Attached files
| file | filename |
|---|---|
| EX-23 - EX-23 - STORE CAPITAL Corp | stor-20141231xex23.htm |
| EX-21 - EX-21 - STORE CAPITAL Corp | stor-20141231ex214763bd0.htm |
| EX-32.1 - EX-32.1 - STORE CAPITAL Corp | stor-20141231ex32158b356.htm |
| EX-32.2 - EX-32.2 - STORE CAPITAL Corp | stor-20141231ex32254f3c4.htm |
| EX-31.2 - EX-31.2 - STORE CAPITAL Corp | stor-20141231ex312fb527a.htm |
| EX-31.1 - EX-31.1 - STORE CAPITAL Corp | stor-20141231ex311fe6aa9.htm |
SECURITIES AND EXCHANGE COMMISSION
Washington, D.C. 20549
Form 10-K
|
☒ |
ANNUAL REPORT PURSUANT TO SECTION 13 OR 15(d) OF THE SECURITIES EXCHANGE ACT OF 1934 |
For the fiscal year ended December 31, 2014
or
|
◻ |
TRANSITION REPORT PURSUANT TO SECTION 13 OR 15(d) OF THE SECURITIES EXCHANGE ACT OF 1934 |
For the transition period from to .
Commission File No. 001-36739
STORE CAPITAL CORPORATION
(Exact name of registrant as specified in its charter)
|
Maryland |
|
45-2280254 |
|
(State or other jurisdiction of incorporation or organization) |
|
(I.R.S. Employer Identification No.) |
8501 East Princess Drive, Suite 190, Scottsdale, Arizona 85255
(Address of principal executive offices) (Zip Code)
Registrant’s telephone number, including area code: (480) 256-1100
Securities Registered Pursuant to Section 12(b) of the Act:
|
Title of Each Class |
|
Name of Each Exchange on Which Registered |
|
Common Stock, $0.01 par value |
|
New York Stock Exchange |
Securities Registered Pursuant to Section 12(g) of the Act: None
Indicate by check mark if the registrant is a well-known seasoned issuer, as defined in Rule 405 of the Securities Act. Yes ◻ No ☒
Indicate by check mark if the registrant is not required to file reports pursuant to Section 13 or Section 15(d) of the Act. Yes ◻ No ☒
Indicate by check mark whether the registrant (1) has filed all reports required to be filed by Section 13 or 15(d) of the Securities Exchange Act of 1934 during the preceding 12 months (or for such shorter period that the registrant was required to file such reports), and (2) has been subject to such filing requirements for the past 90 days. Yes ☒ No ◻
Indicate by check mark whether the registrant has submitted electronically and posted on its corporate Web site, if any, every Interactive Data File required to be submitted and posted pursuant to Rule 405 of Regulation S-T during the preceding 12 months (or for such shorter period that the registrant was required to submit and post such files). Yes ◻ No ◻
Indicate by check mark if disclosure of delinquent filers pursuant to Item 405 of Regulation S-K is not contained herein, and will not be contained, to the best of registrant’s knowledge, in definitive proxy or information statements incorporated by reference in Part III of this Form 10-K or any amendment to this Form 10-K. ☒
Indicate by check mark whether the registrant is a large accelerated filer, an accelerated filer, a non-accelerated filer, or a smaller reporting company. See the definitions of “large accelerated filer,” “accelerated filer” and “smaller reporting company” in Rule 12b-2 of the Exchange Act.
|
Large accelerated filer |
◻ |
Accelerated filer |
◻ |
|
|
|
|
|
|
Non-accelerated filer |
☒ |
Smaller reporting company |
◻ |
Indicate by check mark whether the registrant is a shell company (as defined in Rule 12b-2 of the Exchange Act). Yes ◻ No ☒
The aggregate market value of voting and non-voting common equity held by non-affiliates of the registrant, based on the closing price of a share of the registrant’s common stock on November 18, 2014 as reported on the New York Stock Exchange on such date, was approximately $616,687,500. The registrant has elected to use November 18, 2014, which was the initial trading date on the New York Stock Exchange, as the calculation date because on June 30, 2014 (the last business day of the registrant’s most recently completed second fiscal quarter), the registrant was a privately held company. Shares of the registrant’s common stock held by each executive officer, director and beneficial owner of more than 5% of the outstanding common stock have been excluded from the calculation, as such persons may be deemed to be affiliates. This determination of affiliate status should not be deemed conclusive for any other purpose. As of March 6, 2015, there were 115,210,809 shares of the registrant’s common stock outstanding.
Documents Incorporated by Reference
Portions of Part III of this Form 10-K are incorporated by reference from the registrant’s definitive proxy statement for its 2015 Annual Meeting of Stockholders to be filed with the Securities and Exchange Commission no later than 120 days after the end of the registrant’s fiscal year.
TABLE OF CONTENTS
In this Annual Report on Form 10-K (the “Annual Report”), we refer to STORE Capital Corporation, a Maryland corporation, as “we,” “us,” “our,” “the Company” or “S|T|O|R|E,” unless we specifically state otherwise or the context indicates otherwise.
Forward-Looking Statements
This Annual Report contains forward-looking statements within the meaning of Section 27A of the Securities Act of 1933 and Section 21E of the Securities Exchange Act of 1934. Such forward-looking statements include, without limitation, statements concerning our business and growth strategies, investment, financing and leasing activities and trends in our business, including trends in the market for long-term, triple-net leases of freestanding, single-tenant properties. Words such as “expects,” “anticipates,” “intends,” “plans,” “likely,” “will,” “believes,” “seeks,” “estimates,” and variations of such words and similar expressions are intended to identify such forward-looking statements. Such statements involve known and unknown risks, uncertainties and other factors which may cause our actual results, performance or achievements to be materially different from the results of operations or plans expressed or implied by such forward-looking statements. Although we believe that the assumptions underlying the forward-looking statements contained herein are reasonable, any of the assumptions could be inaccurate, and therefore such statements included in this Annual Report may not prove to be accurate. In light of the significant uncertainties inherent in the forward-looking statements included herein, the inclusion of such information should not be regarded as a representation by us or any other person that the results or conditions described in such statements or our objectives and plans will be achieved. For a further discussion of these and other factors that could impact future results, performance or transactions, see “Item 1A. Risk Factors” elsewhere in this Annual Report.
Forward-looking statements and such risks, uncertainties and other factors speak only as of the date of this Annual Report, and we expressly disclaim any obligation or undertaking to update or revise any forward-looking statement contained herein, to reflect any change in our expectations with regard thereto, or any other change in events, conditions or circumstances on which any such statement is based, except to the extent otherwise required by law.
General
S|T|O|R|E is an internally managed net‑lease real estate investment trust, or REIT, that is the leader in the acquisition, investment and management of Single Tenant Operational Real Estate, or STORE Properties, which is our target market and the inspiration for our name. A STORE Property is a real property location at which a company operates its business and generates sales and profits, which makes the location a profit center and, therefore, fundamentally important to that business.
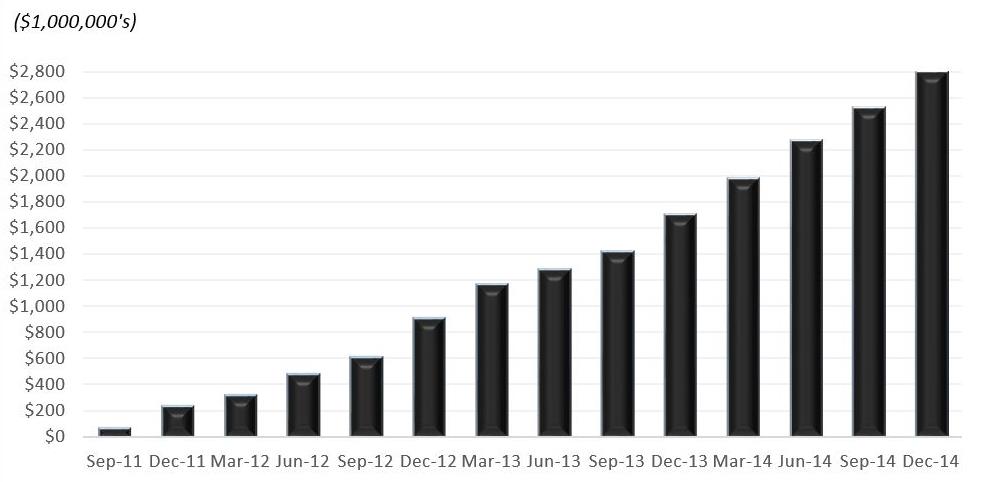
S|T|O|R|E continues the investment activities of our senior leadership team, which has been investing in single‑tenant operational real estate for over thirty-five years. We are one of the largest and fastest‑growing net‑lease REITs, as demonstrated by the table below, and own a large, well‑diversified portfolio that consists of investments in 947 property locations operated by 226 customers across 46 states as of December 31, 2014. Our customers operate across a wide variety of industries within the service, retail and industrial sectors of the U.S. economy, with restaurants, early childhood education centers, health clubs, movie theaters and sporting goods stores representing the top industries in our portfolio.
Our Total Investment Portfolio at Quarter End
We have elected to be taxed as a REIT under the Internal Revenue Code, as amended, which we refer to in this Annual Report as the “Code,” commencing with our initial taxable year ended December 31, 2011. To continue to qualify as a REIT, we must continue to meet certain tests which, among other things, generally require that our assets consist primarily of real estate assets, our income be derived primarily from real estate assets, and that we distribute at least 90% of our REIT taxable income (other than our net capital gains) to our stockholders annually.
Although we are a public company, we are a “controlled company” (within the meaning of the rules of the New York Stock Exchange, or NYSE) because a substantial portion of our common stock (approximately 71%) is owned indirectly by certain investment funds managed by Oaktree Capital Management, L.P. Oaktree is a global investment management firm specializing in alternative investments with approximately $91 billion in assets under management as of December 31, 2014.
2014 Highlights
|
· |
On November 21, 2014, we completed our initial public offering, or IPO, of 31,625,000 shares of our common stock, including 4,125,000 shares of common stock sold in connection with the full exercise of the underwriters’ option to purchase additional shares, at a price to the public of $18.50 per share. The shares began trading on the New York Stock Exchange on November 18, 2014 under the ticker symbol “STOR”. Net proceeds from the sale of our common stock were approximately $545.8 million after deducting underwriting discounts and commissions and offering expenses, the majority of which has been used as of December 31, 2014 to pay down outstanding credit facility debt and for portfolio acquisitions. |
|
· |
In September 2014, we entered into a new three-year $300 million unsecured revolving credit facility, which replaced our two existing secured credit facilities that aggregated $300 million. This new facility includes an accordion feature that allows the size of the facility to be increased up to $500 million and provides us more flexibility at a lower cost than our previous facilities. |
|
· |
In May 2014, we issued our fifth series of STORE Master Funding net-lease mortgage notes payable, aggregating $260 million in principal amount. In addition, we added $53 million of traditional mortgage debt in 2014, bringing our total long-term outstanding debt to $1.28 billion at December 31, 2014, up from $992 million at December 31, 2013. Of our total gross investment in real estate of $2.8 billion at year-end,
2 |
approximately $1.85 billion is utilized as collateral for our $1.28 billion of secured debt outstanding, leaving $952 million of real estate assets unencumbered as of December 31, 2014. |
|
· |
For the year ended December 31, 2014, we declared dividends of $0.9898 per common share to our stockholders, which includes a pro-rated dividend per common share of $0.1139, or $1.00 per share on an annualized basis, for the period since the closing of the IPO through December 31, 2014. |
|
· |
During the year ended December 31, 2014, we invested over $1.1 billion in 341 property locations. |
Our Target Market
We are the leader in providing real estate financing solutions principally to middle‑market and larger businesses that own STORE Properties and operate within the broad-based service, retail and industrial sectors of the U.S. economy. Our net‑lease solutions are designed to provide a long‑term, lower‑cost way to improve our customers’ capital structures and, thus, be a preferred alternative to real estate ownership. We estimate the market for STORE Properties to exceed $2.3 trillion in market value and to include more than 1.5 million properties.
We define middle‑market companies as those having approximate annual gross revenues of between $20 million and $300 million, although some of our customers have annual revenues substantially in excess of $300 million. Most of our customers do not have credit ratings, while some have ratings from rating agencies that service insurance companies or fixed‑income investors. Most of these non-rated companies either prefer to be unrated or are simply too small to issue debt rated by a nationally recognized rating agency in a cost‑efficient manner.
Despite the market’s size, the financing marketplace for STORE Properties is highly fragmented, with few participants addressing the long‑term capital needs of middle‑market and larger non-rated companies. While we believe our net‑lease financing solutions can add value to a wide variety of companies, we believe the largest underserved market and, therefore, our greatest opportunity is non-rated, bank‑dependent, middle‑market and larger companies that generally have less access to efficient sources of long‑term capital.
We believe the demand for our net‑lease solutions is even greater today as a result of the current bank regulatory environment. In our view, the increased scrutiny and regulation of the banking industry over the past several years in response to the collapse of the housing and mortgage industries from 2007 to 2009, particularly with the passage of the Dodd‑Frank Wall Street Reform and Consumer Protection Act and the Basel Accords issued by the Basel Committee on Banking Supervision, have made commercial banks even less responsive to the long‑term capital needs of the middle‑market companies we target. These companies have historically depended on commercial banks for their financing.
S|T|O|R|E was formed to capitalize on this market opportunity and address the capital needs of middle‑market and larger non-rated companies by offering them a superior alternative to financing their profit‑center real estate with traditional mortgage or bank debt and their own equity. We believe our opportunities include both gaining market share from the fragmented network of net‑lease capital providers and growing the market by creating demand for our net‑lease solutions that meet the long‑term real estate capital needs of these companies.
Our target market of STORE Properties is divided into three primary sectors and various sub-sectors. The primary sectors and their proportion of our target market are service at 47%, retail at 37% and industrial at 16%. The sub-sectors included within each primary sector are summarized in the table below.
|
Service |
|
Retail |
|
Industrial |
|
Restaurants |
|
Big box retail |
|
Industrial profit-centers |
|
Education |
|
Specialty retail |
|
|
|
Fitness centers |
|
Grocery |
|
|
|
Transportation |
|
Drug stores |
|
|
|
Automotive services |
|
Automotive (new and used) |
|
|
|
Family entertainment |
|
|
|
|
3
Within the sub‑sectors, the market for STORE Properties is further subdivided into a wide variety of industries within the service, retail and industrial sectors, such as:
|
Automotive parts stores |
|
Movie theaters |
|
Cold storage facilities |
|
Office supplies retailers |
|
Department stores |
|
Pet care facilities |
|
Discount stores |
|
Rental centers |
|
Early childhood education |
|
Secondary education |
|
Furniture stores |
|
Supermarkets |
|
Entertainment facilities |
|
Truck stops |
|
Fast food restaurants |
|
Wholesale clubs |
|
Full service restaurants |
|
|
Many of these industries are represented within our diverse property portfolio.
Our Asset Class: STORE Properties
Single Tenant Operational Real Estate, or STORE Properties, is a unique asset class that inspired the formation of S|T|O|R|E and our company name. STORE Properties are profit-center real estate locations on which our tenants conduct their businesses and generate their revenues and profits. The defining characteristic of STORE Properties is the number of payment sources: STORE Properties have three payment sources, whereas all other commercial real estate assets have just two.
|
· |
Unit-Level Profitability: STORE Properties are distinguished by the primary source of their rent payment, which comes directly from the profits produced by the business operations at the real estate locations we own, which we refer to as ‘unit-level profitability.’ While it is a common perception that the tenant is the primary source of the rent payment (as distinguished from the business at the unit itself), the historic pattern we have observed of tenants in corporate insolvencies vacating unprofitable locations and retaining profitable ones is the main indicator of the payment source. Because tenants historically retain profitable locations and vacate unprofitable ones in the event of insolvency, it is fundamentally important for S|T|O|R|E to collect and review the unit-level financial statements of our tenants at our real estate locations, which is a key component of our business model. As of December 31, 2014, we receive unit-level financial statements on over 96% of the properties in our portfolio. Without having access to unit-level financial reporting for the business activities conducted on the properties we own, we would not have an accurate assessment of the essential nature of our real estate to our customer’s business; without this, we would be speculating about the quality of the most important, and primary, payment source. |
|
· |
Tenant Credit Quality. In addition to the unit-level profitability of the business on the real estate we own, there are two other payment sources that are common to all real estate investments. One is tenant credit quality, which serves as an additional, but not primary, source of payment to unit-level profitability. The tenant’s credit can become the primary payment source if our unit is not profitable and the tenant is required to divert cash flows from its other units or other resources to pay our rents. However, tenant credit quality tends to be subject to greater volatility over time than unit-level profitability, because tenant credit quality is not only a function of the unit-level profitability of the operations at our locations, but of the profitability of potentially many other existing and new assets owned and operated by our tenant. Corporate financial health is also a function of many other decisions, such as capital structure or growth strategies, as well as conditions in the marketplace for the tenant’s products and services, which can change over time and which may have profound impacts on tenant creditworthiness. |
|
· |
Real Estate Residual Value. The other payment source that is common to all real estate investments (and is the third of our three payment sources) is the residual value of the underlying real estate, which gives us the opportunity to receive rents from other substitute tenants in the event our asset becomes vacant. For S|T|O|R|E, this means more than just looking at broad lease rate and transaction comparables. Studies we have done underscore the importance of investing in properties at or below their as-new replacement costs. We also review the local markets in which our properties are located and seek to have rents that are at or
4 |
below prevailing market rents on a per square foot basis for comparable properties. Taking these steps protects S|T|O|R|E and our customers by making it easier for us to assign, sell or sublease properties that our customers may want to sell, reposition or vacate as part of their capital efficiency strategy. |
The following diagram illustrates the three sources of payment that are common among STORE Properties:
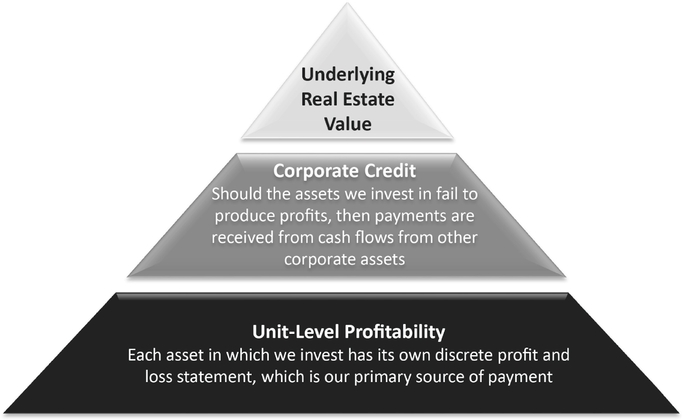
The S|T|O|R|E Credit Pyramid
The investment, management and capitalization competencies we have developed over more than thirty-five years, like our credit pyramid, arise from the distinctive characteristics of the large asset class of STORE Properties we address.
Our Competitive Strengths
Our objective is to build upon our market‑leading platform for the acquisition, investment and management of STORE Properties that simultaneously creates value for stockholders and customers through our five corporate competencies. Each member of our senior leadership team is primarily responsible for one of our five competencies, which are described below:
|
· |
Investment Origination. S|T|O|R|E Capital was formed to fill a need for efficient long-term real estate capital for middle-market and larger customers. We do this principally by creating lease contracts that address our customers’ needs and create strong alignments of interest that benefit our stockholders. By creating demand for our services, and not simply taking market share or aggregating assets, we have maintained a large pipeline of investment opportunities ever since we commenced operations in 2011. As a result, approximately 75% of our investments (by dollar volume) have been originated by our internal origination team through direct customer relationships using our form financing documents. Our objective is to be both selective and achieve higher rates of return than our stockholders could achieve if they sought to acquire profit-center real estate on their own. At the same time, our solutions-oriented approach strives to create superior value for our customers over other financing options they may have to capitalize their businesses. |
|
· |
Investment Underwriting. Our methods of risk evaluation have been developed by our senior leadership team over thirty-five years, more than $12 billion and over 8,000 STORE Property investments. Our investment underwriting approach centers on evaluations of unit-level and corporate-level financial performance, together with detailed real estate valuation assessments. These three areas represent our credit pyramid, which is reflective of the characteristics of the STORE Property asset class. At S|T|O|R|E,
5 |
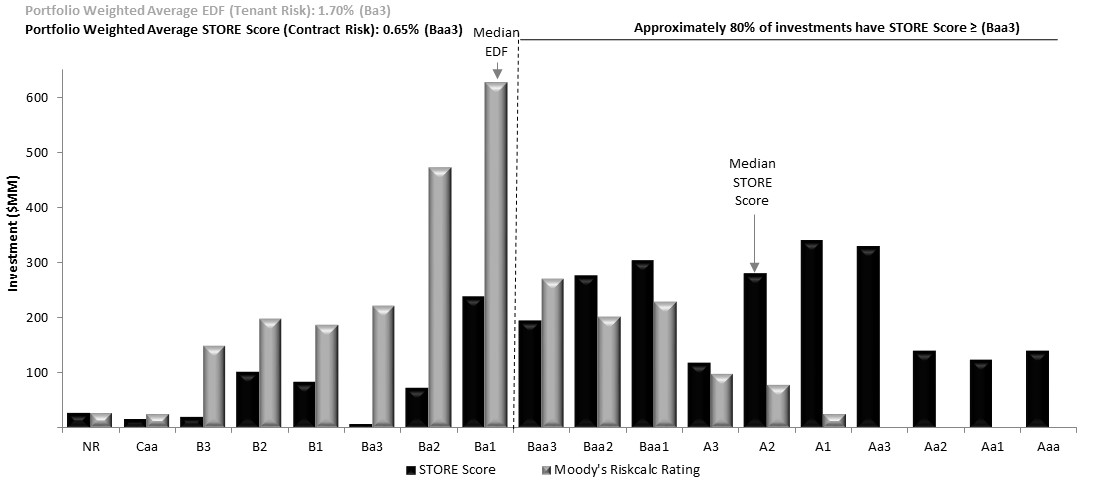
we have combined our underwriting approach with our portfolio management systems to capture tenant credit ratings and lease contract ratings (referred to as a S|T|O|R|E Score) as tools to monitor ongoing portfolio performance. Our collective experience has enabled us to develop sophisticated risk evaluation tools and insights that are designed to offer greater risk-adjusted investment results than those available to most real estate investors. |
The following table compares our tenant credit ratings (determined using Moody’s Riskcalc) with the STORE Score:
|
· |
Investment Documentation. For over thirty-five years, we have learned that lease contracts, and not tenant credit quality, are the principal determinants of investment risk. Part of contract creation is embodied in the investment underwriting process, which focuses on the following factors: the prices we pay for the real estate; the unit-level profitability of the businesses operated on our real estate; the rents and escalations we receive; and the support offered to the investment by tenant credit quality. These factors are ultimately incorporated into our contracts and supported by third party diligence, including appraisals, property condition reports, environmental reports and other diligence. Finally, the contracts we create foster alignments of interest through the use of features such as master leases and bankruptcy-remote investment structures. Altogether, our documentation process, like our approach to underwriting, has evolved over decades and offers investors in S|T|O|R|E a value that most could not create for themselves. |
|
· |
Portfolio Management. Net-lease real estate investment portfolios require active management in order to realize superior risk-adjusted rates of return. With a diversified portfolio, we have developed highly effective approaches that place greater focus on the minority of investments that have a higher risk potential to experience future problems. For over thirty-five years, we have learned how to monitor unit-level profit and loss statements, tenant corporate financial statements and the timely payment of property taxes and insurance in order to gauge portfolio quality. S|T|O|R|E represents our third, and most highly developed, servicing platform. We are virtually paperless, have access to granular or highly detailed information on our portfolio from virtually anywhere and are highly scalable. Having such systems helps us effectively monitor and reduce tenant credit risk at the property level. And when combined with our high degree of financial and operating flexibility, we are able to realize better stockholder risk-adjusted rates of return on our invested capital. |
|
· |
Financial Reporting and Treasury. We consider and evaluate our corporate financing strategies with the same emphasis as our real estate investment strategies. Borrowings must prudently improve stockholder returns; they must be structured to provide portfolio flexibility and minimize our exposure to changes in long-term interest rates; they must be structured to optimize our cost of financing that will enhance investor
6 |
rates of return; and finally, a liability strategy should contribute to corporate governance by enhancing corporate flexibility. Our senior leadership team has extensive experience with diverse liability strategies. Today, we are one of the few REITs to employ our own A+ rated borrowing source. Our senior leadership team developed our master funding conduit strategy in 2005, which is ideally suited to finance diverse portfolios of profit-center real estate, such as ours. The strategies we implement are designed to add value to our investors by offering a more efficient means to finance real estate than they could otherwise do on their own. At the same time, the flexibility we derive from our liability strategies can also result in important flexibility for our customers. |
Our Business and Growth Strategies
Our objective is to continue to create stockholder value through sustained investment and management activities designed to grow distributable cash flows and deliver attractive risk-adjusted rates of return from a growing, diverse portfolio of STORE Properties. To accomplish this, our principal business and growth strategies are as follows:
|
· |
Continue to Focus on Middle‑Market Companies Operating STORE Properties. We believe we have selected the most attractive investment opportunity within the net‑lease market, STORE Properties, and targeted the most attractive customer type within that market, middle‑market and larger non-rated companies. We focus on this market given its strong fundamentals and outsized growth potential. Within the net‑lease market for STORE Properties, our value proposition is most compelling to middle‑market, bank‑dependent companies who are not rated by any nationally recognized rating agency due to their size or capital markets preferences, but who have strong credit metrics and operate within broad-based industries having the potential for sustained relevance. |
|
· |
Realize Stable Income and Internal Growth. We seek to make investments that generate strong and stable current income as a result of the difference, or spread, between the rate we earn on our assets and the rate we pay on our liabilities (primarily our long‑term debt). We augment that income with internal growth. We seek to realize superior internal growth through a combination of (1) a target dividend payout ratio that permits a level of free cash flow reinvestment and (2) cash generated from the 1.7% weighted average annual escalation of base rent and interest in our portfolio (as of December 31, 2014). We benefit from contractual rent escalations, as nearly 97% of our leases and loans (by annualized base rent and interest) have escalations that are either fixed (23%) or based on the Consumer Price Index, or CPI (74%). We believe this will enable strong dividend growth without relying exclusively on future common stock issuances to fund new portfolio investments. |
|
· |
Capitalize on Direct Origination Capabilities for External Growth. As the market leader in STORE Property investment originations, we plan to complement our internal growth with continued new investments that are funded through future equity issuances and borrowings to expand our platform and raise investor cash flows. |
|
· |
Actively Manage our Balance Sheet to Maximize Capital Efficiency. We seek to select funding sources designed to lock in long‑term investment spreads and limit interest rate sensitivity. We also seek to maintain a prudent balance between the use of debt (which includes our own STORE Master Funding program, commercial mortgage-backed securities, or CMBS, borrowings, insurance borrowings, bank borrowings and possibly preferred stock issuances) and equity financing. As of December 31, 2014, the long‑term, non‑recourse debt of our consolidated special purpose entities had an aggregate outstanding principal balance of $1.3 billion, a weighted average maturity of 6.9 years and a weighted average interest rate of 4.9%. On an annualized basis, our fourth quarter adjusted debt to earnings before interest, taxes, depreciation and amortization, or EBITDA, was under 6x and, as we move forward as a public company, we are targeting a ratio of between 6x and 7x. |
|
· |
Increase our portfolio diversity. As of December 31, 2014, we had invested $2.8 billion in 947 property locations, substantially all of which are profit centers for our customers. Our portfolio is highly diversified with 226 customers operating 208 different brand names, or business concepts, across 46 states and over 65 industry groups. None of our customers represented more than 4% of our portfolio as of
7 |
December 31, 2014, based on annualized base rent and interest. Our portfolio’s diversity decreases the impact on us of an adverse event affecting a specific customer, industry or region, thereby increasing the stability of our cash flows. Additional acquisitions in the future will further increase the diversity of our portfolio and, from time to time, we may sell properties in our portfolio to improve overall portfolio credit quality or diversity. |
Competition
We face competition in the acquisition and financing of STORE Properties from numerous investors, including traded and non‑traded public REITs, private equity investors and institutional investment funds, some of which have greater financial resources than we do, a greater ability to borrow funds to acquire properties and the ability to accept more risk. We also believe that competition for real estate financing comes from middle‑market business owners themselves, many of whom have had a historic preference to own, rather than lease, the real estate they use in their businesses. The competition we face may increase the demand for STORE Properties and, therefore, reduce the number of suitable acquisition opportunities available to us or increase the price we must pay to acquire STORE Properties. This competition will increase if investments in real estate become more attractive relative to other forms of investment.
Employees
As of December 31, 2014, we had 50 full‑time employees, all of whom are located in our single office in Scottsdale, Arizona. None of our employees are subject to a collective bargaining agreement. We consider our employee relations to be good.
Principal Executive Offices
Our principal offices are located at 8501 East Princess Drive, Suite 190, Scottsdale, Arizona 85255. We currently occupy approximately 14,000 square feet of space leased from an unaffiliated third party. We believe that our offices are adequate for our present and currently planned future operations and that adequate additional space will be available if needed in the future.
Insurance
Our leases and loan agreements typically require our tenants and borrowers to maintain insurance of the types and in the amounts that are usual and customary for similar commercial properties, including commercial general liability, fire and extended loss insurance provided by reputable companies, with commercially reasonable exclusions, deductibles and limits, all as verified by our independent insurance consultant.
Separately, we purchase contingent liability insurance, in excess of our tenants’ and borrowers’ liability coverage, to provide us with additional security in the event of a catastrophic claim. Also, we purchase property coverage, on a case-by-case basis, where we believe such additional insurance is warranted.
Regulation
Our properties are subject to various laws and regulations, including regulations relating to fire and safety requirements, ordinances and affirmative and negative covenants and in some instances, common area obligations. Our tenants and borrowers have primary responsibilities for compliance with these requirements pursuant to our lease and loan agreements. We believe that each of our tenants and borrowers have the necessary permits and approvals to operate and conduct their businesses on our properties.
Environmental Matters
General. All real property and the operations conducted on real property are subject to federal, state and local laws and regulations relating to human health and the environment. Certain of these laws and regulations may impose joint and several liability on certain statutory classes of persons, including owners or operators, for the costs of investigation or remediation of contaminated properties, regardless of fault or the legality of the original disposal.
8
These laws and regulations apply to past and present business operations of our tenants and borrowers and the use, storage, handling and contracting for recycling or disposal of hazardous substances or wastes. Our tenants and borrowers are obligated to comply with environmental laws. Our leases and loans typically impose obligations on our tenants and borrowers to indemnify us from all or most compliance costs we may experience as a result of the environmental conditions on our properties. If a tenant or borrower fails to, or cannot, comply we may be required to pay such costs. We are not aware of any environmental condition with respect to any of our properties which would have a material adverse effect on our business, financial condition or results of operations. We cannot predict whether new or more stringent laws relating to the environment will be enacted in the future or how such laws will impact the operations of businesses at our properties. Costs associated with an environmental event could be substantial.
Superlien Laws. Under the laws of many states, contamination on a site may give rise to a lien on the site for clean‑up costs. In several states, such a lien has priority over all existing liens, including those of existing mortgages. In these states, the lien of a mortgage may lose its priority to such a “superlien.”
CERCLA. The federal Comprehensive Environmental Response, Compensation and Liability Act of 1980, as amended, or CERCLA, imposes strict liability on present and past “owners” and “operators” of a contaminated site for the costs of clean‑up. A secured lender may be liable as an “owner” or “operator” of a contaminated site if agents or employees of the lender have participated in the management of such site or in the operations of the tenant. Excluded from CERCLA’s definition of “owner” or “operator” however, is a person “who without participating in the management of the facility, holds indicia of ownership primarily to protect his security interest”. This is the so called “secured creditor exemption.” With respect to most of the assets in our investment portfolio, we are the owner of the real property. However, with respect to a few of the assets in our investment portfolio, we are not the owner of the property but have a mortgage loan on the property. In both instances, we believe we meet the secured creditor exemption.
Liability is not limited to the original or unamortized principal balance of a loan or to the value of the site securing a loan. CERCLA provides substantial protection to lenders by defining the activities in which a lender can engage and still have the benefit of the secured creditor exemption. In order for a lender to be deemed to have participated in the management of a site, the lender must actually participate in the operational affairs of the site or our tenant or borrower. CERCLA provides that “merely having the capacity to influence, or unexercised right to control” operations does not constitute participation in management. A lender may lose the protection of the secured creditor exemption only if it exercises decision‑making control over our tenant’s or borrower’s environmental compliance and hazardous substance handling and disposal practices, or assumes responsibility for substantially all operational functions at the site or overall management encompassing day‑to‑day decision making with regard to environmental compliance. CERCLA also provides that a lender will continue to have the benefit of the secured creditor exemption even if it forecloses on a site, purchases it at a foreclosure sale or accepts a deed‑in‑lieu of foreclosure provided that the lender seeks to sell the site at the earliest practicable commercially reasonable time on commercially reasonable terms.
Certain Other Federal and State Laws. Many states have statutes similar to CERCLA, and not all of those statutes provide for a secured creditor exemption. In addition, under federal law, there is potential liability relating to hazardous wastes and underground storage tanks under the Federal Resource Conservation and Recovery Act, or RCRA. The definition of “hazardous substances” under CERCLA specifically excludes petroleum products. Subtitle I of RCRA governs underground petroleum storage tanks. The protections accorded to lenders under CERCLA are also accorded to the holders of security interests in underground petroleum storage tanks if the lender does not participate in management of the underground storage tanks and is not otherwise engaged in petroleum production, refining or marketing. It should be noted, however, that liability for cleanup of petroleum contamination may be governed by state law, which may not provide for any specific protection for secured creditors.
In a few states, transfers of some types of sites are conditioned upon cleanup of contamination prior to transfer. In these cases, a lender that becomes the owner of a site through foreclosure, deed in lieu of foreclosure or otherwise, may be required to clean up the contamination before selling or otherwise transferring the site.
Also, certain federal, state and local laws govern the removal, encapsulation or disturbance of asbestos‑containing materials, or ACMs, in the event of the remodeling, renovation or demolition of a building. Such
9
laws, as well as common law standards, may impose liability for releases of ACMs and may provide for third parties to seek recovery from owners or operators of sites for personal injuries associated with such releases.
Beyond statute‑based environmental liability, there exist common law causes of action (for example, actions based on nuisance or on toxic tort resulting in death, personal injury or damage to site) related to hazardous environmental conditions on a site. While it may be more difficult to hold a lender liable in such cases, unanticipated or uninsured liabilities of our tenant or borrower may jeopardize the tenant’s or borrower’s ability to meet its lease or loan obligations.
Additional Considerations. The cost of remediating hazardous substance contamination at a site can be substantial. If a lender becomes liable, it can bring an action for contribution against the owner or operator who created the environmental hazard, but that individual or entity may be without substantial assets.
If a lender forecloses on a mortgage secured by a site on which business operations are subject to environmental laws and regulations, the lender will be required to operate the site in accordance with those laws and regulations. Such compliance may result in substantial expense.
In addition, a lender may be obligated to disclose environmental conditions on a site to government entities and/or to prospective buyers (including prospective buyers at a foreclosure sale or following foreclosure). Such disclosure may decrease the amount that prospective buyers are willing to pay for the affected site, sometimes substantially, and thereby decrease the ability of the lender to recoup its investment in a loan upon foreclosure.
Emerging Growth Company Status
We currently qualify as an “emerging growth company,” as defined in the Jumpstart Our Business Startups Act of 2012, or the JOBS Act, and are eligible to take advantage of certain exemptions from various reporting requirements that are applicable to other public companies that are not “emerging growth companies,” including, but not limited to, not being required to comply with the auditor attestation requirements of Section 404 of the Sarbanes-Oxley Act of 2002, or Sarbanes-Oxley Act, reduced disclosure obligations regarding executive compensation in our periodic reports and proxy statements and exemptions from the requirements of holding a non-binding advisory vote on executive compensation and shareholder approval of any golden parachute payments not previously approved. We plan to take advantage of these exemptions for our 2015 proxy statement.
In addition, an “emerging growth company” can take advantage of the extended transition period provided in Section 7(a)(2)(B) of the Securities Act of 1933, as amended, or the Securities Act, for complying with new or revised accounting standards. In other words, an “emerging growth company” can delay the adoption of certain accounting standards until those standards would otherwise apply to private companies. However, we are choosing to “opt out” of such extended transition period, and as a result, we will comply with new or revised accounting standards on the relevant dates on which adoption of such standards is required for all public companies which are not emerging growth companies. Our decision to opt out of the extended transition period for complying with new or revised accounting standards is irrevocable.
We could remain an “emerging growth company” for up to five years after our IPO, or until the earliest of (i) the last day of the first fiscal year in which our annual gross revenues exceed $1 billion, (ii) the date that we become a “large accelerated filer” as defined in Rule 12b-2 under the Securities Exchange Act of 1934, as amended, or the Exchange Act, which would occur if the market value of shares of our common stock that are held by non-affiliates exceeds $700 million as of the last business day of our most recently completed second fiscal quarter, or (iii) the date on which we have issued more than $1 billion in non-convertible debt during the preceding three year period.
Available Information
We electronically file with the Securities and Exchange Commission our annual reports on Form 10-K, quarterly reports on Form 10-Q and current reports on Form 8-K, pursuant to Section 13(a) of the Exchange Act. You may obtain a free copy of our annual reports on Form 10-K, quarterly reports on Form 10-Q and current reports on Form 8-K, and amendments to those reports on the day of filing with the SEC on our website at www.storecapital.com, or by sending an email message to info@storecapital.com.
10
There are many factors that affect our business and the results of our operation, some of which are beyond our control. The following is a description of important factors that may cause our actual results of operations in future periods to differ materially from those currently expected or discussed in forward-looking statements set forth in this Annual Report. Forward-looking statements and such risks, uncertainties and other factors speak only as of the date of this Annual Report, and we expressly disclaim any obligation or undertaking to update or revise any forward-looking statement contained herein, to reflect any change in our expectations with regard thereto, or any other change in events, conditions or circumstances on which any such statement is based, except to the extent otherwise required by law.
Risks Related to Our Business
Our business depends on our customers successfully operating their businesses on real estate we own or finance for them, and their failure to do so could materially and adversely affect our business. Substantially all of our properties are leased by customers operating a business at those locations where sales and profits are generated for their businesses. We underwrite and evaluate investment risk based on our belief that the most important, and primary, source of payment for our leases and loans is unit‑level profitability. While a tenant may have other sources of payment to meet its obligations, we believe the success of our investments materially depends upon whether our customers successfully operate their businesses, and thus generate unit‑level profitability, at the location or locations we are acquiring or financing. Our customers may be adversely affected by many factors beyond our control that might render one or more of their locations uneconomic. These factors include poor management, changing demographics, a downturn in general economic conditions or changes in consumer trends that decrease demand for our customers’ products or services. The occurrence of any of these may cause our customers to fail to pay rent when due, fail to pay real estate taxes when due, fail to pay insurance premiums when due, become insolvent or declare bankruptcy, any of which could materially and adversely affect our business.
Our investments are and are expected to continue to be concentrated in the single‑tenant, middle‑market sector, and if the demand of single‑tenant, middle‑market companies for net‑lease financing fails to increase or decreases, or if the supply of net‑lease financing increases in this sector, we could be materially and adversely affected. Our target market is middle‑market companies that operate their businesses out of one or more locations that generate unit‑level profitability for the business. Historically, many companies prefer to own, rather than lease, the real estate they use in their businesses. A failure to increase demand for our products by, among other ways, failing to convince middle‑market companies to sell and lease back their STORE Properties, or a decrease in the demand of middle‑market companies to rent STORE Properties or an increase in the availability of STORE Properties for rent could materially and adversely affect us.
If we do not have sufficient access to debt and equity, we will be unable to continue to grow by acquiring STORE Properties. As a REIT, we are required to distribute at least 90% of our REIT taxable income, determined without regard to the dividends‑paid deduction and excluding any net capital gain, each year to our stockholders. As a result, our ability to retain earnings to fund acquisitions or make any capital expenditures, if required, will be limited. Our long‑term ability to grow through additional investments will be limited if we cannot obtain additional debt or equity financing. We cannot guarantee that debt or equity financing will be available to us in the future, or that we will be able to obtain it on favorable terms.
We depend on the asset‑backed securities market and the commercial mortgage‑backed securities market for our long‑term debt financing. We depend on, and we likely will continue to depend on, the asset‑backed securities, or ABS, and the CMBS markets for our long‑term debt financing. Substantially all of the long‑term debt on our balance sheet has been obtained from debt offerings in the ABS and CMBS markets. The ABS debt is issued by bankruptcy remote, special purpose entities that we or our subsidiaries own. These special purpose entities issue multiple series of investment‑grade ABS notes from time to time as additional collateral is added to the collateral pool. Our CMBS debt is generally in the form of first mortgage debt incurred by other special purpose entities that we or our subsidiaries own. Our ABS and CMBS debt is generally non‑recourse. However, there are customary limited exceptions to recourse for matters such as fraud, misrepresentation, gross negligence or willful misconduct, misapplication of payments, bankruptcy and environmental liabilities.
11
In the event of a disruption in the financial markets for ABS or CMBS debt, our ability to obtain long‑term debt may be materially and adversely affected. As a result, we may acquire real estate assets at a lower than anticipated growth rate, or we may be unable to acquire additional real estate assets. In addition, this disruption may affect our return on equity as a result of the decrease in the availability of long‑term debt or leverage for us. Furthermore, a reduction in the difference, or spread, between the rate we earn on our assets and the rate we pay on our liabilities (primarily our long‑term debt), which would occur if the interest rates available to us on future debt issuances increase faster than the lease rates we can charge our customers on STORE Properties we acquire and lease back to them, could have a material and adverse effect on our financial condition.
Failure to mitigate our exposure to interest rate volatility changes may materially and adversely affect us. We attempt to mitigate our exposure to interest rate risk by entering into long‑term fixed-rate financing through the combination of periodic debt offerings under STORE Master Funding, our ABS conduit, through discrete non‑recourse secured borrowings, through insurance company and bank borrowings, by laddering our borrowing maturities and by using leases that generally provide for rent escalations during the term of the lease. However, the weighted average term of our borrowings does not match the weighted average term of our investments, and the methods we employ to mitigate our exposure to changes in interest rates involve risks, including the risk that the debt markets are volatile and tend to reflect the conditions of the then‑current economic climate. Our efforts may not be effective in reducing our exposure to interest rate changes. Failure to effectively mitigate our exposure to changes in interest rates may materially and adversely affect us by increasing our cost of capital and reducing the net returns we earn on our portfolio.
A significant portion of our assets have been pledged to secure the borrowings of our subsidiaries. A significant portion of our investment portfolio consists of assets owned by our consolidated, bankruptcy remote, special purpose entity subsidiaries that have been pledged to secure the long‑term borrowings of those subsidiaries. As of December 31, 2014, the total outstanding principal balance of non‑recourse debt obligations of our consolidated special purpose entity subsidiaries was $1.3 billion, and approximately $1.9 billion in assets held by those subsidiaries had been pledged to secure those borrowings. We or our other consolidated subsidiaries are the equity owners of these special purpose entities, meaning we are entitled to the excess cash flows after debt service and all other required payments are made on the debt of these entities. If our subsidiaries fail to make the required payments on this indebtedness, distributions of excess cash flow to us may be reduced or suspended and the indebtedness may become immediately due and payable. If the subsidiaries are unable to pay the accelerated indebtedness, the pledged assets could be foreclosed upon and distributions of excess cash flow to us may be suspended or terminated. In this case, our ability to make distributions to our stockholders could be materially and adversely affected.
Loss of our key personnel could materially impair our ability to operate successfully. As an internally managed company, our ability to achieve our investment objectives and to make distributions to our stockholders depends upon the performance of our senior leadership team. We rely on our senior leadership team to, among other things, identify and consummate acquisitions, design and implement our financing strategies, manage our investments and conduct our day‑to‑day operations. In particular, our success depends upon the performance of Mr. Volk, our Chief Executive Officer, and other members of our senior leadership team.
We cannot guarantee the continued employment of any of the members of our senior leadership team, who may choose to leave our company for any number of reasons, such as other business opportunities, differing views on our strategic direction or other personal reasons. We rely on the experience, efforts and abilities of these individuals, each of whom would be difficult to replace. The employment agreements we have entered into with each of these executives do not guarantee their continued service to us. The loss of services of one or more members of our senior leadership team, or our inability to attract and retain highly qualified personnel, could adversely affect our business, diminish our investment opportunities and weaken our relationships with lenders, business partners, existing and prospective tenants and industry personnel, all of which could materially and adversely affect us.
We have a limited operating history, and our past experience may not be sufficient to allow us to successfully operate as a public company going forward. We commenced business in May 2011. We cannot assure you that our past experience will be sufficient to successfully operate our company as a publicly traded company, including the requirements to timely meet disclosure requirements of the Securities Exchange Act of 1934, as amended, and comply with the Sarbanes‑Oxley Act. We are required to develop and implement disclosure and control systems and procedures to satisfy our periodic and current reporting requirements under applicable U.S. Securities and Exchange
12
Commission, or SEC, regulations and comply with the NYSE listing standards, and this transition could place a significant strain on our management systems, infrastructure and other resources. Failure to operate successfully as a public company could materially and adversely affect us.
Our success depends in part on the creditworthiness of our customers, and we lease most of our properties to non-rated customers. Our underwriting and risk‑management procedures that we use to evaluate a potential customer’s credit risk may be faulty, deficient or otherwise fail to accurately reflect the risk of our investment. Our customers are mostly middle‑market companies, which generally are not rated by a nationally recognized rating agency. We use external and internal tools to evaluate risk and predict the risk of default. When we review a potential investment, we view our sources of payment to be, in order of priority, unit‑level profitability, tenant credit quality and residual real estate valuation. Additionally, we review a potential customer’s management team and the macroeconomic trends of the industry in which that customer operates. We evaluate the risk of company insolvency using a third‑party model, Moody’s Analytics RiskCalc, which is a model for predicting private company defaults based on Moody’s Analytics Credit Research Database and which provides us an Estimated Default Frequency, or EDF, for each of our customers. We then estimate the risk of lease or loan rejection by assigning a probability of termination based on the unit‑level fixed charge coverage ratio, or unit FCCRs, at the property or properties we own. We then estimate the long‑term default risk of an investment by multiplying the EDF score by our estimated probability that our lease will be rejected in bankruptcy, which we call the “STORE Score.”
Our methods may not adequately assess the risk of an investment. Moody’s Analytics RiskCalc, our methodology of estimating probability of lease rejection and the STORE Score may be inaccurate, incomplete or otherwise fail to adequately assess default risk. An EDF score from Moody’s Analytics RiskCalc is not the same as a published credit rating and lacks the extensive company participation that is typically involved when a rating agency publishes a rating. EDF scores and FCCRs are calculated based on financial information provided to us by our customers and prospective customers without independent verification by us. The probability of lease rejection we assign an investment based on unit FCCR or other factors may be inaccurate. Moreover, the risks we have identified as our principal risks may omit significant risks to our investments. If our underwriting procedures fail to properly assess the unit‑level profitability, tenant or corporate credit risk or real estate value of potential investments, then we may invest in properties that result in tenant defaults, and we may be unable to recover our investment by re‑leasing or selling the related property, which could materially and adversely affect our operating results and financial position.
The bankruptcy or insolvency of any of our tenants could result in the termination of such tenant’s lease and material losses to us. A tenant bankruptcy or insolvency could diminish the rental revenue we receive from that property or could force us to “take back” a property as a result of a default or a rejection of the lease by a tenant in bankruptcy. Any claims against bankrupt tenants for unpaid future rent would be subject to statutory limitations that would likely result in our receipt, if at all, of rental revenues that are substantially less than the contractually specified rent we are owed under their leases. In addition, any claim we have for unpaid past rent will likely not be paid in full. If a tenant becomes bankrupt or insolvent, federal law may prohibit us from evicting such tenant based solely upon such bankruptcy or insolvency. We may also be unable to re‑lease a terminated or rejected space or re‑lease it on comparable or more favorable terms.
Many of our tenants lease multiple properties from us under master leases. Bankruptcy laws afford certain protections to a tenant that may also affect the master lease structure. Subject to certain restrictions, a tenant under a master lease generally is required to assume or reject the master lease as a whole, rather than making the decision on a property‑by‑property basis. This prevents the tenant from assuming only the better performing properties and terminating the master lease with respect to the poorer performing properties. If these tenants are considering filing for bankruptcy protection, we may find it necessary to agree to amend their master leases to remove certain underperforming properties rather than risk the tenant rejecting the entire master lease in bankruptcy. Whether or not a bankruptcy court will require a master lease to be assumed or rejected as a whole depends upon a “facts and circumstances” analysis. A bankruptcy court will consider a number of factors, including the parties’ intent, the nature and purpose of the relevant documents, whether there was separate and distinct consideration for each property included in the master lease, the provisions contained in the relevant documents and applicable state law. If a bankruptcy court allows a master lease to be rejected in part, certain underperforming leases related to properties we own could be rejected by the tenant in bankruptcy, thereby adversely affecting payments derived from the properties. As a result, tenant bankruptcies could materially and adversely affect us.
13
Our financial monitoring, periodic site inspections and selective property sales may fail to mitigate the risk of customer defaults, and if a customer defaults, we may experience difficulty or a significant delay in re‑leasing or selling the property. Our portfolio‑management activities, including financial monitoring, periodic site inspections and selective property sales, may be insufficient to prevent or reduce the frequency of tenant defaults. If a tenant defaults, it will likely cause a significant or complete reduction in our revenue from that property for some time. If a defaulting tenant is unable to recover financially, we may have to re‑lease or sell the property. Re‑leasing or selling properties may take a significant amount of time, during which the property might have a negative cash flow to us and we may incur other related expenses. We may also have to renovate the property, reduce the rent or provide an initial rent abatement or other incentive to attract a potential tenant or buyer before we can re‑lease or sell the property. During this period, we likely will incur ongoing expenses for property maintenance, taxes, insurance and other costs. Therefore, tenant defaults could materially and adversely affect us.
As leases expire, we may be unable to renew those leases or re‑lease the space on favorable terms or at all. Our success depends in part upon our ability to cause our properties to be occupied and generating revenue. As of December 31, 2014, leases and loans representing approximately 10% of our annualized base rent and interest will expire prior to 2025. We cannot guarantee you that we will be able to renew leases or re‑lease space (i) without an interruption in the rental revenue from those properties, (ii) at or above our current rental rates, or (iii) without having to offer substantial rent abatements, tenant improvement allowances, early termination rights or below‑market renewal options. The difficulty, delay and cost of renewing leases, re‑leasing space and leasing vacant space could materially and adversely affect us.
The geographic concentration of our properties could make us vulnerable to an economic downturn, regulatory changes or acts of nature in those areas, resulting in a decrease in our revenues or other negative impacts on our results of operations. As of December 31, 2014, the five states from which we derive the largest amount of our annualized base rent and interest were Texas (13.6%), Illinois (6.9%), Georgia (6.0%), Tennessee (5.9%), and Florida (5.0%). As a result of these concentrations, the conditions of local economies and real estate markets, changes in state or local governmental rules and regulations, acts of nature and other factors in these states could result in a decrease in the demand for the products offered by the businesses operating on the properties in those states, which would have an adverse impact on our customers’ revenues, costs and results of operations, thereby adversely affecting their ability to meet their obligations to us.
As we continue to acquire properties, we may decrease or fail to increase the diversity of our portfolio. We have broad authority to invest in any STORE Property that we may identify in the future. As we continue to acquire properties, our portfolio may become less diverse by tenant, industry or geographic area. If our portfolio becomes less diverse, the trading price of our common stock may fall, as our business will be more sensitive to the bankruptcy or insolvency of fewer tenants, to changes in consumer trends of a particular industry and to a general economic downturn in a particular geographic area.
A decrease in demand for restaurant space or a downturn in the restaurant industry could materially and adversely affect us. As of December 31, 2014, real estate investments operated by customers in the restaurant industry represented approximately 28.1% of the dollar amount of our investment portfolio and 27.9% of our annualized base rent and interest, and, in the future, it is likely we will acquire additional restaurant properties. Because the restaurant industry represents a significant portion of our portfolio, a downturn in the restaurant industry may have a material adverse effect on us.
We have investments in industries that depend upon discretionary spending by consumers. A reduction in the willingness or ability of consumers to use their discretionary income in the businesses of our customers and potential customers could reduce the demand for our net‑lease solutions. Most of our portfolio is leased to or financed with customers operating service or retail businesses on our property locations. Restaurants, early childhood education centers, health clubs, movie theaters and sporting goods stores represent the largest industries in our portfolio; and Gander Mountain, Ashley Furniture HomeStore, Applebee’s, Popeyes Louisiana Kitchen and Starplex Cinemas represent the largest concepts in our portfolio. The success of most of these businesses depends on the willingness of consumers to use discretionary income to purchase their products or services. A downturn in the economy could cause consumers to reduce their discretionary spending, which may have a material adverse effect on us.
14
Some of our tenants are subject to government regulation and rely on government funding, which could adversely impact their ability to make timely lease payments to us. The industries in which some of our tenants operate are subject to government regulation, and these businesses may depend, to various extents, on government funding or reimbursements. For example, tenants in the education industry often rely extensively on local, state and federal government funding for their students’ tuition payments. In addition, tenants in the healthcare and childcare‑related industries typically receive local, state or federal funding, subsidies or reimbursements. The amount and timing of these various fundings, subsidies and reimbursements depend on various factors beyond our or our tenants’ control, including government budgets and policies and political issues. Some of these tenants also must satisfy certain licensure or certification requirements in order to qualify for government funding, subsidies or reimbursements. If these tenants fail to satisfy these requirements or otherwise fail to receive government funding, when and as needed, including as a result of tightened government budgets, revised funding policies or otherwise, their cash flow could be materially affected causing them to default on our leases, which could adversely impact our business. As we continue to grow our investment portfolio, we may continue to invest in these industries and expand our business into other industries that operate in highly regulated environments and rely significantly on payments from government payors. Changes in regulatory requirements or government funding policies affecting our tenants may result in lease defaults, which would reduce our revenues and harm our results of operations and financial position.
We may be unable to identify and complete acquisitions of suitable properties, and the competition for acquisitions may reduce the number of acquisitions we can complete, either of which may impede our growth and the continued diversification of our portfolio. Our ability to continue to acquire suitable properties may be constrained by numerous factors, including the following:
|
· |
Our ability to locate properties with attractive economic terms or lease rates. We target investments that have a difference, or spread, between our cost of capital and the lease rate of the properties we acquire. If that difference, or spread, decreases, our ability to profitably grow our company will decrease. |
|
· |
We compete with numerous investors, including publicly traded and non‑traded REITs, institutional, private equity and individual investors and other investment funds, some of whom have greater financial resources and more favorable capital costs when compared to us. |
|
· |
Since many customers we approach have an historic preference to own, rather than lease, their real estate, our ability to grow requires that we overcome those preferences and convince customers that it is in their best interests to lease, rather than own, their STORE Properties, and we may be unable to do so. |
|
· |
After beginning to negotiate the terms of a transaction and during our real property, legal and financial due‑diligence review with respect to a transaction, we may be unable to reach an agreement with the customer or discover previously unknown matters, conditions or liabilities and may be forced to abandon the opportunity after incurring significant costs and diverting management’s attention. |
|
· |
We may fail to have sufficient equity, adequate capital resources or other financing available to complete acquisitions. |
If any of these risks occur, we may be materially and adversely affected.
Insurance on our properties, which our tenants are typically required to maintain, may not adequately cover all losses, and uninsured losses could materially and adversely affect us. Our leases and loan agreements typically require that our tenants and borrowers maintain insurance of the types and in the amounts that are usual and customary for similar types of commercial property, as reviewed by our independent insurance consultant. Under certain circumstances, however, we may permit certain tenants and borrowers to self‑insure. Depending on the location of the property, losses of a catastrophic nature, such as those caused by earthquakes or floods, may be covered by insurance policies that are held by our tenants with limitations, such as large deductibles or co‑payments that a tenant may not be able to meet.
In addition, factors such as inflation, changes in building codes and ordinances, environmental considerations and others, including terrorism or acts of war, may make any insurance proceeds we receive insufficient to repair or
15
replace a property if it is damaged or destroyed. In that situation, the insurance proceeds we receive may not be adequate to restore our economic position with respect to the affected real property. In the event we experience a substantial or comprehensive loss of any of our properties, we may not be able to rebuild such property to its existing specifications without significant capital expenditures, which may exceed any amounts received pursuant to insurance policies, as reconstruction or improvement of such a property would likely require significant upgrades to meet zoning and building code requirements. The loss of our capital investment in, or anticipated future returns from, our properties due to material uninsured losses could materially and adversely affect us.
Changes in zoning laws may prevent us from restoring a property in the event of a substantial casualty loss. Due to changes, among other things, in applicable building and zoning ordinances and codes, or zoning laws, affecting certain of our properties that have come into effect after the construction of the properties, certain properties may not comply fully with current zoning laws, including use, parking and setback requirements, but may qualify as permitted non‑conforming uses. Such changes may limit our or our tenant’s ability to restore the premises of a property to its previous condition in the event of a substantial casualty loss with respect to the property or the ability to refurbish, expand or renovate such property to remain compliant. If we are unable to restore a property to its prior use after a substantial casualty loss, we may be unable to re‑lease the space at a comparable rent or sell the property at an acceptable price, which may materially and adversely affect us.
Some of our customers operate under franchise or license agreements, which, if terminated or not renewed prior to the expiration of their leases with us, would likely impair their ability to pay us rent. As of December 31, 2014, 20% of our customers operated under franchise or license agreements. Generally, franchise agreements have terms that end earlier than the respective expiration dates of the related leases. In addition, a tenant’s or borrower’s rights as a franchisee or licensee typically may be terminated and the tenant or borrower may be precluded from competing with the franchisor or licensor upon termination. Usually, we have no notice or cure rights with respect to such a termination and have no rights to assignment of any such franchise agreement. This may have an adverse effect on our ability to mitigate losses arising from a default on any of our leases or loans. A franchisor’s or licensor’s termination or refusal to renew a franchise or license agreement would likely have a material adverse effect on the ability of the tenant or borrower to make payments under its lease or loan, which could materially and adversely affect us.
A small percentage of the businesses operating on our properties have limited operating histories, which increases the risk that the tenants operating those businesses may default on rent payments to us. As of December 31, 2014, 29 of the 947 properties in our investment portfolio had been open for less than 12 months or were under construction. The businesses operating on these properties, whether newly constructed or recently opened, may not perform as anticipated, and the tenant may become unable to pay rent to us, which may materially and adversely affect us.
If a tenant defaults under either the ground lease or mortgage loan of a hybrid lease, we may be required to take judicial or administrative action or begin foreclosure proceedings before we can re‑lease or sell the property. As of December 31, 2014, 4.7% of our annualized base rent and interest was derived from hybrid leases. A hybrid lease is a modified sale‑leaseback transaction, where the customer sells us their land, leases the land back from us under a ground lease and we simultaneously make a mortgage loan to the customer secured by the improvements the customer continues to own. If a customer defaults under a hybrid lease, we may: (1) evict the customer under the ground lease and assume ownership of the improvements; or (2) if required by a court, foreclose on the mortgage loan that is secured by the improvements. Under a ground lease, we as ground lessor generally become the owner of the improvements on the land at lease maturity or if the tenant defaults. It is possible that a court could require us to foreclose on the mortgage secured by the improvements rather than simply evicting the defaulting tenant under the ground lease. If foreclosure is required rather than simple eviction, we might encounter delays and expenses in obtaining possession of the land and improvements, which in turn could delay our ability to sell or re‑lease the property in a prompt manner, which could materially and adversely affect us.
We are subject to risks related to owning commercial real estate that could reduce the value of our properties. The value of our investments in commercial real estate is subject to the following risks, among others:
|
· |
changes in local real estate conditions in the markets in which our customers operate; |
16
|
· |
environmental risks related to the presence of hazardous or toxic substances or materials on our properties; |
|
· |
the subjectivity of real estate valuations and changes in such valuations over time; |
|
· |
the illiquidity of real estate compared to other financial assets; |
|
· |
changes in interest rates and the availability of financing; and |
|
· |
changes in the general economic and business climate. |
The occurrence of any of the risks described above may cause the value of our real estate to decline, which could materially and adversely affect us.
Global market and economic conditions may materially and adversely affect us and our tenants. Our business is sensitive to changes in the overall economic conditions that impact our customers’ financial condition and financing practices. Adverse economic conditions such as high unemployment levels, interest rates, tax rates and fuel and energy costs may impact the results of our tenants’ operations, which may impact their ability to meet their obligations to us. During periods of economic slowdown, such as the global and U.S. economic downturn of 2008 and 2009, which resulted in increased unemployment, large‑scale business failures and tight credit markets, demand for real estate may decline, resulting in lower rents we can charge or an increased number of defaults under our existing leases. Accordingly, a decline in economic conditions could materially and adversely affect us.
Illiquidity of real estate investments and restrictions imposed by the Code could significantly impede our ability to respond to adverse changes in the performance of our properties and harm our financial condition. Some of the real estate investments we have made and expect to make in the future may be difficult to sell quickly. Therefore, our ability to promptly sell one or more properties in our portfolio in response to changing economic, financial or investment conditions could be limited. In particular, these risks could arise from weaknesses in or even the lack of an established market for a property, changes in the financial condition or prospects of prospective purchasers, changes in national or international economic conditions, such as the most recent economic downturn, and changes in laws, regulations or fiscal policies of the jurisdiction in which our properties are located.
In addition, the Code imposes restrictions on a REIT’s ability to dispose of properties, which restrictions are not applicable to other types of real estate companies. In particular, the tax laws applicable to REITs effectively require that we hold our properties for investment, rather than primarily for sale in the ordinary course of business, which may cause us to forgo or defer sales of properties that otherwise would be in our best interest. Therefore, we may not be able to vary our portfolio in response to economic or other conditions promptly or on favorable terms, which may materially and adversely affect our operations, cash flow and ability to pay distributions on our common stock.
Inflation may materially and adversely affect us and our tenants. We may experience periods when inflation is greater than the increases in rent provided by many of our leases, in which event rent increases will not keep up with the rate of inflation. If this occurs, we will not have the source of internal growth we expect. Also, increased costs may have an adverse impact on our tenants if increases in their operating expenses exceed increases in revenue, which may adversely affect our customers’ ability to satisfy their financial obligations to us.
Property vacancies could result in significant capital expenditures. The loss of a tenant, either through lease expiration or tenant bankruptcy or insolvency, may require us to spend significant amounts of capital to renovate the property before it is suitable for a new tenant and cause us to incur significant costs in the form of ongoing expenses for property maintenance, taxes, insurance and other expenses. Many of the leases we enter into or acquire are for properties that are especially suited to the particular business of the tenants operating on those properties. Because these properties have been designed or physically modified for a particular tenant, if the current lease is terminated or not renewed, we may be required to renovate the property at substantial costs, decrease the rent we charge or provide other concessions to re‑lease the property. In addition, if we are required to sell the property, we may have difficulty selling it to a party other than the tenant due to the special purpose for which the property may have been designed or modified. This potential illiquidity may limit our ability to quickly modify our portfolio in response to changes in economic or other conditions, including tenant demand. These limitations may materially and adversely affect us.
17
The loss of a borrower or the failure of a borrower to make loan payments on a timely basis will reduce our revenues and may cause us to incur substantial costs, which could lead to losses on our investments and reduced returns to our stockholders. From time to time, we make or assume commercial mortgage loans. We have also made a limited amount of investments on properties we own or finance in the form of loans secured by equipment or other fixtures owned by our customers. The success of our loan investments materially depends on the financial stability of our borrowers. The success of our borrowers depends on each of their individual businesses and their industries, which could be affected by economic conditions in general, changes in consumer trends and preferences and other factors over which neither they nor we have control. A default of a borrower on its loan payments to us that would prevent us from earning interest or receiving a return of the principal of our loan could materially and adversely affect us. In the event of a default, we may also experience delays in enforcing our rights as lender and may incur substantial costs in collecting the amounts owed to us and in liquidating any collateral.
Foreclosure and other similar proceedings used to enforce payment of real estate loans are generally subject to principles of equity, which are designed to relieve the indebted party from the legal effect of that party’s default. Foreclosure and other similar laws may limit our right to obtain a deficiency judgment against the defaulting party after a foreclosure or sale. The application of any of these principles may lead to a loss or delay in the payment on loans we hold, which in turn could reduce the amounts we have available to make distributions. Further, in the event we have to foreclose on a property, the amount we receive from the foreclosure sale of the property may be inadequate to fully pay the amounts owed to us by the borrower and our costs incurred to foreclose, repossess and sell the property, which could materially and adversely affect us.
Our investments in mortgage loans may be affected by unfavorable real estate market conditions, which could decrease the value of those loans. As of December 31, 2014, we had investments in mortgage loans having an aggregate unpaid principal balance of $65 million. Investments in mortgage loans are subject to the risk of default by the borrowers and interest‑rate risks. To the extent we incur delays in liquidating defaulted mortgage loans, we may not be able to obtain all amounts due to us under such loans. Further, the values of the properties securing the mortgage loans may not remain at the levels existing on the dates of origination of those mortgage loans or the dates of our investment in the loans. If the values of the underlying properties decline, the value of the collateral securing our mortgage loans will also decline, and if we were to foreclose on any of the properties securing the mortgage loans, we may not be able to sell or lease them for an amount equal to the unpaid amounts due to us under the mortgage loans. As a result, defaults on mortgage loans in which we may invest may materially and adversely affect us.
Compliance with the Americans with Disabilities Act and fire, safety and other regulations may require us to make significant unanticipated expenditures that could materially and adversely affect us. Our properties are subject to the Americans with Disabilities Act, or ADA. Under the ADA, all public accommodations must meet federal requirements related to access and use by disabled persons. Compliance with the ADA could require us to modify the properties we own or may purchase to remove architectural and communication barriers in order to make our properties readily accessible to and usable by disabled individuals, and may restrict renovations on our properties. Failure to comply with the ADA could result in the imposition of fines or an award of damages to private litigants, as well as the incurrence of the costs of making modifications to attain compliance. Future legislation could impose additional obligations or restrictions on our properties. Our tenants and borrowers are generally responsible to maintain and repair our properties pursuant to our lease and loan agreements, including compliance with the ADA and other similar laws and regulations, but we could be held liable as the owner of the property for their failure to comply with the ADA or other similar laws and regulations. Any required changes could involve greater expenditures than anticipated or the changes might be made on a more accelerated basis than anticipated, either of which could adversely affect the ability of our tenants to cover such costs. If we are subject to liability under the ADA or similar laws and regulations as an owner and our tenants are unable to cover the cost of compliance or if we are required to expend our own funds to comply with the ADA or similar laws and regulations, we could be materially and adversely affected.
In addition, our properties are subject to various laws and regulations relating to fire, safety and other regulations, and in some instances, common‑area obligations. Our tenants and borrowers have primary responsibility for compliance with these requirements pursuant to our lease and loan agreements. Our tenants and borrowers may not have the financial ability to fully comply with these regulations. If our tenants and borrowers are unable to comply with these regulations, they may be unable to pay rent on time or may default, or we may have to make substantial capital expenditures to comply with these regulations, which we may not be able to recoup from our tenants and
18
borrowers. We may also face owner liability for failure to comply with these regulations, which may lead to the imposition of fines or an award of damages to private litigants. Therefore, the failure of our tenants and borrowers to comply with these regulations could materially and adversely affect us.
The costs of compliance with or liabilities related to environmental laws may materially and adversely affect us. Our properties may be subject to known and unknown environmental liabilities under various federal, state and local laws and regulations relating to human health and the environment. Certain of these laws and regulations may impose joint and several liability on certain statutory classes of persons, including owners or operators, for the costs of investigation or remediation of contaminated properties. These laws and regulations apply to past and present business operations on the properties, and the use, storage, handling and recycling or disposal of hazardous substances or wastes. We may face liability regardless of our knowledge of the contamination, the timing of the contamination, the cause of the contamination or the party responsible for the contamination of the property. Our leases and loans typically impose obligations on our tenants and borrowers to indemnify us from all or most compliance costs we may experience as a result of the environmental conditions on our properties, but if a tenant or borrower fails to, or cannot, comply, we may be required to pay such costs. We cannot predict whether in the future, new or more stringent environmental laws will be enacted or how such laws will impact the operations of businesses on our properties. Costs associated with an adverse environmental event could be substantial, and the potential liability as to any of our properties is generally not limited under such laws and regulations and could significantly exceed the value of such property.
Under the laws of many states, contamination on a site may give rise to a lien on the site for clean‑up costs. In several states, such a lien has priority over all existing liens, including those of existing mortgages. In these states, a lien of a mortgage may lose its priority to such a “superlien.” If any of the properties on which we have a mortgage are or become contaminated and subject to a superlien, we may not be able to recover the full value of our investment and may be materially and adversely affected.
Certain federal, state and local laws, regulations and ordinances govern the use, removal and/or replacement of underground storage tanks in the event of a release on, or an upgrade or redevelopment of, certain properties. Such laws, as well as common‑law standards, may impose liability for any releases of hazardous substances associated with the underground storage tanks and may provide for third parties to seek recovery from owners or operators of such properties for damages associated with such releases. If hazardous substances are released from any underground storage tanks on any of our properties, we may be materially and adversely affected.
In a few states, transfers of some types of sites are conditioned upon cleanup of contamination prior to transfer, including in cases where a lender has become the owner of the site through a foreclosure, deed in lieu of foreclosure or otherwise. If any of our properties are subject to such contamination, we may be subject to substantial clean‑up costs before we are able to sell or otherwise transfer the property.
Certain federal, state and local laws, regulations and ordinances govern the removal, encapsulation or disturbance of asbestos‑containing materials, or ACMs, in the event of the remodeling, renovation or demolition of a building. Such laws, as well as common‑law standards, may impose liability for releases of ACMs and may impose fines and penalties against us or our tenants for failure to comply with these requirements or provide for third parties to seek recovery from us or our tenants.
If we or our tenants or borrowers become subject to any of the above‑ mentioned environmental risks, we may be materially and adversely affected.
Our properties may contain or develop harmful mold, which could lead to liability for adverse health effects and costs of remediation. When excessive moisture accumulates in buildings or on building materials, mold growth may occur, particularly if the moisture problem remains undiscovered or is not addressed over a period of time. Some molds may produce airborne toxins or irritants. Exposure to mold may cause a variety of adverse health effects and symptoms, including allergic or other reactions. If our tenants or their employees or customers are exposed to mold at any of our properties, we could be required to undertake a costly remediation program to contain or remove the mold from the affected property. In addition, exposure to mold by our tenants or others could subject us to liability if property damage or health concerns arise. If we were to become subject to significant mold‑related liabilities, we could be materially and adversely affected, which could harm our business.
19
Our proprietary IT platform may not capture all of the necessary information to allow us to properly monitor and analyze our tenants’ and borrowers’ credit risk, which may materially and adversely affect us. We have a proprietary information technology, or IT, platform, which we developed to proactively manage our investment portfolio. Our IT platform offers customer relationship management and general ledger and servicing system integration. Another component of our IT platform is the STORE Universal Database System, or SUDS, which provides our management with access to lease abstracts, tenant information, document scans, property data and servicing information. Our IT platform and SUDS may not capture all the information needed to mitigate the risk of tenant or borrower default.
Our revenues and expenses are not directly correlated and, because a large percentage of our costs and expenses are fixed, we may not be able to adapt our cost structure to offset declines in our revenue. Most of the expenses associated with our business, such as our office rent, certain acquisition costs, insurance, employee wages and benefits and other general corporate expenses, are relatively inflexible and will not necessarily decrease with a reduction in revenue from our business. Our expenses also will be affected by inflationary increases, and certain of our cost increases may exceed the rate of inflation in any given period. By contrast, our revenue is affected by many factors beyond our control, such as the economic conditions of the markets where we own properties. As a result, we may not be able to fully offset rising costs by increasing our rents, which could have a material and adverse effect on us.
We may become subject to litigation, which could materially and adversely affect us. In the future we may become subject to litigation, including claims relating to our operations, debt and equity offerings and otherwise in the ordinary course of business. Some of these claims may result in significant defense costs and potentially significant judgments against us, some of which are not, or cannot be, insured against. We generally intend to defend ourselves, but we cannot be certain of the ultimate outcomes of any claims that may arise. Resolution of these types of matters against us may result in our having to pay significant fines, judgments or settlements, which, if uninsured, or if the fines, judgments and settlements exceed insured levels, could adversely impact our earnings and cash flows, thereby materially and adversely affecting us. Certain litigation or the resolution of certain litigation may affect the availability or cost of some of our insurance coverage, which could materially and adversely impact us, expose us to increased risks that would be uninsured and materially and adversely impact our ability to attract directors and officers.
Our portfolio of tenants and borrowers may be riskier than portfolios comprised of rated investment‑grade companies. Most of our customers have not been assigned a credit rating by any nationally recognized rating agency. Our method of determining creditworthiness of potential customers may be less comprehensive and detailed than the process by which nationally recognized rating agencies assign company credit ratings. As a result, our investment portfolio of tenants and borrowers may be riskier than a portfolio comprised of rated investment‑grade companies.
We may not acquire the properties that we evaluate in our pipeline. We actively maintain a multi-billion dollar pipeline of investment opportunities. However, we typically close only a small percentage (approximately 5%) of all transactions we evaluate. Transactions may fail to close for a variety of reasons, including the discovery of previously unknown liabilities or other items uncovered during our diligence process. Similarly, we may never execute binding purchase agreements with respect to properties that are currently subject to non‑binding letters of intent, and properties with respect to which we are negotiating may never lead to the execution of any letter of intent. For many other reasons, we may not ultimately acquire the remaining properties currently in our pipeline. Accordingly, you should not place undue reliance on the concept of a pipeline as we have referred to in this Annual Report.
Risks Related to Our Organization and Structure
Our controlling stockholder has substantial influence over our business, and its interests, and the interests of certain members of our management, may differ from our interests or those of our other stockholders. Our controlling stockholder beneficially owns approximately 72% of our outstanding common stock. As a result, our controlling stockholder has the power to elect a majority of our directors and, consequently, appoint our executive officers, set our management policies and exercise overall control over us and our subsidiaries.
The interests of our controlling stockholder may differ from the interests of our other stockholders, and the concentration of control in our controlling stockholder will limit other stockholders’ ability to influence corporate matters. In addition, certain members of our management have certain ownership interests in the holding company through which our controlling stockholder owns our securities, which may cause them to have interests that differ from
20
our other stockholders. The concentration of ownership and voting power of our controlling stockholder may also delay, defer or even prevent an acquisition by a third party or other change of control of our company and may make some transactions more difficult or impossible without the support of our controlling stockholder, even if such events are in the best interests of our other stockholders. The concentration of voting power that our controlling stockholder has may have an adverse effect on the price of our common stock. As a result of our being controlled by a controlling stockholder, we may take actions that our other stockholders do not view as beneficial, which may adversely affect our results of operations and financial condition and cause the value of your investment in us to decline.
We are a “controlled company” within the meaning of the NYSE’s rules, and, as a result, qualify for, and intend to rely on, exemptions from certain corporate governance requirements. You will not have the same protections afforded to stockholders of companies that are subject to such requirements. Our controlling stockholder controls a majority of the combined voting power of all classes of our stock entitled to vote generally in the election of directors. As a result, we are a “controlled company” within the meaning of the corporate‑governance standards of the NYSE. Under these rules, a company of which more than 50% of the voting power in the election of directors is held by an individual, group or another company is a “controlled company” and may elect not to comply with certain corporate‑governance requirements, including but not limited to the following:
|
· |
having a board that is composed of a majority of “independent directors,” as defined under the rules of such exchange; |
|
· |
having a compensation committee that is composed entirely of independent directors; and |
|
· |
having a nominating and corporate governance committee that is composed entirely of independent directors. |
We currently use, and intend to continue to use, all of these exemptions. As a result, a majority of the directors on our board of directors are not independent. In addition, although we have a fully independent audit committee, our compensation and nominating and corporate governance committees do not consist entirely of independent directors. Accordingly, you do not have the same protections afforded to stockholders of companies that are subject to all of the corporate governance requirements of the NYSE.
Our board of directors may change our investment strategy, financing strategy or leverage policies without stockholder consent. Our board of directors, which our controlling stockholder has the right to elect for the foreseeable future, may change any of our strategies, policies or procedures with respect to property acquisitions and divestitures, asset allocation, growth, operations, indebtedness, financing and distributions at any time without the consent of our stockholders, which could result in our acquiring properties that are different from, and possibly riskier than, the types of single‑tenant real estate and related investments described in this Annual Report. These changes could materially and adversely affect us.
Our board’s power to increase the number of authorized shares of our stock without stockholder approval may negatively impact our existing stockholders. Our charter authorizes our board of directors, with the approval of a majority of the board of directors and without stockholder approval, to amend our charter to increase or decrease the aggregate number of shares of stock or the number of shares of any class or series of stock that we are authorized to issue. Accordingly, our board could authorize the issuance of shares of common stock or another class or series of stock, including a class or series of preferred stock, that could have the effect of delaying, deferring or preventing a change in control of us that our existing stockholders may view as favorable. In addition, our board may increase our authorized stock in order to issue additional shares in connection with future financings and other transactions. These additional issuances could dilute the ownership interests of our existing stockholders.
If we fail to implement and maintain an effective system of integrated internal controls, we may not be able to accurately report our financial results. As a publicly traded company, we are required to comply with the applicable provisions of the Sarbanes‑Oxley Act, which requires, among other things, that we establish and maintain effective internal controls and procedures for financial reporting and effective disclosure controls and procedures for making required filings with the SEC. Effective internal and disclosure controls are necessary for us to provide reliable financial reports and effectively prevent fraud and to operate successfully as a public company. If we cannot provide
21
reliable financial reports or prevent fraud, our reputation and operating results would be harmed, which could depress the trading price of our common stock.
Designing and implementing an effective system of integrated internal controls is a continuous effort that requires significant resources and devotion of time. As part of the ongoing monitoring of internal controls required of publicly traded companies, we may discover significant deficiencies or material weaknesses in our internal controls. As a result of deficiencies or weaknesses that may be identified in our internal controls, we may also identify certain deficiencies in some of our disclosure controls and procedures that we believe require remediation. If we discover deficiencies or weaknesses, we will make efforts to improve our internal and disclosure controls. However, we may not be successful. In addition, as an “emerging growth company,” our independent registered public accounting firm will not be required to formally attest to the effectiveness of our internal control over financial reporting until the date we are no longer an “emerging growth company.”
Any failure to maintain effective controls or timely effect any necessary improvement of our internal and disclosure controls could harm operating results or cause us to fail to meet our reporting obligations, which could affect our ability to remain listed with the NYSE. Ineffective internal and disclosure controls could also cause investors to lose confidence in our reported financial information, which would likely materially and adversely affect us.
We will continue to incur significant expenses as a result of being a public company, which will negatively impact our financial performance. We incur, and will continue to incur, significant legal, accounting, insurance and other expenses as a result of being a public company. The Dodd‑Frank Wall Street Reform and Consumer Protection Act of 2010, or the Dodd‑Frank Act, and the Sarbanes‑Oxley Act, as well as related rules implemented by the SEC and the NYSE, have required changes in corporate governance practices of public companies. Although the JOBS Act may for a limited period of time lessen the cost of complying with some of these additional regulatory and other requirements, we nonetheless have experienced a substantial increase in legal, accounting, insurance and certain other expenses, which will negatively impact our results of operations and financial condition. In addition, rules that the SEC is implementing or is required to implement pursuant to the Dodd‑Frank Act are expected to require additional changes. We expect that compliance with these and other similar laws, rules and regulations, including compliance with Section 404 of the Sarbanes‑Oxley Act, will substantially increase our expenses, including our legal and accounting costs, and make some activities more time‑consuming and costly. We also expect these laws, rules and regulations to make it more expensive for us to obtain director and officer liability insurance, and we may be required to accept reduced policy limits and coverage or incur substantially higher costs to obtain the same or similar coverage, which may make it more difficult for us to attract and retain qualified persons to serve on our board of directors or as officers.
We are an emerging growth company, and the reduced reporting requirements applicable to emerging growth companies may make our common stock less attractive to investors. We are an “emerging growth company” as defined in the JOBS Act. We will remain an “emerging growth company” until the earliest to occur of:
|
· |
the last day of the fiscal year during which our total annual revenue equals or exceeds $1 billion (subject to adjustment for inflation); |
|
· |
the last day of the fiscal year following the fifth anniversary of our IPO, which occurred in November 2014; |
|
· |
the date on which we have, during the previous three‑year period, issued more than $1 billion in non‑convertible debt; or |
|
· |
the date on which we are deemed to be a “large accelerated filer” under the Exchange Act, which would occur if the market value of our common stock that is held by non‑affiliates exceeds $700 million as of the last business day of our most recently completed second fiscal quarter. |
We may take advantage of exemptions from various reporting requirements that are applicable to other public companies that are not emerging growth companies, including but not limited to, not being required to comply with the auditor attestation requirements of Section 404 of the Sarbanes‑Oxley Act, reduced disclosure obligations regarding executive compensation in our periodic reports and proxy or information statements and exemptions from the
22
requirements of holding a non‑binding advisory vote on executive compensation and seeking stockholder approval of any golden parachute payments not previously approved, except we have irrevocably elected not to take advantage of the extension of time to comply with new or revised financial accounting standards available under Section 102(b) of the JOBS Act. We cannot predict if investors will find our common stock less attractive because we may rely on these exemptions. If some investors find our common stock less attractive as a result, there may be a less active trading market for our common stock and our per share trading price may be adversely affected and more volatile.
Risks Related to Our Tax Status and Other Tax Related Matters
We would incur adverse tax consequences if we fail to qualify as a REIT. We have elected to be taxed as a REIT under the Code. Our qualification as a REIT requires us to satisfy numerous requirements, some on an annual and quarterly basis, established under highly technical and complex Code provisions for which there are only limited judicial or administrative interpretations, and which involves the determination of various factual matters and circumstances not entirely within our control. We expect that our current organization and methods of operation will enable us to continue to qualify as a REIT, but we may not so qualify or we may not be able to remain so qualified in the future. In addition, U.S. federal income tax laws governing REITs and other corporations and the administrative interpretations of those laws may be amended at any time, potentially with retroactive effect. Future legislation, new regulations, administrative interpretations or court decisions could adversely affect our ability to qualify as a REIT or adversely affect our stockholders.
If we fail to qualify as a REIT in any taxable year, we would be subject to federal income tax (including any applicable alternative minimum tax) on our taxable income at regular corporate rates, and would not be allowed to deduct dividends paid to our stockholders in computing our taxable income. Also, unless the Internal Revenue Service granted us relief under certain statutory provisions, we could not re‑elect REIT status until the fifth calendar year after the year in which we first failed to qualify as a REIT. The additional tax liability from the failure to qualify as a REIT would reduce or eliminate the amount of cash available for investment or distribution to our stockholders. This would likely have a significant adverse effect on the value of our securities and our ability to raise additional capital. In addition, we would no longer be required to make distributions to our stockholders. Even if we continue to qualify as a REIT, we will continue to be subject to certain federal, state and local taxes on our income and property.
Dividends paid by REITs generally do not qualify for reduced tax rates. In general, the maximum U.S. federal income tax rate for dividends that constitute “qualified dividend income” paid to individuals, trusts and estates is 20%. Unlike dividends received from a corporation that is not a REIT, our distributions generally are not eligible for the reduced rates. Although these rules do not adversely affect the taxation of REITs or dividends payable by REITs, investors who are individuals, trusts and estates may perceive investments in REITs to be relatively less attractive than investments in the stocks of non‑REIT corporations that pay dividends, which could materially and adversely affect the value of the shares of REITs, including the per share trading price of our common stock.
We may conduct a portion of our business through taxable REIT subsidiaries, which are subject to certain tax risks. We have established a taxable REIT subsidiary and may establish others in the future. Despite our qualification as a REIT, our taxable REIT subsidiaries must pay income tax on their taxable income. In addition, we must comply with various tests to continue to qualify as a REIT for federal income tax purposes, and our income from and investments in our taxable REIT subsidiaries generally do not constitute permissible income and investments for these tests. Our dealings with our taxable REIT subsidiaries may adversely affect our REIT qualification. Furthermore, we may be subject to a 100% penalty tax, we may jeopardize our ability to retain future gains on real property sales, or our taxable REIT subsidiaries may be denied deductions, to the extent our dealings with our taxable REIT subsidiaries are not deemed to be arm’s length in nature or are otherwise not permitted under the Code.
The Internal Revenue Service may treat sale‑leaseback transactions as loans, which could jeopardize our REIT status or require us to make an unexpected distribution. The Internal Revenue Service may take the position that specific sale‑leaseback transactions that we treat as leases are not true leases for federal income tax purposes but are, instead, financing arrangements or loans. If a sale‑leaseback transaction were so re‑characterized, we might fail to satisfy the REIT asset tests, the income tests or distribution requirements and consequently lose our REIT status effective with the year of re‑characterization unless we elect to make an additional distribution to maintain our REIT status.
23
REIT distribution requirements limit our available cash. As a REIT, we are subject to annual distribution requirements, which limit the amount of cash we retain for other business purposes, including amounts to fund our growth. We generally must distribute annually at least 90% of our net REIT taxable income, excluding any net capital gain, in order for our distributed earnings to not be subject to corporate income tax. We intend to make distributions to our stockholders to comply with the requirements of the Code. However, differences in timing between the recognition of taxable income and the actual receipt of cash could require us to sell assets or borrow funds on a short‑term or long‑term basis to meet the 90% distribution requirement of the Code, even if the prevailing market conditions are not favorable for these borrowings.
Certain property transfers may generate prohibited transaction income, resulting in a penalty tax on gain attributable to the transaction. From time to time, we may transfer or otherwise dispose of some of our properties. Under the Code, any gain resulting from transfers of properties that we hold as inventory or primarily for sale to customers in the ordinary course of business would be treated as income from a prohibited transaction and subject to a 100% penalty tax. Since we acquire properties for investment purposes, we do not believe that our occasional transfers or disposals of property are prohibited transactions. However, whether property is held for investment purposes is a question of fact that depends on all the facts and circumstances surrounding the particular transaction. The Internal Revenue Service may contend that certain transfers or disposals of properties by us are prohibited transactions. If the Internal Revenue Service were to argue successfully that a transfer or disposition of property constituted a prohibited transaction, then we would be required to pay a 100% penalty tax on any gain allocable to us from the prohibited transaction and we may jeopardize our ability to retain future gains on real property sales. In addition, income from a prohibited transaction might adversely affect our ability to satisfy the income tests for qualification as a REIT for federal income tax purposes.
We could face possible state and local tax audits and adverse changes in state and local tax laws. As discussed in the risk factors above, because we are organized and qualify as a REIT, we are generally not subject to federal income taxes, but we are subject to certain state and local taxes. From time to time, changes in state and local tax laws or regulations are enacted, which may result in an increase in our tax liability. A shortfall in tax revenues for states and municipalities in which we own properties may lead to an increase in the frequency and size of such changes. If such changes occur, we may be required to pay additional state and local taxes. These increased tax costs could adversely affect our financial condition and the amount of cash available for the payment of distributions to our stockholders. In the normal course of business, entities through which we own real estate may also become subject to tax audits. If such entities become subject to state or local tax audits, the ultimate result of such audits could have an adverse effect on our financial condition.
Qualifying as a REIT involves highly technical and complex provisions of the Code. Our qualification as a REIT involves the application of highly technical and complex Code provisions for which only limited judicial and administrative authorities exist. Even a technical or inadvertent violation could jeopardize our REIT qualification. Moreover, new legislation, court decisions or administrative guidance, in each case possibly with retroactive effect, may make it more difficult or impossible for us to qualify as a REIT. Our qualification as a REIT will depend on our satisfaction of certain asset, income, organizational, distribution, stockholder ownership and other requirements on a continuing basis. Our ability to satisfy the REIT income and asset tests depends upon our analysis of the characterization and fair market values of our assets, some of which are not susceptible to a precise determination and for which we will not obtain independent appraisals, and upon our ability to successfully manage the composition of our income and assets on an ongoing basis. In addition, our ability to satisfy the requirements to qualify as a REIT depends in part on the actions of third parties over which we have no control or only limited influence, including in cases where we own an equity interest in an entity that is classified as a partnership for U.S. federal income tax purposes.
24
Risks Related to Ownership of Our Common Stock
Changes in market conditions and volatility of stock prices could adversely affect the market price of our common stock. The stock markets, including the NYSE, on which we list our common stock, have experienced significant price and volume fluctuations. As a result, the market price of our common stock could be similarly volatile, and investors in our common stock may experience a decrease in the value of their shares, including decreases unrelated to our operating performance or prospects. In addition to the risks listed in this “Risk Factors” section, a number of factors could negatively affect the price per share of our common stock, including:
|
· |
general market and economic conditions; |
|
· |
actual or anticipated variations in our quarterly operating results or dividends or our payment of dividends in shares of our common stock; |
|
· |
changes in our funds from operations or earnings estimates; |
|
· |
difficulties or inability to access capital or extend or refinance existing debt; |
|
· |
changes in market valuations or similar companies; |
|
· |
publication of research reports about us or the real estate industry; |
|
· |
the general reputation of real estate investment trusts and the attractiveness of their equity securities in comparison to other equity securities; |
|
· |
general stock and bond market conditions, including changes in interest rates on fixed income securities, that may lead prospective purchasers of our stock to demand a higher annual yield from future dividends; |
|
· |
a change in analyst ratings; |
|
· |
additions or departures of key management personnel; |
|
· |
adverse market reaction to any additional debt we may incur in the future; |
|
· |
speculation in the press or investment community; |
|
· |
terrorist activity which may adversely affect the markets in which our securities trade, possibly increasing market volatility and causing further erosion of business and consumer confidence and spending; |
|
· |
failure to qualify as a REIT; |
|
· |
strategic decisions by us or our competitors, such as acquisitions, divestments, spin-offs, joint ventures, strategic investments or changes in business strategy; |
|
· |
failure to satisfy listing requirements of the NYSE; |
|
· |
governmental regulatory action and changes in tax laws; and |
|
· |
the issuance of additional shares of our common stock, or the perception that such sales might occur. |
Many of the factors listed above are beyond our control. These factors may cause the market price of shares of our common stock to decline, regardless of our financial condition, results of operations, business or our prospects.
25
Limitations on share ownership and limitations on the ability of our stockholders to effect a change in control of us restrict the transferability of our stock and may prevent takeovers that are beneficial to our stockholders. One of the requirements for maintenance of our qualification as a REIT for U.S. federal income tax purposes is that no more than 50% in value of our outstanding capital stock may be owned by five or fewer individuals, including entities specified in the Code, during the last half of any taxable year. Our charter contains ownership and transfer restrictions relating to our stock to assist us in complying with this and other REIT ownership requirements, among other purposes. However, the restrictions may have the effect of preventing a change of control that does not threaten REIT status. These restrictions include a provision in our charter that generally limits ownership by any person of more than 9.8% of the value of our outstanding stock or 9.8% (in value or by number of shares, whichever is more restrictive) of our outstanding common stock, unless our board of directors exempts the person from such ownership limitation. Absent such an exemption from our board of directors, the transfer of our stock to any person in excess of the applicable ownership limit, or any transfer of shares of such stock in violation of the ownership requirements of the Code for REITs, may be void under certain circumstances, and the intended transferee of such stock will acquire no rights in such shares. These provisions of our charter may have the effect of delaying, deferring or preventing someone from taking control of us, even though a change of control might involve a premium price for our stockholders or might otherwise be in our stockholders’ best interests.
A substantial portion of our total outstanding common stock may be sold into the market at any time. This could cause the market price of our common stock to drop significantly, even if our business is doing well, and make it difficult for us to sell equity securities in the future. The market price of our common stock could decline as a result of sales of a large number of shares of our common stock or the perception that such sales could occur. These sales, or the possibility that these sales may occur, also might make it difficult for us to sell equity securities in the future at times or prices that we deem appropriate.
If we raise additional capital through the issuance of new equity securities, your interest in us will be diluted. We may, and will likely, have to issue additional equity securities periodically to finance our growth. If we raise additional capital through the issuance of new equity securities, your interest in us will be diluted, which could cause you to lose all or a portion of your investment. If we are unable to access the public markets in the future, or if our performance or prospects decrease, we may need to consummate a private placement or public offering of our common stock or preferred stock. In addition, any new securities we may issue, such as preferred stock, may have rights, preferences or privileges senior to those securities held by you.
If securities analysts do not publish research or reports about our company, or if they issue unfavorable commentary about us or our industry or downgrade the outlook of our common stock, the price of our common stock could decline. The trading market for our common stock depends in part on the research and reports that third‑party securities analysts publish about our company and our industry. One or more analysts could downgrade the outlook of our common stock or issue other negative commentary about our company or our industry. In addition, we may be unable or slow to attract additional research coverage. Furthermore, if one or more of these analysts cease coverage of our company, we could lose visibility in the market. As a result of one or more of these factors, the trading price of our common stock could decline and cause you to lose all or a portion of your investment.
We may change the dividend policy for our common stock in the future. The decision to declare and pay dividends on our common stock, as well as the form, timing and amount of any such future dividends, is at the sole discretion of our board of directors and will depend on our earnings, cash flows, liquidity, financial condition, capital requirements, contractual prohibitions or other limitations under our indebtedness, the annual distribution requirements under the REIT provisions of the Code, state law and such other factors as our board of directors considers relevant. Any change in our dividend policy could have a material adverse effect on the market price of our common stock.
Legislative or regulatory action could adversely affect purchasers of our common stock. In recent years, numerous legislative, judicial and administrative changes have been made in the provisions of the federal income tax laws applicable to investments similar to an investment in our common stock. Changes are likely to continue to occur in the future, and these changes could adversely affect our stockholders’ investment in our common stock. These changes include but are not limited to the reduction or elimination of the corporate income tax under the Code. Any of these changes could have an adverse effect on an investment in our common stock or on the market value or resale potential of our common stock. Stockholders are urged to consult with their own tax advisor with respect to the impact
26
that recent legislation may have on their investment and the status of legislative, regulatory or administrative developments and proposals and their potential effect on their investment in our stock.
Item 1B. UNRESOLVED STAFF COMMENTS
None.
As of December 31, 2014, our total investment in real estate and loans approximated $2.8 billion, representing investments in 947 property locations, substantially all of which are profit centers for our customers. These investments generate our cash flows from more than 350 contracts predominantly structured as net leases, mortgage loans and combinations of leases and mortgage loans, or hybrid leases. All of our owned single‑tenant properties are subject to leases; the weighted average non‑cancellable remaining term of our leases at December 31, 2014 was 15 years.
Our real estate portfolio is highly diversified. As of December 31, 2014, our 947 property locations are operated by 226 customers across 46 states. None of our customers represented more than 4% of our portfolio at December 31, 2014, and our top ten largest customers represented less than 21% of annualized base rent and interest. Our customers operate their businesses across 208 brand names or business concepts in more than 65 industries. Our top five concepts as of December 31, 2014 were Gander Mountain, Ashley Furniture HomeStore, Applebee’s, Popeyes Louisiana Kitchen and Starplex Cinemas; combined, these concepts represented 15% of annualized base rent and interest. Our top five industries as of December 31, 2014 are restaurants, early childhood education centers, health clubs, movie theaters and sporting goods stores. Combined, these industries represented 55% of annualized base rent and interest.
Diversification by Customer
As of December 31, 2014, our 947 property locations were operated by our 226 customers. The following table identifies our ten largest customers as of December 31, 2014:
|
|
|
|
|
|
|
|
|
|
% of |
|
|
|
|
|
|
Annualized |
|
|
|
|
|
|
Base Rent |
|
Number |
|
|
|
|
and |
|
of |
|
|
Customer |
|
Interest (1) |
|
Properties |
|
|
Gander Mountain Company |
|
3.52 |
% |
12 |
|
|
Starplex Master Holdings, Inc. |
|
3.03 |
|
10 |
|
|
O’Charley’s LLC |
|
2.40 |
|
30 |
|
|
Sailormen, Inc. |
|
1.91 |
|
41 |
|
|
FreedomRoads, LLC |
|
1.84 |
|
8 |
|
|
Rainbow Early Education Holding, LLC |
|
1.70 |
|
34 |
|
|
Heald College, LLC |
|
1.52 |
|
5 |
|
|
Conn’s, Inc. |
|
1.49 |
|
7 |
|
|
RMH Franchise Holdings, Inc. |
|
1.46 |
|
17 |
|
|
Hill Country Holdings, LLC |
|
1.45 |
|
6 |
|
|
All other customers (216 customers) |
|
79.68 |
|
777 |
|
|
Total |
|
100.00 |
% |
947 |
|
|
(1) |
Represents the percentage of base rent and interest, annualized based on rates in effect on December 31, 2014, for all of our leases, loans and direct financing receivables in place as of that date. |
27
Diversification by Concept
As of December 31, 2014, our customers operated their businesses across 208 concepts. The following table identifies those concepts as of December 31, 2014:
|
|
|
|
|
|
|
|
|
|
% of |
|
|
|
|
|
|
Annualized |
|
|
|
|
|
|
Base Rent |
|
Number |
|
|
|
|
and |
|
of |
|
|
Customer Business Concept |
|
Interest (1) |
|
Properties |
|
|
Gander Mountain |
|
3.52 |
% |
12 |
|
|
Ashley Furniture HomeStore |
|
3.31 |
|
15 |
|
|
Applebee’s |
|
3.01 |
|
36 |
|
|
Popeyes Louisiana Kitchen |
|
2.53 |
|
57 |
|
|
Starplex Cinemas |
|
2.51 |
|
8 |
|
|
O’Charley’s |
|
2.40 |
|
30 |
|
|
KFC |
|
1.85 |
|
51 |
|
|
FreedomRoads |
|
1.84 |
|
8 |
|
|
Rainbow Child Care Center |
|
1.70 |
|
34 |
|
|
Heald College |
|
1.52 |
|
5 |
|
|
All other concepts (198 concepts) |
|
75.81 |
|
691 |
|
|
Total |
|
100.00 |
% |
947 |
|
|
(1) |
Represents the percentage of base rent and interest, annualized based on rates in effect on December 31, 2014, for all of our leases, loans and direct financing receivables in place as of that date. |
28
Diversification by Industry
As of December 31, 2014, our customers’ business concepts were diversified across more than 65 industries within the service, retail and industrial sectors of the U.S. economy. The following table summarizes those industries as of December 31, 2014:
|
|
|
|
|
|
|
|
|
|
|
|
% of |
|
|
|
|
|
|
|
|
Annualized |
|
|
|
Building |
|
|
|
|
Base Rent |
|
Number |
|
Square |
|
|
|
|
and |
|
of |
|
Footage |
|
|
Customer Industry |
|
Interest (1) |
|
Properties |
|
(in thousands) |
|
|
Service: |
|
|
|
|
|
|
|
|
Restaurants—full service |
|
17.96 |
% |
228 |
|
1,641 |
|
|
Restaurants—limited service |
|
9.98 |
|
236 |
|
724 |
|
|
Early childhood education centers |
|
8.13 |
|
119 |
|
1,176 |
|
|
Health clubs |
|
7.98 |
|
39 |
|
1,296 |
|
|
Movie theaters |
|
6.89 |
|
26 |
|
977 |
|
|
Junior colleges |
|
2.47 |
|
9 |
|
640 |
|
|
Colleges and professional schools |
|
2.07 |
|
5 |
|
205 |
|
|
All other service industries (27 industries) |
|
17.16 |
|
136 |
|
3,465 |
|
|
Total service: |
|
72.64 |
|
798 |
|
10,124 |
|
|
Retail: |
|
|
|
|
|
|
|
|
Sporting goods stores |
|
4.16 |
|
15 |
|
983 |
|
|
Furniture stores |
|
4.11 |
|
20 |
|
963 |
|
|
Recreational vehicle dealers |
|
1.84 |
|
8 |
|
207 |
|
|
All other retail industries (9 industries) |
|
6.32 |
|
46 |
|
2,447 |
|
|
Total retail: |
|
16.43 |
|
89 |
|
4,600 |
|
|
Industrial: |
|
|
|
|
|
|
|
|
All industrial (21 industries) |
|
10.93 |
|
60 |
|
5,891 |
|
|
Total |
|
100.00 |
% |
947 |
|
20,615 |
|
|
(1) |
Represents the percentage of base rent and interest, annualized based on rates in effect on December 31, 2014, for all of our leases, loans and direct financing receivables in place as of that date. |
29
Diversification by Geography
Our portfolio is also highly diversified by geography, as our 947 property locations can be found in 46 of the 50 states (excluding Alaska, Delaware, Hawaii and Rhode Island). The following table details the top ten geographical locations of the properties as of December 31, 2014:
|
|
|
|
|
|
|
|
|
|
% of |
|
|
|
|
|
|
Annualized |
|
|
|
|
|
|
Base Rent |
|
|
|
|
|
|
and |
|
Number of |
|
|
State |
|
Interest (1) |
|
Properties |
|
|
Texas |
|
13.57 |
% |
81 |
|
|
Illinois |
|
6.93 |
|
51 |
|
|
Georgia |
|
6.02 |
|
68 |
|
|
Tennessee |
|
5.87 |
|
58 |
|
|
Florida |
|
5.02 |
|
60 |
|
|
Ohio |
|
4.88 |
|
56 |
|
|
Arizona |
|
4.66 |
|
35 |
|
|
California |
|
4.55 |
|
16 |
|
|
North Carolina |
|
4.03 |
|
73 |
|
|
Pennsylvania |
|
3.36 |
|
19 |
|
|
All other states (36 states)(2) |
|
41.11 |
|
430 |
|
|
Total |
|
100.00 |
% |
947 |
|
|
(1) |
Represents the percentage of base rent and interest, annualized based on rates in effect on December 31, 2014, for all of our leases, loans and direct financing receivables in place as of that date. |
|
(2) |
Includes one property in Ontario, Canada which represents less than 0.2% of annualized base rent and interest. |
30
Contract Expirations
The following table sets forth the schedule of our lease, loan and direct financing receivable expirations as of December 31, 2014:
|
|
|
|
|
|
|
|
|
|
% of |
|
|
|
|
|
|
Annualized |
|
|
|
|
|
|
Base Rent |
|
|
|
|
|
|
and |
|
Number of |
|
|
Year of Lease Expiration or Loan Maturity (1) |
|
Interest (2) |
|
Properties |
|
|
2015 |
|
0.40 |
% |
5 |
|
|
2016 |
|
- |
|
- |
|
|
2017 |
|
0.37 |
|
4 |
|
|
2018 |
|
0.44 |
|
2 |
|
|
2019 |
|
1.09 |
|
6 |
|
|
2020 |
|
0.29 |
|
2 |
|
|
2021 |
|
1.23 |
|
4 |
|
|
2022 |
|
0.42 |
|
4 |
|
|
2023 |
|
3.70 |
|
38 |
|
|
2024 |
|
2.47 |
|
19 |
|
|
2025 |
|
1.90 |
|
9 |
|
|
2026 |
|
3.76 |
|
30 |
|
|
2027 |
|
8.91 |
|
62 |
|
|
2028 |
|
16.24 |
|
118 |
|
|
2029 |
|
19.41 |
|
201 |
|
|
2030 |
|
1.17 |
|
2 |
|
|
Thereafter |
|
38.20 |
|
441 |
|
|
Total |
|
100.00 |
% |
947 |
|
|
(1) |
Expiration year of contracts in place as of December 31, 2014 and excludes any tenant option renewal periods. |
|
(2) |
Represents the percentage of base rent and interest, annualized based on rates in effect on December 31, 2014, for all of our leases, loans and direct financing receivables in place as of that date. |
From time to time, we become party to various lawsuits, claims and other legal proceedings that arise in the ordinary course of our business and the business of our tenants. Since our organization in May 2011, we have not been a party, as plaintiff or defendant, to any legal proceedings that we believe to be material or which, individually or in the aggregate, would be expected to have a material effect on our business, financial condition or results of operations if determined adversely to us.
Item 4. MINE SAFETY DISCLOSURES
Not Applicable.
31
Item 5. MARKET FOR REGISTRANT’S COMMON STOCK, RELATED STOCKHOLDER MATTERS AND ISSUER PURCHASES OF EQUITY SECURITIES
The Company’s common stock is listed on the NYSE under the symbol “STOR”. The following table sets forth, for the quarters indicated, the range of high and low sales prices for the Company’s common stock on the NYSE during fiscal 2014 and distributions declared per share of common stock. The historical stock prices reflected in the following table are not necessarily indicative of future stock price performance.
|
|
|
|
|
|
|
|
|
|
|
|
|
|
|
2014 |
|
|||||||
|
|
|
|
|
|
|
|
|
Distributions |
|
|
|
|
|
High |
|
Low |
|
Declared |
|
|||
|
Quarter ended March 31, |
|
|
N/A |
|
|
N/A |
|
$ |
0.2395 |
|
|
Quarter ended June 30, |
|
|
N/A |
|
|
N/A |
|
$ |
0.2455 |
|
|
Quarter ended September 30, |
|
|
N/A |
|
|
N/A |
|
$ |
0.2870 |
|
|
Quarter ended December 31, |
|
$ |
22.46 |
|
$ |
19.25 |
|
$ |
0.2178 |
(1) |
|
(1) |
Includes a pro-rated dividend per common share of $0.1139, or $1.00 per share on an annualized basis, for the period since the closing of the IPO through December 31, 2014 that was paid in January 2015. |
During 2013, we declared quarterly dividends aggregating $0.8743 per share of common stock as follows: quarter ended March 31, $0.2096; quarter ended June 30, $0.2156; quarter ended September 30, $0.2216; and quarter ended December 31, $0.2275.
On March 6, 2015, the closing sale price of our common stock was $21.29 per share on the NYSE, and there were 24 holders of record of the 115,210,809 outstanding shares of our common stock. Because many of our shares of common stock are held by brokers and other institutions on behalf of stockholders, we are unable to estimate the total number of stockholders represented by these record holders. We have determined that, for federal income tax purposes, approximately 88.72% of the distributions paid in 2014 represented ordinary income and 6.41% represented long-term capital gain.
Distributions
The Company pays regular quarterly distributions to holders of its common stock. Future distributions will be at the discretion of our Board of Directors and will depend on our actual funds from operations, financial condition and capital requirements, the annual distribution requirements under the REIT provisions of the Code and other factors.
Issuer Purchases of Equity Securities
With proceeds from the IPO, on November 21, 2014 the Company redeemed all of the outstanding shares of its 12.5% Series A Cumulative Non-Voting Preferred Stock at a redemption price of $1,000.00 per share plus accrued and unpaid dividends. The Company did not repurchase any other equity securities during the year ended December 31, 2014.
Stock Performance Graph
The following performance chart compares, for the period from November 18, 2014 (our first trading day on the NYSE) through December 31, 2014, the cumulative total stockholder return on our common stock with that of the Standard & Poor’s 500 Composite Stock Index (the “S&P 500”) and the MSCI US REIT Index. The chart assumes $100.00 was invested on November 18, 2014 and assumes the reinvestment of any dividends. The historical stock price performance reflected in the following graph is not necessarily indicative of future stock price performance.
32
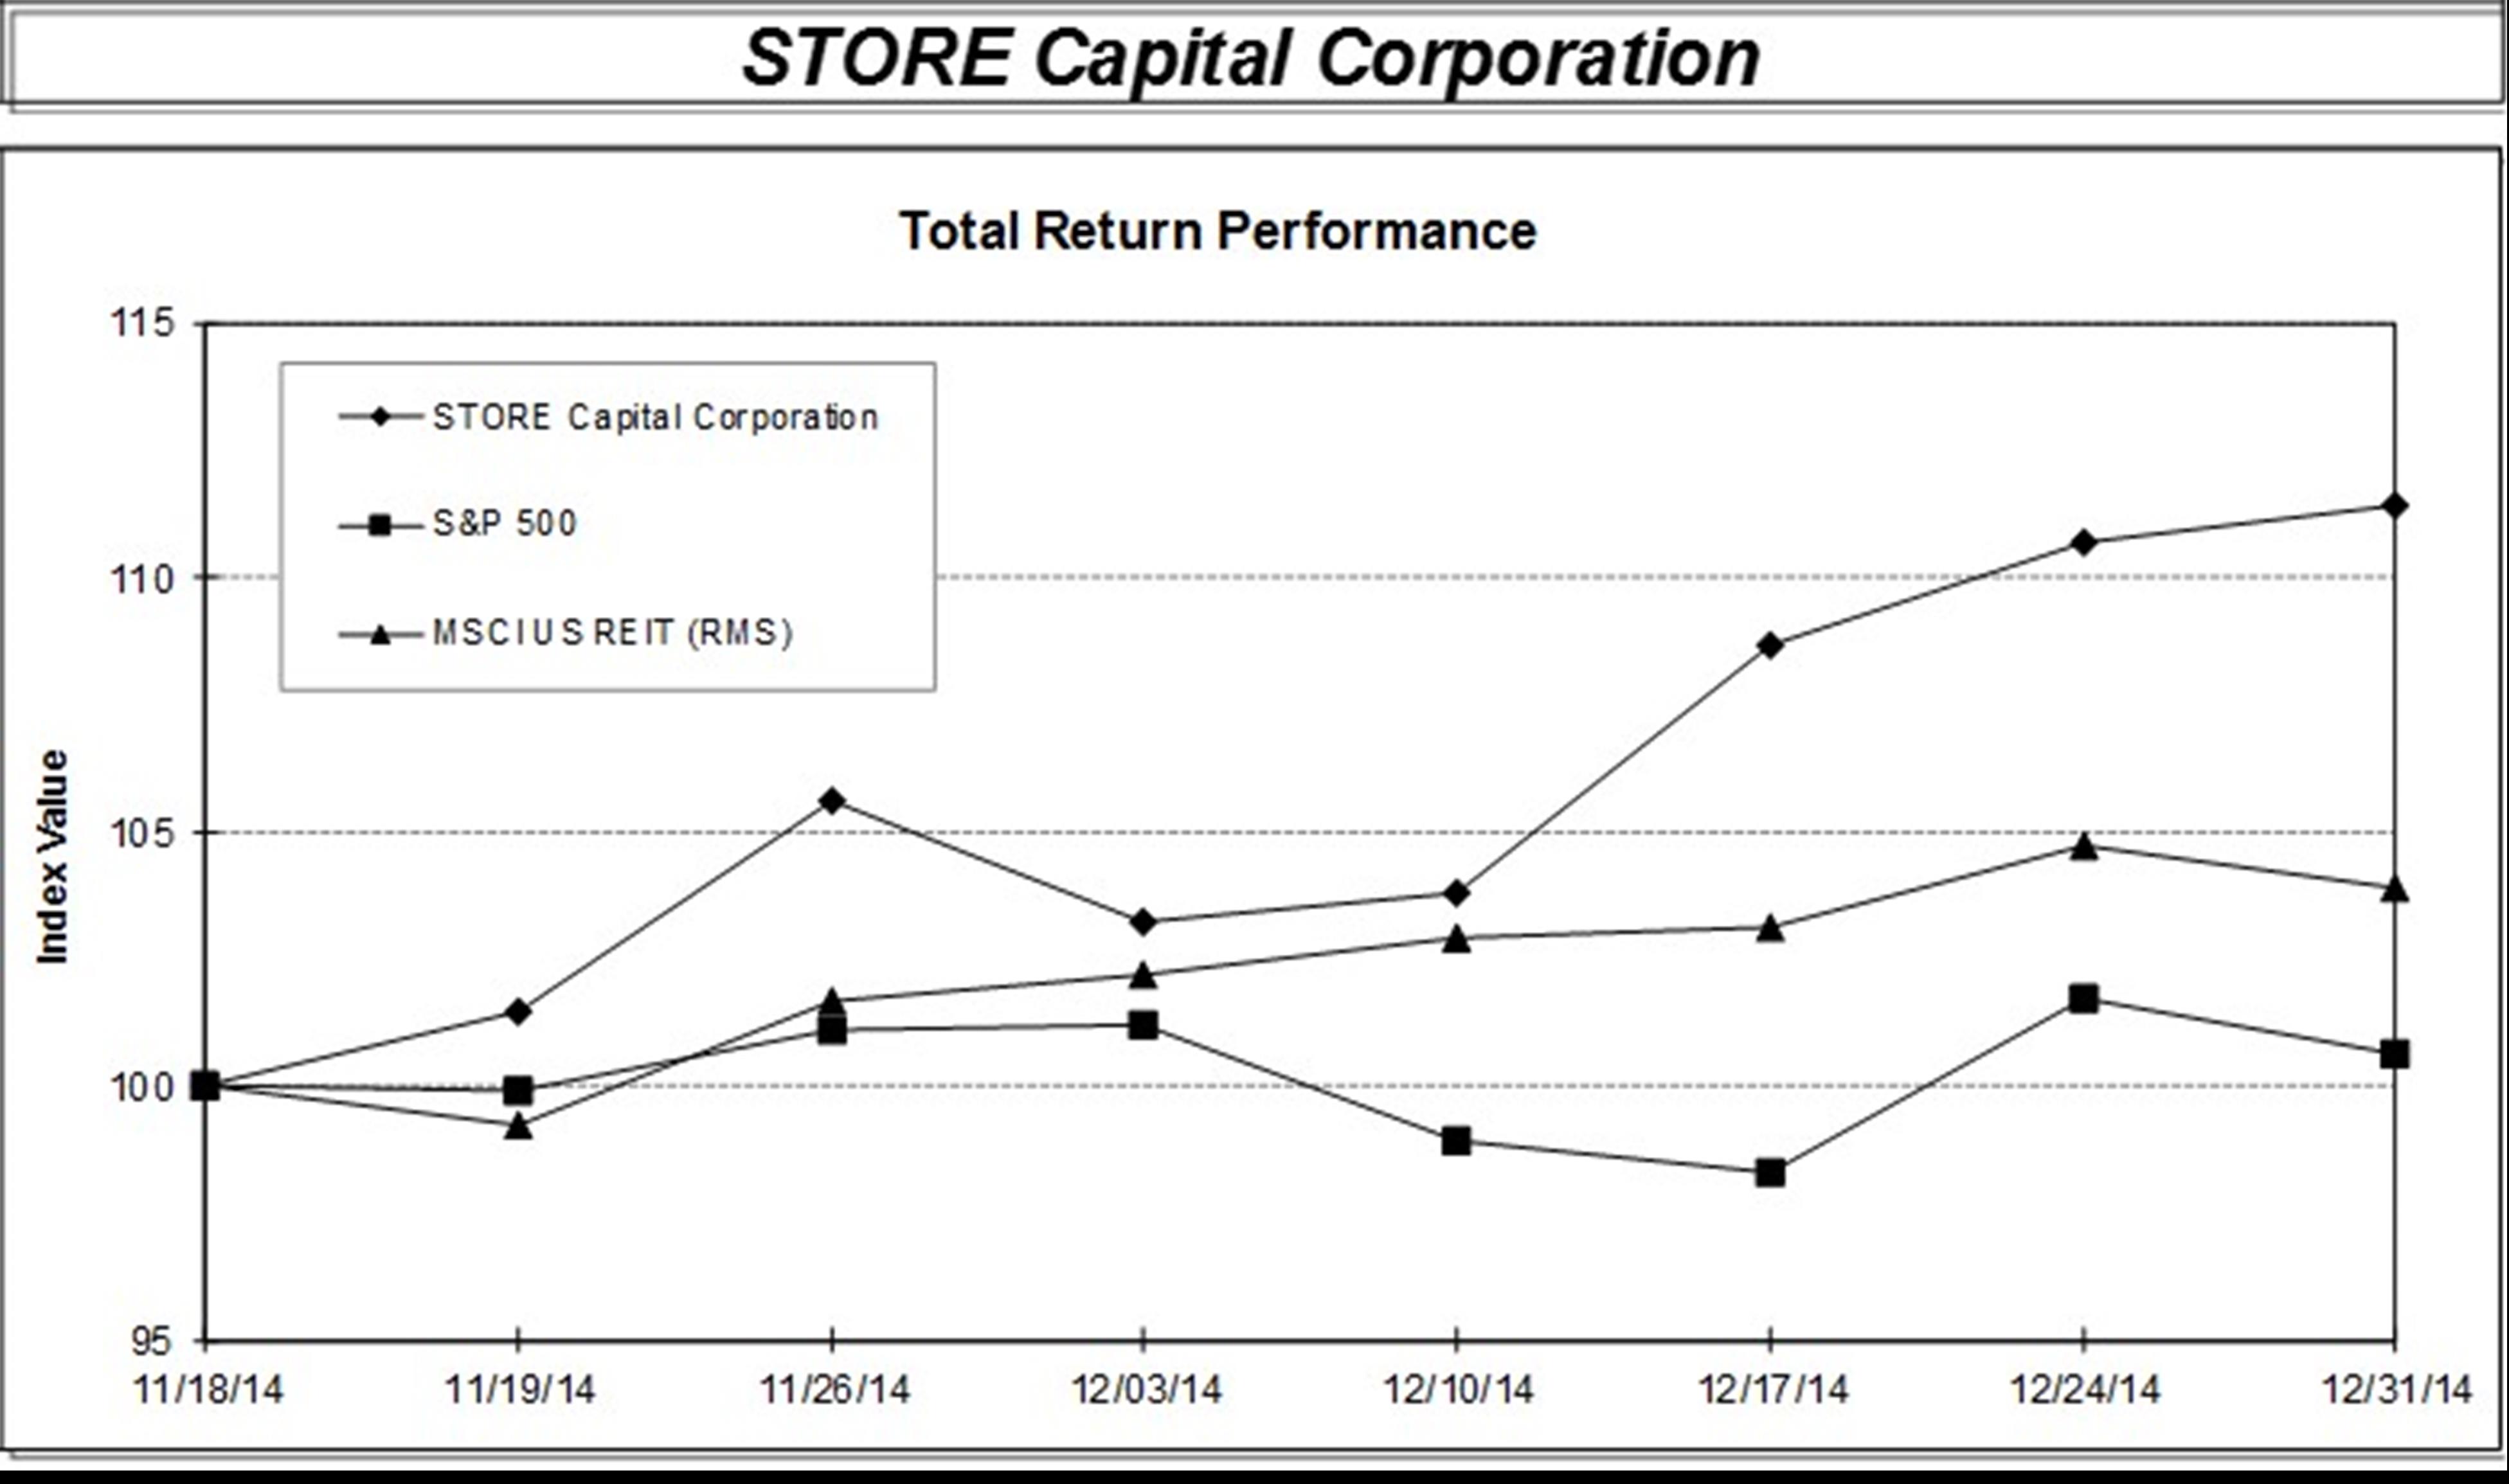
|
|
|
|
|
|
|
|
|
|
|
|
|
|
|
|
|
|
|
|
|
|
Period Ending |
|
||||||||||||||
|
Index |
|
11/18/2014 |
|
11/19/2014 |
|
11/26/2014 |
|
12/3/2014 |
|
12/10/2014 |
|
12/17/2014 |
|
12/24/2014 |
|
12/31/2014 |
|
|
STORE Capital Corporation |
|
100.00 |
|
101.44 |
|
105.59 |
|
103.23 |
|
103.79 |
|
108.67 |
|
110.67 |
|
111.40 |
|
|
S&P 500 |
|
100.00 |
|
99.88 |
|
101.08 |
|
101.19 |
|
98.89 |
|
98.28 |
|
101.69 |
|
100.60 |
|
|
MSCI US REIT (RMS) |
|
100.00 |
|
99.20 |
|
101.64 |
|
102.16 |
|
102.90 |
|
103.09 |
|
104.72 |
|
103.86 |
|
The performance graph and the related chart and text are being furnished solely to accompany this Annual Report on Form 10-K pursuant to Item 201(c) of Regulation S-K, and are not being filed for purposes of Section 18 of the Securities Exchange Act of 1934, as amended, and are not to be incorporated by reference into any filing of ours, whether made before or after the date hereof, regardless of any general incorporation language in such filing.
Use of Proceeds from the Sale of Registered Securities
Our registration statement on Form S-11, as amended (Registration No. 333-198486), with respect to our IPO was declared effective on November 17, 2014. On November 21, 2014, the Company completed the IPO through the registration and sale of 31,625,000 shares of common stock, including 4,125,000 shares of common stock sold in connection with the full exercise of the underwriters’ over-allotment option to purchase additional shares, raising gross proceeds of approximately $585 million.
As of the date of this Annual Report, our IPO has terminated and all of the securities registered for sale by us pursuant to our registration statement on Form S-11 have been sold. The joint book-running managers of the IPO were Goldman, Sachs & Co., Credit Suisse Securities (USA) LLC and Morgan Stanley & Co. LLC. The joint lead managers of the IPO were Citigroup Global Markets Inc., Deutsche Bank Securities Inc., KeyBanc Capital Markets Inc. and Wells Fargo Securities, LLC. BMO Capital Markets Corp., Raymond James & Associates, Inc., Robert W. Baird & Co. Incorporated, Stifel, Nicolaus & Company, Incorporated, SunTrust Robinson Humphrey, Inc. and Comerica Securities, Inc. acted as co-managers for the IPO.
The expenses of the IPO included approximately $35 million for underwriting discounts and commissions and approximately $4 million of other expenses, for total offering expenses of approximately $39 million. All of the foregoing underwriting discounts and expenses were direct or indirect payments to persons other than: (i) our directors, officers or any of their associates; (ii) persons owning ten percent (10%) or more of our shares of common stock; or (iii) our affiliates.
33
The net proceeds to us from the IPO totaled approximately $546 million, after deducting the underwriting discounts and commissions and other offering expenses. Since the completion of the IPO, we used approximately $223 million of the net offering proceeds to repay the outstanding balance under our credit facility, $125,000 to redeem all outstanding shares of our Series A Preferred Stock and approximately $243 million to make property acquisitions from the closing date of the IPO through December 31, 2014. In 2015, we deployed the remainder of the proceeds for property acquisitions.
Item 6. SELECTED FINANCIAL DATA
The following tables set forth selected consolidated financial and other information of the Company as of and for each of the years ended December 31, 2014, 2013 and 2012 and for the period from inception (May 17, 2011) through December 31, 2011. The table should be read in conjunction with the Company’s consolidated financial statements and the notes thereto and Item 7 “Management’s Discussion and Analysis of Financial Condition and Results of Operations” included in this Annual Report on Form 10-K.
|
|
|
|
|
|
|
|
|
|
|
|
|
|
|
|
|
|
|
|
|
|
|
|
|
|
|
From |
|
|
|
|
|
|
|
|
|
|
|
|
|
|
Inception |
|
|
|
|
|
|
|
|
|
|
|
|
|
|
(May 17, |
|
|
|
|
|
|
|
|
|
|
|
|
|
|
2011) |
|
|
|
|
|
|
|
|
|
|
|
|
|
|
Through |
|
|
|
|
|
Year Ended December 31, |
|
December 31, |
|
||||||||
|
(Dollars in thousands, except per share data) |
|
2014 |
|
2013 |
|
2012 |
|
2011 |
|
||||
|
Statement of Operations Data: |
|
|
|
|
|
|
|
|
|
|
|
|
|
|
Total revenues |
|
$ |
190,441 |
|
$ |
108,904 |
|
$ |
40,610 |
|
$ |
3,860 |
|
|
Expenses: |
|
|
|
|
|
|
|
|
|
|
|
|
|
|
Interest |
|
|
67,959 |
|
|
39,180 |
|
|
11,472 |
|
|
1,120 |
|
|
Transaction costs |
|
|
2,804 |
|
|
2,643 |
|
|
387 |
|
|
446 |
|
|
Property costs |
|
|
473 |
|
|
127 |
|
|
7 |
|
|
— |
|
|
General and administrative |
|
|
19,494 |
|
|
14,132 |
|
|
10,362 |
|
|
4,024 |
|
|
Depreciation and amortization |
|
|
57,025 |
|
|
30,349 |
|
|
11,015 |
|
|
964 |
|
|
Total expenses |
|
|
147,755 |
|
|
86,431 |
|
|
33,243 |
|
|
6,554 |
|
|
Income (loss) from continuing operations before income taxes |
|
|
42,686 |
|
|
22,473 |
|
|
7,367 |
|
|
(2,694) |
|
|
Income tax expense |
|
|
180 |
|
|
155 |
|
|
70 |
|
|
5 |
|
|
Income (loss) from continuing operations |
|
|
42,506 |
|
|
22,318 |
|
|
7,297 |
|
|
(2,699) |
|
|
Income from discontinued operations, net of taxes |
|
|
1,140 |
|
|
3,995 |
|
|
879 |
|
|
677 |
|
|
Income (loss) before gain on dispositions of real estate investments |
|
|
43,646 |
|
|
26,313 |
|
|
8,176 |
|
|
(2,022) |
|
|
Gain on dispositions of real estate investments |
|
|
4,493 |
|
|
— |
|
|
— |
|
|
— |
|
|
Net income (loss) |
|
$ |
48,139 |
|
$ |
26,313 |
|
$ |
8,176 |
|
$ |
(2,022) |
|
|
Per Common Share Data: |
|
|
|
|
|
|
|
|
|
|
|
|
|
|
Income (loss) from continuing operations—basic and diluted |
|
$ |
0.59 |
|
$ |
0.44 |
|
$ |
0.26 |
|
$ |
(0.14) |
|
|
Net income (loss)—basic and diluted |
|
|
0.61 |
|
|
0.52 |
|
|
0.30 |
|
|
(0.11) |
|
|
Cash dividends declared |
|
|
0.9898 |
|
|
0.8743 |
|
|
0.3509 |
|
|
— |
|
|
Balance Sheet Data (at period end): |
|
|
|
|
|
|
|
|
|
|
|
|
|
|
Total real estate investments, at cost (1) |
|
$ |
2,694,557 |
|
$ |
1,643,635 |
|
$ |
870,254 |
|
$ |
230,822 |
|
|
Carrying amount of loans and direct financing receivables |
|
|
111,354 |
|
|
66,917 |
|
|
41,450 |
|
|
4,956 |
|
|
Total investment portfolio, gross (1) |
|
|
2,805,911 |
|
|
1,710,552 |
|
|
911,704 |
|
|
235,778 |
|
|
Less accumulated depreciation and amortization (1) |
|
|
(98,671) |
|
|
(42,342) |
|
|
(12,005) |
|
|
(999) |
|
|
Net investments |
|
|
2,707,240 |
|
|
1,668,210 |
|
|
899,699 |
|
|
234,799 |
|
|
Cash and cash equivalents |
|
|
136,313 |
|
|
61,814 |
|
|
64,752 |
|
|
31,203 |
|
|
Total assets |
|
|
2,913,612 |
|
|
1,786,100 |
|
|
979,833 |
|
|
270,468 |
|
|
Credit facilities |
|
|
— |
|
|
— |
|
|
160,662 |
|
|
29,971 |
|
|
Non‑recourse debt obligations of consolidated special purpose entities, net of premiums (discounts) |
|
|
1,284,151 |
|
|
991,577 |
|
|
306,581 |
|
|
13,500 |
|
|
Total liabilities |
|
|
1,330,928 |
|
|
1,012,186 |
|
|
482,919 |
|
|
49,506 |
|
|
Total stockholders’ equity |
|
|
1,582,684 |
|
|
773,914 |
|
|
496,914 |
|
|
220,962 |
|
|
Other Data: |
|
|
|
|
|
|
|
|
|
|
|
|
|
|
Funds from Operations (2) |
|
$ |
99,383 |
|
$ |
54,843 |
|
$ |
19,014 |
|
$ |
(982) |
|
|
Adjusted Funds from Operations (2) |
|
$ |
109,876 |
|
$ |
61,739 |
|
$ |
21,701 |
|
$ |
(17) |
|
|
Number of investment property locations (at period end) |
|
|
947 |
|
|
622 |
|
|
371 |
|
|
112 |
|
|
% of owned properties subject to a lease contract (at period end) |
|
|
100 |
% |
|
100 |
% |
|
100 |
% |
|
100 |
% |
|
(1) |
Includes the dollar amount of investments ($9.4 million) and the accumulated depreciation and amortization ($0.4 million) related to real estate investments held for sale at December 31, 2013. |
|
(2) |
For definitions and reconciliations of Funds from Operations and Adjusted Funds from Operations, see “Management Discussion and Analysis of Financial Condition and Results of Operations—Non‑GAAP Measures.” |
34
Item 7. MANAGEMENT’S DISCUSSION AND ANALYSIS OF FINANCIAL CONDITION AND RESULTS OF OPERATIONS
The following discussion of our financial condition and results of operations should be read together with the “Selected Consolidated Financial Data” and “Business” sections, as well as the consolidated financial statements and related notes in Part II, Item 8 in this Annual Report on Form 10-K. Some of the information contained in this discussion and analysis or set forth elsewhere in this report, including information with respect to our plans and strategy for our business, includes forward‑looking statements that involve risks and uncertainties. You should read “Item 1A. Risk Factors” and the “Forward‑Looking Statements” sections of this Annual Report for a discussion of important factors that could cause actual results to differ materially from the results described in or implied by these forward‑looking statements.
Overview
We were formed in 2011 to invest in and manage Single Tenant Operational Real Estate, or STORE Properties, which is our target market and the inspiration for our name. A STORE Property is a property location at which a company operates its business and generates sales and profits, which makes the location a profit center and, therefore, fundamentally important to that business. Examples of operational real estate include restaurants, early childhood education centers, health clubs, movie theaters, sporting goods stores, furniture stores and colleges and professional schools. By acquiring the real estate from the operators and then leasing the real estate back to them, they become our long‑term tenants, and we refer to them as our customers. We provide a source of long‑term capital to our customers by enabling them to avoid the need to incur debt and employ equity in order to finance the real estate that is essential to their business.
We are a Maryland corporation organized as an internally managed real estate investment trust, or REIT. As a REIT, we will generally not be subject to federal income tax to the extent that we distribute all of our taxable income to our stockholders and meet other requirements.
The growth of our Company from inception in May 2011 until November 2014 was funded by STORE Holding Company, LLC, or STORE Holding, a Delaware limited liability company, substantially all of which is owned, directly or indirectly, by certain investment funds managed by Oaktree Capital Management, L.P. In November 2014, we took the Company public on the New York Stock Exchange and now our common stock trades under the ticker symbol “STOR”. STORE Holding is still our primary stockholder, owning approximately 72% of our outstanding common stock as of December 31, 2014. In November 2014, prior to our initial public offering, or IPO, our board of directors declared a stock split effected through the distribution of 1.67 shares for each share of common stock then outstanding; accordingly, all share and per share information included in this report has been retroactively restated to take into account the effect of the stock split.
Since our inception in 2011, we have selectively originated a real estate investment portfolio totaling $2.8 billion, consisting of investments in 947 property locations across 46 states. All of the real estate we acquire is held by our wholly-owned subsidiaries, many of which are special purpose bankruptcy remote entities formed to facilitate the financing of our real estate. We predominantly acquire our single‑tenant properties directly from our customers in sale‑leaseback transactions where our customers sell us their operating properties and then simultaneously enter into a long‑term triple‑net lease with us to lease the property back. Accordingly, our properties are fully occupied and under lease from the moment we acquire them. Since inception, our portfolio has remained at 100% occupancy, as all of our properties are subject to leases. We generate our cash from operations primarily through the monthly lease payments, or “base rent”, we receive from our customers under their long‑term leases with us. We also receive interest payments on loans receivable, which are a small part of our portfolio. We refer to the monthly scheduled lease and interest payments due from our customers as “base rent and interest”. Most of our leases contain lease escalations every year or every several years that are based on the lesser of the increase in the Consumer Price Index, or CPI, or a stated percentage (if expressed on an annual basis, currently averaging approximately 1.7%), which allows the monthly lease payments we receive to rise somewhat in an inflationary economic environment. As of December 31, 2014, approximately 97% of our leases (based on annualized base rent) are referred to as “triple net”, which means that our customer is responsible for all of the maintenance, insurance and property taxes associated with the properties they lease from us, including any increases in those costs that may occur as a result of inflation. The remaining leases have some landlord responsibilities,
35
generally related to maintenance and structural component replacement that may be required on such properties in the future. Also, we will occasionally incur nominal property‑level expenses that are not paid by our customers, such as the costs of periodically making site inspections of our properties. We do not currently anticipate incurring significant capital expenditures or property costs. Since our properties are single‑tenant properties, all of which are under long‑term leases, it is not necessary for us to perform any significant ongoing leasing activities on our properties. As of December 31, 2014, the weighted average remaining term of our leases (calculated based on annualized base rent) was approximately 15 years, excluding renewal options, which are exercisable at the option of our tenants upon expiration of their base lease term. Leases approximating 98% of our base rent as of that date provide for tenant renewal options (generally two to four five‑year options) and leases approximating 4% of our base rent provide our tenant the option, at their election, to purchase the property from us at a specified time or times (generally at the greater of the then‑fair market value or our cost).
Liquidity and Capital Resources
At the beginning of 2014, our real estate investment portfolio totaled $1.7 billion, consisting of investments in 622 property locations with base rent and interest due from our customers aggregating approximately $12 million per month, excluding future rent payment escalations. By December 31, 2014, our investment portfolio had grown to $2.8 billion, consisting of investments in 947 property locations with base rent and interest aggregating approximately $19.8 million per month. Substantially all of our cash from operations is generated by our real estate portfolio.
Our primary cash expenditures are the monthly principal and interest payments we make on the debt we use to finance our real estate investment portfolio and the general and administrative expenses of servicing the portfolio and operating our business. Since substantially all of our leases are triple net, our tenants are generally responsible for the maintenance, insurance and property taxes associated with the properties they lease from us. When a property becomes vacant through a tenant default or expiration of the lease term with no tenant renewal, we would incur these property costs during the time it would take to locate a substitute tenant. As of December 31, 2014, our portfolio was 100% occupied and leases on only five properties are scheduled to expire during 2015, representing less than one-half of one percent of our annualized base rent and interest. Accordingly, we do not currently anticipate making significant capital expenditures or incurring other significant property costs.
We intend to continue to grow through additional real estate investments. To accomplish this objective, we must continue to identify real estate acquisitions which are consistent with our underwriting guidelines and raise future additional capital. We acquire real estate with a combination of debt and equity capital and with cash from operations that is not otherwise distributed to our stockholders. Prior to our IPO, our equity capital was provided to us as needed for our real estate acquisition activity by investors in STORE Holding, which is our holding company parent. In our IPO, which closed on November 21, 2014, we raised $585 million in gross offering proceeds through the sale of 31,625,000 shares of our common stock, including the underwriters’ overallotment. The proceeds of the offering were used to pay offering expenses totaling $39 million, including the underwriters’ discount, leaving net proceeds of $546 million. The net proceeds were used to pay off amounts outstanding on our unsecured credit facility totaling $223 million, redeem all of our outstanding preferred stock ($125,000) and, through December 31, 2014, approximately $243 million was deployed to continue to selectively acquire real estate properties.
Our debt capital is provided on a temporary basis through our variable‑rate unsecured revolving credit facility with a group of banks, until our short-term, variable-rate borrowings are sufficiently large to enable the economic issuance of term notes from our Master Funding program. We also, from time to time, obtain non‑recourse mortgage financing from banks and insurance companies secured by specific property we pledge as collateral. By matching the expected cash inflows from our long‑term real estate leases with the expected cash outflows of our long‑term fixed‑rate debt, we “lock in”, for as long as is economically feasible, the expected positive difference between our scheduled cash inflows on the leases and the cash outflows on our debt payments. By “locking in” this difference, or “spread”, we seek to reduce the risk that increases in interest rates would adversely impact our profitability. In addition, we may use various financial instruments designed to mitigate the impact of interest rate fluctuations on our cash flows and earnings, including hedging strategies such as interest rate caps, depending on our analysis of the interest rate environment and the costs and risks of such strategies. We target a level of debt within a range of six to seven times our earnings before interest, taxes, depreciation and amortization.
36
The availability of debt to finance commercial real estate in the United States can, at times, be impacted by economic and other factors that are beyond our control. An example of this is the period during the recession of 2007 to 2009 when availability of debt capital for commercial real estate was significantly curtailed. We seek to reduce the risk that long‑term debt capital may be unavailable to us by limiting the period between the time we acquire our real estate and the time we finance our real estate with long‑term debt. In addition, we have arranged our short‑term debt facility (described below) to have a multi‑year term in order to reduce the risk that short‑term real estate financing would not be available to us. As we grow our real estate portfolio, we also intend to manage our debt maturities to reduce the risk that a significant amount of our debt will mature in any single year in the future. As of December 31, 2014, we had no significant near-term debt maturities, with balloon payments due during 2015 representing just $19 million, or 1.5%, of our total long-term debt, and our weighted average debt maturity is approximately seven years. As our outstanding debt matures, we may refinance this maturing debt as it comes due or choose to repay it using cash and cash equivalents or our revolving credit facility. Because our long-term debt generally requires monthly payments of principal, in addition to the monthly interest payments, the resulting principal amortization reduces our refinancing risk upon maturity of the debt. The long-term debt we have issued as of December 31, 2014 is comprised, almost exclusively, of secured nonrecourse borrowings with a weighted average loan-to-value ratio of 69% and approximately 66% of our portfolio serves as collateral for this long-term debt. The remaining portfolio properties, aggregating $952 million, are unencumbered and this unencumbered pool of properties provides us flexibility for future borrowings or as substitute collateral for existing indebtedness.
We raise debt capital through several different markets, including the asset‑backed and commercial mortgage‑backed securities markets, as well as the market for term debt financing. Each of these is described in more detail below. We believe that having access to multiple debt markets increases our financing flexibility because different debt markets may attract different debt investors, thus increasing our access to a potentially larger pool of debt investors. Also, a particular debt market may be more competitive than another at any particular point in time. In addition to these sources of debt capital, our senior leadership team has prior experience with senior secured lines of credit and senior unsecured term debt, which may be deployed as we continue to grow the business and implement our asset‑liability management strategies.
Typically, we use our short‑term unsecured credit facility to acquire our real estate properties, until those borrowings are sufficiently large to warrant the economic issuance of term notes under our Master Funding conduit, the proceeds from which we use to repay the amounts outstanding under our credit facility. In September 2014, we entered into a new $300 million unsecured revolving credit facility with a group of lenders, which replaced our two previous secured credit facilities that aggregated $300 million. This new facility, which includes an accordion feature that allows the size of the facility to be increased up to $500 million, is for an initial term of three years and includes a one‑year extension option subject to certain conditions and the payment of a 20 basis point extension fee. The facility bears interest at a rate selected by us equal to either one‑month LIBOR plus a leverage‑based credit spread ranging from 1.75% to 2.50%, or a Base Rate, as defined in the debt agreement, plus a leverage‑based credit spread ranging from 0.75% to 1.50%, and also includes a fee of 0.25% assessed on the average unused portion of the facility. Availability under the facility is limited to 50% of the value of our eligible unencumbered assets at any point in time. At December 31, 2014, we had no borrowings outstanding on this new credit facility and we had a pool of unencumbered assets aggregating $952 million, substantially all of which were eligible under the credit facility. Covenants under this new facility include: maximum leverage of 65%, minimum fixed charge coverage of 1.5x, minimum net worth of $600 million plus 75% of new net equity proceeds, and a maximum dividend payout ratio limited to 95% of Funds from Operations, all as defined in the agreement. The facility is recourse to us and includes a guaranty from STORE Capital Acquisitions, LLC, one of our direct wholly‑owned subsidiaries. We remain in compliance with these covenants. Prior to entering into the new $300 million unsecured credit facility, we had two bank credit facilities that were secured by real estate properties we pledged as collateral, as well as our equity interests in certain of our consolidated special purpose subsidiaries and our holdings of the Class B notes issued under our STORE Master Funding debt program described below.
As of December 31, 2014, essentially all of our long‑term debt was fixed‑rate debt, or was effectively converted to a fixed‑rate for the term of the debt. Our primary long‑term debt funding option is STORE Master Funding, which we began to use in 2012. As summarized below, a large portion of our real estate investment portfolio serves as collateral for outstanding borrowings under this debt program. Through this debt program, we arrange for bankruptcy remote, special purpose entity subsidiaries to issue multiple series of investment‑grade asset‑backed net‑lease mortgage notes, or
37
ABS notes, from time to time as additional collateral is added to the collateral pool. The ABS notes are generally issued to institutional investors through the asset‑backed securities market. These ABS notes are issued in two classes, Class A and Class B. The Class A notes, which represent approximately 70% of the appraised value of the underlying real estate collateral, are currently rated A+ by Standard & Poor’s Ratings Services. The Class A notes generally require monthly payments of principal and interest with balloon payments due at their respective maturity dates, either seven or 10 years from the date of issuance. We have historically retained the Class B notes, which are subordinated to the Class A notes as to principal repayment. The Class B notes, currently rated BBB by Standard & Poor’s Rating Services, aggregate $78.0 million in principal amount outstanding at December 31, 2014 and are held by one of our bankruptcy remote, special purpose entity subsidiaries. The Class B notes are not reflected in our financial statements because they eliminate in consolidation. Since these Class B notes are issued and outstanding, they provide us with additional financial flexibility in that we may sell them to a third party in the future or use them as collateral for short‑term borrowings as we have done from time to time in the past.
Members of our senior leadership team pioneered the concept of serial issuances of rated debt backed by a growing collateral pool of net‑leased commercial real estate in 2005. When we wish to issue additional long‑term debt under the STORE Master Funding debt program, our special purpose entity subsidiaries acquire real estate assets to increase the size of the existing collateral pool sufficiently to support the additional debt. Upon issuance of a new series of debt under this program, the entire collateral pool (including the newly added real estate) will be pledged to secure all of the notes, both the existing and the new series, on a pro rata basis. This has the effect of increasing the diversity of the collateral pool for all of the note holders, including those that invested in prior series. For example, the first Master Funding note series issued in 2012 totaled $214.5 million in Class A principal amount, which was supported by a collateral pool valued at $305.9 million representing 132 property locations operated by 30 customers; those same note holders now hold notes secured by a significantly more diverse pool than when they purchased their investment, with the Master Funding notes outstanding at December 31, 2014 totaling $1.1 billion in Class A principal amount supported by a collateral pool valued at $1.6 billion (on a gross book value of $1.5 billion) representing 608 property locations operated by 147 customers. The amount of debt that can be issued in any new series is determined by the structure of the transaction and the amount of collateral that has been added to the pool. In addition, the issuance of each new series of notes is subject to the satisfaction of several conditions, including that there is no event of default on the existing note series and that the issuance will not result in an event of default on, or the credit rating downgrade of, the existing note series.
Absent a plan to issue additional long‑term debt through the Master Funding program, we are not required to add assets to, or substitute collateral in, the existing collateral pool. We can voluntarily elect to substitute assets in the collateral pool, subject to meeting prescribed conditions that are designed to protect the collateral pool by requiring the substitute assets to be of equal or greater measure in attributes such as: the asset’s fair value, monthly rent payments, remaining lease term and weighted average FCCR. In addition, we can sell underperforming assets and reinvest the proceeds in better performing properties. Any substitutions and sales are subject to an overall limitation of 35% of the collateral pool unless the substitution or sale is credit‑ or risk‑based, in which case there are no limitations. Since our Master Funding program began in 2012, we sold eight properties in the collateral pool, representing less than 1.2% of the collateral pool value, and have since reinvested the proceeds in newly-acquired properties.
The A+ rating currently assigned to the Class A notes issued under our Master Funding program reflects the rating agency’s opinion of the level of credit enhancement available for the benefit of the note holders. As structured, the Master Funding notes have several layers of credit enhancement—subordination (because the Class B notes are subordinate in payment of principal to the right of the more senior Class A notes); overcollateralization (since our Class A notes have an advance rate of 70%, the other 30% is the “overcollateralization” provided by the equity and the BBB‑rated Class B notes held by STORE Capital); and the last layer of credit enhancement is the excess monthly cash flow generated by the collateral pool after debt service obligations and servicing and trustee expenses have been paid. A significant portion of our cash flows are generated by the special purpose entities comprising our Master Funding program. For the year ended December 31, 2014, excess cash flow, after payment of debt service and servicing and trustee expenses, totaled $51 million on cash collections of $120 million, which represents an overall ratio of cash collections to debt service of approximately 1.7 to 1 on the Master Funding program. If at any time the debt service coverage ratio (as defined in the program documents) generated by the collateral pool is less than 1.3 to 1, excess cash flow from the Master Funding entities will be deposited into a reserve account to be used for payments to be made on the
38
net‑lease mortgage notes, to the extent there is a shortfall. We anticipate that the debt service coverage ratio for the Master Funding program will remain well above program minimums.
We believe our STORE Master Funding program provides us with several advantages, including the ability to:
|
· |
create a growing diversified pool of properties and realize resultant competitive debt costs; |
|
· |
actively manage the pool of assets for the benefit of note holders as well as our stockholders, customers and other stakeholders; |
|
· |
issue non‑recourse (subject to certain customary limited exceptions) debt having limited corporate covenants, including but not limited to the fact that a change in control of STORE Capital would not cause the debt to become due, which increases our corporate flexibility; and |
|
· |
issue frequent serial notes from a growing collateral pool to prudently extend, or ladder, sequential debt maturities. |
To complement STORE Master Funding, we also obtain debt in discrete transactions through other bankruptcy remote, special purpose entity subsidiaries, which debt is solely secured by specific real estate assets and is generally non‑recourse to us (subject to certain customary limited exceptions). These discrete borrowings are generally in the form of traditional mortgage notes payable, with principal and interest payments due monthly and balloon payments due at their respective maturity dates, which typically range from seven to 10 years from the date of issuance. We generally obtain discrete secured borrowings from institutional commercial mortgage lenders, who subsequently securitize (that is, sell) the loans within the commercial mortgage‑backed securities, or CMBS, market. We have also occasionally used similar types of financing from insurance companies and commercial banks. Our secured borrowings contain various covenants customarily found in mortgage notes, including a limitation on the issuing entity’s ability to incur additional indebtedness on the underlying real estate. Certain of the notes also require the posting of cash reserves with the lender or trustee if specified coverage ratios are not maintained by the special purpose entity or the tenant. As of December 31, 2014, the long‑term, non‑recourse debt of our consolidated special purpose entities had an aggregate outstanding principal balance of approximately $1.3 billion, a weighted average maturity of 6.9 years and a weighted average interest rate of 4.89%; these amounts include the impact of the 2014 issuance of $260 million in STORE Master Funding seven-year and ten-year notes at a weighted average interest rate of 4.64%.
As previously noted, a large portion of our real estate investment portfolio serves as collateral for our consolidated outstanding debt. The following is a summary of the outstanding balance of our borrowings as well as a summary of the portion of our real estate investment portfolio that is either pledged as collateral for these borrowings or is unencumbered as of December 31, 2014:
|
|
|
|
|
|
|
|
|
|
|
|
|
|
|
|
|
|
|
|
|
Gross Investment Amount |
|
|||||||
|
|
|
|
|
|
Special |
|
|
|
|
|
|
|
|
|
|
|
|
|
|
Purpose |
|
|
|
|
|
|
|
|
|
|
|
Outstanding |
|
Entity |
|
All Other |
|
|
|
|
|||
|
(In millions) |
|
Borrowings |
|
Subsidiaries |
|
Subsidiaries |
|
Total |
|
||||
|
STORE Master Funding net‑lease mortgage notes payable |
|
$ |
1,085 |
|
$ |
1,527 |
|
$ |
- |
|
$ |
1,527 |
|
|
Other mortgage notes payable |
|
|
198 |
|
|
327 |
|
|
- |
|
|
327 |
|
|
Total long‑term debt |
|
|
1,283 |
|
|
1,854 |
|
|
|
|
|
1,854 |
|
|
Unencumbered real estate assets |
|
|
— |
|
|
684 |
|
|
268 |
|
|
952 |
|
|
|
|
$ |
1,283 |
|
$ |
2,538 |
|
$ |
268 |
|
$ |
2,806 |
|
Our decision to use STORE Master Funding or non‑recourse traditional mortgage loan borrowings depends on borrowing costs, debt terms, debt flexibility and the tenant and industry diversification levels of the collateral pool. As we continue to acquire real estate, we expect to balance the overall degree of leverage on our portfolio by growing a pool of portfolio assets that are unencumbered. A growing pool of unencumbered assets will increase our financial flexibility in the future by providing us with assets that could support unsecured short‑term financing or that could serve as substitute collateral. As of December 31, 2014, our unencumbered assets aggregated $952 million. Should market factors, which are beyond our control, adversely impact our access to these debt sources at economically feasible rates,
39
our ability to grow through additional real estate acquisitions will be limited to any undistributed amounts available from our operations and any additional equity capital raises.
As shown in the table below, net cash provided by operating activities rose each year primarily due to the increase in the size of our real estate investment portfolio. Our real estate investing activities have grown in volume as we continue to make headway into our target market by identifying and acquiring real estate, primarily through sale‑leaseback transactions. Our investing activities in the table below are shown net of cash proceeds from the sales of 16 properties in 2014 aggregating $39.4 million, 17 properties in 2013 aggregating $40.7 million and seven properties in 2012 aggregating $5.3 million. Real estate investment activity was funded with a combination of cash from operations, proceeds from the issuance of debt and proceeds from the issuance of common stock. We began making distributions in 2012 and paid dividends to our stockholders totaling $5.7 million in 2012, $51.6 million in 2013 and $64.6 million in 2014. The 2014 dividends exclude a pro-rated dividend per common share of $0.1139, or $1.00 per share on an annualized basis, for the period since the closing of the IPO through December 31, 2014. This dividend was paid in January 2015 and represents our intended annual cash dividend of $1.00 per share. Cash for the increase in dividends between years resulted primarily from the increase in cash provided by our operations. Cash and cash equivalents totaled $136.3 million, $61.8 million and $64.8 million at December 31, 2014, 2013 and 2012, respectively.
|
|
|
|
|
|
|
|
|
|
|
|
|
|
|
Year Ended December 31, |
|
|||||||
|
(In thousands) |
|
2014 |
|
2013 |
|
2012 |
|
|||
|
Net cash provided by operating activities |
|
$ |
108,106 |
|
$ |
54,934 |
|
$ |
22,415 |
|
|
Net cash used in investing activities |
|
|
(1,059,814) |
|
|
(786,515) |
|
|
(672,154) |
|
|
Net cash provided by financing activities |
|
|
1,026,207 |
|
|
728,643 |
|
|
683,288 |
|
|
Net increase (decrease) in cash and cash equivalents |
|
$ |
74,499 |
|
$ |
(2,938) |
|
$ |
33,549 |
|
Management believes that the cash generated by our operations, together with our cash and cash equivalents at December 31, 2014, our current borrowing capacity on our revolving credit facility and our access to long‑term debt capital, will be sufficient to fund our operations for the foreseeable future and allow us to acquire the real estate for which we currently have made commitments. In order to continue to grow our real estate portfolio in the future beyond the excess cash generated by our operations and our ability to borrow, we intend to raise additional equity capital through the sale of our common stock.
Off‑Balance Sheet Arrangements
We have no off‑balance sheet arrangements as of December 31, 2014.
Contractual Obligations
The following table provides information with respect to our contractual commitments as of December 31, 2014, including any guaranteed or minimum commitments under contractual obligations.
|
|
|
|
|
|
|
|
|
|
|
|
|
|
|
|
|
|
|
|
|
|
|
|
Payment Due by Period |
|
||||||||||
|
|
|
|
|
|
|
|
|
|
|
|
|
|
|
More than |
|
|
|
|
|
|
|
|
1 year |
|
1 ‑ 3 years |
|
3 ‑ 5 years |
|
5 years |
|
||||
|
(In thousands) |
|
Total |
|
(2015) |
|
(2016 ‑ 2017) |
|
(2018 ‑ 2019) |
|
(after 2019) |
|
|||||
|
Credit facility (1) |
|
$ |
— |
|
$ |
— |
|
$ |
— |
|
$ |
— |
|
$ |
— |
|
|
Non‑recourse long‑term debt obligations: |
|
|
|
|
|
|
|
|
|
|
|
|
|
|
|
|
|
Principal |
|
|
1,283,495 |
|
|
37,901 |
|
|
56,776 |
|
|
261,041 |
|
|
927,777 |
|
|
Interest |
|
|
397,242 |
|
|
61,777 |
|
|
118,612 |
|
|
108,451 |
|
|
108,402 |
|
|
Commitments to customers (2) |
|
|
33,940 |
|
|
31,989 |
|
|
1,951 |
|
|
— |
|
|
— |
|
|
Corporate office operating lease obligations |
|
|
1,061 |
|
|
290 |
|
|
613 |
|
|
158 |
|
|
— |
|
|
Total |
|
$ |
1,715,738 |
|
$ |
131,957 |
|
$ |
177,952 |
|
$ |
369,650 |
|
$ |
1,036,179 |
|
|
(1) |
We had no balances outstanding on our unsecured credit facility as of December 31, 2014. |
40
|
(2) |
Represents our commitments to fund improvements to real estate properties previously acquired; these construction improvement commitments are similar to property acquisitions as they will result in increases to rental revenue due under the related contracts. |
Recently Issued Accounting Pronouncements
See Note 2 to the December 31, 2014 consolidated financial statements.
Critical Accounting Policies and Estimates
Our discussion and analysis of our historical financial condition and results of operations is based upon our consolidated financial statements which are prepared in accordance with U.S. generally accepted accounting principles, or GAAP. The preparation of financial statements in conformity with GAAP requires management to make estimates and assumptions that affect the reported amounts of assets and liabilities, the disclosure of contingent assets and liabilities and the reported amounts of revenues and expenses during the reporting period. Although management believes its estimates are reasonable, actual results could differ materially from those estimates. The accounting policies discussed below are considered critical because changes to certain judgments and assumptions inherent in these policies could affect the financial statements. For more information on our accounting policies, please refer to the notes to our consolidated financial statements.
Accounting for Real Estate Investments
We record the acquisition of real estate properties at cost, including acquisition and closing costs. We allocate the cost of real estate properties to the tangible and intangible assets and liabilities acquired based on their estimated relative fair values. Real estate properties subject to an existing in‑place lease at the date of acquisition are recorded as business combinations, and each tangible and intangible asset and liability acquired is recorded at fair value. Management uses multiple sources to estimate fair value, including independent appraisals and information obtained about each property as a result of its pre‑acquisition due diligence and its marketing and leasing activities. We expense transaction costs associated with real estate acquisitions accounted for as business combinations in the period incurred. Properties classified as held for sale are recorded at the lower of the carrying value or the fair value, less anticipated closing costs.
Lease Intangibles
In‑place lease intangibles are valued based on management’s estimates of lost rent and carrying costs during the time it would take to locate a tenant if the property were vacant, considering current market conditions and costs to execute similar leases. In estimating lost rent and carrying costs, management considers market rents, real estate taxes, insurance, costs to execute similar leases including leasing commissions and other related costs. The value assigned to in‑place leases is amortized on a straight‑line basis as a component of depreciation and amortization expense typically over the remaining term of the related leases.
The fair value of any above‑market and below‑market leases is estimated based on the present value of the difference between the contractual amounts to be paid pursuant to the in‑place lease and management’s estimate of current market lease rates for the property, measured over a period equal to the remaining term of the lease. Capitalized above‑market lease intangibles are amortized over the remaining term of the respective leases as a decrease to rental revenue. Below‑market lease intangibles are amortized as an increase in rental revenue over the remaining term of the respective leases plus the fixed‑rate renewal periods on those leases, if any. Should a lease terminate early, the unamortized portion of any related lease intangible is immediately recognized in operations.
Loans and Direct Financing Receivables
We hold our loans receivable for long‑term investment. Loans receivable are carried at amortized cost, including related unamortized discounts or premiums, if any. Certain of our real estate investment transactions are accounted for as direct financing leases. We record the direct financing receivables at their net investment, determined as the aggregate minimum lease payments and the estimated residual value of the leased property less unearned income.
41
The unearned income is recognized over the life of the related contracts so as to produce a constant rate of return on the net investment in the asset.
Impairment
We review our real estate investments and related lease intangibles periodically for impairment whenever events or changes in circumstances indicate that the carrying amount of an asset may not be recoverable. Management considers factors such as expected future undiscounted cash flows, estimated residual value, market trends (such as the effects of leasing demand and competition) and other factors in making this assessment. An asset is considered impaired if the carrying value of the asset exceeds its estimated undiscounted cash flows, and the impairment is calculated as the amount by which the carrying value of the asset exceeds its estimated fair value. Estimating future cash flows is highly subjective and such estimates could differ materially from actual results.
We periodically evaluate the collectibility of our loans receivable, including accrued interest, by analyzing the underlying property‑level economics and trends, collateral value and quality and other relevant factors in determining the adequacy of our allowance for loan losses. A loan is determined to be impaired when, in management’s judgment based on current information and events, it is probable that we will be unable to collect all amounts due according to the contractual terms of the loan agreement. Specific allowances for loan losses are provided for impaired loans on an individual loan basis in the amount by which the carrying value exceeds the estimated fair value of the underlying collateral less disposition costs.
Revenue Recognition
We lease real estate to our tenants under long‑term net leases that are predominantly classified as operating leases. Direct costs associated with lease origination, offset by any lease origination fees received, are deferred and amortized over the related lease term as an adjustment to rental revenue. Substantially all of the leases are triple‑net, which provide that the lessees are responsible for the payment of all property operating expenses, including property taxes, maintenance and insurance.
Our leases generally provide for rent escalations throughout the lease terms. For leases that provide for specific contractual escalations, rental revenue is recognized on a straight‑line basis so as to produce a constant periodic rent over the term of the lease. Accordingly, accrued rental revenue, calculated as the aggregate difference between the rental revenue recognized on a straight‑line basis and scheduled rents, represents unbilled rent receivables that we will receive only if the tenants make all rent payments required through the expiration of the lease. We provide an estimated reserve for uncollectible straight‑line rental revenue based on management’s assessment of the risks inherent in those lease contracts, giving consideration to industry default rates for long‑term receivables. Leases that have contingent rent escalators indexed to future increases in the CPI may adjust over a one‑year period or over multiple‑year periods. Generally, these escalators increase rent at the lesser of (a) 1 to 1.25 times the increase in the CPI over a specified period or (b) a fixed percentage. Because of the volatility and uncertainty with respect to future changes in the CPI, our inability to determine the extent to which any specific future change in the CPI is probable at each rent adjustment date during the entire term of these leases and our view that the multiplier does not represent a significant leverage factor, increases in rental revenue from leases with this type of escalator are recognized only after the changes in the rental rates have actually occurred. For leases that have contingent rentals that are based on a percentage of the tenant’s gross sales, we recognize contingent rental revenue when the threshold upon which the contingent lease payment is based is actually reached.
We suspend revenue recognition if the collectibility of amounts due pursuant to a lease is not reasonably assured or if the tenant’s monthly lease payments become more than 60 days past due, whichever is earlier. In the event that the collectibility of a receivable with respect to any tenant is in doubt, a provision for uncollectible amounts will be established or a direct write‑off of the specific rent receivable will be made.
We recognize interest income on loans receivable using the effective interest method applied on a loan‑by‑loan basis. Direct costs associated with originating loans are offset against any related fees received and the balance, along with any premium or discount, is deferred and amortized as an adjustment to interest income over the term of the related loan receivable using the effective interest method. A loan receivable is placed on nonaccrual status when the loan has
42
become 60 days past due, or earlier if management determines that full recovery of the contractually specified payments of principal and interest is doubtful. While on nonaccrual status, interest income is recognized only when received.
Share‑Based Compensation
Certain of our directors, officers and key employees have been granted long‑term incentive awards, including restricted shares of our common stock and profits interests units issued by STORE Holding, which provide them with equity interests as an incentive to remain in our service and align executives’ interests with those of our equity holders. We estimate the fair value of restricted stock at the date of grant and recognize that amount in general and administrative expense ratably over the vesting period at the greater of the amount amortized on a straight‑line basis or the amount vested. The fair value of the restricted stock is based on the per‑share price of the common stock on the date of the grant. Prior to our IPO, the fair value was based on the per-share price of the common stock issued in our private equity offerings.
Depreciation
Our real estate portfolio is depreciated using the straight‑line method over the estimated remaining useful life of the properties, which generally ranges from 30 to 40 years for buildings and is 15 years for land improvements. Any properties classified as held for sale are not depreciated.
Income Taxes
We have made an election to qualify, and believe we are operating in a manner to continue to qualify, as a REIT for federal income tax purposes beginning with our initial taxable year ended December 31, 2011. As a REIT, we will generally not be subject to federal income taxes to the extent that we distribute all of our taxable income to our stockholders and meet other specific requirements; however, we are still subject to certain state and local income taxes and to federal income and excise tax on our undistributed income.
Derivative Instruments and Hedging Activities
We may enter into derivatives contracts as part of our overall financing strategy to manage our exposure to changes in interest rates associated with current and/or future debt issuances. We do not use derivatives for trading or speculative purposes. We record our derivatives on the balance sheet at fair value as either an asset or liability. The accounting for changes in the fair value of derivatives depends on the intended use of the derivative, whether we have elected to apply hedge accounting and whether the hedging relationship has satisfied the criteria necessary to apply hedge accounting. Derivatives qualifying as a hedge of the exposure to variability in expected future cash flows, or other types of forecasted transactions, are considered cash flow hedges. Hedge accounting generally provides for the matching of the earnings effect of the hedged forecasted transactions in a cash flow hedge.
43
Results of Operations
Year Ended December 31, 2014 Compared to Year Ended December 31, 2013
|
|
|
|
|
|
|
|
|
|
|
|
|
|
|
Year Ended |
|
|
|
|
||||
|
|
|
December 31, |
|
Increase |
|
|||||
|
(In thousands) |
|
2014 |
|
2013 |
|
(Decrease) |
|
|||
|
Total revenues |
|
$ |
190,441 |
|
$ |
108,904 |
|
$ |
81,537 |
|
|
Expenses: |
|
|
|
|
|
|
|
|
|
|
|
Interest |
|
|
67,959 |
|
|
39,180 |
|
|
28,779 |
|
|
Transaction costs |
|
|
2,804 |
|
|
2,643 |
|
|
161 |
|
|
Property costs |
|
|
473 |
|
|
127 |
|
|
346 |
|
|
General and administrative |
|
|
19,494 |
|
|
14,132 |
|
|
5,362 |
|
|
Depreciation and amortization |
|
|
57,025 |
|
|
30,349 |
|
|
26,676 |
|
|
Total expenses |
|
|
147,755 |
|
|
86,431 |
|
|
61,324 |
|
|
Income from continuing operations before income taxes |
|
|
42,686 |
|
|
22,473 |
|
|
20,213 |
|
|
Income tax expense |
|
|
180 |
|
|
155 |
|
|
25 |
|
|
Income from continuing operations |
|
|
42,506 |
|
|
22,318 |
|
|
20,188 |
|
|
Income from discontinued operations, net of tax |
|
|
1,140 |
|
|
3,995 |
|
|
(2,855) |
|
|
Income before gain on dispositions of real estate investments |
|
|
43,646 |
|
|
26,313 |
|
|
17,333 |
|
|
Gain on dispositions of real estate investments |
|
|
4,493 |
|
|
— |
|
|
4,493 |
|
|
Net income |
|
$ |
48,139 |
|
$ |
26,313 |
|
$ |
21,826 |
|
Overview
As of December 31, 2014, our real estate investment portfolio had grown to $2.8 billion, consisting of investments in 947 property locations in 46 states, operated by 226 customers in various industries. Approximately 96% of the real estate investment portfolio represents commercial real estate properties subject to long‑term leases, 4% represents mortgage loan and direct financing receivables primarily on commercial real estate buildings (located on land we own and lease to our customers) and a nominal amount represents loans receivable secured by our tenants’ other assets. All of our owned properties were subject to a lease as of December 31, 2014.
Revenues
Revenues rose by 74.9% to $190.4 million for the year ended December 31, 2014 from $108.9 million for the year ended December 31, 2013, driven primarily by the growth in the size of our real estate investment portfolio, which generated additional rental revenues and interest income. Our real estate investment portfolio grew from $1.7 billion in gross investment amount at the end of 2013 to $2.8 billion in gross investment amount at December 31, 2014. Our real estate investments were made throughout the years presented and were not all outstanding for the entire period; accordingly, about half of the increase in revenues between years is related to recognizing a full year of revenue in 2014 on acquisitions that were purchased during 2013 and about half of the increase represents a partial year of revenue on assets that were acquired during 2014. The full revenue impact of 2014 acquisitions will be seen in 2015. The weighted average real estate investment amounts outstanding during the years were $2.24 billion in 2014 and $1.28 billion in 2013.
The weighted average initial real estate capitalization rate on the properties we acquired during 2014 (calculated as the initial annualized base rent divided by the purchase price of the properties) was 8.3% as compared to 8.5% for properties acquired during 2013.
The initial rental rates we receive on sale‑leaseback transactions on the various types of properties we target across the United States vary from transaction to transaction based on many factors, such as the terms of the lease, each property’s real estate fundamentals and the market rents in the area. The majority of our transactions are sale‑leaseback transactions where we acquire the property and simultaneously negotiate a lease with the tenant based on their business
44
needs, whereas the properties listed in online commercial real estate marketplaces are often subject to existing leases and are offered by third‑party sellers. Since our real estate leases represent an alternative for our customers to other forms of corporate capitalization, lease rates can also be influenced by changes in interest rates and overall capital availability. In general, because we provide tailored customer lease solutions, our lease rates have been historically subject to less variance than the auction marketplace as a whole. We have seen a general decrease of approximately 0.35% between December 2013 and December 2014 in real estate capitalization rates listed in online commercial real estate marketplaces. While we have experienced less downward lease rate pressures with the investments we funded during 2014, we have seen some lease rate compression, particularly during the latter part of the year. The lower long‑term interest rate environment during 2014 contributed to this easing. The impact of the lower lease rates may be wholly or partially offset by opportunities for lower long‑term borrowing costs, although there is no assurance of this.
Interest Expense
Interest expense increased to $68.0 million for the year ended December 31, 2014 from $39.2 million in 2013 due primarily to an increase in long‑term borrowings used to partially fund the acquisition of properties for our growing real estate investment portfolio. We funded the growth in our real estate investment portfolio with added equity and long‑term debt, using our short‑term credit facilities to temporarily finance properties we acquired until we had a sufficiently large and diverse pool of properties to issue long‑term fixed‑rate debt.
The following table summarizes our interest expense for the periods.
|
|
|
|
|
|
|
|
|
|
|
|
For the Year Ended |
|
||||
|
|
|
December 31, |
|
||||
|
(Dollars in thousands) |
|
2014 |
|
2013 |
|
||
|
Interest expense—short‑term credit facilities (includes non‑use fees) |
|
$ |
3,084 |
|
$ |
3,344 |
|
|
Interest expense—non‑recourse debt obligations of consolidated special purpose entities |
|
|
58,304 |
|
|
31,650 |
|
|
Amortization of deferred financing costs and other |
|
|
6,571 |
|
|
4,186 |
|
|
Total interest expense |
|
$ |
67,959 |
|
$ |
39,180 |
|
|
Short‑term credit facilities: |
|
|
|
|
|
|
|
|
Average debt outstanding |
|
$ |
79,519 |
|
$ |
77,315 |
|
|
Average interest rate (includes non‑use fees) |
|
|
3.9 |
% |
|
4.3 |
% |
|
Non‑recourse debt obligations of consolidated special purpose entities: |
|
|
|
|
|
|
|
|
Average debt outstanding |
|
$ |
1,188,842 |
|
$ |
629,181 |
|
|
Average interest rate |
|
|
4.9 |
% |
|
5.0 |
% |
The average amount of long-term debt outstanding was $1.19 billion during 2014, up significantly from $0.63 billion in 2013 which is the primary driver for the increase in interest expense on long-term debt. This increase was slightly offset by a decrease in the weighted average interest rate of the long-term debt. During 2014, our consolidated special purpose entities issued one series of STORE Master Funding net‑lease mortgage notes payable aggregating $260 million in principal amount with a weighted average interest rate of 4.64%. In addition, we added $52.7 million of traditional mortgage debt during 2014. At the end of 2014, we had $1.28 billion of outstanding long term debt with a weighted average interest rate of 4.9%. The average debt outstanding on our credit facilities increased to $79.5 million in 2014 from $77.3 million in 2013. The weighted average interest rate, including non-use fees on undrawn amounts, on our short-term borrowings was 3.9% in 2014, down from 4.3% in 2013. During these periods, our two main secured credit facilities bore interest at a variable rate based on one‑month LIBOR plus a credit spread of 2.45% to 3.0%. In September 2014, we replaced these two secured credit facilities with an unsecured credit facility that bears interest based on one‑month LIBOR plus a credit spread ranging from 1.75% to 2.50% using a leverage‑based scale. The LIBOR rate has been fairly stable since the beginning of 2013, with the one‑month LIBOR rate hovering between 0.15% and 0.17% during 2014 and between 0.16% and 0.21% during 2013.
From time to time, we may have construction activities on one or more of our real estate properties and interest capitalized as a part of those activities represented less than $1 million in 2014. In addition, interest expense in 2014
45
includes the write off of $1.2 million in remaining unamortized deferred financing costs related to the two secured credit facilities that we replaced with our new $300 million unsecured credit facility in September 2014.
Transaction Costs
Our real estate acquisitions have been predominantly sale‑leaseback transactions in which acquisition and closing costs were capitalized as part of the investment in the property. We also occasionally acquire properties subject to an existing lease. Costs incurred on real estate transactions where we acquired properties that are subject to an existing lease were expensed to operations as incurred. Transaction costs expensed during the year ended December 31, 2014 totaled $2.8 million, as compared to $2.6 million incurred during 2013. Whether the real estate we acquire is subject to an existing lease or not determines how we account for the related transaction costs and, accordingly, may cause variability in the level of such costs expensed to operations from year to year.
Property Costs
Approximately 97% of our leases are triple-net, meaning that our tenants are generally responsible for the property-level operating costs such as taxes, insurance and maintenance. Accordingly, we generally do not expect to incur property-level operating costs or capital expenditures, except during any period where one or more of our properties is no longer under lease. As of December 31, 2014, all of our properties are under lease and we have few near-term scheduled lease maturities, so we do not expect to incur significant property costs in the near term. Our need to expend capital on our properties is further reduced due to the fact that some of our tenants will periodically refresh the property at their own expense to meet their business needs or in connection with franchisor requirements.
Included in property costs in 2014 and 2013 is approximately $57,000 and $30,000, respectively, related to the amortization of ground lease interest intangibles. Property costs also include the expense of performing site inspections of our properties from time to time, as well as the property management costs of the few properties we own that have specific landlord property-level expense obligations.
General and Administrative Expenses
General and administrative expenses include compensation and benefits; professional fees such as portfolio servicing, legal and accounting fees; and general office expenses such as insurance, office rent and travel costs. General and administrative costs totaled $19.5 million for the year ended December 31, 2014 as compared to $14.1 million for 2013 primarily due to the growth of our portfolio and additions to our staff due to the growth in our operations. Expenses, such as property‑related insurance costs and the costs of servicing the properties and loans comprising our real estate portfolio, increase in direct proportion to the increase in the size of the portfolio. Other costs, including the compensation paid to our real estate acquisition personnel, are based on the volume of real estate acquisitions made during the period; these costs were higher during the year ended December 31, 2014 as compared to the year ended December 31, 2013 commensurate with the increase in acquisition volume. Our number of employees grew from 44 employees at the end of 2013 to 50 employees as of December 31, 2014; the added positions expanded our portfolio management and servicing team and other operations support functions and contributed to the increase in compensation and employee benefits expense. We expect an increase of approximately $2 million per year in ongoing costs related to being a public company, including the costs of public company governance and reporting and meeting other regulatory filing requirements. We also expect that general and administrative expenses will continue to rise in some measure as our real estate investment portfolio grows; however, we expect that such expenses as a percentage of the portfolio will decrease over time due to efficiencies and economies of scale.
Depreciation and Amortization Expense
Depreciation and amortization expense generally rises in proportion to the increase in the size of our real estate portfolio and, accordingly, such expense rose from $30.3 million for the year ended December 31, 2013 to $57.0 million for the year ended December 31, 2014.
46
Net Income
Our net income rose to $48.1 million for the year ended December 31, 2014 from the $26.3 million in net income reported in 2013. The increase in net income is primarily due to the growth in the size of our real estate investment portfolio, which generated additional rental revenues and interest income. A portion of the increase in net income relates to an increase in gains from the sale of properties. We sell properties from time to time in order to enhance the diversity and quality of our real estate portfolio. We reported gains aggregating $5.5 million on the sale of 16 properties during the year ended December 31, 2014. The cost of the properties sold during 2014 represented 2% of our total real estate investment portfolio at the beginning of the year. During the year ended December 31, 2013, we reported gains aggregating $2.2 million (net of tax) on the sale of 17 properties; the cost of these properties represented 4% of our real estate investment portfolio at the beginning of that year. As discussed in Note 2 to the consolidated financial statements, we adopted Accounting Standards Update No. 2014‑08 effective as of the beginning of 2014. As a result of this new accounting guidance, during 2014, the gains on the sales of the three properties that were considered to be held for sale as of the end of 2013 are reported in income from discontinued operations and the remaining gains are reported separately below income from continuing operations. During the year ended December 31, 2013, all gains on sales of properties were reported, net of tax, in income from discontinued operations.
Year Ended December 31, 2013 Compared to Year Ended December 31, 2012
|
|
|
|
|
|
|
|
|
|
|
|
|
|
|
Year Ended |
|
|
|
|
||||
|
|
|
December 31, |
|
Increase |
|
|||||
|
(In thousands) |
|
2013 |
|
2012 |
|
(Decrease) |
|
|||
|
Total revenues |
|
$ |
108,904 |
|
$ |
40,610 |
|
$ |
68,294 |
|
|
Expenses: |
|
|
|
|
|
|
|
|
|
|
|
Interest |
|
|
39,180 |
|
|
11,472 |
|
|
27,708 |
|
|
Transaction costs |
|
|
2,643 |
|
|
387 |
|
|
2,256 |
|
|
Property costs |
|
|
127 |
|
|
7 |
|
|
120 |
|
|
General and administrative |
|
|
14,132 |
|
|
10,362 |
|
|
3,770 |
|
|
Depreciation and amortization |
|
|
30,349 |
|
|
11,015 |
|
|
19,334 |
|
|
Total expenses |
|
|
86,431 |
|
|
33,243 |
|
|
53,188 |
|
|
Income from continuing operations before income taxes |
|
|
22,473 |
|
|
7,367 |
|
|
15,106 |
|
|
Income tax expense |
|
|
155 |
|
|
70 |
|
|
85 |
|
|
Income from continuing operations |
|
|
22,318 |
|
|
7,297 |
|
|
15,021 |
|
|
Income from discontinued operations, net of tax |
|
|
3,995 |
|
|
879 |
|
|
3,116 |
|
|
Net income |
|
$ |
26,313 |
|
$ |
8,176 |
|
$ |
18,137 |
|
Overview
As of December 31, 2013, our real estate investment portfolio totaled $1.7 billion, consisting of investments in 622 property locations in 42 states, operated by 148 customers in various industries. Approximately 96% of the real estate investment portfolio represented commercial real estate properties subject to long‑term leases, 4% represented mortgage loans receivable on commercial real estate buildings (located on land we owned and leased to our customers) and a nominal amount represented loans receivable secured by our tenants’ inventory or other assets. All of our owned properties were subject to a lease as of December 31, 2013 and 2012.
Revenues
Revenues rose by 168% to $108.9 million for the year ended December 31, 2013 from $40.6 million for the year ended December 31, 2012, driven primarily by the growth in the size of our real estate investment portfolio, which generated additional rental revenues and interest income. Our real estate investment portfolio grew from $911.7 million in gross investment amount representing 371 properties at December 31, 2012 to $1.7 billion in gross investment amount representing 622 properties at December 31, 2013. The $837 million we invested in portfolio assets during 2013 represented 268 properties operated by 94 customers in 33 industries in 39 states. Our real estate investments were made throughout the years presented and were not all outstanding for the entire period. The weighted average real estate investment amounts outstanding during the years were $1.28 billion in 2013 and $486.2 million in 2012. The weighted average initial real estate capitalization rate on the properties we acquired in 2013 (calculated as the initial annualized base rent divided by the purchase price of the properties) was 8.5% for 2013 as compared to 8.7% for 2012.
47
Interest Expense
The following table summarizes our interest expense for the years ended December 31, 2013 and 2012.
|
|
|
|
|
|
|
|
|
|
|
|
For the Year |
|
||||
|
|
|
Ended December 31, |
|
||||
|
(Dollars in thousands) |
|
2013 |
|
2012 |
|
||
|
Interest expense—secured credit facilities (includes non‑use fees) |
|
$ |
3,262 |
|
$ |
2,393 |
|
|
Interest expense—unsecured credit facility |
|
|
82 |
|
|
144 |
|
|
Interest expense—non‑recourse debt obligations of consolidated special purpose entities |
|
|
31,650 |
|
|
6,834 |
|
|
Amortization of deferred financing costs and other |
|
|
4,186 |
|
|
2,101 |
|
|
Total interest expense |
|
$ |
39,180 |
|
$ |
11,472 |
|
|
Secured short‑term credit facilities: |
|
|
|
|
|
|
|
|
Average debt outstanding |
|
$ |
74,877 |
|
$ |
54,814 |
|
|
Average interest rate (includes non‑use fees) |
|
|
4.36 |
% |
|
4.37 |
% |
|
Non‑recourse debt obligations of consolidated special purpose entities: |
|
|
|
|
|
|
|
|
Average debt outstanding |
|
$ |
629,181 |
|
$ |
122,813 |
|
|
Average interest rate |
|
|
5.03 |
% |
|
5.56 |
% |
Interest expense increased to $39.2 million for the year ended December 31, 2013 from $11.5 million in 2012 due primarily to an increase in short‑term and long‑term borrowings used to partially fund the acquisition of properties for our growing real estate investment portfolio. We funded the growth in our real estate investment portfolio with added equity and long‑term debt, using our short‑term credit facilities to temporarily finance properties we acquired until we had a sufficiently large and diverse pool of properties to issue long‑term fixed‑rate debt. The average debt outstanding on our secured credit facilities increased from $54.8 million in 2012 to $74.9 million in 2013 at a weighted average interest rate of 3.18% in 2012 as compared to 3.13% in 2013. During these periods, our secured credit facilities bore interest at a variable rate based on one‑month LIBOR plus a credit spread of 2.45% to 3.0%. The LIBOR rate was fairly stable during 2012 and 2013 at less than 0.3%. In addition to the interest, we paid a non‑use fee on undrawn amounts. During 2013, our consolidated special purpose entities issued a total of three series of STORE Master Funding net‑lease mortgage notes payable aggregating $633 million in principal amount. In addition, we added $61.6 million of traditional mortgage debt during the year, bringing our long‑term debt outstanding to $991.4 million at December 31, 2013, up from $306.6 million at December 31, 2012. The interest rates achieved on the debt added during 2013, primarily consisting of the Master Funding notes issued throughout the year, resulted in a decrease in the weighted average cost of our long-term debt.
Transaction Costs
Transaction costs expensed during the year ended December 31, 2013 totaled $2.6 million and were higher than the $0.4 million incurred during the comparable period of 2012, because we had a higher volume of transactions subject to existing leases in 2013. Whether the real estate we acquire is subject to an existing lease or not determines how we account for the related transaction costs and, accordingly, may cause variability in the level of such costs expensed to operations from year to year.
General and Administrative Expenses
General and administrative costs totaled $14.1 million for the year ended December 31, 2013 as compared to $10.4 million for 2012 primarily due to the growth of our portfolio and additions to our staff due to the growth in our operations. Expenses, such as property‑related insurance costs and the costs of servicing the properties and loans comprising our real estate portfolio, increased in direct proportion to the increase in the size of the portfolio. Other costs, including the compensation paid to our real estate acquisition personnel, were based on the volume of real estate acquisitions made during the period; these costs were higher in 2013 than in 2012 because our acquisition volume was
48
higher in 2013. We hired eight employees in 2013 to expand our primary internal operating functions, increasing compensation and employee benefits expense.
Depreciation and Amortization Expense
Depreciation and amortization expense increased in proportion to the increase in the size of the real estate portfolio and, accordingly, such expense rose from $11.0 million for the year ended December 31, 2012 to $30.3 million for the year ended December 31, 2013.
Net Income
Our net income rose to $26.3 million for the year ended December 31, 2013 from the $8.2 million in net income reported in 2012. The increase in net income is primarily due to the growth in the size of our real estate investment portfolio, which generated additional rental revenues and interest income. In addition, we reported an aggregate gain of $2.2 million (net of taxes) on the sale of 17 properties during the year ended December 31, 2013 as compared to an aggregate gain of $0.2 million on the sale of seven properties during 2012. During the years ended December 31, 2013 and 2012, gains and losses on the sales of properties were reported, net of tax, in income from discontinued operations.
Non-GAAP Measures
Our reported results are presented in accordance with U.S. generally accepted accounting principles, or GAAP. We also disclose Funds from Operations, or FFO, and Adjusted Funds from Operations, or AFFO, both of which are non‑GAAP measures. We believe these two non‑GAAP financial measures are useful to investors because they are widely accepted industry measures used by analysts and investors to compare the operating performance of REITs. FFO and AFFO do not represent cash generated from operating activities and are not necessarily indicative of cash available to fund cash requirements; accordingly, they should not be considered alternatives to net income as a performance measure or cash flows from operations as reported on our statement of cash flows as a liquidity measure and should be considered in addition to, and not in lieu of, GAAP financial measures.
We compute FFO in accordance with the definition adopted by the Board of Governors of the National Association of Real Estate Investment Trusts, or NAREIT. NAREIT defines FFO as GAAP net income, excluding gains (or losses) from extraordinary items and sales of depreciable property, real estate impairment losses and depreciation and amortization expense from real estate assets, including the pro rata share of such adjustments of unconsolidated subsidiaries. To derive AFFO, we modify the NAREIT computation of FFO to include other adjustments to GAAP net income related to non‑cash revenues and expenses such as straight‑line rents, amortization of deferred financing costs and stock‑based compensation. In addition, in deriving AFFO, we exclude transaction costs associated with acquiring real estate subject to existing leases.
FFO is used by management, investors and analysts to facilitate meaningful comparisons of operating performance between periods and among our peers primarily because it excludes the effect of real estate depreciation and amortization and net gains on sales, which are based on historical costs and implicitly assume that the value of real estate diminishes predictably over time, rather than fluctuating based on existing market conditions. Management believes that AFFO provides more useful information to investors and analysts because it modifies FFO to exclude additional non-cash revenues and expenses such as straight‑line rents, amortization of deferred financing costs and stock‑based compensation as such items may cause short-term fluctuations in net income but have no impact on operating cash flows or long-term operating performance. Additionally, in deriving AFFO, we exclude transaction costs associated with acquiring real estate subject to existing leases. We view transaction costs to be a part of our investment in the real estate we acquire, similar to the treatment of acquisition and closing costs on our sale-leaseback transactions, which are capitalized as a part of the investment in the asset. We believe that transaction costs are not an ongoing cost of the portfolio in place at the end of each reporting period and, for these reasons, we add back the portion expensed when computing AFFO. As a result, we believe AFFO to be a more meaningful measurement of ongoing performance that allows for greater performance comparability. Therefore, we disclose both FFO and AFFO and reconcile them to the most appropriate GAAP performance metric, which is net income. STORE Capital’s FFO and AFFO may not be comparable to similarly titled measures employed by other companies.
49
The following is a reconciliation of net income (which we believe is the most comparable GAAP measure) to FFO and AFFO.
|
|
|
|
|
|
|
|
|
|
|
|
|
|
|
Year Ended December 31, |
|
|||||||
|
(In thousands) |
|
2014 |
|
2013 |
|
2012 |
|
|||
|
Net income |
|
$ |
48,139 |
|
$ |
26,313 |
|
$ |
8,176 |
|
|
Depreciation and amortization of real estate assets: |
|
|
|
|
|
|
|
|
|
|
|
Continuing operations |
|
|
56,722 |
|
|
30,117 |
|
|
10,871 |
|
|
Discontinued operations |
|
|
— |
|
|
575 |
|
|
147 |
|
|
Gain on dispositions of real estate, net of tax |
|
|
(5,478) |
|
|
(2,162) |
|
|
(180) |
|
|
Funds from Operations |
|
|
99,383 |
|
|
54,843 |
|
|
19,014 |
|
|
Adjustments: |
|
|
|
|
|
|
|
|
|
|
|
Straight‑line rental revenue, net |
|
|
(2,402) |
|
|
(1,421) |
|
|
(218) |
|
|
Transaction costs |
|
|
2,804 |
|
|
2,643 |
|
|
387 |
|
|
Non‑cash equity‑based compensation |
|
|
2,294 |
|
|
1,228 |
|
|
356 |
|
|
Non‑cash interest expense |
|
|
7,146 |
|
|
4,186 |
|
|
2,100 |
|
|
Amortization of lease‑related intangibles and costs |
|
|
651 |
|
|
260 |
|
|
62 |
|
|
Adjusted Funds from Operations |
|
$ |
109,876 |
|
$ |
61,739 |
|
$ |
21,701 |
|
Item 7A. Quantitative and Qualitative Disclosures About Market Risk
Our interest rate risk management objective is to limit the impact of future interest rate changes on our earnings and cash flows. We seek to match the cash inflows from our long‑term leases with the expected cash outflows on our long‑term debt. To achieve this objective, our consolidated subsidiaries primarily borrow on a fixed‑rate basis for longer‑term debt issuances. At December 31, 2014, substantially all of our outstanding long‑term debt carried a fixed interest rate and the weighted average debt maturity was approximately seven years. We are exposed to interest rate risk between the time we enter into a sale‑leaseback transaction and the time we finance the related real estate with long‑term fixed‑rate debt. In addition, when that long‑term debt matures, we may have to refinance the real estate at a higher interest rate. Market interest rates are sensitive to many factors that are beyond our control.
We address interest rate risk by employing the following strategies to help insulate us from any adverse impact of rising interest rates:
|
· |
We seek to minimize the time period between acquisition of our real estate and the ultimate financing of that real estate with long‑term fixed‑rate debt. |
|
· |
By using serial issuances of long-term debt, we intend to ladder out our debt maturities to avoid a significant amount of debt maturing during any single period. |
|
· |
We choose long‑term debt that generally provides for some amortization of the principal balance over the term of the debt, which serves to reduce the amount of refinancing risk at debt maturity to the extent that we can refinance the reduced debt balance over a revised long-term amortization schedule. |
|
· |
We strive to grow our free cash flow such that, over time, our cash flow from operating activities, after principal payments on our debt, plus cash flows from property sales and principal collected on our loans receivable, each year exceeds that year’s scheduled debt maturities. |
Although the substantial majority of our debt is fixed-rate debt, we utilize credit facilities that are based on a variable rate. During the year ended December 31, 2014, we had average daily outstanding borrowings of $79.5 million on our variable‑rate credit facilities at a weighted average annual interest rate of one‑month LIBOR plus 2.25% to 3.0%. We monitor our market interest rate risk exposures using a sensitivity analysis. Our sensitivity analysis estimates the exposure to market risk sensitive instruments assuming a hypothetical adverse change in interest rates. Based on the results of a sensitivity analysis, which assumes a 1% adverse change in interest rates, the estimated market risk exposure for all of our variable‑rate debt was approximately $849,000, or less than 1% of net cash provided by operating activities for the year ended December 31, 2014. In addition, we may use various financial instruments designed to mitigate the impact of interest rate fluctuations on our cash flows and earnings, including hedging strategies, depending on our analysis of the interest rate environment and the costs and risks of such strategies. We do not use derivative instruments for trading or speculative purposes. See Note 5 to our Consolidated Financial Statements for further information on derivatives.
50
Item 8. FINANCIAL STATEMENTS AND SUPPLEMENTARY DATA
The Board of Directors and Stockholders of
STORE Capital Corporation
We have audited the accompanying consolidated balance sheets of STORE Capital Corporation (the Company) as of December 31, 2014 and 2013, and the related consolidated statements of income, comprehensive income, stockholders’ equity, and cash flows for each of the three years in the period ended December 31, 2014. Our audits also included the financial statement schedules listed in the Index at Item 15(a). These financial statements and schedules are the responsibility of the Company's management. Our responsibility is to express an opinion on these financial statements and schedules based on our audits.
We conducted our audits in accordance with the standards of the Public Company Accounting Oversight Board (United States). Those standards require that we plan and perform the audit to obtain reasonable assurance about whether the financial statements are free of material misstatement. We were not engaged to perform an audit of the Company's internal control over financial reporting. Our audits included consideration of internal control over financial reporting as a basis for designing audit procedures that are appropriate in the circumstances, but not for the purpose of expressing an opinion on the effectiveness of the Company's internal control over financial reporting. Accordingly, we express no such opinion. An audit also includes examining, on a test basis, evidence supporting the amounts and disclosures in the financial statements, assessing the accounting principles used and significant estimates made by management, and evaluating the overall financial statement presentation. We believe that our audits provide a reasonable basis for our opinion.
In our opinion, the financial statements referred to above present fairly, in all material respects, the consolidated financial position of STORE Capital Corporation at December 31, 2014 and 2013, and the consolidated results of its operations and its cash flows for each of the three years in the period ended December 31, 2014 in conformity with U.S. generally accepted accounting principles. Also, in our opinion, the related financial statement schedules, when considered in relation to the basic financial statements taken as a whole, present fairly, in all material respects, the information set forth therein.
As discussed in Note 2 to the consolidated financial statements, the Company changed its method for reporting discontinued operations effective January 1, 2014.
/s/ Ernst & Young LLP
Phoenix, Arizona
March 10, 2015
51
STORE Capital Corporation
Consolidated Balance Sheets
(In thousands, except share and per share data)
|
|
|
|
|
|
|
|
|
|
|
|
December 31, |
|
||||
|
|
|
2014 |
|
2013 |
|
||
|
Assets |
|
|
|
|
|
|
|
|
Investments: |
|
|
|
|
|
|
|
|
Real estate investments: |
|
|
|
|
|
|
|
|
Land and improvements |
|
$ |
843,843 |
|
$ |
562,085 |
|
|
Buildings and improvements |
|
|
1,790,530 |
|
|
1,042,244 |
|
|
Intangible lease assets |
|
|
60,184 |
|
|
29,917 |
|
|
Total real estate investments |
|
|
2,694,557 |
|
|
1,634,246 |
|
|
Less accumulated depreciation and amortization |
|
|
(98,671) |
|
|
(41,976) |
|
|
|
|
|
2,595,886 |
|
|
1,592,270 |
|
|
Real estate investments held for sale, net |
|
|
— |
|
|
9,023 |
|
|
Loans and direct financing receivables |
|
|
111,354 |
|
|
66,917 |
|
|
Net investments |
|
|
2,707,240 |
|
|
1,668,210 |
|
|
Cash and cash equivalents |
|
|
136,313 |
|
|
61,814 |
|
|
Restricted cash and other assets |
|
|
32,923 |
|
|
24,556 |
|
|
Deferred costs, net |
|
|
37,136 |
|
|
31,520 |
|
|
Total assets |
|
$ |
2,913,612 |
|
$ |
1,786,100 |
|
|
|
|
|
|
|
|
|
|
|
Liabilities and stockholders’ equity |
|
|
|
|
|
|
|
|
Liabilities: |
|
|
|
|
|
|
|
|
Credit facilities |
|
$ |
— |
|
$ |
— |
|
|
Non‑recourse debt obligations of consolidated special purpose entities, net |
|
|
1,284,151 |
|
|
991,577 |
|
|
Dividends payable |
|
|
13,123 |
|
|
— |
|
|
Accounts payable and accrued expenses |
|
|
30,486 |
|
|
13,263 |
|
|
Other liabilities |
|
|
3,168 |
|
|
7,346 |
|
|
Total liabilities |
|
|
1,330,928 |
|
|
1,012,186 |
|
|
Stockholders’ equity: |
|
|
|
|
|
|
|
|
Preferred stock, $0.01 par value per share, 125,000,000 shares authorized; no shares and 125 shares issued and outstanding, respectively |
|
|
— |
|
|
— |
|
|
Common stock, $0.01 par value per share, 375,000,000 shares authorized; 115,212,541 and 62,966,920 shares issued and outstanding, respectively |
|
|
1,152 |
|
|
630 |
|
|
Capital in excess of par value |
|
|
1,636,203 |
|
|
798,228 |
|
|
Distributions in excess of retained earnings |
|
|
(54,405) |
|
|
(24,816) |
|
|
Accumulated other comprehensive loss |
|
|
(266) |
|
|
(128) |
|
|
Total stockholders’ equity |
|
|
1,582,684 |
|
|
773,914 |
|
|
Total liabilities and stockholders’ equity |
|
$ |
2,913,612 |
|
$ |
1,786,100 |
|
See accompanying notes.
52
STORE Capital Corporation
Consolidated Statements of Income
(In thousands, except share and per share data)
|
|
|
|
|
|
|
|
|
|
|
|
|
|
|
Year ended December 31, |
|
|||||||
|
|
|
2014 |
|
2013 |
|
2012 |
|
|||
|
Revenues: |
|
|
|
|
|
|
|
|
|
|
|
Rental revenues |
|
$ |
181,972 |
|
$ |
103,398 |
|
$ |
38,752 |
|
|
Interest income on loans and direct financing receivables |
|
|
8,069 |
|
|
5,044 |
|
|
1,843 |
|
|
Other income |
|
|
400 |
|
|
462 |
|
|
15 |
|
|
Total revenues |
|
|
190,441 |
|
|
108,904 |
|
|
40,610 |
|
|
Expenses: |
|
|
|
|
|
|
|
|
|
|
|
Interest |
|
|
67,959 |
|
|
39,180 |
|
|
11,472 |
|
|
Transaction costs |
|
|
2,804 |
|
|
2,643 |
|
|
387 |
|
|
Property costs |
|
|
473 |
|
|
127 |
|
|
7 |
|
|
General and administrative |
|
|
19,494 |
|
|
14,132 |
|
|
10,362 |
|
|
Depreciation and amortization |
|
|
57,025 |
|
|
30,349 |
|
|
11,015 |
|
|
Total expenses |
|
|
147,755 |
|
|
86,431 |
|
|
33,243 |
|
|
Income from continuing operations before income taxes |
|
|
42,686 |
|
|
22,473 |
|
|
7,367 |
|
|
Income tax expense |
|
|
180 |
|
|
155 |
|
|
70 |
|
|
Income from continuing operations |
|
|
42,506 |
|
|
22,318 |
|
|
7,297 |
|
|
Income from discontinued operations, net of tax |
|
|
1,140 |
|
|
3,995 |
|
|
879 |
|
|
Income before gain on dispositions of real estate investments |
|
|
43,646 |
|
|
26,313 |
|
|
8,176 |
|
|
Gain on dispositions of real estate investments |
|
|
4,493 |
|
|
— |
|
|
— |
|
|
Net income |
|
$ |
48,139 |
|
$ |
26,313 |
|
$ |
8,176 |
|
|
Net income per share of common stock—basic and diluted: |
|
|
|
|
|
|
|
|
|
|
|
Continuing operations |
|
$ |
0.59 |
|
$ |
0.44 |
|
$ |
0.26 |
|
|
Discontinued operations |
|
|
0.01 |
|
|
0.08 |
|
|
0.03 |
|
|
Net income |
|
$ |
0.61 |
|
$ |
0.52 |
|
$ |
0.30 |
|
|
Weighted average common shares outstanding: |
|
|
|
|
|
|
|
|
|
|
|
Basic |
|
|
78,454,599 |
|
|
49,893,667 |
|
|
27,338,052 |
|
|
Diluted |
|
|
78,454,599 |
|
|
49,893,667 |
|
|
27,338,052 |
|
See accompanying notes.
53
STORE Capital Corporation
Consolidated Statements of Comprehensive Income
(In thousands)
|
|
|
|
|
|
|
|
|
|
|
|
|
|
|
Year ended December 31, |
|
|||||||
|
|
|
2014 |
|
2013 |
|
2012 |
|
|||
|
Net income |
|
$ |
48,139 |
|
$ |
26,313 |
|
$ |
8,176 |
|
|
Other comprehensive (loss) income: |
|
|
|
|
|
|
|
|
|
|
|
Change in unrealized losses on cash flow hedges |
|
|
(457) |
|
|
414 |
|
|
(911) |
|
|
Cash flow hedge losses reclassified to operations |
|
|
319 |
|
|
319 |
|
|
306 |
|
|
Total other comprehensive (loss) income |
|
|
(138) |
|
|
733 |
|
|
(605) |
|
|
Total comprehensive income |
|
$ |
48,001 |
|
$ |
27,046 |
|
$ |
7,571 |
|
See accompanying notes.
54
STORE Capital Corporation
Consolidated Statements of Stockholders’ Equity
For the Years Ended December 31, 2014, 2013 and 2012
(In thousands, except share data)
|
|
|
|
|
|
|
|
|
|
|
|
|
|
|
|
|
|
|
|
|
|
|
|
|
|
|
|
Series A |
|
|
|
|
|
|
|
|
|
Distributions |
|
Accumulated |
|
|
|
|
|||||
|
|
|
Cumulative |
|
|
|
|
|
|
Capital in |
|
in Excess of |
|
Other |
|
Total |
|
|||||||
|
|
|
Preferred Stock |
|
Common Stock |
|
Excess of |
|
Retained |
|
Comprehensive |
|
Stockholders’ |
|
||||||||||
|
|
|
Shares |
|
Par Value |
|
Shares |
|
Par Value |
|
Par Value |
|
Earnings |
|
Loss |
|
Equity |
|
||||||
|
Balance at December 31, 2011 |
|
— |
|
$ |
— |
|
18,703,165 |
|
$ |
187 |
|
$ |
223,053 |
|
$ |
(2,022) |
|
$ |
(256) |
|
$ |
220,962 |
|
|
Net income |
|
— |
|
|
— |
|
— |
|
|
— |
|
|
— |
|
|
8,176 |
|
|
— |
|
|
8,176 |
|
|
Other comprehensive loss |
|
— |
|
|
— |
|
— |
|
|
— |
|
|
— |
|
|
— |
|
|
(605) |
|
|
(605) |
|
|
Issuance of common stock |
|
— |
|
|
— |
|
23,398,812 |
|
|
234 |
|
|
279,991 |
|
|
— |
|
|
— |
|
|
280,225 |
|
|
Issuance of preferred stock, net of costs of $45 |
|
125 |
|
|
— |
|
— |
|
|
— |
|
|
80 |
|
|
— |
|
|
— |
|
|
80 |
|
|
Share‑based compensation |
|
— |
|
|
— |
|
145,776 |
|
|
2 |
|
|
338 |
|
|
— |
|
|
— |
|
|
340 |
|
|
Common dividends declared |
|
— |
|
|
— |
|
— |
|
|
— |
|
|
— |
|
|
(12,248) |
|
|
— |
|
|
(12,248) |
|
|
Preferred dividends declared |
|
— |
|
|
— |
|
— |
|
|
— |
|
|
— |
|
|
(16) |
|
|
— |
|
|
(16) |
|
|
Balance at December 31, 2012 |
|
125 |
|
|
— |
|
42,247,753 |
|
|
423 |
|
|
503,462 |
|
|
(6,110) |
|
|
(861) |
|
|
496,914 |
|
|
Net income |
|
— |
|
|
— |
|
— |
|
|
— |
|
|
— |
|
|
26,313 |
|
|
— |
|
|
26,313 |
|
|
Other comprehensive income |
|
— |
|
|
— |
|
— |
|
|
— |
|
|
— |
|
|
— |
|
|
733 |
|
|
733 |
|
|
Issuance of common stock |
|
— |
|
|
— |
|
20,492,291 |
|
|
205 |
|
|
293,545 |
|
|
— |
|
|
— |
|
|
293,750 |
|
|
Share‑based compensation |
|
— |
|
|
— |
|
226,876 |
|
|
2 |
|
|
1,221 |
|
|
— |
|
|
— |
|
|
1,223 |
|
|
Common dividends declared |
|
— |
|
|
— |
|
— |
|
|
— |
|
|
— |
|
|
(45,003) |
|
|
— |
|
|
(45,003) |
|
|
Preferred dividends declared |
|
— |
|
|
— |
|
— |
|
|
— |
|
|
— |
|
|
(16) |
|
|
— |
|
|
(16) |
|
|
Balance at December 31, 2013 |
|
125 |
|
|
— |
|
62,966,920 |
|
|
630 |
|
|
798,228 |
|
|
(24,816) |
|
|
(128) |
|
|
773,914 |
|
|
Net income |
|
— |
|
|
— |
|
— |
|
|
— |
|
|
— |
|
|
48,139 |
|
|
— |
|
|
48,139 |
|
|
Other comprehensive income |
|
— |
|
|
— |
|
— |
|
|
— |
|
|
— |
|
|
— |
|
|
(138) |
|
|
(138) |
|
|
Issuance of common stock, net of costs of $39,217 |
|
— |
|
|
— |
|
51,832,758 |
|
|
518 |
|
|
835,738 |
|
|
— |
|
|
— |
|
|
836,256 |
|
|
Share‑based compensation |
|
— |
|
|
— |
|
412,863 |
|
|
4 |
|
|
2,317 |
|
|
2 |
|
|
— |
|
|
2,323 |
|
|
Redemption of preferred stock |
|
(125) |
|
|
— |
|
— |
|
|
— |
|
|
(80) |
|
|
(45) |
|
|
— |
|
|
(125) |
|
|
Common dividends declared |
|
— |
|
|
— |
|
— |
|
|
— |
|
|
— |
|
|
(77,671) |
|
|
— |
|
|
(77,671) |
|
|
Preferred dividends declared |
|
— |
|
|
— |
|
— |
|
|
— |
|
|
— |
|
|
(14) |
|
|
— |
|
|
(14) |
|
|
Balance at December 31, 2014 |
|
— |
|
$ |
— |
|
115,212,541 |
|
$ |
1,152 |
|
$ |
1,636,203 |
|
$ |
(54,405) |
|
$ |
(266) |
|
$ |
1,582,684 |
|
See accompanying notes.
55
STORE Capital Corporation
Consolidated Statements of Cash Flows
(In thousands)
|
|
|
|
|
|
|
|
|
|
|
|
|
|
|
Year ended December 31, |
|
|||||||
|
|
|
2014 |
|
2013 |
|
2012 |
|
|||
|
Operating activities |
|
|
|
|
|
|
|
|
|
|
|
Net income |
|
$ |
48,139 |
|
$ |
26,313 |
|
$ |
8,176 |
|
|
Adjustments to net income: |
|
|
|
|
|
|
|
|
|
|
|
Depreciation and amortization |
|
|
57,025 |
|
|
30,924 |
|
|
11,163 |
|
|
Amortization of deferred financing costs |
|
|
7,497 |
|
|
4,195 |
|
|
2,113 |
|
|
Amortization of debt (premiums) and discounts, net |
|
|
(351) |
|
|
(9) |
|
|
(13) |
|
|
Amortization of share‑based compensation |
|
|
2,294 |
|
|
1,228 |
|
|
356 |
|
|
Gain on sale of real estate |
|
|
(5,478) |
|
|
(3,147) |
|
|
(180) |
|
|
Noncash revenue and other |
|
|
(1,113) |
|
|
(1,162) |
|
|
(156) |
|
|
Changes in operating assets and liabilities: |
|
|
|
|
|
|
|
|
|
|
|
Restricted cash and other assets |
|
|
2,656 |
|
|
(14,333) |
|
|
(2,497) |
|
|
Deferred costs |
|
|
(1,551) |
|
|
(1,313) |
|
|
(863) |
|
|
Accounts payable and other liabilities |
|
|
(1,012) |
|
|
12,238 |
|
|
4,316 |
|
|
Net cash provided by operating activities |
|
|
108,106 |
|
|
54,934 |
|
|
22,415 |
|
|
Investing activities |
|
|
|
|
|
|
|
|
|
|
|
Acquisition of and additions to real estate |
|
|
(1,044,339) |
|
|
(788,462) |
|
|
(640,869) |
|
|
Investment in loans and direct financing receivables |
|
|
(52,636) |
|
|
(33,647) |
|
|
(36,577) |
|
|
Collections of principal on loans and direct financing receivables |
|
|
6,206 |
|
|
238 |
|
|
73 |
|
|
Proceeds from disposition of real estate |
|
|
39,352 |
|
|
40,661 |
|
|
5,308 |
|
|
Transfers to restricted deposits |
|
|
(8,397) |
|
|
(5,305) |
|
|
(89) |
|
|
Net cash used in investing activities |
|
|
(1,059,814) |
|
|
(786,515) |
|
|
(672,154) |
|
|
Financing activities |
|
|
|
|
|
|
|
|
|
|
|
Borrowings under credit facilities |
|
|
590,080 |
|
|
359,500 |
|
|
329,123 |
|
|
Repayments under credit facilities |
|
|
(590,080) |
|
|
(520,162) |
|
|
(198,432) |
|
|
Borrowings under non‑recourse debt obligations of consolidated special purpose entities |
|
|
286,089 |
|
|
679,848 |
|
|
291,087 |
|
|
Repayments under non‑recourse debt obligations of consolidated special purpose entities |
|
|
(20,621) |
|
|
(9,755) |
|
|
(1,704) |
|
|
Financing costs paid |
|
|
(11,624) |
|
|
(22,942) |
|
|
(11,407) |
|
|
Proceeds from the issuance of common stock |
|
|
875,476 |
|
|
293,751 |
|
|
280,226 |
|
|
Proceeds from the issuance of preferred stock |
|
|
— |
|
|
— |
|
|
125 |
|
|
Dividends paid to common and preferred stockholders |
|
|
(64,562) |
|
|
(51,597) |
|
|
(5,685) |
|
|
Redemption of preferred stock |
|
|
(125) |
|
|
— |
|
|
— |
|
|
Offering costs paid |
|
|
(38,426) |
|
|
— |
|
|
(45) |
|
|
Net cash provided by financing activities |
|
|
1,026,207 |
|
|
728,643 |
|
|
683,288 |
|
|
Net increase (decrease) in cash and cash equivalents |
|
|
74,499 |
|
|
(2,938) |
|
|
33,549 |
|
|
Cash and cash equivalents, beginning of period |
|
|
61,814 |
|
|
64,752 |
|
|
31,203 |
|
|
Cash and cash equivalents, end of period |
|
$ |
136,313 |
|
$ |
61,814 |
|
$ |
64,752 |
|
See accompanying notes.
56
STORE Capital Corporation
Notes to Consolidated Financial Statements
December 31, 2014
1. Organization and Formation Activities
STORE Capital Corporation (STORE Capital or the Company) was formed in Maryland on May 17, 2011 to acquire single‑tenant operational real estate to be leased on a long‑term, net basis to companies that operate across a wide variety of industries within the service, retail and industrial sectors of the United States economy. The Company may also provide mortgage financing to its customers from time to time.
On November 21, 2014, the Company completed the initial public offering (IPO) of its common stock. The shares began trading on the New York Stock Exchange on November 18, 2014 under the ticker symbol “STOR”. The Company was originally formed as a wholly-owned subsidiary of STORE Holding Company, LLC (STORE Holding), a Delaware limited liability company. At December 31, 2014, there were 115,212,541 shares of the Company’s common stock outstanding, of which 82,802,026 shares were still held by STORE Holding, representing a 71.87% ownership of the Company. STORE Holding is primarily owned by entities managed by a global investment management firm and certain members of the Company’s senior management own 0.79% of STORE Holding.
STORE Capital has made an election to qualify, and believes it is operating in a manner to continue to qualify, as a real estate investment trust (REIT) for federal income tax purposes beginning with its initial taxable year ended December 31, 2011. As a REIT, it will generally not be subject to federal income taxes to the extent that it distributes all of its taxable income to its stockholders and meets other specific requirements.
2. Summary of Significant Accounting Principles
Basis of Accounting and Principles of Consolidation
The consolidated financial statements are prepared on the accrual basis of accounting in accordance with U.S. generally accepted accounting principles (GAAP). These consolidated statements include the accounts of STORE Capital Corporation and its subsidiaries which are wholly‑owned and controlled by the Company through its voting interest. One of the Company’s wholly‑owned subsidiaries, STORE Capital Advisors, LLC, provides all of the general and administrative services for the day‑to‑day operations of the consolidated group, including property acquisition and lease origination, real estate portfolio management and marketing, accounting and treasury services. The remaining subsidiaries were formed to acquire and hold real estate investments or to facilitate non‑recourse secured borrowing activities. Generally, the initial operations of the real estate subsidiaries are funded by an interest‑bearing intercompany loan from STORE Capital Corporation, and such intercompany loan is repaid when the subsidiary issues long‑term debt secured by its properties. All intercompany account balances and transactions have been eliminated in consolidation.
Certain of the Company’s wholly‑owned consolidated subsidiaries were formed as special purpose entities. Each special purpose entity is a separate legal entity and is the sole owner of its assets and liabilities. The assets of the special purpose entities are not available to pay or otherwise satisfy obligations to the creditors of any owner or affiliate of the special purpose entity. At December 31, 2014 and 2013, assets totaling $2.5 billion and $1.7 billion, respectively, were held and third‑party liabilities totaling $1.3 billion and $1.0 billion, respectively, were owed by these special purpose entities and are included in the accompanying consolidated balance sheets.
Use of Estimates
The preparation of financial statements in conformity with GAAP requires management to make estimates and assumptions that affect the reported amounts of assets and liabilities, the disclosure of contingent assets and liabilities and the reported amounts of revenues and expenses during the reporting period. Although management believes its estimates are reasonable, actual results could differ from those estimates.
57
Reclassifications
Certain reclassifications have been made to prior period balances to conform to the current period presentation.
Segment Reporting
The Financial Accounting Standards Board’s (FASB) Accounting Standards Codification (ASC) Topic 280, Segment Reporting, established standards for the manner in which enterprises report information about operating segments. The Company views its operations as one reportable segment.
Accounting for Real Estate Investments
STORE Capital records the acquisition of real estate properties at cost, including acquisition and closing costs. The Company allocates the cost of real estate properties to the tangible and intangible assets and liabilities acquired based on their estimated relative fair values. Real estate properties subject to an existing in‑place lease at the date of acquisition are recorded as business combinations and each tangible and intangible asset and liability acquired is recorded at fair value. Management uses multiple sources to estimate fair value, including independent appraisals and information obtained about each property as a result of its pre‑acquisition due diligence and its marketing and leasing activities. The Company expenses transaction costs associated with real estate acquisitions accounted for as business combinations in the period incurred.
In‑place lease intangibles are valued based on management’s estimates of lost rent and carrying costs during the time it would take to locate a tenant if the property were vacant, considering current market conditions and costs to execute similar leases. In estimating lost rent and carrying costs, management considers market rents, real estate taxes, insurance, costs to execute similar leases including leasing commissions and other related costs. The value assigned to in‑place leases is amortized on a straight‑line basis as a component of depreciation and amortization expense typically over the remaining term of the related leases.
The fair value of any above‑market and below‑market leases is estimated based on the present value of the difference between the contractual amounts to be paid pursuant to the in‑place lease and management’s estimate of current market lease rates for the property, measured over a period equal to the remaining term of the lease. Capitalized above‑market lease intangibles are amortized over the remaining term of the respective leases as a decrease to rental revenue. Below‑market lease intangibles are amortized as an increase in rental revenue over the remaining term of the respective leases plus the fixed‑rate renewal periods on those leases, if any. Should a lease terminate early, the unamortized portion of any related lease intangible is immediately recognized in operations.
The Company’s real estate portfolio is depreciated using the straight‑line method over the estimated remaining useful life of the properties, which generally ranges from 30 to 40 years for buildings and is 15 years for land improvements. Properties classified as held for sale are recorded at the lower of their carrying value or their fair value, less anticipated closing costs. Any properties classified as held for sale are not depreciated.
Impairment
STORE Capital reviews its real estate investments and related lease intangibles periodically for impairment whenever events or changes in circumstances indicate that the carrying amount of an asset may not be recoverable. Management considers factors such as expected future undiscounted cash flows, estimated residual value, market trends (such as the effects of leasing demand and competition) and other factors in making this assessment. An asset is considered impaired if the carrying value of the asset exceeds its estimated undiscounted cash flows and the impairment is calculated as the amount by which the carrying value of the asset exceeds its estimated fair value. Estimating future cash flows is highly subjective and such estimates could differ materially from actual results. No impairment charges were recorded during the years ended December 31, 2014, 2013 or 2012.
Revenue Recognition
STORE Capital leases real estate to its tenants under long‑term net leases that are predominantly classified as operating leases. Direct costs associated with lease origination, offset by any lease origination fees received, are deferred
58
and amortized over the related lease term as an adjustment to rental revenue. Substantially all of the leases are triple‑net, which provide that the lessees are responsible for the payment of all property operating expenses, including property taxes, maintenance and insurance. The Company may collect property taxes from its customers and remit those taxes to governmental authorities; such property taxes are presented on a net basis in the consolidated income statements.
The Company’s leases generally provide for rent escalations throughout the lease terms. For leases that provide for specific contractual escalations, rental revenue is recognized on a straight‑line basis so as to produce a constant periodic rent over the term of the lease. Accordingly, accrued rental revenue, calculated as the aggregate difference between the rental revenue recognized on a straight‑line basis and scheduled rents, represents unbilled rent receivables that the Company will receive only if the tenants make all rent payments required through the expiration of the lease. The Company provides an estimated reserve for uncollectible straight‑line rental revenue based on management’s assessment of the risks inherent in those lease contracts, giving consideration to industry default rates for long‑term receivables. There was $4.7 million and $1.5 million of accrued straight‑line rental revenue, net of allowances of $1.7 million and $0.5 million, at December 31, 2014 and 2013, respectively. Leases that have contingent rent escalators indexed to future increases in the Consumer Price Index (CPI) may adjust over a one‑year period or over multiple‑year periods. Generally, these escalators increase rent at the lesser of (a) 1 to 1.25 times the increase in the CPI over a specified period or (b) a fixed percentage. Because of the volatility and uncertainty with respect to future changes in the CPI, the Company’s inability to determine the extent to which any specific future change in the CPI is probable at each rent adjustment date during the entire term of these leases and the Company’s view that the multiplier does not represent a significant leverage factor, increases in rental revenue from leases with this type of escalator are recognized only after the changes in the rental rates have actually occurred.
For leases that have contingent rentals that are based on a percentage of the tenant’s gross sales, the Company recognizes contingent rental revenue when the threshold upon which the contingent lease payment is based is actually reached. Less than 1.5% of the Company’s investment portfolio is subject to leases that provide for contingent rent based on a percentage of the tenant’s gross sales.
The Company suspends revenue recognition if the collectibility of amounts due pursuant to a lease is not reasonably assured or if the tenant’s monthly lease payments become more than 60 days past due, whichever is earlier. The Company reviews its rent receivables for collectibility on a regular basis, taking into consideration changes in factors such as the tenant’s payment history, the financial condition of the tenant, business conditions in the industry in which the tenant operates and economic conditions in the area where the property is located. In the event that the collectibility of a receivable with respect to any tenant is in doubt, a provision for uncollectible amounts will be established or a direct write‑off of the specific rent receivable will be made. As of December 31, 2014 and 2013, the Company had no provision for uncollectible contractual rent payments due from tenants.
Loans Receivable
STORE Capital holds its loans receivable for long‑term investment. Loans receivable are carried at amortized cost, including related unamortized discounts or premiums, if any.
Revenue Recognition
The Company recognizes interest income on loans receivable using the effective-interest method applied on a loan‑by‑loan basis. Direct costs associated with originating loans are offset against any related fees received and the balance, along with any premium or discount, is deferred and amortized as an adjustment to interest income over the term of the related loan receivable using the effective interest method. A loan receivable is placed on nonaccrual status when the loan has become 60 days past due, or earlier if management determines that full recovery of the contractually specified payments of principal and interest is doubtful. While on nonaccrual status, interest income is recognized only when received. As of December 31, 2014 and 2013, there were no loans on nonaccrual status.
Impairment and Provision for Loan Losses
The Company periodically evaluates the collectibility of its loans receivable, including accrued interest, by analyzing the underlying property‑level economics and trends, collateral value and quality and other relevant factors in
59
determining the adequacy of its allowance for loan losses. A loan is determined to be impaired when, in management’s judgment based on current information and events, it is probable that the Company will be unable to collect all amounts due according to the contractual terms of the loan agreement. Specific allowances for loan losses are provided for impaired loans on an individual loan basis in the amount by which the carrying value exceeds the estimated fair value of the underlying collateral less disposition costs. There was no allowance for loan losses at December 31, 2014 and 2013.
Direct Financing Receivables
Certain of the Company’s real estate investment transactions are accounted for as direct financing leases. The Company records the direct financing receivables at their net investment, determined as the aggregate minimum lease payments and the estimated residual value of the leased property less unearned income. The unearned income is recognized over the life of the related contracts so as to produce a constant rate of return on the net investment in the asset.
Cash and Cash Equivalents
Cash and cash equivalents include cash and highly liquid investment securities with maturities at acquisition of three months or less. The Company invests cash primarily in money‑market funds of a major financial institution, consisting predominantly of U.S. Government obligations.
Restricted Cash and Escrow Deposits
The Company had $15.4 million and $12.5 million of restricted cash and deposits in escrow at December 31, 2014 and 2013, respectively.
Deferred Costs
Deferred costs consist principally of financing costs related to the issuance of the Company’s debt. Deferred financing costs are amortized as an increase to interest expense over the term of the related debt instrument using the effective interest method. Deferred costs also include lease origination costs, which are amortized as a decrease to rental revenue over the term of the respective lease.
Derivative Instruments and Hedging Activities
The Company may enter into derivatives contracts as part of its overall financing strategy to manage the Company’s exposure to changes in interest rates associated with current and/or future debt issuances. The Company does not use derivatives for trading or speculative purposes. The Company records its derivatives on the balance sheet at fair value as either an asset or liability. The accounting for changes in the fair value of derivatives depends on the intended use of the derivative, whether the Company has elected to apply hedge accounting and whether the hedging relationship has satisfied the criteria necessary to apply hedge accounting. Derivatives qualifying as a hedge of the exposure to variability in expected future cash flows, or other types of forecasted transactions, are considered cash flow hedges. Hedge accounting generally provides for the matching of the earnings effect of the hedged forecasted transactions in a cash flow hedge.
Share‑based Compensation
Certain directors and employees of the Company have been granted long‑term incentive awards, including restricted shares of the Company’s common stock and profits interests units issued by STORE Holding, which provide them with equity interests as an incentive to remain in the Company’s service and align executives’ interests with those of the Company’s equity holders.
The Company estimates the fair value of restricted stock at the date of grant and recognizes that amount in general and administrative expense ratably over the vesting period at the greater of the amount amortized on a straight‑line basis or the amount vested. The fair value of the restricted stock is based on the per‑share price of the common stock on the date of the grant. Prior to the Company’s IPO, the fair value was based on the per-share price of the common stock issued in the Company’s private equity offerings.
60
Income Taxes
As a REIT, the Company generally will not be subject to federal income tax; however, it is still subject to state and local income taxes and to federal income and excise tax on its undistributed income. STORE Investment Corporation is the Company’s wholly‑owned taxable REIT subsidiary (TRS) created to engage in non‑qualifying REIT activities. The TRS is subject to federal, state and local income taxes.
Net Income Per Common Share
Net income per common share has been computed pursuant to the guidance in the FASB ASC Topic 260, Earnings Per Share. The guidance requires the classification of the shares of the Company’s unvested restricted stock, which contain rights to receive non‑forfeitable dividends, as participating securities requiring the two‑class method of computing net income per common share. The following table is a reconciliation of the numerator and denominator used in the computation of basic and diluted net income per common share (dollars in thousands):
|
|
|
|
|
|
|
|
|
|
|
|
|
|
|
Year ended December 31, |
|
|||||||
|
|
|
2014 |
|
2013 |
|
2012 |
|
|||
|
Numerator: |
|
|
|
|
|
|
|
|
|
|
|
Net income |
|
$ |
48,139 |
|
$ |
26,313 |
|
$ |
8,176 |
|
|
Less: preferred stock dividends |
|
|
(59) |
|
|
(16) |
|
|
(16) |
|
|
Net income attributable to common stockholders |
|
|
48,080 |
|
|
26,297 |
|
|
8,160 |
|
|
Less: earnings attributable to unvested restricted shares |
|
|
(500) |
|
|
(294) |
|
|
(46) |
|
|
Net income used in basic and diluted income per share |
|
$ |
47,580 |
|
$ |
26,003 |
|
$ |
8,114 |
|
|
Denominator: |
|
|
|
|
|
|
|
|
|
|
|
Weighted average common shares outstanding |
|
|
78,924,475 |
|
|
50,216,017 |
|
|
27,412,533 |
|
|
Less: Weighted average number of shares of unvested restricted stock |
|
|
(469,876) |
|
|
(322,350) |
|
|
(74,481) |
|
|
Weighted average shares outstanding used in basic income per share |
|
|
78,454,599 |
|
|
49,893,667 |
|
|
27,338,052 |
|
|
Effects of dilutive securities: |
|
|
|
|
|
|
|
|
|
|
|
Add: Treasury stock method impact of unvested restricted shares (a) |
|
|
— |
|
|
— |
|
|
— |
|
|
Weighted average shares outstanding used in diluted income per share |
|
|
78,454,599 |
|
|
49,893,667 |
|
|
27,338,052 |
|
|
(a) |
For the years ended December 31, 2014, 2013 and 2012 excludes 89,625 shares, 43,654 shares and 9,218 shares, respectively, as the effect would have been antidilutive. |
Recent Accounting Pronouncements
From time to time, new accounting pronouncements are issued by the FASB or the U.S. Securities and Exchange Commission. The Company adopts the new pronouncements as of the specified effective date. When permitted, the Company may elect to early adopt the new pronouncements. Unless otherwise discussed, these new accounting pronouncements include technical corrections to existing guidance or introduce new guidance related to specialized industries or entities and therefore will have minimal, if any, impact on the Company’s financial position or results of operations upon adoption.
In April 2014, the FASB issued Accounting Standards Update (ASU) No. 2014‑08, Presentation of Financial Statements (Topic 205) and Property, Plant, and Equipment (Topic 360): Reporting Discontinued Operations and Disclosures of Disposals of Components of an Entity (ASU 2014‑08). This new guidance changes the criteria for reporting discontinued operations while enhancing disclosures in this area. Under the new guidance, only dispositions that represent a strategic shift in operations and have a major effect on the organization’s operations and financial results would be presented as discontinued operations. The new standard is effective, on a prospective basis, for all disposals or classifications as held for sale of components of an entity that occur within interim and annual periods beginning after December 15, 2014. Early adoption is permitted, but only for disposals or classifications as held for sale that have not
61
been reported in financial statements previously issued. The Company has chosen to early adopt ASU 2014‑08 effective January 1, 2014 and has applied the provisions prospectively. As a result of the adoption of this new guidance, the Company no longer presents the operating results of sold properties, which do not represent a strategic shift in operations, as part of discontinued operations on the statement of income. In implementing this guidance, the results of operations from properties sold or considered to be held for sale prior to adoption are still reported as part of discontinued operations.
In May 2014, the FASB issued ASU No. 2014‑09, Revenue from Contracts with Customers: Topic 606. This new guidance establishes a principles‑based approach for accounting for revenue from contracts with customers. Lease contracts covered by Topic 840, Leases, are excluded from the scope of this new guidance. This new standard is effective for public companies for annual reporting periods beginning after December 15, 2016 and early adoption is not permitted. The Company is currently evaluating the impact of this new standard on its financial position, results of operations and cash flows.
In August 2014, the FASB issued ASU No. 2014-15, Disclosure of Uncertainties about an Entity’s Ability to Continue as a Going Concern, which requires management to perform interim and annual assessments of an entity’s ability to continue as a going concern within one year of the date the financial statements are issued and provides guidance on determining when and how to disclose going concern uncertainties in the financial statements. Certain disclosures will be required if conditions give rise to substantial doubt about an entity’s ability to continue as a going concern. This new standard is effective for public companies for annual reporting periods beginning after December 15, 2016 and the Company does not expect that it will have an impact on its financial position, results of operations or cash flows.
3. Investments
At December 31, 2014, STORE Capital had investments in 947 property locations representing 937 owned properties (of which 11 are accounted for as direct financing receivables), six ground lease interests and four properties which secure mortgage loans. The gross acquisition cost of the real estate investments totaled $2.7 billion at December 31, 2014. In addition, the Company held loans and direct financing receivables with an aggregate carrying amount at December 31, 2014 of $111 million, for an aggregate portfolio totaling $2.8 billion in gross investment. A substantial portion of these investments are assets of consolidated special purpose entity subsidiaries and are pledged as collateral under the non‑recourse obligations of these special purpose entities (Note 4).
62
During 2012, 2013 and 2014, the Company had the following gross real estate and loan activity (dollars in thousands):
|
|
|
|
|
|
|
|
|
|
|
Number of |
|
Dollar |
|
|
|
|
|
Investment |
|
Amount of |
|
|
|
|
|
Locations |
|
Investments (a) |
|
|
|
Gross investments, December 31, 2011 |
|
112 |
|
$ |
235,778 |
|
|
Acquisition of and additions to real estate |
|
265 |
|
|
644,580 |
|
|
Investment in loans and direct financing receivables |
|
1 |
|
|
36,577 |
|
|
Sales of real estate (Note 9) |
|
(7) |
|
|
(5,148) |
|
|
Principal collections on loans and direct financing receivables |
|
|
|
|
(73) |
|
|
Other |
|
|
|
|
(10) |
|
|
Gross investments, December 31, 2012 |
|
371 |
|
|
911,704 |
|
|
Acquisition of and additions to real estate (b) |
|
267 |
|
|
811,248 |
|
|
Investment in loans and direct financing receivables |
|
2 |
|
|
33,647 |
|
|
Sales of real estate (Note 9) |
|
(17) |
|
|
(37,867) |
|
|
Principal collections on loans and direct financing receivables (b) |
|
(1) |
|
|
(8,113) |
|
|
Other |
|
|
|
|
(67) |
|
|
Gross investments, December 31, 2013 |
|
622 |
|
|
1,710,552 |
|
|
Acquisition of and additions to real estate (c)(d) |
|
328 |
|
|
1,085,816 |
|
|
Investment in loans and direct financing receivables |
|
15 |
|
|
52,636 |
|
|
Sales of real estate (Note 9) |
|
(16) |
|
|
(34,768) |
|
|
Principal collections on loans and direct financing receivables (c) |
|
(2) |
|
|
(8,145) |
|
|
Other |
|
|
|
|
(180) |
|
|
Gross investments, December 31, 2014 |
|
|
|
|
2,805,911 |
|
|
Less accumulated depreciation and amortization |
|
|
|
|
(98,671) |
|
|
Net investments, December 31, 2014 |
|
947 |
|
$ |
2,707,240 |
|
|
(a) |
The dollar amount of investments includes the investment in land, buildings, improvements and lease intangibles related to real estate investments as well as the carrying amount of the loans and direct financing receivables. |
|
(b) |
One loan receivable was repaid in full through a $7.9 million non‑cash transaction in which the Company acquired the underlying mortgaged property and leased it back to the borrower. |
|
(c) |
One mortgage loan receivable was repaid in full through a $1.9 million non‑cash transaction in which the Company acquired the two underlying mortgaged properties and leased them back to the borrower. |
|
(d) |
Includes $0.6 million of interest capitalized to properties under construction. |
63
The following table shows information regarding the diversification of the Company’s total investment portfolio among the different industries in which its tenants and borrowers operate as of December 31, 2014 (dollars in thousands):
|
|
|
|
|
|
|
|
|
|
|
|
|
|
|
|
|
|
Percentage of |
|
|
|
|
Number of |
|
Dollar |
|
Total Dollar |
|
|
|
|
|
Investment |
|
Amount of |
|
Amount of |
|
|
|
|
|
Locations |
|
Investments (a) |
|
Investments |
|
|
|
Restaurants |
|
464 |
|
$ |
788,512 |
|
28 |
% |
|
Industrial |
|
60 |
|
|
303,254 |
|
11 |
|
|
Health clubs |
|
39 |
|
|
225,501 |
|
8 |
|
|
Early childhood education centers |
|
119 |
|
|
220,165 |
|
8 |
|
|
Movie theaters |
|
26 |
|
|
194,133 |
|
7 |
|
|
Sporting goods stores |
|
15 |
|
|
122,627 |
|
4 |
|
|
Furniture stores |
|
20 |
|
|
111,623 |
|
4 |
|
|
Junior colleges |
|
9 |
|
|
66,956 |
|
2 |
|
|
All other service industries |
|
141 |
|
|
545,946 |
|
20 |
|
|
All other retail industries |
|
54 |
|
|
227,194 |
|
8 |
|
|
|
|
947 |
|
$ |
2,805,911 |
|
100 |
% |
|
(a) |
The dollar amount of investments includes the gross investment in land, buildings, improvements and lease intangibles related to real estate investments as well as the carrying amount of the loans and direct financing receivables. |
Significant Credit and Revenue Concentration
STORE Capital’s real estate investments are leased or financed to 226 customers geographically dispersed throughout 46 states. Only one state, Texas (13%), accounted for 10% or more of the total dollar amount of STORE Capital’s investment portfolio at December 31, 2014. None of the Company’s 226 customers represented more than 10% of the Company’s real estate investment portfolio at December 31, 2014, with the largest customer representing less than 4% of the total investment portfolio. On an annualized basis, this largest customer represented less than 4% of the Company’s total investment portfolio revenues as of December 31, 2014. The Company’s customers operate their businesses across 208 concepts and none of these concepts represented more than 4% of the Company’s annualized total investment portfolio revenues as of December 31, 2014.
Intangible Lease Assets
The following details intangible lease assets and related accumulated amortization at December 31 (in thousands):
|
|
|
|
|
|
|
|
|
|
|
|
2014 |
|
2013 |
|
||
|
In‑place lease assets |
|
$ |
47,359 |
|
$ |
26,641 |
(a) |
|
Ground lease interest assets |
|
|
7,299 |
|
|
3,814 |
|
|
Above-market lease assets |
|
|
5,526 |
|
|
— |
|
|
Total intangible lease assets |
|
|
60,184 |
|
|
30,455 |
|
|
Accumulated amortization |
|
|
(6,006) |
|
|
(1,459) |
(a) |
|
Net intangible lease assets |
|
$ |
54,178 |
|
$ |
28,996 |
|
|
(a) |
Includes the dollar amount of in‑place lease intangibles ($538,000) and the related accumulated amortization ($61,000) for the real estate investments held for sale at December 31, 2013. |
64
During the years ended December 31, 2014, 2013 and 2012, aggregate lease intangible amortization expense was $4.0 million, $1.3 million and $175,000, respectively. The amount amortized as a decrease to rental revenue for capitalized above‑market lease intangibles was $592,000 for the year ended December 31, 2014.
Based on the balance of intangible lease assets as of December 31, 2014, the aggregate amortization expense for the next five years is expected to be $4.8 million in 2015, $4.6 million in 2016, $4.5 million in 2017, $4.3 million in 2018, and $4.1 million in 2019, and the amount expected to be amortized as a decrease to rental revenue is $0.8 million for each of the next five years. The weighted average remaining amortization period is approximately 11 years for the in‑place lease intangibles, approximately 75 years for the amortizing ground lease interests and approximately six years for the above‑market lease intangibles.
Real Estate Investments
The Company’s investment properties are leased to tenants under long‑term operating leases that typically include one or more renewal options. The weighted average remaining noncancelable lease term at December 31, 2014 was approximately 15 years. Substantially all of the leases are triple‑net, which means that the lessees are responsible for the payment of all property operating expenses, including property taxes, maintenance and insurance; therefore, STORE Capital is generally not responsible for repairs or other capital expenditures related to the properties. At December 31, 2014, all of the properties were subject to a lease.
Scheduled future minimum rentals to be received under the remaining noncancelable term of the operating leases at December 31, 2014, are as follows (in thousands):
|
|
|
|
|
|
|
2015 |
|
$ |
226,708 |
|
|
2016 |
|
|
227,014 |
|
|
2017 |
|
|
227,018 |
|
|
2018 |
|
|
227,070 |
|
|
2019 |
|
|
227,095 |
|
|
Thereafter |
|
|
2,257,338 |
|
|
Total future minimum rentals |
|
$ |
3,392,243 |
|
Since lease renewal periods are exercisable at the option of the lessee, the preceding table presents future minimum lease payments due during the initial lease term only. In addition, the future minimum lease payments do not include any contingent rentals such as lease escalations based on future changes in CPI.
Loans and Direct Financing Receivables
At December 31, 2014, the Company held nine loans receivable with an aggregate carrying amount of $65.6 million and had $45.8 million of investments in transactions accounted for as direct financing leases. Eight of the loans are mortgage loans secured by land and/or buildings and improvements on the mortgaged property. The majority of the mortgage loans receivable require the borrowers to make monthly principal and interest payments based on a 40‑year amortization period with balloon payments, if any, at maturity. Two of the mortgage loans are shorter-term loans and require monthly interest‑only payments with a balloon payment at maturity. The remaining loan is secured by a tenant’s equipment and requires the borrower to make monthly principal and interest payments with a balloon payment at maturity.
65
The Company’s loans and direct financing receivables are summarized below (dollars in thousands):
|
|
|
|
|
|
|
|
|
|
|
|
|
|
|
|
|
|
|
|
Amount Outstanding |
|
||||
|
|
|
Stated Interest |
|
Maturity |
|
December 31, |
|
||||
|
Type |
|
Rate |
|
Date |
|
2014 |
|
2013 |
|
||
|
Mortgage loan receivable (a) |
|
8.25 |
% |
|
|
$ |
— |
|
$ |
1,939 |
|
|
Mortgage loan receivable |
|
8.50 |
% |
Jan. 2015 |
|
|
4,300 |
|
|
— |
|
|
Mortgage loan receivable |
|
9.09 |
% |
Jan. 2017 |
|
|
1,933 |
|
|
— |
|
|
Mortgage loan receivable |
|
8.35 |
% |
Jan. 2028 |
|
|
3,775 |
|
|
3,789 |
|
|
Mortgage loan receivable |
|
8.75 |
% |
Jul. 2032 |
|
|
23,998 |
|
|
24,119 |
|
|
Mortgage loan receivable |
|
9.00 |
% |
Mar. 2053 |
|
|
14,595 |
|
|
14,629 |
|
|
Mortgage loan receivable |
|
8.75 |
% |
Jun. 2053 |
|
|
6,357 |
|
|
6,376 |
|
|
Mortgage loan receivable |
|
8.50 |
% |
Jun. 2053 |
|
|
6,697 |
|
|
6,262 |
|
|
Mortgage loan receivable |
|
8.25 |
% |
Aug. 2053 |
|
|
3,337 |
|
|
3,349 |
|
|
Total mortgage loans receivable |
|
|
|
|
|
|
64,992 |
|
|
60,463 |
|
|
Equipment loan receivable |
|
12.00 |
% |
|
|
|
— |
|
|
1,000 |
|
|
Equipment loan receivable |
|
10.00 |
% |
Jan. 2015 |
|
|
94 |
|
|
161 |
|
|
Other secured loan receivable |
|
11.00 |
% |
|
|
|
— |
|
|
4,834 |
|
|
Total principal amount outstanding—loans receivable |
|
|
|
|
|
|
65,086 |
|
|
66,458 |
|
|
Unamortized loan origination costs |
|
|
|
|
|
|
497 |
|
|
459 |
|
|
Direct financing receivables |
|
|
|
|
|
|
45,771 |
|
|
— |
|
|
Total loans and direct financing receivables |
|
|
|
|
|
$ |
111,354 |
|
$ |
66,917 |
|
|
(a) |
Loan receivable was repaid in full through a non‑cash transaction in which the Company purchased the two underlying mortgaged properties and leased them back to the borrower. |
The long‑term mortgage loans receivable generally allow for prepayments in whole, but not in part, without penalty or with penalties ranging from 1% to 5%, depending on the timing of the prepayment. All other loans receivable allow for prepayments in whole or in part without penalty. Absent prepayments, scheduled maturities are expected to be as follows (in thousands):
|
|
|
|
|
|
|
|
|
|
|
|
|
|
|
Scheduled |
|
Balloon |
|
Total |
|
|||
|
|
|
Principal |
|
Payments |
|
Payments |
|
|||
|
2015 |
|
$ |
221 |
|
$ |
4,394 |
|
$ |
4,615 |
|
|
2016 |
|
|
226 |
|
|
— |
|
|
226 |
|
|
2017 |
|
|
246 |
|
|
1,933 |
|
|
2,179 |
|
|
2018 |
|
|
268 |
|
|
— |
|
|
268 |
|
|
2019 |
|
|
293 |
|
|
— |
|
|
293 |
|
|
Thereafter |
|
|
33,636 |
|
|
23,869 |
|
|
57,505 |
|
|
Total principal repayments |
|
$ |
34,890 |
|
$ |
30,196 |
|
$ |
65,086 |
|
The components of the investments accounted for as direct financing receivables as of December 31, 2014 were as follows (in thousands):
|
|
|
|
|
|
|
Minimum lease payments receivable |
|
$ |
119,552 |
|
|
Estimated residual value of leased assets |
|
|
4,553 |
|
|
Unearned income |
|
|
(78,334) |
|
|
Net investment |
|
$ |
45,771 |
|
4. Debt
Credit Facility
On September 19, 2014, the Company entered into a new $300 million unsecured revolving credit facility with
66
a group of lenders, which replaced the Company’s previous two secured credit facilities that aggregated $300 million. This facility is used to partially fund real estate acquisitions pending the issuance of long‑term, fixed‑rate debt.
The new facility, which includes an accordion feature that allows the size of the facility to be increased up to $500 million, is for an initial term of three years and includes a one‑year extension option subject to certain conditions and the payment of a 0.2% extension fee. The facility is recourse to the Company and includes a guaranty from STORE Capital Acquisitions, LLC, one of the Company’s direct wholly‑owned subsidiaries. Borrowings under this facility require monthly payments of interest at a rate selected by the Company of either (1) one‑month LIBOR plus a credit spread ranging from 1.75% to 2.50%, or (2) the Base Rate, as defined in the agreement, plus a credit spread ranging from 0.75% to 1.50%. The credit spread used is based on the Company’s leverage ratio. The Company must also pay a 0.25% non‑use fee on the unused portion of the facility. Borrowing availability under the facility is limited to 50% of the value of the Company’s eligible unencumbered assets at any point in time. At December 31, 2014, the Company had no borrowings outstanding and a pool of eligible unencumbered assets aggregating approximately $900 million.
The Company is subject to various financial and nonfinancial covenants under this unsecured credit facility including a maximum leverage of 65%, minimum EBITDA to fixed charges ratio of 1.5 to 1, minimum consolidated net worth of $600 million plus 75% of any additional equity raised after September 2014, and a maximum dividend payout ratio limited to 95% of Funds from Operations, all as defined in the agreement. As of December 31, 2014, the Company was in compliance with these covenants.
Prior to September 19, 2014, the Company had two bank credit facilities that were secured by real estate properties which were pledged as collateral under the facilities as well as the Company’s equity interests in certain of its special purpose entity subsidiaries and the Company’s holdings of the Class B notes issued under its STORE Master Funding debt program (see below). One of the secured credit facilities consisted of two parts: a primary two‑year $150 million credit line (bearing interest at one‑month LIBOR plus 2.45%), which was expandable to $250 million under certain circumstances, and a one‑year $50 million credit line (bearing interest at one‑month LIBOR plus 2.95%). The Company’s other previous secured credit facility was a three‑year $100 million facility (bearing interest at one‑month LIBOR plus 3.00%), with an accordion feature to increase the facility amount up to $150 million under certain circumstances.
The financing costs related to the establishment of the Company’s credit facilities are deferred and amortized to interest expense over the term of the credit facilities. The Company accelerated the amortization of the remaining deferred financing costs related to the two previous credit facilities upon their termination in September 2014. The amount accelerated totaled $1.2 million and is included in interest expense. At December 31, 2014 and 2013, unamortized financing costs related to the Company’s credit facilities totaled $2.4 million and $2.1 million, respectively.
Non‑Recourse Debt Obligations of Consolidated Special Purpose Entities
During 2012, the Company implemented a debt issuance program pursuant to which certain of its consolidated special purpose entities issue multiple series of non‑recourse net‑lease mortgage notes from time to time that are collateralized by the assets owned by these entities and their related leases (collateral). One of the principal features of the program is that, as additional series of notes are issued, new collateral is contributed to the collateral pool thereby increasing the size and diversity of the collateral pool for the benefit of all noteholders, including those who invested in prior series. Another feature of the program is the ability to substitute collateral from time to time subject to meeting certain prescribed conditions and criteria. The notes are generally segregated into Class A amortizing notes and Class B non‑amortizing notes. The Company has retained each of the Class B notes which aggregate $78 million at December 31, 2014.
The Class A notes require monthly principal and interest payments with a balloon payment due at maturity and these notes may be prepaid at any time, subject to a yield maintenance prepayment premium. As of December 31, 2014, the aggregate collateral pool securing the net‑lease mortgage notes is comprised primarily of single tenant commercial real estate properties with an aggregate gross investment amount of approximately $1.5 billion.
A number of additional consolidated special purpose entity subsidiaries of the Company have financed their owned real estate properties with traditional first mortgage debt. The notes require monthly principal and interest
67
payments with balloon payments at maturity. In general, these mortgage notes payable can be prepaid in whole or in part upon payment of a yield maintenance premium. The mortgage notes payable are collateralized by real estate properties owned by these consolidated special purpose entity subsidiaries with an aggregate gross investment amount of approximately $327 million at December 31, 2014.
The mortgage notes payable, which are obligations of consolidated special purpose entities as described in Note 2, contain various covenants customarily found in mortgage notes, including a limitation on the issuing entity’s ability to incur additional indebtedness on the underlying real estate. Although this mortgage debt generally is non‑recourse, there are customary limited exceptions to recourse for matters such as fraud, misrepresentation, gross negligence or willful misconduct, misapplication of payments, bankruptcy and environmental liabilities. Certain of the mortgage notes payable also require the posting of cash reserves with the lender or trustee if specified coverage ratios are not maintained by the Company or one of its tenants.
Financing costs related to the issuance of the non‑recourse debt obligations are deferred and amortized to interest expense over the terms of the related notes. As of December 31, 2014 and 2013, unamortized financing costs related to all non‑recourse debt obligations totaled $30.9 million and $26.9 million, respectively.
The non‑recourse debt obligations of consolidated special purpose entity subsidiaries are summarized below (dollars in thousands):
|
|
|
|
|
|
|
|
|
|
|
|
|
|
|
|
|
|
Coupon |
|
Outstanding Balance |
|
||||
|
|
|
Maturity |
|
Interest |
|
December 31, |
|
||||
|
|
|
Date |
|
Rate |
|
2014 |
|
2013 |
|
||
|
Non‑recourse net‑lease mortgage notes: |
|
|
|
|
|
|
|
|
|
|
|
|
Series 2012‑1, Class A |
|
Aug. 2019 |
|
5.77 |
% |
$ |
207,503 |
|
$ |
210,612 |
|
|
Series 2013‑1, Class A‑1 |
|
Mar. 2020 |
|
4.16 |
% |
|
145,876 |
|
|
148,274 |
|
|
Series 2013‑2, Class A‑1 |
|
Jul. 2020 |
|
4.37 |
% |
|
104,740 |
|
|
106,352 |
|
|
Series 2013‑3, Class A‑1 |
|
Nov. 2020 |
|
4.24 |
% |
|
75,767 |
|
|
76,907 |
|
|
Series 2014‑1, Class A‑1 |
|
Apr. 2021 |
|
4.21 |
% |
|
119,650 |
|
|
— |
|
|
Series 2013‑1, Class A‑2 |
|
Mar. 2023 |
|
4.65 |
% |
|
99,196 |
|
|
100,827 |
|
|
Series 2013‑2, Class A‑2 |
|
Jul. 2023 |
|
5.33 |
% |
|
94,951 |
|
|
96,412 |
|
|
Series 2013‑3, Class A‑2 |
|
Nov. 2023 |
|
5.21 |
% |
|
98,398 |
|
|
99,880 |
|
|
Series 2014‑1, Class A‑2 |
|
Apr. 2024 |
|
5.00 |
% |
|
139,592 |
|
|
— |
|
|
Non‑recourse mortgage notes payable: |
|
|
|
|
|
|
|
|
|
|
|
|
$21,443 note issued July 2005 (a) |
|
Aug. 2015 |
|
5.26 |
% (a) |
|
18,956 |
|
|
— |
|
|
$4,000 note issued August 2006 (b) |
|
Sept. 2016 |
|
6.33 |
% (b) |
|
3,326 |
|
|
3,428 |
|
|
$3,800 note issued September 2006 (c) |
|
Oct. 2016 |
|
6.47 |
% (c) |
|
3,512 |
|
|
— |
|
|
$7,088 note issued April 2007 (d) |
|
May 2017 |
|
6.00 |
% (d) |
|
6,676 |
|
|
6,776 |
|
|
$4,400 note issued August 2007 (e) |
|
Sept. 2017 |
|
6.7665 |
% (e) |
|
3,807 |
|
|
— |
|
|
$8,000 note issued January 2012; assumed in December 2013 |
|
Jan. 2018 |
|
4.778 |
% |
|
7,511 |
|
|
7,775 |
|
|
$20,530 note issued December 2011 and amended February 2012 |
|
Jan. 2019 |
|
5.275 |
% (f) |
|
19,317 |
|
|
19,758 |
|
|
$6,500 note issued December 2012 |
|
Dec. 2019 |
|
4.806 |
% |
|
6,207 |
|
|
6,351 |
|
|
$2,823 note issued December 2012 |
|
|
|
|
|
|
— |
|
|
2,749 |
|
|
$2,956 note issued June 2013 |
|
Jun. 2020 |
|
3.154 |
% (g) |
|
2,827 |
|
|
2,907 |
|
|
$16,100 note issued February 2014 |
|
Mar. 2021 |
|
4.83 |
% |
|
15,857 |
|
|
— |
|
|
$13,000 note issued May 2012 |
|
May 2022 |
|
5.195 |
% |
|
12,326 |
|
|
12,599 |
|
|
$14,950 note issued July 2012 |
|
Aug. 2022 |
|
4.95 |
% |
|
13,863 |
|
|
14,547 |
|
|
$26,000 note issued August 2012 |
|
Sept. 2022 |
|
5.05 |
% |
|
24,805 |
|
|
25,353 |
|
|
$6,400 note issued November 2012 |
|
Dec. 2022 |
|
4.707 |
% |
|
6,127 |
|
|
6,267 |
|
|
$11,895 note issued March 2013 |
|
Apr. 2023 |
|
4.7315 |
% |
|
11,478 |
|
|
11,733 |
|
|
$17,500 note issued August 2013 |
|
Sept. 2023 |
|
5.46 |
% |
|
17,091 |
|
|
17,420 |
|
|
$10,075 note issued March 2014 |
|
Apr. 2024 |
|
5.10 |
% |
|
9,984 |
|
|
— |
|
|
$7,750 note issued February 2013 |
|
Mar. 2038 |
|
4.81 |
% (h) |
|
7,468 |
|
|
7,633 |
|
|
$6,944 notes issued March 2013 |
|
Apr. 2038 |
|
4.50 |
% (i) |
|
6,684 |
|
|
6,842 |
|
|
|
|
|
|
|
|
|
1,283,495 |
|
|
991,402 |
|
|
Unamortized net premium |
|
|
|
|
|
|
656 |
|
|
175 |
|
|
Total non‑recourse debt obligations of consolidated special purpose entities |
|
|
|
|
|
$ |
1,284,151 |
|
$ |
991,577 |
|
68
|
(a) |
Note was assumed in June 2014 at a premium; estimated effective yield at assumption of 3.69%. |
|
(b) |
Note was assumed in July 2012 at a premium; estimated effective yield at assumption of 5.15%. |
|
(c) |
Note was assumed in April 2014 at a premium; estimated effective yield at assumption of 3.88%. |
|
(d) |
Note was assumed in December 2013 at a premium; estimated effective yield at assumption of 4.45%. |
|
(e) |
Note was assumed in September 2014 at a premium; estimated effective yield at assumption of 3.40%. |
|
(f) |
Note is a variable‑rate note which resets monthly at 1‑month LIBOR + 3.50%. The Company has entered into two interest rate swap agreements that effectively convert the floating rate on a $12.7 million portion and a $6.6 million portion of this mortgage note payable to fixed rates of 5.299% and 5.230%, respectively (Note 5). |
|
(g) |
Note is a variable‑rate note which resets monthly at 1‑month LIBOR + 3.00%; rate shown is effective rate at December 31, 2014. |
|
(h) |
Interest rate is effective for first 10 years and will reset to greater of (1) initial rate plus 400 basis points or (2) Treasury rate plus 400 basis points. |
|
(i) |
Interest rate is effective for first 10 years and will reset to the lender’s then prevailing interest rate. |
As of December 31, 2014, the scheduled maturities, including balloon payments, on the non‑recourse debt obligations during the next five years and thereafter are as follows (in thousands):
|
|
|
|
|
|
|
|
|
|
|
|
|
|
|
Scheduled |
|
Balloon |
|
|
|
|
||
|
|
|
Principal |
|
Payments |
|
Total |
|
|||
|
2015 |
|
$ |
19,191 |
|
$ |
18,710 |
|
$ |
37,901 |
|
|
2016 |
|
|
19,789 |
|
|
6,549 |
|
|
26,338 |
|
|
2017 |
|
|
20,517 |
|
|
9,921 |
|
|
30,438 |
|
|
2018 |
|
|
21,071 |
|
|
6,665 |
|
|
27,736 |
|
|
2019 |
|
|
19,766 |
|
|
213,539 |
|
|
233,305 |
|
|
Thereafter |
|
|
50,847 |
|
|
876,930 |
|
|
927,777 |
|
|
|
|
$ |
151,181 |
|
$ |
1,132,314 |
|
$ |
1,283,495 |
|
5. Derivative Instruments and Hedging Activities
As of December 31, 2014, the Company had entered into two interest rate swap agreements with current notional amounts of $12.7 million and $6.6 million that were designated as cash flow hedges associated with the Company’s secured, variable‑rate mortgage note payable due 2019 (Note 4). The aggregate fair value of the interest rate swaps at December 31, 2014 and 2013 was a liability of $266,000 and $128,000, respectively, and is included in liabilities on the consolidated balance sheets.
The effective portion of changes in the fair value of derivatives designated and that qualify as cash flow hedges is recorded in accumulated other comprehensive loss. Amounts reported in accumulated other comprehensive loss related to cash flow hedges will be reclassified to interest expense as interest payments are made on the hedged debt transaction. During 2014, $457,000 of unrealized losses and, during 2013, $414,000 of unrealized gains and, during 2012, $911,000 of unrealized losses were recorded in accumulated other comprehensive loss. During 2014, 2013 and 2012, $319,000, $319,000 and $306,000, respectively, were reclassified to operations as an increase to interest expense. During the next 12 months, the Company estimates that $274,000 will be reclassified as an increase to interest expense. The ineffective portion of the change in fair value of derivatives is recognized directly in earnings. No hedge ineffectiveness was recognized during the years ended December 31, 2014, 2013 or 2012.
The Company has an agreement with its derivative counterparty containing a provision that, if the Company defaults on any of its indebtedness, including default where repayment of the indebtedness has not been accelerated by the lender, the Company could also be declared in default on its derivative obligations.
As of December 31, 2014, the termination value of the Company’s derivatives was a liability position of $308,000 which includes accrued interest but excludes any adjustment for nonperformance risk.
69
6. Income Taxes
The Company’s total current income tax expense from continuing operations was as follows (in thousands):
|
|
|
|
|
|
|
|
|
|
|
|
|
|
|
Year ended December 31, |
|
|||||||
|
|
|
2014 |
|
2013 |
|
2012 |
|
|||
|
Federal income tax |
|
$ |
— |
|
$ |
— |
|
$ |
(2) |
|
|
State income tax |
|
|
180 |
|
|
155 |
|
|
72 |
|
|
Total current income tax expense |
|
$ |
180 |
|
$ |
155 |
|
$ |
70 |
|
During 2013, $853,000 of federal income tax and $132,000 of state income tax, were attributable to discontinued operations (Note 9) of the Company’s taxable REIT subsidiary. There was no current income tax expense attributable to discontinued operations for the years ended December 31, 2014 and 2012. The Company’s deferred income tax expense was immaterial for the years ended December 2014, 2013 and 2012. The ending balance in deferred tax assets and liabilities was immaterial at December 31, 2014 and 2013.
The Company files federal, state and local income tax returns. All returns filed since the Company’s inception in 2011 remain subject to examination. The Company has net operating loss carryforwards (NOLs) for income tax purposes of $1.5 million at December 31, 2014, 2013 and 2012. These losses are available to reduce future REIT taxable income until they expire in 2031. At this time, the Company does not believe it is likely it will use the NOLs to reduce future taxable income; therefore, any deferred tax asset associated with such NOLs has been fully reserved.
Management of the Company determines whether any tax positions taken or expected to be taken meet the “more‑likely‑than‑not” threshold of being sustained by the applicable federal, state or local tax authority. As of December 31, 2014 and 2013, management concluded that there is no tax liability relating to uncertain income tax positions. The Company’s policy is to recognize interest related to any underpayment of income taxes as interest expense and to recognize any penalties as operating expenses. There was no accrual for interest or penalties at December 31, 2014 and 2013.
For federal income tax purposes, distributions can consist of ordinary income dividends, capital gain dividends, return of capital, or a combination thereof. For the year ended December 31, 2014, preferred dividends of $14,000 paid in 2014 were characterized for tax as $13,000 of ordinary income and $1,000 of capital gain. For the years ended December 31, 2013 and 2012, preferred dividends of $16,000 paid in each year were characterized for tax as ordinary income.
The Company’s common stock distributions declared were characterized for tax as follows (in thousands):
|
|
|
|
|
|
|
|
|
|
|
|
|
|
|
Year ended December 31, |
|
|||||||
|
|
|
2014 |
|
2013 |
|
2012 |
|
|||
|
Ordinary income |
|
$ |
56,887 |
|
$ |
33,602 |
|
$ |
10,333 |
|
|
Capital gain |
|
|
4,109 |
|
|
— |
|
|
18 |
|
|
Return of capital |
|
|
3,127 |
|
|
12,958 |
|
|
— |
|
|
Total |
|
$ |
64,123 |
|
$ |
46,560 |
|
$ |
10,351 |
|
For tax purposes, $13.0 million of the 2014 distributions declared will be treated as distributions in 2015 and $1.9 million of the 2012 distributions declared were treated as distributions in 2013. In addition, $500,000, $294,000 and $46,000 of the distributions declared in 2014, 2013 and 2012, respectively, were treated as compensation to holders of unvested restricted stock.
7. Stockholders’ Equity
On November 3, 2014, the Company’s board of directors declared a 1.67‑for‑one split of its common stock effected through a dividend to its stockholders. The stock dividend was treated as a stock split for accounting purposes; the $0.01 par value of the common stock was unchanged.
70
During 2014 and prior to the IPO, the Company issued approximately 20.2 million common shares related to the contribution of the remaining $290.4 million equity commitment from its parent, STORE Holding. As of December 31, 2014 and 2013, STORE Holding held 82,802,026 and 62,594,268 common shares, respectively.
On November 21, 2014, the Company completed its IPO of 31,625,000 shares of common stock, including 4,125,000 shares of common stock sold in connection with the full exercise of the underwriters’ option to purchase additional shares, at a public offering price of $18.50 per share. The Company received $545.8 million in proceeds, net of both underwriters’ discount and offering expenses, in connection with the offering.
The Company declared dividends payable to common stockholders totaling $77.7 million, $45.0 million and $12.2 million during the years ended December 31, 2014, 2013 and 2012, respectively. The 2014 dividends include a pro-rated dividend per common share of $0.1139, or $1.00 per share on an annualized basis, for the period since the closing of the IPO through December 31, 2014, which was paid in January 2015. On December 31, 2014, there were 115,212,541 shares of common stock outstanding, including 31,625,000 shares issued pursuant to the initial public offering, 82,802,026 shares held by STORE Holding, and 785,515 shares granted under the Company’s long-term incentive plans (Note 8).
The Company issued 125 shares of 12.5% Series A Cumulative Non‑Voting Preferred Stock (Preferred Stock) at a price of $1,000 per share on January 6, 2012. On November 21, 2014, immediately following the closing of its IPO, the Company elected to redeem all 125 shares of its Preferred Stock for a redemption price of $1,000 per share plus accrued and unpaid dividends. During the years ended December 31, 2014, 2013 and 2012, the Company paid dividends on the Preferred Stock of $14,000, $16,000 and $16,000, respectively.
8. Long‑Term Incentive Plans
In June 2012, the Company’s Board of Directors established the STORE Capital Corporation 2012 Long‑Term Incentive Plan (the 2012 Plan) which permits the issuance of up to 1,035,400 shares of common stock. The 2012 Plan allows for awards of restricted shares of the Company’s common stock and other awards and performance‑based grants to officers, directors and key employees of the Company. As of December 31, 2014, 249,885 shares remain available for grant under the 2012 Plan.
The following table summarizes the restricted common stock activity under the 2012 Plan:
|
|
|
|
|
|
|
|
|
|
|
|
|
|
|
|
|
|
|
|
|
2014 |
|
2013 |
|
2012 |
|
|||||||||
|
|
|
|
|
Weighted |
|
|
|
Weighted |
|
|
|
Weighted |
|
|||
|
|
|
Number of |
|
Average Share |
|
Number of |
|
Average Share |
|
Number of |
|
Average Share |
|
|||
|
|
|
Shares |
|
Price (1) |
|
Shares |
|
Price (1) |
|
Shares |
|
Price (1) |
|
|||
|
Outstanding non‑vested shares, beginning of year |
|
336,203 |
|
$ |
13.59 |
|
145,776 |
|
$ |
11.98 |
|
— |
|
$ |
— |
|
|
Shares granted |
|
416,403 |
|
$ |
17.35 |
|
228,804 |
|
$ |
14.37 |
|
145,776 |
|
$ |
11.98 |
|
|
Shares vested |
|
(93,160) |
|
$ |
13.44 |
|
(36,449) |
|
$ |
11.98 |
|
— |
|
$ |
— |
|
|
Shares forfeited |
|
(3,540) |
|
$ |
14.30 |
|
(1,928) |
|
$ |
14.14 |
|
— |
|
$ |
— |
|
|
Outstanding non‑vested shares, end of year |
|
655,906 |
|
$ |
16.00 |
|
336,203 |
|
$ |
13.59 |
|
145,776 |
|
$ |
11.98 |
|
|
(1) |
Grant date fair value |
The Company estimates the fair value of restricted stock at the date of grant and recognizes that amount in expense over the vesting period as the greater of the amount amortized on a straight‑line basis or the amount vested. Prior to the Company’s IPO, the fair value was based on the per-share price of the common stock issued in the Company’s private equity offerings. Subsequent to the IPO, the fair value of the restricted stock is based on the per‑share market closing price of the Company’s common stock on the date of the grant. Generally, restricted shares granted vest in 25% increments in February of each year. Certain directors receive annual grants that vest at the end of each term served. Compensation expense for share‑based payments totaled $2.3 million, $1.2 million and $356,000 for
71
the years ended December 31, 2014, 2013 and 2012, respectively, and is included in general and administrative expenses.
Due to a historically low turnover rate, the Company does not estimate a forfeiture rate for non-vested shares. Accordingly, unexpected forfeitures will lower share-based compensation expense during the applicable period. Under the terms of the 2012 Plan, the Company pays non-refundable dividends to the holders of non-vested shares. Applicable accounting guidance requires that the dividends paid to holders of these non-vested shares be charged as compensation expense to the extent that they relate to non-vested shares that do not or are not expected to vest. At December 31, 2014, STORE Capital had $8.9 million of unrecognized compensation cost related to non‑vested share‑based compensation arrangements which will be recognized through February 2019.
In November 2014, the Company’s Board of Directors approved the adoption of the STORE Capital Corporation 2015 Omnibus Equity Incentive Plan (the 2015 Plan), which permits the issuance of up to 6,903,076 shares of common stock, which represented 6% of the number of issued and outstanding shares of the Company’s common stock upon the completion of the IPO. The 2015 Plan allows for awards of restricted shares of the Company’s common stock and other awards and performance‑based grants to officers, directors and key employees of the Company. As of December 31, 2014, no awards had been issued under the 2015 Plan.
9. Income from Discontinued Operations
Periodically, the Company may sell real estate properties it owns. Effective January 1, 2014, the Company has early adopted ASU 2014‑08 (Note 2) and will apply the provisions prospectively. Under ASU 2014‑08, only disposals representing a strategic shift in operations of the Company and that have (or will have) a major effect on the Company’s operations and financial results are to be presented as discontinued operations. The Company is required to continue to classify any property disposal or property classified as held for sale as of December 31, 2013 as discontinued operations prospectively; therefore, the gains and losses from these property dispositions and all operations from these properties were reclassified to discontinued operations, net of tax, in the consolidated statements of income. This presentation has no impact on net income or cash flow. The Company did not classify any additional property disposals as discontinued operations subsequent to December 31, 2013.
All amounts reclassified to discontinued operations during the years ended December 31, 2014, 2013 and 2012, relate to assets that had been classified as held for sale prior to the Company’s adoption of ASU 2014‑08. Amounts reclassified to discontinued operations are summarized below (in thousands):
|
|
|
|
|
|
|
|
|
|
|
|
|
|
|
Year ended December 31, |
|
|||||||
|
|
|
2014 |
|
2013 |
|
2012 |
|
|||
|
Revenues |
|
$ |
157 |
|
$ |
2,425 |
|
$ |
853 |
|
|
Expenses: |
|
|
|
|
|
|
|
|
|
|
|
General and administrative |
|
|
2 |
|
|
17 |
|
|
7 |
|
|
Depreciation and amortization |
|
|
— |
|
|
575 |
|
|
147 |
|
|
Total expenses |
|
|
2 |
|
|
592 |
|
|
154 |
|
|
Income from discontinued real estate investments |
|
|
155 |
|
|
1,833 |
|
|
699 |
|
|
Gain on the dispositions of real estate investments |
|
|
985 |
|
|
3,147 |
|
|
180 |
|
|
Income tax expense |
|
|
— |
|
|
(985) |
|
|
— |
|
|
Income from discontinued operations, net of tax |
|
$ |
1,140 |
|
$ |
3,995 |
|
$ |
879 |
|
10. Commitments and Contingencies
In the normal course of business, the Company enters into various types of commitments to purchase real estate properties. These commitments are generally subject to the Company’s customary due diligence process and, accordingly, a number of specific conditions must be met before the Company is obligated to purchase the properties. At the time the Company purchases a property, the Company may also agree to fund future improvements to the property. As of December 31, 2014, the Company had approximately $33.9 million in commitments to fund improvements to real estate properties previously acquired which will generally result in increases to the rental revenue due under the related contracts.
72
The Company entered into a lease agreement with an unrelated third party for its corporate office space that will expire in June 2018. During the years ended December 31, 2014, 2013 and 2012, total rent expense was $252,000, $220,000 and $220,000, respectively. At December 31, 2014, the Company’s future minimum rental commitments under all noncancelable operating leases was approximately $290,000 in 2015, $300,000 in 2016, $313,000 in 2017 and $158,000 in 2018.
The Company has had employment agreements with its executive officers since its formation in May 2011. In connection with the closing of the IPO on November 21, 2014, the Company entered into new employment agreements with each of its executive officers, which have a term of four years. The agreements provide for minimum annual base salaries and annual incentive compensation based on the satisfactory achievement of reasonable performance criteria and objectives to be adopted by the Company’s Board of Directors each year. In addition, each officer is eligible to receive equity awards as determined by the Company’s Board of Directors under the 2015 Plan. In the event an executive officer is terminated without cause or terminates employment for good reason, the Company is liable for a lump‑sum severance payment in an amount equal to, in the case of the Company’s Chief Executive Officer, the sum of (i) two times his base salary and (ii) two times the target cash bonus for which he was eligible in the prior fiscal year (whether or not received); and, in the case of the Company’s other executive officers, the sum of (i) 1.5 times his or her base salary and (ii) 1.5 times the target cash bonus for which he or she was eligible in the prior fiscal year (whether or not received); plus, in the case of all executive officers, certain other specified termination benefits. In the event of a termination without cause, as defined in the employment agreements, the executive officer is entitled to immediate vesting of any and all outstanding unvested shares of the Company’s restricted stock that he or she has been awarded as part of the Company’s incentive compensation program.
In October 2011, the Company adopted a defined contribution retirement savings plan qualified under Section 401(a) of the Internal Revenue Code (the 401(k) Plan). The 401(k) Plan is available to employees who have completed at least six consecutive months of service or, if earlier, one year of service with the Company. STORE Capital provides a matching contribution in cash, up to a maximum of 4% of compensation, which vests immediately. The matching contributions made by the Company totaled approximately $258,000 in 2014, $160,000 in 2013 and $109,000 in 2012.
11. Fair Value Measurements
Fair value is defined as the price that would be received to sell an asset or paid to transfer a liability in an orderly transaction between market participants at the measurement date (an exit price). The hierarchy described below prioritizes inputs to the valuation techniques used in measuring the fair value of assets and liabilities. This hierarchy maximizes the use of observable inputs and minimizes the use of unobservable inputs by requiring the most observable inputs to be used when available. The hierarchy is broken down into three levels based on the reliability of inputs as follows:
|
· |
Level 1—Quoted market prices in active markets for identical assets and liabilities that the Company has the ability to access. |
|
· |
Level 2—Significant inputs that are observable, either directly or indirectly. These types of inputs would include quoted prices for similar assets or liabilities in active markets, quoted prices for identical assets in inactive markets and market‑corroborated inputs. |
|
· |
Level 3—Inputs that are unobservable and significant to the overall fair value measurement of the assets or liabilities. These types of inputs include the Company’s own assumptions. |
The assets and liabilities that are required to be measured at fair value in the Company’s consolidated financial statements are summarized below.
73
The following table sets forth the Company’s financial liabilities that were accounted for at fair value on a recurring basis (in thousands):
|
|
|
|
|
|
|
|
|
|
|
|
|
|
|
|
|
|
|
|
|
Fair Value Hierarchy Level |
|
|||||||
|
|
|
Fair Value |
|
Level 1 |
|
Level 2 |
|
Level 3 |
|
||||
|
December 31, 2014 |
|
|
|
|
|
|
|
|
|
|
|
|
|
|
Derivatives: |
|
|
|
|
|
|
|
|
|
|
|
|
|
|
Interest rate swaps |
|
$ |
266 |
|
$ |
— |
|
$ |
266 |
|
$ |
— |
|
|
December 31, 2013 |
|
|
|
|
|
|
|
|
|
|
|
|
|
|
Derivatives: |
|
|
|
|
|
|
|
|
|
|
|
|
|
|
Interest rate swaps |
|
$ |
128 |
|
$ |
— |
|
$ |
128 |
|
$ |
— |
|
Derivatives are measured under a market approach, using prices obtained from a nationally recognized pricing service and pricing models with market observable inputs such as interest rates and equity index levels. These measurements are classified as Level 2 within the fair value hierarchy. At December 31, 2014 and 2013, the fair value of the derivative instruments was a liability and is included in liabilities on the consolidated balance sheets.
In addition to the disclosures for assets and liabilities required to be measured at fair value at the balance sheet date, companies are required to disclose the estimated fair values of all financial instruments, even if they are not carried at their fair value. The fair values of financial instruments are estimates based upon market conditions and perceived risks at December 31, 2014 and 2013. These estimates require management’s judgment and may not be indicative of the future fair values of the assets and liabilities.
Financial assets and liabilities for which the carrying values approximate their fair values include cash and cash equivalents, restricted cash and escrow deposits, accounts receivable, accounts payable and tenant deposits. Generally these assets and liabilities are short‑term in duration and are recorded at fair value on the consolidated balance sheets. The Company believes that the carrying value of the borrowings on its credit facility approximate fair value based upon their nature, terms and variable interest rate. Additionally, the Company believes the carrying values of its fixed‑rate loan receivables approximate fair values based on market quotes for comparable instruments or discounted cash flow analysis using estimates of the amount and timing of future cash flows, market rates and credit spreads.
The estimated fair values of the non‑recourse debt obligations of consolidated special purpose entities have been derived based on market observable inputs such as interest rates and discounted cash flow analyses using estimates of the amount and timing of future cash flows, market rates and credit spreads. These measurements are classified as Level 2 of the fair value hierarchy. At December 31, 2014, the Company’s non‑recourse debt obligations had a carrying value of $1,284.2 million and an estimated fair value of $1,349.0 million. At December 31, 2013, the Company’s non‑recourse debt obligations had a carrying value of $991.6 million and an estimated fair value of $1.0 billion.
12. Supplemental Cash Flow Information
The following schedule summarizes the Company’s supplemental disclosure of noncash investing and financing activities and other cash flow information for the years ended December 31, 2014, 2013 and 2012 (in thousands):
|
|
|
|
|
|
|
|
|
|
|
|
|
|
|
2014 |
|
2013 |
|
2012 |
|
|||
|
Supplemental disclosure of noncash investing and financing activities: |
|
|
|
|
|
|
|
|
|
|
|
Accrued tenant improvement advances included in real estate investments |
|
$ |
12,081 |
|
$ |
— |
|
$ |
— |
|
|
Purchase of collateral properties securing a mortgage note receivable |
|
|
1,939 |
|
|
7,875 |
|
|
— |
|
|
Non‑recourse debt obligations assumed in conjunction with acquisition of property |
|
|
27,457 |
|
|
14,911 |
|
|
3,711 |
|
|
Accrued financing costs |
|
|
157 |
|
|
— |
|
|
— |
|
|
Accrued offering costs |
|
|
791 |
|
|
— |
|
|
— |
|
|
|
|
|
|
|
|
|
|
|
|
|
|
Supplemental disclosure of cash flow information: |
|
|
|
|
|
|
|
|
|
|
|
Cash paid during the period for interest, net of amounts capitalized |
|
$ |
60,431 |
|
$ |
33,972 |
|
$ |
8,757 |
|
|
Cash paid during the period for income and franchise taxes |
|
|
674 |
|
|
1,601 |
|
|
185 |
|
74
13. Quarterly Financial Information (Unaudited)
The following table summarizes the unaudited consolidated quarterly financial information for 2014 and 2013. All adjustments (consisting of only normal recurring accruals) necessary for a fair presentation of the interim periods presented are included. The calculation of basic and diluted per share amounts for each quarter is based on the weighted average shares outstanding for that period; consequently, the sum of the quarters may not necessarily be equal to the full year basic and diluted net income per share (amounts in thousands, except per-share amounts):
|
|
|
|
|
|
|
|
|
|
|
|
|
|
|
|
|
|
|
|
|
First Quarter |
|
Second Quarter |
|
Third Quarter |
|
Fourth Quarter |
|
Total |
|
|||||
|
2014 |
|
|
|
|
|
|
|
|
|
|
|
|
|
|
|
|
|
Revenues |
|
$ |
39,329 |
|
$ |
45,022 |
|
$ |
50,928 |
|
$ |
55,162 |
|
$ |
190,441 |
|
|
Income from continuing operations |
|
|
8,693 |
|
|
9,035 |
|
|
10,622 |
|
|
14,156 |
|
|
42,506 |
|
|
Net income |
|
|
9,539 |
|
|
10,422 |
|
|
10,755 |
|
|
17,423 |
|
|
48,139 |
|
|
Basic and diluted income per common share: |
|
|
|
|
|
|
|
|
|
|
|
|
|
|
|
|
|
Continuing operations |
|
|
0.14 |
|
|
0.14 |
|
|
0.13 |
|
|
0.18 |
|
|
0.59 |
|
|
Net income |
|
|
0.15 |
|
|
0.15 |
|
|
0.13 |
|
|
0.18 |
|
|
0.61 |
|
|
Cash dividends declared per common share |
|
|
0.2395 |
|
|
0.2455 |
|
|
0.2870 |
|
|
0.2178 |
|
|
0.9898 |
|
|
|
|
|
|
|
|
|
|
|
|
|
|
|
|
|
|
|
|
|
|
First Quarter |
|
Second Quarter |
|
Third Quarter |
|
Fourth Quarter |
|
Total |
|
|||||
|
2013 |
|
|
|
|
|
|
|
|
|
|
|
|
|
|
|
|
|
Revenues |
|
$ |
20,939 |
|
$ |
25,501 |
|
$ |
29,101 |
|
$ |
33,363 |
|
$ |
108,904 |
|
|
Income from continuing operations |
|
|
3,507 |
|
|
5,610 |
|
|
6,089 |
|
|
7,112 |
|
|
22,318 |
|
|
Net income |
|
|
4,221 |
|
|
6,771 |
|
|
7,816 |
|
|
7,505 |
|
|
26,313 |
|
|
Basic and diluted income per common share: |
|
|
|
|
|
|
|
|
|
|
|
|
|
|
|
|
|
Continuing operations |
|
|
0.08 |
|
|
0.11 |
|
|
0.12 |
|
|
0.13 |
|
|
0.44 |
|
|
Net income |
|
|
0.10 |
|
|
0.14 |
|
|
0.15 |
|
|
0.13 |
|
|
0.52 |
|
|
Cash dividends declared per common share |
|
|
0.2096 |
|
|
0.2156 |
|
|
0.2216 |
|
|
0.2275 |
|
|
0.8743 |
|
75
Item 9. CHANGES IN AND DISAGREEMENTS WITH ACCOUNTANTS ON ACCOUNTING AND FINANCIAL DISCLOSURE
None.
Item 9A. CONTROLS AND PROCEDURES
Disclosure Controls and Procedures
The disclosure controls and procedures of the Company are designed with the objective of ensuring that information required to be disclosed in our reports filed under the Securities Exchange Act of 1934 is recorded, processed, summarized and reported within the time periods specified in the SEC’s rules and forms. Our disclosure controls and procedures are also designed to ensure that such information is accumulated and communicated to our management, including our Chief Executive Officer and Chief Financial Officer, as appropriate to allow timely decisions regarding required disclosure.
It should be noted that the design of any system of controls is based in part upon certain assumptions about the likelihood of future events, and there can be no assurance that any design will succeed in achieving its stated goals under all potential future conditions, regardless of how remote. As a result, our disclosure controls and procedures are designed to provide reasonable assurance that such disclosure controls and procedures will meet their objectives.
As of December 31, 2014, we carried out an evaluation, under the supervision and with the participation of our Chief Executive Officer and Chief Financial Officer, of the effectiveness of the design and operation of the disclosure controls and procedures of the Company as defined in Rule 13a-15(f) under the Exchange Act. Based on this evaluation, the Chief Executive Officer and Chief Financial Officer of the Company concluded that the Company’s design and operation of these disclosure controls and procedures are effective at the reasonable assurance level described above.
Management’s Report on Internal Control over Financial Reporting
This Annual Report does not include a report of management’s assessment regarding internal control over financial reporting or an attestation report of the Company’s independent registered public accounting firm due to a transition period established by rules of the SEC for newly public companies.
Changes in Internal Control Over Financial Reporting
There have not been any changes in the Company’s internal control over financial reporting (as such term is defined in Rules 13a-15(f) and 15d-15(f) under the Exchange Act) during the fourth fiscal quarter to which this report relates that materially affected, or are reasonably likely to materially affect, the internal control over financial reporting of the Company.
None.
76
Item 10. DIRECTORS, EXECUTIVE OFFICERS AND CORPORATE GOVERNANCE
The information required by this item is incorporated by reference to the information set forth under the headings “Proposal No. 1 – Election of Directors,” “Corporate Governance Matters – Information Regarding the Board and its Committees,” “Executive Officers” and “Section 16(a) Beneficial Ownership Reporting Compliance” in the Company’s definitive proxy statement for its 2015 Annual Meeting of Stockholders (2015 Proxy Statement).
Our Board of Directors has adopted a code of business conduct and ethics (Code of Ethics) that applies to all of our officers, directors and employees. Our Code of Ethics is available free of charge on our website, www.storecapital.com, and is incorporated by reference to the information set forth under the heading “Corporate Governance Matters” in our 2015 Proxy Statement. We intend to satisfy the disclosure requirements of Form 8-K regarding any amendment to, or a waiver from, any provision of our Code of Ethics by posting such amendment or waiver on our website.
Item 11. EXECUTIVE COMPENSATION
The information required by this item is incorporated by reference to the information set forth under the headings “Executive Compensation” and “Corporate Governance Matters – Director Compensation” and “Corporate Governance Matters – Compensation Committee Interlocks and Insider Participation” in our 2015 Proxy Statement.
Item 12. SECURITY OWNERSHIP OF CERTAIN BENEFICIAL OWNERS AND MANAGEMENT AND RELATED STOCKHOLDER MATTERS
The information required by this item is incorporated by reference to the information set forth under the heading “Beneficial Ownership of Common Stock by Certain Beneficial Owners and Management” in our 2015 Proxy Statement.
Securities Authorized for Issuance Under Equity Compensation Plans
The following information reflects certain information about our equity compensation plan as of December 31, 2014:
|
|
|
|
|
|
|
|
|
|
|
|
Number of securities |
|
|
|
Number of securities |
|
|
|
|
to be issued upon |
|
Weighted-average |
|
available for future issuance |
|
|
|
|
exercise of |
|
exercise price of |
|
under equity compensation |
|
|
|
|
outstanding options, |
|
outstanding options, |
|
plans (excluding securities |
|
|
Plan category |
|
warrants and rights |
|
warrants and rights |
|
reflected in column (a)) |
|
|
|
|
(a) |
|
(b) |
|
(c) |
|
|
Equity compensation plans approved by shareholders |
|
– |
|
– |
|
7,152,961 | (1) |
|
Equity compensation plans not approved by shareholders |
|
– |
|
– |
|
– |
|
|
Total |
|
– |
|
– |
|
7,152,961 |
|
|
(1) |
Represents 6,903,076 shares available for future issuance under the STORE Capital Corporation 2015 Omnibus Equity Incentive Plan and 249,885 shares available for future issuance under the STORE Capital Corporation 2012 Long-Term Incentive Plan. |
Item 13. CERTAIN RELATIONSHIPS AND RELATED TRANSACTIONS, AND DIRECTOR INDEPENDENCE
The information required by this item is incorporated by reference to the information set forth under the headings “Corporate Governance Matters – Director Independence” and “Certain Relationships and Related Party Transactions” in our 2015 Proxy Statement.
77
Item 14. PRINCIPAL ACCOUNTANT FEES AND SERVICES
The information required by this item is incorporated by reference to the information set forth under the heading “Proposal No. 2 – Ratification of Appointment of Auditors – Accounting Fees and Services” in our 2015 Proxy Statement.
78
Item 15. EXHIBITS AND FINANCIAL STATEMENT SCHEDULES
(a) The following documents are filed as part of this Annual Report:
1. Financial Statements. (see Item 8)
Report of Independent Registered Public Accounting Firm
Consolidated Balance Sheets as of December 31, 2014 and 2013
Consolidated Statements of Income for the years ended December 31, 2014, 2013 and 2012
Consolidated Statements of Comprehensive Income for the years ended December 31, 2014, 2013 and 2012
Consolidated Statements of Stockholders’ Equity for the years ended December 31, 2014, 2013 and 2012
Consolidated Statements of Cash Flows for the years ended December 31, 2014, 2013 and 2012
Notes to Consolidated Financial Statements
2. Financial Statement Schedules. (see schedules beginning on page F-1)
Schedule III—Real Estate and Accumulated Depreciation
Schedule IV—Mortgage Loans on Real Estate
All other schedules are omitted since the required information is not present or is not present in amounts sufficient to require submission of the schedule, or because the information required is included in the consolidated financial statements and notes thereto.
3. Exhibits. The exhibits filed with this Annual Report are set forth in the Exhibit Index.
79
SIGNATURES
Pursuant to the requirements of Section 13 or 15 (d) of the Securities Exchange Act of 1934, the registrant has duly caused this Report to be signed on its behalf by the undersigned, thereunto duly authorized.
|
|
STORE CAPITAL CORPORATION |
|
|
|
|
|
|
Date: March 10, 2015 |
By: |
/s/ Christopher H. Volk |
|
|
|
Christopher H. Volk |
|
|
|
Chief Executive Officer and |
Pursuant to the requirements of the Securities Exchange Act of 1934, this Report has been signed below on March 10, 2015 by the following persons on behalf of the registrant and in the capacities indicated.
|
Signature |
|
Title |
|
Date |
|
|
|
|
|
|
|
/s/Christopher H. Volk |
|
Director, President and Chief Executive |
|
March 10, 2015 |
|
Christopher H. Volk |
|
Officer (principal executive officer) |
|
|
|
|
|
|
|
|
|
/s/Catherine Long |
|
Executive Vice President, Chief Financial Officer (principal |
|
March 10, 2015 |
|
Catherine Long |
|
financial and accounting officer) |
|
|
|
|
|
|
|
|
|
/s/Morton H. Fleischer |
|
Chairman of the Board of Directors |
|
March 10, 2015 |
|
Morton H. Fleischer |
|
|
|
|
|
|
|
|
|
|
|
/s/Mahesh Balakrishnan |
|
Director |
|
March 10, 2015 |
|
Mahesh Balakrishnan |
|
|
|
|
|
|
|
|
|
|
|
/s/ Manish Desai |
|
Director |
|
March 10, 2015 |
|
Manish Desai |
|
|
|
|
|
|
|
|
|
|
|
/s/Ken Liang |
|
Director |
|
March 10, 2015 |
|
Ken Liang |
|
|
|
|
|
|
|
|
|
|
|
/s/Rajath Shourie |
|
Director |
|
March 10, 2015 |
|
Rajath Shourie |
|
|
|
|
|
|
|
|
|
|
|
/s/Derek Smith |
|
Director |
|
March 10, 2015 |
|
Derek Smith |
|
|
|
|
|
|
|
|
|
|
|
/s/Joseph M. Donovan |
|
Director |
|
March 10, 2015 |
|
Joseph M. Donovan |
|
|
|
|
|
|
|
|
|
|
|
/s/Quentin P. Smith, Jr. |
|
Director |
|
March 10, 2015 |
|
Quentin P. Smith, Jr. |
|
|
|
|
80
EXHIBIT INDEX
The exhibits listed below are filed as part of this Annual Report. References under the caption “Location” to exhibits or other filings indicate that the exhibit or other filing has been filed, that the indexed exhibit and the exhibit referred to are the same and that the exhibit referred to is incorporated by reference. Management contracts and compensatory plans or arrangements filed as exhibits to this Annual Report are identified by an asterisk. The SEC file number for STORE Capital Corporation’s Exchange Act filings referenced below is 1-36739.
|
Exhibit |
|
Description |
|
Location |
|
3.1 |
|
Articles of Amendment and Restatement of STORE Capital Corporation filed with the State Department of Assessments and Taxation of Maryland on November 18, 2014. |
|
Exhibit 3.1 to the Company’s Current Report on Form 8-K dated November 18, 2014 and filed with the SEC on November 21, 2014. |
|
3.2 |
|
Amended and Restated Bylaws of STORE Capital Corporation dated November 21, 2014. |
|
Exhibit 3.2 to the Company’s Current Report on Form 8-K dated November 18, 2014 and filed with the SEC on November 21, 2014. |
|
4.1 |
|
Form of Common Stock Certificate. |
|
Exhibit 4.1 to the Company’s Current Report on Form 8-K dated November 18, 2014 and filed with the SEC on November 21, 2014. |
|
4.2 |
|
Third Amended and Restated Master Indenture dated as of May 6, 2014, among STORE Master Funding I, LLC, STORE Master Funding II, LLC, STORE Master Funding III, LLC, STORE Master Funding IV, LLC and STORE Master Funding V, LLC, each a Delaware limited liability company, collectively as issuers, and Citibank, N.A., as indenture trustee, relating to Net-Lease Mortgage Notes. |
|
Exhibit 4.1 to Amendment No. 1 to the Company’s Registration Statement on Form S-11 dated and filed with the SEC as of September 23, 2014 (File No. 333-198486). |
|
4.3 |
|
Series 2012-1 Indenture Supplement dated as of August 23, 2012, between STORE Master Funding I, LLC and Citibank, N.A., as indenture trustee. |
|
Exhibit 4.2 to Amendment No. 1 to the Company’s Registration Statement on Form S-11 dated and filed with the SEC as of September 23, 2014 (File No. 333-198486). |
|
4.4 |
|
Series 2013-1 Indenture Supplement dated as of March 27, 2013, between STORE Master Funding I, LLC, STORE Master Funding II, LLC and Citibank, N.A., as indenture trustee. |
|
Exhibit 4.3 to Amendment No. 1 to the Company’s Registration Statement on Form S-11 dated and filed with the SEC as of September 23, 2014 (File No. 333-198486). |
|
4.5 |
|
Series 2013-2 Indenture Supplement dated as of July 25, 2013, between STORE Master Funding I, LLC, STORE Master Funding II, LLC, STORE Master Funding III, LLC and Citibank, N.A., as indenture trustee. |
|
Exhibit 4.4 to Amendment No. 1 to the Company’s Registration Statement on Form S-11 dated and filed with the SEC as of September 23, 2014 (File No. 333-198486). |
|
4.6 |
|
Series 2013-3 Indenture Supplement dated as of December 3, 2013, among STORE Master Funding I, LLC, STORE Master Funding II, LLC STORE Master Funding III, LLC, STORE Master Funding IV, LLC and Citibank, N.A., as indenture trustee. |
|
Exhibit 4.5 to Amendment No. 1 to the Company’s Registration Statement on Form S-11 dated and filed with the SEC as of September 23, 2014 (File No. 333-198486). |
|
4.7 |
|
Series 2014-1 Indenture Supplement dated as of May 6, 2014, among STORE Master Funding I, LLC, STORE Master Funding II, LLC, STORE Master Funding III, LLC, STORE Master Funding IV, LLC, STORE Master Funding V, LLC and Citibank, N.A., as indenture trustee. |
|
Exhibit 4.6 to Amendment No. 1 to the Company’s Registration Statement on Form S-11 dated and filed with the SEC as of September 23, 2014 (File No. 333-198486). |
81
|
10.1 |
|
Third Amended and Restated Property Management and Servicing Agreement dated as of May 6, 2014, among STORE Master Funding I, LLC, STORE Master Funding II, LLC, STORE Master Funding III, LLC, STORE Mastering Funding IV, LLC and STORE Master Funding V, LLC, each a Delaware limited liability company, collectively as issuers, STORE Capital Corporation, a Maryland corporation, as property manager and special servicer, and Midland Loan Services, Inc., a Delaware corporation, as back-up manager and Citibank, N.A., as indenture trustee. |
|
Exhibit 10.1 to Amendment No. 1 to the Company’s Registration Statement on Form S-11 dated and filed with the SEC as of September 23, 2014 (File No. 333-198486). |
|
10.2 |
|
Stockholders Agreement among STORE Capital Corporation and the persons named therein, effective as of November 21, 2014. |
|
Exhibit 10.1 to the Company’s Current Report on Form 8-K dated November 20, 2014 and filed with the SEC on November 26, 2014. |
|
10.3 |
|
Registration Rights Agreement among STORE Capital Corporation and the persons named therein, effective as of November 21, 2014. |
|
Exhibit 10.2 to the Company’s Current Report on Form 8-K dated November 20, 2014 and filed with the SEC on November 26, 2014. |
|
10.4 |
* |
STORE Capital Corporation 2015 Omnibus Equity Incentive Plan, effective as of November 20, 2014. |
|
Exhibit 10.3 to the Company’s Current Report on Form 8-K dated November 20, 2014 and filed with the SEC on November 26, 2014. |
|
10.5 |
* |
STORE Capital Corporation 2012 Long-Term Incentive Plan. |
|
Exhibit 10.7 to Amendment No. 1 to the Company’s Registration Statement on Form S-11 dated and filed with the SEC as of September 23, 2014 (File No. 333-198486). |
|
10.6 |
* |
Form of 2012 Long-Term Incentive Award Plan Restricted Stock Award Grant Agreement. |
|
Exhibit 10.8 to Amendment No. 1 to the Company’s Registration Statement on Form S-11 dated and filed with the SEC as of September 23, 2014 (File No. 333-198486). |
|
10.7 |
* |
STORE Capital Corporation Director Compensation Program. |
|
Exhibit 10.5 to Amendment No. 1 to the Company’s Registration Statement on Form S-11 dated and filed with the SEC as of September 23, 2014 (File No. 333-198486). |
|
10.8 |
* |
Form of Indemnification Agreement between STORE Capital Corporation and each of its directors and executive officers. |
|
Exhibit 10.10 to the Company’s Current Report on Form 8-K dated November 20, 2014 and filed with the SEC on November 26, 2014. |
|
10.9 |
* |
Employment Agreement among STORE Capital Corporation, STORE Capital Advisors, LLC and Christopher H. Volk, effective as of November 21, 2014. |
|
Exhibit 10.4 to the Company’s Current Report on Form 8-K dated November 20, 2014 and filed with the SEC on November 26, 2014. |
|
10.10 |
* |
Employment Agreement among STORE Capital Corporation, STORE Capital Advisors, LLC and Michael T. Bennett, effective as of November 21, 2014. |
|
Exhibit 10.5 to the Company’s Current Report on Form 8-K dated November 20, 2014 and filed with the SEC on November 26, 2014. |
|
10.11 |
* |
Employment Agreement among STORE Capital Corporation, STORE Capital Advisors, LLC and Catherine Long, effective as of November 21, 2014. |
|
Exhibit 10.6 to the Company’s Current Report on Form 8-K dated November 20, 2014 and filed with the SEC on November 26, 2014. |
|
10.12 |
* |
Employment Agreement among STORE Capital Corporation, STORE Capital Advisors, LLC and Mary Fedewa, effective as of November 21, 2014. |
|
Exhibit 10.7 to the Company’s Current Report on Form 8-K dated November 20, 2014 and filed with the SEC on November 26, 2014. |
82
|
10.13 |
* |
Employment Agreement among STORE Capital Corporation, STORE Capital Advisors, LLC and Michael J. Zieg, effective as of November 21, 2014. |
|
Exhibit 10.8 to the Company’s Current Report on Form 8-K dated November 20, 2014 and filed with the SEC on November 26, 2014. |
|
10.14 |
* |
Employment Agreement among STORE Capital Corporation, STORE Capital Advisors, LLC and Christopher K. Burbach, effective as of November 21, 2014. |
|
Exhibit 10.9 to the Company’s Current Report on Form 8-K dated November 20, 2014 and filed with the SEC on November 26, 2014. |
|
10.15 |
|
Credit Agreement dated as of September 19, 2014, by and among STORE Capital Corporation, as Borrower, KeyBank National Association, the other Lenders which are parties thereto and other Lenders that may become parties thereto, KeyBank National Association, as Administrative Agent, Wells Fargo Bank, National Association, as Syndication Agent, BMO Harris Bank, N.A. and Regions Bank, as Co-Documentation Agents, and KeyBanc Capital Markets Inc. and Wells Fargo Securities, LLC as Joint Lead Arrangers and Joint Book Runners. |
|
Exhibit 10.21 to Amendment No. 1 to the Company’s Registration Statement on Form S-11 dated and filed with the SEC as of September 23, 2014 (File No. 333-198486). |
|
21 |
|
List of Subsidiaries. |
|
Filed herewith. |
|
23 |
|
Consent of Independent Registered Public Accounting Firm. |
|
Filed herewith. |
|
31.1 |
|
Rule 13a-14(a) Certification of the Chief Executive Officer. |
|
Filed herewith. |
|
31.2 |
|
Rule 13a-14(a) Certification of the Chief Financial Officer. |
|
Filed herewith. |
|
32.1 |
|
Section 1350 Certification of the Chief Executive Officer. |
|
Filed herewith. |
|
32.2 |
|
Section 1350 Certification of the Chief Financial Officer. |
|
Filed herewith. |
*Indicates management contract or compensatory plan.
83
STORE Capital Corporation
Schedule III - Real Estate and Accumulated Depreciation
(Dollars in Thousands)
|
Descriptions (a) |
|
|
|
Initial Cost to Company |
|
Costs Capitalized |
|
Gross amount at December 31, 2014 (b) (c) |
|
|
|
|
|
|
||||||||||||||
|
Tenant Industry |
|
City |
|
St |
|
Encumbrances |
|
Land & |
|
Building & |
|
Land & |
|
Building & |
|
Land & |
|
Building & |
|
Total |
|
Accumulated |
|
Year |
|
Date |
||
|
Restaurants – Limited Service |
|
Benson |
|
MN |
|
(f) |
|
$ 187
|
|
$ 627
|
|
$ |
- |
|
$ |
- |
|
$ 187
|
|
$ 627
|
|
$ 814
|
|
$ (98)
|
|
1987 |
|
07/29/2011 |
|
Restaurants – Limited Service |
|
Glencoe |
|
MN |
|
(f) |
|
369 |
|
772 |
|
- |
|
- |
|
369 |
|
772 |
|
1,141 |
|
(122) |
|
1986 |
|
07/29/2011 |
||
|
Restaurants – Limited Service |
|
Little Falls |
|
MN |
|
(f) |
|
456 |
|
803 |
|
- |
|
- |
|
456 |
|
803 |
|
1,259 |
|
(150) |
|
1983 |
|
07/29/2011 |
||
|
Restaurants – Limited Service |
|
Minneapolis |
|
MN |
|
(f) |
|
243 |
|
590 |
|
34 |
|
169 |
|
277 |
|
759 |
|
1,036 |
|
(102) |
|
1996 |
|
07/29/2011 |
||
|
Restaurants – Limited Service |
|
Sauk Rapids |
|
MN |
|
(f) |
|
224 |
|
887 |
|
- |
|
- |
|
224 |
|
887 |
|
1,111 |
|
(118) |
|
1996 |
|
07/29/2011 |
||
|
Restaurants – Limited Service |
|
Staples |
|
MN |
|
(f) |
|
213 |
|
729 |
|
- |
|
- |
|
213 |
|
729 |
|
942 |
|
(108) |
|
1987 |
|
07/29/2011 |
||
|
Restaurants – Limited Service |
|
Wadena |
|
MN |
|
(f) |
|
171 |
|
732 |
|
- |
|
- |
|
171 |
|
732 |
|
903 |
|
(98) |
|
1980 |
|
07/29/2011 |
||
|
Restaurants – Limited Service |
|
Valley City |
|
ND |
|
(f) |
|
217 |
|
676 |
|
- |
|
- |
|
217 |
|
676 |
|
893 |
|
(116) |
|
1984 |
|
07/29/2011 |
||
|
Restaurants – Limited Service |
|
Wahpeton |
|
ND |
|
(f) |
|
314 |
|
589 |
|
- |
|
- |
|
314 |
|
589 |
|
903 |
|
(94) |
|
1987 |
|
07/29/2011 |
||
|
Restaurants – Limited Service |
|
Mobridge |
|
SD |
|
(f) |
|
336 |
|
517 |
|
- |
|
- |
|
336 |
|
517 |
|
853 |
|
(117) |
|
1993 |
|
07/29/2011 |
||
|
Furniture Stores |
|
Austin |
|
TX |
|
(f) |
|
2,212 |
|
3,600 |
|
- |
|
- |
|
2,212 |
|
3,600 |
|
5,812 |
|
(355) |
|
2006 |
|
09/02/2011 |
||
|
Furniture Stores |
|
Live Oak |
|
TX |
|
(f) |
|
1,885 |
|
3,927 |
|
- |
|
- |
|
1,885 |
|
3,927 |
|
5,812 |
|
(374) |
|
2005 |
|
09/02/2011 |
||
|
Furniture Stores |
|
New Braunfels |
|
TX |
|
(f) |
|
1,692 |
|
6,926 |
|
- |
|
- |
|
1,692 |
|
6,926 |
|
8,618 |
|
(876) |
|
1995 |
|
09/02/2011 |
||
|
Furniture Stores |
|
San Antonio |
|
TX |
|
(f) |
|
2,361 |
|
3,952 |
|
- |
|
- |
|
2,361 |
|
3,952 |
|
6,313 |
|
(393) |
|
2006 |
|
09/02/2011 |
||
|
Restaurants – Limited Service |
|
Florence |
|
AL |
|
(f) |
|
398 |
|
540 |
|
- |
|
- |
|
398 |
|
540 |
|
938 |
|
(73) |
|
1994 |
|
09/08/2011 |
||
|
Restaurants – Limited Service |
|
Vestavia |
|
AL |
|
(f) |
|
310 |
|
354 |
|
- |
|
- |
|
310 |
|
354 |
|
664 |
|
(47) |
|
1972 |
|
09/08/2011 |
||
|
Restaurants – Limited Service |
|
Jacksonville |
|
FL |
|
(f) |
|
310 |
|
325 |
|
- |
|
- |
|
310 |
|
325 |
|
635 |
|
(46) |
|
1982 |
|
09/08/2011 |
||
|
Restaurants – Limited Service |
|
Bainbridge |
|
GA |
|
(f) |
|
147 |
|
381 |
|
- |
|
- |
|
147 |
|
381 |
|
528 |
|
(52) |
|
1989 |
|
09/08/2011 |
||
|
Restaurants – Limited Service |
|
Winder |
|
GA |
|
(f) |
|
348 |
|
366 |
|
- |
|
- |
|
348 |
|
366 |
|
714 |
|
(62) |
|
1986 |
|
09/08/2011 |
||
|
Restaurants – Limited Service |
|
Evansville |
|
IN |
|
(f) |
|
226 |
|
380 |
|
- |
|
- |
|
226 |
|
380 |
|
606 |
|
(61) |
|
1988 |
|
09/08/2011 |
||
|
Restaurants – Limited Service |
|
Louisville |
|
KY |
|
(f) |
|
310 |
|
383 |
|
- |
|
- |
|
310 |
|
383 |
|
693 |
|
(61) |
|
1973 |
|
09/08/2011 |
||
|
Restaurants – Limited Service |
|
Florissant |
|
MO |
|
(f) |
|
460 |
|
400 |
|
- |
|
- |
|
460 |
|
400 |
|
860 |
|
(60) |
|
1981 |
|
09/08/2011 |
||
|
Restaurants – Limited Service |
|
Jackson |
|
MS |
|
(f) |
|
253 |
|
460 |
|
- |
|
- |
|
253 |
|
460 |
|
713 |
|
(64) |
|
1993 |
|
09/08/2011 |
||
|
Restaurants – Limited Service |
|
Jackson |
|
MS |
|
(f) |
|
225 |
|
342 |
|
- |
|
- |
|
225 |
|
342 |
|
567 |
|
(45) |
|
1983 |
|
09/08/2011 |
||
|
Restaurants – Limited Service |
|
Cincinnati |
|
OH |
|
(f) |
|
148 |
|
467 |
|
- |
|
- |
|
148 |
|
467 |
|
615 |
|
(65) |
|
1987 |
|
09/08/2011 |
||
|
Restaurants – Limited Service |
|
Owasso |
|
OK |
|
(f) |
|
275 |
|
301 |
|
- |
|
- |
|
275 |
|
301 |
|
576 |
|
(42) |
|
1986 |
|
09/08/2011 |
||
|
Restaurants – Limited Service |
|
Tulsa |
|
OK |
|
(f) |
|
209 |
|
328 |
|
- |
|
- |
|
209 |
|
328 |
|
537 |
|
(57) |
|
1977 |
|
09/08/2011 |
||
|
Restaurants – Limited Service |
|
Antioch |
|
TN |
|
(f) |
|
391 |
|
264 |
|
- |
|
- |
|
391 |
|
264 |
|
655 |
|
(42) |
|
1978 |
|
09/08/2011 |
||
|
Restaurants – Limited Service |
|
Clarksville |
|
TN |
|
(f) |
|
239 |
|
425 |
|
- |
|
- |
|
239 |
|
425 |
|
664 |
|
(60) |
|
1993 |
|
09/08/2011 |
||
|
Restaurants – Limited Service |
|
Knoxville |
|
TN |
|
(f) |
|
371 |
|
323 |
|
- |
|
- |
|
371 |
|
323 |
|
694 |
|
(48) |
|
1987 |
|
09/08/2011 |
||
|
Restaurants – Limited Service |
|
Princeton |
|
WV |
|
(f) |
|
246 |
|
408 |
|
- |
|
- |
|
246 |
|
408 |
|
654 |
|
(54) |
|
1977 |
|
09/08/2011 |
||
|
Veneer, Plywood, and Engineered Wood Product Manufacturing |
|
Delaware |
|
OH |
|
(f) |
|
308 |
|
478 |
|
- |
|
- |
|
308 |
|
478 |
|
786 |
|
(63) |
|
1969 |
|
09/27/2011 |
||
|
Veneer, Plywood, and Engineered Wood Product Manufacturing |
|
Hillsboro |
|
OR |
|
(f) |
|
879 |
|
167 |
|
- |
|
- |
|
879 |
|
167 |
|
1,046 |
|
(33) |
|
1965 |
|
09/27/2011 |
||
|
Veneer, Plywood, and Engineered Wood Product Manufacturing |
|
Stayton |
|
OR |
|
(f) |
|
2,254 |
|
2,526 |
|
- |
|
- |
|
2,254 |
|
2,526 |
|
4,780 |
|
(319) |
|
1985 |
|
09/27/2011 |
||
|
Family Entertainment Centers |
|
Webster |
|
TX |
|
(f) |
|
2,135 |
|
6,355 |
|
- |
|
- |
|
2,135 |
|
6,355 |
|
8,490 |
|
(640) |
|
2007 |
|
09/30/2011 |
||
|
Child Day Care Services |
|
Laveen |
|
AZ |
|
(f) |
|
1,427 |
|
3,012 |
|
35 |
|
210 |
|
1,462 |
|
3,222 |
|
4,684 |
|
(309) |
|
2008 |
|
10/07/2011 |
||
|
Child Day Care Services |
|
Maricopa |
|
AZ |
|
(f) |
|
2,212 |
|
4,080 |
|
- |
|
- |
|
2,212 |
|
4,080 |
|
6,292 |
|
(398) |
|
2008 |
|
10/07/2011 |
||
|
Beer, Wine, and Liquor Stores |
|
McAllen |
|
TX |
|
(f) |
|
1,490 |
|
2,220 |
|
- |
|
- |
|
1,490 |
|
2,220 |
|
3,710 |
|
(346) |
|
1955 |
|
10/07/2011 |
||
|
Beer, Wine, and Liquor Stores |
|
Pharr |
|
TX |
|
(f) |
|
699 |
|
1,362 |
|
- |
|
- |
|
699 |
|
1,362 |
|
2,061 |
|
(197) |
|
1989 |
|
10/07/2011 |
||
|
Restaurants – Full Service |
|
Canton |
|
GA |
|
(f) |
|
1,101 |
|
973 |
|
- |
|
- |
|
1,101 |
|
973 |
|
2,074 |
|
(138) |
|
1998 |
|
10/17/2011 |
||
|
Restaurants – Full Service |
|
Fayetteville |
|
GA |
|
(f) |
|
1,155 |
|
1,210 |
|
- |
|
- |
|
1,155 |
|
1,210 |
|
2,365 |
|
(173) |
|
2004 |
|
10/17/2011 |
||
|
Restaurants – Full Service |
|
Ft. Oglethorpe |
|
GA |
|
(f) |
|
957 |
|
986 |
|
- |
|
- |
|
957 |
|
986 |
|
1,943 |
|
(128) |
|
2003 |
|
10/17/2011 |
||
|
Restaurants – Full Service |
|
Stockbridge |
|
GA |
|
(f) |
|
1,135 |
|
1,276 |
|
- |
|
- |
|
1,135 |
|
1,276 |
|
2,411 |
|
(176) |
|
2000 |
|
10/17/2011 |
||
F-1
|
Descriptions (a) |
|
|
|
Initial Cost to Company |
|
Costs Capitalized |
|
Gross amount at December 31, 2014 (b) (c) |
|
|
|
|
|
|
||||||||||||
|
Tenant Industry |
|
City |
|
St |
|
Encumbrances |
|
Land & |
|
Building & |
|
Land & |
|
Building & |
|
Land & |
|
Building & |
|
Total |
|
Accumulated |
|
Year |
|
Date |
|
Restaurants – Full Service |
|
Camby |
|
IN |
|
(f) |
|
636 |
|
1,297 |
|
- |
|
- |
|
636 |
|
1,297 |
|
1,933 |
|
(174) |
|
2008 |
|
10/17/2011 |
|
Restaurants – Full Service |
|
Greenwood |
|
IN |
|
(f) |
|
518 |
|
1,196 |
|
- |
|
- |
|
518 |
|
1,196 |
|
1,714 |
|
(152) |
|
2005 |
|
10/17/2011 |
|
Restaurants – Full Service |
|
Georgetown |
|
KY |
|
(f) |
|
727 |
|
1,076 |
|
- |
|
- |
|
727 |
|
1,076 |
|
1,803 |
|
(144) |
|
2002 |
|
10/17/2011 |
|
Restaurants – Full Service |
|
Owensboro |
|
KY |
|
(f) |
|
585 |
|
1,427 |
|
- |
|
- |
|
585 |
|
1,427 |
|
2,012 |
|
(209) |
|
1996 |
|
10/17/2011 |
|
Restaurants – Full Service |
|
Charlotte |
|
NC |
|
(f) |
|
737 |
|
1,087 |
|
- |
|
- |
|
737 |
|
1,087 |
|
1,824 |
|
(177) |
|
2000 |
|
10/17/2011 |
|
Restaurants – Full Service |
|
Greensboro |
|
NC |
|
(f) |
|
626 |
|
1,039 |
|
- |
|
- |
|
626 |
|
1,039 |
|
1,665 |
|
(159) |
|
2004 |
|
10/17/2011 |
|
Restaurants – Full Service |
|
Dayton |
|
OH |
|
(f) |
|
1,369 |
|
1,357 |
|
- |
|
- |
|
1,369 |
|
1,357 |
|
2,726 |
|
(193) |
|
1998 |
|
10/17/2011 |
|
Restaurants – Full Service |
|
Springdale |
|
OH |
|
(f) |
|
1,286 |
|
897 |
|
- |
|
- |
|
1,286 |
|
897 |
|
2,183 |
|
(111) |
|
1996 |
|
10/17/2011 |
|
Restaurants – Full Service |
|
Cookeville |
|
TN |
|
(f) |
|
1,528 |
|
1,511 |
|
691 |
|
- |
|
2,219 |
|
1,511 |
|
3,730 |
|
(220) |
|
1994 |
|
10/17/2011 |
|
Restaurants – Full Service |
|
Knoxville |
|
TN |
|
(f) |
|
1,161 |
|
1,221 |
|
- |
|
- |
|
1,161 |
|
1,221 |
|
2,382 |
|
(188) |
|
2003 |
|
10/17/2011 |
|
Restaurants – Full Service |
|
Harrisonburg |
|
VA |
|
(f) |
|
468 |
|
1,067 |
|
- |
|
- |
|
468 |
|
1,067 |
|
1,535 |
|
(151) |
|
2003 |
|
10/17/2011 |
|
Restaurants – Full Service |
|
Panama City |
|
FL |
|
|
|
230 |
|
1,451 |
|
- |
|
- |
|
230 |
|
1,451 |
|
1,681 |
|
(171) |
|
2001 |
|
10/17/2011 |
|
Restaurants – Full Service |
|
Augusta |
|
GA |
|
|
|
853 |
|
1,148 |
|
- |
|
- |
|
853 |
|
1,148 |
|
2,001 |
|
(151) |
|
1997 |
|
10/17/2011 |
|
Restaurants – Full Service |
|
Cumming |
|
GA |
|
|
|
1,375 |
|
946 |
|
- |
|
- |
|
1,375 |
|
946 |
|
2,321 |
|
(140) |
|
1998 |
|
10/17/2011 |
|
Restaurants – Full Service |
|
Lawrenceville |
|
GA |
|
|
|
985 |
|
879 |
|
- |
|
- |
|
985 |
|
879 |
|
1,864 |
|
(123) |
|
1996 |
|
10/17/2011 |
|
Restaurants – Full Service |
|
Snellville |
|
GA |
|
|
|
1,954 |
|
927 |
|
- |
|
- |
|
1,954 |
|
927 |
|
2,881 |
|
(135) |
|
1998 |
|
10/17/2011 |
|
Restaurants – Full Service |
|
Frankfort |
|
KY |
|
|
|
955 |
|
916 |
|
- |
|
- |
|
955 |
|
916 |
|
1,871 |
|
(133) |
|
1998 |
|
10/17/2011 |
|
Restaurants – Full Service |
|
Lexington |
|
KY |
|
$19,317 |
|
533 |
|
1,148 |
|
- |
|
- |
|
533 |
|
1,148 |
|
1,681 |
|
(146) |
|
1988 |
|
10/17/2011 |
|
Restaurants – Full Service |
|
Louisville |
|
KY |
|
|
|
1,216 |
|
1,028 |
|
- |
|
- |
|
1,216 |
|
1,028 |
|
2,244 |
|
(139) |
|
1993 |
|
10/17/2011 |
|
Restaurants – Full Service |
|
Mansfield |
|
OH |
|
|
|
725 |
|
1,156 |
|
- |
|
- |
|
725 |
|
1,156 |
|
1,881 |
|
(172) |
|
2003 |
|
10/17/2011 |
|
Restaurants – Full Service |
|
Charleston |
|
SC |
|
|
|
889 |
|
1,245 |
|
- |
|
- |
|
889 |
|
1,245 |
|
2,134 |
|
(188) |
|
2001 |
|
10/17/2011 |
|
Restaurants – Full Service |
|
Cleveland |
|
TN |
|
|
|
1,169 |
|
1,346 |
|
- |
|
- |
|
1,169 |
|
1,346 |
|
2,515 |
|
(208) |
|
1996 |
|
10/17/2011 |
|
Restaurants – Full Service |
|
Goodlettsville |
|
TN |
|
|
|
933 |
|
1,191 |
|
- |
|
- |
|
933 |
|
1,191 |
|
2,124 |
|
(159) |
|
1988 |
|
10/17/2011 |
|
Restaurants – Full Service |
|
Lebanon |
|
TN |
|
|
|
1,037 |
|
1,134 |
|
- |
|
- |
|
1,037 |
|
1,134 |
|
2,171 |
|
(165) |
|
1997 |
|
10/17/2011 |
|
Restaurants – Full Service |
|
Morristown |
|
TN |
|
|
|
803 |
|
1,578 |
|
- |
|
- |
|
803 |
|
1,578 |
|
2,381 |
|
(238) |
|
2000 |
|
10/17/2011 |
|
Restaurants – Full Service |
|
Lynchburg |
|
VA |
|
|
|
903 |
|
1,078 |
|
- |
|
- |
|
903 |
|
1,078 |
|
1,981 |
|
(195) |
|
2001 |
|
10/17/2011 |
|
Restaurants – Limited Service |
|
Bradenton |
|
FL |
|
(f) |
|
785 |
|
276 |
|
- |
|
- |
|
785 |
|
276 |
|
1,061 |
|
(103) |
|
1984 |
|
10/19/2011 |
|
Restaurants – Limited Service |
|
Sarasota |
|
FL |
|
(f) |
|
848 |
|
410 |
|
- |
|
- |
|
848 |
|
410 |
|
1,258 |
|
(137) |
|
1981 |
|
10/19/2011 |
|
Automotive Repair and Maintenance |
|
Prescott Valley |
|
AZ |
|
(f) |
|
241 |
|
259 |
|
- |
|
- |
|
241 |
|
259 |
|
500 |
|
(33) |
|
2003 |
|
11/01/2011 |
|
Automotive Repair and Maintenance |
|
Snowflake |
|
AZ |
|
(f) |
|
276 |
|
134 |
|
- |
|
- |
|
276 |
|
134 |
|
410 |
|
(19) |
|
1998 |
|
11/01/2011 |
|
Restaurants – Full Service |
|
Davenport |
|
IA |
|
(f) |
|
1,613 |
|
2,210 |
|
- |
|
- |
|
1,613 |
|
2,210 |
|
3,823 |
|
(323) |
|
2003 |
|
11/07/2011 |
|
Restaurants – Full Service |
|
Eagan |
|
MN |
|
(f) |
|
1,481 |
|
2,958 |
|
- |
|
- |
|
1,481 |
|
2,958 |
|
4,439 |
|
(295) |
|
1998 |
|
11/07/2011 |
|
Health Clubs |
|
Edinburg |
|
TX |
|
(f) |
|
865 |
|
4,109 |
|
- |
|
116 |
|
865 |
|
4,225 |
|
5,090 |
|
(491) |
|
1994 |
|
11/18/2011 |
|
Health Clubs |
|
McAllen |
|
TX |
|
(f) |
|
1,423 |
|
1,540 |
|
- |
|
88 |
|
1,423 |
|
1,628 |
|
3,051 |
|
(174) |
|
2004 |
|
11/18/2011 |
|
Health Clubs |
|
Mission |
|
TX |
|
(f) |
|
692 |
|
2,408 |
|
- |
|
49 |
|
692 |
|
2,457 |
|
3,149 |
|
(246) |
|
2000 |
|
11/18/2011 |
|
Motion Picture and Video Industries |
|
Owasso |
|
OK |
|
(f) |
|
986 |
|
3,926 |
|
- |
|
- |
|
986 |
|
3,926 |
|
4,912 |
|
(508) |
|
1992 |
|
12/16/2011 |
|
Other Personal Services |
|
Erlanger |
|
KY |
|
(f) |
|
604 |
|
1,809 |
|
- |
|
- |
|
604 |
|
1,809 |
|
2,413 |
|
(225) |
|
2000 |
|
12/22/2011 |
|
Other Personal Services |
|
Louisville |
|
KY |
|
(f) |
|
492 |
|
2,022 |
|
- |
|
- |
|
492 |
|
2,022 |
|
2,514 |
|
(234) |
|
2003 |
|
12/22/2011 |
|
Iron and Steel Mills and Ferroalloy Manufacturing |
|
Troy |
|
MI |
|
(f) |
|
510 |
|
2,388 |
|
- |
|
- |
|
510 |
|
2,388 |
|
2,898 |
|
(399) |
|
1962 |
|
12/22/2011 |
|
Other Personal Services |
|
Cincinnati |
|
OH |
|
(f) |
|
547 |
|
1,967 |
|
- |
|
- |
|
547 |
|
1,967 |
|
2,514 |
|
(240) |
|
2005 |
|
12/22/2011 |
|
Restaurants – Full Service |
|
Snyder |
|
TX |
|
(f) |
|
177 |
|
740 |
|
- |
|
- |
|
177 |
|
740 |
|
917 |
|
(95) |
|
1974 |
|
12/22/2011 |
|
Basic Chemical Manufacturing |
|
Elk Grove Village |
|
IL |
|
(f) |
|
854 |
|
1,460 |
|
- |
|
- |
|
854 |
|
1,460 |
|
2,314 |
|
(176) |
|
1964 |
|
12/29/2011 |
|
Basic Chemical Manufacturing |
|
Wheeling |
|
IL |
|
(f) |
|
1,463 |
|
3,064 |
|
- |
|
- |
|
1,463 |
|
3,064 |
|
4,527 |
|
(377) |
|
1966 |
|
12/29/2011 |
|
Motion Picture and Video Industries |
|
Vancouver |
|
WA |
|
(f) |
|
1,644 |
|
5,792 |
|
- |
|
- |
|
1,644 |
|
5,792 |
|
7,436 |
|
(578) |
|
2005 |
|
12/29/2011 |
|
Restaurants – Limited Service |
|
Leadington |
|
MO |
|
(f) |
|
494 |
|
499 |
|
- |
|
- |
|
494 |
|
499 |
|
993 |
|
(75) |
|
1978 |
|
12/30/2011 |
|
Restaurants – Limited Service |
|
St. Louis |
|
MO |
|
(f) |
|
395 |
|
393 |
|
- |
|
- |
|
395 |
|
393 |
|
788 |
|
(48) |
|
1977 |
|
12/30/2011 |
|
Child Day Care Services |
|
Blue Ash |
|
OH |
|
(f) |
|
739 |
|
2,464 |
|
- |
|
- |
|
739 |
|
2,464 |
|
3,203 |
|
(226) |
|
1979 |
|
12/30/2011 |
|
Restaurants – Limited Service |
|
Marietta |
|
OH |
|
(f) |
|
435 |
|
677 |
|
- |
|
- |
|
435 |
|
677 |
|
1,112 |
|
(99) |
|
1986 |
|
12/30/2011 |
|
Restaurants – Limited Service |
|
Salem |
|
OH |
|
(f) |
|
205 |
|
676 |
|
- |
|
- |
|
205 |
|
676 |
|
881 |
|
(87) |
|
1969 |
|
12/30/2011 |
|
Restaurants – Limited Service |
|
Warren |
|
OH |
|
(f) |
|
328 |
|
612 |
|
- |
|
- |
|
328 |
|
612 |
|
940 |
|
(87) |
|
1988 |
|
12/30/2011 |
F-2
|
Descriptions (a) |
|
|
|
Initial Cost to Company |
|
Costs Capitalized |
|
Gross amount at December 31, 2014 (b) (c) |
|
|
|
|
|
|
||||||||||||
|
Tenant Industry |
|
City |
|
St |
|
Encumbrances |
|
Land & |
|
Building & |
|
Land & |
|
Building & |
|
Land & |
|
Building & |
|
Total |
|
Accumulated |
|
Year |
|
Date |
|
Restaurants – Limited Service |
|
McKees Rocks |
|
PA |
|
(f) |
|
556 |
|
692 |
|
- |
|
- |
|
556 |
|
692 |
|
1,248 |
|
(92) |
|
1984 |
|
12/30/2011 |
|
Restaurants – Limited Service |
|
Pittsburgh |
|
PA |
|
(f) |
|
364 |
|
440 |
|
- |
|
- |
|
364 |
|
440 |
|
804 |
|
(57) |
|
1989 |
|
12/30/2011 |
|
Restaurants – Limited Service |
|
Clinton |
|
TN |
|
(f) |
|
454 |
|
653 |
|
- |
|
- |
|
454 |
|
653 |
|
1,107 |
|
(96) |
|
1984 |
|
12/30/2011 |
|
Child Day Care Services |
|
Franklin |
|
TN |
|
(f) |
|
1,782 |
|
2,422 |
|
- |
|
- |
|
1,782 |
|
2,422 |
|
4,204 |
|
(317) |
|
2010 |
|
12/30/2011 |
|
Restaurants – Limited Service |
|
Greeneville |
|
TN |
|
(f) |
|
566 |
|
491 |
|
- |
|
- |
|
566 |
|
491 |
|
1,057 |
|
(82) |
|
1985 |
|
12/30/2011 |
|
Restaurants – Limited Service |
|
Knoxville |
|
TN |
|
(f) |
|
405 |
|
702 |
|
- |
|
- |
|
405 |
|
702 |
|
1,107 |
|
(107) |
|
1986 |
|
12/30/2011 |
|
Restaurants – Limited Service |
|
Knoxville |
|
TN |
|
(f) |
|
775 |
|
734 |
|
- |
|
- |
|
775 |
|
734 |
|
1,509 |
|
(103) |
|
1979 |
|
12/30/2011 |
|
Restaurants – Limited Service |
|
Maryville |
|
TN |
|
(f) |
|
542 |
|
414 |
|
45 |
|
309 |
|
587 |
|
723 |
|
1,310 |
|
(81) |
|
1983 |
|
12/30/2011 |
|
Restaurants – Limited Service |
|
Newport |
|
TN |
|
(f) |
|
484 |
|
623 |
|
- |
|
- |
|
484 |
|
623 |
|
1,107 |
|
(103) |
|
1987 |
|
12/30/2011 |
|
Restaurants – Limited Service |
|
Wichita Falls |
|
TX |
|
(f) |
|
198 |
|
491 |
|
- |
|
- |
|
198 |
|
491 |
|
689 |
|
(68) |
|
1984 |
|
12/30/2011 |
|
Restaurants – Limited Service |
|
Wichita Falls |
|
TX |
|
(f) |
|
253 |
|
535 |
|
- |
|
- |
|
253 |
|
535 |
|
788 |
|
(76) |
|
1986 |
|
12/30/2011 |
|
Restaurants – Limited Service |
|
New Martinsville |
|
WV |
|
(f) |
|
269 |
|
475 |
|
- |
|
- |
|
269 |
|
475 |
|
744 |
|
(65) |
|
1978 |
|
12/30/2011 |
|
Restaurants – Limited Service |
|
Parkersburg |
|
WV |
|
(f) |
|
245 |
|
461 |
|
- |
|
- |
|
245 |
|
461 |
|
706 |
|
(61) |
|
1987 |
|
12/30/2011 |
|
Restaurants – Limited Service |
|
Parkersburg |
|
WV |
|
(f) |
|
769 |
|
301 |
|
- |
|
- |
|
769 |
|
301 |
|
1,070 |
|
(50) |
|
1986 |
|
12/30/2011 |
|
Restaurants – Limited Service |
|
Wheeling |
|
WV |
|
(f) |
|
357 |
|
714 |
|
- |
|
- |
|
357 |
|
714 |
|
1,071 |
|
(103) |
|
1986 |
|
12/30/2011 |
|
Family Entertainment Centers |
|
Frisco |
|
TX |
|
(f) |
|
3,705 |
|
5,109 |
|
- |
|
- |
|
3,705 |
|
5,109 |
|
8,814 |
|
(509) |
|
2008 |
|
01/27/2012 |
|
Family Entertainment Centers |
|
Lubbock |
|
TX |
|
(f) |
|
2,056 |
|
6,658 |
|
- |
|
- |
|
2,056 |
|
6,658 |
|
8,714 |
|
(652) |
|
2007 |
|
01/27/2012 |
|
Junior Colleges |
|
Fresno |
|
CA |
|
(f) |
|
2,063 |
|
1,984 |
|
- |
|
- |
|
2,063 |
|
1,984 |
|
4,047 |
|
(274) |
|
1966 |
|
02/29/2012 |
|
Junior Colleges |
|
Rancho Cordova |
|
CA |
|
(f) |
|
3,108 |
|
3,587 |
|
- |
|
- |
|
3,108 |
|
3,587 |
|
6,695 |
|
(406) |
|
1984 |
|
02/29/2012 |
|
Junior Colleges |
|
Roseville |
|
CA |
|
(f) |
|
3,352 |
|
5,941 |
|
- |
|
- |
|
3,352 |
|
5,941 |
|
9,293 |
|
(638) |
|
1999 |
|
02/29/2012 |
|
Junior Colleges |
|
Milpitas |
|
CA |
|
12,326 |
|
5,749 |
|
8,840 |
|
- |
|
- |
|
5,749 |
|
8,840 |
|
14,589 |
|
(785) |
|
1987 |
|
02/29/2012 |
|
Junior Colleges |
|
Stockton |
|
CA |
|
|
|
1,789 |
|
3,557 |
|
- |
|
- |
|
1,789 |
|
3,557 |
|
5,346 |
|
(428) |
|
1990 |
|
02/29/2012 |
|
Motion Picture and Video Industries |
|
Bethlehem |
|
GA |
|
(f) |
|
1,888 |
|
5,168 |
|
- |
|
- |
|
1,888 |
|
5,168 |
|
7,056 |
|
(432) |
|
2011 |
|
03/15/2012 |
|
Restaurants – Limited Service |
|
Cherryville |
|
NC |
|
(f) |
|
461 |
|
650 |
|
- |
|
- |
|
461 |
|
650 |
|
1,111 |
|
(70) |
|
2005 |
|
03/28/2012 |
|
Restaurants – Limited Service |
|
Hudson |
|
NC |
|
(f) |
|
215 |
|
996 |
|
- |
|
- |
|
215 |
|
996 |
|
1,211 |
|
(82) |
|
1984 |
|
03/28/2012 |
|
Restaurants – Limited Service |
|
Maiden |
|
NC |
|
(f) |
|
557 |
|
533 |
|
- |
|
- |
|
557 |
|
533 |
|
1,090 |
|
(58) |
|
1987 |
|
03/28/2012 |
|
Restaurants – Limited Service |
|
Marion |
|
NC |
|
(f) |
|
322 |
|
637 |
|
- |
|
- |
|
322 |
|
637 |
|
959 |
|
(67) |
|
1999 |
|
03/28/2012 |
|
Restaurants – Limited Service |
|
Richfield |
|
NC |
|
(f) |
|
361 |
|
720 |
|
- |
|
- |
|
361 |
|
720 |
|
1,081 |
|
(76) |
|
2007 |
|
03/28/2012 |
|
Restaurants – Limited Service |
|
West Jefferson |
|
NC |
|
(f) |
|
357 |
|
854 |
|
- |
|
- |
|
357 |
|
854 |
|
1,211 |
|
(88) |
|
1996 |
|
03/28/2012 |
|
Restaurants – Full Service |
|
Naperville |
|
IL |
|
(f) |
|
1,869 |
|
3,154 |
|
- |
|
- |
|
1,869 |
|
3,154 |
|
5,023 |
|
(246) |
|
2011 |
|
03/30/2012 |
|
Restaurants – Full Service |
|
Wheeling |
|
IL |
|
(f) |
|
824 |
|
2,441 |
|
- |
|
- |
|
824 |
|
2,441 |
|
3,265 |
|
(168) |
|
2008 |
|
03/30/2012 |
|
Child Day Care Services |
|
Arlington |
|
TX |
|
(f) |
|
183 |
|
574 |
|
- |
|
- |
|
183 |
|
574 |
|
757 |
|
(88) |
|
1984 |
|
03/30/2012 |
|
Child Day Care Services |
|
Cedar Hill |
|
TX |
|
(f) |
|
285 |
|
569 |
|
- |
|
- |
|
285 |
|
569 |
|
854 |
|
(88) |
|
1984 |
|
03/30/2012 |
|
Child Day Care Services |
|
Grand Prairie |
|
TX |
|
(f) |
|
292 |
|
581 |
|
- |
|
- |
|
292 |
|
581 |
|
873 |
|
(91) |
|
1985 |
|
03/30/2012 |
|
Child Day Care Services |
|
Haltom City |
|
TX |
|
(f) |
|
362 |
|
415 |
|
- |
|
- |
|
362 |
|
415 |
|
777 |
|
(64) |
|
1985 |
|
03/30/2012 |
|
Child Day Care Services |
|
Watauga |
|
TX |
|
(f) |
|
174 |
|
622 |
|
- |
|
- |
|
174 |
|
622 |
|
796 |
|
(97) |
|
1986 |
|
03/30/2012 |
|
Furniture Stores |
|
Tacoma |
|
WA |
|
(f) |
|
2,213 |
|
3,319 |
|
- |
|
817 |
|
2,213 |
|
4,136 |
|
6,349 |
|
(314) |
|
1994 |
|
04/20/2012 |
|
Other Personal Services |
|
Dayton |
|
OH |
|
(f) |
|
574 |
|
1,937 |
|
- |
|
- |
|
574 |
|
1,937 |
|
2,511 |
|
(201) |
|
2008 |
|
04/30/2012 |
|
Child Day Care Services |
|
Tucson |
|
AZ |
|
(f) |
|
2,674 |
|
4,120 |
|
- |
|
- |
|
2,674 |
|
4,120 |
|
6,794 |
|
(504) |
|
2008 |
|
05/08/2012 |
|
Furniture Stores |
|
Tucson |
|
AZ |
|
(f) |
|
1,371 |
|
4,170 |
|
- |
|
- |
|
1,371 |
|
4,170 |
|
5,541 |
|
(392) |
|
2003 |
|
05/10/2012 |
|
Restaurants – Full Service |
|
Troy |
|
MI |
|
(f) |
|
1,503 |
|
2,506 |
|
- |
|
- |
|
1,503 |
|
2,506 |
|
4,009 |
|
(167) |
|
2012 |
|
05/15/2012 |
|
Restaurants – Limited Service |
|
Graham |
|
TX |
|
(f) |
|
212 |
|
581 |
|
- |
|
- |
|
212 |
|
581 |
|
793 |
|
(84) |
|
1998 |
|
05/15/2012 |
|
Motion Picture and Video Industries |
|
Ardmore |
|
OK |
|
(f) |
|
1,302 |
|
3,095 |
|
- |
|
- |
|
1,302 |
|
3,095 |
|
4,397 |
|
(278) |
|
2008 |
|
05/17/2012 |
|
Restaurants – Limited Service |
|
Carrollton |
|
GA |
|
(f) |
|
467 |
|
627 |
|
- |
|
- |
|
467 |
|
627 |
|
1,094 |
|
(64) |
|
1980 |
|
05/18/2012 |
|
Restaurants – Limited Service |
|
Cedartown |
|
GA |
|
(f) |
|
319 |
|
502 |
|
- |
|
- |
|
319 |
|
502 |
|
821 |
|
(53) |
|
1981 |
|
05/18/2012 |
|
Restaurants – Limited Service |
|
College Park |
|
GA |
|
(f) |
|
918 |
|
227 |
|
- |
|
- |
|
918 |
|
227 |
|
1,145 |
|
(24) |
|
1973 |
|
05/18/2012 |
|
Restaurants – Limited Service |
|
Dalton |
|
GA |
|
(f) |
|
337 |
|
483 |
|
- |
|
- |
|
337 |
|
483 |
|
820 |
|
(51) |
|
1980 |
|
05/18/2012 |
|
Restaurants – Limited Service |
|
Decatur |
|
GA |
|
(f) |
|
378 |
|
484 |
|
- |
|
- |
|
378 |
|
484 |
|
862 |
|
(73) |
|
1981 |
|
05/18/2012 |
|
Restaurants – Limited Service |
|
Lithonia |
|
GA |
|
(f) |
|
469 |
|
706 |
|
- |
|
- |
|
469 |
|
706 |
|
1,175 |
|
(102) |
|
1979 |
|
05/18/2012 |
|
Restaurants – Limited Service |
|
Macon |
|
GA |
|
(f) |
|
379 |
|
716 |
|
- |
|
- |
|
379 |
|
716 |
|
1,095 |
|
(103) |
|
1975 |
|
05/18/2012 |
|
Restaurants – Limited Service |
|
McDonough |
|
GA |
|
(f) |
|
304 |
|
719 |
|
- |
|
- |
|
304 |
|
719 |
|
1,023 |
|
(74) |
|
2001 |
|
05/18/2012 |
F-3
|
Descriptions (a) |
|
|
|
Initial Cost to Company |
|
Costs Capitalized |
|
Gross amount at December 31, 2014 (b) (c) |
|
|
|
|
|
|
||||||||||||
|
Tenant Industry |
|
City |
|
St |
|
Encumbrances |
|
Land & |
|
Building & |
|
Land & |
|
Building & |
|
Land & |
|
Building & |
|
Total |
|
Accumulated |
|
Year |
|
Date |
|
Restaurants – Limited Service |
|
Riverdale |
|
GA |
|
(f) |
|
241 |
|
874 |
|
- |
|
- |
|
241 |
|
874 |
|
1,115 |
|
(126) |
|
1976 |
|
05/18/2012 |
|
Restaurants – Limited Service |
|
Savannah |
|
GA |
|
(f) |
|
422 |
|
946 |
|
- |
|
- |
|
422 |
|
946 |
|
1,368 |
|
(96) |
|
1973 |
|
05/18/2012 |
|
Restaurants – Limited Service |
|
Ooltewah |
|
TN |
|
(f) |
|
458 |
|
687 |
|
- |
|
- |
|
458 |
|
687 |
|
1,145 |
|
(70) |
|
1999 |
|
05/18/2012 |
|
Health Clubs |
|
Kansas City |
|
MO |
|
(f) |
|
1,259 |
|
895 |
|
28 |
|
1,510 |
|
1,287 |
|
2,405 |
|
3,692 |
|
(191) |
|
2007 |
|
05/24/2012 |
|
Restaurants – Full Service |
|
Franklin |
|
NC |
|
(f) |
|
573 |
|
1,087 |
|
- |
|
- |
|
573 |
|
1,087 |
|
1,660 |
|
(123) |
|
2008 |
|
05/24/2012 |
|
Restaurants – Full Service |
|
Morganton |
|
NC |
|
(f) |
|
1,125 |
|
708 |
|
- |
|
- |
|
1,125 |
|
708 |
|
1,833 |
|
(76) |
|
2002 |
|
05/24/2012 |
|
Restaurants – Full Service |
|
Rockingham |
|
NC |
|
(f) |
|
1,111 |
|
870 |
|
- |
|
- |
|
1,111 |
|
870 |
|
1,981 |
|
(94) |
|
2005 |
|
05/24/2012 |
|
Restaurants – Full Service |
|
Aiken |
|
SC |
|
(f) |
|
1,009 |
|
974 |
|
- |
|
- |
|
1,009 |
|
974 |
|
1,983 |
|
(109) |
|
2006 |
|
05/24/2012 |
|
Restaurants – Full Service |
|
Rock Hill |
|
SC |
|
(f) |
|
1,121 |
|
778 |
|
- |
|
- |
|
1,121 |
|
778 |
|
1,899 |
|
(83) |
|
2004 |
|
05/24/2012 |
|
Health Clubs |
|
Richland |
|
WA |
|
(f) |
|
1,758 |
|
7,296 |
|
- |
|
- |
|
1,758 |
|
7,296 |
|
9,054 |
|
(583) |
|
2012 |
|
06/12/2012 |
|
Child Day Care Services |
|
Pearland |
|
TX |
|
(f) |
|
1,345 |
|
6,257 |
|
608 |
|
2,542 |
|
1,953 |
|
8,799 |
|
10,752 |
|
(547) |
|
2011 |
|
06/20/2012 |
|
Restaurants – Full Service |
|
Aiken |
|
SC |
|
(f) |
|
547 |
|
1,587 |
|
- |
|
- |
|
547 |
|
1,587 |
|
2,134 |
|
(134) |
|
2009 |
|
06/21/2012 |
|
Health Clubs |
|
Fairfield |
|
CA |
|
(f) |
|
1,564 |
|
1,949 |
|
542 |
|
1,758 |
|
2,106 |
|
3,707 |
|
5,813 |
|
(236) |
|
1978 |
|
06/27/2012 |
|
Restaurants – Limited Service |
|
Altamonte Springs |
|
FL |
|
(f) |
|
438 |
|
- |
|
- |
|
- |
|
438 |
|
- |
|
438 |
|
- |
|
1978 |
|
06/27/2012 |
|
Restaurants – Limited Service |
|
Apopka |
|
FL |
|
(f) |
|
550 |
|
- |
|
- |
|
- |
|
550 |
|
- |
|
550 |
|
- |
|
1988 |
|
06/27/2012 |
|
Restaurants – Limited Service |
|
Fort Pierce |
|
FL |
|
(f) |
|
153 |
|
- |
|
- |
|
- |
|
153 |
|
- |
|
153 |
|
- |
|
1979 |
|
06/27/2012 |
|
Restaurants – Limited Service |
|
Jacksonville |
|
FL |
|
(f) |
|
550 |
|
- |
|
- |
|
- |
|
550 |
|
- |
|
550 |
|
- |
|
1986 |
|
06/27/2012 |
|
Restaurants – Limited Service |
|
Jacksonville |
|
FL |
|
(f) |
|
234 |
|
- |
|
- |
|
- |
|
234 |
|
- |
|
234 |
|
- |
|
1985 |
|
06/27/2012 |
|
Restaurants – Limited Service |
|
Jacksonville |
|
FL |
|
(f) |
|
326 |
|
- |
|
- |
|
- |
|
326 |
|
- |
|
326 |
|
- |
|
1981 |
|
06/27/2012 |
|
Restaurants – Limited Service |
|
Jacksonville |
|
FL |
|
(f) |
|
275 |
|
- |
|
- |
|
- |
|
275 |
|
- |
|
275 |
|
- |
|
1980 |
|
06/27/2012 |
|
Restaurants – Limited Service |
|
Jacksonville |
|
FL |
|
(f) |
|
285 |
|
- |
|
- |
|
- |
|
285 |
|
- |
|
285 |
|
- |
|
1982 |
|
06/27/2012 |
|
Restaurants – Limited Service |
|
Kissimmee |
|
FL |
|
(f) |
|
601 |
|
- |
|
- |
|
- |
|
601 |
|
- |
|
601 |
|
- |
|
1981 |
|
06/27/2012 |
|
Restaurants – Limited Service |
|
Lake City |
|
FL |
|
(f) |
|
224 |
|
- |
|
- |
|
- |
|
224 |
|
- |
|
224 |
|
- |
|
1978 |
|
06/27/2012 |
|
Restaurants – Limited Service |
|
Merritt Island |
|
FL |
|
(f) |
|
316 |
|
- |
|
- |
|
- |
|
316 |
|
- |
|
316 |
|
- |
|
1983 |
|
06/27/2012 |
|
Restaurants – Limited Service |
|
Orange Park |
|
FL |
|
(f) |
|
326 |
|
- |
|
- |
|
- |
|
326 |
|
- |
|
326 |
|
- |
|
1985 |
|
06/27/2012 |
|
Restaurants – Limited Service |
|
Orlando |
|
FL |
|
(f) |
|
285 |
|
- |
|
- |
|
- |
|
285 |
|
- |
|
285 |
|
- |
|
1981 |
|
06/27/2012 |
|
Restaurants – Limited Service |
|
Palatka |
|
FL |
|
(f) |
|
1,110 |
|
- |
|
- |
|
- |
|
1,110 |
|
- |
|
1,110 |
|
- |
|
1997 |
|
06/27/2012 |
|
Restaurants – Limited Service |
|
Plant City |
|
FL |
|
(f) |
|
621 |
|
- |
|
- |
|
- |
|
621 |
|
- |
|
621 |
|
- |
|
1988 |
|
06/27/2012 |
|
Restaurants – Limited Service |
|
Sanford |
|
FL |
|
(f) |
|
407 |
|
- |
|
- |
|
- |
|
407 |
|
- |
|
407 |
|
- |
|
1986 |
|
06/27/2012 |
|
Restaurants – Limited Service |
|
Tallahassee |
|
FL |
|
(f) |
|
306 |
|
- |
|
- |
|
- |
|
306 |
|
- |
|
306 |
|
- |
|
1978 |
|
06/27/2012 |
|
Restaurants – Limited Service |
|
Fairview Heights |
|
IL |
|
(f) |
|
326 |
|
- |
|
- |
|
- |
|
326 |
|
- |
|
326 |
|
- |
|
1986 |
|
06/27/2012 |
|
Child Day Care Services |
|
South Elgin |
|
IL |
|
(f) |
|
574 |
|
2,508 |
|
- |
|
- |
|
574 |
|
2,508 |
|
3,082 |
|
(186) |
|
2009 |
|
06/27/2012 |
|
Restaurants – Limited Service |
|
Monroe |
|
LA |
|
(f) |
|
266 |
|
- |
|
- |
|
- |
|
266 |
|
- |
|
266 |
|
- |
|
1998 |
|
06/27/2012 |
|
Restaurants – Limited Service |
|
West Monroe |
|
LA |
|
(f) |
|
511 |
|
- |
|
- |
|
- |
|
511 |
|
- |
|
511 |
|
- |
|
2000 |
|
06/27/2012 |
|
Restaurants – Limited Service |
|
Brookhaven |
|
MS |
|
(f) |
|
337 |
|
- |
|
- |
|
- |
|
337 |
|
- |
|
337 |
|
- |
|
1979 |
|
06/27/2012 |
|
Restaurants – Limited Service |
|
Byram |
|
MS |
|
(f) |
|
306 |
|
- |
|
- |
|
- |
|
306 |
|
- |
|
306 |
|
- |
|
1993 |
|
06/27/2012 |
|
Restaurants – Limited Service |
|
Canton |
|
MS |
|
(f) |
|
133 |
|
- |
|
- |
|
- |
|
133 |
|
- |
|
133 |
|
- |
|
1991 |
|
06/27/2012 |
|
Restaurants – Limited Service |
|
Clarksdale |
|
MS |
|
(f) |
|
276 |
|
- |
|
- |
|
- |
|
276 |
|
- |
|
276 |
|
- |
|
1979 |
|
06/27/2012 |
|
Restaurants – Limited Service |
|
Cleveland |
|
MS |
|
(f) |
|
- |
|
- |
|
- |
|
- |
|
- |
|
- |
|
- |
|
- |
|
1991 |
|
06/27/2012 |
|
Restaurants – Limited Service |
|
Clinton |
|
MS |
|
(f) |
|
337 |
|
- |
|
- |
|
- |
|
337 |
|
- |
|
337 |
|
- |
|
1994 |
|
06/27/2012 |
|
Restaurants – Limited Service |
|
McComb |
|
MS |
|
(f) |
|
337 |
|
- |
|
- |
|
- |
|
337 |
|
- |
|
337 |
|
- |
|
1985 |
|
06/27/2012 |
|
Restaurants – Limited Service |
|
Starkville |
|
MS |
|
(f) |
|
184 |
|
- |
|
- |
|
- |
|
184 |
|
- |
|
184 |
|
- |
|
1991 |
|
06/27/2012 |
|
Restaurants – Limited Service |
|
Tupelo |
|
MS |
|
(f) |
|
317 |
|
- |
|
- |
|
- |
|
317 |
|
- |
|
317 |
|
- |
|
1990 |
|
06/27/2012 |
|
Child Day Care Services |
|
Sicklerville |
|
NJ |
|
(f) |
|
403 |
|
2,527 |
|
- |
|
- |
|
403 |
|
2,527 |
|
2,930 |
|
(182) |
|
2008 |
|
06/27/2012 |
|
Child Day Care Services |
|
Collegeville |
|
PA |
|
(f) |
|
546 |
|
2,182 |
|
- |
|
- |
|
546 |
|
2,182 |
|
2,728 |
|
(161) |
|
2008 |
|
06/27/2012 |
|
Child Day Care Services |
|
Woodbridge |
|
VA |
|
(f) |
|
777 |
|
2,204 |
|
219 |
|
- |
|
996 |
|
2,204 |
|
3,200 |
|
(225) |
|
2002 |
|
06/27/2012 |
|
Grocery Stores |
|
Alabaster |
|
AL |
|
|
|
487 |
|
2,872 |
|
- |
|
- |
|
487 |
|
2,872 |
|
3,359 |
|
(267) |
|
1985 |
|
06/29/2012 |
|
Grocery Stores |
|
Atmore |
|
AL |
|
|
|
292 |
|
1,568 |
|
- |
|
- |
|
292 |
|
1,568 |
|
1,860 |
|
(144) |
|
1990 |
|
06/29/2012 |
|
Grocery Stores |
|
Brewton |
|
AL |
|
|
|
234 |
|
1,625 |
|
- |
|
- |
|
234 |
|
1,625 |
|
1,859 |
|
(149) |
|
1990 |
|
06/29/2012 |
|
Grocery Stores |
|
Enterprise |
|
AL |
|
|
|
744 |
|
2,045 |
|
- |
|
- |
|
744 |
|
2,045 |
|
2,789 |
|
(206) |
|
1987 |
|
06/29/2012 |
|
Grocery Stores |
|
Luverne |
|
AL |
|
|
|
234 |
|
1,425 |
|
- |
|
- |
|
234 |
|
1,425 |
|
1,659 |
|
(132) |
|
1992 |
|
06/29/2012 |
F-4
|
Descriptions (a) |
|
|
|
Initial Cost to Company |
|
Costs Capitalized |
|
Gross amount at December 31, 2014 (b) (c) |
|
|
|
|
|
|
||||||||||||
|
Tenant Industry |
|
City |
|
St |
|
Encumbrances |
|
Land & |
|
Building & |
|
Land & |
|
Building & |
|
Land & |
|
Building & |
|
Total |
|
Accumulated |
|
Year |
|
Date |
|
Grocery Stores |
|
Muscle Shoals |
|
AL |
|
|
|
521 |
|
2,089 |
|
- |
|
- |
|
521 |
|
2,089 |
|
2,610 |
|
(197) |
|
1982 |
|
06/29/2012 |
|
Grocery Stores |
|
Troy |
|
AL |
|
|
|
511 |
|
2,209 |
|
- |
|
- |
|
511 |
|
2,209 |
|
2,720 |
|
(217) |
|
1984 |
|
06/29/2012 |
|
Grocery Stores |
|
Albany |
|
GA |
|
|
|
628 |
|
2,571 |
|
- |
|
- |
|
628 |
|
2,571 |
|
3,199 |
|
(237) |
|
1992 |
|
06/29/2012 |
|
Grocery Stores |
|
Milledgeville |
|
GA |
|
|
|
652 |
|
2,317 |
|
- |
|
- |
|
652 |
|
2,317 |
|
2,969 |
|
(218) |
|
1994 |
|
06/29/2012 |
|
Other Motor Vehicle Dealers |
|
Oklahoma City |
|
OK |
|
(f) |
|
5,451 |
|
3,275 |
|
438 |
|
1,227 |
|
5,889 |
|
4,502 |
|
10,391 |
|
(1,019) |
|
1997 |
|
06/29/2012 |
|
Health Clubs |
|
Visalia |
|
CA |
|
3,326 |
|
1,382 |
|
4,928 |
|
- |
|
- |
|
1,382 |
|
4,928 |
|
6,310 |
|
(482) |
|
1975 |
|
07/06/2012 |
|
Restaurants – Full Service |
|
Alpharetta |
|
GA |
|
(f) |
|
866 |
|
3,520 |
|
- |
|
- |
|
866 |
|
3,520 |
|
4,386 |
|
(310) |
|
2001 |
|
07/17/2012 |
|
Restaurants – Full Service |
|
Newnan |
|
GA |
|
(f) |
|
1,114 |
|
1,847 |
|
- |
|
- |
|
1,114 |
|
1,847 |
|
2,961 |
|
(186) |
|
2005 |
|
07/17/2012 |
|
Restaurants – Full Service |
|
Peachtree City |
|
GA |
|
(f) |
|
1,280 |
|
1,750 |
|
- |
|
- |
|
1,280 |
|
1,750 |
|
3,030 |
|
(196) |
|
1999 |
|
07/17/2012 |
|
Restaurants – Full Service |
|
Suwanee |
|
GA |
|
(f) |
|
1,325 |
|
1,954 |
|
- |
|
- |
|
1,325 |
|
1,954 |
|
3,279 |
|
(191) |
|
2006 |
|
07/17/2012 |
|
Restaurants – Full Service |
|
Suwanee |
|
GA |
|
(f) |
|
1,168 |
|
1,624 |
|
- |
|
- |
|
1,168 |
|
1,624 |
|
2,792 |
|
(170) |
|
2005 |
|
07/17/2012 |
|
Restaurants – Full Service |
|
Huntersville |
|
NC |
|
(f) |
|
1,654 |
|
1,147 |
|
- |
|
- |
|
1,654 |
|
1,147 |
|
2,801 |
|
(101) |
|
2000 |
|
07/17/2012 |
|
Restaurants – Limited Service |
|
South St. Paul |
|
MN |
|
(f) |
|
357 |
|
498 |
|
60 |
|
240 |
|
417 |
|
738 |
|
1,155 |
|
(105) |
|
1987 |
|
07/19/2012 |
|
Elementary and Secondary Schools |
|
Scottsdale |
|
AZ |
|
(f) |
|
3,729 |
|
6,288 |
|
- |
|
- |
|
3,729 |
|
6,288 |
|
10,017 |
|
(561) |
|
1991 |
|
07/25/2012 |
|
Home Furnishings Stores |
|
Dayton |
|
OH |
|
(f) |
|
369 |
|
1,318 |
|
- |
|
- |
|
369 |
|
1,318 |
|
1,687 |
|
(127) |
|
1996 |
|
07/26/2012 |
|
Home Furnishings Stores |
|
Fairborn |
|
OH |
|
(f) |
|
418 |
|
872 |
|
- |
|
- |
|
418 |
|
872 |
|
1,290 |
|
(83) |
|
2006 |
|
07/26/2012 |
|
Home Furnishings Stores |
|
Heath |
|
OH |
|
(f) |
|
818 |
|
1,171 |
|
- |
|
- |
|
818 |
|
1,171 |
|
1,989 |
|
(100) |
|
2004 |
|
07/26/2012 |
|
Other Personal Services |
|
Columbus |
|
OH |
|
(f) |
|
853 |
|
1,655 |
|
- |
|
- |
|
853 |
|
1,655 |
|
2,508 |
|
(174) |
|
2012 |
|
07/27/2012 |
|
Motion Picture and Video Industries |
|
Corpus Christi |
|
TX |
|
|
|
5,954 |
|
9,373 |
|
- |
|
- |
|
5,954 |
|
9,373 |
|
15,327 |
|
(1,188) |
|
1995 |
|
08/21/2012 |
|
Motion Picture and Video Industries |
|
Forney |
|
TX |
|
|
|
2,740 |
|
2,904 |
|
- |
|
- |
|
2,740 |
|
2,904 |
|
5,644 |
|
(292) |
|
2006 |
|
08/21/2012 |
|
Motion Picture and Video Industries |
|
Fort Worth |
|
TX |
|
24,805 |
|
3,105 |
|
7,677 |
|
- |
|
- |
|
3,105 |
|
7,677 |
|
10,782 |
|
(744) |
|
2010 |
|
08/21/2012 |
|
Motion Picture and Video Industries |
|
Irving |
|
TX |
|
|
|
1,976 |
|
1,172 |
|
- |
|
- |
|
1,976 |
|
1,172 |
|
3,148 |
|
(150) |
|
1995 |
|
08/21/2012 |
|
Motion Picture and Video Industries |
|
Rio Grande City |
|
TX |
|
|
|
1,933 |
|
3,196 |
|
- |
|
- |
|
1,933 |
|
3,196 |
|
5,129 |
|
(316) |
|
2008 |
|
08/21/2012 |
|
Restaurants – Limited Service |
|
Hancock |
|
MD |
|
(f) |
|
490 |
|
347 |
|
- |
|
- |
|
490 |
|
347 |
|
837 |
|
(44) |
|
1987 |
|
08/29/2012 |
|
Restaurants – Limited Service |
|
Chambersburg |
|
PA |
|
(f) |
|
539 |
|
666 |
|
- |
|
- |
|
539 |
|
666 |
|
1,205 |
|
(70) |
|
1989 |
|
08/29/2012 |
|
Restaurants – Limited Service |
|
Greencastle |
|
PA |
|
(f) |
|
767 |
|
638 |
|
- |
|
- |
|
767 |
|
638 |
|
1,405 |
|
(70) |
|
1986 |
|
08/29/2012 |
|
Child Day Care Services |
|
Gilbert |
|
AZ |
|
|
|
453 |
|
1,639 |
|
- |
|
- |
|
453 |
|
1,639 |
|
2,092 |
|
(111) |
|
1996 |
|
08/30/2012 |
|
Child Day Care Services |
|
Gilbert |
|
AZ |
|
6,207 |
|
393 |
|
1,699 |
|
- |
|
- |
|
393 |
|
1,699 |
|
2,092 |
|
(110) |
|
2002 |
|
08/30/2012 |
|
Child Day Care Services |
|
Phoenix |
|
AZ |
|
|
|
877 |
|
2,311 |
|
- |
|
- |
|
877 |
|
2,311 |
|
3,188 |
|
(177) |
|
2003 |
|
08/30/2012 |
|
Child Day Care Services |
|
Phoenix |
|
AZ |
|
|
|
595 |
|
2,094 |
|
- |
|
- |
|
595 |
|
2,094 |
|
2,689 |
|
(148) |
|
2006 |
|
08/30/2012 |
|
Child Day Care Services |
|
Plainfield |
|
IL |
|
(f) |
|
390 |
|
699 |
|
- |
|
- |
|
390 |
|
699 |
|
1,089 |
|
(62) |
|
2008 |
|
09/07/2012 |
|
Other Motor Vehicle Dealers |
|
Garner |
|
NC |
|
(f) |
|
2,163 |
|
342 |
|
329 |
|
2,938 |
|
2,492 |
|
3,280 |
|
5,772 |
|
(148) |
|
1997 |
|
09/13/2012 |
|
Other Motor Vehicle Dealers |
|
Hope Mills |
|
NC |
|
(f) |
|
1,462 |
|
1,437 |
|
- |
|
- |
|
1,462 |
|
1,437 |
|
2,899 |
|
(183) |
|
1993 |
|
09/13/2012 |
|
Motion Picture and Video Industries |
|
Savoy |
|
IL |
|
(f) |
|
2,764 |
|
3,552 |
|
212 |
|
5,787 |
|
2,976 |
|
9,339 |
|
12,315 |
|
(492) |
|
1990 |
|
09/25/2012 |
|
Restaurants – Full Service |
|
Lumberton |
|
NC |
|
(f) |
|
676 |
|
451 |
|
- |
|
- |
|
676 |
|
451 |
|
1,127 |
|
(45) |
|
1999 |
|
09/25/2012 |
|
Restaurants – Full Service |
|
Morehead City |
|
NC |
|
(f) |
|
559 |
|
507 |
|
- |
|
- |
|
559 |
|
507 |
|
1,066 |
|
(51) |
|
1995 |
|
09/25/2012 |
|
Restaurants – Full Service |
|
Morrisville |
|
NC |
|
(f) |
|
891 |
|
235 |
|
- |
|
- |
|
891 |
|
235 |
|
1,126 |
|
(28) |
|
1999 |
|
09/25/2012 |
|
Restaurants – Full Service |
|
Roanoke Rapids |
|
NC |
|
(f) |
|
464 |
|
471 |
|
- |
|
- |
|
464 |
|
471 |
|
935 |
|
(46) |
|
1998 |
|
09/25/2012 |
|
Restaurants – Full Service |
|
Rocky Mount |
|
NC |
|
(f) |
|
593 |
|
403 |
|
- |
|
- |
|
593 |
|
403 |
|
996 |
|
(42) |
|
1994 |
|
09/25/2012 |
|
Restaurants – Full Service |
|
Smithfield |
|
NC |
|
(f) |
|
702 |
|
384 |
|
- |
|
- |
|
702 |
|
384 |
|
1,086 |
|
(44) |
|
1998 |
|
09/25/2012 |
|
Restaurants – Full Service |
|
Wilson |
|
NC |
|
(f) |
|
631 |
|
304 |
|
- |
|
- |
|
631 |
|
304 |
|
935 |
|
(33) |
|
2001 |
|
09/25/2012 |
|
Restaurants – Full Service |
|
Charleston |
|
WV |
|
(f) |
|
496 |
|
399 |
|
- |
|
- |
|
496 |
|
399 |
|
895 |
|
(40) |
|
2004 |
|
09/25/2012 |
|
Child Day Care Services |
|
Columbus |
|
OH |
|
(f) |
|
937 |
|
1,135 |
|
- |
|
- |
|
937 |
|
1,135 |
|
2,072 |
|
(105) |
|
1992 |
|
09/28/2012 |
|
Furniture Stores |
|
Fairfield |
|
CA |
|
6,127 |
|
2,618 |
|
2,633 |
|
- |
|
- |
|
2,618 |
|
2,633 |
|
5,251 |
|
(217) |
|
2006 |
|
10/01/2012 |
|
Furniture Stores |
|
Rohnert Park |
|
CA |
|
|
|
2,115 |
|
3,362 |
|
- |
|
- |
|
2,115 |
|
3,362 |
|
5,477 |
|
(272) |
|
2006 |
|
10/01/2012 |
|
Child Day Care Services |
|
Oak Creek |
|
WI |
|
(f) |
|
781 |
|
1,657 |
|
- |
|
- |
|
781 |
|
1,657 |
|
2,438 |
|
(126) |
|
2009 |
|
10/02/2012 |
|
Restaurants – Full Service |
|
Wheeling |
|
IL |
|
(f) |
|
1,116 |
|
1,090 |
|
31 |
|
469 |
|
1,147 |
|
1,559 |
|
2,706 |
|
(130) |
|
2007 |
|
10/05/2012 |
|
Restaurants – Full Service |
|
Auburn |
|
IN |
|
(f) |
|
750 |
|
1,420 |
|
- |
|
- |
|
750 |
|
1,420 |
|
2,170 |
|
(140) |
|
2000 |
|
10/05/2012 |
|
Restaurants – Full Service |
|
Fort Wayne |
|
IN |
|
(f) |
|
946 |
|
1,335 |
|
- |
|
- |
|
946 |
|
1,335 |
|
2,281 |
|
(120) |
|
1993 |
|
10/05/2012 |
|
Restaurants – Full Service |
|
Fort Wayne |
|
IN |
|
(f) |
|
964 |
|
1,337 |
|
- |
|
- |
|
964 |
|
1,337 |
|
2,301 |
|
(118) |
|
1993 |
|
10/05/2012 |
|
Restaurants – Full Service |
|
Fort Wayne |
|
IN |
|
(f) |
|
1,239 |
|
1,614 |
|
- |
|
- |
|
1,239 |
|
1,614 |
|
2,853 |
|
(136) |
|
2002 |
|
10/05/2012 |
F-5
|
Descriptions (a) |
|
|
|
Initial Cost to Company |
|
Costs Capitalized |
|
Gross amount at December 31, 2014 (b) (c) |
|
|
|
|
|
|
||||||||||||
|
Tenant Industry |
|
City |
|
St |
|
Encumbrances |
|
Land & |
|
Building & |
|
Land & |
|
Building & |
|
Land & |
|
Building & |
|
Total |
|
Accumulated |
|
Year |
|
Date |
|
Restaurants – Full Service |
|
Goshen |
|
IN |
|
(f) |
|
639 |
|
1,451 |
|
- |
|
- |
|
639 |
|
1,451 |
|
2,090 |
|
(140) |
|
1999 |
|
10/05/2012 |
|
Restaurants – Full Service |
|
Granger |
|
IN |
|
(f) |
|
778 |
|
1,222 |
|
- |
|
- |
|
778 |
|
1,222 |
|
2,000 |
|
(115) |
|
1995 |
|
10/05/2012 |
|
Restaurants – Full Service |
|
Portage |
|
IN |
|
(f) |
|
555 |
|
1,374 |
|
- |
|
- |
|
555 |
|
1,374 |
|
1,929 |
|
(129) |
|
1999 |
|
10/05/2012 |
|
Restaurants – Full Service |
|
Schererville |
|
IN |
|
(f) |
|
543 |
|
1,356 |
|
- |
|
- |
|
543 |
|
1,356 |
|
1,899 |
|
(123) |
|
1992 |
|
10/05/2012 |
|
Restaurants – Full Service |
|
South Bend |
|
IN |
|
(f) |
|
675 |
|
1,394 |
|
- |
|
- |
|
675 |
|
1,394 |
|
2,069 |
|
(130) |
|
1999 |
|
10/05/2012 |
|
Restaurants – Full Service |
|
Valparaiso |
|
IN |
|
(f) |
|
507 |
|
1,502 |
|
- |
|
- |
|
507 |
|
1,502 |
|
2,009 |
|
(137) |
|
1995 |
|
10/05/2012 |
|
Restaurants – Full Service |
|
Fremont |
|
OH |
|
(f) |
|
728 |
|
1,443 |
|
- |
|
- |
|
728 |
|
1,443 |
|
2,171 |
|
(130) |
|
2000 |
|
10/05/2012 |
|
Restaurants – Full Service |
|
Lima |
|
OH |
|
(f) |
|
765 |
|
1,576 |
|
- |
|
- |
|
765 |
|
1,576 |
|
2,341 |
|
(138) |
|
1996 |
|
10/05/2012 |
|
Restaurants – Full Service |
|
Lima |
|
OH |
|
(f) |
|
755 |
|
1,536 |
|
- |
|
- |
|
755 |
|
1,536 |
|
2,291 |
|
(135) |
|
2005 |
|
10/05/2012 |
|
Restaurants – Full Service |
|
Maumee |
|
OH |
|
(f) |
|
657 |
|
1,684 |
|
- |
|
- |
|
657 |
|
1,684 |
|
2,341 |
|
(148) |
|
1995 |
|
10/05/2012 |
|
Restaurants – Full Service |
|
Northwood |
|
OH |
|
(f) |
|
615 |
|
1,716 |
|
- |
|
- |
|
615 |
|
1,716 |
|
2,331 |
|
(151) |
|
2004 |
|
10/05/2012 |
|
Restaurants – Full Service |
|
Toledo |
|
OH |
|
(f) |
|
754 |
|
1,587 |
|
- |
|
- |
|
754 |
|
1,587 |
|
2,341 |
|
(146) |
|
1995 |
|
10/05/2012 |
|
Child Day Care Services |
|
Bradenton |
|
FL |
|
(f) |
|
545 |
|
2,149 |
|
- |
|
- |
|
545 |
|
2,149 |
|
2,694 |
|
(190) |
|
1982 |
|
10/19/2012 |
|
Restaurants – Full Service |
|
Chicago |
|
IL |
|
(f) |
|
504 |
|
3,959 |
|
- |
|
- |
|
504 |
|
3,959 |
|
4,463 |
|
(237) |
|
1886 |
|
10/29/2012 |
|
Restaurants – Full Service |
|
Chicago |
|
IL |
|
(f) |
|
900 |
|
2,410 |
|
- |
|
- |
|
900 |
|
2,410 |
|
3,310 |
|
(195) |
|
1923 |
|
10/29/2012 |
|
Restaurants – Full Service |
|
Chicago |
|
IL |
|
(f) |
|
810 |
|
5,559 |
|
- |
|
- |
|
810 |
|
5,559 |
|
6,369 |
|
(329) |
|
2008 |
|
10/29/2012 |
|
Restaurants – Limited Service |
|
Baton Rouge |
|
LA |
|
(f) |
|
700 |
|
162 |
|
- |
|
- |
|
700 |
|
162 |
|
862 |
|
(21) |
|
2005 |
|
11/09/2012 |
|
Restaurants – Limited Service |
|
Baton Rouge |
|
LA |
|
(f) |
|
741 |
|
212 |
|
- |
|
- |
|
741 |
|
212 |
|
953 |
|
(30) |
|
2005 |
|
11/09/2012 |
|
Restaurants – Limited Service |
|
Breaux Bridge |
|
LA |
|
(f) |
|
678 |
|
643 |
|
- |
|
- |
|
678 |
|
643 |
|
1,321 |
|
(93) |
|
1996 |
|
11/09/2012 |
|
Restaurants – Limited Service |
|
Denham |
|
LA |
|
(f) |
|
831 |
|
444 |
|
- |
|
- |
|
831 |
|
444 |
|
1,275 |
|
(60) |
|
2001 |
|
11/09/2012 |
|
Restaurants – Limited Service |
|
Donaldsonville |
|
LA |
|
(f) |
|
327 |
|
562 |
|
- |
|
- |
|
327 |
|
562 |
|
889 |
|
(72) |
|
1981 |
|
11/09/2012 |
|
Restaurants – Limited Service |
|
Gonzales |
|
LA |
|
(f) |
|
547 |
|
599 |
|
- |
|
- |
|
547 |
|
599 |
|
1,146 |
|
(70) |
|
1981 |
|
11/09/2012 |
|
Restaurants – Limited Service |
|
Gonzales |
|
LA |
|
(f) |
|
617 |
|
419 |
|
- |
|
- |
|
617 |
|
419 |
|
1,036 |
|
(54) |
|
1996 |
|
11/09/2012 |
|
Restaurants – Limited Service |
|
Kentwood |
|
LA |
|
(f) |
|
243 |
|
600 |
|
- |
|
- |
|
243 |
|
600 |
|
843 |
|
(57) |
|
2006 |
|
11/09/2012 |
|
Restaurants – Limited Service |
|
Larose |
|
LA |
|
(f) |
|
418 |
|
756 |
|
- |
|
- |
|
418 |
|
756 |
|
1,174 |
|
(102) |
|
1986 |
|
11/09/2012 |
|
Restaurants – Limited Service |
|
Port Vincent |
|
LA |
|
(f) |
|
692 |
|
207 |
|
- |
|
- |
|
692 |
|
207 |
|
899 |
|
(24) |
|
2006 |
|
11/09/2012 |
|
Restaurants – Limited Service |
|
Prairieville |
|
LA |
|
(f) |
|
724 |
|
165 |
|
- |
|
- |
|
724 |
|
165 |
|
889 |
|
(32) |
|
1995 |
|
11/09/2012 |
|
Restaurants – Limited Service |
|
Walker |
|
LA |
|
(f) |
|
508 |
|
776 |
|
- |
|
- |
|
508 |
|
776 |
|
1,284 |
|
(106) |
|
2001 |
|
11/09/2012 |
|
Other Schools and Instruction |
|
Denver |
|
CO |
|
7,468 |
|
5,201 |
|
8,925 |
|
- |
|
- |
|
5,201 |
|
8,925 |
|
14,126 |
|
(620) |
|
1962 |
|
11/21/2012 |
|
Scientific Research and Development Services |
|
Columbia |
|
MO |
|
11,478 |
|
807 |
|
13,794 |
|
- |
|
- |
|
807 |
|
13,794 |
|
14,601 |
|
(687) |
|
2008 |
|
11/29/2012 |
|
Restaurants – Full Service |
|
Orland Park |
|
IL |
|
(f) |
|
1,267 |
|
4,320 |
|
- |
|
- |
|
1,267 |
|
4,320 |
|
5,587 |
|
(243) |
|
2005 |
|
11/30/2012 |
|
Child Day Care Services |
|
Cincinnati |
|
OH |
|
(f) |
|
1,074 |
|
1,610 |
|
- |
|
- |
|
1,074 |
|
1,610 |
|
2,684 |
|
(137) |
|
2001 |
|
12/10/2012 |
|
Child Day Care Services |
|
Powell |
|
OH |
|
(f) |
|
1,102 |
|
1,602 |
|
- |
|
- |
|
1,102 |
|
1,602 |
|
2,704 |
|
(136) |
|
1998 |
|
12/10/2012 |
|
Child Day Care Services |
|
Manassas |
|
VA |
|
(f) |
|
938 |
|
2,580 |
|
- |
|
- |
|
938 |
|
2,580 |
|
3,518 |
|
(199) |
|
2005 |
|
12/10/2012 |
|
Restaurants – Limited Service |
|
Dalton |
|
GA |
|
(f) |
|
418 |
|
1,133 |
|
- |
|
- |
|
418 |
|
1,133 |
|
1,551 |
|
(90) |
|
1984 |
|
12/11/2012 |
|
Restaurants – Limited Service |
|
Chattanooga |
|
TN |
|
(f) |
|
426 |
|
984 |
|
- |
|
- |
|
426 |
|
984 |
|
1,410 |
|
(80) |
|
1984 |
|
12/11/2012 |
|
Restaurants – Limited Service |
|
East Ridge |
|
TN |
|
(f) |
|
481 |
|
807 |
|
- |
|
- |
|
481 |
|
807 |
|
1,288 |
|
(68) |
|
1982 |
|
12/11/2012 |
|
Restaurants – Full Service |
|
Abilene |
|
TX |
|
(f) |
|
593 |
|
2,023 |
|
- |
|
- |
|
593 |
|
2,023 |
|
2,616 |
|
(172) |
|
1961 |
|
12/11/2012 |
|
Furniture Stores |
|
Lancaster |
|
PA |
|
(f) |
|
1,034 |
|
- |
|
- |
|
- |
|
1,034 |
|
- |
|
1,034 |
|
- |
|
1999 |
|
12/13/2012 |
|
Furniture Stores |
|
Wilkes Barre |
|
PA |
|
(f) |
|
827 |
|
- |
|
- |
|
- |
|
827 |
|
- |
|
827 |
|
- |
|
1997 |
|
12/13/2012 |
|
Health Clubs |
|
Mesa |
|
AZ |
|
(f) |
|
1,112 |
|
3,684 |
|
- |
|
- |
|
1,112 |
|
3,684 |
|
4,796 |
|
(219) |
|
2003 |
|
12/20/2012 |
|
Health Clubs |
|
Scottsdale |
|
AZ |
|
(f) |
|
2,029 |
|
4,716 |
|
- |
|
- |
|
2,029 |
|
4,716 |
|
6,745 |
|
(299) |
|
2003 |
|
12/20/2012 |
|
Restaurants – Full Service |
|
Champaign |
|
IL |
|
(f) |
|
931 |
|
854 |
|
- |
|
- |
|
931 |
|
854 |
|
1,785 |
|
(65) |
|
2004 |
|
12/27/2012 |
|
Restaurants – Full Service |
|
Decatur |
|
IL |
|
(f) |
|
559 |
|
615 |
|
- |
|
- |
|
559 |
|
615 |
|
1,174 |
|
(51) |
|
2005 |
|
12/27/2012 |
|
Restaurants – Full Service |
|
Dekalb |
|
IL |
|
(f) |
|
615 |
|
747 |
|
- |
|
- |
|
615 |
|
747 |
|
1,362 |
|
(71) |
|
2000 |
|
12/27/2012 |
|
Restaurants – Full Service |
|
Effingham |
|
IL |
|
(f) |
|
514 |
|
717 |
|
- |
|
- |
|
514 |
|
717 |
|
1,231 |
|
(60) |
|
2003 |
|
12/27/2012 |
|
Restaurants – Full Service |
|
Morton |
|
IL |
|
(f) |
|
554 |
|
856 |
|
- |
|
- |
|
554 |
|
856 |
|
1,410 |
|
(83) |
|
1999 |
|
12/27/2012 |
|
Restaurants – Full Service |
|
Rockford |
|
IL |
|
(f) |
|
925 |
|
250 |
|
- |
|
- |
|
925 |
|
250 |
|
1,175 |
|
(25) |
|
1999 |
|
12/27/2012 |
|
Restaurants – Full Service |
|
Skokie |
|
IL |
|
(f) |
|
737 |
|
1,189 |
|
- |
|
- |
|
737 |
|
1,189 |
|
1,926 |
|
(96) |
|
2000 |
|
12/27/2012 |
|
Restaurants – Full Service |
|
Clarksville |
|
IN |
|
(f) |
|
813 |
|
1,369 |
|
- |
|
- |
|
813 |
|
1,369 |
|
2,182 |
|
(120) |
|
1978 |
|
12/27/2012 |
|
Restaurants – Full Service |
|
Merrillville |
|
IN |
|
(f) |
|
981 |
|
1,795 |
|
- |
|
- |
|
981 |
|
1,795 |
|
2,776 |
|
(164) |
|
1979 |
|
12/27/2012 |
F-6
|
Descriptions (a) |
|
|
|
Initial Cost to Company |
|
Costs Capitalized |
|
Gross amount at December 31, 2014 (b) (c) |
|
|
|
|
|
|
||||||||||||
|
Tenant Industry |
|
City |
|
St |
|
Encumbrances |
|
Land & |
|
Building & |
|
Land & |
|
Building & |
|
Land & |
|
Building & |
|
Total |
|
Accumulated |
|
Year |
|
Date |
|
Restaurants – Full Service |
|
Emporia |
|
KS |
|
(f) |
|
730 |
|
1,542 |
|
- |
|
- |
|
730 |
|
1,542 |
|
2,272 |
|
(160) |
|
1998 |
|
12/27/2012 |
|
Restaurants – Full Service |
|
Topeka |
|
KS |
|
(f) |
|
783 |
|
2,054 |
|
- |
|
- |
|
783 |
|
2,054 |
|
2,837 |
|
(211) |
|
1992 |
|
12/27/2012 |
|
Restaurants – Full Service |
|
Florence |
|
KY |
|
(f) |
|
1,161 |
|
1,290 |
|
- |
|
- |
|
1,161 |
|
1,290 |
|
2,451 |
|
(157) |
|
2004 |
|
12/27/2012 |
|
Restaurants – Full Service |
|
Louisville |
|
KY |
|
(f) |
|
1,127 |
|
1,577 |
|
- |
|
- |
|
1,127 |
|
1,577 |
|
2,704 |
|
(152) |
|
1973 |
|
12/27/2012 |
|
Restaurants – Full Service |
|
Louisville |
|
KY |
|
(f) |
|
1,122 |
|
1,415 |
|
- |
|
- |
|
1,122 |
|
1,415 |
|
2,537 |
|
(140) |
|
1974 |
|
12/27/2012 |
|
Restaurants – Full Service |
|
Maryville |
|
MO |
|
(f) |
|
682 |
|
1,727 |
|
- |
|
- |
|
682 |
|
1,727 |
|
2,409 |
|
(151) |
|
2005 |
|
12/27/2012 |
|
Restaurants – Full Service |
|
Columbus |
|
NE |
|
(f) |
|
628 |
|
1,401 |
|
- |
|
- |
|
628 |
|
1,401 |
|
2,029 |
|
(99) |
|
2002 |
|
12/27/2012 |
|
Restaurants – Full Service |
|
Grand Island |
|
NE |
|
(f) |
|
749 |
|
1,922 |
|
- |
|
- |
|
749 |
|
1,922 |
|
2,671 |
|
(136) |
|
1999 |
|
12/27/2012 |
|
Restaurants – Full Service |
|
Kearney |
|
NE |
|
(f) |
|
718 |
|
2,236 |
|
- |
|
- |
|
718 |
|
2,236 |
|
2,954 |
|
(158) |
|
2002 |
|
12/27/2012 |
|
Restaurants – Full Service |
|
Lincoln |
|
NE |
|
(f) |
|
672 |
|
1,539 |
|
- |
|
- |
|
672 |
|
1,539 |
|
2,211 |
|
(123) |
|
1993 |
|
12/27/2012 |
|
Restaurants – Full Service |
|
Lincoln |
|
NE |
|
(f) |
|
726 |
|
1,775 |
|
- |
|
- |
|
726 |
|
1,775 |
|
2,501 |
|
(125) |
|
1999 |
|
12/27/2012 |
|
Restaurants – Full Service |
|
Dayton |
|
OH |
|
(f) |
|
960 |
|
1,088 |
|
- |
|
- |
|
960 |
|
1,088 |
|
2,048 |
|
(141) |
|
2003 |
|
12/27/2012 |
|
Restaurants – Full Service |
|
Ada |
|
OK |
|
1,639 |
|
1,252 |
|
1,438 |
|
- |
|
- |
|
1,252 |
|
1,438 |
|
2,690 |
|
(112) |
|
2006 |
|
12/27/2012 |
|
Restaurants – Full Service |
|
Altus |
|
OK |
|
1,145 |
|
732 |
|
1,147 |
|
- |
|
- |
|
732 |
|
1,147 |
|
1,879 |
|
(91) |
|
2005 |
|
12/27/2012 |
|
Restaurants – Full Service |
|
Ardmore |
|
OK |
|
(f) |
|
946 |
|
1,539 |
|
- |
|
- |
|
946 |
|
1,539 |
|
2,485 |
|
(131) |
|
1998 |
|
12/27/2012 |
|
Restaurants – Full Service |
|
Lawton |
|
OK |
|
1,328 |
|
923 |
|
1,258 |
|
- |
|
- |
|
923 |
|
1,258 |
|
2,181 |
|
(123) |
|
1996 |
|
12/27/2012 |
|
Restaurants – Full Service |
|
Goodlettsville |
|
TN |
|
(f) |
|
969 |
|
1,616 |
|
- |
|
- |
|
969 |
|
1,616 |
|
2,585 |
|
(173) |
|
1973 |
|
12/27/2012 |
|
Restaurants – Full Service |
|
Memphis |
|
TN |
|
(f) |
|
1,244 |
|
1,580 |
|
- |
|
- |
|
1,244 |
|
1,580 |
|
2,824 |
|
(165) |
|
2002 |
|
12/27/2012 |
|
Restaurants – Full Service |
|
Nashville |
|
TN |
|
(f) |
|
979 |
|
1,319 |
|
- |
|
- |
|
979 |
|
1,319 |
|
2,298 |
|
(140) |
|
1978 |
|
12/27/2012 |
|
Restaurants – Full Service |
|
Nashville |
|
TN |
|
(f) |
|
626 |
|
2,270 |
|
- |
|
- |
|
626 |
|
2,270 |
|
2,896 |
|
(165) |
|
1910 |
|
12/27/2012 |
|
Restaurants – Full Service |
|
Amarillo |
|
TX |
|
1,333 |
|
927 |
|
1,330 |
|
- |
|
- |
|
927 |
|
1,330 |
|
2,257 |
|
(127) |
|
1995 |
|
12/27/2012 |
|
Restaurants – Full Service |
|
Lubbock |
|
TX |
|
1,239 |
|
1,289 |
|
808 |
|
- |
|
- |
|
1,289 |
|
808 |
|
2,097 |
|
(79) |
|
1994 |
|
12/27/2012 |
|
Restaurants – Full Service |
|
Evansville |
|
WY |
|
(f) |
|
932 |
|
1,569 |
|
- |
|
- |
|
932 |
|
1,569 |
|
2,501 |
|
(133) |
|
1999 |
|
12/27/2012 |
|
Restaurants – Full Service |
|
Gillette |
|
WY |
|
(f) |
|
1,322 |
|
1,990 |
|
- |
|
- |
|
1,322 |
|
1,990 |
|
3,312 |
|
(169) |
|
2001 |
|
12/27/2012 |
|
Restaurants – Full Service |
|
Laramie |
|
WY |
|
(f) |
|
923 |
|
1,081 |
|
- |
|
- |
|
923 |
|
1,081 |
|
2,004 |
|
(90) |
|
1996 |
|
12/27/2012 |
|
Restaurants – Full Service |
|
Omaha |
|
NE |
|
(f) |
|
920 |
|
1,324 |
|
- |
|
- |
|
920 |
|
1,324 |
|
2,244 |
|
(112) |
|
2005 |
|
12/28/2012 |
|
Restaurants – Full Service |
|
Edmond |
|
OK |
|
(f) |
|
371 |
|
294 |
|
- |
|
- |
|
371 |
|
294 |
|
665 |
|
(32) |
|
1990 |
|
12/28/2012 |
|
Restaurants – Full Service |
|
Oklahoma City |
|
OK |
|
(f) |
|
507 |
|
556 |
|
- |
|
- |
|
507 |
|
556 |
|
1,063 |
|
(67) |
|
1999 |
|
12/28/2012 |
|
Restaurants – Full Service |
|
Oklahoma City |
|
OK |
|
(f) |
|
186 |
|
390 |
|
- |
|
- |
|
186 |
|
390 |
|
576 |
|
(39) |
|
1984 |
|
12/28/2012 |
|
Restaurants – Full Service |
|
Oklahoma City |
|
OK |
|
(f) |
|
500 |
|
603 |
|
- |
|
- |
|
500 |
|
603 |
|
1,103 |
|
(67) |
|
1968 |
|
12/28/2012 |
|
Restaurants – Full Service |
|
Oklahoma City |
|
OK |
|
(f) |
|
398 |
|
427 |
|
- |
|
- |
|
398 |
|
427 |
|
825 |
|
(45) |
|
1995 |
|
12/28/2012 |
|
Restaurants – Full Service |
|
Oklahoma City |
|
OK |
|
(f) |
|
291 |
|
385 |
|
- |
|
- |
|
291 |
|
385 |
|
676 |
|
(43) |
|
1997 |
|
12/28/2012 |
|
Restaurants – Full Service |
|
Oklahoma City |
|
OK |
|
(f) |
|
271 |
|
404 |
|
- |
|
- |
|
271 |
|
404 |
|
675 |
|
(51) |
|
2000 |
|
12/28/2012 |
|
Restaurants – Full Service |
|
Yukon |
|
OK |
|
(f) |
|
408 |
|
426 |
|
- |
|
- |
|
408 |
|
426 |
|
834 |
|
(53) |
|
2002 |
|
12/28/2012 |
|
Restaurants – Full Service |
|
Bartlett |
|
TN |
|
(f) |
|
1,182 |
|
1,297 |
|
- |
|
- |
|
1,182 |
|
1,297 |
|
2,479 |
|
(121) |
|
1998 |
|
12/28/2012 |
|
Restaurants – Limited Service |
|
Huntingdon |
|
TN |
|
(f) |
|
132 |
|
956 |
|
- |
|
- |
|
132 |
|
956 |
|
1,088 |
|
(45) |
|
1989 |
|
12/28/2012 |
|
Restaurants – Limited Service |
|
Paris |
|
TN |
|
(f) |
|
383 |
|
686 |
|
- |
|
- |
|
383 |
|
686 |
|
1,069 |
|
(46) |
|
1981 |
|
12/28/2012 |
|
Restaurants – Limited Service |
|
Richlands |
|
VA |
|
(f) |
|
275 |
|
1,023 |
|
- |
|
- |
|
275 |
|
1,023 |
|
1,298 |
|
(62) |
|
1990 |
|
12/28/2012 |
|
Restaurants – Limited Service |
|
Wise |
|
VA |
|
(f) |
|
371 |
|
1,207 |
|
- |
|
- |
|
371 |
|
1,207 |
|
1,578 |
|
(61) |
|
1983 |
|
12/28/2012 |
|
Other Motor Vehicle Dealers |
|
Liberty Lake |
|
WA |
|
(f) |
|
2,458 |
|
2,687 |
|
1,355 |
|
- |
|
3,813 |
|
2,687 |
|
6,500 |
|
(294) |
|
2006 |
|
12/28/2012 |
|
Restaurants – Limited Service |
|
Welch |
|
WV |
|
(f) |
|
542 |
|
997 |
|
- |
|
- |
|
542 |
|
997 |
|
1,539 |
|
(60) |
|
1984 |
|
12/28/2012 |
|
Restaurants – Full Service |
|
Jonesboro |
|
GA |
|
(f) |
|
477 |
|
664 |
|
- |
|
- |
|
477 |
|
664 |
|
1,141 |
|
(62) |
|
2000 |
|
12/31/2012 |
|
Restaurants – Full Service |
|
Lawrenceville |
|
GA |
|
(f) |
|
675 |
|
447 |
|
- |
|
- |
|
675 |
|
447 |
|
1,122 |
|
(42) |
|
2000 |
|
12/31/2012 |
|
Restaurants – Limited Service |
|
Altoona |
|
IA |
|
(f) |
|
368 |
|
468 |
|
- |
|
- |
|
368 |
|
468 |
|
836 |
|
(36) |
|
1995 |
|
12/31/2012 |
|
Restaurants – Limited Service |
|
Ankeny |
|
IA |
|
(f) |
|
423 |
|
474 |
|
- |
|
- |
|
423 |
|
474 |
|
897 |
|
(44) |
|
1986 |
|
12/31/2012 |
|
Restaurants – Limited Service |
|
Boone |
|
IA |
|
(f) |
|
308 |
|
538 |
|
- |
|
- |
|
308 |
|
538 |
|
846 |
|
(38) |
|
1974 |
|
12/31/2012 |
|
Restaurants – Limited Service |
|
Des Moines |
|
IA |
|
(f) |
|
419 |
|
901 |
|
- |
|
- |
|
419 |
|
901 |
|
1,320 |
|
(65) |
|
2003 |
|
12/31/2012 |
|
Restaurants – Limited Service |
|
Des Moines |
|
IA |
|
(f) |
|
382 |
|
555 |
|
- |
|
- |
|
382 |
|
555 |
|
937 |
|
(49) |
|
2008 |
|
12/31/2012 |
|
Restaurants – Limited Service |
|
Des Moines |
|
IA |
|
(f) |
|
250 |
|
536 |
|
- |
|
- |
|
250 |
|
536 |
|
786 |
|
(47) |
|
1991 |
|
12/31/2012 |
|
Restaurants – Limited Service |
|
West Des Moines |
|
IA |
|
(f) |
|
366 |
|
652 |
|
- |
|
- |
|
366 |
|
652 |
|
1,018 |
|
(48) |
|
2010 |
|
12/31/2012 |
|
Restaurants – Limited Service |
|
West Des Moines |
|
IA |
|
(f) |
|
490 |
|
628 |
|
- |
|
- |
|
490 |
|
628 |
|
1,118 |
|
(47) |
|
1995 |
|
12/31/2012 |
|
Restaurants – Full Service |
|
Fishers |
|
IN |
|
(f) |
|
750 |
|
1,622 |
|
- |
|
440 |
|
750 |
|
2,062 |
|
2,812 |
|
(134) |
|
2004 |
|
01/03/2013 |
F-7
|
Descriptions (a) |
|
|
|
Initial Cost to Company |
|
Costs Capitalized |
|
Gross amount at December 31, 2014 (b) (c) |
|
|
|
|
|
|
||||||||||||
|
Tenant Industry |
|
City |
|
St |
|
Encumbrances |
|
Land & |
|
Building & |
|
Land & |
|
Building & |
|
Land & |
|
Building & |
|
Total |
|
Accumulated |
|
Year |
|
Date |
|
Restaurants – Full Service |
|
Fishers |
|
IN |
|
(f) |
|
730 |
|
1,181 |
|
8 |
|
- |
|
738 |
|
1,181 |
|
1,919 |
|
(78) |
|
2009 |
|
01/03/2013 |
|
Restaurants – Full Service |
|
Greenwood |
|
IN |
|
(f) |
|
1,418 |
|
1,194 |
|
- |
|
164 |
|
1,418 |
|
1,358 |
|
2,776 |
|
(156) |
|
2007 |
|
01/03/2013 |
|
Restaurants – Full Service |
|
Lafayette |
|
IN |
|
(f) |
|
679 |
|
1,953 |
|
198 |
|
388 |
|
877 |
|
2,341 |
|
3,218 |
|
(136) |
|
2006 |
|
01/03/2013 |
|
Restaurants – Limited Service |
|
Columbus |
|
GA |
|
(f) |
|
1,127 |
|
1,251 |
|
- |
|
- |
|
1,127 |
|
1,251 |
|
2,378 |
|
(125) |
|
1997 |
|
01/10/2013 |
|
Restaurants – Limited Service |
|
Greenwood |
|
IN |
|
(f) |
|
945 |
|
1,324 |
|
- |
|
- |
|
945 |
|
1,324 |
|
2,269 |
|
(126) |
|
2001 |
|
01/10/2013 |
|
Restaurants – Limited Service |
|
Indianapolis |
|
IN |
|
(f) |
|
889 |
|
1,489 |
|
- |
|
- |
|
889 |
|
1,489 |
|
2,378 |
|
(141) |
|
1999 |
|
01/10/2013 |
|
Restaurants – Limited Service |
|
Plainfield |
|
IN |
|
(f) |
|
853 |
|
1,120 |
|
- |
|
- |
|
853 |
|
1,120 |
|
1,973 |
|
(103) |
|
1999 |
|
01/10/2013 |
|
Restaurants – Limited Service |
|
Cleveland |
|
TN |
|
(f) |
|
1,143 |
|
1,366 |
|
- |
|
- |
|
1,143 |
|
1,366 |
|
2,509 |
|
(146) |
|
1999 |
|
01/10/2013 |
|
Health Clubs |
|
North Las Vegas |
|
NV |
|
(f) |
|
1,609 |
|
6,621 |
|
- |
|
- |
|
1,609 |
|
6,621 |
|
8,230 |
|
(343) |
|
2009 |
|
01/17/2013 |
|
Restaurants – Full Service |
|
Peoria |
|
AZ |
|
(f) |
|
510 |
|
1,630 |
|
- |
|
- |
|
510 |
|
1,630 |
|
2,140 |
|
(113) |
|
2003 |
|
01/22/2013 |
|
Motion Picture and Video Industries |
|
Mount Airy |
|
NC |
|
(f) |
|
1,053 |
|
3,141 |
|
- |
|
- |
|
1,053 |
|
3,141 |
|
4,194 |
|
(249) |
|
2000 |
|
01/24/2013 |
|
Motion Picture and Video Industries |
|
Sanford |
|
NC |
|
(f) |
|
1,146 |
|
4,245 |
|
- |
|
- |
|
1,146 |
|
4,245 |
|
5,391 |
|
(268) |
|
2004 |
|
01/24/2013 |
|
Motion Picture and Video Industries |
|
Shallotte |
|
NC |
|
(f) |
|
1,239 |
|
3,353 |
|
- |
|
- |
|
1,239 |
|
3,353 |
|
4,592 |
|
(204) |
|
2003 |
|
01/24/2013 |
|
Restaurants – Full Service |
|
Fort Wayne |
|
IN |
|
(f) |
|
843 |
|
1,018 |
|
- |
|
- |
|
843 |
|
1,018 |
|
1,861 |
|
(76) |
|
1998 |
|
01/31/2013 |
|
Restaurants – Full Service |
|
Lafayette |
|
IN |
|
(f) |
|
782 |
|
1,812 |
|
- |
|
- |
|
782 |
|
1,812 |
|
2,594 |
|
(152) |
|
1999 |
|
01/31/2013 |
|
Restaurants – Full Service |
|
Wichita |
|
KS |
|
(f) |
|
882 |
|
1,594 |
|
- |
|
- |
|
882 |
|
1,594 |
|
2,476 |
|
(100) |
|
2006 |
|
01/31/2013 |
|
Restaurants – Limited Service |
|
Nebraska City |
|
NE |
|
(f) |
|
259 |
|
717 |
|
- |
|
- |
|
259 |
|
717 |
|
976 |
|
(64) |
|
1989 |
|
01/31/2013 |
|
Electronics and Appliance Stores |
|
Las Cruces |
|
NM |
|
(f) |
|
1,350 |
|
4,043 |
|
- |
|
- |
|
1,350 |
|
4,043 |
|
5,393 |
|
(222) |
|
1981 |
|
01/31/2013 |
|
Electronics and Appliance Stores |
|
Houston |
|
TX |
|
(f) |
|
1,538 |
|
4,829 |
|
- |
|
- |
|
1,538 |
|
4,829 |
|
6,367 |
|
(269) |
|
2007 |
|
01/31/2013 |
|
Electronics and Appliance Stores |
|
McAllen |
|
TX |
|
(f) |
|
1,321 |
|
2,917 |
|
- |
|
- |
|
1,321 |
|
2,917 |
|
4,238 |
|
(164) |
|
2006 |
|
01/31/2013 |
|
Electronics and Appliance Stores |
|
Mesquite |
|
TX |
|
(f) |
|
1,795 |
|
5,838 |
|
- |
|
- |
|
1,795 |
|
5,838 |
|
7,633 |
|
(299) |
|
1973 |
|
01/31/2013 |
|
Restaurants – Full Service |
|
San Angelo |
|
TX |
|
(f) |
|
913 |
|
2,057 |
|
- |
|
- |
|
913 |
|
2,057 |
|
2,970 |
|
(128) |
|
2000 |
|
01/31/2013 |
|
Restaurants – Full Service |
|
Marietta |
|
GA |
|
(f) |
|
728 |
|
98 |
|
8 |
|
129 |
|
736 |
|
227 |
|
963 |
|
(15) |
|
1984 |
|
02/05/2013 |
|
Restaurants – Full Service |
|
Norcross |
|
GA |
|
(f) |
|
499 |
|
190 |
|
2 |
|
31 |
|
501 |
|
221 |
|
722 |
|
(19) |
|
1999 |
|
02/05/2013 |
|
Restaurants – Full Service |
|
Norcross |
|
GA |
|
(f) |
|
687 |
|
351 |
|
5 |
|
92 |
|
692 |
|
443 |
|
1,135 |
|
(35) |
|
1996 |
|
02/05/2013 |
|
Restaurants – Full Service |
|
Stockbridge |
|
GA |
|
(f) |
|
704 |
|
1,274 |
|
6 |
|
104 |
|
710 |
|
1,378 |
|
2,088 |
|
(107) |
|
1996 |
|
02/05/2013 |
|
Motion Picture and Video Industries |
|
Lewisville |
|
TX |
|
(f) |
|
1,330 |
|
3,294 |
|
- |
|
- |
|
1,330 |
|
3,294 |
|
4,624 |
|
(265) |
|
1994 |
|
02/08/2013 |
|
Restaurants – Limited Service |
|
Lehi |
|
UT |
|
(f) |
|
682 |
|
1,441 |
|
- |
|
- |
|
682 |
|
1,441 |
|
2,123 |
|
(121) |
|
2008 |
|
02/14/2013 |
|
Restaurants – Limited Service |
|
Charlotte |
|
NC |
|
(f) |
|
997 |
|
109 |
|
- |
|
- |
|
997 |
|
109 |
|
1,106 |
|
(14) |
|
2005 |
|
02/27/2013 |
|
Restaurants – Limited Service |
|
Charlotte |
|
NC |
|
(f) |
|
978 |
|
128 |
|
- |
|
- |
|
978 |
|
128 |
|
1,106 |
|
(17) |
|
2007 |
|
02/27/2013 |
|
Restaurants – Limited Service |
|
Gastonia |
|
NC |
|
(f) |
|
703 |
|
244 |
|
- |
|
- |
|
703 |
|
244 |
|
947 |
|
(30) |
|
2004 |
|
02/27/2013 |
|
Restaurants – Limited Service |
|
Indian Trail |
|
NC |
|
(f) |
|
830 |
|
78 |
|
- |
|
- |
|
830 |
|
78 |
|
908 |
|
(11) |
|
2003 |
|
02/27/2013 |
|
Restaurants – Limited Service |
|
Lincolnton |
|
NC |
|
(f) |
|
572 |
|
60 |
|
- |
|
- |
|
572 |
|
60 |
|
632 |
|
(7) |
|
2005 |
|
02/27/2013 |
|
Restaurants – Limited Service |
|
Mooresville |
|
NC |
|
(f) |
|
874 |
|
34 |
|
- |
|
- |
|
874 |
|
34 |
|
908 |
|
(5) |
|
2002 |
|
02/27/2013 |
|
Restaurants – Limited Service |
|
Morganton |
|
NC |
|
(f) |
|
703 |
|
28 |
|
- |
|
- |
|
703 |
|
28 |
|
731 |
|
(4) |
|
2003 |
|
02/27/2013 |
|
Restaurants – Limited Service |
|
Newton |
|
NC |
|
(f) |
|
594 |
|
403 |
|
- |
|
- |
|
594 |
|
403 |
|
997 |
|
(54) |
|
2002 |
|
02/27/2013 |
|
Restaurants – Limited Service |
|
Shelby |
|
NC |
|
(f) |
|
395 |
|
59 |
|
- |
|
- |
|
395 |
|
59 |
|
454 |
|
(9) |
|
2004 |
|
02/27/2013 |
|
Home Furnishings Stores |
|
Oklahoma City |
|
OK |
|
(f) |
|
2,898 |
|
5,889 |
|
- |
|
- |
|
2,898 |
|
5,889 |
|
8,787 |
|
(453) |
|
1995 |
|
03/15/2013 |
|
Home Furnishings Stores |
|
Tulsa |
|
OK |
|
(f) |
|
3,406 |
|
5,373 |
|
- |
|
- |
|
3,406 |
|
5,373 |
|
8,779 |
|
(445) |
|
1996 |
|
03/15/2013 |
|
Furniture Stores |
|
Goodyear |
|
AZ |
|
(f) |
|
2,112 |
|
4,111 |
|
- |
|
- |
|
2,112 |
|
4,111 |
|
6,223 |
|
(247) |
|
2005 |
|
03/26/2013 |
|
Furniture Stores |
|
Prescott |
|
AZ |
|
(f) |
|
1,937 |
|
3,216 |
|
- |
|
- |
|
1,937 |
|
3,216 |
|
5,153 |
|
(186) |
|
2007 |
|
03/26/2013 |
|
Foundries |
|
Fayetteville |
|
AR |
|
(f) |
|
968 |
|
2,227 |
|
- |
|
- |
|
968 |
|
2,227 |
|
3,195 |
|
(133) |
|
2005 |
|
03/28/2013 |
|
Foundries |
|
Harrison |
|
AR |
|
(f) |
|
224 |
|
1,322 |
|
- |
|
- |
|
224 |
|
1,322 |
|
1,546 |
|
(89) |
|
1998 |
|
03/28/2013 |
|
Foundries |
|
Harrison |
|
AR |
|
(f) |
|
920 |
|
2,378 |
|
- |
|
- |
|
920 |
|
2,378 |
|
3,298 |
|
(221) |
|
1950 |
|
03/28/2013 |
|
Foundries |
|
Harrison |
|
AR |
|
(f) |
|
211 |
|
1,438 |
|
- |
|
- |
|
211 |
|
1,438 |
|
1,649 |
|
(93) |
|
1988 |
|
03/28/2013 |
|
Restaurants – Full Service |
|
Arvada |
|
CO |
|
(f) |
|
860 |
|
1,303 |
|
- |
|
- |
|
860 |
|
1,303 |
|
2,163 |
|
(88) |
|
2001 |
|
03/28/2013 |
|
Restaurants – Limited Service |
|
Ashland |
|
KY |
|
(f) |
|
1,224 |
|
1,986 |
|
- |
|
- |
|
1,224 |
|
1,986 |
|
3,210 |
|
(152) |
|
1996 |
|
03/28/2013 |
|
Foundries |
|
Chelmsford |
|
MA |
|
(f) |
|
542 |
|
571 |
|
- |
|
- |
|
542 |
|
571 |
|
1,113 |
|
(104) |
|
1963 |
|
03/28/2013 |
|
Restaurants – Limited Service |
|
Ironwood |
|
MI |
|
(f) |
|
171 |
|
415 |
|
- |
|
- |
|
171 |
|
415 |
|
586 |
|
(28) |
|
1999 |
|
03/28/2013 |
|
Restaurants – Limited Service |
|
Ishpeming |
|
MI |
|
(f) |
|
384 |
|
597 |
|
- |
|
- |
|
384 |
|
597 |
|
981 |
|
(41) |
|
1999 |
|
03/28/2013 |
|
Foundries |
|
Arden Hills |
|
MN |
|
(f) |
|
1,176 |
|
1,359 |
|
- |
|
- |
|
1,176 |
|
1,359 |
|
2,535 |
|
(135) |
|
1964 |
|
03/28/2013 |
|
Foundries |
|
St. Charles |
|
MO |
|
(f) |
|
988 |
|
825 |
|
- |
|
- |
|
988 |
|
825 |
|
1,813 |
|
(55) |
|
1995 |
|
03/28/2013 |
F-8
|
Descriptions (a) |
|
|
|
Initial Cost to Company |
|
Costs Capitalized |
|
Gross amount at December 31, 2014 (b) (c) |
|
|
|
|
|
|
||||||||||||
|
Tenant Industry |
|
City |
|
St |
|
Encumbrances |
|
Land & |
|
Building & |
|
Land & |
|
Building & |
|
Land & |
|
Building & |
|
Total |
|
Accumulated |
|
Year |
|
Date |
|
Restaurants – Limited Service |
|
Lillington |
|
NC |
|
(f) |
|
188 |
|
377 |
|
- |
|
- |
|
188 |
|
377 |
|
565 |
|
(25) |
|
1970 |
|
03/28/2013 |
|
Foundries |
|
Dover |
|
NH |
|
(f) |
|
1,125 |
|
1,688 |
|
- |
|
- |
|
1,125 |
|
1,688 |
|
2,813 |
|
(162) |
|
1970 |
|
03/28/2013 |
|
Restaurants – Limited Service |
|
Clayton |
|
OH |
|
(f) |
|
704 |
|
769 |
|
- |
|
- |
|
704 |
|
769 |
|
1,473 |
|
(55) |
|
2004 |
|
03/28/2013 |
|
Foundries |
|
Loyalhanna |
|
PA |
|
(f) |
|
237 |
|
1,928 |
|
- |
|
- |
|
237 |
|
1,928 |
|
2,165 |
|
(114) |
|
1989 |
|
03/28/2013 |
|
Restaurants – Limited Service |
|
Jefferson City |
|
TN |
|
(f) |
|
450 |
|
440 |
|
- |
|
- |
|
450 |
|
440 |
|
890 |
|
(30) |
|
1988 |
|
03/28/2013 |
|
Restaurants – Limited Service |
|
Manchester |
|
TN |
|
(f) |
|
478 |
|
419 |
|
172 |
|
290 |
|
650 |
|
709 |
|
1,359 |
|
(46) |
|
1980 |
|
03/28/2013 |
|
Restaurants – Limited Service |
|
Cleburne |
|
TX |
|
(f) |
|
195 |
|
726 |
|
- |
|
- |
|
195 |
|
726 |
|
921 |
|
(50) |
|
1977 |
|
03/28/2013 |
|
Restaurants – Limited Service |
|
Houston |
|
TX |
|
(f) |
|
912 |
|
913 |
|
- |
|
- |
|
912 |
|
913 |
|
1,825 |
|
(63) |
|
1988 |
|
03/28/2013 |
|
Restaurants – Limited Service |
|
Cross Lanes |
|
WV |
|
(f) |
|
1,490 |
|
2,067 |
|
- |
|
- |
|
1,490 |
|
2,067 |
|
3,557 |
|
(172) |
|
1999 |
|
03/28/2013 |
|
Restaurants – Limited Service |
|
Huntington |
|
WV |
|
(f) |
|
1,042 |
|
2,287 |
|
- |
|
- |
|
1,042 |
|
2,287 |
|
3,329 |
|
(175) |
|
1997 |
|
03/28/2013 |
|
Restaurants – Limited Service |
|
Parkersburg |
|
WV |
|
(f) |
|
1,288 |
|
2,428 |
|
- |
|
- |
|
1,288 |
|
2,428 |
|
3,716 |
|
(185) |
|
2004 |
|
03/28/2013 |
|
Colleges, Universities, and Professional Schools |
|
San Marcos |
|
CA |
|
17,091 |
|
4,528 |
|
22,213 |
|
- |
|
- |
|
4,528 |
|
22,213 |
|
26,741 |
|
(879) |
|
2008 |
|
03/29/2013 |
|
Other Personal Services |
|
Wheat Ridge |
|
CO |
|
(f) |
|
590 |
|
211 |
|
- |
|
- |
|
590 |
|
211 |
|
801 |
|
(22) |
|
1953 |
|
03/29/2013 |
|
Other Personal Services |
|
Avon |
|
CT |
|
(f) |
|
747 |
|
215 |
|
- |
|
- |
|
747 |
|
215 |
|
962 |
|
(47) |
|
1964 |
|
03/29/2013 |
|
Other Personal Services |
|
Bethany |
|
CT |
|
(f) |
|
257 |
|
435 |
|
- |
|
- |
|
257 |
|
435 |
|
692 |
|
(83) |
|
1970 |
|
03/29/2013 |
|
Restaurants – Full Service |
|
Snellville |
|
GA |
|
(f) |
|
427 |
|
1,005 |
|
4 |
|
64 |
|
431 |
|
1,069 |
|
1,500 |
|
(77) |
|
1985 |
|
03/29/2013 |
|
Restaurants – Full Service |
|
Stone Mountain |
|
GA |
|
(f) |
|
894 |
|
1,148 |
|
6 |
|
107 |
|
900 |
|
1,255 |
|
2,155 |
|
(89) |
|
1984 |
|
03/29/2013 |
|
Other Personal Services |
|
Prairie View |
|
IL |
|
(f) |
|
780 |
|
2,415 |
|
- |
|
- |
|
780 |
|
2,415 |
|
3,195 |
|
(269) |
|
1975 |
|
03/29/2013 |
|
Other Personal Services |
|
Carmel |
|
IN |
|
(f) |
|
299 |
|
783 |
|
- |
|
- |
|
299 |
|
783 |
|
1,082 |
|
(77) |
|
1984 |
|
03/29/2013 |
|
Other Personal Services |
|
Boxford |
|
MA |
|
(f) |
|
1,185 |
|
829 |
|
- |
|
- |
|
1,185 |
|
829 |
|
2,014 |
|
(154) |
|
1955 |
|
03/29/2013 |
|
Other Electrical Equipment and Component Manufacturing |
|
South Hadley |
|
MA |
|
(f) |
|
480 |
|
3,832 |
|
- |
|
- |
|
480 |
|
3,832 |
|
4,312 |
|
(237) |
|
1955 |
|
03/29/2013 |
|
Other Personal Services |
|
Wakefield |
|
MA |
|
(f) |
|
401 |
|
901 |
|
- |
|
- |
|
401 |
|
901 |
|
1,302 |
|
(80) |
|
1965 |
|
03/29/2013 |
|
Other Personal Services |
|
Clinton Township |
|
MI |
|
(f) |
|
511 |
|
451 |
|
- |
|
- |
|
511 |
|
451 |
|
962 |
|
(54) |
|
1977 |
|
03/29/2013 |
|
Other Personal Services |
|
Cinnaminson |
|
NJ |
|
(f) |
|
378 |
|
323 |
|
- |
|
- |
|
378 |
|
323 |
|
701 |
|
(33) |
|
1949 |
|
03/29/2013 |
|
Other Personal Services |
|
Windsor |
|
NJ |
|
(f) |
|
691 |
|
170 |
|
- |
|
- |
|
691 |
|
170 |
|
861 |
|
(18) |
|
1985 |
|
03/29/2013 |
|
Other Personal Services |
|
Cincinnati |
|
OH |
|
(f) |
|
605 |
|
276 |
|
- |
|
- |
|
605 |
|
276 |
|
881 |
|
(33) |
|
1972 |
|
03/29/2013 |
|
Other Personal Services |
|
Chadds Ford |
|
PA |
|
(f) |
|
837 |
|
666 |
|
- |
|
- |
|
837 |
|
666 |
|
1,503 |
|
(64) |
|
1979 |
|
03/29/2013 |
|
Other Personal Services |
|
Houston |
|
TX |
|
(f) |
|
237 |
|
1,015 |
|
- |
|
- |
|
237 |
|
1,015 |
|
1,252 |
|
(93) |
|
1975 |
|
03/29/2013 |
|
Other Personal Services |
|
Spring |
|
TX |
|
(f) |
|
1,828 |
|
3,561 |
|
- |
|
- |
|
1,828 |
|
3,561 |
|
5,389 |
|
(283) |
|
1973 |
|
03/29/2013 |
|
Automotive Parts, Accessories, and Tire Stores |
|
La Salle |
|
IL |
|
(f) |
|
1,620 |
|
8,166 |
|
- |
|
- |
|
1,620 |
|
8,166 |
|
9,786 |
|
(543) |
|
1997 |
|
04/17/2013 |
|
Restaurants – Full Service |
|
Amarillo |
|
TX |
|
(f) |
|
840 |
|
1,954 |
|
- |
|
- |
|
840 |
|
1,954 |
|
2,794 |
|
(127) |
|
2002 |
|
05/06/2013 |
|
Restaurants – Full Service |
|
Lubbock |
|
TX |
|
(f) |
|
766 |
|
1,657 |
|
- |
|
- |
|
766 |
|
1,657 |
|
2,423 |
|
(115) |
|
2004 |
|
05/06/2013 |
|
Other Motor Vehicle Dealers |
|
Byron |
|
GA |
|
2,827 |
|
1,726 |
|
3,656 |
|
932 |
|
- |
|
2,658 |
|
3,656 |
|
6,314 |
|
(294) |
|
2007 |
|
05/16/2013 |
|
Restaurants – Full Service |
|
Clovis |
|
NM |
|
(f) |
|
253 |
|
787 |
|
- |
|
- |
|
253 |
|
787 |
|
1,040 |
|
(56) |
|
2013 |
|
05/28/2013 |
|
Restaurants – Full Service |
|
Ruidoso |
|
NM |
|
(f) |
|
518 |
|
346 |
|
72 |
|
528 |
|
590 |
|
874 |
|
1,464 |
|
(54) |
|
1961 |
|
05/28/2013 |
|
Restaurants – Full Service |
|
Tucumcari |
|
NM |
|
(f) |
|
131 |
|
507 |
|
12 |
|
188 |
|
143 |
|
695 |
|
838 |
|
(57) |
|
1985 |
|
05/28/2013 |
|
Restaurants – Full Service |
|
Beeville |
|
TX |
|
(f) |
|
189 |
|
449 |
|
14 |
|
411 |
|
203 |
|
860 |
|
1,063 |
|
(49) |
|
1986 |
|
05/28/2013 |
|
Restaurants – Full Service |
|
Corpus Christi |
|
TX |
|
(f) |
|
473 |
|
470 |
|
- |
|
225 |
|
473 |
|
695 |
|
1,168 |
|
(52) |
|
2005 |
|
05/28/2013 |
|
Restaurants – Full Service |
|
Fort Stockton |
|
TX |
|
(f) |
|
344 |
|
657 |
|
- |
|
12 |
|
344 |
|
669 |
|
1,013 |
|
(62) |
|
1978 |
|
05/28/2013 |
|
Restaurants – Full Service |
|
Lamesa |
|
TX |
|
(f) |
|
221 |
|
447 |
|
13 |
|
562 |
|
234 |
|
1,009 |
|
1,243 |
|
(76) |
|
1978 |
|
05/28/2013 |
|
Motor Vehicle and Motor Vehicle Parts and Supplies Merchant Wholesalers |
|
Washington |
|
PA |
|
(f) |
|
6,508 |
|
1,380 |
|
- |
|
- |
|
6,508 |
|
1,380 |
|
7,888 |
|
(415) |
|
1975 |
|
05/31/2013 |
|
Restaurants – Full Service |
|
Cincinnati |
|
OH |
|
(f) |
|
1,334 |
|
1,669 |
|
- |
|
- |
|
1,334 |
|
1,669 |
|
3,003 |
|
(106) |
|
2007 |
|
06/04/2013 |
|
Health Clubs |
|
Auburn |
|
AL |
|
(f) |
|
947 |
|
- |
|
- |
|
- |
|
947 |
|
- |
|
947 |
|
- |
|
2007 |
|
06/14/2013 |
|
Department Stores |
|
Cherokee Village |
|
AR |
|
(f) |
|
498 |
|
790 |
|
- |
|
- |
|
498 |
|
790 |
|
1,288 |
|
(60) |
|
2011 |
|
06/14/2013 |
|
Health Clubs |
|
Columbus |
|
GA |
|
(f) |
|
1,357 |
|
- |
|
- |
|
- |
|
1,357 |
|
- |
|
1,357 |
|
- |
|
2006 |
|
06/14/2013 |
|
Department Stores |
|
Marion |
|
IL |
|
(f) |
|
614 |
|
668 |
|
- |
|
- |
|
614 |
|
668 |
|
1,282 |
|
(55) |
|
2010 |
|
06/14/2013 |
|
Automobile Dealers |
|
Michigan City |
|
IN |
|
(f) |
|
832 |
|
- |
|
- |
|
- |
|
832 |
|
- |
|
832 |
|
- |
|
2001 |
|
06/14/2013 |
F-9
|
Descriptions (a) |
|
|
|
Initial Cost to Company |
|
Costs Capitalized |
|
Gross amount at December 31, 2014 (b) (c) |
|
|
|
|
|
|
||||||||||||
|
Tenant Industry |
|
City |
|
St |
|
Encumbrances |
|
Land & |
|
Building & |
|
Land & |
|
Building & |
|
Land & |
|
Building & |
|
Total |
|
Accumulated |
|
Year |
|
Date |
|
Automobile Dealers |
|
Portage |
|
IN |
|
(f) |
|
1,634 |
|
- |
|
- |
|
- |
|
1,634 |
|
- |
|
1,634 |
|
- |
|
1998 |
|
06/14/2013 |
|
Department Stores |
|
Albany |
|
KY |
|
(f) |
|
396 |
|
1,051 |
|
- |
|
- |
|
396 |
|
1,051 |
|
1,447 |
|
(78) |
|
2010 |
|
06/14/2013 |
|
Department Stores |
|
Cave City |
|
KY |
|
(f) |
|
365 |
|
754 |
|
- |
|
- |
|
365 |
|
754 |
|
1,119 |
|
(60) |
|
2010 |
|
06/14/2013 |
|
Department Stores |
|
Hartford |
|
KY |
|
(f) |
|
337 |
|
1,066 |
|
- |
|
- |
|
337 |
|
1,066 |
|
1,403 |
|
(77) |
|
2012 |
|
06/14/2013 |
|
Department Stores |
|
Gautier |
|
MS |
|
(f) |
|
764 |
|
1,037 |
|
- |
|
- |
|
764 |
|
1,037 |
|
1,801 |
|
(76) |
|
2011 |
|
06/14/2013 |
|
Department Stores |
|
Leakesville |
|
MS |
|
(f) |
|
361 |
|
915 |
|
- |
|
- |
|
361 |
|
915 |
|
1,276 |
|
(69) |
|
2012 |
|
06/14/2013 |
|
Department Stores |
|
Pascagoula |
|
MS |
|
(f) |
|
646 |
|
995 |
|
- |
|
- |
|
646 |
|
995 |
|
1,641 |
|
(70) |
|
2011 |
|
06/14/2013 |
|
Department Stores |
|
Purvis |
|
MS |
|
(f) |
|
417 |
|
901 |
|
- |
|
- |
|
417 |
|
901 |
|
1,318 |
|
(67) |
|
2012 |
|
06/14/2013 |
|
Restaurants – Full Service |
|
LaVale |
|
MD |
|
(f) |
|
1,313 |
|
1,629 |
|
- |
|
- |
|
1,313 |
|
1,629 |
|
2,942 |
|
(101) |
|
2005 |
|
06/27/2013 |
|
Child Day Care Services |
|
Columbus |
|
OH |
|
(f) |
|
452 |
|
1,687 |
|
- |
|
- |
|
452 |
|
1,687 |
|
2,139 |
|
(85) |
|
2006 |
|
06/27/2013 |
|
Child Day Care Services |
|
Columbus |
|
OH |
|
(f) |
|
253 |
|
943 |
|
- |
|
- |
|
253 |
|
943 |
|
1,196 |
|
(48) |
|
2006 |
|
06/27/2013 |
|
Child Day Care Services |
|
Delaware |
|
OH |
|
(f) |
|
1,130 |
|
1,029 |
|
- |
|
- |
|
1,130 |
|
1,029 |
|
2,159 |
|
(58) |
|
2005 |
|
06/27/2013 |
|
Child Day Care Services |
|
Delaware |
|
OH |
|
(f) |
|
647 |
|
590 |
|
- |
|
- |
|
647 |
|
590 |
|
1,237 |
|
(33) |
|
2005 |
|
06/27/2013 |
|
Child Day Care Services |
|
Dublin |
|
OH |
|
(f) |
|
843 |
|
1,011 |
|
- |
|
- |
|
843 |
|
1,011 |
|
1,854 |
|
(72) |
|
2003 |
|
06/27/2013 |
|
Child Day Care Services |
|
Hilliard |
|
OH |
|
(f) |
|
278 |
|
852 |
|
- |
|
- |
|
278 |
|
852 |
|
1,130 |
|
(45) |
|
2003 |
|
06/27/2013 |
|
Child Day Care Services |
|
Hilliard |
|
OH |
|
(f) |
|
485 |
|
1,485 |
|
- |
|
- |
|
485 |
|
1,485 |
|
1,970 |
|
(79) |
|
2003 |
|
06/27/2013 |
|
Child Day Care Services |
|
Marysville |
|
OH |
|
(f) |
|
237 |
|
949 |
|
- |
|
- |
|
237 |
|
949 |
|
1,186 |
|
(47) |
|
2005 |
|
06/27/2013 |
|
Child Day Care Services |
|
Marysville |
|
OH |
|
(f) |
|
424 |
|
1,696 |
|
- |
|
- |
|
424 |
|
1,696 |
|
2,120 |
|
(85) |
|
2005 |
|
06/27/2013 |
|
Child Day Care Services |
|
Powell |
|
OH |
|
(f) |
|
735 |
|
2,303 |
|
- |
|
- |
|
735 |
|
2,303 |
|
3,038 |
|
(122) |
|
2004 |
|
06/27/2013 |
|
Child Day Care Services |
|
Powell |
|
OH |
|
(f) |
|
286 |
|
895 |
|
- |
|
- |
|
286 |
|
895 |
|
1,181 |
|
(47) |
|
2004 |
|
06/27/2013 |
|
Child Day Care Services |
|
Westerville |
|
OH |
|
(f) |
|
315 |
|
918 |
|
- |
|
- |
|
315 |
|
918 |
|
1,233 |
|
(49) |
|
2005 |
|
06/27/2013 |
|
Child Day Care Services |
|
Westerville |
|
OH |
|
(f) |
|
550 |
|
1,601 |
|
- |
|
- |
|
550 |
|
1,601 |
|
2,151 |
|
(86) |
|
2005 |
|
06/27/2013 |
|
Restaurants – Full Service |
|
Midlothian |
|
VA |
|
(f) |
|
729 |
|
2,037 |
|
- |
|
- |
|
729 |
|
2,037 |
|
2,766 |
|
(116) |
|
1992 |
|
06/27/2013 |
|
Restaurants – Full Service |
|
Martinsburg |
|
WV |
|
(f) |
|
1,115 |
|
1,267 |
|
- |
|
- |
|
1,115 |
|
1,267 |
|
2,382 |
|
(79) |
|
1995 |
|
06/27/2013 |
|
Other Motor Vehicle Dealers |
|
Holiday |
|
FL |
|
(f) |
|
2,444 |
|
2,723 |
|
912 |
|
20 |
|
3,356 |
|
2,743 |
|
6,099 |
|
(188) |
|
1974 |
|
06/28/2013 |
|
Other Motor Vehicle Dealers |
|
Jacksonville |
|
FL |
|
(f) |
|
1,758 |
|
2,450 |
|
460 |
|
1,375 |
|
2,218 |
|
3,825 |
|
6,043 |
|
(174) |
|
2010 |
|
06/28/2013 |
|
Restaurants – Limited Service |
|
Charlotte |
|
NC |
|
(f) |
|
1,545 |
|
2,176 |
|
- |
|
- |
|
1,545 |
|
2,176 |
|
3,721 |
|
(146) |
|
2009 |
|
06/28/2013 |
|
Child Day Care Services |
|
Maineville |
|
OH |
|
(f) |
|
685 |
|
1,575 |
|
- |
|
- |
|
685 |
|
1,575 |
|
2,260 |
|
(102) |
|
2008 |
|
06/28/2013 |
|
Outpatient Care Centers |
|
North Charleston |
|
SC |
|
(f) |
|
410 |
|
2,356 |
|
- |
|
- |
|
410 |
|
2,356 |
|
2,766 |
|
(98) |
|
2009 |
|
06/28/2013 |
|
Restaurants – Limited Service |
|
Glen Allen |
|
VA |
|
(f) |
|
2,184 |
|
- |
|
- |
|
- |
|
2,184 |
|
- |
|
2,184 |
|
- |
|
1995 |
|
06/28/2013 |
|
Restaurants – Limited Service |
|
North Chesterfield |
|
VA |
|
(f) |
|
1,951 |
|
- |
|
- |
|
- |
|
1,951 |
|
- |
|
1,951 |
|
- |
|
1993 |
|
06/28/2013 |
|
Restaurants – Full Service |
|
Harker Heights |
|
TX |
|
|
|
860 |
|
150 |
|
577 |
|
1,811 |
|
1,437 |
|
1,961 |
|
3,398 |
|
(52) |
|
2014 |
|
07/09/2013 |
|
Restaurants – Limited Service |
|
Broken Arrow |
|
OK |
|
(f) |
|
366 |
|
597 |
|
- |
|
- |
|
366 |
|
597 |
|
963 |
|
(33) |
|
2007 |
|
07/12/2013 |
|
Restaurants – Limited Service |
|
Moore |
|
OK |
|
(f) |
|
179 |
|
744 |
|
- |
|
- |
|
179 |
|
744 |
|
923 |
|
(37) |
|
2000 |
|
07/12/2013 |
|
Restaurants – Limited Service |
|
Oklahoma City |
|
OK |
|
(f) |
|
161 |
|
554 |
|
- |
|
- |
|
161 |
|
554 |
|
715 |
|
(36) |
|
1978 |
|
07/12/2013 |
|
Restaurants – Limited Service |
|
Oklahoma City |
|
OK |
|
(f) |
|
400 |
|
473 |
|
- |
|
- |
|
400 |
|
473 |
|
873 |
|
(33) |
|
1998 |
|
07/12/2013 |
|
Restaurants – Limited Service |
|
Leawood |
|
KS |
|
(f) |
|
278 |
|
334 |
|
130 |
|
270 |
|
408 |
|
604 |
|
1,012 |
|
(37) |
|
1966 |
|
07/16/2013 |
|
Restaurants – Full Service |
|
Chattanooga |
|
TN |
|
(f) |
|
1,041 |
|
1,101 |
|
- |
|
- |
|
1,041 |
|
1,101 |
|
2,142 |
|
(67) |
|
1994 |
|
07/17/2013 |
|
Restaurants – Full Service |
|
Franklin |
|
TN |
|
(f) |
|
1,641 |
|
1,358 |
|
- |
|
- |
|
1,641 |
|
1,358 |
|
2,999 |
|
(83) |
|
1992 |
|
07/17/2013 |
|
Restaurants – Full Service |
|
Hermitage |
|
TN |
|
(f) |
|
1,292 |
|
1,228 |
|
- |
|
- |
|
1,292 |
|
1,228 |
|
2,520 |
|
(77) |
|
1998 |
|
07/17/2013 |
|
Restaurants – Full Service |
|
Knoxville |
|
TN |
|
(f) |
|
1,072 |
|
1,169 |
|
- |
|
- |
|
1,072 |
|
1,169 |
|
2,241 |
|
(73) |
|
1986 |
|
07/17/2013 |
|
Child Day Care Services |
|
Conover |
|
NC |
|
(f) |
|
250 |
|
644 |
|
- |
|
- |
|
250 |
|
644 |
|
894 |
|
(37) |
|
1985 |
|
07/26/2013 |
|
Child Day Care Services |
|
Conover |
|
NC |
|
(f) |
|
257 |
|
780 |
|
- |
|
- |
|
257 |
|
780 |
|
1,037 |
|
(47) |
|
1986 |
|
07/26/2013 |
|
Child Day Care Services |
|
Dobson |
|
NC |
|
(f) |
|
73 |
|
413 |
|
- |
|
- |
|
73 |
|
413 |
|
486 |
|
(25) |
|
1996 |
|
07/26/2013 |
|
Child Day Care Services |
|
Millers Creek |
|
NC |
|
(f) |
|
219 |
|
321 |
|
- |
|
- |
|
219 |
|
321 |
|
540 |
|
(28) |
|
1997 |
|
07/26/2013 |
|
Child Day Care Services |
|
Wilson |
|
NC |
|
(f) |
|
601 |
|
568 |
|
- |
|
- |
|
601 |
|
568 |
|
1,169 |
|
(34) |
|
1987 |
|
07/26/2013 |
|
Child Day Care Services |
|
Charlottesville |
|
VA |
|
(f) |
|
708 |
|
328 |
|
- |
|
- |
|
708 |
|
328 |
|
1,036 |
|
(26) |
|
1990 |
|
07/26/2013 |
|
Child Day Care Services |
|
Charlottesville |
|
VA |
|
(f) |
|
959 |
|
123 |
|
- |
|
- |
|
959 |
|
123 |
|
1,082 |
|
(11) |
|
1992 |
|
07/26/2013 |
|
Restaurants – Limited Service |
|
Montgomery |
|
AL |
|
(f) |
|
1,615 |
|
1,444 |
|
- |
|
- |
|
1,615 |
|
1,444 |
|
3,059 |
|
(101) |
|
2006 |
|
07/31/2013 |
|
Restaurants – Full Service |
|
Champaign |
|
IL |
|
(f) |
|
777 |
|
1,640 |
|
- |
|
- |
|
777 |
|
1,640 |
|
2,417 |
|
(106) |
|
1984 |
|
07/31/2013 |
|
Restaurants – Full Service |
|
Peoria |
|
IL |
|
(f) |
|
1,122 |
|
1,305 |
|
- |
|
- |
|
1,122 |
|
1,305 |
|
2,427 |
|
(84) |
|
2005 |
|
07/31/2013 |
|
Restaurants – Full Service |
|
Rockford |
|
IL |
|
(f) |
|
1,012 |
|
1,643 |
|
- |
|
- |
|
1,012 |
|
1,643 |
|
2,655 |
|
(89) |
|
1992 |
|
07/31/2013 |
F-10
|
Descriptions (a) |
|
|
|
Initial Cost to Company |
|
Costs Capitalized |
|
Gross amount at December 31, 2014 (b) (c) |
|
|
|
|
|
|
||||||||||||
|
Tenant Industry |
|
City |
|
St |
|
Encumbrances |
|
Land & |
|
Building & |
|
Land & |
|
Building & |
|
Land & |
|
Building & |
|
Total |
|
Accumulated |
|
Year |
|
Date |
|
Restaurants – Limited Service |
|
Gulfport |
|
MS |
|
(f) |
|
2,288 |
|
1,674 |
|
- |
|
- |
|
2,288 |
|
1,674 |
|
3,962 |
|
(110) |
|
2008 |
|
07/31/2013 |
|
Home Furnishings Stores |
|
Centerville |
|
OH |
|
(f) |
|
341 |
|
948 |
|
- |
|
- |
|
341 |
|
948 |
|
1,289 |
|
(55) |
|
1994 |
|
08/08/2013 |
|
Restaurants – Full Service |
|
Tempe |
|
AZ |
|
(f) |
|
1,696 |
|
545 |
|
- |
|
- |
|
1,696 |
|
545 |
|
2,241 |
|
(91) |
|
1988 |
|
08/13/2013 |
|
Motion Picture and Video Industries |
|
Lubbock |
|
TX |
|
|
|
1,115 |
|
331 |
|
747 |
|
5,305 |
|
1,862 |
|
5,636 |
|
7,498 |
|
(127) |
|
2014 |
|
08/16/2013 |
|
Plastics Product Manufacturing |
|
Milesburg |
|
PA |
|
(f) |
|
2,563 |
|
4,327 |
|
- |
|
- |
|
2,563 |
|
4,327 |
|
6,890 |
|
(421) |
|
1970 |
|
08/23/2013 |
|
Commercial and Industrial Machinery and Equipment Rental and Leasing |
|
Davie |
|
FL |
|
(f) |
|
2,198 |
|
1,973 |
|
- |
|
- |
|
2,198 |
|
1,973 |
|
4,171 |
|
(85) |
|
1996 |
|
08/28/2013 |
|
Commercial and Industrial Machinery and Equipment Rental and Leasing |
|
Fort Myers |
|
FL |
|
(f) |
|
1,384 |
|
4,797 |
|
- |
|
- |
|
1,384 |
|
4,797 |
|
6,181 |
|
(181) |
|
2007 |
|
08/28/2013 |
|
Commercial and Industrial Machinery and Equipment Rental and Leasing |
|
Tampa |
|
FL |
|
(f) |
|
2,063 |
|
4,869 |
|
318 |
|
1,182 |
|
2,381 |
|
6,051 |
|
8,432 |
|
(247) |
|
2000 |
|
08/28/2013 |
|
Furniture Stores |
|
Huntsville |
|
AL |
|
(f) |
|
1,812 |
|
4,314 |
|
- |
|
- |
|
1,812 |
|
4,314 |
|
6,126 |
|
(186) |
|
1987 |
|
08/29/2013 |
|
Furniture Stores |
|
Tuscaloosa |
|
AL |
|
(f) |
|
1,273 |
|
3,856 |
|
- |
|
- |
|
1,273 |
|
3,856 |
|
5,129 |
|
(140) |
|
2007 |
|
08/29/2013 |
|
Grocery Stores |
|
Houghton |
|
MI |
|
(f) |
|
1,009 |
|
1,955 |
|
- |
|
- |
|
1,009 |
|
1,955 |
|
2,964 |
|
(131) |
|
1993 |
|
08/29/2013 |
|
Restaurants – Full Service |
|
Tulsa |
|
OK |
|
(f) |
|
3,210 |
|
3,773 |
|
- |
|
350 |
|
3,210 |
|
4,123 |
|
7,333 |
|
(305) |
|
1991 |
|
08/30/2013 |
|
Outpatient Care Centers |
|
Charleston |
|
SC |
|
(f) |
|
1,005 |
|
1,802 |
|
- |
|
- |
|
1,005 |
|
1,802 |
|
2,807 |
|
(71) |
|
1968 |
|
08/30/2013 |
|
Restaurants – Limited Service |
|
Athens |
|
TN |
|
(f) |
|
318 |
|
- |
|
- |
|
- |
|
318 |
|
- |
|
318 |
|
- |
|
2005 |
|
08/30/2013 |
|
Restaurants – Limited Service |
|
Cleveland |
|
TN |
|
(f) |
|
346 |
|
- |
|
- |
|
- |
|
346 |
|
- |
|
346 |
|
- |
|
2001 |
|
08/30/2013 |
|
Restaurants – Limited Service |
|
Dayton |
|
TN |
|
(f) |
|
271 |
|
- |
|
- |
|
- |
|
271 |
|
- |
|
271 |
|
- |
|
1997 |
|
08/30/2013 |
|
Restaurants – Limited Service |
|
Kimball |
|
TN |
|
(f) |
|
271 |
|
- |
|
- |
|
- |
|
271 |
|
- |
|
271 |
|
- |
|
1987 |
|
08/30/2013 |
|
Restaurants – Limited Service |
|
Madisonville |
|
TN |
|
(f) |
|
243 |
|
- |
|
- |
|
- |
|
243 |
|
- |
|
243 |
|
- |
|
2005 |
|
08/30/2013 |
|
Home Furnishings Stores |
|
Fort Worth |
|
TX |
|
(f) |
|
3,783 |
|
9,559 |
|
- |
|
- |
|
3,783 |
|
9,559 |
|
13,342 |
|
(388) |
|
1998 |
|
08/30/2013 |
|
Sporting Goods, Hobby, and Musical Instrument Stores |
|
Flint |
|
MI |
|
(f) |
|
919 |
|
6,382 |
|
- |
|
- |
|
919 |
|
6,382 |
|
7,301 |
|
(437) |
|
1992 |
|
09/16/2013 |
|
Sporting Goods, Hobby, and Musical Instrument Stores |
|
Kentwood |
|
MI |
|
(f) |
|
1,935 |
|
1,473 |
|
- |
|
- |
|
1,935 |
|
1,473 |
|
3,408 |
|
(91) |
|
1995 |
|
09/16/2013 |
|
Restaurants – Limited Service |
|
Moncks Corner |
|
SC |
|
(f) |
|
145 |
|
768 |
|
- |
|
- |
|
145 |
|
768 |
|
913 |
|
(27) |
|
1989 |
|
09/17/2013 |
|
Sporting Goods, Hobby, and Musical Instrument Stores |
|
Peoria |
|
IL |
|
(f) |
|
850 |
|
2,768 |
|
- |
|
- |
|
850 |
|
2,768 |
|
3,618 |
|
(102) |
|
2001 |
|
09/18/2013 |
|
Sporting Goods, Hobby, and Musical Instrument Stores |
|
Jackson |
|
TN |
|
(f) |
|
3,437 |
|
4,634 |
|
- |
|
- |
|
3,437 |
|
4,634 |
|
8,071 |
|
(196) |
|
2007 |
|
09/18/2013 |
|
Health Clubs |
|
Weslaco |
|
TX |
|
|
|
1,565 |
|
224 |
|
354 |
|
3,020 |
|
1,919 |
|
3,244 |
|
5,163 |
|
(61) |
|
2014 |
|
09/27/2013 |
|
Consumer Goods Rental |
|
Bradenton |
|
FL |
|
(f) |
|
365 |
|
524 |
|
- |
|
- |
|
365 |
|
524 |
|
889 |
|
(26) |
|
1964 |
|
09/30/2013 |
|
Consumer Goods Rental |
|
Dade City |
|
FL |
|
(f) |
|
533 |
|
752 |
|
- |
|
- |
|
533 |
|
752 |
|
1,285 |
|
(40) |
|
1995 |
|
09/30/2013 |
|
Consumer Goods Rental |
|
Lake City |
|
FL |
|
(f) |
|
192 |
|
465 |
|
- |
|
- |
|
192 |
|
465 |
|
657 |
|
(22) |
|
1973 |
|
09/30/2013 |
|
Consumer Goods Rental |
|
Plant City |
|
FL |
|
(f) |
|
412 |
|
985 |
|
- |
|
- |
|
412 |
|
985 |
|
1,397 |
|
(50) |
|
1979 |
|
09/30/2013 |
|
Consumer Goods Rental |
|
Tampa |
|
FL |
|
(f) |
|
752 |
|
4,014 |
|
- |
|
- |
|
752 |
|
4,014 |
|
4,766 |
|
(188) |
|
1967 |
|
09/30/2013 |
|
Consumer Goods Rental |
|
Tampa |
|
FL |
|
(f) |
|
139 |
|
457 |
|
- |
|
- |
|
139 |
|
457 |
|
596 |
|
(22) |
|
1967 |
|
09/30/2013 |
|
Consumer Goods Rental |
|
Tampa |
|
FL |
|
(f) |
|
347 |
|
380 |
|
- |
|
- |
|
347 |
|
380 |
|
727 |
|
(23) |
|
1999 |
|
09/30/2013 |
|
Consumer Goods Rental |
|
Adel |
|
GA |
|
(f) |
|
102 |
|
544 |
|
- |
|
- |
|
102 |
|
544 |
|
646 |
|
(26) |
|
1978 |
|
09/30/2013 |
|
Consumer Goods Rental |
|
Moultrie |
|
GA |
|
(f) |
|
142 |
|
1,073 |
|
- |
|
- |
|
142 |
|
1,073 |
|
1,215 |
|
(49) |
|
1960 |
|
09/30/2013 |
|
Outpatient Care Centers |
|
Ballwin |
|
MO |
|
|
|
233 |
|
1,297 |
|
- |
|
- |
|
233 |
|
1,297 |
|
1,530 |
|
(42) |
|
2011 |
|
09/30/2013 |
|
Outpatient Care Centers |
|
Ballwin |
|
MO |
|
|
|
610 |
|
3,390 |
|
- |
|
- |
|
610 |
|
3,390 |
|
4,000 |
|
(110) |
|
2004 |
|
09/30/2013 |
|
Family Entertainment Centers |
|
Bethlehem |
|
PA |
|
(f) |
|
2,484 |
|
3,534 |
|
- |
|
- |
|
2,484 |
|
3,534 |
|
6,018 |
|
(183) |
|
1998 |
|
10/04/2013 |
|
Fiber, Yarn, and Thread Mills |
|
Brownsville |
|
TX |
|
(f) |
|
547 |
|
1,826 |
|
- |
|
- |
|
547 |
|
1,826 |
|
2,373 |
|
(97) |
|
1997 |
|
10/08/2013 |
|
Consumer Goods Rental |
|
Auburn |
|
WA |
|
(f) |
|
236 |
|
835 |
|
- |
|
- |
|
236 |
|
835 |
|
1,071 |
|
(34) |
|
1953 |
|
10/11/2013 |
|
Consumer Goods Rental |
|
Centralia |
|
WA |
|
(f) |
|
298 |
|
711 |
|
- |
|
- |
|
298 |
|
711 |
|
1,009 |
|
(39) |
|
1975 |
|
10/11/2013 |
|
Consumer Goods Rental |
|
Moses Lake |
|
WA |
|
(f) |
|
451 |
|
569 |
|
- |
|
- |
|
451 |
|
569 |
|
1,020 |
|
(35) |
|
1993 |
|
10/11/2013 |
|
Consumer Goods Rental |
|
Wenatchee |
|
WA |
|
(f) |
|
535 |
|
259 |
|
- |
|
- |
|
535 |
|
259 |
|
794 |
|
(14) |
|
2005 |
|
10/11/2013 |
F-11
|
Descriptions (a) |
|
|
|
Initial Cost to Company |
|
Costs Capitalized |
|
Gross amount at December 31, 2014 (b) (c) |
|
|
|
|
|
|
||||||||||||
|
Tenant Industry |
|
City |
|
St |
|
Encumbrances |
|
Land & |
|
Building & |
|
Land & |
|
Building & |
|
Land & |
|
Building & |
|
Total |
|
Accumulated |
|
Year |
|
Date |
|
Restaurants – Full Service |
|
Chicago |
|
IL |
|
(f) |
|
353 |
|
3,103 |
|
- |
|
- |
|
353 |
|
3,103 |
|
3,456 |
|
(127) |
|
1894 |
|
10/18/2013 |
|
Resin, Synthetic Rubber, and Artificial Synthetic Fibers and Filaments Manufacturing |
|
Cranberry Township |
|
PA |
|
(f) |
|
1,220 |
|
3,513 |
|
- |
|
- |
|
1,220 |
|
3,513 |
|
4,733 |
|
(232) |
|
1998 |
|
10/25/2013 |
|
Psychiatric and Substance Abuse Hospitals |
|
Jacksonville |
|
FL |
|
(f) |
|
1,062 |
|
6,666 |
|
89 |
|
292 |
|
1,151 |
|
6,958 |
|
8,109 |
|
(221) |
|
1984 |
|
10/31/2013 |
|
Health Clubs |
|
San Antonio |
|
TX |
|
(f) |
|
3,403 |
|
2,796 |
|
- |
|
- |
|
3,403 |
|
2,796 |
|
6,199 |
|
(108) |
|
2013 |
|
11/04/2013 |
|
Machinery, Equipment, and Supplies Merchant Wholesalers |
|
Williams |
|
IA |
|
(f) |
|
2,134 |
|
4,245 |
|
- |
|
- |
|
2,134 |
|
4,245 |
|
6,379 |
|
(255) |
|
2013 |
|
11/08/2013 |
|
Coating, Engraving, Heat Treating, and Allied Activities |
|
Melrose Park |
|
IL |
|
(f) |
|
1,285 |
|
3,249 |
|
- |
|
- |
|
1,285 |
|
3,249 |
|
4,534 |
|
(150) |
|
1966 |
|
11/08/2013 |
|
Coating, Engraving, Heat Treating, and Allied Activities |
|
Northlake |
|
IL |
|
(f) |
|
593 |
|
2,234 |
|
- |
|
- |
|
593 |
|
2,234 |
|
2,827 |
|
(98) |
|
1964 |
|
11/08/2013 |
|
Coating, Engraving, Heat Treating, and Allied Activities |
|
Northlake |
|
IL |
|
(f) |
|
770 |
|
1,055 |
|
- |
|
- |
|
770 |
|
1,055 |
|
1,825 |
|
(60) |
|
1958 |
|
11/08/2013 |
|
Coating, Engraving, Heat Treating, and Allied Activities |
|
Rockford |
|
IL |
|
(f) |
|
513 |
|
1,211 |
|
- |
|
- |
|
513 |
|
1,211 |
|
1,724 |
|
(55) |
|
1977 |
|
11/08/2013 |
|
Coating, Engraving, Heat Treating, and Allied Activities |
|
South Bend |
|
IN |
|
(f) |
|
359 |
|
1,464 |
|
- |
|
- |
|
359 |
|
1,464 |
|
1,823 |
|
(74) |
|
1983 |
|
11/08/2013 |
|
Coating, Engraving, Heat Treating, and Allied Activities |
|
Benton Harbor |
|
MI |
|
(f) |
|
659 |
|
1,475 |
|
- |
|
- |
|
659 |
|
1,475 |
|
2,134 |
|
(83) |
|
1957 |
|
11/08/2013 |
|
Coating, Engraving, Heat Treating, and Allied Activities |
|
Coldwater |
|
MI |
|
(f) |
|
757 |
|
2,484 |
|
- |
|
- |
|
757 |
|
2,484 |
|
3,241 |
|
(141) |
|
1995 |
|
11/08/2013 |
|
Coating, Engraving, Heat Treating, and Allied Activities |
|
Kitchener |
|
ON |
|
|
|
1,440 |
|
3,296 |
|
- |
|
- |
|
1,440 |
|
3,296 |
|
4,736 |
|
(144) |
|
1975 |
|
11/08/2013 |
|
Coating, Engraving, Heat Treating, and Allied Activities |
|
St. Marys |
|
PA |
|
(f) |
|
447 |
|
2,098 |
|
- |
|
- |
|
447 |
|
2,098 |
|
2,545 |
|
(96) |
|
1987 |
|
11/08/2013 |
|
Furniture Stores |
|
Southaven |
|
MS |
|
(f) |
|
1,969 |
|
4,553 |
|
- |
|
- |
|
1,969 |
|
4,553 |
|
6,522 |
|
(150) |
|
2007 |
|
11/12/2013 |
|
Furniture Stores |
|
Chattanooga |
|
TN |
|
(f) |
|
2,897 |
|
3,891 |
|
- |
|
- |
|
2,897 |
|
3,891 |
|
6,788 |
|
(165) |
|
1996 |
|
11/12/2013 |
|
Furniture Stores |
|
Jackson |
|
TN |
|
(f) |
|
1,956 |
|
3,757 |
|
- |
|
- |
|
1,956 |
|
3,757 |
|
5,713 |
|
(150) |
|
2004 |
|
11/12/2013 |
|
Converted Paper Product Manufacturing |
|
Green Bay |
|
WI |
|
(f) |
|
871 |
|
6,889 |
|
- |
|
- |
|
871 |
|
6,889 |
|
7,760 |
|
(305) |
|
1997 |
|
11/12/2013 |
|
Converted Paper Product Manufacturing |
|
Green Bay |
|
WI |
|
(f) |
|
795 |
|
4,877 |
|
- |
|
- |
|
795 |
|
4,877 |
|
5,672 |
|
(318) |
|
1968 |
|
11/12/2013 |
|
Sporting Goods, Hobby, and Musical Instrument Stores |
|
Fargo |
|
ND |
|
(f) |
|
2,024 |
|
7,151 |
|
- |
|
- |
|
2,024 |
|
7,151 |
|
9,175 |
|
(282) |
|
2004 |
|
11/14/2013 |
|
Sporting Goods, Hobby, and Musical Instrument Stores |
|
College Station |
|
TX |
|
13,863 |
|
4,044 |
|
8,057 |
|
- |
|
- |
|
4,044 |
|
8,057 |
|
12,101 |
|
(281) |
|
2007 |
|
11/14/2013 |
|
Sporting Goods, Hobby, and Musical Instrument Stores |
|
Lubbock |
|
TX |
|
|
|
3,264 |
|
6,622 |
|
- |
|
- |
|
3,264 |
|
6,622 |
|
9,886 |
|
(201) |
|
2007 |
|
11/14/2013 |
|
Sporting Goods, Hobby, and Musical Instrument Stores |
|
Gadsden |
|
AL |
|
|
|
1,849 |
|
299 |
|
297 |
|
4,003 |
|
2,146 |
|
4,302 |
|
6,448 |
|
(85) |
|
2014 |
|
11/15/2013 |
|
Other Personal Services |
|
Charlotte |
|
NC |
|
(f) |
|
681 |
|
2,905 |
|
- |
|
- |
|
681 |
|
2,905 |
|
3,586 |
|
(91) |
|
2002 |
|
11/22/2013 |
|
Restaurants – Full Service |
|
Alcoa |
|
TN |
|
(f) |
|
572 |
|
1,295 |
|
- |
|
- |
|
572 |
|
1,295 |
|
1,867 |
|
(59) |
|
1997 |
|
11/22/2013 |
|
Restaurants – Full Service |
|
Knoxville |
|
TN |
|
(f) |
|
861 |
|
2,073 |
|
- |
|
- |
|
861 |
|
2,073 |
|
2,934 |
|
(99) |
|
1995 |
|
11/22/2013 |
|
Health Clubs |
|
Humble |
|
TX |
|
(f) |
|
1,209 |
|
2,816 |
|
- |
|
- |
|
1,209 |
|
2,816 |
|
4,025 |
|
(97) |
|
2012 |
|
11/27/2013 |
|
Motion Picture and Video Industries |
|
Spring Hill |
|
TN |
|
|
|
1,976 |
|
180 |
|
- |
|
4,762 |
|
1,976 |
|
4,942 |
|
6,918 |
|
- |
|
|
|
12/12/2013 |
|
Motion Picture and Video Industries |
|
Austin |
|
TX |
|
7,511 |
|
3,839 |
|
6,201 |
|
- |
|
- |
|
3,839 |
|
6,201 |
|
10,040 |
|
(183) |
|
2012 |
|
12/12/2013 |
|
Restaurants – Full Service |
|
Waco |
|
TX |
|
|
|
888 |
|
123 |
|
654 |
|
2,040 |
|
1,542 |
|
2,163 |
|
3,705 |
|
(41) |
|
2014 |
|
12/12/2013 |
|
Lumber and Other Construction Materials Merchant Wholesalers |
|
Conway |
|
SC |
|
(f) |
|
1,727 |
|
3,668 |
|
- |
|
- |
|
1,727 |
|
3,668 |
|
5,395 |
|
(217) |
|
2002 |
|
12/13/2013 |
F-12
|
Descriptions (a) |
|
|
|
Initial Cost to Company |
|
Costs Capitalized |
|
Gross amount at December 31, 2014 (b) (c) |
|
|
|
|
|
|
||||||||||||
|
Tenant Industry |
|
City |
|
St |
|
Encumbrances |
|
Land & |
|
Building & |
|
Land & |
|
Building & |
|
Land & |
|
Building & |
|
Total |
|
Accumulated |
|
Year |
|
Date |
|
Outpatient Care Centers |
|
Chandler |
|
AZ |
|
(f) |
|
577 |
|
1,405 |
|
- |
|
- |
|
577 |
|
1,405 |
|
1,982 |
|
(59) |
|
2007 |
|
12/16/2013 |
|
Outpatient Care Centers |
|
Gilbert |
|
AZ |
|
(f) |
|
578 |
|
1,335 |
|
- |
|
- |
|
578 |
|
1,335 |
|
1,913 |
|
(58) |
|
2004 |
|
12/16/2013 |
|
Restaurants – Full Service |
|
Burlington |
|
IA |
|
(f) |
|
585 |
|
1,571 |
|
- |
|
- |
|
585 |
|
1,571 |
|
2,156 |
|
(61) |
|
2010 |
|
12/18/2013 |
|
Restaurants – Full Service |
|
Galesburg |
|
IL |
|
(f) |
|
870 |
|
1,287 |
|
- |
|
- |
|
870 |
|
1,287 |
|
2,157 |
|
(58) |
|
2007 |
|
12/18/2013 |
|
Restaurants – Full Service |
|
Macomb |
|
IL |
|
(f) |
|
858 |
|
1,299 |
|
- |
|
- |
|
858 |
|
1,299 |
|
2,157 |
|
(59) |
|
2009 |
|
12/18/2013 |
|
Sporting Goods, Hobby, and Musical Instrument Stores |
|
Cicero |
|
NY |
|
6,676 |
|
1,933 |
|
7,013 |
|
- |
|
- |
|
1,933 |
|
7,013 |
|
8,946 |
|
(226) |
|
2004 |
|
12/19/2013 |
|
Health Clubs |
|
Denver |
|
CO |
|
(f) |
|
654 |
|
4,393 |
|
12 |
|
453 |
|
666 |
|
4,846 |
|
5,512 |
|
(183) |
|
1997 |
|
12/30/2013 |
|
Restaurants – Limited Service |
|
Evansville |
|
IN |
|
(f) |
|
381 |
|
840 |
|
- |
|
- |
|
381 |
|
840 |
|
1,221 |
|
(38) |
|
2005 |
|
12/30/2013 |
|
Psychiatric and Substance Abuse Hospitals |
|
Knoxville |
|
TN |
|
(f) |
|
223 |
|
1,508 |
|
- |
|
- |
|
223 |
|
1,508 |
|
1,731 |
|
(62) |
|
1981 |
|
12/30/2013 |
|
Psychiatric and Substance Abuse Hospitals |
|
Knoxville |
|
TN |
|
(f) |
|
214 |
|
1,444 |
|
- |
|
- |
|
214 |
|
1,444 |
|
1,658 |
|
(59) |
|
1973 |
|
12/30/2013 |
|
Psychiatric and Substance Abuse Hospitals |
|
Knoxville |
|
TN |
|
(f) |
|
72 |
|
485 |
|
- |
|
- |
|
72 |
|
485 |
|
557 |
|
(20) |
|
1989 |
|
12/30/2013 |
|
Restaurants – Full Service |
|
Houston |
|
TX |
|
(f) |
|
666 |
|
780 |
|
- |
|
- |
|
666 |
|
780 |
|
1,446 |
|
(34) |
|
2006 |
|
12/30/2013 |
|
Restaurants – Full Service |
|
Lubbock |
|
TX |
|
(f) |
|
430 |
|
920 |
|
- |
|
- |
|
430 |
|
920 |
|
1,350 |
|
(39) |
|
2002 |
|
12/30/2013 |
|
Restaurants – Limited Service |
|
Bristol |
|
CT |
|
(f) |
|
473 |
|
501 |
|
- |
|
- |
|
473 |
|
501 |
|
974 |
|
(22) |
|
1987 |
|
12/31/2013 |
|
Restaurants – Limited Service |
|
East Hartford |
|
CT |
|
(f) |
|
345 |
|
401 |
|
- |
|
- |
|
345 |
|
401 |
|
746 |
|
(18) |
|
1917 |
|
12/31/2013 |
|
Restaurants – Limited Service |
|
Hamden |
|
CT |
|
(f) |
|
346 |
|
349 |
|
- |
|
- |
|
346 |
|
349 |
|
695 |
|
(17) |
|
1985 |
|
12/31/2013 |
|
Restaurants – Limited Service |
|
Hartford |
|
CT |
|
(f) |
|
270 |
|
395 |
|
- |
|
- |
|
270 |
|
395 |
|
665 |
|
(14) |
|
2009 |
|
12/31/2013 |
|
Restaurants – Limited Service |
|
Manchester |
|
CT |
|
(f) |
|
114 |
|
602 |
|
- |
|
- |
|
114 |
|
602 |
|
716 |
|
(24) |
|
1953 |
|
12/31/2013 |
|
Restaurants – Limited Service |
|
New Britain |
|
CT |
|
(f) |
|
394 |
|
1,038 |
|
- |
|
- |
|
394 |
|
1,038 |
|
1,432 |
|
(42) |
|
1988 |
|
12/31/2013 |
|
Restaurants – Limited Service |
|
New Haven |
|
CT |
|
(f) |
|
231 |
|
613 |
|
- |
|
- |
|
231 |
|
613 |
|
844 |
|
(24) |
|
1982 |
|
12/31/2013 |
|
Restaurants – Limited Service |
|
Southington |
|
CT |
|
(f) |
|
678 |
|
376 |
|
- |
|
- |
|
678 |
|
376 |
|
1,054 |
|
(18) |
|
2001 |
|
12/31/2013 |
|
Restaurants – Limited Service |
|
Vernon |
|
CT |
|
(f) |
|
255 |
|
629 |
|
- |
|
- |
|
255 |
|
629 |
|
884 |
|
(29) |
|
1983 |
|
12/31/2013 |
|
Restaurants – Limited Service |
|
West Hartford |
|
CT |
|
(f) |
|
316 |
|
917 |
|
- |
|
- |
|
316 |
|
917 |
|
1,233 |
|
(36) |
|
1998 |
|
12/31/2013 |
|
Restaurants – Limited Service |
|
Gainesville |
|
FL |
|
(f) |
|
220 |
|
376 |
|
- |
|
- |
|
220 |
|
376 |
|
596 |
|
(19) |
|
1980 |
|
12/31/2013 |
|
Restaurants – Limited Service |
|
Gainesville |
|
FL |
|
(f) |
|
463 |
|
432 |
|
- |
|
- |
|
463 |
|
432 |
|
895 |
|
(26) |
|
2001 |
|
12/31/2013 |
|
Restaurants – Limited Service |
|
Middleburg |
|
FL |
|
(f) |
|
502 |
|
432 |
|
- |
|
- |
|
502 |
|
432 |
|
934 |
|
(22) |
|
2001 |
|
12/31/2013 |
|
Restaurants – Limited Service |
|
Perry |
|
FL |
|
(f) |
|
184 |
|
472 |
|
- |
|
- |
|
184 |
|
472 |
|
656 |
|
(22) |
|
1979 |
|
12/31/2013 |
|
Restaurants – Limited Service |
|
Starke |
|
FL |
|
(f) |
|
365 |
|
232 |
|
- |
|
- |
|
365 |
|
232 |
|
597 |
|
(13) |
|
1991 |
|
12/31/2013 |
|
Other Motor Vehicle Dealers |
|
Lake Park |
|
GA |
|
(f) |
|
2,108 |
|
2,897 |
|
- |
|
- |
|
2,108 |
|
2,897 |
|
5,005 |
|
(146) |
|
2013 |
|
12/31/2013 |
|
Other Food Manufacturing |
|
South Holland |
|
IL |
|
(f) |
|
1,373 |
|
14,648 |
|
- |
|
- |
|
1,373 |
|
14,648 |
|
16,021 |
|
(510) |
|
1991 |
|
12/31/2013 |
|
Restaurants – Full Service |
|
Olathe |
|
KS |
|
(f) |
|
787 |
|
2,119 |
|
- |
|
- |
|
787 |
|
2,119 |
|
2,906 |
|
(84) |
|
2005 |
|
12/31/2013 |
|
Restaurants – Full Service |
|
Springfield |
|
MO |
|
(f) |
|
1,684 |
|
5,405 |
|
- |
|
- |
|
1,684 |
|
5,405 |
|
7,089 |
|
(212) |
|
1977 |
|
12/31/2013 |
|
Semiconductor and Other Electronic Component Manufacturing |
|
State College |
|
PA |
|
9,984 |
|
4,398 |
|
11,503 |
|
- |
|
- |
|
4,398 |
|
11,503 |
|
15,901 |
|
(693) |
|
1960 |
|
12/31/2013 |
|
Elementary and Secondary Schools |
|
Arlington |
|
TX |
|
(f) |
|
744 |
|
5,783 |
|
- |
|
- |
|
744 |
|
5,783 |
|
6,527 |
|
(163) |
|
1945 |
|
12/31/2013 |
|
Child Day Care Services |
|
Houston |
|
TX |
|
(f) |
|
706 |
|
2,798 |
|
- |
|
- |
|
706 |
|
2,798 |
|
3,504 |
|
(80) |
|
2003 |
|
12/31/2013 |
|
Motion Picture and Video Industries |
|
Keller |
|
TX |
|
|
|
1,532 |
|
1,720 |
|
1,692 |
|
5,759 |
|
3,224 |
|
7,479 |
|
10,703 |
|
(50) |
|
2014 |
|
12/31/2013 |
|
Restaurants – Limited Service |
|
Buckeye |
|
AZ |
|
(f) |
|
731 |
|
724 |
|
- |
|
- |
|
731 |
|
724 |
|
1,455 |
|
(58) |
|
1999 |
|
01/03/2014 |
|
Restaurants – Limited Service |
|
Bullhead City |
|
AZ |
|
(f) |
|
461 |
|
282 |
|
- |
|
- |
|
461 |
|
282 |
|
743 |
|
(21) |
|
2002 |
|
01/03/2014 |
|
Restaurants – Limited Service |
|
Cottonwood |
|
AZ |
|
(f) |
|
503 |
|
611 |
|
- |
|
- |
|
503 |
|
611 |
|
1,114 |
|
(35) |
|
1996 |
|
01/03/2014 |
|
Restaurants – Limited Service |
|
Golden Valley |
|
AZ |
|
(f) |
|
316 |
|
206 |
|
- |
|
- |
|
316 |
|
206 |
|
522 |
|
(16) |
|
1998 |
|
01/03/2014 |
|
Restaurants – Limited Service |
|
Prescott |
|
AZ |
|
(f) |
|
640 |
|
635 |
|
- |
|
- |
|
640 |
|
635 |
|
1,275 |
|
(45) |
|
1993 |
|
01/03/2014 |
|
Restaurants – Limited Service |
|
Show Low |
|
AZ |
|
(f) |
|
603 |
|
882 |
|
- |
|
- |
|
603 |
|
882 |
|
1,485 |
|
(49) |
|
2006 |
|
01/03/2014 |
|
Child Day Care Services |
|
Alexandria |
|
KY |
|
(f) |
|
317 |
|
852 |
|
- |
|
- |
|
317 |
|
852 |
|
1,169 |
|
(33) |
|
1997 |
|
01/03/2014 |
|
Child Day Care Services |
|
Covington |
|
KY |
|
(f) |
|
240 |
|
989 |
|
- |
|
- |
|
240 |
|
989 |
|
1,229 |
|
(33) |
|
1990 |
|
01/03/2014 |
|
Child Day Care Services |
|
Crescent Springs |
|
KY |
|
(f) |
|
205 |
|
692 |
|
- |
|
- |
|
205 |
|
692 |
|
897 |
|
(29) |
|
1990 |
|
01/03/2014 |
|
Child Day Care Services |
|
Crestview Hills |
|
KY |
|
(f) |
|
566 |
|
1,862 |
|
- |
|
- |
|
566 |
|
1,862 |
|
2,428 |
|
(61) |
|
2007 |
|
01/03/2014 |
|
Child Day Care Services |
|
Erlanger |
|
KY |
|
(f) |
|
295 |
|
1,277 |
|
- |
|
- |
|
295 |
|
1,277 |
|
1,572 |
|
(48) |
|
2000 |
|
01/03/2014 |
F-13
|
Descriptions (a) |
|
|
|
Initial Cost to Company |
|
Costs Capitalized |
|
Gross amount at December 31, 2014 (b) (c) |
|
|
|
|
|
|
||||||||||||
|
Tenant Industry |
|
City |
|
St |
|
Encumbrances |
|
Land & |
|
Building & |
|
Land & |
|
Building & |
|
Land & |
|
Building & |
|
Total |
|
Accumulated |
|
Year |
|
Date |
|
Child Day Care Services |
|
Florence |
|
KY |
|
(f) |
|
418 |
|
1,426 |
|
- |
|
- |
|
418 |
|
1,426 |
|
1,844 |
|
(55) |
|
1992 |
|
01/03/2014 |
|
Child Day Care Services |
|
Florence |
|
KY |
|
(f) |
|
289 |
|
699 |
|
- |
|
- |
|
289 |
|
699 |
|
988 |
|
(32) |
|
1988 |
|
01/03/2014 |
|
Child Day Care Services |
|
Hebron |
|
KY |
|
(f) |
|
350 |
|
1,555 |
|
- |
|
- |
|
350 |
|
1,555 |
|
1,905 |
|
(59) |
|
1997 |
|
01/03/2014 |
|
Child Day Care Services |
|
Independence |
|
KY |
|
(f) |
|
440 |
|
1,141 |
|
- |
|
- |
|
440 |
|
1,141 |
|
1,581 |
|
(51) |
|
2000 |
|
01/03/2014 |
|
Child Day Care Services |
|
Taylor Mill |
|
KY |
|
(f) |
|
658 |
|
752 |
|
- |
|
- |
|
658 |
|
752 |
|
1,410 |
|
(36) |
|
1995 |
|
01/03/2014 |
|
Child Day Care Services |
|
Walton |
|
KY |
|
(f) |
|
269 |
|
1,253 |
|
- |
|
- |
|
269 |
|
1,253 |
|
1,522 |
|
(45) |
|
1998 |
|
01/03/2014 |
|
Other Food Manufacturing |
|
Mason City |
|
IA |
|
(f) |
|
401 |
|
8,703 |
|
- |
|
- |
|
401 |
|
8,703 |
|
9,104 |
|
(226) |
|
2003 |
|
01/10/2014 |
|
Gambling Industries |
|
Cripple Creek |
|
CO |
|
|
|
702 |
|
16,128 |
|
- |
|
- |
|
702 |
|
16,128 |
|
16,830 |
|
(380) |
|
2008 |
|
01/17/2014 |
|
Gambling Industries |
|
Cripple Creek |
|
CO |
|
|
|
212 |
|
588 |
|
- |
|
- |
|
212 |
|
588 |
|
800 |
|
(30) |
|
1993 |
|
01/17/2014 |
|
Gambling Industries |
|
Cripple Creek |
|
CO |
|
|
|
105 |
|
- |
|
- |
|
- |
|
105 |
|
- |
|
105 |
|
- |
|
|
|
01/17/2014 |
|
Child Day Care Services |
|
Jamestown |
|
NC |
|
(f) |
|
477 |
|
730 |
|
- |
|
- |
|
477 |
|
730 |
|
1,207 |
|
(38) |
|
1989 |
|
01/24/2014 |
|
Resin, Synthetic Rubber, and Artificial Synthetic Fibers and Filaments Manufacturing |
|
Montrose |
|
CO |
|
(f) |
|
291 |
|
5,521 |
|
- |
|
- |
|
291 |
|
5,521 |
|
5,812 |
|
(179) |
|
1995 |
|
01/31/2014 |
|
Health Clubs |
|
Louisville |
|
KY |
|
(f) |
|
2,493 |
|
6,029 |
|
- |
|
- |
|
2,493 |
|
6,029 |
|
8,522 |
|
(222) |
|
1972 |
|
01/31/2014 |
|
Health Clubs |
|
Antioch |
|
TN |
|
|
|
1,400 |
|
5,388 |
|
- |
|
- |
|
1,400 |
|
5,388 |
|
6,788 |
|
(157) |
|
2002 |
|
01/31/2014 |
|
Health Clubs |
|
Lexington |
|
KY |
|
15,857 |
|
1,164 |
|
8,000 |
|
- |
|
- |
|
1,164 |
|
8,000 |
|
9,164 |
|
(204) |
|
2004 |
|
01/31/2014 |
|
Health Clubs |
|
Lexington |
|
KY |
|
|
|
1,251 |
|
6,619 |
|
- |
|
- |
|
1,251 |
|
6,619 |
|
7,870 |
|
(169) |
|
2005 |
|
01/31/2014 |
|
Child Day Care Services |
|
Fayetteville |
|
AR |
|
(f) |
|
465 |
|
1,866 |
|
- |
|
- |
|
465 |
|
1,866 |
|
2,331 |
|
(56) |
|
2012 |
|
02/14/2014 |
|
Restaurants – Full Service |
|
Eagan |
|
MN |
|
(f) |
|
1,405 |
|
2,162 |
|
- |
|
- |
|
1,405 |
|
2,162 |
|
3,567 |
|
(59) |
|
1996 |
|
02/19/2014 |
|
Restaurants – Full Service |
|
Maplewood |
|
MN |
|
(f) |
|
915 |
|
1,848 |
|
- |
|
- |
|
915 |
|
1,848 |
|
2,763 |
|
(51) |
|
2000 |
|
02/19/2014 |
|
Restaurants – Full Service |
|
Naperville |
|
IL |
|
|
|
2,000 |
|
489 |
|
501 |
|
1,564 |
|
2,501 |
|
2,053 |
|
4,554 |
|
(30) |
|
2014 |
|
03/06/2014 |
|
Colleges, Universities, and Professional Schools |
|
Columbia |
|
SC |
|
|
|
562 |
|
11,878 |
|
- |
|
810 |
|
562 |
|
12,688 |
|
13,250 |
|
(339) |
|
1995 |
|
03/10/2014 |
|
Colleges, Universities, and Professional Schools |
|
Columbia |
|
SC |
|
|
|
638 |
|
5,017 |
|
- |
|
- |
|
638 |
|
5,017 |
|
5,655 |
|
(142) |
|
2010 |
|
03/10/2014 |
|
Colleges, Universities, and Professional Schools |
|
Columbia |
|
SC |
|
|
|
244 |
|
- |
|
- |
|
3,740 |
|
244 |
|
3,740 |
|
3,984 |
|
- |
|
|
|
03/10/2014 |
|
Child Day Care Services |
|
Alpharetta |
|
GA |
|
|
|
920 |
|
1,590 |
|
- |
|
- |
|
920 |
|
1,590 |
|
2,510 |
|
(40) |
|
2007 |
|
03/11/2014 |
|
Child Day Care Services |
|
Cumming |
|
GA |
|
|
|
826 |
|
3,449 |
|
- |
|
- |
|
826 |
|
3,449 |
|
4,275 |
|
(80) |
|
2006 |
|
03/11/2014 |
|
Health Clubs |
|
Vestavia Hills |
|
AL |
|
|
|
1,299 |
|
6,199 |
|
- |
|
- |
|
1,299 |
|
6,199 |
|
7,498 |
|
(135) |
|
2007 |
|
03/20/2014 |
|
Restaurants – Full Service |
|
Athens |
|
GA |
|
(f) |
|
731 |
|
1,065 |
|
- |
|
- |
|
731 |
|
1,065 |
|
1,796 |
|
(33) |
|
2007 |
|
03/21/2014 |
|
Restaurants – Full Service |
|
Winder |
|
GA |
|
(f) |
|
752 |
|
1,045 |
|
- |
|
- |
|
752 |
|
1,045 |
|
1,797 |
|
(24) |
|
2005 |
|
03/21/2014 |
|
Junior Colleges |
|
Overland Park |
|
KS |
|
|
|
4,181 |
|
8,942 |
|
- |
|
- |
|
4,181 |
|
8,942 |
|
13,123 |
|
(176) |
|
2012 |
|
03/21/2014 |
|
Restaurants – Full Service |
|
Lenoir |
|
NC |
|
(f) |
|
975 |
|
1,065 |
|
- |
|
- |
|
975 |
|
1,065 |
|
2,040 |
|
(25) |
|
2008 |
|
03/21/2014 |
|
Restaurants – Full Service |
|
Anderson |
|
SC |
|
(f) |
|
900 |
|
825 |
|
- |
|
- |
|
900 |
|
825 |
|
1,725 |
|
(28) |
|
2006 |
|
03/21/2014 |
|
Restaurants – Full Service |
|
Camden |
|
SC |
|
(f) |
|
765 |
|
1,275 |
|
- |
|
- |
|
765 |
|
1,275 |
|
2,040 |
|
(33) |
|
2006 |
|
03/21/2014 |
|
Restaurants – Full Service |
|
Cheraw |
|
SC |
|
(f) |
|
626 |
|
947 |
|
- |
|
- |
|
626 |
|
947 |
|
1,573 |
|
(24) |
|
2007 |
|
03/21/2014 |
|
Restaurants – Full Service |
|
Clinton |
|
SC |
|
(f) |
|
697 |
|
1,515 |
|
- |
|
- |
|
697 |
|
1,515 |
|
2,212 |
|
(38) |
|
2006 |
|
03/21/2014 |
|
Restaurants – Full Service |
|
Greenwood |
|
SC |
|
(f) |
|
808 |
|
1,181 |
|
- |
|
- |
|
808 |
|
1,181 |
|
1,989 |
|
(40) |
|
1995 |
|
03/21/2014 |
|
Restaurants – Full Service |
|
Bristol |
|
TN |
|
(f) |
|
776 |
|
1,020 |
|
- |
|
- |
|
776 |
|
1,020 |
|
1,796 |
|
(34) |
|
2005 |
|
03/21/2014 |
|
Restaurants – Full Service |
|
Kingsport |
|
TN |
|
(f) |
|
814 |
|
1,053 |
|
- |
|
- |
|
814 |
|
1,053 |
|
1,867 |
|
(34) |
|
2006 |
|
03/21/2014 |
|
Restaurants – Full Service |
|
Dublin |
|
VA |
|
(f) |
|
947 |
|
971 |
|
- |
|
- |
|
947 |
|
971 |
|
1,918 |
|
(28) |
|
2008 |
|
03/21/2014 |
|
Restaurants – Limited Service |
|
Jacksonville |
|
FL |
|
(f) |
|
494 |
|
- |
|
- |
|
- |
|
494 |
|
- |
|
494 |
|
- |
|
1997 |
|
03/27/2014 |
|
Restaurants – Limited Service |
|
Miami |
|
FL |
|
(f) |
|
1,210 |
|
- |
|
- |
|
- |
|
1,210 |
|
- |
|
1,210 |
|
- |
|
1981 |
|
03/27/2014 |
|
Restaurants – Limited Service |
|
Orlando |
|
FL |
|
(f) |
|
625 |
|
- |
|
- |
|
- |
|
625 |
|
- |
|
625 |
|
- |
|
1997 |
|
03/27/2014 |
|
Restaurants – Limited Service |
|
Tampa |
|
FL |
|
(f) |
|
474 |
|
- |
|
- |
|
- |
|
474 |
|
- |
|
474 |
|
- |
|
1999 |
|
03/27/2014 |
|
Restaurants – Limited Service |
|
Warner Robins |
|
GA |
|
(f) |
|
373 |
|
- |
|
- |
|
- |
|
373 |
|
- |
|
373 |
|
- |
|
1996 |
|
03/27/2014 |
|
Machinery, Equipment, and Supplies Merchant Wholesalers |
|
Irving |
|
TX |
|
|
|
1,375 |
|
4,661 |
|
- |
|
- |
|
1,375 |
|
4,661 |
|
6,036 |
|
(105) |
|
1982 |
|
03/27/2014 |
|
Family Entertainment Centers |
|
Tempe |
|
AZ |
|
|
|
3,288 |
|
6,268 |
|
- |
|
- |
|
3,288 |
|
6,268 |
|
9,556 |
|
(167) |
|
2013 |
|
03/28/2014 |
F-14
|
Descriptions (a) |
|
|
|
Initial Cost to Company |
|
Costs Capitalized |
|
Gross amount at December 31, 2014 (b) (c) |
|
|
|
|
|
|
||||||||||||
|
Tenant Industry |
|
City |
|
St |
|
Encumbrances |
|
Land & |
|
Building & |
|
Land & |
|
Building & |
|
Land & |
|
Building & |
|
Total |
|
Accumulated |
|
Year |
|
Date |
|
Restaurants – Limited Service |
|
Los Fresnos |
|
TX |
|
|
|
250 |
|
772 |
|
14 |
|
86 |
|
264 |
|
858 |
|
1,122 |
|
(27) |
|
2014 |
|
03/28/2014 |
|
Health Clubs |
|
Antioch |
|
CA |
|
|
|
836 |
|
2,724 |
|
- |
|
- |
|
836 |
|
2,724 |
|
3,560 |
|
(72) |
|
1989 |
|
03/31/2014 |
|
Health Clubs |
|
Monterey |
|
CA |
|
|
|
868 |
|
2,694 |
|
- |
|
- |
|
868 |
|
2,694 |
|
3,562 |
|
(79) |
|
1978 |
|
03/31/2014 |
|
Offices of Physicians |
|
Boynton Beach |
|
FL |
|
|
|
301 |
|
4,727 |
|
- |
|
- |
|
301 |
|
4,727 |
|
5,028 |
|
(143) |
|
2005 |
|
03/31/2014 |
|
Offices of Physicians |
|
Jupiter |
|
FL |
|
|
|
158 |
|
4,457 |
|
- |
|
- |
|
158 |
|
4,457 |
|
4,615 |
|
(101) |
|
2011 |
|
03/31/2014 |
|
Offices of Physicians |
|
Wellington |
|
FL |
|
|
|
860 |
|
4,652 |
|
- |
|
- |
|
860 |
|
4,652 |
|
5,512 |
|
(119) |
|
2009 |
|
03/31/2014 |
|
Converted Paper Product Manufacturing |
|
Hattiesburg |
|
MS |
|
|
|
2,727 |
|
4,045 |
|
- |
|
- |
|
2,727 |
|
4,045 |
|
6,772 |
|
(117) |
|
1982 |
|
03/31/2014 |
|
Automotive Parts, Accessories, and Tire Stores |
|
Miami |
|
OK |
|
|
|
90 |
|
1,157 |
|
739 |
|
1,949 |
|
829 |
|
3,106 |
|
3,935 |
|
(59) |
|
1971 |
|
03/31/2014 |
|
Child Day Care Services |
|
Fort Mill |
|
SC |
|
|
|
707 |
|
3,271 |
|
- |
|
- |
|
707 |
|
3,271 |
|
3,978 |
|
(79) |
|
2007 |
|
03/31/2014 |
|
Other Wood Product Manufacturing |
|
Elgin |
|
IL |
|
|
|
1,374 |
|
714 |
|
- |
|
- |
|
1,374 |
|
714 |
|
2,088 |
|
(19) |
|
1996 |
|
04/09/2014 |
|
Other Miscellaneous Manufacturing |
|
Bozeman |
|
MT |
|
|
|
2,127 |
|
348 |
|
- |
|
- |
|
2,127 |
|
348 |
|
2,475 |
|
(19) |
|
1977 |
|
04/09/2014 |
|
Other Miscellaneous Manufacturing |
|
Nashville |
|
TN |
|
|
|
4,264 |
|
4,273 |
|
- |
|
- |
|
4,264 |
|
4,273 |
|
8,537 |
|
(178) |
|
1975 |
|
04/09/2014 |
|
Offices of Physicians |
|
Fort Pierce |
|
FL |
|
|
|
806 |
|
2,953 |
|
- |
|
- |
|
806 |
|
2,953 |
|
3,759 |
|
(111) |
|
2007 |
|
04/10/2014 |
|
Offices of Physicians |
|
Palm Beach Gardens |
|
FL |
|
|
|
43 |
|
1,337 |
|
- |
|
- |
|
43 |
|
1,337 |
|
1,380 |
|
(33) |
|
2005 |
|
04/10/2014 |
|
Offices of Physicians |
|
Palm Beach Gardens |
|
FL |
|
|
|
32 |
|
1,288 |
|
- |
|
- |
|
32 |
|
1,288 |
|
1,320 |
|
(36) |
|
2005 |
|
04/10/2014 |
|
Offices of Physicians |
|
Vero Beach |
|
FL |
|
|
|
233 |
|
2,529 |
|
- |
|
- |
|
233 |
|
2,529 |
|
2,762 |
|
(86) |
|
2009 |
|
04/10/2014 |
|
Offices of Physicians |
|
Wellington |
|
FL |
|
|
|
272 |
|
1,421 |
|
- |
|
- |
|
272 |
|
1,421 |
|
1,693 |
|
(22) |
|
2008 |
|
04/10/2014 |
|
Health Clubs |
|
Phoenix |
|
AZ |
|
|
|
- |
|
- |
|
- |
|
4,218 |
|
- |
|
4,218 |
|
4,218 |
|
- |
|
|
|
04/16/2014 |
|
Junior Colleges |
|
Youngstown |
|
OH |
|
|
|
471 |
|
5,075 |
|
- |
|
667 |
|
471 |
|
5,742 |
|
6,213 |
|
(114) |
|
1974 |
|
04/16/2014 |
|
Health Clubs |
|
Live Oak |
|
TX |
|
3,512 |
|
1,266 |
|
4,022 |
|
- |
|
- |
|
1,266 |
|
4,022 |
|
5,288 |
|
(77) |
|
2004 |
|
04/17/2014 |
|
Junior Colleges |
|
Middletown |
|
OH |
|
|
|
404 |
|
5,441 |
|
- |
|
375 |
|
404 |
|
5,816 |
|
6,220 |
|
(125) |
|
1969 |
|
04/23/2014 |
|
Child Day Care Services |
|
Gastonia |
|
NC |
|
|
|
184 |
|
1,212 |
|
- |
|
- |
|
184 |
|
1,212 |
|
1,396 |
|
(30) |
|
2003 |
|
04/25/2014 |
|
Machinery, Equipment, and Supplies Merchant Wholesalers |
|
Rapid City |
|
SD |
|
|
|
812 |
|
1,211 |
|
- |
|
- |
|
812 |
|
1,211 |
|
2,023 |
|
(36) |
|
1992 |
|
04/30/2014 |
|
Offices of Physicians |
|
Jupiter |
|
FL |
|
|
|
742 |
|
5,525 |
|
- |
|
- |
|
742 |
|
5,525 |
|
6,267 |
|
(114) |
|
2007 |
|
05/02/2014 |
|
Home Furnishings Stores |
|
Columbus |
|
OH |
|
|
|
753 |
|
1,047 |
|
- |
|
- |
|
753 |
|
1,047 |
|
1,800 |
|
(24) |
|
2014 |
|
05/07/2014 |
|
Forging and Stamping |
|
Pharr |
|
TX |
|
|
|
1,343 |
|
1,863 |
|
- |
|
- |
|
1,343 |
|
1,863 |
|
3,206 |
|
(49) |
|
1999 |
|
05/07/2014 |
|
Forging and Stamping |
|
Clearwater |
|
FL |
|
|
|
1,529 |
|
6,239 |
|
- |
|
- |
|
1,529 |
|
6,239 |
|
7,768 |
|
(155) |
|
1994 |
|
05/15/2014 |
|
Restaurants – Full Service |
|
Schaumburg |
|
IL |
|
|
|
2,063 |
|
- |
|
- |
|
2,664 |
|
2,063 |
|
2,664 |
|
4,727 |
|
- |
|
|
|
05/15/2014 |
|
Child Day Care Services |
|
Cincinnati |
|
OH |
|
(f) |
|
537 |
|
1,765 |
|
- |
|
- |
|
537 |
|
1,765 |
|
2,302 |
|
(35) |
|
2004 |
|
05/15/2014 |
|
Sporting Goods, Hobby, and Musical Instrument Stores |
|
Lake Worth |
|
TX |
|
|
|
2,009 |
|
- |
|
1,280 |
|
4,590 |
|
3,289 |
|
4,590 |
|
7,879 |
|
(29) |
|
2014 |
|
05/21/2014 |
|
Machinery, Equipment, and Supplies Merchant Wholesalers |
|
Tucson |
|
AZ |
|
|
|
1,107 |
|
932 |
|
- |
|
- |
|
1,107 |
|
932 |
|
2,039 |
|
(31) |
|
1980 |
|
05/22/2014 |
|
Consumer Goods Rental |
|
Florence |
|
AL |
|
|
|
492 |
|
634 |
|
- |
|
- |
|
492 |
|
634 |
|
1,126 |
|
(12) |
|
2004 |
|
05/23/2014 |
|
Other Professional, Scientific, and Technical Services |
|
Scottsdale |
|
AZ |
|
|
|
821 |
|
1,285 |
|
- |
|
- |
|
821 |
|
1,285 |
|
2,106 |
|
(28) |
|
2006 |
|
05/23/2014 |
|
Bakeries and Tortilla Manufacturing |
|
West Monroe |
|
LA |
|
|
|
902 |
|
3,827 |
|
- |
|
- |
|
902 |
|
3,827 |
|
4,729 |
|
(102) |
|
2004 |
|
05/23/2014 |
|
Consumer Goods Rental |
|
Lenoir |
|
NC |
|
|
|
548 |
|
578 |
|
- |
|
- |
|
548 |
|
578 |
|
1,126 |
|
(11) |
|
2005 |
|
05/23/2014 |
|
Other Professional, Scientific, and Technical Services |
|
Waxhaw |
|
NC |
|
|
|
570 |
|
934 |
|
- |
|
- |
|
570 |
|
934 |
|
1,504 |
|
(24) |
|
1968 |
|
05/23/2014 |
|
Consumer Goods Rental |
|
Lynchburg |
|
VA |
|
|
|
259 |
|
865 |
|
- |
|
- |
|
259 |
|
865 |
|
1,124 |
|
(14) |
|
1961 |
|
05/23/2014 |
|
Grocery Stores |
|
Lodi |
|
CA |
|
|
|
1,431 |
|
7,215 |
|
- |
|
- |
|
1,431 |
|
7,215 |
|
8,646 |
|
(123) |
|
2004 |
|
05/30/2014 |
|
Machinery, Equipment, and Supplies Merchant Wholesalers |
|
Henderson |
|
CO |
|
|
|
1,283 |
|
1,448 |
|
- |
|
- |
|
1,283 |
|
1,448 |
|
2,731 |
|
(47) |
|
1980 |
|
05/30/2014 |
|
Motion Picture and Video Industries |
|
Flower Mound |
|
TX |
|
|
|
1,860 |
|
442 |
|
- |
|
3,697 |
|
1,860 |
|
4,139 |
|
5,999 |
|
- |
|
|
|
05/30/2014 |
|
Other General Purpose Machinery Manufacturing |
|
Saltillo |
|
MS |
|
|
|
605 |
|
15,409 |
|
- |
|
- |
|
605 |
|
15,409 |
|
16,014 |
|
(314) |
|
1974 |
|
06/05/2014 |
|
Restaurants – Full Service |
|
Shawnee |
|
OK |
|
|
|
192 |
|
1,016 |
|
- |
|
- |
|
192 |
|
1,016 |
|
1,208 |
|
(19) |
|
1982 |
|
06/06/2014 |
|
Restaurants – Full Service |
|
San Antonio |
|
TX |
|
|
|
1,578 |
|
1,632 |
|
- |
|
- |
|
1,578 |
|
1,632 |
|
3,210 |
|
(29) |
|
2008 |
|
06/06/2014 |
F-15
|
Descriptions (a) |
|
|
|
Initial Cost to Company |
|
Costs Capitalized |
|
Gross amount at December 31, 2014 (b) (c) |
|
|
|
|
|
|
||||||||||||
|
Tenant Industry |
|
City |
|
St |
|
Encumbrances |
|
Land & |
|
Building & |
|
Land & |
|
Building & |
|
Land & |
|
Building & |
|
Total |
|
Accumulated |
|
Year |
|
Date |
|
Forging and Stamping |
|
Wickliffe |
|
OH |
|
|
|
617 |
|
2,725 |
|
- |
|
- |
|
617 |
|
2,725 |
|
3,342 |
|
(84) |
|
1958 |
|
06/12/2014 |
|
Other Support Services |
|
Mills River |
|
NC |
|
|
|
1,027 |
|
2,862 |
|
- |
|
2,139 |
|
1,027 |
|
5,001 |
|
6,028 |
|
(36) |
|
2001 |
|
06/16/2014 |
|
Child Day Care Services |
|
Columbus |
|
GA |
|
|
|
377 |
|
1,007 |
|
- |
|
- |
|
377 |
|
1,007 |
|
1,384 |
|
(16) |
|
2014 |
|
06/19/2014 |
|
Medical Equipment and Supplies Manufacturing |
|
Buford |
|
GA |
|
|
|
2,680 |
|
24,103 |
|
- |
|
- |
|
2,680 |
|
24,103 |
|
26,783 |
|
(323) |
|
1998 |
|
06/20/2014 |
|
Medical Equipment and Supplies Manufacturing |
|
Buford |
|
GA |
|
|
|
225 |
|
2,681 |
|
- |
|
- |
|
225 |
|
2,681 |
|
2,906 |
|
(47) |
|
1993 |
|
06/20/2014 |
|
Support Activities for Air Transportation |
|
East Alton |
|
IL |
|
|
|
1,710 |
|
7,126 |
|
- |
|
- |
|
1,710 |
|
7,126 |
|
8,836 |
|
(133) |
|
1988 |
|
06/20/2014 |
|
Medical Equipment and Supplies Manufacturing |
|
North Attleboro |
|
MA |
|
|
|
1,541 |
|
8,900 |
|
- |
|
- |
|
1,541 |
|
8,900 |
|
10,441 |
|
(127) |
|
1981 |
|
06/20/2014 |
|
Foundation, Structure, and Building Exterior Contractors |
|
Indian Trail |
|
NC |
|
|
|
526 |
|
311 |
|
- |
|
- |
|
526 |
|
311 |
|
837 |
|
(8) |
|
1968 |
|
06/20/2014 |
|
Foundation, Structure, and Building Exterior Contractors |
|
Amarillo |
|
TX |
|
|
|
269 |
|
457 |
|
- |
|
- |
|
269 |
|
457 |
|
726 |
|
(6) |
|
1954 |
|
06/20/2014 |
|
Foundation, Structure, and Building Exterior Contractors |
|
Humble |
|
TX |
|
|
|
269 |
|
467 |
|
- |
|
- |
|
269 |
|
467 |
|
736 |
|
(9) |
|
1982 |
|
06/20/2014 |
|
Foundation, Structure, and Building Exterior Contractors |
|
Milwaukee |
|
WI |
|
|
|
515 |
|
3,318 |
|
- |
|
- |
|
515 |
|
3,318 |
|
3,833 |
|
(61) |
|
1968 |
|
06/20/2014 |
|
Restaurants – Full Service |
|
Calumet City |
|
IL |
|
|
|
521 |
|
983 |
|
- |
|
- |
|
521 |
|
983 |
|
1,504 |
|
(20) |
|
1983 |
|
06/23/2014 |
|
Restaurants – Full Service |
|
Lansing |
|
IL |
|
|
|
406 |
|
877 |
|
- |
|
- |
|
406 |
|
877 |
|
1,283 |
|
(25) |
|
1973 |
|
06/23/2014 |
|
Outpatient Care Centers |
|
Ballwin |
|
MO |
|
|
|
696 |
|
1,814 |
|
- |
|
- |
|
696 |
|
1,814 |
|
2,510 |
|
(35) |
|
1977 |
|
06/23/2014 |
|
Iron and Steel Mills and Ferroalloy Manufacturing |
|
Peachtree Corners |
|
GA |
|
|
|
400 |
|
3,768 |
|
- |
|
- |
|
400 |
|
3,768 |
|
4,168 |
|
(98) |
|
1986 |
|
06/24/2014 |
|
Restaurants – Full Service |
|
Rockford |
|
IL |
|
|
|
239 |
|
409 |
|
- |
|
- |
|
239 |
|
409 |
|
648 |
|
(13) |
|
1993 |
|
06/24/2014 |
|
Restaurants – Full Service |
|
Beloit |
|
WI |
|
|
|
218 |
|
528 |
|
- |
|
- |
|
218 |
|
528 |
|
746 |
|
(16) |
|
1983 |
|
06/24/2014 |
|
Restaurants – Full Service |
|
Mauston |
|
WI |
|
|
|
226 |
|
432 |
|
- |
|
- |
|
226 |
|
432 |
|
658 |
|
(14) |
|
2000 |
|
06/24/2014 |
|
Restaurants – Full Service |
|
Monroe |
|
WI |
|
|
|
344 |
|
711 |
|
- |
|
- |
|
344 |
|
711 |
|
1,055 |
|
(18) |
|
1977 |
|
06/24/2014 |
|
Other Personal Services |
|
Lexington |
|
KY |
|
|
|
943 |
|
1,967 |
|
- |
|
- |
|
943 |
|
1,967 |
|
2,910 |
|
(31) |
|
2005 |
|
06/25/2014 |
|
Electrical Equipment Manufacturing |
|
Chattanooga |
|
TN |
|
|
|
1,419 |
|
5,648 |
|
- |
|
- |
|
1,419 |
|
5,648 |
|
7,067 |
|
(105) |
|
1960 |
|
06/25/2014 |
|
Psychiatric and Substance Abuse Hospitals |
|
Jacksonville |
|
FL |
|
|
|
310 |
|
- |
|
- |
|
2,710 |
|
310 |
|
2,710 |
|
3,020 |
|
- |
|
|
|
06/26/2014 |
|
Warehousing and Storage |
|
Perth Amboy |
|
NJ |
|
18,956 |
|
6,396 |
|
23,189 |
|
- |
|
- |
|
6,396 |
|
23,189 |
|
29,585 |
|
(428) |
|
1955 |
|
06/26/2014 |
|
Child Day Care Services |
|
Anderson Township |
|
OH |
|
(f) |
|
273 |
|
829 |
|
- |
|
- |
|
273 |
|
829 |
|
1,102 |
|
(18) |
|
1995 |
|
06/26/2014 |
|
Child Day Care Services |
|
Forney |
|
TX |
|
|
|
511 |
|
2,785 |
|
- |
|
- |
|
511 |
|
2,785 |
|
3,296 |
|
(36) |
|
2004 |
|
06/26/2014 |
|
Health Clubs |
|
Oakdale |
|
CA |
|
|
|
1,073 |
|
4,560 |
|
- |
|
- |
|
1,073 |
|
4,560 |
|
5,633 |
|
(87) |
|
1973 |
|
06/27/2014 |
|
Other Professional, Scientific, and Technical Services |
|
Orlando |
|
FL |
|
|
|
461 |
|
385 |
|
- |
|
- |
|
461 |
|
385 |
|
846 |
|
(9) |
|
1998 |
|
06/27/2014 |
|
Restaurants – Limited Service |
|
Saint Martinville |
|
LA |
|
(f) |
|
264 |
|
921 |
|
- |
|
- |
|
264 |
|
921 |
|
1,185 |
|
(26) |
|
1987 |
|
06/27/2014 |
|
Health Clubs |
|
Chanhassen |
|
MN |
|
|
|
511 |
|
2,168 |
|
- |
|
- |
|
511 |
|
2,168 |
|
2,679 |
|
(30) |
|
1999 |
|
06/27/2014 |
|
Health Clubs |
|
Maple Grove |
|
MN |
|
|
|
1,372 |
|
1,386 |
|
- |
|
- |
|
1,372 |
|
1,386 |
|
2,758 |
|
(43) |
|
2001 |
|
06/27/2014 |
|
Health Clubs |
|
Chapel Hill |
|
NC |
|
|
|
1,198 |
|
1,926 |
|
- |
|
21 |
|
1,198 |
|
1,947 |
|
3,145 |
|
(45) |
|
2005 |
|
06/30/2014 |
|
Health Clubs |
|
Hanahan |
|
SC |
|
|
|
412 |
|
722 |
|
- |
|
- |
|
412 |
|
722 |
|
1,134 |
|
(15) |
|
2008 |
|
06/30/2014 |
|
Health Clubs |
|
Mount Pleasant |
|
SC |
|
|
|
1,615 |
|
1,943 |
|
- |
|
111 |
|
1,615 |
|
2,054 |
|
3,669 |
|
(31) |
|
1985 |
|
06/30/2014 |
|
Health Clubs |
|
Mount Pleasant |
|
SC |
|
|
|
1,427 |
|
3,281 |
|
- |
|
60 |
|
1,427 |
|
3,341 |
|
4,768 |
|
(46) |
|
2004 |
|
06/30/2014 |
|
Health Clubs |
|
Mount Pleasant |
|
SC |
|
|
|
670 |
|
904 |
|
- |
|
- |
|
670 |
|
904 |
|
1,574 |
|
(18) |
|
1998 |
|
06/30/2014 |
|
Health Clubs |
|
North Charleston |
|
SC |
|
|
|
1,618 |
|
800 |
|
- |
|
226 |
|
1,618 |
|
1,026 |
|
2,644 |
|
(20) |
|
1986 |
|
06/30/2014 |
|
Child Day Care Services |
|
Colorado Springs |
|
CO |
|
|
|
855 |
|
1,851 |
|
- |
|
- |
|
855 |
|
1,851 |
|
2,706 |
|
(23) |
|
2008 |
|
07/24/2014 |
|
Child Day Care Services |
|
Loveland |
|
CO |
|
|
|
629 |
|
1,005 |
|
- |
|
- |
|
629 |
|
1,005 |
|
1,634 |
|
(17) |
|
2003 |
|
07/24/2014 |
|
Child Day Care Services |
|
Cartersville |
|
GA |
|
|
|
343 |
|
601 |
|
- |
|
4 |
|
343 |
|
605 |
|
948 |
|
(11) |
|
1997 |
|
07/24/2014 |
|
Child Day Care Services |
|
Kennesaw |
|
GA |
|
|
|
557 |
|
714 |
|
- |
|
3 |
|
557 |
|
717 |
|
1,274 |
|
(12) |
|
1997 |
|
07/24/2014 |
|
Child Day Care Services |
|
Norcross |
|
GA |
|
|
|
487 |
|
521 |
|
- |
|
- |
|
487 |
|
521 |
|
1,008 |
|
(9) |
|
1988 |
|
07/24/2014 |
F-16
|
Descriptions (a) |
|
|
|
Initial Cost to Company |
|
Costs Capitalized |
|
Gross amount at December 31, 2014 (b) (c) |
|
|
|
|
|
|
||||||||||||
|
Tenant Industry |
|
City |
|
St |
|
Encumbrances |
|
Land & |
|
Building & |
|
Land & |
|
Building & |
|
Land & |
|
Building & |
|
Total |
|
Accumulated |
|
Year |
|
Date |
|
Child Day Care Services |
|
Stockbridge |
|
GA |
|
|
|
426 |
|
891 |
|
- |
|
8 |
|
426 |
|
899 |
|
1,325 |
|
(15) |
|
1997 |
|
07/24/2014 |
|
Child Day Care Services |
|
Tucker |
|
GA |
|
|
|
450 |
|
585 |
|
- |
|
- |
|
450 |
|
585 |
|
1,035 |
|
(10) |
|
1994 |
|
07/24/2014 |
|
Child Day Care Services |
|
Woodstock |
|
GA |
|
|
|
537 |
|
299 |
|
- |
|
6 |
|
537 |
|
305 |
|
842 |
|
(6) |
|
1992 |
|
07/24/2014 |
|
Child Day Care Services |
|
Charlotte |
|
NC |
|
|
|
625 |
|
783 |
|
- |
|
- |
|
625 |
|
783 |
|
1,408 |
|
(14) |
|
2001 |
|
07/24/2014 |
|
Child Day Care Services |
|
Greensboro |
|
NC |
|
|
|
325 |
|
193 |
|
- |
|
- |
|
325 |
|
193 |
|
518 |
|
(4) |
|
1983 |
|
07/24/2014 |
|
Child Day Care Services |
|
Greensboro |
|
NC |
|
|
|
628 |
|
244 |
|
- |
|
6 |
|
628 |
|
250 |
|
878 |
|
(5) |
|
1968 |
|
07/24/2014 |
|
Child Day Care Services |
|
Greensboro |
|
NC |
|
|
|
330 |
|
360 |
|
- |
|
7 |
|
330 |
|
367 |
|
697 |
|
(6) |
|
1970 |
|
07/24/2014 |
|
Child Day Care Services |
|
Greensboro |
|
NC |
|
|
|
500 |
|
300 |
|
- |
|
- |
|
500 |
|
300 |
|
800 |
|
(6) |
|
1978 |
|
07/24/2014 |
|
Child Day Care Services |
|
Greensboro |
|
NC |
|
|
|
544 |
|
173 |
|
- |
|
2 |
|
544 |
|
175 |
|
719 |
|
(4) |
|
1981 |
|
07/24/2014 |
|
Child Day Care Services |
|
Winston Salem |
|
NC |
|
|
|
519 |
|
361 |
|
- |
|
5 |
|
519 |
|
366 |
|
885 |
|
(8) |
|
1969 |
|
07/24/2014 |
|
Child Day Care Services |
|
Winston Salem |
|
NC |
|
|
|
364 |
|
517 |
|
- |
|
- |
|
364 |
|
517 |
|
881 |
|
(9) |
|
1983 |
|
07/24/2014 |
|
Child Day Care Services |
|
Aiken |
|
SC |
|
|
|
164 |
|
508 |
|
- |
|
7 |
|
164 |
|
515 |
|
679 |
|
(9) |
|
1985 |
|
07/24/2014 |
|
Child Day Care Services |
|
Aiken |
|
SC |
|
|
|
281 |
|
563 |
|
- |
|
- |
|
281 |
|
563 |
|
844 |
|
(11) |
|
1992 |
|
07/24/2014 |
|
Child Day Care Services |
|
Duncan |
|
SC |
|
|
|
428 |
|
326 |
|
- |
|
13 |
|
428 |
|
339 |
|
767 |
|
(9) |
|
1997 |
|
07/24/2014 |
|
Child Day Care Services |
|
Florence |
|
SC |
|
|
|
147 |
|
489 |
|
- |
|
1 |
|
147 |
|
490 |
|
637 |
|
(8) |
|
1983 |
|
07/24/2014 |
|
Child Day Care Services |
|
Greenwood |
|
SC |
|
|
|
317 |
|
183 |
|
- |
|
- |
|
317 |
|
183 |
|
500 |
|
(4) |
|
1978 |
|
07/24/2014 |
|
Child Day Care Services |
|
Greenwood |
|
SC |
|
|
|
367 |
|
396 |
|
- |
|
8 |
|
367 |
|
404 |
|
771 |
|
(8) |
|
1984 |
|
07/24/2014 |
|
Child Day Care Services |
|
Greer |
|
SC |
|
|
|
125 |
|
633 |
|
- |
|
- |
|
125 |
|
633 |
|
758 |
|
(11) |
|
2002 |
|
07/24/2014 |
|
Child Day Care Services |
|
Mauldin |
|
SC |
|
|
|
296 |
|
231 |
|
- |
|
4 |
|
296 |
|
235 |
|
531 |
|
(5) |
|
1981 |
|
07/24/2014 |
|
Child Day Care Services |
|
North Augusta |
|
SC |
|
|
|
257 |
|
561 |
|
- |
|
2 |
|
257 |
|
563 |
|
820 |
|
(10) |
|
1983 |
|
07/24/2014 |
|
Child Day Care Services |
|
North Charleston |
|
SC |
|
|
|
272 |
|
300 |
|
- |
|
- |
|
272 |
|
300 |
|
572 |
|
(6) |
|
1987 |
|
07/24/2014 |
|
Child Day Care Services |
|
Spartanburg |
|
SC |
|
|
|
334 |
|
293 |
|
- |
|
- |
|
334 |
|
293 |
|
627 |
|
(6) |
|
1987 |
|
07/24/2014 |
|
Child Day Care Services |
|
Spartanburg |
|
SC |
|
|
|
185 |
|
560 |
|
- |
|
- |
|
185 |
|
560 |
|
745 |
|
(9) |
|
1973 |
|
07/24/2014 |
|
Child Day Care Services |
|
Summerville |
|
SC |
|
|
|
678 |
|
185 |
|
- |
|
3 |
|
678 |
|
188 |
|
866 |
|
(4) |
|
1984 |
|
07/24/2014 |
|
Child Day Care Services |
|
Frisco |
|
TX |
|
|
|
509 |
|
1,253 |
|
- |
|
19 |
|
509 |
|
1,272 |
|
1,781 |
|
(15) |
|
1996 |
|
07/24/2014 |
|
Child Day Care Services |
|
Little Elm |
|
TX |
|
|
|
454 |
|
1,018 |
|
- |
|
15 |
|
454 |
|
1,033 |
|
1,487 |
|
(16) |
|
1989 |
|
07/24/2014 |
|
Restaurants – Limited Service |
|
Torrington |
|
CT |
|
(f) |
|
401 |
|
495 |
|
- |
|
- |
|
401 |
|
495 |
|
896 |
|
(9) |
|
1993 |
|
07/29/2014 |
|
Restaurants – Limited Service |
|
Wethersfield |
|
CT |
|
(f) |
|
427 |
|
628 |
|
- |
|
- |
|
427 |
|
628 |
|
1,055 |
|
(11) |
|
2008 |
|
07/29/2014 |
|
Boiler, Tank, and Shipping Container Manufacturing |
|
Anderson |
|
SC |
|
|
|
369 |
|
1,015 |
|
- |
|
- |
|
369 |
|
1,015 |
|
1,384 |
|
(17) |
|
1994 |
|
07/29/2014 |
|
Sporting Goods, Hobby, and Musical Instrument Stores |
|
Rothschild |
|
WI |
|
|
|
2,440 |
|
10,171 |
|
- |
|
- |
|
2,440 |
|
10,171 |
|
12,611 |
|
(129) |
|
2003 |
|
07/29/2014 |
|
Drugs and Druggists' Sundries Merchant Wholesalers |
|
Knoxville |
|
TN |
|
|
|
1,421 |
|
7,109 |
|
- |
|
- |
|
1,421 |
|
7,109 |
|
8,530 |
|
(105) |
|
1983 |
|
07/30/2014 |
|
Electronics and Appliance Stores |
|
Phoenix |
|
AZ |
|
|
|
3,480 |
|
3,209 |
|
- |
|
- |
|
3,480 |
|
3,209 |
|
6,689 |
|
(43) |
|
1988 |
|
07/31/2014 |
|
Electronics and Appliance Stores |
|
Colorado Springs |
|
CO |
|
|
|
2,223 |
|
4,197 |
|
- |
|
- |
|
2,223 |
|
4,197 |
|
6,420 |
|
(12) |
|
1995 |
|
07/31/2014 |
|
Motion Picture and Video Industries |
|
Berlin |
|
CT |
|
|
|
2,937 |
|
6,719 |
|
- |
|
- |
|
2,937 |
|
6,719 |
|
9,656 |
|
(129) |
|
1990 |
|
07/31/2014 |
|
Lessors of Real Estate |
|
Sugar Hill |
|
GA |
|
|
|
1,658 |
|
4,507 |
|
- |
|
- |
|
1,658 |
|
4,507 |
|
6,165 |
|
(79) |
|
2013 |
|
07/31/2014 |
|
Motion Picture and Video Industries |
|
Springfield |
|
MO |
|
|
|
2,299 |
|
7,487 |
|
- |
|
- |
|
2,299 |
|
7,487 |
|
9,786 |
|
(90) |
|
1990 |
|
07/31/2014 |
|
Motion Picture and Video Industries |
|
Ridgefield Park |
|
NJ |
|
|
|
44 |
|
10,848 |
|
- |
|
- |
|
44 |
|
10,848 |
|
10,892 |
|
(152) |
|
1991 |
|
07/31/2014 |
|
Motion Picture and Video Industries |
|
Boerne |
|
TX |
|
|
|
4,186 |
|
3,413 |
|
- |
|
- |
|
4,186 |
|
3,413 |
|
7,599 |
|
(79) |
|
2013 |
|
07/31/2014 |
|
Lessors of Real Estate |
|
Corinth |
|
TX |
|
|
|
2,517 |
|
4,173 |
|
- |
|
- |
|
2,517 |
|
4,173 |
|
6,690 |
|
(72) |
|
2009 |
|
07/31/2014 |
|
Lessors of Real Estate |
|
Houston |
|
TX |
|
|
|
2,650 |
|
3,644 |
|
- |
|
- |
|
2,650 |
|
3,644 |
|
6,294 |
|
(66) |
|
2005 |
|
07/31/2014 |
|
Electronics and Appliance Stores |
|
Lubbock |
|
TX |
|
|
|
2,220 |
|
4,148 |
|
- |
|
- |
|
2,220 |
|
4,148 |
|
6,368 |
|
(46) |
|
2014 |
|
07/31/2014 |
|
Child Day Care Services |
|
Monroe |
|
NC |
|
|
|
753 |
|
1,560 |
|
- |
|
- |
|
753 |
|
1,560 |
|
2,313 |
|
(24) |
|
2000 |
|
08/08/2014 |
|
Furniture Stores |
|
Portland |
|
OR |
|
|
|
1,693 |
|
1,769 |
|
- |
|
236 |
|
1,693 |
|
2,005 |
|
3,698 |
|
(24) |
|
1997 |
|
08/08/2014 |
|
Child Day Care Services |
|
McDonough |
|
GA |
|
|
|
310 |
|
812 |
|
- |
|
- |
|
310 |
|
812 |
|
1,122 |
|
(12) |
|
1999 |
|
08/11/2014 |
|
Other Professional, Scientific, and Technical Services |
|
Tucson |
|
AZ |
|
|
|
1,200 |
|
5,810 |
|
- |
|
- |
|
1,200 |
|
5,810 |
|
7,010 |
|
(56) |
|
2004 |
|
08/21/2014 |
|
Other Professional, Scientific, and Technical Services |
|
Baltimore |
|
MD |
|
|
|
1,235 |
|
1,347 |
|
- |
|
- |
|
1,235 |
|
1,347 |
|
2,582 |
|
(23) |
|
1950 |
|
08/28/2014 |
|
Furniture Stores |
|
Memphis |
|
TN |
|
(f) |
|
1,367 |
|
3,771 |
|
- |
|
- |
|
1,367 |
|
3,771 |
|
5,138 |
|
(36) |
|
2005 |
|
09/02/2014 |
F-17
|
Descriptions (a) |
|
|
|
Initial Cost to Company |
|
Costs Capitalized |
|
Gross amount at December 31, 2014 (b) (c) |
|
|
|
|
|
|
||||||||||||
|
Tenant Industry |
|
City |
|
St |
|
Encumbrances |
|
Land & |
|
Building & |
|
Land & |
|
Building & |
|
Land & |
|
Building & |
|
Total |
|
Accumulated |
|
Year |
|
Date |
|
Child Day Care Services |
|
Huntersville |
|
NC |
|
|
|
1,118 |
|
1,719 |
|
- |
|
- |
|
1,118 |
|
1,719 |
|
2,837 |
|
(16) |
|
2006 |
|
09/05/2014 |
|
Consumer Goods Rental |
|
Immokalee |
|
FL |
|
(f) |
|
548 |
|
686 |
|
- |
|
- |
|
548 |
|
686 |
|
1,234 |
|
(7) |
|
1999 |
|
09/09/2014 |
|
Consumer Goods Rental |
|
Lewiston |
|
ID |
|
|
|
390 |
|
996 |
|
- |
|
- |
|
390 |
|
996 |
|
1,386 |
|
(14) |
|
2008 |
|
09/10/2014 |
|
Consumer Goods Rental |
|
Hardin |
|
MT |
|
|
|
45 |
|
513 |
|
- |
|
- |
|
45 |
|
513 |
|
558 |
|
(9) |
|
1920 |
|
09/10/2014 |
|
Consumer Goods Rental |
|
Moses Lake |
|
WA |
|
|
|
459 |
|
1,034 |
|
- |
|
- |
|
459 |
|
1,034 |
|
1,493 |
|
(15) |
|
2009 |
|
09/10/2014 |
|
Consumer Goods Rental |
|
Casper |
|
WY |
|
|
|
506 |
|
846 |
|
- |
|
- |
|
506 |
|
846 |
|
1,352 |
|
(12) |
|
2009 |
|
09/10/2014 |
|
Restaurants – Full Service |
|
Chicago |
|
IL |
|
|
|
25 |
|
2,769 |
|
- |
|
- |
|
25 |
|
2,769 |
|
2,794 |
|
(31) |
|
1926 |
|
09/15/2014 |
|
Consumer Goods Rental |
|
Puyallup |
|
WA |
|
(f) |
|
743 |
|
392 |
|
- |
|
- |
|
743 |
|
392 |
|
1,135 |
|
(7) |
|
1982 |
|
09/16/2014 |
|
Other Professional, Scientific, and Technical Services |
|
Albany |
|
GA |
|
|
|
176 |
|
438 |
|
- |
|
- |
|
176 |
|
438 |
|
614 |
|
(5) |
|
1974 |
|
09/17/2014 |
|
Health Clubs |
|
Southaven |
|
MS |
|
|
|
2,264 |
|
3,039 |
|
- |
|
- |
|
2,264 |
|
3,039 |
|
5,303 |
|
(35) |
|
1999 |
|
09/18/2014 |
|
Motion Picture and Video Industries |
|
Parker |
|
CO |
|
3,807 |
|
1,773 |
|
4,252 |
|
- |
|
- |
|
1,773 |
|
4,252 |
|
6,025 |
|
(41) |
|
2002 |
|
09/23/2014 |
|
Restaurants – Full Service |
|
Morristown |
|
TN |
|
|
|
552 |
|
958 |
|
- |
|
- |
|
552 |
|
958 |
|
1,510 |
|
(10) |
|
1987 |
|
09/23/2014 |
|
Other Ambulatory Health Care Services |
|
Birmingham |
|
AL |
|
|
|
316 |
|
1,628 |
|
- |
|
- |
|
316 |
|
1,628 |
|
1,944 |
|
(11) |
|
2008 |
|
09/24/2014 |
|
Other Ambulatory Health Care Services |
|
Glendale |
|
AZ |
|
|
|
357 |
|
3,099 |
|
- |
|
- |
|
357 |
|
3,099 |
|
3,456 |
|
(21) |
|
1982 |
|
09/24/2014 |
|
Other Ambulatory Health Care Services |
|
Glendale |
|
AZ |
|
|
|
283 |
|
1,510 |
|
- |
|
- |
|
283 |
|
1,510 |
|
1,793 |
|
(14) |
|
1985 |
|
09/24/2014 |
|
Other Ambulatory Health Care Services |
|
Council Bluffs |
|
IA |
|
|
|
946 |
|
2,010 |
|
- |
|
- |
|
946 |
|
2,010 |
|
2,956 |
|
(17) |
|
2009 |
|
09/24/2014 |
|
Other Ambulatory Health Care Services |
|
Rexburg |
|
ID |
|
|
|
139 |
|
1,204 |
|
- |
|
- |
|
139 |
|
1,204 |
|
1,343 |
|
(10) |
|
1976 |
|
09/24/2014 |
|
Sporting Goods, Hobby, and Musical Instrument Stores |
|
Forest Lake |
|
MN |
|
|
|
5,403 |
|
7,570 |
|
- |
|
- |
|
5,403 |
|
7,570 |
|
12,973 |
|
(69) |
|
2003 |
|
09/24/2014 |
|
Other Ambulatory Health Care Services |
|
Cleveland |
|
OH |
|
|
|
274 |
|
1,990 |
|
- |
|
- |
|
274 |
|
1,990 |
|
2,264 |
|
(15) |
|
2009 |
|
09/24/2014 |
|
Other Ambulatory Health Care Services |
|
Fort Worth |
|
TX |
|
|
|
1,584 |
|
2,053 |
|
- |
|
- |
|
1,584 |
|
2,053 |
|
3,637 |
|
(15) |
|
2009 |
|
09/24/2014 |
|
Other Ambulatory Health Care Services |
|
Salt Lake City |
|
UT |
|
|
|
543 |
|
649 |
|
- |
|
- |
|
543 |
|
649 |
|
1,192 |
|
(6) |
|
1972 |
|
09/24/2014 |
|
Restaurants – Full Service |
|
Fort Myers |
|
FL |
|
|
|
1,373 |
|
1,946 |
|
- |
|
- |
|
1,373 |
|
1,946 |
|
3,319 |
|
(18) |
|
1977 |
|
09/25/2014 |
|
Restaurants – Full Service |
|
Bangor |
|
ME |
|
|
|
506 |
|
547 |
|
- |
|
- |
|
506 |
|
547 |
|
1,053 |
|
(6) |
|
2006 |
|
09/29/2014 |
|
Restaurants – Full Service |
|
Ellsworth |
|
ME |
|
|
|
249 |
|
552 |
|
- |
|
- |
|
249 |
|
552 |
|
801 |
|
(8) |
|
1979 |
|
09/29/2014 |
|
Restaurants – Full Service |
|
Farmington |
|
ME |
|
|
|
365 |
|
648 |
|
- |
|
- |
|
365 |
|
648 |
|
1,013 |
|
(7) |
|
1993 |
|
09/29/2014 |
|
Restaurants – Full Service |
|
Presque Isle |
|
ME |
|
|
|
172 |
|
416 |
|
- |
|
- |
|
172 |
|
416 |
|
588 |
|
(7) |
|
1980 |
|
09/29/2014 |
|
Restaurants – Full Service |
|
Concord |
|
NH |
|
|
|
563 |
|
359 |
|
- |
|
- |
|
563 |
|
359 |
|
922 |
|
(6) |
|
1973 |
|
09/29/2014 |
|
Restaurants – Full Service |
|
Dover |
|
NH |
|
|
|
832 |
|
678 |
|
- |
|
- |
|
832 |
|
678 |
|
1,510 |
|
(10) |
|
1979 |
|
09/29/2014 |
|
Restaurants – Full Service |
|
Littleton |
|
NH |
|
|
|
418 |
|
362 |
|
- |
|
- |
|
418 |
|
362 |
|
780 |
|
(6) |
|
1981 |
|
09/29/2014 |
|
Restaurants – Full Service |
|
Nashua |
|
NH |
|
|
|
508 |
|
668 |
|
- |
|
- |
|
508 |
|
668 |
|
1,176 |
|
(7) |
|
2006 |
|
09/29/2014 |
|
Restaurants – Full Service |
|
Galloway |
|
NJ |
|
|
|
819 |
|
498 |
|
- |
|
- |
|
819 |
|
498 |
|
1,317 |
|
(7) |
|
1991 |
|
09/29/2014 |
|
Restaurants – Full Service |
|
Bennington |
|
VT |
|
|
|
480 |
|
482 |
|
- |
|
- |
|
480 |
|
482 |
|
962 |
|
(7) |
|
1998 |
|
09/29/2014 |
|
Restaurants – Full Service |
|
Rutland |
|
VT |
|
|
|
475 |
|
346 |
|
- |
|
- |
|
475 |
|
346 |
|
821 |
|
(5) |
|
1983 |
|
09/29/2014 |
|
Restaurants – Full Service |
|
Eden Prairie |
|
MN |
|
(f) |
|
1,252 |
|
2,873 |
|
- |
|
- |
|
1,252 |
|
2,873 |
|
4,125 |
|
(21) |
|
1994 |
|
09/30/2014 |
|
Machinery, Equipment, and Supplies Merchant Wholesalers |
|
Watertown |
|
SD |
|
|
|
2,425 |
|
7,933 |
|
- |
|
- |
|
2,425 |
|
7,933 |
|
10,358 |
|
(82) |
|
2014 |
|
09/30/2014 |
|
Building Material and Supplies Dealers |
|
Columbus |
|
OH |
|
|
|
1,475 |
|
3,704 |
|
- |
|
- |
|
1,475 |
|
3,704 |
|
5,179 |
|
(59) |
|
1994 |
|
10/03/2014 |
|
Junior Colleges |
|
Warren |
|
OH |
|
|
|
194 |
|
340 |
|
- |
|
896 |
|
194 |
|
1,236 |
|
1,430 |
|
(3) |
|
1968 |
|
10/03/2014 |
|
Outpatient Care Centers |
|
Bentonville |
|
AR |
|
|
|
872 |
|
664 |
|
- |
|
- |
|
872 |
|
664 |
|
1,536 |
|
(7) |
|
2014 |
|
10/22/2014 |
|
Health Clubs |
|
Carmichael |
|
CA |
|
|
|
1,301 |
|
3,840 |
|
- |
|
- |
|
1,301 |
|
3,840 |
|
5,141 |
|
(25) |
|
1977 |
|
10/31/2014 |
|
Restaurants – Full Service |
|
Indianapolis |
|
IN |
|
|
|
468 |
|
1,570 |
|
- |
|
- |
|
468 |
|
1,570 |
|
2,038 |
|
(10) |
|
1985 |
|
10/31/2014 |
|
Grantmaking and Giving Services |
|
Shawnee |
|
OK |
|
|
|
624 |
|
1,294 |
|
- |
|
- |
|
624 |
|
1,294 |
|
1,918 |
|
(8) |
|
2011 |
|
11/12/2014 |
|
Motion Picture and Video Industries |
|
LaVista |
|
NE |
|
|
|
807 |
|
251 |
|
- |
|
1,218 |
|
807 |
|
1,469 |
|
2,276 |
|
- |
|
|
|
11/14/2014 |
|
Child Day Care Services |
|
Collierville |
|
TN |
|
|
|
544 |
|
1,986 |
|
- |
|
- |
|
544 |
|
1,986 |
|
2,530 |
|
(12) |
|
1999 |
|
11/14/2014 |
|
Child Day Care Services |
|
Collierville |
|
TN |
|
|
|
579 |
|
1,316 |
|
- |
|
- |
|
579 |
|
1,316 |
|
1,895 |
|
(7) |
|
2009 |
|
11/14/2014 |
|
Furniture Stores |
|
Wichita Falls |
|
TX |
|
|
|
1,198 |
|
5,038 |
|
- |
|
- |
|
1,198 |
|
5,038 |
|
6,236 |
|
(12) |
|
2006 |
|
11/19/2014 |
|
Outpatient Care Centers |
|
Battle Creek |
|
MI |
|
|
|
593 |
|
777 |
|
- |
|
- |
|
593 |
|
777 |
|
1,370 |
|
(2) |
|
2014 |
|
11/20/2014 |
|
Child Day Care Services |
|
Stockbridge |
|
GA |
|
|
|
206 |
|
315 |
|
- |
|
213 |
|
206 |
|
528 |
|
734 |
|
(1) |
|
2006 |
|
11/21/2014 |
F-18
|
Descriptions (a) |
|
|
|
Initial Cost to Company |
|
Costs Capitalized |
|
Gross amount at December 31, 2014 (b) (c) |
|
|
|
|
|
|
||||||||||||
|
Tenant Industry |
|
City |
|
St |
|
Encumbrances |
|
Land & |
|
Building & |
|
Land & |
|
Building & |
|
Land & |
|
Building & |
|
Total |
|
Accumulated |
|
Year |
|
Date |
|
Paint, Coating, and Adhesive Manufacturing |
|
Grove City |
|
OH |
|
|
|
605 |
|
1,207 |
|
- |
|
154 |
|
605 |
|
1,361 |
|
1,966 |
|
(3) |
|
1979 |
|
11/25/2014 |
|
Paint, Coating, and Adhesive Manufacturing |
|
Fort Worth |
|
TX |
|
|
|
451 |
|
2,513 |
|
- |
|
- |
|
451 |
|
2,513 |
|
2,964 |
|
(7) |
|
1967 |
|
11/25/2014 |
|
Restaurants – Full Service |
|
Chicago |
|
IL |
|
|
|
666 |
|
2,275 |
|
- |
|
- |
|
666 |
|
2,275 |
|
2,941 |
|
(5) |
|
1898 |
|
11/26/2014 |
|
Restaurants – Full Service |
|
Chicago |
|
IL |
|
|
|
1,130 |
|
3,699 |
|
- |
|
- |
|
1,130 |
|
3,699 |
|
4,829 |
|
(8) |
|
1908 |
|
11/26/2014 |
|
Restaurants – Full Service |
|
Chicago |
|
IL |
|
|
|
1,697 |
|
3,360 |
|
- |
|
- |
|
1,697 |
|
3,360 |
|
5,057 |
|
(7) |
|
1892 |
|
11/26/2014 |
|
Motor Vehicle and Motor Vehicle Parts and Supplies Merchant Wholesalers |
|
Mechanicsburg |
|
PA |
|
(f) |
|
9,019 |
|
1,771 |
|
- |
|
- |
|
9,019 |
|
1,771 |
|
10,790 |
|
(19) |
|
1980 |
|
12/05/2014 |
|
Restaurants – Limited Service |
|
Bessemer |
|
AL |
|
|
|
517 |
|
830 |
|
- |
|
- |
|
517 |
|
830 |
|
1,347 |
|
(3) |
|
1994 |
|
12/10/2014 |
|
Restaurants – Limited Service |
|
Birmingham |
|
AL |
|
|
|
701 |
|
706 |
|
- |
|
- |
|
701 |
|
706 |
|
1,407 |
|
(3) |
|
1991 |
|
12/10/2014 |
|
Restaurants – Limited Service |
|
Birmingham |
|
AL |
|
|
|
726 |
|
752 |
|
- |
|
- |
|
726 |
|
752 |
|
1,478 |
|
(3) |
|
2002 |
|
12/10/2014 |
|
Restaurants – Limited Service |
|
Birmingham |
|
AL |
|
|
|
566 |
|
841 |
|
- |
|
- |
|
566 |
|
841 |
|
1,407 |
|
(3) |
|
1995 |
|
12/10/2014 |
|
Restaurants – Limited Service |
|
Birmingham |
|
AL |
|
|
|
265 |
|
633 |
|
- |
|
- |
|
265 |
|
633 |
|
898 |
|
(2) |
|
1980 |
|
12/10/2014 |
|
Restaurants – Limited Service |
|
Birmingham |
|
AL |
|
|
|
240 |
|
559 |
|
- |
|
- |
|
240 |
|
559 |
|
799 |
|
(2) |
|
1989 |
|
12/10/2014 |
|
Restaurants – Limited Service |
|
Birmingham |
|
AL |
|
|
|
334 |
|
764 |
|
- |
|
- |
|
334 |
|
764 |
|
1,098 |
|
(3) |
|
1989 |
|
12/10/2014 |
|
Restaurants – Limited Service |
|
Decatur |
|
AL |
|
|
|
235 |
|
1,012 |
|
- |
|
- |
|
235 |
|
1,012 |
|
1,247 |
|
(3) |
|
1996 |
|
12/10/2014 |
|
Restaurants – Limited Service |
|
Fairfield |
|
AL |
|
|
|
583 |
|
765 |
|
- |
|
- |
|
583 |
|
765 |
|
1,348 |
|
(3) |
|
1995 |
|
12/10/2014 |
|
Restaurants – Limited Service |
|
Forestdale |
|
AL |
|
|
|
559 |
|
769 |
|
- |
|
- |
|
559 |
|
769 |
|
1,328 |
|
(3) |
|
1991 |
|
12/10/2014 |
|
Restaurants – Limited Service |
|
Gardendale |
|
AL |
|
|
|
915 |
|
492 |
|
- |
|
- |
|
915 |
|
492 |
|
1,407 |
|
(2) |
|
1988 |
|
12/10/2014 |
|
Restaurants – Limited Service |
|
Hueytown |
|
AL |
|
|
|
886 |
|
282 |
|
- |
|
- |
|
886 |
|
282 |
|
1,168 |
|
(2) |
|
1988 |
|
12/10/2014 |
|
Restaurants – Limited Service |
|
Huntsville |
|
AL |
|
|
|
368 |
|
910 |
|
- |
|
- |
|
368 |
|
910 |
|
1,278 |
|
(3) |
|
1976 |
|
12/10/2014 |
|
Restaurants – Limited Service |
|
Huntsville |
|
AL |
|
|
|
404 |
|
873 |
|
- |
|
- |
|
404 |
|
873 |
|
1,277 |
|
(3) |
|
2004 |
|
12/10/2014 |
|
Restaurants – Limited Service |
|
Madison |
|
AL |
|
|
|
511 |
|
756 |
|
- |
|
- |
|
511 |
|
756 |
|
1,267 |
|
(3) |
|
1986 |
|
12/10/2014 |
|
Restaurants – Limited Service |
|
Madison |
|
AL |
|
|
|
468 |
|
1,009 |
|
- |
|
- |
|
468 |
|
1,009 |
|
1,477 |
|
(4) |
|
1999 |
|
12/10/2014 |
|
Restaurants – Limited Service |
|
Meridianville |
|
AL |
|
|
|
598 |
|
1,358 |
|
- |
|
- |
|
598 |
|
1,358 |
|
1,956 |
|
(5) |
|
2001 |
|
12/10/2014 |
|
Restaurants – Limited Service |
|
Scottsboro |
|
AL |
|
|
|
259 |
|
899 |
|
- |
|
- |
|
259 |
|
899 |
|
1,158 |
|
(3) |
|
1986 |
|
12/10/2014 |
|
Outpatient Care Centers |
|
San Tan Valley |
|
AZ |
|
|
|
539 |
|
294 |
|
- |
|
- |
|
539 |
|
294 |
|
833 |
|
- |
|
|
|
12/11/2014 |
|
Child Day Care Services |
|
Huntsville |
|
AL |
|
|
|
298 |
|
1,187 |
|
- |
|
- |
|
298 |
|
1,187 |
|
1,485 |
|
(4) |
|
1994 |
|
12/12/2014 |
|
Child Day Care Services |
|
Huntsville |
|
AL |
|
|
|
694 |
|
1,181 |
|
- |
|
- |
|
694 |
|
1,181 |
|
1,875 |
|
(4) |
|
2003 |
|
12/12/2014 |
|
Consumer Goods Rental |
|
Jacksonville |
|
FL |
|
(f) |
|
543 |
|
893 |
|
- |
|
- |
|
543 |
|
893 |
|
1,436 |
|
(3) |
|
2014 |
|
12/12/2014 |
|
Consumer Goods Rental |
|
Jacksonville |
|
FL |
|
(f) |
|
594 |
|
1,276 |
|
- |
|
- |
|
594 |
|
1,276 |
|
1,870 |
|
(4) |
|
2014 |
|
12/12/2014 |
|
Psychiatric and Substance Abuse Hospitals |
|
Las Vegas |
|
NV |
|
|
|
147 |
|
252 |
|
- |
|
- |
|
147 |
|
252 |
|
399 |
|
(1) |
|
2003 |
|
12/12/2014 |
|
Psychiatric and Substance Abuse Hospitals |
|
Las Vegas |
|
NV |
|
|
|
139 |
|
280 |
|
- |
|
- |
|
139 |
|
280 |
|
419 |
|
(1) |
|
1975 |
|
12/12/2014 |
|
Psychiatric and Substance Abuse Hospitals |
|
Las Vegas |
|
NV |
|
|
|
107 |
|
351 |
|
- |
|
- |
|
107 |
|
351 |
|
458 |
|
(1) |
|
1987 |
|
12/12/2014 |
|
Psychiatric and Substance Abuse Hospitals |
|
Las Vegas |
|
NV |
|
|
|
165 |
|
194 |
|
- |
|
- |
|
165 |
|
194 |
|
359 |
|
(1) |
|
1980 |
|
12/12/2014 |
|
Psychiatric and Substance Abuse Hospitals |
|
Las Vegas |
|
NV |
|
|
|
194 |
|
255 |
|
- |
|
- |
|
194 |
|
255 |
|
449 |
|
(1) |
|
1982 |
|
12/12/2014 |
|
Psychiatric and Substance Abuse Hospitals |
|
Las Vegas |
|
NV |
|
|
|
183 |
|
256 |
|
- |
|
- |
|
183 |
|
256 |
|
439 |
|
(1) |
|
1981 |
|
12/12/2014 |
|
Psychiatric and Substance Abuse Hospitals |
|
Las Vegas |
|
NV |
|
|
|
269 |
|
180 |
|
- |
|
- |
|
269 |
|
180 |
|
449 |
|
(1) |
|
1977 |
|
12/12/2014 |
|
Psychiatric and Substance Abuse Hospitals |
|
Las Vegas |
|
NV |
|
|
|
162 |
|
197 |
|
- |
|
- |
|
162 |
|
197 |
|
359 |
|
(1) |
|
1983 |
|
12/12/2014 |
|
Psychiatric and Substance Abuse Hospitals |
|
Las Vegas |
|
NV |
|
|
|
1,408 |
|
2,891 |
|
- |
|
- |
|
1,408 |
|
2,891 |
|
4,299 |
|
(9) |
|
1990 |
|
12/12/2014 |
F-19
|
Descriptions (a) |
|
|
|
Initial Cost to Company |
|
Costs Capitalized |
|
Gross amount at December 31, 2014 (b) (c) |
|
|
|
|
|
|
||||||||||||
|
Tenant Industry |
|
City |
|
St |
|
Encumbrances |
|
Land & |
|
Building & |
|
Land & |
|
Building & |
|
Land & |
|
Building & |
|
Total |
|
Accumulated |
|
Year |
|
Date |
|
Restaurants – Limited Service |
|
Boise |
|
ID |
|
|
|
670 |
|
- |
|
- |
|
- |
|
670 |
|
- |
|
670 |
|
- |
|
2000 |
|
12/15/2014 |
|
Restaurants – Limited Service |
|
Boise |
|
ID |
|
|
|
610 |
|
- |
|
- |
|
- |
|
610 |
|
- |
|
610 |
|
- |
|
2003 |
|
12/15/2014 |
|
Restaurants – Limited Service |
|
Emmett |
|
ID |
|
|
|
350 |
|
- |
|
- |
|
- |
|
350 |
|
- |
|
350 |
|
- |
|
2006 |
|
12/15/2014 |
|
Restaurants – Limited Service |
|
Garden City |
|
ID |
|
|
|
410 |
|
- |
|
- |
|
- |
|
410 |
|
- |
|
410 |
|
- |
|
2005 |
|
12/15/2014 |
|
Restaurants – Limited Service |
|
Meridian |
|
ID |
|
|
|
490 |
|
- |
|
- |
|
- |
|
490 |
|
- |
|
490 |
|
- |
|
2003 |
|
12/15/2014 |
|
Restaurants – Limited Service |
|
Nampa |
|
ID |
|
|
|
480 |
|
- |
|
- |
|
- |
|
480 |
|
- |
|
480 |
|
- |
|
2006 |
|
12/15/2014 |
|
Restaurants – Limited Service |
|
Nampa |
|
ID |
|
|
|
410 |
|
- |
|
- |
|
- |
|
410 |
|
- |
|
410 |
|
- |
|
2006 |
|
12/15/2014 |
|
Restaurants – Full Service |
|
Chicago |
|
IL |
|
|
|
2,298 |
|
2,425 |
|
- |
|
- |
|
2,298 |
|
2,425 |
|
4,723 |
|
(5) |
|
1911 |
|
12/15/2014 |
|
Resin, Synthetic Rubber, and Artificial Synthetic Fibers and Filaments Manufacturing |
|
Greenfield |
|
MA |
|
|
|
655 |
|
5,499 |
|
- |
|
- |
|
655 |
|
5,499 |
|
6,154 |
|
- |
|
1999 |
|
12/16/2014 |
|
Resin, Synthetic Rubber, and Artificial Synthetic Fibers and Filaments Manufacturing |
|
Greenfield |
|
MA |
|
|
|
300 |
|
1,831 |
|
- |
|
- |
|
300 |
|
1,831 |
|
2,131 |
|
- |
|
1989 |
|
12/16/2014 |
|
Resin, Synthetic Rubber, and Artificial Synthetic Fibers and Filaments Manufacturing |
|
Greenfield |
|
MA |
|
|
|
195 |
|
1,406 |
|
- |
|
- |
|
195 |
|
1,406 |
|
1,601 |
|
- |
|
1986 |
|
12/16/2014 |
|
Health and Personal Care Stores |
|
Elizabethtown |
|
NY |
|
|
|
89 |
|
2,305 |
|
- |
|
- |
|
89 |
|
2,305 |
|
2,394 |
|
- |
|
1972 |
|
12/16/2014 |
|
Health and Personal Care Stores |
|
Syracuse |
|
NY |
|
|
|
357 |
|
1,610 |
|
- |
|
- |
|
357 |
|
1,610 |
|
1,967 |
|
- |
|
1986 |
|
12/16/2014 |
|
Foundation, Structure, and Building Exterior Contractors |
|
Chandler |
|
AZ |
|
|
|
1,884 |
|
6,218 |
|
- |
|
- |
|
1,884 |
|
6,218 |
|
8,102 |
|
- |
|
2010 |
|
12/17/2014 |
|
Outpatient Care Centers |
|
Jackson |
|
MI |
|
|
|
490 |
|
1,290 |
|
- |
|
- |
|
490 |
|
1,290 |
|
1,780 |
|
- |
|
2014 |
|
12/18/2014 |
|
Restaurants – Full Service |
|
Woodbury |
|
MN |
|
|
|
2,758 |
|
2,275 |
|
- |
|
- |
|
2,758 |
|
2,275 |
|
5,033 |
|
- |
|
2008 |
|
12/18/2014 |
|
Restaurants – Full Service |
|
Portage |
|
IN |
|
|
|
1,406 |
|
2,351 |
|
- |
|
- |
|
1,406 |
|
2,351 |
|
3,757 |
|
- |
|
2007 |
|
12/19/2014 |
|
Motion Picture and Video Industries |
|
Nicholasville |
|
KY |
|
|
|
4,505 |
|
3,506 |
|
- |
|
- |
|
4,505 |
|
3,506 |
|
8,011 |
|
- |
|
2005 |
|
12/19/2014 |
|
Restaurants – Full Service |
|
Bakersfield |
|
CA |
|
|
|
923 |
|
3,686 |
|
- |
|
- |
|
923 |
|
3,686 |
|
4,609 |
|
- |
|
1986 |
|
12/22/2014 |
|
Restaurants – Full Service |
|
Albemarle |
|
NC |
|
|
|
419 |
|
482 |
|
- |
|
- |
|
419 |
|
482 |
|
901 |
|
- |
|
1998 |
|
12/22/2014 |
|
Restaurants – Full Service |
|
Lenior |
|
NC |
|
|
|
537 |
|
454 |
|
- |
|
- |
|
537 |
|
454 |
|
991 |
|
- |
|
1997 |
|
12/22/2014 |
|
Restaurants – Full Service |
|
Mt. Airy |
|
NC |
|
|
|
331 |
|
450 |
|
- |
|
- |
|
331 |
|
450 |
|
781 |
|
- |
|
1996 |
|
12/22/2014 |
|
Restaurants – Full Service |
|
Sanford |
|
NC |
|
|
|
323 |
|
479 |
|
- |
|
- |
|
323 |
|
479 |
|
802 |
|
- |
|
1997 |
|
12/22/2014 |
|
Restaurants – Full Service |
|
Winston-Salem |
|
NC |
|
|
|
281 |
|
430 |
|
- |
|
- |
|
281 |
|
430 |
|
711 |
|
- |
|
1995 |
|
12/22/2014 |
|
Grocery Stores |
|
Hot Springs Village |
|
AR |
|
|
|
362 |
|
1,299 |
|
- |
|
- |
|
362 |
|
1,299 |
|
1,661 |
|
- |
|
1991 |
|
12/23/2014 |
|
Grocery Stores |
|
Redfield |
|
AR |
|
|
|
415 |
|
333 |
|
- |
|
- |
|
415 |
|
333 |
|
748 |
|
- |
|
1999 |
|
12/23/2014 |
|
Child Day Care Services |
|
Bremen |
|
GA |
|
|
|
550 |
|
488 |
|
- |
|
- |
|
550 |
|
488 |
|
1,038 |
|
- |
|
2005 |
|
12/23/2014 |
|
Child Day Care Services |
|
McDonough |
|
GA |
|
|
|
1,826 |
|
748 |
|
- |
|
- |
|
1,826 |
|
748 |
|
2,574 |
|
- |
|
2006 |
|
12/23/2014 |
|
Child Day Care Services |
|
Villa Rica |
|
GA |
|
|
|
665 |
|
792 |
|
- |
|
- |
|
665 |
|
792 |
|
1,457 |
|
- |
|
2004 |
|
12/23/2014 |
|
Child Day Care Services |
|
Villa Rica |
|
GA |
|
|
|
855 |
|
783 |
|
- |
|
- |
|
855 |
|
783 |
|
1,638 |
|
- |
|
1999 |
|
12/23/2014 |
|
Child Day Care Services |
|
Elkin |
|
NC |
|
|
|
278 |
|
768 |
|
- |
|
- |
|
278 |
|
768 |
|
1,046 |
|
- |
|
1995 |
|
12/23/2014 |
|
Child Day Care Services |
|
Greensboro |
|
NC |
|
|
|
725 |
|
421 |
|
- |
|
- |
|
725 |
|
421 |
|
1,146 |
|
- |
|
1994 |
|
12/23/2014 |
|
Child Day Care Services |
|
High Point |
|
NC |
|
|
|
462 |
|
733 |
|
- |
|
- |
|
462 |
|
733 |
|
1,195 |
|
- |
|
1996 |
|
12/23/2014 |
|
Child Day Care Services |
|
King |
|
NC |
|
|
|
313 |
|
882 |
|
- |
|
- |
|
313 |
|
882 |
|
1,195 |
|
- |
|
2008 |
|
12/23/2014 |
|
Child Day Care Services |
|
Mount Airy |
|
NC |
|
|
|
176 |
|
820 |
|
- |
|
- |
|
176 |
|
820 |
|
996 |
|
- |
|
1999 |
|
12/23/2014 |
|
Child Day Care Services |
|
Mount Airy |
|
NC |
|
|
|
260 |
|
737 |
|
- |
|
- |
|
260 |
|
737 |
|
997 |
|
- |
|
2006 |
|
12/23/2014 |
|
Child Day Care Services |
|
Mount Airy |
|
NC |
|
|
|
207 |
|
739 |
|
- |
|
- |
|
207 |
|
739 |
|
946 |
|
- |
|
1995 |
|
12/23/2014 |
|
Other Miscellaneous Manufacturing |
|
Utica |
|
NY |
|
|
|
102 |
|
988 |
|
- |
|
- |
|
102 |
|
988 |
|
1,090 |
|
- |
|
1965 |
|
12/23/2014 |
|
Sporting Goods, Hobby, and Musical Instrument Stores |
|
North Canton |
|
OH |
|
|
|
1,574 |
|
6,043 |
|
- |
|
- |
|
1,574 |
|
6,043 |
|
7,617 |
|
- |
|
1989 |
|
12/23/2014 |
|
Sporting Goods, Hobby, and Musical Instrument Stores |
|
Springfield |
|
OH |
|
|
|
1,983 |
|
2,437 |
|
- |
|
- |
|
1,983 |
|
2,437 |
|
4,420 |
|
- |
|
1984 |
|
12/23/2014 |
|
Other Miscellaneous Manufacturing |
|
Warrensville Heights |
|
OH |
|
|
|
842 |
|
767 |
|
- |
|
- |
|
842 |
|
767 |
|
1,609 |
|
- |
|
1982 |
|
12/23/2014 |
|
Sporting Goods, Hobby, and Musical Instrument Stores |
|
Monroeville |
|
PA |
|
|
|
1,621 |
|
6,552 |
|
- |
|
- |
|
1,621 |
|
6,552 |
|
8,173 |
|
- |
|
1977 |
|
12/23/2014 |
F-20
|
Descriptions (a) |
|
|
|
Initial Cost to Company |
|
Costs Capitalized |
|
Gross amount at December 31, 2014 (b) (c) |
|
|
|
|
|
|
||||||||||||
|
Tenant Industry |
|
City |
|
St |
|
Encumbrances |
|
Land & |
|
Building & |
|
Land & |
|
Building & |
|
Land & |
|
Building & |
|
Total |
|
Accumulated |
|
Year |
|
Date |
|
Other Miscellaneous Manufacturing |
|
Cookeville |
|
TN |
|
|
|
797 |
|
3,689 |
|
- |
|
- |
|
797 |
|
3,689 |
|
4,486 |
|
- |
|
1973 |
|
12/23/2014 |
|
Resin, Synthetic Rubber, and Artificial Synthetic Fibers and Filaments Manufacturing |
|
Paris |
|
IL |
|
|
|
2,022 |
|
4,907 |
|
- |
|
- |
|
2,022 |
|
4,907 |
|
6,929 |
|
- |
|
1993 |
|
12/29/2014 |
|
Resin, Synthetic Rubber, and Artificial Synthetic Fibers and Filaments Manufacturing |
|
Hazelton |
|
PA |
|
|
|
1,400 |
|
6,260 |
|
- |
|
- |
|
1,400 |
|
6,260 |
|
7,660 |
|
- |
|
1998 |
|
12/29/2014 |
|
Resin, Synthetic Rubber, and Artificial Synthetic Fibers and Filaments Manufacturing |
|
Manchester |
|
PA |
|
|
|
1,489 |
|
5,911 |
|
- |
|
- |
|
1,489 |
|
5,911 |
|
7,400 |
|
- |
|
1985 |
|
12/29/2014 |
|
Colleges, Universities, and Professional Schools |
|
Austin |
|
TX |
|
|
|
1,721 |
|
7,175 |
|
- |
|
- |
|
1,721 |
|
7,175 |
|
8,896 |
|
- |
|
2012 |
|
12/29/2014 |
|
Freight Transportation Arrangement |
|
Cartersville |
|
GA |
|
|
|
1,119 |
|
6,093 |
|
- |
|
- |
|
1,119 |
|
6,093 |
|
7,212 |
|
- |
|
2000 |
|
12/31/2014 |
|
Other Professional, Scientific, and Technical Services |
|
Elmwood Park |
|
IL |
|
|
|
258 |
|
1,027 |
|
- |
|
- |
|
258 |
|
1,027 |
|
1,285 |
|
- |
|
1960 |
|
12/31/2014 |
|
Freight Transportation Arrangement |
|
Spartanburg |
|
SC |
|
|
|
1,601 |
|
8,716 |
|
- |
|
- |
|
1,601 |
|
8,716 |
|
10,317 |
|
- |
|
1997 |
|
12/31/2014 |
|
|
|
|
|
|
|
|
|
|
|
|
|
|
|
|
|
|
|
|
|
|
|
|
|
|
|
|
|
|
|
|
|
|
|
$ 197,822
|
|
$ 828,988
|
|
$ 1,705,467
|
|
$ 14,855
|
|
$ 85,063
|
|
$ 843,843
|
|
$ 1,790,530
|
|
$ 2,634,373
|
|
$ (92,665)
|
|
|
|
|
|
(a) |
As of December 31, 2014, we had investments in 943 single-tenant real estate property locations including 937 owned properties and six ground lease interests; eleven of our owned properties are accounted for as direct financing receivables and are excluded from the table above. Initial costs exclude intangible lease assets totaling $60.2 million. |
|
(b) |
The aggregate cost for federal income tax purposes is approximately $2,690.5 million. |
|
(c) |
The following is a reconciliation of total real estate carrying value for the years ended December 31, 2014, 2013 and 2012: |
|
|
|
Year Ended December 31, |
|
|||||||
|
|
|
2014 |
|
2013 |
|
2012 |
|
|||
|
|
|
|
|
|
|
|
|
|||
|
Balance, beginning of year |
|
$ |
1,604,329 |
|
$ |
862,419 |
|
$ |
228,987 |
|
|
Additions |
|
|
|
|
|
|
|
|
|
|
|
Acquisitions |
|
|
984,839 |
|
|
762,664 |
|
|
635,187 |
|
|
Improvements |
|
|
70,710 |
|
|
25,848 |
|
|
3,393 |
|
|
Deductions |
|
|
|
|
|
|
|
|
|
|
|
Cost of real estate sold |
|
|
(25,505) |
|
|
(37,751) |
|
|
(5,148) |
|
|
Reclasses to held for sale |
|
|
- |
|
|
(8,851) |
|
|
|
|
|
Balance, end of year |
|
$ |
2,634,373 |
|
$ |
1,604,329 |
|
$ |
862,419 |
|
|
(d) |
The following is a reconciliation of accumulated depreciation for the years ended December 31, 2014, 2013 and 2012: |
|
|
|
Year Ended December 31, |
|
|||||||
|
|
|
2014 |
|
2013 |
|
2012 |
|
|||
|
|
|
|
|
|
|
|
|
|||
|
Balance, beginning of year |
|
$ |
(40,578) |
|
$ |
(11,811) |
|
$ |
(979) |
|
|
Additions |
|
|
|
|
|
|
|
|
|
|
|
Depreciation expense |
|
|
(52,763) |
|
|
(29,453) |
|
|
(10,851) |
|
|
Deductions |
|
|
|
|
|
|
|
|
|
|
|
Accumulated depreciation associated with real estate sold |
|
|
676 |
|
|
380 |
|
|
19 |
|
|
Reclasses to held for sale |
|
|
|
|
|
306 |
|
|
|
|
|
Balance, end of year |
|
$ |
(92,665) |
|
$ |
(40,578) |
|
$ |
(11,811) |
|
|
(e) |
The Company's real estate assets are depreciated using the straight-line method over the estimated useful lives of the properties, which generally ranges from 30 to 40 years for buildings and improvements and is 15 years for land improvements. |
|
(f) |
Property is collateral for non-recourse debt obligations totaling $1.1 billion of STORE Master Funding I, LLC; STORE Master Funding II, LLC; STORE Master Funding III, LLC; STORE Master Funding IV, LLC and STORE Master Funding V, LLC, all consolidated special purpose subsidiaries |
F-21
STORE Capital Corporation
Schedule IV - Mortgage Loans on Real Estate
As of December 31, 2014
(Dollars in thousands)
|
|
|
|
|
|
|
|
|
|
|
|
|
|
|
|
|
|
|
|
|
|
|
|
Final |
|
|
|
|
|
|
|
Outstanding |
|
Carrying |
|
||
|
|
|
|
|
Maturity |
|
Periodic Payment |
|
|
|
|
|
face amount of |
|
amount of |
|
||
|
Description |
|
Interest Rate |
|
Date |
|
Terms |
|
Final Payment Terms |
|
Prior Liens |
|
mortgages |
|
mortgages (i) |
|
||
|
|
|
|
|
|
|
|
|
|
|
|
|
|
|
|
|
|
|
|
Service(a) |
|
8.50 |
% |
1/31/2015 |
|
Interest only |
|
Balloon of $4.3 million |
|
None |
|
$ |
4,300 |
|
$ |
4,302 |
|
|
Restaurant(b) |
|
9.09 |
% |
1/1/2017 |
|
Interest only |
|
Balloon of $1.9 million |
|
None |
|
|
1,933 |
|
|
1,941 |
|
|
Retail(c) |
|
8.35 |
% |
1/1/2028 |
|
Principal & Interest |
|
Balloon of $3.5 million |
|
None |
|
|
3,775 |
|
|
3,864 |
|
|
Restaurant(d) |
|
8.75 |
% |
7/1/2032 |
|
Principal & Interest |
|
Balloon of $20.4 million |
|
None |
|
|
23,998 |
|
|
24,292 |
|
|
Service(e) |
|
9.00 |
% |
3/31/2053 |
|
Principal & Interest |
|
Fully amortizing |
|
None |
|
|
14,595 |
|
|
14,605 |
|
|
Service(f) |
|
8.75 |
% |
6/30/2053 |
|
Principal & Interest |
|
Fully amortizing |
|
None |
|
|
6,357 |
|
|
6,369 |
|
|
Retail(g) |
|
8.50 |
% |
6/30/2053 |
|
Principal & Interest |
|
Fully amortizing |
|
None |
|
|
6,697 |
|
|
6,711 |
|
|
Restaurant(h) |
|
8.25 |
% |
8/31/2053 |
|
Principal & Interest |
|
Fully amortizing |
|
None |
|
|
3,337 |
|
|
3,348 |
|
|
|
|
|
|
|
|
|
|
|
|
|
|
$ |
64,992 |
|
$ |
65,432 |
|
The following shows changes in the carrying amounts of mortgage loans receivable during the period (in thousands):
|
|
|
|
|
|
|
|
|
|
|
|
|
|
|
Year ended December 31, |
|
|||||||
|
|
|
2014 |
|
2013 |
|
2012 |
|
|||
|
Balance, beginning of period |
|
$ |
60,917 |
|
$ |
36,345 |
|
$ |
- |
|
|
Additions: |
|
|
|
|
|
|
|
|
|
|
|
New mortgage loans |
|
|
6,689 |
|
|
32,598 |
|
|
35,895 |
|
|
Other capitalized loan origination costs |
|
|
34 |
|
|
49 |
|
|
482 |
|
|
Deductions: |
|
|
|
|
|
|
|
|
|
|
|
Collections of principal (j) |
|
|
(2,159) |
|
|
(8,008) |
|
|
(23) |
|
|
Amortization of loan origination costs |
|
|
(49) |
|
|
(67) |
|
|
(9) |
|
|
Balance, end of period |
|
$ |
65,432 |
|
$ |
60,917 |
|
$ |
36,345 |
|
|
(a) |
The mortgage loan is secured by buildings and improvements to one property located in Kentucky. |
|
(b) |
The mortgage loan is secured by buildings and improvements to three properties located in North Carolina and South Carolina. |
|
(c) |
The mortgage loan is secured by buildings and improvements to two properties located in Pennsylvania. |
|
(d) |
The mortgage loan is secured by buildings and improvements to 29 properties located in Florida, Illinois, Louisiana and Mississippi. |
|
(e) |
The mortgage loan is secured by buildings and improvements to one property located in Kansas. |
|
(f) |
The mortgage loan is secured by buildings and improvements to two properties located in Alabama and Georgia. |
|
(g) |
The mortgage loan is secured by buildings and improvements to two properties located in Indiana. |
|
(h) |
The mortgage loan is secured by buildings and improvements to five properties located in Tennessee. |
|
(i) |
The aggregate cost for federal income tax purposes is $65.4 million. |
|
(j) |
One mortgage loan was repaid in full during 2014 through a non-cash transaction in which the Company purchased the two underlying mortgaged properties and leased them back to the borrower. Similarly, during 2013, one mortgage loan receivable was repaid in full through a $7.9 million non-cash transaction in which the Company acquired the underlying mortgaged property and leased it back to the borrower. |
F-22