Attached files
| file | filename |
|---|---|
| 8-K - FORM 8-K - Trinseo S.A. | d910538d8k.htm |
| EX-99.2 - EX-99.2 - Trinseo S.A. | d910538dex992.htm |
Exhibit 99.1
Recent Developments
Name Change & Rebranding
In the first quarter of 2015, we completed a rebranding process to change our operating name and legal entities from “Styron” to “Trinseo.” We believe that this new name reflects our breadth as a company with broad global reach and a diverse portfolio of materials and technologies. We believe TRINSEOTM captures our commitment to deliver innovative and sustainable materials that provide value to our customers’ products.
First Quarter 2015 Financial Results Estimate
Our regular quarterly financial reporting closing process is currently underway and we plan to report our first quarter 2015 financial results no later than May 15, 2015. We have provided below estimated ranges of certain financial metrics regarding the results of our quarterly period ended March 31, 2015. The quarterly financial estimates as of and for the three months ended March 31, 2015 are based on our preliminary unaudited results as of, and for, such period. The information is derived from preliminary financial reports which management believes are reasonable and as a result is subject to change in connection with the completion of our normal quarterly closing procedures and such changes could be material.
| Three Months Ended | ||||||||||||
| (in millions) |
March 31, | December 31, | ||||||||||
| 2015 (preliminary estimate) |
2014 | 2014 | ||||||||||
| Net sales |
$ | 1,000—1,040 | $ | 1,359 | $ | 1,122 | ||||||
| Adjusted EBITDA |
103—113 | 88 | 32 | |||||||||
| Adjusted EBITDA, excluding inventory revaluation |
145—155 | 83 | 104 | |||||||||
We estimate first quarter 2015 net sales of $1,000 million to $1,040 million. The midpoint of this range represents a 25% decrease from the first quarter of 2014 driven by the pass through of lower raw material costs as well as the weakening of the euro relative to the U.S. dollar. These impacts were partially offset by higher sales volumes across all of our reporting segments. The midpoint of this range represents a 9% decrease from the fourth quarter of 2014 due to the pass through of raw material costs and the weakening of the euro relative to the U.S. dollar. This was offset by higher sales volumes across all of our reporting segments due primarily to customer restocking in styrenic polymers as well as typical seasonal strength. We estimate first quarter 2015 sales volumes of 1,390 million pounds to 1,430 million pounds, which, at the midpoint, was 5% higher than the prior year.
We estimate first quarter 2015 Adjusted EBITDA of $103 million to $113 million, and Adjusted EBITDA excluding inventory revaluation of $145 million to $155 million. Excluding inventory revaluation, the midpoint of the range was $67 million higher than the first quarter of 2014, driven by higher margins in our Basic Plastics & Feedstocks division and our Performance Plastics segment. Improvement in our Basic Plastics & Feedstocks division was aided by the impact of our polycarbonate restructuring and improved market conditions, as well as by improvement in styrenic polymers and styrene monomer, including improved results from our 50%-owned joint venture, Americas Styrenics. In addition, our Performance Plastics segment margins were higher than the first quarter of 2014 due to declining raw material costs during the period. These positive effects were offset by an approximate $10 million impact from the weakened euro relative to the U.S. dollar as compared to the first quarter of 2014.
The midpoint of our Adjusted EBITDA excluding inventory revaluation range represented an increase of approximately $46 million compared to the fourth quarter of 2014. This was driven by high margins during the quarter in styrenic polymers and Performance Plastics as a result of significant declines in raw material costs which exceeded declines in the prices of our products as
compared to the fourth quarter of 2014. This was aided by the fact that customers were restocking during the quarter, after destocking in the latter half of 2014, as well as seasonally strong sales volumes in the first quarter of 2015 versus the fourth quarter of 2014. Earnings from our joint ventures were also high as compared to the fourth quarter of 2014 due to similar dynamics. We also benefited from our polycarbonate restructuring, as well as an overall stronger polycarbonate market. These positive results were offset by the impact of the weakened euro, which negatively impacted our Adjusted EBITDA and our Adjusted EBITDA excluding inventory revaluation by approximately $5 million, in each case, as compared to the fourth quarter of 2014.
In addition, we expect first quarter free cash flow (which we define as cash provided by operating activities, less cash used in investing activities, excluding the impact of changes in restricted cash) of between $13 million and $19 million, which is inclusive of a $52 million semi-annual interest payment on the Existing Notes as well as a significant inventory build ahead of planned turnarounds in the second quarter of 2015. We have received $45 million in cash dividends from Americas Styrenics during the twelve months ended March 31, 2015, including $15 million of dividends in both the fourth quarter of 2014 and the first quarter of 2015.
As of March 31, 2015, we had substantial liquidity of approximately $658 million, consisting of approximately $219 million of cash and cash equivalents, approximately $148 million of availability under our accounts receivable securitization facility and $291 million of availability under our existing revolving credit facility. In addition, as of March 31, 2015, our total indebtedness was approximately $1,199 million.
Our unaudited financial data for the fiscal quarter ended March 31, 2015 presented above are preliminary, based upon our good faith estimates and subject to completion of our financial closing procedures. We have provided ranges for our expectations described above because our fiscal quarter closing procedures are not yet complete. While we expect that our final financial results for the quarterly period ended March 31, 2015, following the completion of our financial closing procedures, will be within the ranges described above, our actual results may differ materially from these estimates as a result of the completion of our financial closing procedures as well as final adjustments and other developments that may arise between now and the time that our financial results for this quarterly period are finalized. All of the data presented above has been prepared by and is the responsibility of management. PricewaterhouseCoopers LLP has not audited, reviewed, compiled or performed any procedures with respect to the accompanying financial data. Accordingly, PricewaterhouseCoopers LLP does not express an opinion or any other form of assurance with respect thereto. This summary is not a comprehensive statement of our financial results for the quarterly period.
New Senior Secured Credit Facility
Concurrently with the closing of this offering, we will enter into the New Senior Secured Credit Facility with Deutsche Bank AG New York Branch as administrative agent. Our New Senior Secured Credit Facility is expected to provide for senior secured financing consisting of a (i) $325.0 revolving credit facility, with a $25.0 million swingline subfacility and a $35.0 million letter of credit subfacility and (ii) $450.0 million senior secured term loan B facility. Amounts under the revolving credit facility will be available in U.S. Dollars and Euros. The offering of the notes is conditioned upon the execution of the credit agreement governing the New Senior Secured Credit Facility.
2
Company Realignment & Update for Business and Industry Trends in 2015
Effective January 1, 2015, we reorganized our business under two new divisions called Performance Materials and Basic Plastics & Feedstocks. The Performance Materials division now includes the following reporting segments: Synthetic Rubber, Latex, and Performance Plastics. The Basic Plastics & Feedstocks division represents a separate segment for financial reporting purposes and includes styrenic polymers, polycarbonate, and styrene monomer. In addition, the Basic Plastics & Feedstocks division includes the results of our two 50%-owned joint ventures, Americas Styrenics and Sumika Styron Polycarbonate. The following chart provides an overview of this new organizational structure including the results of key financial metrics under this structure for the year ended December 31, 2014:
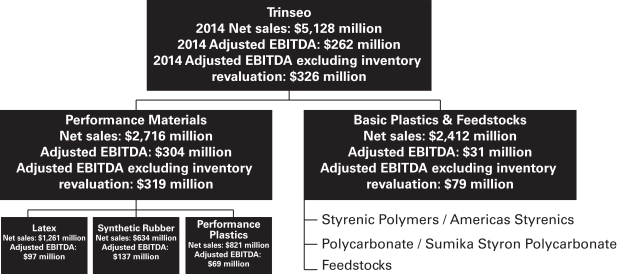
Note: Consolidated division and segment totals may not sum due to rounding. Division and Segment Adjusted EBITDA and Adjusted EBITDA excluding inventory revaluation exclude corporate Adjusted EBITDA of $(73) million.
3
We believe that this new organizational structure better reflects the nature of our Company by grouping together segments with similar strategies, business drivers and operating characteristics. Our two new divisions are of similar size in terms of sales, but have different margin profiles, different strategic focus, different value drivers and different operating requirements. By organizing the Company in this way, we believe that we can manage and operate more effectively in order to accelerate the growth of our Performance Materials division, and improve the profitability of our Basic Plastics & Feedstocks division. We also believe that this new organizational structure allows our investors to better understand the drivers of our business. Below is a description of each of these new segments, including our strategy and assessment of current market conditions.
Latex
The composition of our Latex reporting segment did not change as a result of our new organizational structure. Our strategy focuses on delivering consistent results by continuing to grow our volumes in Asia, in carpet, and in performance latex and to leverage our cost-advantaged position to minimize volume declines from the overall declines in the coated paper market in North America and Europe. In 2014, we experienced record sales volume in the carpet market, where we saw double-digit year-over-year volume growth, as well as an 8% increase in our volumes in Asia and high single digit volume growth in performance latex.
We continue to focus on our lower cost, starch emulsion technologies, which provide customers with similar performance as SB latex but at a cost advantage. We sold a record volume of this technology in 2014 and look to continue to grow this going forward.
Our strategic plans to meet the growing demand for latex in China’s paper and paper board industry are ongoing. We expect our new reactor expansion in Zhangjiagang, China, to come online in the third quarter of 2015, adding 25 kT of additional capacity, which we expect to be able to sell out quickly and to maintain our current margins.
Synthetic Rubber
The composition of our Synthetic Rubber segment is also unchanged by the new organizational structure. We remain committed to being a technology leader in providing products to the rapidly growing performance tire market, which is expected to grow at approximately 2 to 3 times the growth rate of the standard tire market. Our strategy in this market focuses on developing and commercializing new performance rubber grades and shifting the mix of products we sell toward more differentiated, higher margin products. Consistent with this strategy, we have doubled our production capacity of SSBR since 2012. This additional capacity enabled us to grow our SSBR sales volumes by 28% in 2014. Within our SSBR product family, our sales volume of enhanced SSBR grew 39% in 2014, and now represents 52% of our total SSBR sales volume, up from 38% in 2012. This mix shift has resulted in Adjusted EBITDA margins improving from 16% in 2012 to 22% in 2014.
In addition, we continue to make investments to grow this segment. In 2014 we purchased an additional 25 kMT of SSBR production capacity rights at our Schkopau facility and our progress continues on the conversion of our Ni-PBR line to higher margin Nd-PBR, which is expected to come online in 2016. We also continue to focus on remaining a technology leader in SSBR, providing superior tread properties such as wet grip, low rolling resistance, and reduced noise. We are currently testing our Generation 4 SSBR with key customers and expect it to be commercially available by the end of 2015.
4
Performance Plastics
Performance Plastics, a new reporting segment, produces highly engineered compounds and blends for automotive end markets, as well as consumer electronics, medical, and lighting, which we collectively call consumer essential markets (CEM). Our strategy in this segment focuses on developing differentiated compounds and blends in line with key industry trends, such as light-weighting and improved aesthetics in automotive, increased recycled material content and a push toward LED lighting in CEM.
In automotive end applications, we aim to maintain and develop sustainable, long-standing relationships with industry leaders, taking advantage of our production capacity on four continents to drive OEM platform design wins. In 2014, we experienced growth in key markets, with a 5% increase in volume outside of Latin America, which experienced declines due to lower consumer confidence and higher interest rates. We continue to focus on our strategic plans to grow this segment through both current technologies and expanded offerings for car exteriors and semi-structural applications.
In CEM, sales volume for 2014 was up 7% over 2013, driven largely by the consumer electronics industry in Asia and by significant progress during the year with our lighting customers, including materials for LED housings and lenses.
Basic Plastics & Feedstocks
Basic Plastics & Feedstocks, another new reporting segment, includes styrenic polymers, PC, and styrene monomer. This segment also includes the results of our two joint ventures, Americas Styrenics and Sumika Styron Polycarbonate. We do not anticipate investing for organic growth in this segment in the near term. Rather, our strategy for this segment is focused on operational enhancements, margin improvement, and cash generation.
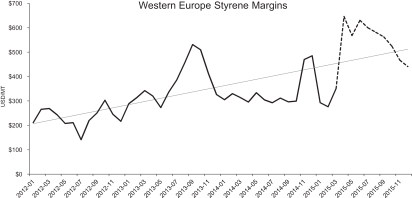
Within styrene monomer, we believe there is a longer term trend towards higher styrene margins, due to both an aging industry asset base and limited new supply expected over the next five years. Global styrene operating rates were estimated to be 84% in 2014 and are forecasted to rise to 87% by 2019. These relatively high operating rates can result in periods of elevated margins due to planned or unplanned production outages. For example, over 20% of Western European capacity is currently offline, which, combined with customer restocking in polystyrene derivatives, is expected to result in increased margins in the second quarter of 2015. The following chart illustrates historical and forecasted styrene margins in Western Europe:
5
Also within this segment, our 50%-owned joint venture, Americas Styrenics, continues to be a leading producer in North America of both styrene and polystyrene. We have received $45 million in cash dividends from Americas Styrenics during the twelve months ended March 31, 2015.
Of the total equity in earnings from unconsolidated affiliates for the years ended December 31, 2014, 2013 and 2012 of $47.7 million, $39.1 million and $27.1 million, respectively, Americas Styrenics contributed earnings of $50.2 million, $39.4 million and $27.0 million, respectively. In the table below, we present EBITDA for Americas Styrenics for the years ended December 31, 2014, 2013, and 2012, as well as a reconciliation of that EBITDA to Americas Styrenics’ net income (loss), determined in accordance with GAAP. For this purpose, EBITDA is defined as net income (loss) before interest expense (income), income tax expense, and depreciation and amortization. We believe that the presentation of Americas Styrenics EBITDA provides investors with useful information regarding the performance of this joint venture, as it is a key metric that we use to evaluate business performance compared to budgets, forecasts, and prior year financial results and we believe that it is helpful in assessing the core operating performance of Americas Styrenics.
There are limitations to using financial measures such as EBITDA. This performance measure is not intended to represent cash flow from operations as defined by GAAP and should not be used as an alternative to net income (loss) as an indicator of operating performance or to cash flow as a measure of liquidity. Other companies may define EBITDA differently. As a result, it may be difficult to use EBITDA, or similarly-named financial measures that other companies may use, to compare the performance of those companies to the performance of Americas Styrenics.
| Year Ended December 31, |
||||||||||||
| (in millions) | 2014 | 2013 | 2012 | |||||||||
| Americas Styrenics Net income |
$ | 56.2 | $ | 36.5 | $ | 18.5 | ||||||
| Interest income |
— | — | (0.1 | ) | ||||||||
| Income tax expense |
9.0 | 3.8 | 7.9 | |||||||||
| Depreciation and amortization |
40.3 | 37.3 | 41.8 | |||||||||
|
|
|
|
|
|
|
|||||||
| Americas Styrenics EBITDA |
$ | 105.5 | $ | 77.6 | $ | 68.1 | ||||||
|
|
|
|
|
|
|
|||||||
The results of Sumika Styron Polycarbonate, our other 50%-owned joint venture, are also now included within the results of our Basic Plastics & Feedstocks segment. Of the total equity in earnings from unconsolidated affiliates for the years ended December 31, 2014, 2013 and 2012 of $47.7 million, $39.1 million and $27.1 million, Sumika Styron Polycarbonate contributed to us losses of $2.5 million and $0.3 million and earnings of $0.1 million, respectively.
6
The following chart represents historical and forecasted styrene, benzene, and ethylene prices, as well as styrene margin, which is calculated by subtracting the costs of benzene and ethylene from the sales price of styrene.
Europe
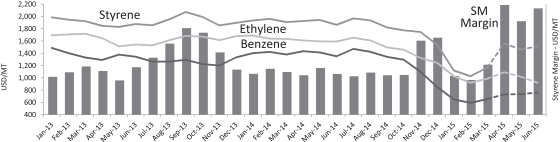
Asia
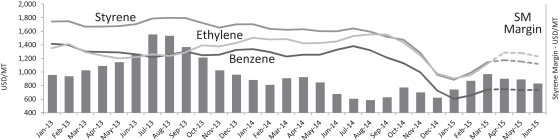
Source: IHS. Styrene: W. Europe Contract Monthly Market (Delivered W. Europe); Benzene: 50% W. Europe Spot Avg (CIF NW Europe / Basis ARA) and 50% W. Europe Contract – Monthly Market (FOB/CIF W. Europe); Ethylene: W. Europe Contract – Market Piepline (Delivered W. Europe). Styrene: NE Asia Avg Spot Posting (CFR China); Benzene: NE Asia Spot Avg (FOB S. Korea); Ethylene: NE Asia Spot Avg (CFR NE Asia). Margin: Styrene lless 80% Benzene less 30% Ethylene.
We capture styrene monomer margin through both internally produced and cost-based purchases of styrene. We produced approximately 600 kilotons of styrene in Western Europe in 2014, and purchased approximately 300 kilotons of styrene in Asia in 2014 with cost based economics. A $50 per metric ton change in styrene margins would be expected to impact our annual Adjusted EBITDA by approximately $35 million in Europe and approximately $15 million in Asia.
In PC, we continue to drive improvements in profitability as a result of savings from our restructuring activities, as well as from improvements in industry supply and demand. Industry operating rates are estimated to have increased to nearly 80% in 2014 driven by demand for polycarbonate in automotive and electronics applications. Global operating rates are forecasted to increase further in 2015 and 2016 to approximately 82%, which could result in a meaningful increase in polycarbonate margins. A $100 per metric ton change in polycarbonate margins would be expected to result in approximately a $15 million change in our annual Adjusted EBITDA.
7