Attached files
| file | filename |
|---|---|
| EX-3.1 - EX-3.1 - CONNECTURE INC | d877081dex31.htm |
| EX-10.3.2 - EX-10.3.2 - CONNECTURE INC | d877081dex1032.htm |
| EX-32.2 - EX-32.2 - CONNECTURE INC | d877081dex322.htm |
| EX-32.1 - EX-32.1 - CONNECTURE INC | d877081dex321.htm |
| EX-31.1 - EX-31.1 - CONNECTURE INC | d877081dex311.htm |
| EX-23.1 - EX-23.1 - CONNECTURE INC | d877081dex231.htm |
| EX-10.5.8 - EX-10.5.8 - CONNECTURE INC | d877081dex1058.htm |
| EX-10.6.8 - EX-10.6.8 - CONNECTURE INC | d877081dex1068.htm |
| EX-10.6.7 - EX-10.6.7 - CONNECTURE INC | d877081dex1067.htm |
| EX-10.14.1 - EX-10.14.1 - CONNECTURE INC | d877081dex10141.htm |
| EX-10.14.2 - EX-10.14.2 - CONNECTURE INC | d877081dex10142.htm |
| EX-31.2 - EX-31.2 - CONNECTURE INC | d877081dex312.htm |
| EX-10.5.9 - EX-10.5.9 - CONNECTURE INC | d877081dex1059.htm |
Table of Contents
UNITED STATES
SECURITIES AND EXCHANGE COMMISSION
Washington, D.C. 20549
FORM 10-K
| x | ANNUAL REPORT PURSUANT TO SECTION 13 OR 15(d) OF THE SECURITIES EXCHANGE ACT OF 1934 |
For the fiscal year ended December 31, 2014
OR
| ¨ | TRANSITION REPORT PURSUANT TO SECTION 13 OR 15(d) OF THE SECURITIES EXCHANGE ACT OF 1934 |
For the Transition Period from to
Commission File Number 001-36778
CONNECTURE, INC.
(Exact name of registrant as specified in its charter)
| Delaware | 58-2488736 | |
| (State or other jurisdiction of incorporation or organization) |
(I.R.S. Employer Identification Number) |
18500 West Corporate Drive, Suite 250
Brookfield, WI 53045
(Address of principal executive offices and zip code)
(262) 432-8282
(Registrant’s telephone number, including area code)
Securities registered pursuant to Section 12(b) of the Act:
| Title of each class |
Name of each exchange on which registered | |
| Common Stock, par value $0.001 per share | The NASDAQ Global Market LLC |
Securities registered pursuant to Section 12(g) of the Act:
None
Indicate by check mark if the registrant is a well-known seasoned issuer, as defined in Rule 405 of the Securities Act. Yes ¨ No x
Indicate by check mark if the registrant is not required to file reports pursuant to Section 13 or Section 15(d) of the Act. Yes ¨ No x
Indicate by check mark whether the registrant (1) has filed all reports required to be filed by Section 13 or 15(d) of the Securities Exchange Act of 1934 during the preceding 12 months (or for such shorter period that the registrant was required to file such reports), and (2) has been subject to such filing requirements for the past 90 days. Yes x No ¨
Indicate by check mark whether the registrant has submitted electronically and posted on its corporate Web site, if any, every Interactive Data File required to be submitted and posted pursuant to Rule 405 of Regulation S-T (§ 232.405 of this chapter) during the preceding 12 months (or for such shorter period that the registrant was required to submit and post such files). Yes x No ¨
Indicate by check mark if disclosure of delinquent filers pursuant to Item 405 of Regulation S-K (§ 229.405 of this chapter) is not contained herein, and will not be contained, to the best of registrant’s knowledge, in definitive proxy or information statements incorporated by reference in Part III of this Form 10-K or any amendment to this Form 10-K. x
Indicate by check mark whether the registrant is a large accelerated filer, an accelerated filer, a non-accelerated filer, or a smaller reporting company. See the definitions of “large accelerated filer,” “accelerated filer” and “smaller reporting company” in Rule 12b-2 of the Exchange Act.
| Large accelerated filer | ¨ | Accelerated filer | ¨ | |||
| Non-accelerated filer | x (Do not check if a smaller reporting company) | Smaller reporting company | ¨ |
Indicate by check mark whether the registrant is a shell company (as defined in Rule 12b-2 of the Act). Yes ¨ No x
The registrant was not a public company as of June 30, 2014, the last day of the registrant’s most recently completed second fiscal quarter, and therefore cannot calculate the aggregate market value of its common stock held by non-affiliates as of such date.
As of February 28, 2015, there were 21,697,740 shares of the registrant’s common stock issued and outstanding.
DOCUMENTS INCORPORATED BY REFERENCE:
The information required by Part III of this Report, to the extent not set forth herein, is incorporated herein by reference from the Proxy Statement relating to the registrant’s 2015 annual meeting of stockholders, which shall be filed with the Securities and Exchange Commission within 120 days after the end of the fiscal year to which this Report relates.
Table of Contents
CONNECTURE, INC.
Form 10-K
For the Year Ended December 31, 2014
Table of Contents
Forward Looking Statements
Except for the historical financial information contained herein, the matters discussed in this Annual Report on Form 10-K (as well as documents incorporated herein by reference) may be considered “forward-looking” statements within the meaning of Section 27A of the Securities Act of 1933, as amended, and Section 21E of the Securities Exchange Act of 1934, as amended. All statements, other than statements of historical fact, are statements that could be deemed forward-looking statements, including, but not limited to, statements regarding our future financial position, business strategy and plans and objectives of management for future operations. When used in this Annual Report, the words “believe,” “may,” “could,” “will,” “estimate,” “continue,” “intend,” “expect,” “anticipate,” “plan,” “project” and similar expressions are intended to identify forward-looking statements.
We have based these forward-looking statements largely on our current expectations and projections about future events and financial trends that we believe may affect our financial condition, results of operations, business strategy, short-term and long-term business operations and objectives, and financial needs. These forward-looking statements are subject to certain risks and uncertainties that could cause our actual results to differ materially from those reflected in the forward-looking statements. Factors that could cause or contribute to such differences include, but are not limited to, those discussed in this report, and in particular, the risks discussed under Part 1, Item 1A:“Risk Factors” and those discussed in other documents we file with the Securities and Exchange Commission. Except as required by law, we do not intend to update these forward-looking statements publicly or to update the reasons actual results could differ materially from those anticipated in these forward-looking statements, even if new information becomes available in the future.
In light of these risks, uncertainties and assumptions, the forward-looking events and circumstances discussed in this report and in the documents incorporated in this report may not occur and actual results could differ materially and adversely from those anticipated or implied in the forward-looking statements. Accordingly, readers are cautioned not to place undue reliance on such forward-looking statements.
Overview
We are a leading web-based consumer shopping, enrollment and retention platform for health insurance distribution. Our solutions support the industry evolution towards a consumer-centric experience that is transforming how health insurance is purchased and distributed. We offer a personalized health insurance shopping experience that recommends the best fit insurance plan based on an individual’s preferences, health status, preferred providers, medications and expected out-of-pocket costs. Our customers are health insurance marketplace operators such as health plans, brokers and exchange operators, who must distribute health insurance in a cost-effective manner to a growing number of insured consumers. Our solutions automate key functions in the health insurance distribution process, allowing our customers to price and present plan options accurately to consumers and efficiently enroll, renew and manage plan members.
The United States health insurance marketplace is undergoing a tremendous structural change that is fundamentally altering how health insurance is purchased and distributed. More consumers now have access to health insurance with more plan options and places to buy their insurance than ever before. As a result, consumers need effective decision-support tools to help them optimize their health insurance choices. Concurrently, health plans and brokers that have traditionally distributed a more limited set of plans to employers through group coverage must now cost-effectively sell insurance in the more fragmented individual market and in public and private exchanges, which are online marketplaces sponsored either by a non-government entity, such as an employer, insurance broker or other distributor (in the case of private exchanges) or by a federal or state government entity (in the case of public exchanges) for health insurance and related products that allow individuals and businesses to compare products and make purchases directly from health plans. These changes
1
Table of Contents
are driving significant demand for innovative technology solutions to more effectively help consumers navigate the new health insurance marketplace and for health plans, brokers and other aggregators of covered lives to deploy cost-effective distribution channels.
We have a 15-year history of providing technology-enabled health plan sales automation solutions. In 2013, our solutions were used by plan sponsors, brokers and consumers representing over 20 million lives and facilitated over $130 billion of annual plan premiums. Our expanding customer base includes more than 70 health plans, including 20 of the top 25 health plans (based on total enrollment). Our personalized health insurance shopping experience is available to all 52 million Medicare beneficiaries through our provision of shopping, price comparison, plan ranking and enrollment software for Medicare.gov and 1-800-Medicare call center agents. We estimate that approximately 4 million Medicare beneficiaries used our software in the 2013 to 2014 enrollment period. As of December 31, 2014, our technology powers more than 30 private, state and federal exchanges.
All of our state and federal government contracts contain provisions allowing the government counterparty to terminate the contract for convenience, or for a lack of adequate funding, generally with 30 days’ written notice, which we believe to be customary for government contracts. These contracts accounted for 30% and 12%, respectively, of our revenues in the years ended December 31, 2014 and 2013. In the year ended December 31, 2012, these contracts accounted for less than 1% of our revenues. The increase in revenues from these contracts between 2012 and 2013 is attributed to our acquisition of DRX in January 2013 (and the Medicare.gov contract held by DRX) and the growth in state exchange contracts awarded to us during this period. These contracts collectively represent approximately 19% of our deferred revenue balance at December 31, 2014.
As of December 31, 2014 and 2013, total stockholders’ deficit was $28.8 million and $106.1 million, respectively. For the years ended December 31, 2014, 2013 and 2012, our net loss was $10.2 million, $26.4 million and $16.8 million, respectively. Over the same periods, our adjusted EBITDA was $1.3 million, ($17.3) million and ($13.1) million, respectively. Please refer to “Selected Consolidated Financial Data—Adjusted Gross Margin and Adjusted EBITDA” in this Annual Report on Form 10-K for a discussion of the limitations of adjusted EBITDA and a reconciliation of adjusted EBITDA to net loss, the most comparable GAAP measurement.
We were incorporated in Delaware in 1999 under the name Healthplanet.com, Inc., which we changed to SimplyHealth.com, Inc. later that year. In 2002, we changed our name to Connecture, Inc.
Industry Background
The United States health insurance industry is responsible for the administration of healthcare benefits to over 200 million individuals covered by commercial health insurance and is experiencing a structural transformation in which shopping for and enrollment in health insurance products is transitioning from a wholesale or group-based distribution model to an individual or retail-oriented consumer marketplace. This transformation, in conjunction with regulatory and competitive pressure on distribution and overhead costs, places substantial new business and technology requirements on health plan, brokers and aggregators of covered lives and prospective customers and has created an attractive growth opportunity in the markets we serve.
Consumer-Centric Marketplace
We estimate that approximately 100 million individuals will be shopping for and enrolling in health insurance annually through the individual market and public and private exchanges by 2018. This evolution is being driven by a shift in responsibility for health insurance purchasing to individuals from employers, placing increased importance on better, more informed decision-making, and is changing where these purchases are being made. This trend is evident in several key health insurance membership market segments:
| • | Individual Insurance Market: The Patient Protection and Affordable Care Act, or PPACA, which mandates broader health insurance coverage, is expected to drive growth in the under-65 individual market from 20 million lives in 2012 to 57 million in 2017 and create new opportunities for health plans, brokers and retailers to sell directly to individuals. |
2
Table of Contents
| • | Employer-sponsored Insurance Market: For individuals who currently receive insurance through their employers, there has been a trend toward employees bearing a greater share of the cost of these benefits. According to a Towers Watson survey, from 2011 to 2013, more than 70% of companies increased employee share or premium contributions. Employees’ share of premium costs increased nearly 7% between 2013 and 2014 and employees’ total cost share, including premiums and out-of-pocket costs, were 37% in 2014. This trend creates an increased need for employees to engage in the shopping experience, purchase the right levels of coverage and better understand the overall financial implications of their benefit selection decisions. |
| • | Exchange-based Insurance Market: According to a study by Accenture, employers are expected to move approximately 40 million lives to private exchanges by 2018 as a mechanism to make health insurance a defined contribution benefit and decouple benefit expenses from medical cost inflation trends. As part of this shift, large employers are increasingly moving retirees from group Medicare Advantage plans to retail Medicare Advantage plans that are distributed through retiree exchanges. |
| • | Medicaid Market: As a result of expanded eligibility under PPACA, average monthly Medicaid enrollment is expected to expand from approximately 58 million individuals in 2013 to approximately 73 million individuals by 2024, creating new opportunities for Medicaid managed care organizations to expand into the individual market. |
| • | Medicare Market: We believe that the number of participants in Medicare Advantage and Medicare Supplement plans will increase from approximately 25 million individuals in 2013 to approximately 32 million individuals in 2018 and that there will be increased movement from group Medicare Advantage plans to retail Medicare Advantage plans. |
As a whole, these trends are directing an evolution of health insurance technology toward supporting more effective and consumer-friendly solutions that help consumers to better compare and enroll in plans based on their actual healthcare needs and to optimize their increased health insurance responsibility and spend.
Pressure to Manage Distribution Costs and Operating Expenses
While health plans and brokers need to support a more individualized and fragmented health insurance shopping and enrollment process, they are under increasing pressure to lower distribution costs. Recent federal restrictions on health plan profitability and increased competition for members on exchanges have driven health plans to find ways to better manage areas of non-medical cost structure, such as sales commissions and internal information technology development. As a result, health plans have undertaken efforts to lower brokerage commissions and to implement innovative third-party technologies to reduce investment in internally-developed software. Similarly, brokers who now face depressed commissions from health plans need to leverage technology-based, automated processes to sell more cost-effectively and to identify product cross-selling opportunities, such as with ancillary products, as part of the plan selection process.
Increasing Opportunity for Technology
As shopping and enrollment in health insurance transitions to an individual, retail-oriented consumer marketplace, there is significant opportunity for intuitive, web-based technologies to automate and lower the cost of health insurance distribution, as well as increase enrollment opportunities and member retention. As of 2012, approximately $25 billion was spent to distribute health insurance annually, the majority of which is spent on sales commissions that support manual, people-based processes. As technology becomes increasingly critical to support a more consumer-centric, fragmented shopping and enrollment process, we believe, based on our assumptions and estimates, that $3.4 billion was spent annually on web-based shopping and enrollment solutions as of 2013 and that this amount should reach $5.2 billion by 2017, representing 15% annual growth. According to a Harvard Business Review article authored by McKinsey & Company on health insurance technology, a robust technology program can deliver up to 65% in cost reduction, reduce turnaround time on key insurance processes by 90% and improve conversion rates by more than 20%.
3
Table of Contents
The Connecture Platform
We are a leading web-based consumer shopping, enrollment and retention platform for health insurance distribution. Our solutions support the industry evolution towards a consumer-centric experience that is transforming how health insurance is purchased and distributed. We simplify the health insurance shopping experience with data-driven, personalized plan comparison and shopping tools that empower individual consumers who are now faced with more decisions to make better health insurance choices. For health plans, brokers and exchange operator customers, we deliver a powerful and unified distribution platform that we believe increases their revenue opportunity as they serve a growing, but fragmented insured population, while also reducing the costs associated with acquiring new and retaining current members.
The Connecture Sales Automation Solution

We automate the following key functions of the health insurance distribution process for our health plans, brokers and exchange operator customers:
| • | Rate Setting and Modeling: prices and presents plan options accurately to consumers; |
| • | Shopping and Quoting: allows consumers to view and compare plans, including estimated premiums, out-of-pocket costs and plan benefits; |
| • | Application and Enrollment: streamlines application and enrollment operations, eliminating manual processes and paper processing; |
| • | Renewal Management: streamlines the renewal process, eliminating manual processes and paper processing; |
| • | Member Management: updates plan offering details based on members’ work or life changes; and |
| • | Exchange Integration: connects to state and federal exchanges to determine subsidy eligibility. |
We believe the breadth, depth and scale of the Connecture solutions across key functional areas are critical to our success in the complex and changing health insurance marketplace for the following reasons:
Our personalized and data-driven shopping experience helps consumers make better health insurance purchasing decisions
We believe that our interactive and intuitive health insurance shopping experience offers better decision support for consumers to choose their health plan. Our solutions offer personalized health plan recommendations based on the individual’s self-entered preferences, health status, preferred providers, medication and expected out-of-pocket costs. Our data-driven recommendations engine also uses empirical data, a consumer’s actual claims experience and proprietary algorithms to find the best matches among available plan options. We believe that our personalized shopping experience results in a more effective health plan selection because individuals are able to better understand the plans they are purchasing, select plans that provide appropriate coverage and lower total costs and represent the best match given historical and expected levels of healthcare utilization.
4
Table of Contents
Our unified platform across multiple product types is designed to maximize enrollment and member retention opportunities
Our platform is designed to deliver a seamless shopping and enrollment mechanism in a marketplace that is characterized by a wide range of potential insurance alternatives and changing insurance eligibility for both currently and previously insured individuals. For brokers that seek to sell the full array of health insurance products, we believe we offer the only unified solution that serves all insurable populations across a broad range of health insurance products including subsidized or unsubsidized individual plans, group plans, Medicare Advantage, Medicare Supplement, Medicare Part D and Medicaid. For health plans that seek to minimize membership churn, our solution enables customers to enroll and retain members as their plan eligibility changes. For example, for a previously uninsured individual or an individual whose employer no longer provides health insurance, our solution integrates with the Federal Health Exchange and allows for calculation of subsidies and enrollment in qualifying individual plans. For the over-65 population, our solution integrates Medicare Advantage, Medicare Supplement and Medicare Part D plan data nationally, which allows seniors to make informed choices as they potentially transition from a local group plan to an appropriate nationwide individual plan. Because our platform can both identify appropriate eligibility and present available plan options, our customers are able to minimize lost membership opportunities to competing brokers and health plans.
Our technology enables rapid deployment of public and private single- and multi-payer exchanges to help customers adapt to evolving market needs
Our technology allows our health plan, broker and aggregator customers to capitalize on the migration to public and private exchanges. Our exchange solutions allow quick deployment of a customized online marketplace where consumers can shop for a plan of their choice and employers or other plan sponsors can set defined contributions to subsidize the cost of the plans. For brokers that are looking to set up multi-payer exchanges, which are private exchanges generally promoted by third parties such as brokers or benefits consultants that offer a broad range of health plans for individuals to choose from, for employers and consumers, the breadth of our existing relationships with health plans and knowledge of highly locally-regulated insurance products allow us to rapidly implement robust exchanges because we can more easily integrate their health plan data and offer greater choice to consumers. For health plans that are looking to sell single-payer exchanges, which are private exchanges that generally offer only plans sponsored by a single health plan, directly to employers, our ability to offer easy-to-use technology that can handle the broader eligibility needs of employees and their dependents allows them to offer a complete integrated solution. Exchange offerings represented approximately 36% of our revenue in 2014, and we have an established track record of scalability and reliability with our more than 30 exchange customers.
Our Competitive Strengths
We believe we have the following key competitive strengths:
Health plan shopping and enrollment leadership
While the health insurance industry is in the midst of adapting to rapidly changing requirements, we have a 15 year history in the technology-enabled health plan shopping and enrollment market serving individuals both under and over-65, including the following:
| • | Leadership in the commercial under-65 health insurance market with over one million enrollments in the one-year period ending March 31, 2014, the date of the closing of the first enrollment period under PPACA; |
| • | Ten years as the web-based technology solution for Medicare.gov; |
| • | Technology utilized in leading public and private exchange solutions; and |
| • | Relationships with a broad range of health plans and brokers, including 20 of the top 25 health plans (based on total enrollment). |
5
Table of Contents
Domain and technology development expertise
The health insurance market is characterized by high levels of regulation associated with the many plan types that can be sold to eligible individuals and how information related to these plans is presented and marketed. We believe our knowledge of the complex health insurance market and our proven ability to innovate positions us to be a continued leader in our industry. Further, our technology assists our customers to compete more effectively by allowing them to introduce new products and change pricing and benefit designs dynamically. We also believe that our solutions allow our customers to more effectively enter new markets and distribute new products faster and more efficiently.
Configurable and scalable platform to meet customer needs
Our platform is designed to handle both high degrees of configurability and significant growth in users without requiring major software re-engineering or capital expenditures by our customers. Our solutions are cost-effective for our customers because we offer a platform that is comprehensive across key sales automation functions, but also has individual software applications that can integrate with common existing customer software applications. We deliver quick deployment solutions in the cloud as well as large scale enterprise solutions. Today, our technology is used by many of the largest health plans and brokers to power their critical shopping and enrollment functions. We also power the country’s largest multi-payer exchange, Medicare.gov, and successfully handle over 20% of all Medicare Advantage and Medicare Part D enrollments, or approximately two million members annually.
Large and valuable database of health plan and drug cost information and ancillary products
We believe that our large database of health plan and drug cost information enables us to deliver higher value to our customers and consumers alike. We are a primary source of health plan and pharmacy data for Medicare products available on Medicare.gov and the broad range of our health plan relationships makes us a valuable and extensive source of permission-based health plan information. These data are critical for consumers to make difficult decisions about trade-offs between plan premiums vs. out-of-pocket costs, physician networks and pharmaceutical formularies. We believe our large dataset of health plan and drug cost information powers our empirically-driven recommendations engine that provides consumers with more precise decision-support tools. In addition, our platform also supports many ancillary products such as dental, life insurance, critical illness and wellness which allows health plans and brokers to sell a more customized package of insurance products, thereby helping to differentiate the consumer shopping experience and maximizing our customers’ revenue opportunity.
Tenured, experienced management team
Our management team has significant experience in high growth healthcare, technology and consulting companies, including Truven Health Analytics (formerly Thomson Reuters Healthcare), Optum (part of UnitedHealth Group), Ernst & Young, PricewaterhouseCoopers and Accenture. Our management team has been responsible for driving innovation in the healthcare information technology industry. Within our own organization, our management team has been responsible for identifying key market needs and broadening our capabilities to serve our customers. For example, we have leveraged our historical expertise in the individual, commercial, and under-65 market to additionally serve Medicare, Medicaid and the exchanges. We believe we have the management team in place to continue developing and marketing innovative solutions that meet the current and future needs of our customers.
Visible, recurring software and technology services revenue model
Our business is characterized by high customer retention rates and recurring revenue. Most of our revenue is derived from multi-year contracts for software and services. In the past three years, our software revenue
6
Table of Contents
retention rate has been approximately 95%. As a result, we have significant visibility into our future financial performance. As of December 31, 2014, we had $78.2 million of business in contracted backlog and a deferred revenue balance of $73.7 million that we expect to recognize in the coming years.
Our Growth Strategy
We intend to strengthen our position as a leading web-based consumer shopping, enrollment and retention platform for health insurance distribution. Key elements of our growth strategy include the following:
Add new customers and expand covered lives within our existing base of growing health plans and broker customers
We believe our market leadership positions us to take advantage of key trends. We are currently working with 20 of the top 25 health plans in the country (based on total enrollment), including more than half of the Blue Cross and Blue Shield plans. We intend to continue engaging additional top national and regional health plans and brokers as they seek innovative solutions to maximize enrollment and retention while minimizing costs as they shift their businesses to capitalize on the opportunity to serve the over 100 million expected members in individual and exchange markets. Furthermore, we believe new market entrants such as retailers and Accountable Care Organizations, or ACOs, that offer health plans present entirely new customer categories for us. We also expect to capitalize on this by leveraging our expertise and leadership position in retiree exchanges to win customers in the rapidly growing under-65 market.
Leverage core technology to establish leadership in the private health plan exchange business
As more small and medium sized employers move away from defined benefit plans and towards defined contribution plans, the number of single-health plan exchanges are expected to significantly increase. Unlike a defined benefit plan in which employers provide a standard set of health benefits and cover a substantial portion of the health insurance premiums, under a defined contribution plan, employers make cash contributions to health savings accounts that employees can use to purchase insurance products of their choosing. This model allows employers to more accurately predict and limit healthcare costs, while also affording employees a greater number of choices relative to a defined benefit plan. As employers move their employees to defined contribution plans, employers can utilize our software to create private exchanges that allow employees to select their own health benefits. We intend to leverage our technological expertise and our long-lasting relationships with health plans to continue capturing these emerging exchanges as well as single and multi-payer private exchanges sponsored and/or purchased by insurance brokers and agents serving their individual consumer, employer group and retiree customer bases. We are currently a leader in the retiree exchange space, an industry providing online private exchanges for both retirees under 65 years old and Medicare beneficiaries that is at the forefront of exchange technology adoption, and believe that our capabilities there position us well for further growth in other exchanges as those markets mature as well as seek an integrated platform across all segments. Finally, we believe there is a significant opportunity to provide more full service private exchange solutions which integrate call center capabilities that leverage our proprietary technology.
Further penetrate our existing customer base
We believe there is a significant opportunity in our existing customer base to cross-sell our full set of applications, as most of our customers utilize less than half of what we are able to offer. Additionally, many of our customers could utilize our solutions across other products within their overall set of offerings, such as a health plan expanding from individual to group product offerings. For example, we initially provided limited solutions to a regional subsidiary of a national customer and then were asked to add a full solution across the entire enterprise based on our initial performance. We also believe our development of new products and capabilities will continue to address evolving customer needs and facilitate additional cross-selling of software applications and solutions.
7
Table of Contents
Expand into new products and distribution channels
We plan to expand into new products and distribution channels by leveraging our current technology and innovation expertise. We believe there are significant growth opportunities in private exchanges in partnership with health plans, data analytics and ancillary product offerings to broaden our value proposition to customers. We maintain a robust pipeline of innovative projects that we believe will drive future growth in revenue per customer. We believe our analytical capabilities differentiate our solutions in the marketplace by improving shopping recommendations, enhancing the customer shopping experience and integrating into customer relationship management, or CRM, solutions.
Monetize the shift to the individual market
PPACA is expected to drive growth in the under-65 individual market from 20 million lives in 2012 to 57 million in 2017. This is projected to be one of the fastest growing segments in the U.S health insurance marketplace and represents an increase in annual commission spend of $4.2 billion over this same period. Given our leadership in the individual market and with exchanges, we believe that we are well positioned to capitalize on this market trend. Specifically, we believe our technology will play a significant role in member acquisition and retention due to the ongoing shift from the traditional group distribution model to an individual, retail-oriented marketplace. We also believe we can capture a greater share of commission spend by offering more comprehensive exchange solutions, including full service support, to our customers.
Connecture Platform
Our portfolio of solutions, as summarized below, includes a comprehensive set of software applications for health plans focused on enterprise-wide sales automation (including the creation of single health plan private exchanges), for health plans and pharmacy benefit managers, or PBMs, focused on Medicare shopping and enrollment automation, for aggregators (brokers, health plans, retailers and other intermediaries) focused on private exchanges, and for state government agencies focused on creating individual and small group exchanges.
Our platform allows customers to add solutions and applications to the platform based on specific market segment needs and functional priorities. Each application is modular and functions independently, yet can integrate together to create a comprehensive and robust solution.
Enterprise Solution for Health Plans
The Connecture InsureAdvantage solution automates sales and enrollment processing in order to allow health plans to operate more cost-effectively, extend reach and provide a better consumer and/or employer/broker experience. The full consumer lifecycle for sales automation is managed, from business acquisition through renewals. Our platform allows a broad range of consumers (individual plan sales, group sales, or single health plan private exchanges) to make better health insurance decisions. Consumers, brokers and other agents can more easily shop for, purchase and renew insurance. The product can be configured for any size of health plan.
InsureAdvantage streamlines workflow for health insurance distribution and automates multiple lines of business, including health, dental, group life, vision, accidental death and dismemberment, short-term disability and long-term disability. InsureAdvantage is web-based, secure and scalable.
The business functions automated by InsureAdvantage for the individual consumer market include:
Shopping
The Shopping application allows for the capture of consumer information, the comparison of plans and viewing of rates. In addition, users can retrieve previously saved quotes, copy and create new quotes and indicate acceptance of plans online. The functionality supports the PPACA rules related to open enrollment, metal tier plan information and member-level rate display.
8
Table of Contents
InsureAdvantage also offers a Plan Advisor Tool which allows the consumer, broker or sales representative to shop and compare plans, products and key benefit features via an interactive “guided shopping” experience based on questions around the consumer’s individual risk tolerance, ability to pay more up-front/higher deductible, personal health factors, desired add-on plans or riders. These questions are then rated and scored and plans are presented based on how the consumer answered each question. There are also subsidy and cost calculators to help the prospective member gauge financial risk. Each implementation is designed to match the health plan’s current website and brand.
Enrollment
An Online Application steps the user through an easy to navigate electronic application. Questions (or fields) can be standard or dynamic. Enrollment enables the health plan to combine enrollment forms for multiple products into one online application. Once an electronic application has been started, the user can save and return at a later time to complete it. A consumer can also receive assistance with completing the application from the broker or sales representative. The broker or sales representative may aid in determining the best coverage fit for his or her customer, based on presented plan details and prices. The broker or sales representative can start the online application process for his or her customer and then forward the application to the customer for completion. eSignature is also supported.
Administrative Review
Applications that do not meet the health plan’s established rules will be routed to an internal user where they can review and approve, withdraw or indicate that an applicant is not eligible for the coverage requested. To expedite the approval process, administrative reviewers can also edit Individual new business enrollments. For example, enrollments held for approval due to circumstances such as home address checks, health plan specific configuration checks or attachment uploads can be edited to allow the process to continue moving forward.
Renewals
InsureAdvantage’s Renewal application is comprised of a series of workflow steps which will allow for the automatic initiation of the renewal process without manual intervention; health plans, however, can also configure business rules to denote renewal groups and subject such groups to the manual renewal process. Functionality includes renewal import, renewal quoting & acceptance, renewal export, package generation and distribution, recommended and alternate plan mapping and agent/broker PDF generation.
Policy Administration
InsureAdvantage’s Policy Administration application allows members the ability to update their profiles with work and life event changes at any point throughout the year through an online portal. The system will track the requested change of coverage through a defined approval process.
The member is able to perform the following functions within the system:
| • | View and modify subscriber and dependent information (e.g., name, address, phone numbers, e-mail, student status, date of birth, gender, social security number); |
| • | Add and remove dependents from coverage; |
| • | View current benefits and rates; |
| • | View address information; and |
| • | View and modify payment information. |
9
Table of Contents
Health plans can also determine unique business rules to determine if administrative review is necessary for specific policy changes.
InsureAdvantage utilizes common capabilities for both the individual consumer and the employer group’s needs. The business functions automated by InsureAdvantage for employer groups include:
Quoting
New Business Quoting provides a guided workflow to capture basic employer demographic information and employee census details in order to view available plans and corresponding rates. Within each new business quote, the user can view the composite/age rates, estimated premiums, plan benefits and benefit comparisons.
InsureAdvantage also provides a guided workflow designed specifically for defined contribution in addition to traditional defined benefit plans. Users can initiate a defined contribution quote by selecting an array of plans options. These options are defined by the health plan and configured within the product server and rate repository. The collection of employer demographics and census information can serve both defined contribution and defined benefit quoting.
Employer and Employee Shopping
The Shopping application allows for the capture of basic consumer information, the comparison of plans and viewing of rates. In addition, users can retrieve previously saved quotes, copy and create new quotes and indicate acceptance of plans online. The functionality supports the PPACA rules related to open enrollment, metal tier plan information and member-level rate display.
InsureAdvantage for groups also offers a Plan Advisor Tool which allows the employee-consumer, or the human resources administrator at the employer, the broker or sales representative working with them, to shop and compare plans, products and key benefit features via an interactive “guided shopping” experience based on questions around their own individual risk tolerance, ability to pay more up-front/higher deductible, personal health factors, desired add-on plans or riders, etc. These questions are rated and scored. Plans are presented based on how the consumer answers each question. Each implementation is designed to match the health plan’s current website and brand. There is both a subsidy calculator and a cost calculator to help the prospective member gauge financial risk.
Enrollment and Renewals
Developed specifically for the group market, InsureAdvantage leverages common capabilities from the Individual applications and delivers necessary functionality tailored for employer group and employee enrollment. Comprehensive functionality also supports the group renewal process.
Group Policy Administration
The Group Policy Administration application allows human resources administrators and members the ability to update profiles with work and life event changes at any point throughout the year through an online portal. The system tracks the requested change of coverage through a defined approval process.
Most customer implementations of InsureAdvantage for groups today are focused on the smaller group market (employers with 100 or less employees). However, larger group sizes are being supported for single health plan exchanges and the product line is being enhanced to streamline group set-up for larger size groups.
We also offer single-health plan private exchanges as an extension to InsureAdvantage. These private exchanges enable insurance health plans to offer more choices to their employer customers. They facilitate an
10
Table of Contents
array of defined contribution and defined benefit plans, promote flexibility and consumer personalization and include medical and ancillary products in the consumer offering. We enable a one-stop shopping and enrollment experience that allows employers to make available to their employees a list of plans and benefits for consideration, pricing, selection and enrollment, including recommendation of best fit plans.
We also offer integration of a health plan’s consumer enrollment website to the Federal exchange through a Direct Enrollment capability supported by the Federal exchange, which provides the health plans the opportunity to maximize member retention by presenting only their Qualified Health Plans. This synchronization and connectivity solution operated in production for several of our customers during the enrollment cycle that commenced on November 15, 2014.
Enterprise Solution for State Exchanges
We offer to state governments a solution that enables states creating public exchanges under PPACA to offer customized individual consumer, or AHBE, and small group, or SHOP, exchanges. Leveraging the InsureAdvantage framework, the state solution has been customized for the government exchange market and includes three major functional components that facilitate plan selection:
| • | AHBE Shopping and Enrollment Applications—Intuitive tools that help consumers examine, compare and enroll in the best insurance options available for them and their families. Our individual shopping solution for state exchanges includes a range of plan comparison, consumer decision support and provider search tools. |
| • | SHOP Exchanges—For employer and employee shopping, quoting and enrollment. |
| • | Health Plan Management—Provides states and health plans with proven tools, methods and best practices that minimize maintenance costs and allow the exchange to remain a successful and sustainable distribution platform. |
Medicare Solution
We provide innovative, web-based Medicare plan comparison and enrollment tools for health plans, PBMs, pharmacies, field marketing organizations, or FMOs, and call centers. These products are used by the Medicare population through commercial health plans, retiree transition exchanges (group to individual, group to group) provided by benefits consulting firms and Medicare.gov. More than 30% of 2013 plan year enrollees in Medicare Part D plans used our product to compare and enroll.
Key capabilities offered for our Medicare solution include:
Consumer Plan Comparison and Shopping
The Plan Comparison and Shopping application is deployable in multiple portal website configurations including consumer, agent/broker and call center representative. The application supports the most common Medicare plan options including Medicare Advantage, or MA, Medicare Advantage Prescription Drug, or MAPD, Prescription Drug, or PDP, and Medicare Supplement plans. In addition to operating as a stand-alone website, the offering can also be made available as an Application Programming Interface or API. This allows the customer to embed the functionality within their existing internet assets without the need for a separate website.
Plan Comparison and Retention
Our Plan Comparison and Retention application utilizes features from the shopping application to improve the efficiency of the policy renewal process. Medicare beneficiaries can receive their forms pre-populated with their personal information from the new business enrollment process, seeing plan options and cost estimates built
11
Table of Contents
on known information, such as age and pharmaceutical drug utilization. These pre-filled forms minimize potential errors and can expedite the enrollment process. Beneficiaries are also offered a Short Enrollment Request Form to facilitate enrolling in a different plan offered by the same health plan (when allowed by Centers for Medicare and Medicaid Services, or CMS).
On-line Enrollment
The On-line Enrollment application can be fully integrated with the Plan Comparison and Shopping application. The application unifies multiple distribution channels (e.g., brokers, field marketing organizations, call centers, etc.) into a single automated application submission to the health plan. Reporting is also available on an integrated basis. Common Medicare plan options including MA, MAPD, PDP and Medicare Supplement plans are supported with dynamic form generation coupled with extensive customization options.
Mobile Field Enrollment
In many cases brokers and agents are in the field and do not have access to the internet at the time of meeting with prospective beneficiaries. Our Mobile Field Enrollment application allows the user to store the enrollment data locally on their tablet and sync with the health plan once they are online. Customer information can also be loaded from the agent/broker’s contact address book located on their tablet. In addition to enrollment forms, other sales information, including presentations and scope of appointment forms are available electronically on the tablet as well.
Private Exchanges
Our Private Exchange provides benefit consultants, brokers, exchange operators and aggregators with a group defined-contribution benefit exchange solution. The solution enables users to provide their employer and individual customers with a compliant benefit shopping, enrollment and post-enrollment benefits management experience. Brokers are empowered with a custom-branded private exchange environment that provides analytics and decision support. Our Private Exchange solution expands upon our single-plan shopping and enrollment tools by allowing users to compare plans, premiums and products from among multiple health plans within a specific geography. Our solution also allows customers to sell commercial and Medicare products.
Through our RxHealth Insurance Agency, Inc. subsidiary, we are a CMS-approved Web Broker Entity, which allows us to assist customers online with (i) completing enrollment in Qualified Health Plans offered in the individual market through the Federal Exchange; (ii) applying for tax credits and cost sharing reductions for Qualified Health Plans; and (iii) other customer service assistance related to health insurance coverage and enrollment processes through the Federal Exchange. Using Web Broker Entity services allows brokers, agencies and aggregators to provide a CMS-approved technology platform to consumers shopping for Qualified Health Plans. However, we believe many brokers, agencies and aggregators lack the technical resources and capabilities to independently obtain CMS approval. Therefore, by extending our Web Broker Entity services to these brokers, agencies and aggregators as part of our private exchange solution, we believe that we can provide enhanced services to those customers that other private exchange providers lacking CMS approval cannot offer.
Under 65 Plan Comparison and Enrollment
Building upon our shopping and enrollment applications, our Private Exchange applications delivers individual consumer and group quoting in a multi-payer configuration. The ability to intake an employer’s employee roster is supported to pre-fill demographic information and decrease process time. Brokers can monitor in-progress activity of the employees and analyze their sold group business, as well as create customized proposals for their customers.
12
Table of Contents
Consumers and employees are provided medical plan decision support, including demographic and health condition analysis, provider network lookup, financial/out-of-pocket decision modeling, out-of-pocket cost calculator and drug comparison services as described below. In addition to medical products, ancillary and supplemental products (e.g., dental, vision, disability, etc.) are also supported in a single user shopping experience. Once the end-user has made plan selections, electronic enrollment during both annual open enrollment and special enrollment periods is available.
The solution includes integration with third-party benefits administration, consumer-directed health account management (FSA/HSA), call center services and population health and wellness management vendors.
Retiree Group Plan Comparison and Enrollment
Developed for the employer seeking to transition its retirees from its current group coverage to individual Medicare plans, the Retiree Group Plan Comparison application allows for the creation of customized employer websites. The roster of eligible retirees can be pre-populated prior to making the site available for the retiree to select a new coverage plan. Health plans that have been selected by the employer are displayed to the retiree. Our Private Exchange solution not only includes technology, but also a repository of participating health plan and ancillary health plan data and integration connectivity. This repository enables the broker and exchange operator to deploy an offering quickly by avoiding an independent sourcing effort.
Drug Compare
We offer our customers, including PBMs, private exchanges and the federal government’s Medicare.gov website, a member engagement tool for drug pricing comparison called Drug Compare. We believe Drug Compare is the most widely-used and comprehensive drug pricing comparison database. In 2013, Drug Compare was made available to an audience of approximately 100 million people. Using this application, dose equivalent therapeutic alternatives are priced according to the shopper’s or member’s benefit and formulary. Lower cost formulary options are suggested, including direct generics, generic alternatives, brands, over the counter drugs, pill-splitting and alternative dosing schedules. Side-by-side pricing and safety comparisons are provided, as well as alerts regarding potential medication management interactions for a member. Our data network includes the ability to comparison shop across nearly 50,000 retail and mail-order pharmacy locations.
Professional Services and Customer Support
We deliver and support the Connecture platform and solutions utilizing teams of highly qualified business and technical personnel.
Implementation: We provide implementation services to our customers in order to help ensure seamless deployment and effective utilization of our solutions. Our customer implementation teams follow a five-step approach for each implementation:
| • | Requirements Identification, including project planning and coordination to establish key milestones, documenting business and technical requirements, establishing a rollout strategy and planning operational and market adoption activities; |
| • | Configuration and deployment, including configuring our applications to meet identified requirements and defining needs for the specific business rules associated with each market segment and function automated; |
| • | Integration, including connecting the Connecture platform functionality to a customer’s currently existing systems, such as core administration, membership and billing as well as connecting to public and private exchanges; |
13
Table of Contents
| • | Testing, including testing of various scenarios and use cases, unique functionality, inbound and outbound feeds, and regression testing; and |
| • | Training, including train the trainer and internal user sessions to learn how to implement and access our solutions. |
Production Support: Once deployed, customers have the option of maintaining various business rules, rates, plans and products on their own utilizing our proprietary tools, or having us maintain the platform on their behalf.
Software Application Maintenance: Product research and development staff provide regular upgrades to the licensed applications, including updates for common regulatory items and new functionality.
Customers
Our customers include many of the nation’s leading commercial and Medicare health plans, public and private exchanges and PBMs.
Sales and Marketing
We sell substantially all of our software solutions through our direct sales organization. Our direct sales team comprises health plan-focused and exchange-focused field sales professionals who are organized primarily by business segment. In our Private Exchange market, we also work closely with our customers to ensure that they are reaching their target audiences (e.g., employer groups) effectively as in some cases our contracts include fees tied to adoption or enrollment volume.
We generate customer leads, accelerate sales opportunities and build brand awareness through our marketing programs and strategic relationships. Our marketing programs target insurance and benefits executives, technology professionals and government department leaders. Our principal marketing programs include:
| • | use of our website to provide application and company information, as well as learning opportunities for potential customers; |
| • | business development representatives who respond to incoming leads and convert them into new sales opportunities; |
| • | participation in, and sponsorship of, user conferences, executive events, trade shows and industry events, including our user conferences; |
| • | integrated marketing campaigns, including direct email, blogs, podcasts and webinars; and |
| • | public relations, analyst relations and social media initiatives. |
Competition
While we do not believe any single competitor provides an offering as comprehensive as our platform, we face competition from various sources, many of which have greater resources than we have.
Our competition includes:
| • | insurance health plans and national brokers that have invested in internally developed customer acquisition and retention solutions; |
| • | various niche software vendors; |
| • | systems integrators and large consulting firms; |
14
Table of Contents
| • | third party administrators and call centers that may look to add technology capabilities; and |
| • | general enterprise resource planning or CRM software vendors. |
We believe that competition for our software and services is based primarily on the following factors:
| • | user experience and personalization; |
| • | breadth and depth of application functionality; |
| • | domain expertise in health insurance, benefits and healthcare consumerism, as well as in commercial and government sectors; |
| • | capability for customization through configuration, integration, security, scalability and reliability of applications; |
| • | size and variety of customer base; |
| • | extensive health plan and API data network; |
| • | cloud-based and on-premise delivery model options; |
| • | ability to integrate with legacy enterprise infrastructures and third-party applications such as CRM; and |
| • | ability to rapidly innovate and respond to customer needs and regulatory requirements. |
We believe that we compete effectively based upon these criteria. Nonetheless, the increasing acceptance of automated solutions in the health insurance marketplace and the adoption of more sophisticated technology and legislative reform will result in increased competition.
Within the business segments that we serve, examples of our competitive positions include:
| • | Enterprise/Commercial: |
We do not believe that any single or small number of competitors is dominant in this segment, although we believe that we are a leader in this space. We have had historic strength in the individual consumer and small group markets, as well as most recently, the health plan private exchange market. As we look to grow our position in the larger group market, we may face increased competition from more established firms based in either the enrollment management or core heath plan administration sectors.
| • | Enterprise/State: |
We do not believe that any single or small number of competitors is dominant in this segment. We have strong capabilities in serving shopping, recommendation and enrollment needs of the individual consumer and small group employee markets, which are the focus of the state exchange business. Our competitors include niche software vendors that address a specific functional need of a state’s overall exchange solution requirements, call center vendors that leverage internally developed software to also provide an internet portal and systems integrators and large consulting firms, which have long-standing relationships with state governments delivering customized solutions, primarily within the Medicaid market.
| • | Medicare: |
We believe that we are a leading technology solution vendor in this segment. This position is reflected in our role as the shopping technology for Medicare.gov, as well as the number of Medicare health plans we support, which include over 40 health plans. We do not believe any of our competitors serve as many customers as we serve. Additionally, we believe that we currently have a strong competitive position relative to other Medicare shopping and enrollment solutions, although some large health plans may possess the capability to develop their own solution that would compete with us, rather than procuring a solution externally.
15
Table of Contents
| • | Private Exchange: |
We believe this segment is relatively immature and the competitive environment is still evolving. As such, no competitor, or small group of competitors is dominant in the segment. A range of technology, benefits administration and call center vendors support private exchanges to varying degrees and these vendors differ as to the scope of software and services provided. We believe that our technology capabilities are robust and that our history of working with health plans in single and multi-plan solutions provide us an advantage, as well as our experience in the retiree exchange business. In addition, our flexible and scalable technology allows us to meet the unique needs of customers ranging from large national brokers to smaller regional customers.
Technology Infrastructure and Operations
As a software vendor, we have primarily deployed our solutions using hosted and software-as-a-service, or SaaS, models. The notable exceptions to our SaaS model are the non-hosted state exchange software solutions we offer in our Enterprise/State segment. Our customers typically access our software via the web or mobile devices, rather than by installing software on their premises. Through both our single-tenant and multi-tenant platforms, our customers have options as to the configuration that best meets their needs. The multi-tenant approach provides significant operating leverage and improved efficiency as it helps us to reduce our fixed cost base and minimize unused capacity on our hardware. In addition, we believe our software architecture gives us an advantage over vendors of legacy systems, who may be using a less flexible architecture that would require significant time and expense to update. Our enterprise customers utilize a single-tenant software application which allows improved configurability and support for a variety of unique integrations.
We host our applications and serve our hosted customers from two data centers in separate locations. We rely on third-party vendors to operate these data centers, which are designed to host mission-critical computer systems and have industry-standard measures in place to minimize service interruptions. Our technical operations staff manages the technology stacks supporting our platforms and uses automated monitoring tools throughout our system to detect unusual events or malfunctions that could interfere with our customers’ use of the Connecture solutions. We monitor application health by verifying that the applications, interfaces and supporting middleware are operational. If our monitoring tools detect a problem, they notify our technical operations staff, who respond immediately to diagnose and resolve the problem. We take the security of our data and our systems very seriously, and we focus on minimizing the risk of vulnerabilities in our system at the levels of software design and system and network administration.
Compliance and Certifications
We voluntarily obtain third-party security examinations relating to security and data privacy. In addition, on an annual basis, we have a qualified security assessor complete an audit of compliance against the Payment Card Industry Data Security Standards, or PCI-DSS, applicable to Level 2 service providers. These standards focus on application and network security controls for companies that process, transmit or store credit card data on behalf of customers. As of December 31, 2014, we have demonstrated compliance with PCI-DSS 2.0 as determined by a qualified security assessor. We also meet the requirements for a Business Associate as required by the Health Insurance Portability and Accountability Act, or HIPAA. We have performed a self-assessment against the security controls contained in the Health Information Trust Alliance Common Security Framework, or HITRUST CSF. In addition, we have completed our MARS-e, or Minimum Acceptable Risk Standards for Exchanges, assessment in preparation for CMS review and with respect to integration with the Federally Facilitated Marketplace, or FFM, /healthcare.gov.
Intellectual Property
We rely on a combination of trade secret, copyright and trademark laws, license agreements, confidentiality procedures, confidentiality and nondisclosure agreements and technical measures to protect the intellectual
16
Table of Contents
property used in our business. We generally enter into confidentiality and nondisclosure agreements with our employees, consultants, vendors and customers. We also seek to control access to and distribution of our software, documentation and other proprietary information.
We use several registered trademarks for our products and services, such as “Connecture,” “DRX,” “DestinationRX” and “InsureAdvantage,” which are registered marks of Connecture in the United States. Through claimed common law trademark protection, we also protect other marks which identify our services, such as RxHealth, and we have reserved numerous domain names, including “connecture.com.”
We also rely on certain intellectual property rights that we license from third parties.
Government Regulation
The healthcare and health insurance industries are highly regulated and entities are required to comply with extensive and complex United States laws and regulations at the federal and state levels. Although many regulatory and governmental requirements do not directly apply to our business, our customers are required to comply with a variety of United States laws, and we may be impacted by these laws as a result of our contractual obligations. We have attempted to structure our operations to comply with applicable legal requirements, but there can be no assurance that our operations will not be challenged or impacted by enforcement initiatives.
Requirements of PPACA
In March 2010, the President signed into law the Patient Protection and Affordable Care Act, or PPACA. As enacted, PPACA will change how healthcare services are covered, delivered and reimbursed through expanded coverage of uninsured individuals, reduced Medicare program spending and insurance market reforms.
Although numerous lawsuits challenged the constitutionality of PPACA, the United States Supreme Court on June 28, 2012, upheld the constitutionality of PPACA except for provisions that would have allowed HHS to penalize states that did not implement the Medicaid expansion with the loss of existing federal Medicaid funding. Consequently, a number of states opted out of the Medicaid expansion. Since that time, several states that initially opted out of the Medicaid expansion changed their positions and expanded Medicaid coverage.
On November 7, 2014, the Supreme Court agreed to hear a lawsuit challenging the legality of an IRS regulation that allows eligible individuals in all states to receive subsidies for health insurance under the PPACA, even in states that have not established their own health exchanges. We are unable to predict the outcome of that challenge.
While many of the provisions of PPACA will not be directly applicable to us, PPACA, as enacted, might affect the business of many of our customers. Health plans and large employers might experience changes in the numbers of individuals they insure as a result of Medicaid expansion and the creation of state and national exchanges. Although we are unable to predict with any reasonable certainty or otherwise quantify the likely impact of PPACA on our business model, financial condition or results of operations, changes in the business of our customers and the number of individuals they insure may negatively impact our business.
Requirements Regarding the Confidentiality, Privacy and Security of Personal Information
HIPAA and Other Privacy and Security Requirements. There are numerous federal and state laws and regulations related to the privacy and security of personal health information. In particular, regulations promulgated pursuant to HIPAA established privacy and security standards that limit the use and disclosure of individually identifiable health information and require the implementation of administrative, physical and technological safeguards to ensure the confidentiality, integrity and availability of individually identifiable health information in electronic form. Health plans, healthcare clearinghouses and most providers are considered by the
17
Table of Contents
HIPAA regulations to be “Covered Entities.” With respect to our operations, we are a Business Associate of our health plan customers and we are directly subject to the privacy and security regulations established under HIPAA. We enter into written Business Associate Agreements with our customers, under which we are required to safeguard individually identifiable health information and comply with restrictions on how we may use and disclose such information. Effective February 2010, the American Recovery and Reinvestment Act of 2009, or ARRA, and effective March 2013, the HIPAA Omnibus Final Rules extended the direct application of certain provisions of the Privacy Standards and Security Standards to us when we are functioning as a Business Associate of our health plan customers. ARRA and the HIPAA Omnibus Final Rule also subject Business Associates to direct oversight and audit by the HHS.
Violations of the Privacy Standards and Security Standards might result in civil and criminal penalties, and ARRA increased the penalties for HIPAA violations and strengthened the enforcement provisions of HIPAA. For example, ARRA authorizes state attorneys general to bring civil actions seeking either injunctions or damages in response to violations of Privacy Standards and Security Standards that threaten the privacy of state residents. Additionally, some health plans interpret HIPAA requirements differently than we do, and as our customers are the Covered Entity under HIPAA we may be required to comply with their interpretations.
We might not be able to adequately address the business risks created by HIPAA implementation. Furthermore, we are unable to predict what changes to HIPAA or other laws or regulations might be made in the future or how those changes could affect our business or the costs of compliance.
In addition to the Privacy Standards and Security Standards, most states have enacted patient confidentiality laws that protect against the disclosure of confidential medical and/or health information, and many states have adopted or are considering further legislation in this area, including privacy safeguards, security standards and data security breach notification requirements. Such state laws, if more stringent than HIPAA requirements, are not preempted by the federal requirements and we are required to comply with them. Additionally, other laws or standards may apply to our operations, including requirements related to handling certain financial information, federal tax information, or FTI, and payment card association operating rules with respect to credit card data.
Failure by us to comply with any state standards regarding patient privacy may subject us to penalties, including civil monetary penalties and, in some circumstances, criminal penalties. Such failure may injure our reputation and adversely affect our ability to retain customers and attract new customers.
Medicare and Medicaid Regulatory Requirements
We have contracts with insurance health plans who offer Medicare Managed Care (also known as Medicare Advantage or Medicare Part C) and Medicaid managed care plans. We also have contracts with insurance health plans who offer Medicare prescription drug benefits (also known as Medicare Part D) plans. The activities of the Medicare plans are regulated by CMS, and Medicaid is regulated at both the state and federal level. Though our health plan customers remain responsible to comply with CMS and other regulatory requirements, we operate as a First Tier, Downstream & Related Entity, or FDR, in support of our Medicare customers. Some of the activities that we might perform, such as the enrollment of beneficiaries, may be subject to CMS and/or state regulation, and such regulations may force us to change the way we do business or otherwise restrict our ability to provide services to such plans. Moreover, the regulatory environment with respect to these programs has become, and will likely continue to become, increasingly complex.
Financial Services-Related Laws and Rules
Financial services and electronic payment processing services are subject to numerous laws, regulations and industry standards, some of which might impact our operations and subject us, our vendors and our customers to liability as a result of the solutions we offer. In addition, our solutions might be impacted by payment card
18
Table of Contents
association operating rules, certification requirements and rules governing electronic funds transfers. If we fail to comply with applicable payment processing rules or requirements, we might be subject to fines and changes in transaction fees and may lose our ability to process credit and debit card transactions or facilitate other types of billing and payment solutions. Moreover, payment transactions processed using the Automated Clearing House Network, or ACH, are subject to network operating rules promulgated by the National Automated Clearing House Association and to various federal laws regarding such operations, including laws pertaining to electronic funds transfers, and these rules and laws might impact our billing and payment solutions.
Insurance Broker Laws
Insurance laws in the United States are often complex, and states have broad authority to adopt regulations regarding brokerage activities. These regulations typically include the licensing of insurance brokers and agents and govern the handling and investment of customer funds held in a fiduciary capacity. We and our broker/agency customers may be subject to some of these regulations, and may not be able to fully comply.
ERISA and Third-Party Administrator Laws
The Employee Retirement Income Security Act of 1974, as amended, or ERISA, regulates how employee benefits are provided to or through certain types of employer-sponsored health benefits plans. ERISA is a set of laws and regulations that is subject to periodic interpretation by the United States Department of Labor as well as the federal courts. We believe that our current operations do not render us subject to ERISA fiduciary obligations, and therefore any such compliance does not currently have a material adverse effect on our operations. However, there can be no assurance that continuing ERISA compliance efforts or any future changes to ERISA will not have a material adverse effect on us.
Numerous states in which we do business have adopted regulations governing entities engaged in third-party administrator, or TPA, activities. TPA regulations typically impose requirements regarding enrollment into benefits plans, claims processing and payments and the handling of customer funds. Although we do not believe we are currently acting as a TPA, changes in state regulations could result in us being obligated to comply with such regulations, which might require us to obtain licenses to provide TPA services in such states.
Legal Proceedings
From time to time, we have become involved in legal or regulatory proceedings arising in the ordinary course of our business. We are not currently a party to any material litigation or regulatory proceeding and we are not aware of any pending or threatened litigation or regulatory proceeding against us that could have a material adverse effect on our business, operating results, financial condition or cash flows.
Employees
As of December 31, 2014, we had 427 employees, all of whom are based in the United States. We consider our current relationship with our employees to be good. None of our employees is represented by a labor union or is a party to a collective bargaining agreement.
Quarterly Trends and Seasonality
Our overall operating results fluctuate from quarter to quarter as a result of a variety of factors, some of which are out of our control. These fluctuations are primarily driven by an increase in the third and fourth quarters in activity at our customers in preparation for and during the annual insurance enrollment cycle, which occurs annually during our fourth quarter. Our historical results should not be considered a reliable indicator of our future results of operations.
19
Table of Contents
Available Information
Our Internet address is www.connecture.com and our investor relations website is located at http://investors.connecture.com. We make available free of charge on our investor relations website under the headings “Financials” and “SEC Filings” our Annual Reports on Form 10-K, Quarterly Reports on Form 10-Q, Current Reports on Form 8-K and amendments to those reports as soon as reasonably practicable after such materials are electronically filed with (or furnished to) the SEC. Information contained on our websites is not incorporated by reference into this Annual Report on Form 10-K. In addition, the public may read and copy materials we file with the SEC at the SEC’s Public Reference Room at 100 F Street, NE, Washington, DC 20549. The public may obtain information on the operation of the Public Reference Room by calling the SEC at 1-800-SEC-0330. In addition, the SEC maintains an Internet site, www.sec.gov, that includes filings of and information about issuers that file electronically with the SEC.
Our business, prospects, financial condition or operating results could be materially adversely affected by any of these risks, as well as other risks not currently known to us or that are currently considered immaterial. The trading price of our common stock could decline due to any of the risks and uncertainties described below, and you may lose all or part of your investment. In assessing these risks, you should also refer to the other information contained in this Annual Report on Form 10-K, including our consolidated financial statements and related notes.
Risks Related to Our Business
We have had a history of losses and we may be unable to achieve or sustain profitability.
We experienced a net loss of $10.2 million, $26.4 million and $16.8 million in 2014, 2013 and 2012, respectively. We cannot predict if we will achieve profitability in the near future or at all. We expect to make significant future expenditures to develop and expand our business. Our recent growth in revenue may not be sustainable, and we might not achieve sufficient revenue to achieve or maintain profitability. We may incur significant losses in the future for a number of reasons, including the other risks described in this Annual Report on Form 10-K, and we may encounter unforeseen expenses, difficulties, complications and delays and other unknown events. Accordingly, we may not be able to achieve or maintain profitability, and we may incur significant losses for the foreseeable future.
Failure to manage our growth effectively could increase our expenses, decrease our revenue and prevent us from implementing our business strategy.
We have been experiencing a period of growth, which puts strain on our business. To manage this and our anticipated future growth effectively, we must continue to maintain and enhance our information technology infrastructure, financial and accounting systems and controls. We also must attract, train and retain a significant number of qualified software engineers, technical and management personnel, sales and marketing personnel, customer support personnel and professional services personnel. Failure to effectively manage our rapid growth could lead us to over-invest or under-invest in development and operations, result in weaknesses in our infrastructure, systems or controls, give rise to operational mistakes, losses, loss of productivity or business opportunities and result in loss of employees and reduced productivity of remaining employees. Our growth could require significant capital expenditures and might divert financial resources from other projects such as the development of new products and services. If our management is unable to effectively manage our growth, our expenses might increase more than expected, our revenue could decline or might grow more slowly than expected, and we might be unable to implement our business strategy. The quality of our products and services might suffer, which could negatively affect our reputation and harm our ability to retain and attract customers.
20
Table of Contents
The market for health insurance exchanges in the United States is relatively undeveloped, rapidly evolving and volatile, which makes it difficult to forecast adoption rates and demand for our solutions. If the market does not develop or develops more slowly than we expect, or if individuals, brokers or health plans select more traditional or alternative channels for the purchase and sale of health insurance, it could have a material adverse effect on our business and results of operations.
The market for health insurance exchanges in the United States is relatively undeveloped, rapidly evolving and volatile. Accordingly, our future financial performance will depend in part on growth in this market and on our ability to adapt to emerging demands and trends in this market. Demand for our exchange solutions has been driven in large part by recent regulatory changes, broader use of the Internet, shifts from group plans to the purchase of individual plans and advances in technology. It is difficult to predict, with any precision, adoption rates or the future growth rate and size of our target market. The market for health insurance sales automation software is relatively new and unproven, and it is uncertain whether it will achieve and sustain high levels of demand and market acceptance. The volatility and rapidly evolving nature of the market in which we operate, as well as other factors that are beyond our control, reduces our ability to accurately evaluate our long-term outlook and forecast annual performance.
Additionally, our success depends in part upon widespread individual and health plan acceptance of the Internet as a shopping platform and marketplace for the purchase and sale of health insurance. Individuals, employers, employees and health plans may choose to depend on more traditional sources, such as individual agents, or alternative sources may develop, including as a result of significant reforms to healthcare legislation through the Patient Protection and Affordable Care Act, or PPACA, and the Healthcare and Education Reconciliation Act of 2010, or HCERA, which we refer to collectively as Healthcare Reform.
A reduction in demand for health insurance exchanges caused by lack of acceptance, technological challenges, competing solutions or as a result of individuals, brokers or health plans determining that other distribution channels for health insurance are superior to ours would have a material adverse effect on our business, growth, results of operations and financial condition.
Our estimate of the market size for our solutions may prove to be inaccurate, and even if the market size is accurate, we cannot assure you that our business will serve a significant portion of the market.
Our estimate of the market size for our solutions is subject to significant uncertainty and is based on assumptions and estimates, including our internal analysis and industry experience, which may not prove to be accurate. Our ability to serve a significant portion of this estimated market is subject to many factors, including our success in implementing our business strategy, which is subject to many risks and uncertainties. Accordingly, even if our estimate of the market size is accurate, we cannot assure you that our business will serve a significant portion of this estimated market for our solutions.
We operate in the highly competitive software industry. If we are not able to compete effectively, our business and operating results will be harmed.
The software market is highly competitive and is likely to attract increased competition, which could make it hard for us to succeed. Small, specialized providers continue to become more sophisticated and effective. In addition, large, well-financed, and technologically sophisticated software companies might focus more on our market. The size and financial strength of these entities is increasing as a result of continued consolidation in both the IT and health insurance industries. We expect large integrated software companies to become more active in our market, both through acquisitions and internal investment. As costs fall and technology improves, increased market saturation might change the competitive landscape in favor of our competitors.
Some of our current competitors have greater name recognition, longer operating histories, and significantly greater resources than we do. As a result, our competitors might be able to respond more quickly and effectively
21
Table of Contents
than we can to new or changing opportunities, technologies, standards, or customer requirements. In addition, current and potential competitors have established, and might in the future establish, cooperative relationships with vendors of complementary products, technologies, or services to increase the availability of their products in the marketplace. Accordingly, new competitors or alliances might emerge that have greater market share, a larger customer base, more widely adopted proprietary technologies, greater marketing expertise, greater financial resources and larger sales forces than we have, which could put us at a competitive disadvantage. Further, in light of these advantages, even if our products and services are more effective than those of our competitors, current or potential customers might accept competitive offerings in lieu of purchasing our offerings. Increased competition is likely to result in pricing pressures, which could negatively impact our sales, profitability or market share. In addition to new niche vendors, who offer stand-alone products and services, we face competition from existing enterprise vendors, including those currently focused on software solutions that have information systems in place with potential customers in our target market. These existing enterprise vendors might promise products or services that offer ease of integration with existing systems and which leverage existing vendor relationships. In addition, large health plans often have internal technology staffs and proprietary software for benefits and distribution management, making them less likely to buy our solutions.
If our existing customers do not continue or renew their agreements with us, renew at lower fee levels or decline to license additional software or purchase additional applications and services from us, it could have a material adverse effect on our business and operating results.
We derive a significant portion of our revenue from renewal of existing customer agreements and sales of additional software and services to existing customers and expect to continue to do so. As a result, achieving a high renewal rate of our customer agreements and selling additional software and services is critical to our future operating results.
We generally sell our software and services pursuant to agreements for terms of multiple years. Our customers may choose not to renew these contracts after the initial contract period expires. Additionally, some of our customers are able to terminate their respective contracts without cause or for convenience at any time. We may not be able to accurately predict future trends in customer renewals, and our customers’ renewal rates may decline or fluctuate. Without the continuance or renewal of our customer contracts our business and operating results may suffer.
Factors that may affect the renewal rate for our existing contracts, and our ability to sell additional applications and services, include:
| • | the price, performance and functionality of our offering; |
| • | the availability, price, performance and functionality of competing solutions; |
| • | our ability to develop complementary applications and services; |
| • | our continued ability to access the pricing and other data necessary to enable us to deliver reliable offerings to customers; |
| • | the stability, performance and security of our hosting infrastructure and hosting services; |
| • | changes in healthcare laws, regulations or trends; and |
| • | the business environment of our customers. |
If any of our customers terminate or do not renew their contracts for our services, renew on less favorable terms, or do not purchase additional functionality or software, our revenue may grow more slowly than expected or decline, and our profitability and gross margins may be harmed.
22
Table of Contents
A significant amount of our revenue is derived from a limited number of customers, and any reduction in revenue from any of these customers could have a material adverse effect on our business.
Our ten largest customers by revenue in the past two years accounted for 56.9% and 49.1% of our consolidated revenue in 2014 and 2013, respectively. If any of our key customers decides not to renew its contracts with us, or to renew on less favorable terms, our business, revenue, reputation, and our ability to obtain new customers could be materially and adversely affected. Except for one customer, none of our customers exceeded 10% of our revenue in 2014 or 2013. Contracts related to the Maryland Health Benefit Exchange accounted for 11.8% of our 2014 revenue due in part to the termination of the exchange contract with the prime contractor, Noridian Healthcare Solutions, LLC, and our recognition of the accompanying previously deferred in-process revenue.
We have experienced quarterly fluctuations, and expect to continue to experience quarterly fluctuations, in our operating results due to a number of factors, including the seasonality of our revenue, the sales and implementation cycles for our products and services and other factors, that make our future results difficult to predict and could cause our operating results to fall below expectations.
Our business is subject to seasonal fluctuations and our operating results are traditionally strongest in the fourth quarter of each year as a result of the open enrollment period established by PPACA. Therefore, our stock price might be based on expectations of future performance that we might not meet and, if our revenue or operating results fall below the expectations of investors or securities analysts, the price of our common stock could decline substantially.
The sales cycle for our products and services can vary from, on average, two to four months for our cloud-based solutions, and from four to 12 or more months for our enterprise solutions, from initial contact to contract execution. After a customer contract is signed, we provide an implementation process for the customer which typically ranges from two to four months for our cloud-based implementations and from three to 15 months for complex enterprise implementations, each from contract execution to completion of implementation. As a result, the period of time between contract signing and recognition of associated revenue may be lengthy, and we are not able to predict with certainty the period in which implementation will be completed.
During the sales and implementation cycles for our enterprise segments, we expend substantial time and effort, and incur significant additional operating expenses, but accounting principles do not allow us to recognize the resulting revenue until implementation is complete and the services are available for use by our customers, at which time we begin recognition of implementation revenue over the life of the contract or the expected life of the customer relationship, whichever is longer. Unanticipated difficulties and delays in implementation might arise as a result of failure by us or our customers to complete one or more of our or their respective responsibilities and, if implementation periods are extended or implementations are cancelled, revenue recognition could be delayed or fail to occur.
Our operating results have varied in the past. In addition to the other risk factors listed in this section, some of the important factors that may cause fluctuations in our quarterly operating results include:
| • | the extent to which our products and services achieve or maintain market acceptance; |
| • | our ability to introduce new products and services and enhancements to our existing products and services on a timely basis; |
| • | new competitors and the introduction of enhanced products and services from competitors; |
| • | the financial condition of our current and potential customers; |
| • | changes in customer budgets and procurement policies; |
| • | the amount and timing of our investment in research and development activities; |
| • | technical difficulties with our products or interruptions in our services; |
23
Table of Contents
| • | our ability to hire and retain qualified personnel, including the rate of expansion of our sales force; |
| • | changes in the regulatory environment related to benefits and healthcare; |
| • | regulatory compliance costs; |
| • | the timing, size and ability to successfully integrate potential future acquisitions; and |
| • | unforeseen legal expenses, including litigation and settlement costs. |
In addition, a significant portion of our operating expense is relatively fixed in nature, and planned expenditures are based in part on expectations regarding future revenue. Accordingly, unexpected revenue shortfalls might decrease our gross margins and could cause significant changes in our operating results from quarter to quarter. If this occurs, the trading price of our common stock could fall substantially, either suddenly or over time.
In the event that our proprietary software does not operate properly, our reputation would suffer, claims would likely be asserted against us, and we would likely be required to divert our resources from other purposes, any of which could have a material adverse effect on our business.
Proprietary software development is time-consuming, expensive and complex. We may experience difficulties with software development, industry standards, design or marketing that could delay or prevent the development, introduction, or implementation of new solutions and enhancements. If our solutions do not function reliably or fail to achieve customer expectations in terms of performance, customers could assert liability claims against us and/or attempt to cancel their contracts with us. This could damage our reputation and impair our ability to attract or maintain customers.
Moreover, software as complex as ours has in the past contained, and may in the future contain, or develop, undetected defects or errors. Material performance problems or defects in our products and services might arise in the future. Errors might result from the interface of our services with legacy systems and data, which we did not develop and the function of which is outside of our control. Defects or errors might arise in our existing or new software or service processes. Because changes in health plan and legal requirements and practices relating to health insurance are frequent, we are continuously discovering defects and errors in our software and service processes compared against these requirements and practices. These defects and errors and any failure by us to identify and address them could result in loss of enrollment by our customers, loss of revenue or market share, liability to customers or others, failure to achieve market acceptance or expansion, diversion of development and other resources, injury to our reputation, and increased service and maintenance costs. Defects or errors in our product or service processes might discourage existing or potential customers from purchasing services from us. Correcting defects or errors could prove to be impossible or impracticable. The costs incurred in correcting any defects or errors or in responding to resulting claims or liability might be substantial and could adversely affect our operating results.
Our customers might assert claims against us in the future alleging that they suffered damages due to a defect, error, or other failure of our product or service processes. A claim could subject us to significant legal defense costs and adverse publicity regardless of the merits or eventual outcome of such claim.
If our transition from our current technology platforms to new platforms does not occur rapidly or as efficiently as anticipated, it could have a material adverse effect on our business and results of operations.
We are expanding our cloud-based software-as-a-service, or SaaS, offerings, including building new shared capabilities such as consumer shopping and personalization. Our ability to (i) complete that development and (ii) efficiently transition existing enterprise-platform customers to new cloud-based components is important to our future operating results. We are also investing in platform delivery improvements that will lower our cost of implementation and configuration and improve competitiveness. Our SaaS business model depends heavily on
24
Table of Contents
achieving economies of scale because the initial upfront investment is costly and the associated revenue is recognized on a ratable basis. If we fail to achieve efficient transitions, improvements to our capabilities, appropriate economies of scale or if we fail to manage or anticipate the evolution and demand of the SaaS pricing model, then our business and operating results will be adversely affected.
If we do not continue to provide innovative products and services, along with high quality support services, that are useful to our customers and consumers of insurance products, we might not remain competitive and our newer solutions may not be adopted by new and existing customers, which would have a material adverse effect on our business and results of operations.
Our success depends in part on our ability to successfully develop and sell innovative products and services that health insurance plans and brokers and their customers will utilize. We must continue to invest significant resources in research and development in order to enhance our existing products and services and introduce new high quality products and services that customers will want. If we are unable to predict preferences of our customers or consumers or industry changes, or if we are unable to modify our products and services on a timely basis, we might lose customers. Our operating results would also suffer if our innovations are not responsive to the needs of our customers, are not appropriately timed with market opportunity, or are not effectively brought to market. As technology continues to develop, our competitors might be able to offer results that are, or that are perceived to be, substantially similar to or better than those generated by us. This would force us to compete on additional product and service attributes and to expend significant resources in order to remain competitive.
Our success also depends on providing high quality support services to resolve any issues related to our products and services. High quality education and customer support are important for the successful marketing and sale of our products and services and for the renewal of existing customers. If we do not help our customers quickly resolve issues and provide effective ongoing support, our ability to sell additional products and services to existing customers would suffer and our reputation with existing or potential customers would be harmed.
We rely on data center providers, Internet infrastructure, bandwidth providers, third-party computer hardware and software, other third parties, and our own systems for providing services to our customers, and any failure of or interruption in the services provided by these third parties or our own systems could expose us to litigation and may negatively impact our relationships with customers, adversely affecting our brand and our business.
We currently serve our customers from two data centers, one located in Atlanta, Georgia and the other located in El Segundo, California. While we control and have access to our servers, we do not control the operation of these facilities. The owners of our data center facilities have no obligation to renew their agreements with us on commercially reasonable terms, or at all. With respect to the provision of core services, our two data center agreements have remaining terms of approximately one year, and the agreements provide for either automatic renewal or routine annual renewal unless terminated by one of the parties. If we are unable to renew these agreements on commercially reasonable terms, or if one of our data center operators is acquired, we may be required to transfer our servers and other infrastructure to new data center facilities, and we may incur significant costs and possible service interruption in connection with doing so. Problems faced by our third-party data center locations, with the telecommunications network providers with whom we or they contract, or with the systems by which our telecommunications providers allocate capacity among their customers, including us, could adversely affect the experience of our customers. Our third-party data centers operators could decide to close their facilities without adequate notice. In addition, any financial difficulties, such as bankruptcy faced by our third-party data centers operators or any of the service providers with whom we or they contract may have negative effects on our business, the nature and extent of which are difficult to predict.
In addition, our ability to deliver our web-based services depends on the development and maintenance of the infrastructure of the Internet by third parties. This includes maintenance of a reliable network backbone with the necessary speed, data capacity, bandwidth capacity and security. Our services are designed to operate without
25
Table of Contents
interruption in accordance with our service level commitments. However, we have experienced and expect that we will experience future interruptions and delays in services and availability from time to time. In the event of a catastrophic event with respect to one or more of our systems, we may experience an extended period of system unavailability, which could negatively impact our relationship with customers. To operate without interruption, both we and our service providers must guard against:
| • | damage from fire, power loss, natural disasters and other force majeure events outside our control; |
| • | communications failures; |
| • | software and hardware errors, failures and crashes; |
| • | security breaches, computer viruses, hacking, denial-of-service attacks and similar disruptive problems; and |
| • | other potential interruptions. |
We also rely on purchased or leased computer hardware and software licensed from third parties in order to offer our services. These licenses are generally commercially available on varying terms. However, it is possible that this hardware and software might not continue to be available on commercially reasonable terms, or at all. Any loss of the right to use any of this hardware or software could result in delays in the provisioning of our services until equivalent technology is either developed by us, or, if available, is identified, obtained and integrated.
We exercise limited control over third-party vendors, which increases our vulnerability to problems with technology and information services they provide. Interruptions in our network access and services might in connection with third-party technology and information services reduce our revenue, cause us to issue refunds to customers for prepaid and unused subscription services, subject us to potential liability, or adversely affect our renewal rates. Although we maintain insurance for our business, the coverage under our policies might not be adequate to compensate us for all losses that may occur. In addition, we might not be able to continue to obtain adequate insurance coverage at an acceptable cost, if at all.
Various events could interrupt customers’ access to our platform, exposing us to significant costs.
The ability to access our platform is critical to our customers. Our operations and facilities are vulnerable to interruption and/or damage from a number of sources, many of which are beyond our control, including, without limitation: (i) power loss and telecommunications failures, (ii) fire, flood, hurricane, and other natural disasters, (iii) software and hardware errors, failures or crashes in our own systems or in other systems, (iv) computer viruses, denial-of-service attacks, hacking and similar disruptive problems in our own systems and in other systems, and (v) civil unrest, war, and/or terrorism. We have implemented various measures to protect against interruptions of customers’ access to our platform. If customers’ access is interrupted because of problems in the operation of our facilities, we could be exposed to significant claims by customers. Our plans for disaster recovery and business continuity rely on third-party providers of related services. If those vendors fail us at a time when our systems are not operating correctly, we could incur a loss of revenue and liability for failure to fulfill our obligations. Any significant instances of system downtime could negatively affect our reputation and ability to retain customers and sell our services, which would adversely impact our revenue.
If our security measures are breached or fail, and unauthorized persons gain access to customers’ and consumers’ data, our products and services might be perceived as being unsecure, customers and consumers might curtail or stop using our products and services, and we might incur significant liabilities.
Our products and services involve the collection, processing, storage and transmission of customers’ and consumers’ confidential information, which may include sensitive individually identifiable information that is subject to stringent statutory and regulatory obligations. Because of the sensitivity of this information, security features of our software and applications are very important. From time to time we may detect vulnerabilities in our systems, which, even if they do not result in a security breach, may reduce customer confidence and require
26
Table of Contents
substantial resources to address. If our security measures or those of our third-party service providers are breached or fail and/or are bypassed as a result of third-party action, employee error, malfeasance, or otherwise, someone might be able to obtain unauthorized access to our customers’ confidential information and/or patient data. As a result, our reputation could be damaged, our business might suffer, and we could face damages for contract breach, penalties for violation of applicable laws or regulations, and significant costs for remediation efforts to prevent future occurrences.
In addition, we rely on various third parties, including health plans, brokers and other third-party service providers and consumers themselves, as users of our system, for key activities to protect and promote the security of our systems and the data and information accessible within them, such as enrollment information, consumer status changes and payment. On occasion, certain individuals have failed to perform these activities. For example, authorized users have failed to administer and use the login/password appropriately, which may allow the system to be accessed by unauthorized third parties. When we become aware of such breaches or incidents, we work with our customers to remedy the issue, terminate inappropriate access as necessary, and provide additional instruction in order to avoid the reoccurrence of such problems. Although to date these breaches have not resulted in claims against us or in material harm to our business, failures to perform these activities might result in claims against us, which could expose us to significant expense, legal liability, and harm to our reputation, which might result in loss of business.
Our security measures, and those of our third-party service providers, may not detect or prevent all attempts to hack our systems, denial-of-service attacks, viruses, malicious software, security breaches or other attacks and similar disruptions that may jeopardize the security of information stored in or transmitted by our sites, networks and systems or that we or our third-party service providers otherwise maintain, including payment card systems which may subject us to fines or higher transaction fees or limit or terminate our access to certain payment methods. Because techniques used to obtain unauthorized access or to sabotage systems change frequently and generally are not recognized until launched against a target, we and our hosting service providers might not be able to detect or prevent these techniques or to implement adequate preventive measures until after the techniques or other attacks have already been launched. If an actual or perceived breach of our security or that of our hosting service providers occurs, the market perception of the effectiveness of our security measures could be harmed and we could lose sales and customers. In addition, our customers might authorize or enable third parties to access their information and data that is stored on our systems. Because we do not control such access, we cannot ensure the complete integrity or security of such data in our systems.
For a more detailed discussion of the risks associated with a failure by us to comply with any of the federal and state standards regarding patient privacy, identity theft prevention and detection and data security, see the risk factor below under “—Risks Related to Regulation—The healthcare and health insurance industries are heavily regulated. Our failure to comply with regulatory requirements could create liability for us, result in adverse publicity and negatively affect our business.”
Our substantial level of indebtedness could adversely affect our ability to raise additional capital to fund our operations, limit our ability to react to changes in the economy or our industry, expose us to interest rate risk to the extent of our variable rate debt and prevent us from meeting obligations on our indebtedness.
We have a substantial amount of indebtedness. As of December 31, 2014, our total indebtedness was $53.1 million. Our substantial level of indebtedness could adversely affect our financial condition and increase the possibility that we may be unable to generate cash sufficient to pay, when due, the principal, interest or other amounts due in respect of our indebtedness. Our substantial indebtedness, combined with our other existing and any future financial obligations and contractual commitments, could have important adverse consequences. For example, it could:
| • | make it more difficult for us to satisfy our obligations with respect to our indebtedness, including making interest payments on our debt obligations, and any failure to comply with the obligations under any of our debt instruments, including restrictive covenants, could result in an event of default under the agreements governing such indebtedness; |
27
Table of Contents
| • | require us to dedicate a substantial portion of our cash flow from operations to payments on our indebtedness, thereby reducing funds available for working capital, capital expenditures, selling and marketing efforts, research and development and other purposes; |
| • | cause us to incur substantial fees from time to time in connection with debt amendments or refinancing; |
| • | increase our exposure to rising interest rates because a portion of our borrowings is at variable interest rates; |
| • | place us at a disadvantage compared to our competitors that have less debt; |
| • | limit our ability to pursue acquisitions; |
| • | limit our flexibility in planning for, or reacting to, changes in our business and the health insurance industry; |
| • | limit our ability to borrow additional funds, or to dispose of assets to raise funds, if needed, for working capital, capital expenditures, acquisitions, selling and marketing efforts, research and development and other corporate purposes; and |
| • | increase our vulnerability to adverse economic and industry conditions, which could place us at a competitive disadvantage compared to our competitors that have relatively less indebtedness. |
See the section titled “Liquidity and Capital Resources—Senior Credit Facility” for a description of our bank credit facility.
We might require additional capital to support business growth, and this capital might not be available.
We intend to continue to make investments to support our business growth and might require additional funds to respond to business challenges or opportunities, including the need to develop new products and services or enhance our existing services, enhance our operating infrastructure, and acquire complementary businesses and technologies. Accordingly, we might need to engage in equity or debt financings to secure additional funds. If we raise additional funds through new issuances of equity or convertible debt securities, our existing stockholders could suffer significant dilution, and any new equity securities we issue could have rights, preferences and privileges superior to those of holders of our common stock. Any debt financing secured by us in the future could involve restrictive covenants relating to our capital-raising activities and other financial and operational matters, which might make it more difficult for us to obtain additional capital and to pursue business opportunities, including potential acquisitions. In addition, we might not be able to obtain additional financing on terms favorable to us, if at all. If we are unable to obtain adequate financing or financing on terms satisfactory to us when we require it, our ability to continue to support our business growth and to respond to business challenges could be significantly limited.
Because we recognize revenue and expense relating to delivery of software, transaction fees and professional services over varying periods, downturns or upturns in sales are not immediately reflected in full in our operating results.
We recognize recurring revenue monthly over the term of our contracts and recognize the majority of our professional services revenue ratably over the contract term or the estimated expected life of the customer relationship, whichever is longer. As a result, a portion of the revenue we report each quarter is the recognition of deferred revenue from contracts we entered into during previous quarters. Consequently, a shortfall in demand for our software solutions and professional services or a decline in new or renewed contracts in any one quarter might not significantly reduce our revenue for that quarter, but could negatively affect our revenue in future quarters. Accordingly, the effect of significant downturns in new or renewed sales of our products and services is not reflected in full in our results of operations until future periods. Our revenue recognition model also makes it difficult for us to rapidly increase our revenue through additional sales in any period, because revenue from new
28
Table of Contents
customers must be recognized over the applicable term of the contracts or the estimated expected life of the customer relationship period, whichever is longer. In addition, we recognize professional services expenses as incurred, which could cause professional services gross margin to be negative.
We have recorded a significant amount of goodwill, intangible assets and deferred implementation costs. We may need to record write-downs from future impairments of these assets, which could adversely affect our costs and business operations.
Our consolidated balance sheet includes significant goodwill, intangible assets and deferred implementation costs, including $26.8 million in goodwill, $15.4 million in other intangible assets and $24.6 million of deferred implementation costs, together representing approximately 59% of our total assets as of December 31, 2014. The determination of related estimated useful lives and whether these assets are impaired involves significant judgments and our ability to accurately predict future cash flows related to these intangible assets may not be accurate. We test our goodwill for impairment each fiscal year, but we also test goodwill, other intangible assets and deferred implementation costs for impairment at any time when there is a change in circumstances that indicates that the carrying value of these assets may be impaired. Any future determination that these assets are carried at greater than their fair value could result in substantial non-cash impairment charges, which could significantly impact our reported operating results.
If we are required to collect sales and use taxes in additional jurisdictions, we might be subject to liability for additional sales and use taxes and our future sales may decrease.
We might incur significant expenses, and, as a result, lose sales, if states successfully impose broader guidelines on state sales and use taxes or successfully argue that current guidelines apply to us. We currently collect sales and use tax in a limited number of states. A successful assertion by one or more states requiring us to collect sales or other taxes on the licensing of our software or sale of our services could result in substantial tax liabilities for past transactions and otherwise harm our business. Each state has different rules and regulations governing sales and use taxes, and these rules and regulations are subject to varying interpretations that change over time. We review these rules and regulations periodically and, when we believe we are subject to sales and use taxes in a particular state, voluntarily engage with state tax authorities in order to determine how to comply with their rules and regulations. We cannot assure you that we will not be subject to sales and use taxes or related interest and penalties for past sales or use taxes in states where we currently believe no such taxes are required.
Vendors of services, like us, are typically held responsible by taxing authorities for the collection and payment of any applicable sales and similar taxes. If one or more taxing authorities determines that taxes should have, but have not, been paid with respect to our services, we might be liable for past taxes in addition to taxes going forward. Liability for past taxes might also include substantial interest and penalty charges. Our customer contracts typically provide that our customers must pay all applicable sales and similar taxes. Nevertheless, our customers might be reluctant to pay back taxes and might refuse responsibility for interest or penalties associated with those taxes. If we are required to collect and pay back taxes and the associated interest and penalties, and if our customers fail or refuse to reimburse us for all or a portion of these amounts (or if we decline to seek reimbursement from our clients), we will incur unplanned expenses that may be substantial. Moreover, imposition of such taxes on us going forward will effectively increase the cost of our software and services to our customers and might adversely affect our ability to retain existing customers or to gain new customers in the areas in which such taxes are imposed.
We might not be able to utilize a significant portion of our net operating loss or other tax credit carryforwards, which could adversely affect our future operating cash flows.
As of December 31, 2014, we had federal and state net operating loss carryforwards due to prior period losses, which if not utilized, will begin to expire in 2020. These carryforwards could expire unused and be unavailable to offset future income tax liabilities, which could adversely affect our future operating cash flows.
29
Table of Contents
In addition, under Section 382 of the Internal Revenue Code of 1986, as amended, our ability to utilize net operating loss carryforwards or other tax attributes in any taxable year may be limited if we experience an “ownership change.” A Section 382 “ownership change” generally occurs if one or more stockholders or groups of stockholders who own at least 5% of our stock increase their collective ownership by more than 50 percentage points over their lowest ownership percentage within a rolling three-year period. Similar rules might apply under state tax laws. As a result of prior equity issuances and other transactions in our stock, we have previously experienced “ownership changes” under Section 382 which limit the amount of net operating losses available to us. Future issuances and other transactions in our stock may cause an additional “ownership change.” Accordingly, the application of Section 382 could have a material effect on the use of our net operating loss carryforwards or other tax attributes, which could adversely affect our future operating cash flows.
As of December 31, 2014 and 2013, we have recorded a full valuation allowance against net operating loss carryforwards, because we believe it is more likely than not that some portion or all of these deferred tax assets will not be realized.
Failure to adequately expand our direct sales force will impede our growth.
We believe that our future growth will depend on the continued expansion of our direct sales force and its ability to obtain new customers and sell additional products and services to existing customers. Identifying and recruiting qualified personnel and training them in the use of our software requires significant time, expense, and attention. It can take up to six months or longer before a new sales representative is fully trained and productive. Our business may be adversely affected if our efforts to expand and train our direct sales force do not generate a corresponding increase in revenue. In particular, if we are unable to hire and develop sufficient numbers of productive direct sales personnel or if new direct sales personnel are unable to achieve desired productivity levels in a reasonable period of time, sales of our products and services will suffer and our growth will be impeded.
Our government business relies on working effectively with the prime contractors that hold the contract with the government customers and those contracts being renewed or extended, as applicable. To the extent those relationships are not positively maintained or such contracts, such as our subcontract in connection with the Centers for Medicare and Medicaid Services, or CMS, contract, are not renewed or extended, it could have a material adverse effect on our business.
In our government business to date, we have only worked as a subcontractor to prime contractors and systems integrators that contract directly with the federal government and state governments. In the scope of these relationships, we have provided specified components of the applicable government entity’s overall request, but have not assumed responsibility for the operation of the government websites. Based on our risk analysis of multiple factors, including the scope of the government entity’s request, the total potential contract value and the terms and conditions of the applicable contract, we have determined that operating in a subcontractor role has been most appropriate for our government business. It may or may not be more beneficial for us to contract directly with the government due to various factors including insurance, risk and liability issues. In order to secure government business, it is important that we identify and market our capabilities to the prime contractor community, participate on joint requests for proposals, and maintain effective working relationships throughout the term of the contract.
In many cases, payment for our products and services is dependent upon the prime contractor getting paid by the government customer. As such, we may not be paid on a timely basis or at all if the prime contractor or other subcontractors have not completed their work.
30
Table of Contents
We use staff contracting firms located internationally or that source their resources from outside the United States to augment our employee base and assist in the development, distribution and delivery of our solutions. Future work with these firms might expose us to risks that could have a material adverse effect on our business.
We use staff contracting firms (both onshore and offshore) to scale up or down based on customer needs, work across various time zones to meet speed to market requirements, and lower our total cost of delivery. For over nine years, we have used staff contracting firms with employees located internationally. Associated risks include:
| • | operating in international markets requires significant resources and management attention and might subject us to regulatory, economic, and political risks that are different from those in the United States, including data privacy and security considerations; |
| • | ability of our vendor firms to continue to identify and staff local talent that meets our quality and turnaround requirements; |
| • | currency fluctuations which raises the price of offshore labor and does not allow us to obtain cost efficiencies; |
| • | difficulties in working with firms that staff and manage foreign operations; |
| • | weaker protection for intellectual property and other legal rights than in the United States and practical difficulties in enforcing intellectual property and other rights outside of the United States; |
| • | adverse tax consequences; and |
| • | unstable regional economic and political conditions. |
In addition, our customers may require us to staff projects with only employed or domestically-based staff. That requirement could increase our cost of delivery, which in turn could decrease our competiveness and lower our overall profitability.
Any future litigation against us could be costly and time-consuming to defend and could have a material adverse effect on our business, financial condition and results of operations.
We may become subject, from time to time, to legal proceedings and claims that arise in the ordinary course of business such as claims brought by our customers in connection with commercial disputes or employment claims made by our current or former employees. Litigation might result in substantial costs and may divert management’s attention and resources, which might seriously harm our business, overall financial condition, and operating results. We generally intend to defend ourselves vigorously; however, we cannot be certain of the ultimate outcomes of any claims that may arise in the future. Insurance might not cover such claims, might not provide sufficient payments to cover all the costs to resolve one or more such claims, and might not continue to be available on terms acceptable to us. A claim brought against us that is uninsured or underinsured could result in unanticipated costs, thereby reducing our operating results and leading analysts or potential investors to reduce their expectations of our performance, which could reduce the trading price of our stock. Additionally, certain litigation or the resolution of certain litigation may affect the availability or cost of some of our insurance coverage, which could adversely impact our results of operations and cash flows, expose us to increased risks that would be uninsured and adversely impact our ability to attract officers and directors.
We might be unable to adequately protect our intellectual property, and intellectual property claims against us could result in the loss of significant rights. Even if we are successful in enforcing our intellectual property rights, we may incur significant costs in doing so, which could have a material adverse effect on our business.
Our success depends in part upon our ability to protect our core technology and intellectual property. To accomplish this, we rely on a combination of intellectual property rights, including trademark, copyright, trade secret and other intellectual property rights, as well as customary contractual protections. Our intellectual
31
Table of Contents
property rights extend to our technologies and software applications. We also rely on intellectual property licensed from third parties. Our attempts to protect our intellectual property might be challenged by others or invalidated through administrative process or litigation. To the extent that our intellectual property and other proprietary rights are not adequately protected, third parties might gain access to our proprietary information, develop and market products or services similar to ours, or use trademarks similar to ours, each of which could materially harm our business.
From time to time, third parties have alleged, and may allege in the future that we have violated their intellectual property rights. If we are forced to defend ourselves against intellectual property infringement claims, regardless of the merit or ultimate result of such claims, we may face costly litigation, diversion of technical and management personnel, limitations on our ability to market or provide our products and services. As a result of any such dispute, we may have to:
| • | develop non-infringing technology; |
| • | pay damages or refund fees; |
| • | enter into or modify royalty or licensing agreements; |
| • | cease providing certain products or services; or |
| • | take other actions to resolve the claims. |
Moreover, if we are unable to implement one or more of the remedial actions described above, we may be prevented from continuing to offer, and our customers may be prevented from continuing to use, any of our affected products or services.
The use of open source software in our products and solutions may expose us to additional risks and harm our intellectual property rights.
Some of our products and solutions use or incorporate software that is subject to one or more open source licenses. Open source software is typically freely accessible, usable, and modifiable. Certain open source software licenses require a user who intends to distribute the open source software as a component of the user’s software to disclose publicly part or all of the source code to the user’s software. In addition, certain open source software licenses require the user of such software to make any derivative works of the open source code available to others on potentially unfavorable terms or at no cost.
The terms of many open source licenses to which we are subject have not been interpreted by United States or foreign courts. Accordingly, there is a risk that those licenses could be construed in a manner that imposes unanticipated conditions or restrictions on our ability to commercialize our solutions. In that event, we could be required to seek licenses from third parties in order to continue offering our products or solutions, to re-develop our products or solutions, to discontinue sales of our products or solutions, or to release our proprietary software code under the terms of an open source license, any of which could harm our business. Further, given the nature of open source software, it may be more likely that third parties might assert copyright and other intellectual property infringement claims against us based on our use of these open source software programs.
While we monitor the use of all open source software in our products, solutions, processes, and technology and try to ensure that no open source software is used in such a way as to require us to disclose the source code to the related product or solution when we do not wish to do so, it is possible that such use may have inadvertently occurred in deploying our proprietary solutions. In addition, if a third-party software provider has incorporated certain types of open source software into software we license from such third party for our products and solutions without our knowledge, we could, under certain circumstances, be required to disclose the source code to our products and solutions. This could harm our intellectual property position and our business, results of operations, and financial condition.
32
Table of Contents
Our confidentiality arrangements with employees and others may not adequately prevent disclosure of trade secrets and other proprietary information, and any such disclosure could have a material adverse effect on our business.
We have devoted substantial resources to the development of our technology, business operations and business plans. In order to protect our trade secrets and proprietary information, we rely in significant part on confidentiality arrangements with our employees, independent contractors, advisers and customers. These arrangements may not be effective to prevent disclosure of confidential information, including trade secrets, and may not provide an adequate remedy in the event of unauthorized disclosure of confidential information. In addition, others may independently discover trade secrets and proprietary information, and in such cases we would not be able to assert trade secret rights against such parties. The loss of trade secret protection could make it easier for third parties to compete with our products and services by copying functionality. In addition, any changes in, or unexpected interpretations of, the trade secret and other intellectual property laws may compromise our ability to enforce our trade secret and intellectual property rights. Costly and time-consuming litigation could be necessary to enforce and determine the scope of our proprietary rights, and failure to obtain or maintain trade secret protection could have a material adverse effect on our business.
If we acquire companies or technologies in the future, they could prove difficult to integrate, disrupt our business, dilute stockholder value, and adversely affect our operating results and the value of our common stock.
As part of our business strategy, we might acquire, enter into joint ventures with, or make investments in complementary companies, services, and technologies in the future. For example, in 2013, we acquired DestinationRx, Inc., or DRX. We spent considerable time, effort, and money acquiring this company and integrating it into our business. Acquisitions and investments involve numerous risks, including:
| • | difficulties in identifying and acquiring products, technologies or businesses that will help our business; |
| • | difficulties in integrating operations, technologies, services and personnel; |
| • | diversion of financial and managerial resources from existing operations; |
| • | risk of entering new markets in which we have little to no experience; and |
| • | delays in customer purchases due to uncertainty and the inability to maintain relationships with customers of the acquired businesses. |
If we fail to properly evaluate acquisitions or investments, we might not achieve the anticipated benefits of any such acquisitions, we might incur costs in excess of what we anticipate, and management resources and attention might be diverted from other necessary or valuable activities, which would have a material adverse effect on our business and results of operations.
Consolidation in the health insurance industry in which our customers operate could cause us to lose customers or could reduce the volume of services purchased by consolidated customers following an acquisition or merger, which could have a material adverse effect on our business.
Consolidation in the health insurance industry has accelerated in recent years, and this trend could continue. We may lose customers due to industry consolidation, and we may not be able to expand sales of our solutions and services to new customers to replace lost customers. In addition, new companies or organizations that result from such consolidation may decide that our solutions are no longer needed because of their own internal processes or the use of alternative solutions. As these entities consolidate, competition to provide solutions and services to industry participants will become more intense and the importance of establishing relationships with large industry participants will become greater. These industry participants may try to use their market power to negotiate price reductions for our solutions. Also, if consolidation of larger current customers occurs, the combined company may represent a larger percentage of business for us and, as a result, we are likely to rely
33
Table of Contents
more significantly on the combined company’s revenue to continue to achieve growth. As a result, industry consolidation or consolidation among current customers or potential customers could adversely affect our business.
We depend on our senior management team and other key employees, and the loss of one or more key personnel or an inability to attract hire, integrate and retain highly skilled personnel could adversely affect our business.
Our success depends largely upon the continued services of key personnel. We also rely on our leadership team in the areas of research and development, marketing, services, and general and administrative functions, and on mission-critical individual contributors in research and development. From time to time, there may be changes in our executive management team resulting from the hiring or departure of executives, which could disrupt our business. The loss of one or more of our executive officers or other key employees could have a serious adverse effect on our business. The replacement of one or more of our executive officers or other key employees would involve significant time and expense and may significantly delay or prevent the achievement of our business objectives.
To continue to execute our growth strategy, we also must identify, hire and retain highly skilled personnel. Competition is intense for engineers with high levels of experience in designing and developing software and Internet-related services. We might not be successful in maintaining our unique culture and continuing to attract and retain qualified personnel. We have from time to time in the past experienced, and we expect to continue to experience in the future, difficulty in hiring and retaining highly skilled personnel with appropriate qualifications. The pool of qualified personnel is limited overall and specifically in the geographic regions in which our principal offices are located. Failure to identify, hire and retain necessary key personnel could have a material adverse effect on our business, financial condition and results of operations.
Consumers of health insurance are increasingly relying on mobile devices as part of their decision-making process. If we are unsuccessful in expanding the capabilities of our shopping tools for mobile platforms, it could adversely affect our business.
We believe that consumers of health insurance are increasingly relying on mobile devices, such as smartphones and tablets, in connection with their health insurance purchasing decisions. Traditionally, our solutions have been designed for desktop platforms, and we must develop new capabilities to deliver compelling user experiences via mobile devices. To deliver high quality mobile offerings, it is important that our solutions integrate with a wide range of other mobile technologies, systems, networks and standards that we do not control. We may not be successful in developing products that operate effectively with these technologies, systems, networks or standards. Further, our success on mobile platforms will be dependent on our interoperability with popular mobile operating systems that we do not control, such as Android, iOS and Windows Mobile, and any change in such systems that degrade our functionality or give preferential treatment to competitive products could adversely affect usage of our solutions through mobile devices. If we fail to achieve success with our mobile offerings, our ability to deliver compelling user experiences to consumers as they increasingly rely on mobile devices in connection with their health insurance purchasing decisions will be constrained and our business could be adversely affected.
If we cannot maintain our corporate culture as we grow, we could lose the innovation, teamwork, passion and focus on execution that we believe contribute to our success, which could have a material adverse effect on our business.
We believe that a critical component to our success has been our corporate culture. We have invested substantial time and resources in building our team. As we continue to grow, we may find it difficult to maintain the innovation, teamwork, passion and focus on execution that we believe are important aspects of our corporate culture. Any failure to preserve our culture could negatively affect our future success, including our ability to retain and recruit personnel and to effectively focus on and pursue our corporate objectives.
34
Table of Contents
Failure by our customers to obtain proper permissions and waivers might result in claims against us or may limit or prevent our use of data, which could have a material adverse effect on our business.
We require our customers to provide necessary notices and to obtain necessary permissions and waivers for use and disclosure of information on our platform, and we require contractual assurances from them that they have done so and will do so. If, however, despite these requirements and contractual obligations, our customers do not obtain necessary permissions and waivers, then our use and disclosure of information that we receive from them or on their behalf might be limited or prohibited by state or federal privacy laws or other laws. This could impair our functions, processes and databases that reflect, contain, or are based upon such data and might prevent use of such data. In addition, this could interfere with, or prevent creation or use of, rules, analyses, or other data-driven activities that benefit us and our business. Moreover, we might be subject to claims or liability for use or disclosure of information by reason of lack of valid notices, agreements, permissions or waivers. These claims or liabilities could subject us to unexpected costs and adversely affect our operating results.
Risks Related to Regulation
The healthcare and health insurance industries are heavily regulated. Our failure to comply with regulatory requirements could create liability for us, result in adverse publicity and negatively affect our business.
The healthcare and health insurance industries are highly regulated and are subject to changing political, legislative, regulatory, and other influences. Existing and new laws and regulations could create unexpected liabilities for us, cause us to incur additional costs and restrict our operations. These laws and regulations are complex and their application to specific services and relationships are not clear. In particular, many existing laws and regulations affecting healthcare and health insurance and related benefits or products when enacted, did not anticipate the services that we provide, and these laws and regulations might be applied to our services in ways that we do not anticipate. Our failure to accurately anticipate the application of these laws and regulations, or our failure to comply, could require us to change our operations or cease using certain datasets, create liability for us, result in adverse publicity, and negatively affect our business. Some of the risks we face from the regulation of healthcare and health insurance are as follows:
| • | Patient Protection and Affordable Care Act. Numerous lawsuits have challenged and continue to challenge the constitutionality and other aspects of PPACA, and regulations and regulatory guidance continue to be issued on various aspects of PPACA that may affect our business. While many of the provisions of PPACA are not directly applicable to us, PPACA, as enacted, affects the business of many of our customers. Our customers might experience changes in the numbers of individuals they insure as a result of Medicaid expansion and the creation of state and national exchanges. Although we are unable to predict with any reasonable certainty or otherwise quantify the likely impact of PPACA on our business model, financial condition, or results of operations, changes in the business of our customers and the number of individuals they insure may negatively impact our business. |
| • | False or Fraudulent Claim Laws. There are numerous federal and state laws that forbid submission of false information or the failure to disclose information in connection with submission and payment of claims for reimbursement from the government. In some cases, these laws also forbid abuse of existing systems for such submission and payment. Any contract we have with a government entity or in support of a government entity requires us to comply with these laws and regulations. Any failure of our services to comply with these laws and regulations could result in substantial liability, including but not limited to criminal liability, could adversely affect demand for our services, and could force us to expend significant capital, research and development, and other resources to address the failure. Any determination by a court or regulatory agency that our services with government customers violate these laws and regulations could subject us to civil or criminal penalties, invalidate all or portions of some of our government customer contracts, require us to change or terminate some portions of our business, require us to refund portions of our services fees, cause us to be disqualified from serving not only government customers but also all customers doing business with government payers, and have an adverse effect on our business. |
35
Table of Contents
| • | HIPAA and Other Privacy and Security Requirements. There are numerous federal and state laws and regulations related to the privacy and security of personal health information. In particular, regulations promulgated pursuant to the Health Insurance Portability and Accountability Act of 1996, or HIPAA, established privacy and security standards, or Privacy Standards and Security Standards, that limit the use and disclosure of individually identifiable health information, and require the implementation of administrative, physical, and technological safeguards to ensure the confidentiality, integrity, and availability of individually identifiable health information in electronic form. Health plans, healthcare clearinghouses, and most providers are considered by the HIPAA regulations to be “Covered Entities.” With respect to our operations, we are a Business Associate of our health plan customers and we are directly subject to the privacy and security regulations established under HIPAA. We enter into written Business Associate Agreements with our health plan customers, under which we are required to safeguard individually identifiable health information and comply with restrictions how we may use and disclose such information. Effective February 2010, the American Recovery and Reinvestment Act of 2009, or ARRA, and effective March 2013, the HIPAA Omnibus Final Rules extended the direct application of certain provisions of the Privacy Standards and Security Standards to us when we are functioning as a Business Associate of our health plan customers. ARRA and the HIPAA Omnibus Final Rule also subject Business Associates to direct oversight and audit by the HHS. |
Violations of the Privacy Standards and Security Standards might result in civil and criminal penalties, and ARRA increased the penalties for HIPAA violations and strengthened the enforcement provisions of HIPAA. For example, ARRA authorizes state attorneys general to bring civil actions seeking either injunctions or damages in response to violations of Privacy Standards and Security Standards that threaten the privacy of state residents. Additionally, some health plans interpret HIPAA requirements differently than we do, and as our customers are the Covered Entity under HIPAA we may be required to comply with their interpretations.
We might not be able to adequately address the business risks created by HIPAA implementation. Furthermore, we are unable to predict what changes to HIPAA or other laws or regulations might be made in the future or how those changes could affect our business or the costs of compliance.
In addition to the Privacy Standards and Security Standards, most states have enacted patient confidentiality laws that protect against the disclosure of confidential medical and/or health information, and many states have adopted or are considering further legislation in this area, including privacy safeguards, security standards, and data security breach notification requirements. Such state laws, if more stringent than HIPAA requirements, are not preempted by the federal requirements and we are required to comply with them. Additionally, other laws or standards may apply to our operations, including requirements related to handling certain financial information, federal tax information, or FTI, and payment card association operating rules with respect to credit card data.
Failure by us to comply with any state standards regarding patient privacy may subject us to penalties, including civil monetary penalties and, in some circumstances, criminal penalties. Such failure may injure our reputation and adversely affect our ability to retain customers and attract new customers.
| • | Medicare and Medicaid Regulatory Requirements. We have contracts with health plans that offer Medicare Managed Care (also known as Medicare Advantage or Medicare Part C). We also have contracts with health plans that offer Medicare prescription drug benefits (also known as Medicare Part D) plans. The activities of the Medicare plans are regulated by CMS. Though our health plan customers remain responsible to comply with CMS requirements, we operate as a First Tier, Downstream & Related Entity, or FDR, in support of our customers. Some of the activities that we might perform, such as the enrollment of beneficiaries, may be subject to CMS and/or state regulation, and such regulations may force us to change the way we do business or otherwise restrict our ability to provide services to such plans. Moreover, the regulatory environment with respect to these programs has become, and will likely continue to become, increasingly complex. |
36
Table of Contents
| • | Financial Services-Related Laws and Rules. Financial services and electronic payment processing services are subject to numerous laws, regulations and industry standards, some of which might impact our operations and subject us, our vendors, and our customers to liability as a result of the payment distribution and processing solutions we offer. In addition, payment distribution and processing solutions might be impacted by payment card association operating rules, certification requirements, and rules governing electronic funds transfers. If we fail to comply with applicable payment processing rules or requirements, we might be subject to fines and changes in transaction fees and may lose our ability to process credit and debit card transactions or facilitate other types of billing and payment solutions. Moreover, payment transactions processed using the Automated Clearing House Network, or ACH, are subject to network operating rules promulgated by the National Automated Clearing House Association and to various federal laws regarding such operations, including laws pertaining to electronic funds transfers, and these rules and laws might impact our billing and payment solutions. Further, our solutions might impact the ability of our payer customers to comply with state prompt payment laws. These laws require payers to pay healthcare claims meeting the statutory or regulatory definition of a “clean claim” within a specified time frame. |
| • | Insurance Broker Laws. Insurance laws in the United States are often complex, and states have broad authority to adopt regulations regarding brokerage activities. These regulations typically include the licensing of insurance brokers and agents and govern the handling and investment of customer funds held in a fiduciary capacity. We and our broker/agency customers may be subject to some of these regulations, and may not be able to fully comply. |
| • | ERISA. The Employee Retirement Income Security Act of 1974, as amended, or ERISA, regulates how employee benefits are provided to or through certain types of employer-sponsored health benefits plans. ERISA is a set of laws and regulations that is subject to periodic interpretation by the United States Department of Labor as well as the federal courts. In some circumstances, and under certain customer contracts, we might be deemed to have assumed duties that make us an ERISA fiduciary, and thus be required to carry out our operations in a manner that complies with ERISA in all material respects. We believe that our current operations do not render us subject to ERISA fiduciary obligations, and therefore that we are in material compliance with ERISA and that any such compliance does not currently have a material adverse effect on our operations. However, there can be no assurance that continuing ERISA compliance efforts or any future changes to ERISA will not have a material adverse effect on us. |
| • | Third-Party Administrator Laws. Numerous states in which we do business have adopted regulations governing entities engaged in third-party administrator, or TPA, activities. TPA regulations typically impose requirements regarding enrollment into benefits plans, claims processing and payments, and the handling of customer funds. Although we do not believe we are currently acting as a TPA, changes in state regulations could result in us being obligated to comply with such regulations, which might require us to obtain licenses to provide TPA services in such states. |
The growth in the Medicare plan market is important to the overall growth rate of our business. The marketing and sale of Medicare plans are subject to numerous, complex and frequently changing laws and regulations, and the impact of changes in laws related to Medicare or any failure to comply with them could harm our business, results of operations and financial condition.
The number of people eligible for Medicare is one of the most significant drivers in the growth of Medicare plans. Any changes in the eligibility requirements for Medicare such as raising the age of eligibility would decrease the available pool of recipients and lower our growth expectations.
The marketing and sale of Medicare plans are subject to numerous laws, regulations and guidelines at both the Federal and state level. The marketing and sale of Medicare Advantage and Medicare Part D prescription drug plans are principally regulated by CMS, which is a division of the United States Department of Health and
37
Table of Contents
Human Services, and the marketing and sale of Medicare supplement plans is principally regulated on a state- by- state basis by state departments of insurance. The laws and regulations applicable to the marketing and sale of Medicare plans lack clarity, are numerous and complex, were not drafted to contemplate health insurance exchanges, and change frequently, particularly with respect to regulations and guidance issued by CMS for Medicare Advantage and Medicare Part D prescription drug plans and by the various state departments of insurance for Medicare supplement plans.
As a result of these laws, regulations and guidelines, we have altered, and will need to continue to alter, our business operations and procedures, including without limitation, to comply with these changing requirements. Though our health plan customers remain responsible to comply with CMS requirements, we operate as an FDR, in support of our customers. Changes to the laws, regulations and guidelines relating to Medicare plans, the scope of their application to our business, their interpretation by regulators or our health plan customers, or the manner in which they are enforced could be incompatible with our business model. As a result, our business could be slowed or we could be prevented from operating portions of our business altogether, either of which would materially harm our results of operations and financial condition, particularly if this occurred during the Medicare annual enrollment period, which is when the vast majority of Medicare plans are sold.
Health plans may adjust their commission rates to comply with regulatory guidelines, such as those published by CMS with respect to the marketing of Medicare Advantage and Medicare Part D prescription drug plans. If these contractual changes result in reduced commissions, our revenue may decline. Because insurance rates may vary between health plans, plans and enrollment dates, changes in enrollment mix may impact our commission revenue. Future changes in health plan pricing practices could harm our business, results of operations and financial condition.
In March 2010, the Federal government enacted significant reforms to healthcare legislation through the PPACA and the HCERA, which we refer to collectively as Healthcare Reform. In addition, one of the elements of the recently passed Budget Control Act of 2011 is the creation of a joint select committee on deficit reduction to develop recommendations, including changes to entitlement programs such as Medicare, to reduce the national debt by at least $1.5 trillion over 10 years. In connection with the United Sates Congress’s failure to agree on a proposal to lower the national deficit, the Budget Control Act mandates automatic cuts to domestic and defense spending, including a significant reduction in Medicare spending. The impact that Healthcare Reform and the Budget Control Act will have on the market for Medicare plans could change the demand for Medicare plans, the way these plans are delivered, or the commissions that health plans pay to us in connection with their sale or otherwise adversely impact us.
In the event that these laws and regulations or changes in these laws and regulations, or other laws and regulations that impact the marketing and sale of Medicare plans, adversely impact our ability or our customers’ ability to market any type of Medicare plan on an exchange platform or the commissions that we receive for selling these plans, our business, results of operations and financial condition would be harmed.
Additional regulatory requirements placed on our software, services, and content could impose increased costs on us, delay or prevent our introduction of new service types, and impair the function or value of our existing service types.
Our products and services are and are likely to continue to be subject to increasing regulatory requirements in a number of ways. As these requirements proliferate, we must change or adapt our products and services to comply. Changing regulatory requirements might render our services obsolete or might prevent us from pursuing our business objective or developing new services. This might in turn impose additional costs upon us to comply or to further develop our products and services. It might also make introduction of new product or service types more costly or more time-consuming than we currently anticipate. It might even prevent introduction by us of new products or services or cause the continuation of our existing products or services to become unprofitable or impossible.
38
Table of Contents
Potential government subsidy of services similar to ours, or creation of a single-payer system, might reduce customer demand.
Recently, entities including brokers and United States federal and state governments have offered to subsidize adoption of online benefits platforms or clearinghouses. In addition, prior proposals regarding healthcare reform have included the concept of creation of a single payer for health insurance. This kind of consolidation of critical benefits activity could negatively impact the demand for our services.
Risk Related to Ownership of our Common Stock
Our stock price may be volatile.
The trading price of our common stock may be highly volatile and could be subject to wide fluctuations in response to various factors, including the risk factors described in this “Risk Factors” section and elsewhere in this Annual Report on Form 10-K and other factors which are beyond our control. These factors include:
| • | our operating performance and the operating performance of similar companies; |
| • | the overall performance of the equity markets; |
| • | announcements by us or our competitors of acquisitions, business plans, or commercial relationships; |
| • | threatened or actual litigation; |
| • | changes in laws or regulations relating to the sale of health insurance; |
| • | any major change in our board of directors or management; |
| • | publication of research reports or news stories about us, our competitors, or our industry, or positive or negative recommendations or withdrawal of research coverage by securities analysts; |
| • | large volumes of sales of our shares of common stock by existing stockholders; and |
| • | general political and economic conditions. |
In addition, the stock market in general, and the market for technology companies in particular, has experienced extreme price and volume fluctuations that have often been unrelated or disproportionate to the operating performance of those companies. Securities class action litigation has often been instituted against companies following periods of volatility in the overall market and in the market price of a company’s securities. This litigation, if instituted against us, could result in substantial costs, divert our management’s attention and resources, and harm our business, operating results, and financial condition.
Our management team had no prior experience managing a public company prior to our initial public offering, and regulatory compliance may divert its attention from day-to-day management of our business, which could have a material adverse effect on our business.
The individuals who now constitute our management team had no prior experience managing a publicly-traded company or complying with the increasingly complex laws pertaining to public companies prior to our initial public offering. Our management team may not successfully or efficiently manage our continued transition to a public company that will be subject to significant regulatory oversight and reporting obligations under the federal securities laws and the regulations imposed by the NASDAQ Global Market. In particular, these new obligations require substantial attention from our senior management and could divert their attention away from the day-to-day management of our business, which could materially and adversely impact our business operations.
39
Table of Contents
A limited number of stockholders have the ability to influence the outcome of director elections and other matters requiring stockholder approval.
As of February 28, 2015, our directors, executive officers, and their affiliated entities beneficially owned approximately 22% of our outstanding common stock. In addition, a limited number of stockholders beneficially own more than a majority of our outstanding common stock. These stockholders, if they act together, could exert substantial influence over matters requiring approval by our stockholders, including the amendment of our amended and restated certificate of incorporation and amended and restated bylaws, and the approval of mergers or other business combination transactions.
This concentration of ownership might discourage, delay, or prevent a change in control of our company, which could deprive our stockholders of an opportunity to receive a premium for their stock as part of a sale of our company and might reduce our stock price. These actions may be taken even if they are opposed by other stockholders.
Future sales of shares of our common stock by existing stockholders could depress the market value of our common stock.
As of February 28, 2015, we had 21,697,744 shares of common stock outstanding. The 7,630,250 shares sold in our initial public offering were freely tradable immediately after the offering and of the remaining 14,067,494 shares outstanding as of February 28, 2015, 13,885,467 shares are currently restricted as a result of lock-up agreements executed in connection with our initial public offering. These shares will be available for sale into the public market on June 10, 2015, subject in some cases to volume and other limitations. The representatives of the underwriters in our initial public offering may, in their sole discretion and at any time without notice, release all or any portion of the securities subject to the lock-up agreements. A large portion of these shares are held by a small number of persons and investment funds. Sales by these stockholders of a substantial number of shares could significantly reduce the market price of our common stock. Moreover, some holders of shares of common stock will have rights, subject to some conditions, to require us to file registration statements covering the shares they currently hold, or to include these shares in registration statements that we might file for ourselves or other stockholders.
On December 19, 2014, we registered an aggregate of 3,114,990 shares of our common stock that we have issued or may issue under our equity incentive plans, which shares can be freely sold in the public market upon issuance, subject to the lock-up agreements referred to above, various vesting agreements and in some cases, to volume and other restrictions. As of February 28, 2015, there were stock options to purchase 1,835,060 shares of our common stock and unvested restricted stock units representing 183,750 shares of our common stock outstanding. If a large number of these shares are sold in the public market, the sales could reduce the trading price of our common stock.
If securities or industry analysts do not continue to publish research or reports about our business, or publish inaccurate or unfavorable research or reports about our business, our stock price and trading volume could decline.
The trading market for our common stock, to some extent, depends on the research and reports that securities or industry analysts publish about us and our business. We do not have any control over these analysts. If one or more of the analysts who cover us downgrade our common stock or change their opinion of our common stock, our stock price would likely decline. If one or more of these analysts cease coverage of our company or fail to regularly publish reports on us, we could lose visibility in the financial markets, which could cause our stock price or trading volume to decline.
40
Table of Contents
We have incurred and will continue to incur significant increased expenses and administrative burdens as a public company, which could have a material adverse effect on our operations and financial results.
We face increased legal, accounting, administrative and other costs and expenses as a public company that we did not incur as a private company. The Sarbanes-Oxley Act of 2002, or the Sarbanes-Oxley Act, including the requirements of Section 404, as well as rules and regulations subsequently implemented by the Securities and Exchange Commission, or SEC, the Public Company Accounting Oversight Board and the NASDAQ Global Market, impose additional reporting and other obligations on public companies. Compliance with public company requirements has increased our costs and made some activities more time-consuming. A number of those requirements require us to carry out activities we have not done previously. For example, we have created new board committees and adopted new internal controls and disclosure controls and procedures. In addition, we have incurred and will continue to incur additional expenses associated with our SEC reporting requirements. Furthermore, if we identify any issues in complying with those requirements (for example, if we or our auditors identify a material weakness or significant deficiency in our internal control over financial reporting), we could incur additional costs rectifying those issues, and the existence of those issues could adversely affect us, our reputation or investor perceptions of us. Risks associated with our status as a public company may make it more difficult for us to attract and retain qualified persons to serve on our board of directors or as executive officers. We expect that the additional reporting and other obligations imposed on us by these rules and regulations will increase our legal and financial compliance costs and the costs of our related legal, accounting and administrative activities by approximately $1.5 million per year. These increased costs will require us to divert a significant amount of money that we could otherwise use to expand our business and achieve our strategic objectives. Advocacy efforts by stockholders and third parties may also prompt additional changes in governance and reporting requirements, which could further increase our costs.
We do not currently intend to pay dividends on our common stock and, consequently, your ability to achieve a return on your investment will depend on appreciation in the price of our common stock.
We have never declared or paid any cash dividends on our common stock and do not currently intend to do so for the foreseeable future. We currently intend to invest our future earnings, if any, to fund our growth. Therefore, you are not likely to receive any dividends on your common stock for the foreseeable future, and the success of an investment in shares of our common stock will depend upon future appreciation in its value, if any. There is no guarantee that shares of our common stock will appreciate in value or even maintain the price at which our stockholders purchased their shares.
Provisions in our amended and restated certificate of incorporation and amended and restated bylaws and Delaware law might discourage, delay, or prevent a change in control of our company or changes in our management and, therefore, depress the trading price of our common stock.
Provisions of our amended and restated certificate of incorporation and amended and restated bylaws and Delaware law might discourage, delay, or prevent a merger, acquisition, or other change in control that stockholders consider favorable, including transactions in which you might otherwise receive a premium for your shares of our common stock. These provisions might also prevent or frustrate attempts by our stockholders to replace or remove our management. These provisions include:
| • | limitations on the removal of directors; |
| • | advance notice requirements for stockholder proposals and nominations; |
| • | limitations on the ability of stockholders to call special meetings; |
| • | the inability of stockholders to cumulate votes at any election of directors; |
| • | the classification of our board of directors into three classes with only one class, representing approximately one-third of our directors, standing for election at each annual meeting; and |
| • | the ability of our board of directors to make, alter or repeal our amended and restated bylaws. |
41
Table of Contents
Our board of directors has the ability to designate the terms of and issue new series of preferred stock without stockholder approval. In addition, Section 203 of the Delaware General Corporation Law prohibits a publicly held Delaware corporation from engaging in a business combination with an interested stockholder, generally a person which together with its affiliates owns, or within the last three years has owned, 15% of our voting stock, for a period of three years after the date of the transaction in which the person became an interested stockholder, unless the business combination is approved in a prescribed manner.
The existence of the foregoing provisions and anti-takeover measures could limit the price that investors are willing to pay in the future for shares of our common stock. They could also deter potential acquirers of our company, thereby reducing the likelihood that you could receive a premium for your common stock in an acquisition.
We currently qualify as an emerging growth company under the JOBS Act and we cannot be certain if the reduced disclosure requirements applicable to emerging growth companies will make our common stock less attractive to investors.
The JOBS Act permits “emerging growth companies” like us to take advantage of certain exemptions from various reporting requirements applicable to other public companies that are not emerging growth companies.
In addition, Section 107 of the JOBS Act also provides that an emerging growth company can take advantage of the exemption from complying with new or revised accounting standards provided in Section 7(a)(2)(B) of the Securities Act as long as we are an emerging growth company. An emerging growth company can therefore delay the adoption of certain accounting standards until those standards would otherwise apply to private companies.
For as long as we continue to be an emerging growth company, we intend to take advantage of certain other exemptions from various reporting requirements that are applicable to other public companies including, but not limited to, reduced disclosure obligations regarding executive compensation in our periodic reports and proxy statements, exemptions from the requirements of holding a nonbinding advisory vote on executive compensation and stockholder approval of any golden parachute payments not previously approved, and exemptions from the requirements of auditor attestation reports on the effectiveness of our internal control over financial reporting. We have elected to take advantage of the extended transition period for complying with new or revised accounting standards under Section 102(B)(1), which will allow us to delay the adoption of new or revised accounting standards that have different effective dates for public and private companies until those standards apply to private companies. As a result of this election, our financial statements may not be comparable to companies that comply with public company effective dates.
We cannot predict if investors will find our common stock less attractive because we will rely on these exemptions. If some investors find our common stock less attractive as a result, there may be a less active trading market for our common stock and our stock price may be more volatile.
We will remain an emerging growth company until the earlier of (1) the last day of the fiscal year (a) ending December 31, 2019, (b) in which we have total annual gross revenue of at least $1.0 billion, or (c) in which we become a large accelerated filer, which means that we have been public for at least 12 months, have filed at least one annual report and the market value of our common stock that is held by non-affiliates exceeds $700 million as of the last day of our then most recently completed second fiscal quarter, and (2) the date on which we have issued more than $1.0 billion in non-convertible debt during the prior three-year period.
Item 1B. Unresolved Staff Comments.
None.
42
Table of Contents
We are headquartered in Brookfield, Wisconsin, where we lease approximately 36,000 square feet of office space under a lease expiring in August 2022. We also lease office space in Atlanta, Georgia, Los Angeles, California, Raleigh, North Carolina, Farmington, Connecticut, and Baltimore, Maryland. Our data centers are located in Atlanta, Georgia and El Segundo, California. We believe our current and planned office facilities and data center space will be adequate for our needs for the foreseeable future.
For additional information regarding obligations under operating leases, see Note 7 of the Notes to Consolidated Financial Statements included in Part II, Item 8: “Financial Statements and Supplementary Data” of this Annual Report on Form 10-K.
From time to time, we may become involved in litigation related to claims arising from the ordinary course of our business. We believe that there are no claims or actions pending or threatened against us, the ultimate disposition of which would have a material adverse effect on us.
Item 4. Mine Safety Disclosures.
Not applicable.
43
Table of Contents
| Item 5. | Market for Registrant’s Common Equity, Related Stockholder Matters and Issuer Purchases of Equity Securities |
Market Information
Our common stock has been listed on the NASDAQ Global Market under the symbol “CNXR” since December 12, 2014. Prior to that date, there was no public trading market for our common stock. Our common stock priced at $8.00 per share in our initial public offering on December 11, 2014. The following table sets forth for the periods indicated the high and low intra-day sale prices per share of our common stock as reported on the NASDAQ Global Market:
| Year ended December 31, 2014 | High | Low | ||||||
| Fourth Quarter (from December 12, 2014) |
$ | 9.42 | $ | 8.10 | ||||
On February 27, 2015, the last reported sale price of our common stock on the NASDAQ Global Market was $8.64 per share, and there were 34 holders of record of our common stock. The actual number of holders of common stock is greater than these numbers of record holders and includes stockholders who are beneficial owners, but whose shares are held in street name by brokers and nominees. The number of holders of record also does not include stockholders whose shares may be held in trust by other entities.
Use of Proceeds from Initial Public Offering of Common Stock
On December 17, 2014, we completed our initial public offering of 7,630,250 shares of common stock, at a price of $8.00 per share, before underwriting discounts and commissions. We issued and sold 6,635,000 of such shares and existing stockholders sold an aggregate of 995,250 of such shares as a result of the underwriters’ exercise of their over-allotment option to purchase additional shares. The offer and sale of all of the shares in our initial public offering were registered under the Securities Act pursuant to a registration statement on Form S-1 (File No. 333-199484), which was declared effective by the SEC on December 11, 2014. Following the sale of the shares in connection with the closing of our initial public offering, the offering terminated. Morgan Stanley & Co. LLC, J.P. Morgan Securities LLC, Wells Fargo Securities, LLC, Raymond James & Associates, Inc. and William Blair & Company, L.L.C. acted as the underwriters. Our initial public offering generated net proceeds to us of approximately $45.2 million, after deducting underwriting discounts and direct offering expenses. Direct offering expenses incurred by us for our initial public offering were approximately $4.2 million and were recorded against the proceeds received from our initial public offering. No payments were made by us to directors, officers or persons owning ten percent or more of our common stock or to their associates, or to our affiliates, other than (i) payments of dividends and (ii) payments in the ordinary course of business to officers for salaries and bonuses and to non-employee directors as compensation for board or board committee service. We did not receive any proceeds from the sale of shares by the selling stockholders in our initial public offering.
With the net proceeds of our initial public offering, we (i) paid in full accumulated dividends on our previously outstanding shares of preferred stock, which totaled approximately $9.0 million, (ii) repaid, in first quarter of 2015, the outstanding principal and interest on outstanding promissory notes, which totaled approximately $3.5 million and (iii) repaid the outstanding principal and interest on outstanding promissory notes held by investors affiliated with members of our board of directors at the time of our initial public offering, which totaled approximately $1.3 million.
There have been no material changes in the planned use of proceeds from our initial public offering from that described in the final prospectus filed with the SEC pursuant to Rule 424(b) on December 12, 2014.
Dividend Policy
We have never declared or paid any cash dividends on our common stock. Neither Delaware law nor our amended and restated certificate of incorporation requires our board of directors to declare dividends on our
44
Table of Contents
common stock. Any future determination to declare cash dividends on our common stock will be made at the discretion of our board of directors and will depend on our financial condition, results of operations, capital requirements, general business conditions, covenants under our Credit Facility and other debt instruments and other factors that our board of directors may deem relevant. We do not anticipate paying cash dividends on our common stock for the foreseeable future.
Equity Compensation Plan Information
Information regarding the securities authorized for issuance under our equity compensation plans will be included in our Proxy Statement relating to our 2015 annual meeting of stockholders to be filed with the SEC within 120 days after the end of our fiscal year ended December 31, 2014, and is incorporated herein by reference.
Performance Graph
Notwithstanding any statement to the contrary in any of our filings with the SEC, the following information shall not be deemed “filed” with the SEC or “soliciting material” under the Securities Exchange Act of 1934 and shall not be incorporated by reference into any such filings irrespective of any general incorporation language contained in such filing.
The following graph compares the total cumulative stockholder return on our common stock with the total cumulative return of the S&P 500 Index and the S&P 1500 Application Software Index during the period commencing on December 12, 2014, the initial trading day of our common stock, and ending on December 31, 2014. The graph assumes that $100 was invested at the beginning of the period in our common stock and in each of the comparative indices, and the reinvestment of any dividends. Historical stock price performance should not be relied upon as an indication of future stock price performance.
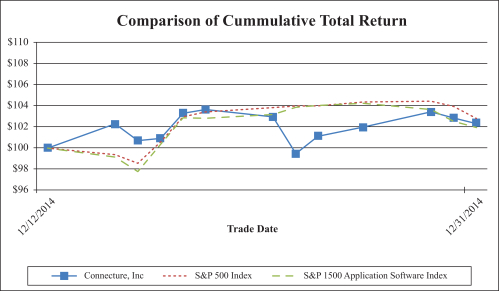
Item 6. Selected Financial Data.
Selected Consolidated Financial and Other Data
The tables on the following pages set forth the consolidated financial and operating data as of and for the periods indicated. Financial information for periods prior to 2012 has not been provided. The condensed consolidated statements of operations data presented below for the years ended December 31, 2014, 2013 and
45
Table of Contents
2012 and the consolidated balance sheet data as of December 31, 2014, 2013 and 2012 have been derived from the audited consolidated financial statements that are included in Part II, Item 8: “Financial Statement” of this Annual Report on Form 10-K
The results presented for 2012 below do not reflect the results of DestinationRX, Inc., which we acquired in January 2013.
The following information should be read in conjunction with our condensed consolidated financial statements and related notes, the sections titled “Risk Factors” and “Management’s Discussion and Analysis of Financial Condition and Results of Operations” and the other information included elsewhere in this Annual Report on Form 10-K. Our historical results should not be considered a reliable indicator of our future results of operations.
Condensed Consolidated Statements of Operations Data
| Year Ended December 31 | ||||||||||||
| 2014 | 2013 | 2012 | ||||||||||
| (in thousands, except share and per share data) |
||||||||||||
| Condensed Consolidated Statements of Operations Data: |
||||||||||||
| Revenue |
$ | 84,579 | $ | 58,326 | $ | 29,626 | ||||||
| Cost of Revenue(1) |
52,431 | 50,173 | 22,886 | |||||||||
|
|
|
|
|
|
|
|||||||
| Gross Margin |
32,148 | 8,153 | 6,740 | |||||||||
|
|
|
|
|
|
|
|||||||
| Operating Expenses: |
||||||||||||
| Research and Development(1) |
18,125 | 11,806 | 7,371 | |||||||||
| Sales and Marketing(1) |
7,729 | 6,800 | 6,644 | |||||||||
| General and Administrative(1) |
10,552 | 12,187 | 7,492 | |||||||||
|
|
|
|
|
|
|
|||||||
| Total Operating Expenses |
36,406 | 30,793 | 21,507 | |||||||||
|
|
|
|
|
|
|
|||||||
| Loss from Operations |
(4,258 | ) | (22,640 | ) | (14,767 | ) | ||||||
|
|
|
|
|
|
|
|||||||
| Other Expenses: |
||||||||||||
| Interest Expense |
5,937 | 4,644 | 1,992 | |||||||||
| Other (Income) Expense, net |
(68 | ) | — | — | ||||||||
|
|
|
|
|
|
|
|||||||
| Loss before Income Taxes |
(10,127 | ) | (27,284 | ) | (16,759 | ) | ||||||
|
|
|
|
|
|
|
|||||||
| Income Tax (Provision) Benefit |
(33 | ) | 900 | 3 | ||||||||
|
|
|
|
|
|
|
|||||||
| Net Loss |
$ | (10,160 | ) | $ | (26,384 | ) | $ | (16,756 | ) | |||
|
|
|
|
|
|
|
|||||||
| Net Loss per common share—basic and diluted |
$ | (10.27 | ) | $ | (163.37 | ) | $ | (14.05 | ) | |||
|
|
|
|
|
|
|
|||||||
| Weighted Average Common Shares Outstanding—basic and diluted |
1,362,109 | 184,051 | 1,353,862 | |||||||||
|
|
|
|
|
|
|
|||||||
| Other Financial Data: |
||||||||||||
| Adjusted Gross Margin(2) |
36,163 | 11,984 | 7,572 | |||||||||
| Adjusted EBITDA(3) |
1,328 | (17,291 | ) | (13,054 | ) | |||||||
| (1) | Cost of revenue and operating expenses include stock-based compensation expense as follows: |
| Year Ended December 31 | ||||||||||||
| 2014 | 2013 | 2012 | ||||||||||
| (dollars in thousands) | ||||||||||||
| Cost of Revenue |
$ | 123 | $ | 92 | $ | 121 | ||||||
| Research and Development |
78 | 55 | 48 | |||||||||
| Sales and Marketing |
32 | 34 | 61 | |||||||||
| General and Administrative |
1,203 | 458 | 470 | |||||||||
46
Table of Contents
| (2) | We define adjusted gross margin as gross margin before depreciation and amortization expense, as well as stock-based compensation expense. See the section titled “Adjusted Gross Margin and Adjusted EBITDA” below for more information and for a reconciliation of adjusted gross margin to gross margin, the most directly comparable financial measure calculated and presented in accordance with GAAP. |
| (3) | We defined adjusted EBITDA as net income (loss) before net interest, other expense, taxes, depreciation and amortization expense, adjusted to eliminate stock-based compensation and non-cash changes in fair value of contingent consideration and impairments of goodwill, intangible and long-lived assets, if any. See the section titled “Adjusted Gross Margin and Adjusted EBITDA” below for more information and for a reconciliation of adjusted EBITDA to EBITDA, the most directly comparable financial measure calculated and presented in accordance with GAAP. |
Our Segments
| Year Ended December 31 | ||||||||||||
| 2014 | 2013 | 2012 | ||||||||||
| (dollars in thousands) | ||||||||||||
| Segment Statements of Operations Data: |
||||||||||||
| Revenue |
||||||||||||
| Enterprise/Commercial |
$ | 40,369 | $ | 33,028 | $ | 28,341 | ||||||
| Enterprise/State |
21,632 | 3,177 | 65 | |||||||||
| Medicare |
16,175 | 15,941 | — | |||||||||
| Private Exchange |
6,403 | 6,180 | 1,220 | |||||||||
|
|
|
|
|
|
|
|||||||
| Total Revenue |
$ | 84,579 | $ | 58,326 | $ | 29,626 | ||||||
|
|
|
|
|
|
|
|||||||
| Gross Margin |
||||||||||||
| Enterprise/Commercial |
$ | 10,323 | $ | (747 | ) | $ | 7,241 | |||||
| Enterprise/State |
11,038 | (1,121 | ) | (784 | ) | |||||||
| Medicare |
9,451 | 7,839 | — | |||||||||
| Private Exchange |
1,336 | 2,182 | 283 | |||||||||
|
|
|
|
|
|
|
|||||||
| Total Gross Margin |
$ | 32,148 | $ | 8,153 | $ | 6,740 | ||||||
|
|
|
|
|
|
|
|||||||
Condensed Consolidated Balance Sheet Data
| Year Ended December 31 | ||||||||||||
| 2014 | 2013 | 2012 | ||||||||||
| (dollars in thousands) | ||||||||||||
| Condensed Consolidated Balance Sheet Data: |
||||||||||||
| Cash and cash equivalents |
$ | 28,252 | $ | 2,277 | $ | 1,476 | ||||||
| Accounts receivable—net of allowances |
12,128 | 20,935 | 6,183 | |||||||||
| Total assets |
112,344 | 94,233 | 24,125 | |||||||||
| Deferred revenue, total |
73,737 | 87,855 | 40,070 | |||||||||
| Capital lease obligations, total |
567 | 975 | — | |||||||||
| Current maturities of long-term debt |
4,479 | 5,431 | 194 | |||||||||
| Long-term debt |
48,581 | 32,818 | 5,562 | |||||||||
| Total liabilities |
141,185 | 150,542 | 54,689 | |||||||||
| Total redeemable convertible preferred stock |
— | 49,475 | 46,060 | |||||||||
| Common stock |
22 | 1 | 1 | |||||||||
| Additional paid-in capital |
96,365 | 9,013 | 12,059 | |||||||||
| Total stockholders’ deficit |
(28,841 | ) | (106,054 | ) | (76,624 | ) | ||||||
47
Table of Contents
Adjusted Gross Margin and Adjusted EBITDA
Within Annual Report on Form 10-K, we use adjusted gross margin and adjusted earnings before interest, taxes, depreciation and amortization, or adjusted EBITDA, to provide investors with additional information regarding our financial results. Adjusted gross margin and adjusted EBITDA are non-GAAP (Generally Accepted Accounting Principles) financial measures. We have provided below reconciliations of these measures to the most directly comparable GAAP financial measures, which for adjusted gross margin is gross margin, and for adjusted EBITDA is net loss.
We have included adjusted gross margin and adjusted EBITDA in this filing because they are key measures used by our management and board of directors to understand and evaluate our core operating performance and trends, to prepare and approve our annual budget, and to develop short- and long-term operational plans. We believe the exclusion of non-cash charges such as depreciation, amortization and stock-based compensation from adjusted EBITDA and adjusted gross margin allows us to have better insight into the core operating performance of our business. The amount of such expenses in any specific period may not directly correlate with the underlying performance of our business operations during the period and such expenses can vary significantly between periods. The use of adjusted EBITDA and adjusted gross margin provides consistency and comparability with our past financial performance and facilitates period-to-period comparisons of operations that could otherwise be masked by the effect of the expenses that we exclude from these non-GAAP financial measures and facilitates comparisons with other peer companies, many of which use similar non-GAAP financial measures to supplement their GAAP results. Additionally, securities analysts use a measure similar to adjusted EBITDA and adjusted gross margin as supplemental measures to evaluate the overall operating performance and comparison of companies, and we anticipate that our investor and analyst presentations will continue to include these measures. Accordingly, we believe that adjusted gross margin and adjusted EBITDA provide useful information to investors and others in understanding and evaluating our operating results.
Our use of adjusted gross margin and adjusted EBITDA as analytical tools has limitations, and you should not consider them in isolation or as substitutes for analysis of our financial results as reported under GAAP. Some of these limitations are:
| • | although depreciation and amortization are non-cash charges, the assets being depreciated and amortized might have to be replaced in the future, and adjusted gross margin and adjusted EBITDA do not reflect cash capital expenditure requirements for such replacements or for new capital expenditure requirements; |
| • | adjusted gross margin and adjusted EBITDA do not reflect changes in, or cash requirements for, our working capital needs; |
| • | adjusted gross margin and adjusted EBITDA do not reflect the potentially dilutive impact of stock-based compensation; |
| • | adjusted gross margin and adjusted EBITDA do not reflect interest or tax payments that could reduce the cash available to us; and |
| • | other companies, including companies in our industry, might calculate adjusted gross margin and adjusted EBITDA or similarly titled measures differently, which reduces their usefulness as comparative measures. |
48
Table of Contents
Because of these and other limitations, you should consider adjusted gross margin and adjusted EBITDA alongside other GAAP-based financial performance measures, including various cash flow metrics, gross margin, net loss and our other GAAP financial results. The following table presents a reconciliation of adjusted gross margin to gross margin and adjusted EBITDA to net loss for each of the periods indicated:
| Year Ended December 31 | ||||||||||||
| 2014 | 2013 | 2012 | ||||||||||
| (dollars in thousands) | ||||||||||||
| Reconciliation from Gross Margin to Adjusted Gross Margin: |
||||||||||||
| Gross Margin |
$ | 32,148 | $ | 8,153 | $ | 6,740 | ||||||
| Depreciation and amortization |
3,892 | 3,739 | 711 | |||||||||
| Stock-based compensation expense |
123 | 92 | 121 | |||||||||
|
|
|
|
|
|
|
|||||||
| Adjusted gross margin |
$ | 36,163 | $ | 11,984 | $ | 7,572 | ||||||
|
|
|
|
|
|
|
|||||||
| Reconciliation from Net Loss to Adjusted EBITDA |
||||||||||||
| Net Loss |
$ | (10,160 | ) | $ | (26,384 | ) | $ | (16,756 | ) | |||
| Depreciation and amortization |
5,101 | 4,710 | 1,013 | |||||||||
| Interest expense |
5,937 | 4,644 | 1,992 | |||||||||
| Other (income) expense |
(68 | ) | — | — | ||||||||
| Income taxes |
33 | (900 | ) | (3 | ) | |||||||
| Stock-based compensation expense |
1,436 | 639 | 700 | |||||||||
| Change in fair value of contingent consideration |
(951 | ) | — | — | ||||||||
|
|
|
|
|
|
|
|||||||
| Total net adjustments |
11,488 | 9,093 | 3,702 | |||||||||
|
|
|
|
|
|
|
|||||||
| Adjusted EBITDA |
$ | 1,328 | $ | (17,291 | ) | $ | (13,054 | ) | ||||
|
|
|
|
|
|
|
|||||||
49
Table of Contents
Item 7. Management’s Discussion and Analysis of Financial Condition and Results of Operations.
The statements included herein that are not based solely on historical facts are “forward looking statements.” Such forward-looking statements are based on current expectations and assumptions that are subject to risks and uncertainties. Our actual results could differ materially from those anticipated by us in these forward-looking statements as a result of various factors, including those discussed below and elsewhere in this Annual Report on Form 10-K, particularly under the section titled “Risk Factors.”
The following discussion and analysis of our financial condition and results of operations should be read in conjunction with our consolidated financial statements and related notes included elsewhere in this Annual Report on Form 10-K. In addition to historical consolidated financial information, the following discussion contains forward-looking statements that reflect our plans, estimates and beliefs. Our actual results could differ materially from those discussed in the forward-looking statements. Factors that could cause or contribute to these differences include those discussed below and elsewhere in this Annual Report on Form 10-K, particularly in the section titled “Risk Factors.”
Overview
We are a leading web-based consumer shopping, enrollment and retention platform for health insurance distribution. Our solutions support the industry evolution towards a consumer-centric experience that is transforming how health insurance is purchased and distributed. Our solutions offer personalized health insurance shopping experience that recommends the best fit insurance plan based on an individual’s preferences, health status, preferred providers, medications and expected out-of-pocket costs. Our customers are health insurance marketplace operators, such as health plans, brokers, and exchange operators, that must distribute health insurance in a cost-effective manner to a growing number of insured consumers. Our solutions automate key functions in the health insurance distribution process, allowing our customers to price and present plan options accurately to consumers and efficiently enroll, renew and manage plan members.
We serve four separate but related market segments: Enterprise/Commercial, Enterprise/State, Medicare and Private Exchange. Our largest market segment is the Enterprise/Commercial market, in which we sell our solutions to health plans. Our Enterprise/State segment sells our sales automation solutions to state governments, which allow our state government customers to offer customized individual and small group exchanges. Our Medicare segment sells web-based Medicare plan comparison and enrollment tools to a variety of different customers, including health plans, pharmacy benefit managers, or PBMs, pharmacies, field marketing organizations, or FMOs, and call centers. Lastly, our Private Exchange segment sells comprehensive defined-contribution benefit exchange solutions to benefit consultants, brokers, exchange operators and aggregators. We believe our presence in these markets and resulting access to such a broad and diverse customer base gives us a strong position at the center of the health insurance distribution marketplace.
We sell our web-based solutions and related services primarily through our direct sales force. We derive most of our revenue from software services fees, which primarily consist of monthly subscription fees paid to us for access to, usage and hosting of our web-based insurance distribution software solutions, and related production support services. Software services fees paid to us from our Enterprise/Commercial customers are based on the size of the health plan for a specified period of time, which usually ranges from three to five years, and the number of software modules used. Software services fees paid to us from our Enterprise/State customers are based on the number of software solutions modules contracted to be used, for a specified period of time, which usually ranges from one to three years. Software services fees paid to us from our Medicare and Private Exchange customers are based on the volume of enrollments for which our software solutions are utilized for a contracted period, which usually ranges from one to three years.
Our Enterprise/State software service fees are largely derived from multiple element contracts for non-hosted software solutions and related services for which we do not have vendor specific objective evidence, or
50
Table of Contents
VSOE, of relative fair value of the contractual elements. For purposes of presentation in management’s discussion and analysis, management classifies a portion of the overall arrangement fee as software services based on an evaluation of various available indicators of fair value, including relative contract value of the software and professional services elements to total contractual value, and applies judgment to reasonably classify the arrangement fee. Our classification of multiple element arrangement fees is for management’s discussion and analysis purposes only and does not affect the timing or amount of revenue recognized.
The amount of Enterprise/State revenue classified as perpetual software licenses within our software services revenue is less than 10% of consolidated revenue for the years ended December 31, 2014, 2013 and 2012.
Software services revenue accounted for approximately 75%, 68% and 57% of our total revenue during the years ended December 31, 2014, 2013 and 2012, respectively.
Our customer contracts are generally only cancellable by the customer in an instance of our uncured breach, although some of our customers (including government customers) are able to terminate their respective contracts without cause or for convenience. Of our top 20 customers by 2014 revenue, eleven customers can terminate their contract for convenience upon written notice of between 30 and 60 days. These customers represented $14.4 million, or 18.5% of our Contracted Backlog balance as of December 31, 2014.
Another component of our revenue is professional services, which we primarily derive from the implementation of our customers onto our platform, typically including discovery, configuration and deployment, integration, testing and training. In general, it takes from six to fifteen months to implement a new Enterprise/Commercial or Enterprise/State customer’s insurance distribution solution and from one to three months to implement a new Medicare or Private Exchange insurance distribution solution.
Our Enterprise/State software professional services fees are largely derived from multiple element contracts for non-hosted software solutions and related services for which we do not have VSOE of relative fair value for the contractual elements. For purposes of presentation in management’s discussion and analysis, management classifies a portion of the overall arrangement fee as professional fees based on an evaluation of various available indicators of fair value, including relative contract value of the software and professional services elements to total contractual value, and applies judgment to reasonably classify the arrangement fee. Our classification of multiple element arrangement fees is for management’s discussion and analysis purposes only and does not affect the timing or amount of revenue recognized.
Professional services revenue accounted for approximately 21%, 24% and 42% of our total revenue during the years ended December 31, 2014, 2013 and 2012, respectively.
We also derive a small portion of our revenue from commissions earned on annual employee enrollments in which our health plan network and software solutions are used in connection with each enrollment.
We believe that there is a substantial market for our products and services, and we have been investing in growth over the past two years. In particular, we have continued to invest in technology and services to better serve our customers, which we believe are an important source of growth for our business. We have also substantially increased our marketing and sales efforts and expect those increased efforts to continue. As we have invested in growth, we have had operating losses in each of the last three years. Due to the nature of our customer relationships, which have been very stable with relatively few customer losses over the past three years, and the long-term subscription nature of our financial model, we believe that our current investment in growth may lead to increased revenue, which would allow us to achieve profitability in the future. Of course, our ability to achieve profitability will continue to be subject to many factors beyond our control.
Management is focused on risks that could have an adverse impact on our operations and our key financial and operating performance metrics, as described below, and takes actions to mitigate those risks. In our
51
Table of Contents
Enterprise/Commercial segment, for example, while fluctuations in bookings are not uncommon given the sales cycle for product and services in that segment, management routinely assesses staffing levels required to support contracted business volume and adjusts staffing levels accordingly. As part of its ongoing assessment of our software capabilities, management also considers industry trends, such as consumers’ increased reliance on mobile devices, to determine where to allocate research and development funding. One of our overall strategic initiatives is to continue to increase the percentage of software services revenue (and reduce professional services revenue as a percentage of total revenue) as we believe this will have a positive impact on overall gross margins in the future.
Key Financial and Operating Performance Metrics
We regularly monitor a number of financial and operating metrics in order to measure our current performance and project our future performance. These metrics help us develop and refine our growth strategies and make strategic decisions. We discuss consolidated revenue, gross margin and the components of operating loss, as well as segment revenue and components of segment gross margin, in “Management’s Discussion and Analysis of Financial Condition and Results of Operations—Components of Operating Results.” In addition, we utilize other key metrics as described below.
Contracted Backlog
We believe the balance of contracted future billings, or Contracted Backlog, is an important indicator of the economic health of our business, as it provides an important source of visibility into our future sources of revenue.
We have generally signed multiple-year subscription contracts for our software services. The timing of our invoices to our customer is a negotiated term and thus varies among our software contracts. For multiple-year agreements, it is common to invoice an initial amount at contract signing for implementation work that is deferred, followed by subsequent annual, quarterly or monthly invoices once we launch a customer, which is when our product is usable by the customer. At any point in the contract term, there may be amounts that we have not yet been contractually able to invoice. Until such time as these amounts are invoiced, they are not recorded in revenue, deferred revenue or elsewhere in our consolidated financial statements and are considered by us to be Contracted Backlog. The amount of our total Contracted Backlog for software services and professional services contracts, which we define as including both cancellable and non-cancellable portions of our customer agreements that we have not yet billed, was approximately $78.2 million and $76.2 million as of December 31, 2014 and 2013, respectively. Our total Contracted Backlog does not take into account contractual provisions that give customers a right to terminate their agreements with us. We fulfill Contracted Backlog associated with a customer contract when the customer implementation process is complete. Our implementation timelines can vary between one and 15 months based on the type of solution, source and condition of the data we receive from third parties, the configurations that we agree to provide and the size of the customer. As a result, our implementation timelines are subject to significant uncertainties, which can have a material impact on our total Contracted Backlog and Contracted Backlog that we fulfill in the current year. Based on our current implementation forecasts, we expect to fulfill our total Contracted Backlog as of December 31, 2014 over a period of approximately four years.
The anticipated impact of the December 31, 2014 Contracted Backlog on each future year is as follows:
| Year |
Millions of Dollars | |||
| 2015 |
$ | 34.3 | ||
| 2016 |
28.4 | |||
| 2017 |
9.3 | |||
| Thereafter |
6.2 | |||
|
|
|
|||
| TOTAL |
$ | 78.2 | ||
|
|
|
|||
52
Table of Contents
We expect that the amount of our Contracted Backlog relative to the total value of our contracts will change from period to period for several reasons, including the amount of cash collected early in the contract term, the specific timing and duration of large customer contracts, varying invoicing cycles of customer contracts, potential customer upsells dependent on our customer contracts, the specific timing of customer renewal and changes in customer financial circumstances. Accordingly, we believe that fluctuations in our Contracted Backlog may not be a reliable indicator of our future revenue beyond one year.
Software Revenue Retention Rate
We believe that our ability to retain our customers and expand the revenue we generate from them over time is an important component of our growth strategy and reflects the long-term value of our customer relationships. We measure our performance on this basis using a metric we refer to as our Software Revenue Retention Rate. We calculate this metric for a particular period by establishing the group of our customers that had active contracts for a given period. We then calculate our Software Revenue Retention Rate by taking the amount of software revenue we recognized for this group in the subsequent comparable period (for which we are reporting the rate) and dividing it by the software revenue we recognized for the group in the prior period. Our active customers accounted for 99%, 93% and 99% of our total revenue during the years ended December 31, 2014, 2013 and 2012, respectively.
For the years ended December 31, 2014, 2013 and 2012, our Software Revenue Retention Rate was approximately 95%.
Adjusted Gross Margin and Adjusted EBITDA
Adjusted gross margin represents our gross margin before depreciation and amortization expense, as well as stock-based compensation expense. Adjusted earnings before interest, taxes, depreciation and amortization, or adjusted EBITDA, represents net income (loss) before net interest, other expense, taxes, depreciation and amortization expense, adjusted to eliminate stock-based compensation and non-cash changes in fair value of contingent consideration and impairments of goodwill, intangible, and other long-lived assets, if any. Adjusted gross margin and adjusted EBITDA are not measures calculated in accordance with GAAP, or Generally Accepted Accounting Principles. Please refer to “Selected Consolidated Financial Data—Adjusted Gross Margin and Adjusted EBITDA” in this Annual Report on Form 10-K for a discussion of the limitations of adjusted gross margin and adjusted EBITDA and reconciliations of adjusted gross margin to gross margin and adjusted EBITDA to net loss, the most comparable GAAP measurements, respectively, for the years ended December 31, 2014, 2013 and 2012.
Components of Operating Results
Revenue
We derive most of our revenue from software services fees, which primarily consist of monthly subscription fees paid to us for access to, usage and hosting of our web-based insurance distribution software solutions, and related production support services.
Software services fees paid to us from our Enterprise/Commercial customers are contracted rates based on the size of the health plan using our solutions for a specified period of time, which usually ranges from three to five years, and the number of software modules used. Software services fees paid to us from our Enterprise/State customers are contracted rates based on the number of software solutions modules being used for a specified period of time, which usually ranges from one to three years. Software services fees paid to us from our Medicare and Private Exchange customers are based on the volume of enrollments for which our software solutions are utilized for a contracted period, which usually ranges from one to three years. Our customer contracts are generally only cancellable by the customer in an instance of our uncured breach, although some of
53
Table of Contents
our customers are able to terminate their respective contracts without cause or for convenience. Software services revenue accounted for approximately 75%, 68% and 57% of our total revenue during the years ended December 31, 2014, 2013 and 2012, respectively.
Another component of our revenue is professional services, which we primarily derive from the implementation of our customers onto our platform, typically including discovery, configuration and deployment, integration, testing and training. We derive the majority of our professional services revenue from the implementation of our customers onto our platform. In general, it takes from six to fifteen months to implement a new enterprise customer’s insurance distribution solution and from one to three months to implement a new Medicare or Private Exchange insurance distribution solutions. Professional services revenue accounted for approximately 21%, 24% and 42% of our total revenue during the years ended December 31, 2014, 2013 and 2012, respectively.
We also derive a small portion of other revenue from commissions earned on annual employee enrollments in which our health plan network and software solutions are used in connection with each enrollment.
For all contractual arrangements that include multiple elements, we allocate revenue from a customer contract to software services and professional services based on the type of multiple element arrangement. For instance, with respect to multiple-element arrangements containing hosted software, we identify each software and professional services unit of accounting based on the terms of the customer contract and allocate revenue to each unit of accounting based on the relative selling price of each deliverable. Revenue from each element is recognized as each element is delivered. Similarly, for multiple-element arrangements containing non-hosted software, during the periods reported we accounted for the entire arrangement as a single unit of accounting, because some or all of the deliverable elements did not have stand-alone value when the related contracts were executed. In these situations, all revenue has been deferred until delivery of the final element, at which time the contract value is recognized ratably over the longer of the contract or expected customer relationship. For purposes of presentation in management’s discussion and analysis, management classifies a portion of the overall arrangement fee as software and professional services fees based on an evaluation of various available indicators of fair value, including relative contract value of the software and professional services elements to total contractual value, and applies judgment to reasonably classify the arrangement fee. Our classification of multiple element arrangement fees does not affect the timing or amount of revenue recognized. Less than 30% of our revenue in each of the periods reported was derived from multiple-element arrangements containing non-hosted software.
We generally invoice our customers for software services in advance, in monthly, quarterly or annual installments. We invoice our Medicare and Private Exchange customers for implementation fees at the inception of the arrangement. We generally invoice our Enterprise/Commercial and Enterprise/State customers for implementation fees at various contractually defined times throughout the implementation process. Implementation fees that have been invoiced are initially recorded as deferred revenue until recognized.
Overhead Allocation
Expenses associated with our facilities and depreciation are allocated between cost of revenue and operating expenses based on employee payroll costs determined by the nature of work performed.
Cost of Revenue
Cost of revenue primarily consists of salaries and other personnel-related costs, including benefits, bonuses and stock-based compensation, for employees providing services to our customers and supporting our Enterprise or SaaS platform infrastructures. Additional expenses in cost of revenue include co-location facility costs for our data centers, depreciation expense for computer equipment directly associated with generating revenue, infrastructure maintenance costs, amortization expenses associated with deferred implementation costs and acquired intangible assets, allocated overhead and other direct costs.
54
Table of Contents
Our cost of revenue is expensed as we incur the costs, with the exception of certain direct, incremental costs associated with new customer implementation efforts, which we defer. The related revenue from fees we receive for our implementation services performed before a customer is operating on our platform is deferred until the commencement of the monthly subscription and recognized as revenue ratably over the longer of the related contract term or the estimated expected life of the customer relationship. Therefore, certain costs incurred in providing these services are expensed in periods prior to the recognition of the corresponding revenue. Our cost associated with providing implementation services has been significantly higher as a percentage of revenue than our cost associated with providing our monthly subscription services due to the labor associated with providing implementation services.
We plan to continue to expand our capacity to support our growth, which will result in higher cost of revenue in dollars. However, we expect cost of revenue as a percentage of revenue to decline and gross margins to increase primarily from the growth of the percentage of our revenue from software services and the realization of economies of scale driven by retention of our customers.
Operating Expenses
Operating expenses consist of research and development, sales and marketing, and general and administrative expenses. Salaries and personnel-related costs are the most significant component of each of these expense categories. We expect to continue to hire new employees in these areas in order to support our anticipated revenue growth. As a result, we expect our operating expenses to increase in both aggregate dollars and as a percentage of revenue in the near term, but to decrease as a percentage of revenue over the longer term as we achieve economies of scale.
Research and development expense. The nature of our research and development activities includes market requirements and definition, product design, software development, quality assurance and product release. Research and development expense consists primarily of salaries and other personnel-related costs, including benefits, bonuses and stock-based compensation for our research and development employees. Additional expenses include costs related to the development, quality assurance, and testing of new technology, and enhancement of our existing platform technology, consulting, travel and allocated overhead. We believe continuing to invest in research and development efforts is essential to maintaining our competitive position. We expect our research and development expense to increase in dollars and as a percentage of revenue for the near term, but decrease as a percentage of revenue over the longer term as we achieve economies of scale.
Sales and marketing expense. Sales and marketing expense consists primarily of salaries and other personnel-related costs, including benefits, bonuses, stock-based compensation and commissions for our sales and marketing employees. We record expense for commissions at the time of contract signing. Additional expenses include advertising, lead generation, promotional event programs, corporate communications, travel and allocated overhead. We expect our sales and marketing expense to increase in both dollars and as a percentage of revenue in the foreseeable future as we further increase the number of our sales and marketing employees and expand our marketing activities in order to continue to grow our business.
General and administrative expense. General and administrative expense consists primarily of salaries and other personnel-related costs, including benefits, bonuses and stock-based compensation for administrative, finance and accounting, information systems, legal, information technology and human resource employees. Additional expenses include consulting and professional fees, insurance and other corporate expenses, and travel. Our general and administrative expenses have, and we expect that they will continue to, increase as a result of operating as a public company and include costs associated with compliance with the Sarbanes-Oxley Act and other regulations governing public companies, increased costs of directors’ and officers’ liability insurance, increased professional services expenses and costs associated with an enhanced investor relations function.
55
Table of Contents
Other Expenses
Other expenses primarily consists interest expense incurred on outstanding borrowings under our financing obligations, existing notes and credit facilities.
Income Tax (Expense) Benefit
Income taxes primarily consist of United States federal and state income tax net operating loss benefits, net of changes in valuation allowances. Valuation allowances are recorded to reduce deferred tax assets to the amount we believe is more likely than not to be realized.
Our income tax (expense) benefit was not meaningful in the years ended December 31, 2014 and 2012. We recorded a net income tax benefit of approximately $0.9 million in the year ended December 31, 2013. The benefit in 2013 resulted primarily from a $1.2 million benefit realized related to the change in our estimate of the Company deferred tax assets, which, as a result of the January 2013 acquisition of DRX, we believe are more likely than not to be realized.
As a result of cumulative net operating losses we have net operating loss carryforwards for federal income tax purposes of $66.2 million as of December 31, 2014. State net operating loss carryforwards were approximately $31.5 million as of December 31, 2014. Our net operating losses will expire at various dates beginning in 2020, if not utilized. As a result of prior equity issuances and other transactions in our stock, we have previously experienced “ownership changes” under Section 382 which limit the amount of net operating loss carryforwards available to us. We may also experience ownership changes in the future, which may result in further limitation of the amount of net operating losses which may be available in future years. At December 31, 2014 we had a full tax valuation allowance offsetting the recorded tax benefit of our federal and state net operating loss carryforwards.
56
Table of Contents
Results of Operations
Condensed Consolidated Statements of Operations Data
The following table sets forth our condensed consolidated statements of operations data for each of the periods indicated.
| Year Ended December 31, | ||||||||||||
| 2014 | 2013 | 2012 | ||||||||||
| (in thousands, except share amounts) | ||||||||||||
| Condensed Consolidated Statements of Operations Data: |
||||||||||||
| Revenue |
$ | 84,579 | $ | 58,326 | $ | 29,626 | ||||||
| Cost of Revenue(1) |
52,431 | 50,173 | 22,886 | |||||||||
|
|
|
|
|
|
|
|||||||
| Gross Margin |
32,148 | 8,153 | 6,740 | |||||||||
|
|
|
|
|
|
|
|||||||
| Operating Expenses: |
||||||||||||
| Research and Development(1) |
18,125 | 11,806 | 7,371 | |||||||||
| Sales and Marketing(1) |
7,729 | 6,800 | 6,644 | |||||||||
| General and Administrative(1) |
10,552 | 12,187 | 7,492 | |||||||||
|
|
|
|
|
|
|
|||||||
| Total Operating Expenses |
36,406 | 30,793 | 21,507 | |||||||||
|
|
|
|
|
|
|
|||||||
| Loss from Operations |
(4,258 | ) | (22,640 | ) | (14,767 | ) | ||||||
|
|
|
|
|
|
|
|||||||
| Other Expenses: |
||||||||||||
| Interest Expense |
5,937 | 4,644 | 1,992 | |||||||||
| Other (Income) Expense, net |
(68 | ) | — | — | ||||||||
|
|
|
|
|
|
|
|||||||
| Loss before Income taxes |
(10,127 | ) | (27,284 | ) | (16,759 | ) | ||||||
|
|
|
|
|
|
|
|||||||
| Income Tax (Expense) Benefit |
(33 | ) | 900 | 3 | ||||||||
|
|
|
|
|
|
|
|||||||
| Net Loss |
$ | (10,160 | ) | $ | (26,384 | ) | $ | (16,756 | ) | |||
|
|
|
|
|
|
|
|||||||
| Weighted Average Common Shares Outstanding—basic and diluted |
1,362,109 | 184,051 | 1,353,862 | |||||||||
| Other Financial Data: |
||||||||||||
| Adjusted gross margin |
36,163 | 11,984 | 7,572 | |||||||||
| Adjusted EBITDA |
1,328 | (17,291 | ) | (13,054 | ) | |||||||
| (1) | Cost of revenue and operating expenses include stock-based compensation expense as follows: |
| Year Ended December 31, | ||||||||||||
| 2014 | 2013 | 2012 | ||||||||||
| (dollars in thousands) | ||||||||||||
| Cost of Revenue |
$ | 123 | $ | 92 | $ | 121 | ||||||
| Research and Development |
78 | 55 | 48 | |||||||||
| Sales and Marketing |
32 | 34 | 61 | |||||||||
| General and Administrative |
1,203 | 458 | 470 | |||||||||
57
Table of Contents
The following table sets forth our condensed consolidated statements of operations data as a percentage of revenue for each of the periods indicated.
| Year Ended December 31, | ||||||||||||
| 2014 | 2013 | 2012 | ||||||||||
| Consolidated Statements of Operations Data as Percentage of Revenue: |
||||||||||||
| Revenue |
100.0 | % | 100.0 | % | 100.0 | % | ||||||
| Cost of Revenue |
62.0 | % | 86.0 | % | 77.2 | % | ||||||
|
|
|
|
|
|
|
|||||||
| Gross Margin |
38.0 | % | 14.0 | % | 22.8 | % | ||||||
|
|
|
|
|
|
|
|||||||
| Operating Expenses: |
||||||||||||
| Research and Development |
21.4 | % | 20.2 | % | 24.9 | % | ||||||
| Sales and Marketing |
9.1 | % | 11.7 | % | 22.4 | % | ||||||
| General and Administrative |
12.5 | % | 20.9 | % | 25.3 | % | ||||||
|
|
|
|
|
|
|
|||||||
| Total Operating Expenses |
43.0 | % | 52.8 | % | 72.6 | % | ||||||
|
|
|
|
|
|
|
|||||||
| Loss from Operations |
(5.0 | %) | (38.8 | %) | (49.8 | %) | ||||||
|
|
|
|
|
|
|
|||||||
| Other Expenses: |
||||||||||||
| Interest Expense |
7.0 | % | 8.0 | % | 6.8 | % | ||||||
| Other (Income) Expense |
(0.1 | %) | 0.0 | % | 0.0 | % | ||||||
|
|
|
|
|
|
|
|||||||
| Loss before Income taxes |
(12.0 | %) | (46.8 | %) | (56.6 | %) | ||||||
|
|
|
|
|
|
|
|||||||
| Income Tax (Expense) Benefit |
(0.0 | %) | 1.6 | % | 0.0 | % | ||||||
|
|
|
|
|
|
|
|||||||
| Net Loss |
(12.0 | %) | 45.2 | % | (56.6 | %) | ||||||
|
|
|
|
|
|
|
|||||||
Our Segments
The following table sets forth segment results for revenue and gross margin for the periods indicated:
| Year Ended December 31, | ||||||||||||
| 2014 | 2013 | 2012 | ||||||||||
| (dollars in thousands) | ||||||||||||
| Segment Statements of Operations Data: |
||||||||||||
| Revenue: |
||||||||||||
| Enterprise/Commercial |
$ | 40,369 | $ | 33,028 | $ | 28,341 | ||||||
| Enterprise/State |
21,632 | 3,177 | 65 | |||||||||
| Medicare |
16,175 | 15,941 | — | |||||||||
| Private Exchange |
6,403 | 6,180 | 1,220 | |||||||||
|
|
|
|
|
|
|
|||||||
| Total Revenue |
$ | 84,579 | $ | 58,326 | $ | 29,626 | ||||||
|
|
|
|
|
|
|
|||||||
| Gross Margin: |
||||||||||||
| Enterprise/Commercial |
$ | 10,323 | $ | (747 | ) | $ | 7,241 | |||||
| Enterprise/State |
11,038 | (1,121 | ) | (784 | ) | |||||||
| Medicare |
9,451 | 7,839 | — | |||||||||
| Private Exchange |
1,336 | 2,182 | 283 | |||||||||
|
|
|
|
|
|
|
|||||||
| Total Gross Margin |
$ | 32,148 | $ | 8,153 | $ | 6,740 | ||||||
|
|
|
|
|
|
|
|||||||
58
Table of Contents
Comparison of Years Ended December 31, 2014 and 2013
Revenue
| Year Ended December 31, | ||||||||||||||||||||||||
| 2014 | 2013 | Period-to-Period Change |
||||||||||||||||||||||
| Amount | % of Revenue |
Amount | % of Revenue |
Amount | % | |||||||||||||||||||
| (dollars in thousands) | ||||||||||||||||||||||||
| Revenue by Type: |
||||||||||||||||||||||||
| Software services |
$ | 63,384 | 74.9 | % | $ | 39,673 | 68.0 | % | $ | 23,711 | 59.8 | % | ||||||||||||
| Professional services |
17,557 | 20.8 | % | 13,995 | 24.0 | % | 3,562 | 25.5 | % | |||||||||||||||
| Other |
3,638 | 4.3 | % | 4,658 | 8.0 | % | (1,020 | ) | (21.9 | %) | ||||||||||||||
|
|
|
|
|
|
|
|
|
|
|
|||||||||||||||
| Total revenue |
$ | 84,579 | 100.0 | % | $ | 58,326 | 100.0 | % | $ | 26,253 | 45.0 | % | ||||||||||||
|
|
|
|
|
|
|
|
|
|
|
|||||||||||||||
Growth in software services revenue was primarily attributable to the recognition of full years’ worth of software service revenues related to customer implementations completed in fourth quarter of 2013, with majority of the growth from our Enterprise/State segment. Our professional services revenue increased due to revenue recognition from newly completed implementations.
For all arrangements that include multiple elements, the allocation of revenue from a customer contract to software services and professional services is based on the type of multiple-element arrangement. For multiple-element arrangements containing hosted software, we identify each software and professional services unit of accounting based on the terms of the customer contract and allocate revenue to each unit of accounting based on the relative selling price of each deliverable. Revenue from each element is recognized as each element is delivered. For multiple-element arrangements containing non-hosted software, during the periods reported we accounted for the entire arrangement as a single unit of accounting, because some or all of the deliverable elements did not have stand-alone value when the related contracts were executed. In these situations, all revenue has been deferred until delivery of the final element, at which time the contract value is recognized ratably over the longer of the contract or expected customer relationship. Less than 30% of our consolidated revenues in each of the periods ended December 31, 2014 and December 31, 2013 had multiple-element arrangements containing non-hosted software.
Segment Revenue
| Year Ended December 31, | ||||||||||||||||||||||||
| 2014 | 2013 | Period-to-Period Change |
||||||||||||||||||||||
| Amount | % of Revenue |
Amount | % of Revenue |
Amount | % | |||||||||||||||||||
| (dollars in thousands) | ||||||||||||||||||||||||
| Revenue by Segment: |
||||||||||||||||||||||||
| Enterprise/Commercial |
$ | 40,369 | 47.7 | % | $ | 33,028 | 56.7 | % | $ | 7,341 | 22.2 | % | ||||||||||||
| Enterprise/State |
21,632 | 25.6 | % | 3,177 | 5.4 | % | 18,455 | 580.9 | % | |||||||||||||||
| Medicare |
16,175 | 19.1 | % | 15,941 | 27.3 | % | 234 | 1.5 | % | |||||||||||||||
| Private Exchange |
6,403 | 7.6 | % | 6,180 | 10.6 | % | 223 | 3.6 | % | |||||||||||||||
|
|
|
|
|
|
|
|
|
|
|
|
|
|||||||||||||
| Total Revenue |
$ | 84,579 | 100.0 | % | $ | 58,326 | 100.0 | % | $ | 26,253 | 45.0 | % | ||||||||||||
|
|
|
|
|
|
|
|
|
|
|
|||||||||||||||
The growth in our Enterprise/Commercial revenue was primarily attributable to a $8.5 million increase in our software services revenue driven by an increase in the number of health plan customers using our platform as of December 31, 2014, as compared to December 31, 2013, offset by a $1.1 million decrease in professional services revenue. The growth in our Enterprise/State revenue was primarily attributable to an increase of
59
Table of Contents
$9.4 million in software services revenue, and a $4.2 million increase in professional services revenue, driven primarily by revenue recognized from new customer implementations completed in the fourth quarter of 2013, along with $4.9 million of accelerated revenue recognition related to a termination of a state exchange contract in the third quarter of 2014. The growth in our Medicare and Private Exchange revenue was primarily attributable to a $2.8 million increase in software services revenue driven by an increase in the number of health plan and broker customers using our platform as of December 31, 2014 as compared to December 31, 2013, offset by a $1.5 million decrease in professional services revenue and $0.8 million in other revenue.
Cost of Revenue
| Year Ended December 31, | ||||||||||||||||||||||||
| 2014 | 2013 | Period-to-Period Change |
||||||||||||||||||||||
| Amount | % of Revenue |
Amount | % of Revenue |
Amount | % | |||||||||||||||||||
| (dollars in thousands) | ||||||||||||||||||||||||
| Cost of Revenue |
$ | 52,431 | 62.0 | % | $ | 50,173 | 86.0 | % | $ | 2,258 | 4.5 | % | ||||||||||||
The dollar increase in cost of revenue was primarily due to a $6.2 million decrease in capitalization of deferred implementation costs related to new customer implementations and a $4.6 million increase in amortization of previously deferred implementation costs, partially offset by a $2.3 million decrease in salaries and personnel-related costs associated with 2014 staffing realignments, a $4.6 million decrease in professional fees to outside contractors utilized to support customer implementation services and a decrease of approximately $1.6 million primarily related to reduced travel expenses to customer sites and hosting expenses to support our platforms.
Segment Gross Margin
| Year Ended December 31, | ||||||||||||||||||||||||
| 2014 | 2013 | Period-to-Period Change |
||||||||||||||||||||||
| Amount | % of Revenue |
Amount | % of Revenue |
Amount | % | |||||||||||||||||||
| (dollars in thousands) | ||||||||||||||||||||||||
| Segment Gross Margin: |
||||||||||||||||||||||||
| Enterprise/Commercial |
$ | 10,323 | 25.6 | % | $ | (747 | ) | (2.3 | %) | $ | 11,070 | * | ||||||||||||
| Enterprise/State |
11,038 | 51.0 | % | (1,121 | ) | (35.3 | %) | 12,159 | * | |||||||||||||||
| Medicare |
9,451 | 58.4 | % | 7,839 | 49.2 | % | 1,612 | 20.6 | % | |||||||||||||||
| Private Exchange |
1,336 | 20.9 | % | 2,182 | 35.3 | % | (846 | ) | (38.8 | %) | ||||||||||||||
|
|
|
|
|
|
|
|
|
|
|
|
|
|||||||||||||
| Total Gross Margin |
$ | 32,148 | 38.0 | % | $ | 8,153 | 14.0 | % | $ | 23,995 | 294.3 | % | ||||||||||||
|
|
|
|
|
|
|
|||||||||||||||||||
| * | Not meaningful |
Enterprise/Commercial gross margin increased in dollars by $11.1 million and was driven primarily by a $7.3 million increase in Enterprise/Commercial revenue, and a $3.7 million decrease in Enterprise/Commercial cost of revenue. The increase in revenue is primarily attributable to recognition of previously deferred revenue on software that is implemented, which increased due to new health plan customer implementations completed in 2014 along with a full years’ revenue on those implementations completed in the fourth quarter of 2013. Our Enterprise/Commercial gross margin included $0.4 million and $0.5 million of depreciation and amortization for each of the years ended December 31, 2014 and 2013, respectively.
Enterprise/State gross margin increased by $12.2 million and was driven primarily by a $18.5 million increase in Enterprise/State revenue, partially offset by a $6.3 million increase in Enterprise/State cost of
60
Table of Contents
revenue. The increase in cost of revenue is primarily attributable to amortization of previously deferred implementation costs related to new customer implementations that were completed in the fourth quarter of 2013 and throughout 2014, along with $0.7 million of accellerated deferred cost amortization related to the termination of a state exchange contract in the third quarter of 2014. Our Enterprise/State gross margin included $0.1 million in depreciation and amortization for each of the years ended December 31, 2014 and 2013.
Medicare gross margin increased by $1.6 million and was driven primarily by a $0.2 million increase in Medicare revenue and $1.4 million decrease in Medicare cost of revenue. The decrease in cost of revenue is primarily attributable to a decrease in personnel costs. Our Medicare gross margin included $2.5 million and $2.4 million in depreciation and amortization for the years ended December 31, 2014 and 2013, respectively.
Private Exchange gross margin decreased by $0.8 million and was driven by a $1.1 million increase in Private Exchange cost of revenue, offset by a $0.2 million increase in Private Exchange revenue. The increase in cost of revenue is primarily attributable to an increase in personnel costs to support new customer implementation efforts. Our Private Exchange gross margin included $0.8 million in depreciation and amortization for each of the years ended December 31, 2104 and 2013, respectively.
The negative gross margins recorded in the Enterprise/Commercial and Enterprise/State reportable segments during the year ended December 31, 2013 were primarily caused by the amount of indirect labor and overhead in cost of revenue that indirectly support future revenue, but which may not be deferred and capitalized to “deferred implementation costs” on our consolidated balance sheet. Specifically, in both reportable segments, the Company experienced a significant level of new customer implementation activity (more than 30 software implementations during the period reported). The Company deferred the corresponding implementation services revenue and direct costs associated with those implementations, but expensed the associated indirect labor and overhead in cost of revenue. As the Enterprise/Commercial and Enterprise/State software implementations were completed during the fourth quarter of 2013 and the first quarter of 2014, the Company started amortizing the deferred revenue and related deferred implementation costs associated with these implementations. The transition from a period of implementing software with no revenue to a period of customer software usage and revenue recognition is a key driver of the change from the negative gross margins recorded in the Enterprise/Commercial and Enterprise/State reportable segments during the year ended 31, 2013 to positive gross margins in the year ended December 31, 2014.
Research and Development
| Year Ended December 31, | ||||||||||||||||||||||||
| 2014 | 2013 | Period-to-Period Change |
||||||||||||||||||||||
| Amount | % of Revenue |
Amount | % of Revenue |
Amount | % | |||||||||||||||||||
| (dollars in thousands) | ||||||||||||||||||||||||
| Research and Development |
$ | 18,125 | 21.4 | % | $ | 11,806 | 20.2 | % | $ | 6,319 | 53.5 | % | ||||||||||||
The increase in research and development expense in dollars was primarily attributable to a $4.2 million increase in salaries and personnel-related costs, due to additional research and development headcount. Additionally, we experienced a $1.1 million increase in engineering consulting fees for assistance in product development and $1.0 million related primarily to increases in facilities and travel costs driven by an increase in headcount.
The increased research and development spending has resulted in expanded product capabilities with our Private Exchange software solution, which has translated into new customer contracts and revenue opportunities, and productivity enhancements via reduced implementation cycle times in our Enterprise/Commercial software solutions, which we anticipate will lead to lower implementation costs in future periods. The increased
61
Table of Contents
expenditures have also resulted in expanded product capabilities within our Enterprise/State solution that allow us to pursue sales opportunities in new markets and improve Medicare shopping, enrollment and member engagement software capabilities, which we expect will lead to incremental sales in future periods.
Sales and Marketing
| Year Ended December 31, | ||||||||||||||||||||||||
| 2014 | 2013 | Period-to-Period Change |
||||||||||||||||||||||
| Amount | % of Revenue |
Amount | % of Revenue |
Amount | % | |||||||||||||||||||
| (dollars in thousands) | ||||||||||||||||||||||||
| Sales and Marketing |
$ | 7,729 | 9.1 | % | $ | 6,800 | 11.7 | % | $ | 929 | 13.7 | % | ||||||||||||
The increase in sales and marketing expense in dollars was primarily attributable to a $0.8 million increase in salaries and personnel-related costs, due to sales employees hired in 2014 to continue driving revenue growth.
General and Administrative
| Year Ended December 31, | ||||||||||||||||||||||||
| 2014 | 2013 | Period-to-Period Change |
||||||||||||||||||||||
| Amount | % of Revenue |
Amount | % of Revenue |
Amount | % | |||||||||||||||||||
| (dollars in thousands) | ||||||||||||||||||||||||
| General and Administrative |
$ | 10,552 | 12.5 | % | $ | 12,187 | 20.9 | % | ($ | 1,635 | ) | (13.4 | %) | |||||||||||
The decrease in general and administrative expense in dollars was primarily attributable to a $1.0 million benefit recorded in the fourth quarter of 2014 related to the decrease in fair value of the DestinationRX contingent acquisition consideration, a $0.7 million decrease in consulting and professional fees directly related to the 2013 acquisition and integration of DRX into our business and a $0.4 million benefit from the settlement of a number of sales and use tax contingencies in the fourth quarter of 2014, partially offset by a $0.5 million increase in other expenses. While we expect our general and administrative expenses will grow in dollars as our business grows, we believe such expenses as a percent of revenue will decline.
Interest Expense
| Year Ended December 31, | ||||||||||||||||||||||||
| 2014 | 2013 | Period-to-Period Change |
||||||||||||||||||||||
| Amount | % of Revenue |
Amount | % of Revenue |
Amount | % | |||||||||||||||||||
| (dollars in thousands) | ||||||||||||||||||||||||
| Interest Expense |
$ | 5,937 | 7.0 | % | $ | 4,644 | 8.0 | % | $ | 1,293 | 27.8 | % | ||||||||||||
The increase in interest expense in dollars was primarily attributable to an increase in average borrowings outstanding and a higher weighted average cost of debt on our outstanding borrowings during the year ended December 31, 2014, as compared to the year ended December 31, 2013.
62
Table of Contents
Comparison of Years Ended December 31, 2013 and 2012
Revenue
| Year Ended December 31, | ||||||||||||||||||||||||
| 2013 | 2012 | Period-to-Period Change |
||||||||||||||||||||||
| Amount | % of Revenue |
Amount | % of Revenue |
Amount | % | |||||||||||||||||||
| (dollars in thousands) | ||||||||||||||||||||||||
| Revenue by Type: |
||||||||||||||||||||||||
| Software services |
$ | 39,673 | 68.0 | % | $ | 16,906 | 57.0 | % | $ | 22,767 | 134.7 | % | ||||||||||||
| Professional services |
13,995 | 24.0 | 12,402 | 41.9 | 1,593 | 12.8 | ||||||||||||||||||
| Other |
4,658 | 8.0 | 318 | 1.1 | 4,340 | * | ||||||||||||||||||
|
|
|
|
|
|
|
|
|
|
|
|
|
|||||||||||||
| Total revenue |
$ | 58,326 | 100.0 | % | $ | 29,626 | 100.0 | % | $ | 28,700 | 96.9 | % | ||||||||||||
|
|
|
|
|
|
|
|
|
|
|
|||||||||||||||
| * | Not meaningful |
The increase in software services revenue for the year ended December 31, 2013, as compared to the year ended December 31, 2012, was primarily attributable to a $14.7 million increase in revenue associated with our acquisition of DRX in January 2013, as well as year-over-year growth in software services revenue attributed to the completion of new customer implementations in the third and fourth quarter of 2013 within our Enterprise/Commercial and Enterprise/State segments.
The increase in other revenue for the year ended December 31, 2013, as compared to the year ended December 31, 2012, was primarily attributable to commission revenue from DRX, which we acquired in January 2013.
For all arrangements that include multiple elements, the allocation of revenue from a customer contract to software services and professional services is based on the type of multiple-element arrangement. For multiple-element arrangements containing hosted software, we identify each software and professional services unit of accounting based on the terms of the customer contract and allocate revenue to each unit of accounting based on the relative selling price of each deliverable. Revenue from each element is recognized as each element is delivered. For multiple-element arrangements containing non-hosted software, during the periods reported we accounted for the entire arrangement as a single unit of accounting, because some or all of the deliverable elements did not have stand-alone value when the related contracts were executed. In these situations, all revenue has been deferred until delivery of the final element, at which time the contract value is recognized ratably over the longer of the contract or expected customer relationship. Less than 30% of our consolidated revenues in each of the periods ended December 31, 2013 and December 31, 2012 had multiple-element arrangements containing non-hosted software.
63
Table of Contents
Segment Revenue
| Year Ended December 31, | ||||||||||||||||||||||||
| 2013 | 2012 | Period-to-Period Change |
||||||||||||||||||||||
| Amount | % of Revenue |
Amount | % of Revenue |
Amount | % | |||||||||||||||||||
| (dollars in thousands) | ||||||||||||||||||||||||
| Revenue by Segment: |
||||||||||||||||||||||||
| Enterprise/Commercial |
$ | 33,028 | 56.7 | % | $ | 28,341 | 95.7 | % | $ | 4,687 | 16.5 | % | ||||||||||||
| Enterprise/State |
3,177 | 5.4 | 65 | 0.2 | 3,112 | * | ||||||||||||||||||
| Medicare |
15,941 | 27.3 | — | N/A | 15,941 | N/A | ||||||||||||||||||
| Private Exchange |
6,180 | 10.6 | 1,220 | 4.1 | 4,960 | 406.6 | ||||||||||||||||||
|
|
|
|
|
|
|
|
|
|
|
|
|
|||||||||||||
| Total Revenue |
$ | 58,326 | 100.0 | % | $ | 29,626 | 100.0 | % | $ | 28,700 | 96.9 | % | ||||||||||||
|
|
|
|
|
|
|
|
|
|
|
|||||||||||||||
| * | Not meaningful |
The growth in Enterprise/Commercial revenue for the year ended December 31, 2013, as compared to the year ended December 31, 2012, was primarily attributable to a $6.9 million increase in our software services revenue driven by an increase in the number of health plan customers using our platform as of December 31, 2013, as compared to December 31, 2012, partially offset by a $2.2 million decrease in professional services and other revenue. The growth in Enterprise/State revenue year-over-year was primarily attributable to an increase of $1.3 million in our software services revenue and $1.8 million increase in professional services revenue, both driven by an increase in the number of state customers using our platform following the completion of implementation efforts during the year ended December 31, 2013, as compared to the year ended December 31, 2012. The growth in the Medicare and Private Exchange revenue for the year ended December 31, 2013, as compared to the year ended December 31, 2012, was primarily attributable to our acquisition of DRX in January 2013.
Cost of Revenue
| Year Ended December 31, | ||||||||||||||||||||||||
| 2013 | 2012 | Period-to-Period Change |
||||||||||||||||||||||
| Amount | % of Revenue |
Amount | % of Revenue |
Amount | % | |||||||||||||||||||
| (dollars in thousands) | ||||||||||||||||||||||||
| Cost of Revenue |
$ | 50,173 | 86.0 | % | $ | 22,886 | 77.2 | % | $ | 27,287 | 119.2 | % | ||||||||||||
The increase in cost of revenue for the year ended December 31, 2013, as compared to the year ended December 31, 2012, was attributable to a $11.2 million increase in costs associated with our acquisition of DRX in January 2013. In addition, the increase was attributed to a $9.5 million increase in salaries and personnel-related costs associated with staffing that was added during the year and a $13.8 million increase in professional fees, both in support of customer growth. In addition, we experienced a $0.7 million increase in hosting expenses to support our platforms, a $1.6 million increase in travel expenses to customer sites and a $0.5 million increase in recruiting costs driven by additional hiring. These amounts were offset by a $11.0 million increase in implementation costs that we deferred during the year and which will be recognized in future periods.
64
Table of Contents
Segment Gross Margin
| Year Ended December 31, | ||||||||||||||||||||||||
| 2013 | 2012 | Period-to-Period Change |
||||||||||||||||||||||
| Amount | % of Revenue |
Amount | % of Revenue |
Amount | % | |||||||||||||||||||
| (dollars in thousands) | ||||||||||||||||||||||||
| Segment Gross Margin: |
||||||||||||||||||||||||
| Enterprise/Commercial |
$ | (747 | ) | (2.3 | )% | $ | 7,241 | 25.5 | % | $ | (7,988 | ) | * | |||||||||||
| Enterprise/State |
(1,121 | ) | (35.3 | ) | (784 | ) | * | (337 | ) | * | ||||||||||||||
| Medicare |
7,839 | 49.2 | — | N/A | 7,839 | N/A | ||||||||||||||||||
| Private Exchange |
2,182 | 35.3 | 283 | 23.2 | % | 1,899 | * | |||||||||||||||||
|
|
|
|
|
|
|
|
|
|
|
|
|
|||||||||||||
| Total Gross Margin |
$ | 8,153 | 14.0 | % | $ | 6,740 | 22.8 | % | $ | 1,413 | 21.0 | % | ||||||||||||
|
|
|
|
|
|
|
|||||||||||||||||||
| * | Not meaningful |
The decrease in Enterprise/Commercial gross margin for the year ended December 31, 2013, as compared to the year ended December 31, 2012, was driven by a $12.7 million, or 60.1%, increase in Enterprise/Commercial cost of revenue, partially offset by a $4.7 million, or 16.5%, increase in Enterprise/Commercial revenue. The increase in cost of revenue was primarily attributable to costs associated with providing implementation services, which increased due to a higher number of new health plan customer implementations in 2013 as compared to 2012. Our Enterprise/Commercial gross margin included $0.5 million and $0.5 million of depreciation and amortization for the years ended December 31, 2013 and 2012, respectively.
The decrease in Enterprise/State gross margin for the year ended December 31, 2013, as compared to the year ended December 31, 2012, was driven by a $3.4 million increase in Enterprise/State cost of revenue, partially offset by a $3.1 million increase in Enterprise/State revenue. The increase in cost of revenue was primarily attributable to costs associated with providing implementation services, which increased due to a higher number of new state customer implementations in 2013 as compared to 2012. Our Enterprise/State gross margin included $0.1 million of depreciation and amortization for the years ended December 31, 2013 and 2012.
The increase in Medicare and Private Exchange gross margin for the year ended December 31, 2013, as compared to the year ended December 31, 2012, was primarily attributable to our acquisition of DRX in January 2013.
Research and Development
| Year Ended December 31, | ||||||||||||||||||||||||
| 2013 | 2012 | Period-to-Period Change |
||||||||||||||||||||||
| Amount | % of Revenue |
Amount | % of Revenue |
Amount | % | |||||||||||||||||||
| (dollars in thousands) | ||||||||||||||||||||||||
| Research and Development |
$ | 11,806 | 20.2 | % | $ | 7,371 | 24.9 | % | $ | 4,435 | 60.2 | % | ||||||||||||
The increase in research and development expense for the year ended December 31, 2013, as compared to the year ended December 31, 2012, was primarily attributable to a $1.7 million increase in costs associated with our acquisition of DRX in January 2013. In addition, we experienced a $1.4 million increase in salaries and personnel-related costs associated with research and development personnel hired in 2013 and a $1.2 million increase in engineering consulting fees, both related to continued development and feature enhancements to our next generation of software services which translated into new 2014 private exchange contracts, software implementation productivity enhancements and expanded software features used by our Enterprise/State and
65
Table of Contents
Medicare segment customers. In dollars, we expect to continue to invest in the research and development of our current and proposed software services over the foreseeable future. Additionally, we experienced a $0.2 million increase in travel expenses to customer sites.
Sales and Marketing
| Year Ended December 31, | ||||||||||||||||||||||||
| 2013 | 2012 | Period-to-Period Change |
||||||||||||||||||||||
| Amount | % of Revenue |
Amount | % of Revenue |
Amount | % | |||||||||||||||||||
| (dollars in thousands) | ||||||||||||||||||||||||
| Sales and Marketing |
$ | 6,800 | 11.7 | % | $ | 6,644 | 22.4 | % | $ | 156 | 2.3 | % | ||||||||||||
The increase in sales and marketing expense for the year ended December 31, 2013, as compared to the year ended December 31, 2012, was primarily attributable to a $1.2 million increase in costs associated with our acquisition of DRX in January 2013, partially offset by a $0.6 million decrease in commissions and sales bonus expenses due to decreased bookings year over year within our Enterprise/Commercial segment.
General and Administrative
| Year Ended December 31, | ||||||||||||||||||||||||
| 2013 | 2012 | Period-to-Period Change |
||||||||||||||||||||||
| Amount | % of Revenue |
Amount | % of Revenue |
Amount | % | |||||||||||||||||||
| (dollars in thousands) | ||||||||||||||||||||||||
| General and Administrative |
$ | 12,187 | 20.9 | % | $ | 7,492 | 25.3 | % | $ | 4,695 | 62.7 | % | ||||||||||||
The increase in general and administrative expense for the year ended December 31, 2013, as compared to the year ended December 31, 2012, was primarily attributable to a $3.8 million increase in costs associated with our acquisition of DRX in January of 2013, as well as a $0.7 million increase in consulting and professional fees directly related to the acquisition of and integration of DRX into our business and a $0.2 million increase related to added personnel to support our growing business.
We expect to continue to hire additional general and administrative personnel to support the growth of our business, and therefore expect general and administrative expense, in dollars, will continue to increase. However, we expect revenue growth to outpace general and administrative expense growth and so expect general and administrative expense, as a percentage of revenue, to decrease in the future.
Interest Expense
| Year Ended December 31, | ||||||||||||||||||||||||
| 2013 | 2012 | Period-to-Period Change |
||||||||||||||||||||||
| Amount | % of Revenue |
Amount | % of Revenue |
Amount | % | |||||||||||||||||||
| (dollars in thousands) | ||||||||||||||||||||||||
| Interest Expense |
$ | 4,644 | 8.0 | % | $ | 1,992 | 6.7 | % | $ | 2,652 | 133.1 | % | ||||||||||||
The increase in interest expense for the year ended December 31, 2013, as compared to the year ended December 31, 2012, was primarily attributed to an increase in our outstanding borrowings during 2013.
66
Table of Contents
Critical Accounting Policies and Significant Judgments and Estimates
Our management’s discussion and analysis of our financial condition and results of operations is based on our consolidated financial statements, which have been prepared in accordance with GAAP. The preparation of these consolidated financial statements requires us to make estimates and assumptions that affect the reported amounts of assets and liabilities, disclosure of contingent assets and liabilities at the date of the consolidated financial statements, and the reported amounts of revenue and expenses. In accordance with GAAP, we base our estimates on historical experience and on various other assumptions that we believe reasonable under the circumstances. Actual results might differ from these estimates under different assumptions or conditions.
While our significant accounting policies are more fully described in Note 2 to our consolidated financial statements appearing in Part II, Item 8: “Financial Statement” of this Annual Report on Form 10-K, we believe the following accounting policies are critical to the process of making significant judgments and estimates in the preparation of our consolidated financial statements.
We have elected to take advantage of the extended transition period for complying with new or revised accounting standards under Section 102(B)(1), which will allow us to delay the adoption of new or revised accounting standards that have different effective dates for public and private companies until those standards apply to private companies. As a result of this election, our financial statements may not be comparable to companies that comply with public company effective dates.
Revenue Recognition and Deferred Revenue
We derive our revenue primarily from the following sources: (a) the sale, implementation and ongoing support of our insurance distribution solutions; (b) fees from brokers for the right to access our multi-payer quoting platform; (c) our Medicare.gov contract, which is a cost-plus-fixed-fee contract; and (d) commissions earned on annual employee enrollments in which our health plan network and software solutions are used in connection with each enrollment. In all contractual arrangements, we determine whether persuasive evidence of an arrangement exists, services have been rendered, the fee is fixed or determinable, and collection is probable. If any of these criteria are not met, the Company does not recognize revenue until all of the criteria are met.
We have multiple sources of revenue, which fall under different sets of revenue recognition rules including accounting for revenue under hosted and non-hosted arrangements and percentage of completion accounting. The determination of whether the contract meets the definition of software and the corresponding separability of the elements and fair value assessments require judgment.
We recognize revenue for upfront license and implementation fees over the longer of the term of the customer agreement or the estimated customer relationship period based on various factors including, but not limited to, contract terms, contract extensions and renewals, customer attrition, the nature and pace of technology advancements and obsolescence, and the anticipated impact of demand, competition, and other regulatory and economic factors.
Most of our deferred revenue relates to professional services performed for our Enterprise/Commercial and Enterprise/States customers, which require a more extensive and lengthy implementation. We continue to evaluate the term over which our Enterprise/State implementation fee revenue is recognized as we gain more experience with customer contract renewals given the Enterprise/State segment is less mature than our Enterprise/Commercial segment. At December 31, 2014, deferred revenue related to the Enterprise/State segment was $13.9 million and is being recognized in our statements of operations over a weighted average period of approximately 2.25 years. If the weighted average period was increased by one year to 3.25 years the Enterprise/State revenue for the year ended December 31, 2014 would have decreased by approximately $4.0 million.
67
Table of Contents
Deferred Implementation Costs
We capitalize certain direct, incremental costs associated with new customer implementation efforts in our Enterprise/Commercial and Enterprise/State reporting segments, and we account for those costs as deferred implementation costs, to the extent that they are deemed recoverable. We had $24.6 million and $19.9 million of deferred implementation costs recorded as of December 31, 2014 and 2013, respectively. The increase in deferred implementation costs is correlated with the increase in implementation of new software solutions resulting from health insurance customers responding to changes mandated by the PPACA. The increase in deferred implementation costs from 2013 to 2014 is primarily due to capitalization of 2014 direct implementation expenditures related to new Enterprise/Commercial customer solutions. Deferred implementation costs are amortized consistent with the recognition of deferred revenue. The deferred implementation cost balance is subject to periodic impairment evaluation to determine recoverability of the asset. At every reporting period, we evaluate the recoverability of the deferred implementation costs, factoring in the remaining implementation schedule, estimated cost to complete the implementation effort and the probability of revenue in excess of deferred costs capitalized.
Goodwill and Acquired Intangible Assets
Goodwill represents the excess of the aggregate of the fair value of consideration transferred in a business combination over the fair value of assets acquired, net of liabilities assumed. Goodwill is not amortized, but is subject to an annual impairment test. We test goodwill for impairment at the reporting unit level annually on October 31, or more frequently if events or changes in business circumstances indicate the carrying value may not be recoverable.
We test goodwill for impairment at the reporting unit level using a two-step approach. In step one, we determine if the fair value of the reporting unit exceeds the unit’s carrying value. If step one indicates that the fair value of the reporting unit is less than its carrying value, we perform step two, determining the fair value of goodwill and, if the carrying value of goodwill exceeds the implied fair value, recording an impairment charge.
We have three reporting units with goodwill, Enterprise/Commercial, Medicare and Private Exchange; the Enterprise/Commercial, Medicare and Private Exchange reporting units have $7.7 million, $14.7 million and $4.3 million of goodwill, respectively, as of December 31, 2014. To determine the fair value of our reporting units, we primarily use a discounted cash flow analysis which requires significant assumptions and estimates about future operations. Significant judgments inherent in this discounted cash flow analysis include the expected revenue growth and operating margins and the determination of an appropriate discount rate.
We review acquired intangible assets for impairment whenever events or changes in circumstances indicate the carrying amount of the asset may not be recoverable. Recoverability is assessed by comparing the carrying amount of the asset to the undiscounted future cash flows expected to be generated by the asset. Measurement of any impairment loss is based on estimated fair value.
Given the significance of our goodwill and intangible assets, an adverse change in fair value could result in an impairment charge, which could be material to our financial statements. Each reporting unit had greater than 10% excess fair value over carrying value as of our last assessment.
Stock-Based Compensation
Prior to our December 2014 initial public offering, we issued one type of stock-based award under our equity incentive plans: stock options. Upon completing our initial public offering, our 2014 Equity Incentive Plan became effective and replaced all prior equity incentive plans, which have been terminated except with respect to currently outstanding stock options. Our 2014 Equity Incentive Plan permits several stock-based awards, including stock options and restricted stock units, or RSUs. Stock-based awards granted to employees, directors and third parties are measured at fair value at each grant date. When determining the fair value of our stock
68
Table of Contents
options, there are significant judgments involved in estimating the fair value of our common stock prior to our initial public offering and determining our expected stock price volatility using what we consider to be comparable publicly traded companies.
Determination of the Fair Value of Common Stock on Grant Dates
Prior to our initial public offering, we were a private company with no active public market for our common stock. We had periodically determined for financial reporting purposes the estimated per share fair value of our common stock at various dates using contemporaneous valuations performed with the assistance of an independent third-party in accordance with the guidance outlined in the American Institute of Certified Public Accountants Practice Aid, “Valuation of Privately Held Company Equity Securities Issued as Compensation,” or the Practice Aid. We performed these valuations as of August 31, 2012, December 31, 2012 and December 31, 2013, and utilized the probability weighted expected return model, or PWERM, approach to allocate our equity value to our common shares. The PWERM approach employs various market, income, or cost approach calculations depending on the likelihood of various liquidation scenarios. In conducting the valuations, we considered all objective and subjective factors that we believed to be relevant for each valuation conducted, including management’s estimate of our business condition, prospects, and operating performance at each valuation date. Within the valuations performed by our management, a range of factors, assumptions, and methodologies were used. The significant factors included:
| • | the fact that we were a privately held technology company and our common stock was illiquid; |
| • | the nature and history of our business; |
| • | our historical financial performance; |
| • | our discounted future cash flows, based on our projected operating results; |
| • | valuations of comparable public companies; |
| • | the potential impact on common stock of liquidation preference rights of redeemable convertible preferred stock under different valuation scenarios; |
| • | general economic conditions and the specific outlook for our industry; |
| • | the likelihood of achieving a liquidity event for shares of our common stock such as an initial public offering or a sale of our company, given prevailing market conditions, or remaining a private company; and |
| • | the state of the initial public offering market for similarly situated privately held technology companies. |
The dates of our stock valuations coincided within a reasonable period of the dates of our stock-based compensation grants.
The additional factors considered when determining any changes in fair value between the most recent valuation and the grant dates included our stage of development, our operating and financial performance, current business conditions and the market performance of comparable publicly traded companies.
There were significant judgments and estimates inherent in these valuations. These judgments and estimates included assumptions regarding the probability of future events for the company, including an initial public offering, a strategic merger or sale, our remaining a private company, the sale of our assets and resulting dissolution of our company and the time to completing an initial public offering or other liquidity event. When determining the value of any of these four possible outcomes, we primarily used the income approach to determine the equity value of our company. Significant assumptions included future operating performance, primarily the expected revenue growth and gross margins, and the determination of an appropriate discount rate and marketability discount. If we made different assumptions, our stock-based compensation expense, net loss
69
Table of Contents
and net loss per common share could have been significantly different. A $1 per share increase in the stock valuation would impact the grant date fair values of the options granted during the years ended December 31, 2014 and 2013 by approximately $1 per option.
Income Taxes
We account for income taxes under the asset and liability method. We recognize deferred tax assets and liabilities for the future tax consequences attributable to differences between the financial statement carrying amounts of existing assets and liabilities and their respective tax bases, as well as for operating loss and tax credit carryforwards. We measure deferred tax assets and liabilities using enacted tax rates expected to apply to taxable income in the years in which we expect to recover or settle those temporary differences. We recognize the effect of a change in tax rates on deferred tax assets and liabilities in the results of operations in the period that includes the enactment date.
We reduce the measurement of a deferred tax asset, if necessary, by a valuation allowance if it is more likely than not that we will not realize some or all of the deferred tax asset. We recorded a valuation allowance for a portion of our deferred tax assets of $36.4 million and $37.9 million as of December 31, 2014 and 2013, respectively, based on the projected profitability of the entity in the respective tax jurisdiction, which includes a full valuation allowance against net operating loss carryforwards. The valuation allowance is based on an evaluation of the uncertainty that the carryforwards will be realized. Our projected net income could increase if we determine we will be able to use more carryforwards than currently expected.
Liquidity and Capital Resources
Sources of Liquidity
In December 2014, we completed an initial public offering in which we issued and sold 6,635,000 shares of our common stock and existing shareholders sold 995,250 shares of our common stock at a public offering price of $8.00 per share. We did not receive any proceeds from the sale of our common stock by the existing shareholders. We received net proceeds of $45.2 million after deducting underwriting discounts and commissions and other direct offering expenses, which were available for general corporate purposes.
Prior to our initial public offering, we funded our operations primarily through cash from operating activities, bank and subordinated debt borrowings and the private issuance of equity securities. As of December 31, 2014, we have cash and cash equivalents of $28.3 million which is held for working capital and other general corporate purposes, including to develop new technologies, fund capital expenditures, make investments in or acquisitions of other businesses, solutions or technologies or repay a portion of our outstanding borrowings. We do not enter into investments for trading or speculative purposes. Our policy is to invest any cash in excess of our immediate requirements in investments designed to preserve the principal balance and provide liquidity. Accordingly, our cash and cash equivalents are invested primarily in demand deposit and money market accounts that are currently providing only a minimal return.
Senior Credit Facility
On January 15, 2013, we entered into a bank credit facility to provide for short-term working capital and long-term investment needs, as amended and restated from time to time, or the Credit Facility. The Credit Facility replaced our previous bank facility, which was paid in full on January 15, 2013.
The Credit Facility initially provided for $22.5 million of term loans, or Senior Term Loans, and $5.0 million of revolving credit, or the Senior Revolving Credit Facility, through January 15, 2018, or the Maturity Date. The Senior Term Loans require quarterly principal payments of $0.3 million commencing on March 31, 2013, with the unpaid principal balance payable in full on the Maturity Date. On March 12, 2014, we amended the Credit Facility to, among other things, increase the Senior Revolving Credit Facility by $5.0 million to $10.0 million.
70
Table of Contents
The Senior Term Loans accrue interest at a rate based on the London Interbank Offered Rate, or LIBOR, plus a LIBOR margin payable monthly. The Senior Revolving Credit Facility accrues interest monthly at a rate based on LIBOR, the Fed Funds Rate or bank’s Prime Rate. As of December 31, 2014, the interest rates on the outstanding Senior Term Loans and Senior Revolving Credit Facility advances were 6.5% to 8.25%.
The Credit Facility contains customary representations, warranties and covenants of the Company, as well as various limitations on the activities of the Company as they relate to additional indebtedness, junior liens, investments, capital expenditures, and mergers and acquisitions. As of December 31, 2014, we were in compliance with financial covenants.
On March 10, 2015, we amended the Credit Facility to, among other things, establish the 2015 financial covenants, as defined in the Credit Facility. The financial covenants include a quarterly building EBITDA covenant and a minimum liquidity covenant. The quarterly building EBITDA covenant sets forth specific levels of cumulative trailing twelve month EBITDA measured on calendar quarter ends, as defined. The quarterly building EBITDA covenant increases from $3.5 million for the measurement period ending March 31, 2015 to $9.0 million for the year ending December 31, 2015. The minimum liquidity covenant requires us to maintain a minimum liquidity level of $15.0 million at all times, with minimum liquidity defined as the sum of cash and cash equivalents and borrowing capacity available to us under the $10.0 million Senior Revolving Credit Facility. The minimum liquidity covenant expires once we achieve a Fixed Coverage Ratio, as defined, in excess of 1.25:1.00 for two consecutive quarters. We expect to be in compliance with the 2015 financial covenants.
Subordinated Loans
On March 18, 2013, we entered into a Senior Subordinated Term Loan Agreement with THL Corporate Finance, Inc., or the THL Note, for total proceeds of $10.0 million less $0.2 million of original issue discount, or OID, to finance the repayment of the $6.0 million subordinated promissory notes and to fund working capital needs. The THL Note maturity date is July 15, 2018, with the principal balance payable in full at the maturity date.
In the first half of 2014, we amended the THL Note to, among other things, provide $20.0 million of additional subordinated term note financing through July 2018. The $20.0 million additional financing was reduced by approximately $0.5 million of original issue discount.
Interest on the THL Note accrues at a variable rate of LIBOR plus a LIBOR margin, and is payable monthly. As of December 31, 2014, the rate was 12.0% and the outstanding balance, net of OID, was $29.5 million.
On March 10, 2015, we amended the THL Note to, among other things, establish 2015 financial covenants, as defined in the THL Note. The financial covenants include a quarterly building EBITDA covenant and a minimum liquidity covenant. The quarterly building EBITDA covenant sets forth specific levels of cumulative trailing twelve month EBITDA measured on calendar quarter ends, as defined. The quarterly building EBITDA covenant increases from $2.6 million for the measurement period ending March 31, 2015 to $8.1 million for the year ending December 31, 2015. The minimum liquidity covenant requires us to maintain a minimum liquidity level of $13.5 million at all times, with minimum liquidity defined as the sum of cash and cash equivalents and borrowing capacity available to us under the $10.0 million Senior Revolving Credit Facility. The minimum liquidity covenant expires once we achieve a Fixed Coverage Ratio, as defined, in excess of 1.25:1.00 for two consecutive quarters. As of December 31, 2014, we were in compliance with our financial covenants, and we expect to be in compliance with the 2015 financial covenants.
On January 15, 2013, we entered into a subordinated promissory note with the sellers of DRX, or the DRX Seller Note. The $3.0 million principal amount is subject to adjustment upon resolution of the working capital, as well as the satisfaction of customary escrow provisions. Interest accrues at a rate of 8.0% and was payable with the adjusted principal on the January 15, 2015 maturity date. The DRX Seller Note was paid subsequent to December 31, 2014, see Note 17 of the Notes to Consolidated Financial Statements included in Part II, Item 8: “Financial Statements and Supplementary Data” of this Annual Report on Form 10-K.
71
Table of Contents
During 2012, we entered into various borrowing arrangements to finance purchases of computer equipment and software. These borrowing arrangements included a $1.2 million master lease with a third-party financing company, which bore interest at a fixed annual rate of 8.0% and was collateralized by certain specifically identified software licenses on software installed in 2013.
The following table summarizes the principal balances of our outstanding borrowings as of December 31, 2014:
| Outstanding Principal Balance |
||||
| (dollars in thousands) |
||||
| Credit Facility: Revolving line of credit |
$ | 354 | ||
| Credit Facility: Term loans |
20,250 | |||
| Subordinated Loans |
32,456 | |||
|
|
|
|||
| $ | 53,060 | |||
|
|
|
|||
We believe that cash from operations, the proceeds from our offering, cash on hand and available capacity under our Credit Facility will provide liquidity to meet anticipated future short term capital requirements for the next twelve months. The sufficiency of these liquidity sources to fund necessary and committed capital needs will be dependent upon our ability to meet our covenant requirements of our Credit Facility. See the section titled “Liquidity and Capital Resources—Senior Credit Facility” for a description of our Credit Facility.
In the future, we may seek to access the capital markets to raise additional equity financing for various business reasons, including required debt payments and acquisitions. The timing, term, size, and pricing of any such financing will depend on investor interest and market conditions, and there can be no assurance that we will be able to obtain any such financing. In addition, if we are unable to comply with our debt covenants in the future and as a result default on our loan agreements, approximately $50.1 million of our outstanding borrowings would become immediately payable, which could adversely affect our financial condition.
Dividends on Preferred Stock
Dividends accrued on our outstanding shares of Series A and B preferred stock at 8% per annum. In connection with the completion of our initial public offering, all then outstanding Series A and B preferred stock were converted into common stock on a three-for-one basis, and $9.0 million of accrued dividends were paid in cash.
Cash Flows
Our cash flows were as follows for the years ended December 31, 2014, 2013 and 2012:
| Year Ended December 31, | ||||||||||||
| 2014 | 2013 | 2012 | ||||||||||
| Net cash flows provided by (used in): |
||||||||||||
| Operating activities |
$ | (20,253 | ) | $ | 1,702 | $ | (2,305 | ) | ||||
| Investing activities |
(837 | ) | (27,096 | ) | (1,081 | ) | ||||||
| Financing activities |
47,065 | 26,195 | 3,694 | |||||||||
|
|
|
|
|
|
|
|||||||
| Net increase in cash and cash equivalents |
$ | 25,975 | $ | 801 | $ | 308 | ||||||
|
|
|
|
|
|
|
|||||||
72
Table of Contents
Operating Activities
For the year ended December 31, 2014, our net cash and cash equivalents used in operating activities of $20.3 million consisted of a net loss of $10.2 million and $17.7 million of cash used by changes in working capital, partially offset by $7.6 million in adjustments for non-cash items. The cash used by changes in working capital primarily consisted of a decrease in deferred revenue of $14.1 million. The decrease in deferred revenue was a result of contracts closed during prior periods with associated upfront fees, on which we began recognizing revenue ratably as implementations were completed and software services have commenced.
For the year ended December 31, 2013, net cash and cash equivalents provided by operating activities of $1.7 million consisted of a net loss of $26.4 million partially offset by $21.4 million of cash provided by changes in working capital and $6.7 million in adjustments for non-cash items. The cash provided by changes in working capital primarily consisted of an increase in deferred revenue of $41.8 million, partially offset by a decrease in operating cash flow due to a $11.3 million increase in accounts receivable. The increase in deferred revenue was a result of contracts closed during the period with associated upfront fees, which will be recognized as revenue ratably over the customer contract period beginning once the software services have commenced. The increase in accounts receivable was primarily attributable to the growth of our revenue and fees invoiced for the period.
For the year ended December 31, 2012, our net cash and cash equivalents used in operating activities of $2.3 million consisted of a net loss of $16.8 million, offset by $11.7 million of cash provided by changes in working capital and $2.7 million in adjustments for non-cash items. The increase in cash resulting from changes in working capital primarily consisted of an increase in deferred revenue of $13.2 million. The increase in deferred revenue was a result of contracts closed during the period with associated upfront fees, which will be recognized as revenue, ratably over the customer contract period, beginning once the software services have commenced.
A substantial amount of revenue in a period comes from the recognition of previously collected and deferred revenue, while period-end accounts receivable balances are directly influenced by the timing of contractually negotiated milestone and time-based advance billings and their subsequent collection. We generally have the contractual right to invoice and collect fees from customers ahead of delivery and revenue recognition of our software and professional services.
Investing Activities
For the year ended December 31, 2014, net cash used in investing activities was $0.8 million, for the purchase of property and equipment. Net cash used in investing activities totaled $27.1 million for the year ended December 31, 2013. We spent $25.9 million on the acquisition of DRX, net of cash acquired. In addition, we spent $1.2 million to purchase property and equipment. For the year ended December 31, 2012, net cash used in investing activities was $1.1 million, for the purchase of property and equipment.
Financing Activities
For the year ended December 31, 2014, net cash provided by financing activities was $47.1 million, consisting of $45.9 million of proceeds from our initial public offering, net of issuance costs, and $32.8 million in proceeds from credit facility and term-debt borrowings partially offset by $19.6 million of debt and capital lease obligation payments, $9.0 million of dividends on preferred stock, $2.3 million of deferred business acquisition purchase price and $0.7 million of financing fees paid.
For the year ended December 31, 2013, net cash provided by financing activities was $26.2 million, consisting of $39.9 million in proceeds from credit facility and term-debt borrowings, partially offset by $12.3 million of repayments of debt and capital lease obligations and $1.2 million of financing fees paid.
73
Table of Contents
Net cash provided by financing activities totaled $3.7 million for 2012, which resulted primarily from $4.0 million in proceeds from the issuance of preferred stock and $0.5 million in proceeds from stock option exercises, partially offset by $0.8 million in repayments of debt obligations.
Operating and Capital Expenditure Requirements
We believe that our existing cash and cash equivalents balances and cash generated from operations will be sufficient to meet our anticipated cash requirements through at least the next 12 months, including expected capital expenditure requirements of approximately $1.0 million to $2.0 million. If our available cash and cash equivalents balances are insufficient to satisfy our liquidity requirements, we may seek to sell additional equity or convertible debt securities or enter into an additional credit facility. The sale of equity and convertible debt securities may result in dilution to our stockholders and those securities may have rights senior to those of our common shares. If we raise additional funds through the issuance of convertible debt securities, these securities could contain covenants that would restrict our operations. We may require additional capital beyond our currently anticipated amounts. Additional capital may not be available on reasonable terms, or at all.
Quarterly Trends and Seasonality
Our overall operating results fluctuate from quarter to quarter as a result of a variety of factors, some of which are out of our control. These fluctuations are primarily driven by an increase in the third and fourth quarters in activity at our customers in preparation for and during the annual insurance enrollment cycle, which occurs annually during our fourth quarter. Our historical results should not be considered a reliable indicator of our future results of operations.
Contractual Obligations and Commitments
Our principal commitments consist of obligations under our outstanding debt facilities, non-cancelable leases for our office space and computer equipment, purchase commitments for our co-location and other support services. The following table summarizes these contractual obligations as of December 31, 2014. Future events could cause actual payments to differ from these estimates.
| Contractual Obligations: |
Total | Less than 1 year |
1-3 years | 3-5 years | More than 5 years |
|||||||||||||||
| (In thousands) | ||||||||||||||||||||
| Long-term debt—Revolving line of credit |
||||||||||||||||||||
| Principal(1) |
$ | 354 | $ | 354 | $ | — | $ | — | $ | — | ||||||||||
| Interest(2) |
1 | 1 | — | — | — | |||||||||||||||
| Long-term debt—Other senior and subordinated |
||||||||||||||||||||
| Principal |
53,250 | 4,125 | 1,969 | 47,156 | — | |||||||||||||||
| Interest(2) |
20,523 | 5,369 | 9,558 | 5,596 | — | |||||||||||||||
| Operating lease obligations |
10,033 | 1,720 | 2,894 | 2,185 | 3,234 | |||||||||||||||
| Capital lease obligations |
609 | 448 | 161 | — | — | |||||||||||||||
|
|
|
|
|
|
|
|
|
|
|
|||||||||||
| Total |
$ | 84,770 | $ | 12,017 | $ | 14,582 | $ | 54,937 | $ | 3,234 | ||||||||||
|
|
|
|
|
|
|
|
|
|
|
|||||||||||
| (1) | Repayment of the revolving line of credit is due at end of the term in January 2018. Early repayment is allowed and the revolving line of credit and interest was repaid subsequent to year end. |
| (2) | Includes estimated interest payments based on contractual rates as of December 31, 2014. |
Off-Balance Sheet Arrangements
As of December 31, 2014, we had standby letters of credit totaling $0.2 million as security for rented office space.
74
Table of Contents
Recent Accounting Pronouncements
See Note 2 to the Consolidated Financial Statements for information on new accounting standards.
JOBS Act
The JOBS Act contains provisions that, among other things, reduce certain reporting requirements for qualifying public companies. As defined in the JOBS Act, a public company whose initial public offering of common equity securities occurred after December 8, 2011 and whose annual gross revenue is less than $1.0 billion will, in general, qualify as an “emerging growth company” until the earliest of:
| • | the last day of its fiscal year following the fifth anniversary of the date of its initial public offering of common equity securities; |
| • | the last day of its fiscal year in which it has annual gross revenue of $1.0 billion or more; |
| • | the date on which it has, during the previous three-year period, issued more than $1.0 billion in non-convertible debt; and |
| • | the date on which it is deemed to be a “large accelerated filer,” which will occur at such time as the company (a) has an aggregate worldwide market value of common equity securities held by non-affiliates of $700 million or more as of the last business day of its most recently completed second fiscal quarter, and (b) has been required to file annual and quarterly reports under the Securities Exchange Act of 1934 for a period of at least 12 months and (c) has filed at least one annual report pursuant to the Securities Act of 1934. |
Under this definition, we are an “emerging growth company” and could remain an emerging growth company until as late as December 31, 2019.
As an “emerging growth company” we have chosen to rely on such exemptions and are therefore not required to, among other things, (i) provide an auditor’s attestation report on our system of internal controls over financial reporting pursuant to Section 404, (ii) provide all of the compensation disclosure that may be required of non-emerging growth public companies under the Dodd-Frank Wall Street Reform and Consumer Protection Act, (iii) comply with any requirement that may be adopted by the PCAOB regarding mandatory audit firm rotation or a supplement to the auditor’s report providing additional information about the audit and the financial statements (auditor discussion and analysis) and (iv) disclose certain executive compensation-related items such as the correlation between executive compensation and performance and comparisons of the Chief Executive Officer’s compensation to median employee compensation.
Item 7A. Quantitative and Qualitative Disclosures about Market Risk.
We have operations solely in the United States and are exposed to market risks in the ordinary course of our business. Market risk is the risk of loss to future earnings, values or future cash flows that may result from changes in the price of a financial instrument. The value of a financial instrument might change as a result of changes in interest rates, exchange rates, commodity prices, equity prices and other market changes. We do not use derivative financial instruments for speculative, hedging or trading purposes, although in the future we might enter into exchange rate hedging arrangements to manage the risks described below.
Interest Rate Risk
We are exposed to market risk related to changes in interest rates. Borrowings under the term loan and revolving line of credit with Wells Fargo Bank, which was entered into in January 2013, bear interest at rates that are variable. Borrowings under the THL Corporate Finance, Inc. subordinated promissory note bear interest at rates that are variable. Increases in the LIBOR or Prime Rate would increase the amount of interest payable under these borrowings. As of December 31, 2014, we had total borrowings of $50.1 million subject to a variable
75
Table of Contents
interest rate. As a result, each change of one percentage point in interest rates would result in an approximate $0.5 million change in our annual interest expense on our outstanding borrowings as of December 31, 2014. Any debt we incur in the future may also bear interest at variable rates. Borrowings outstanding under our other credit arrangements are not subject to interest rate risk because they bear interest at fixed rates.
Inflation Risk
We do not believe that inflation has had a material effect on our business, financial condition, or results of operations. We continue to monitor the impact of inflation in order to minimize its effects through pricing strategies, productivity improvements and cost reductions. If our costs were to become subject to significant inflationary pressures, we may not be able to fully offset such higher costs through price increases. Our inability or failure to do so could harm our business, financial condition, and results of operations.
Item 8. Financial Statements and Supplementary Data.
The information required by this item is incorporated by reference to the consolidated financial statements and accompanying notes set forth on pages F-1 through F-29 of this Annual Report on Form 10-K.
Item 9. Changes in and Disagreements With Accountants on Accounting and Financial Disclosure.
None.
Item 9A. Controls and Procedures.
Disclosure Controls and Procedures
The term “disclosure controls and procedures,” as defined in Rules 13a-15(e) and 15d-15(e) under the Exchange Act refers to controls and procedures that are designed to ensure that information required to be disclosed by a company in the reports that it files or submits under the Exchange Act is recorded, processed, summarized and reported, within the time periods specified in the SEC’s rules and forms. Disclosure controls and procedures include, without limitation, controls and procedures designed to ensure that such information is accumulated and communicated to a company’s management, including its principal executive and principal financial officers, as appropriate to allow timely decisions regarding required disclosure.
Our management, with the participation of our Chief Executive Officer and Chief Financial Officer, has evaluated the effectiveness of our disclosure controls and procedures as of December 31, 2014, the end of the period covered by this Annual Report on Form 10-K. Based upon such evaluation, our Chief Executive Officer and Chief Financial Officer have concluded that our disclosure controls and procedures were effective as of such date.
Management’s Report on Internal Control Over Financial Reporting and Attestation Report of the Registered Public Accounting Firm
This Annual Report on Form 10-K does not include a report of management’s assessment regarding internal control over financial reporting or an attestation report of our registered public accounting firm due to a transition period established by rules of the SEC for newly public companies.
Changes in Internal Control Over Financial Reporting
There were no changes in our internal control over financial reporting during the quarter ended December 31, 2014, which were identified in connection with management’s evaluation required by Rules 13a-15(d) and 15d-15(d) under the Exchange Act, that have materially affected, or are reasonably likely to materially affect, our internal control over financial reporting.
76
Table of Contents
Limitations on Controls
Our disclosure controls and procedures and internal control over financial reporting are designed to provide reasonable assurance of achieving their objectives as specified above. Management does not expect, however, that our disclosure controls and procedures or our internal control over financial reporting will prevent or detect all error and fraud. Any control system, no matter how well designed and operated, is based upon certain assumptions and can provide only reasonable, not absolute, assurance that its objectives will be met. Further, no evaluation of controls can provide absolute assurance that misstatements due to error or fraud will not occur or that all control issues and instances of fraud, if any, within our company have been detected.
None.
77
Table of Contents
Item 10. Directors, Executive Officers and Corporate Governance
Information required by Part III, Item 10, will be included in our Proxy Statement relating to our 2015 annual meeting of stockholders to be filed with the SEC within 120 days after the end of our fiscal year ended December 31, 2014, and is incorporated herein by reference.
Item 11. Executive Compensation
Information required by Part III, Item 11, will be included in our Proxy Statement relating to our 2015 annual meeting of stockholders to be filed with the SEC within 120 days after the end of our fiscal year ended December 31, 2014, and is incorporated herein by reference.
Item 12. Security Ownership of Certain Beneficial Owners and Management and Related Stockholder Matters.
Information required by Part III, Item 12, will be included in our Proxy Statement relating to our 2015 annual meeting of stockholders to be filed with the SEC within 120 days after the end of our fiscal year ended December 31, 2014, and is incorporated herein by reference.
Item 13. Certain Relationships and Related Transactions, and Director Independence.
Information required by Part III, Item 13, will be included in our Proxy Statement relating to our 2015 annual meeting of stockholders to be filed with the SEC within 120 days after the end of our fiscal year ended December 31, 2014, and is incorporated herein by reference.
Item 14. Principal Accounting Fees and Services.
Information required by Part III, Item 14, will be included in our Proxy Statement relating to our 2015 annual meeting of stockholders to be filed with the SEC within 120 days after the end of our fiscal year ended December 31, 2014, and is incorporated herein by reference.
78
Table of Contents
Item 15. Exhibits and Financial Statement Schedules
| (a) | Documents Filed with Report |
| (1) | Consolidated Financial Statements. |
| Page | ||||
| Report of Independent Registered Public Accounting Firm |
F-2 | |||
| Consolidated Balance Sheets as of December 31, 2014 and 2013 |
F-3 | |||
| Consolidated Statements of Operations and Comprehensive Loss for the years ended December 31, 2014, 2013 and 2012 |
F-4 | |||
| Consolidated Statements of Stockholders’ Deficit for the years ended December 31, 2014, 2013 and 2012 |
F-5 | |||
| Consolidated Statements of Cash Flows for the years ended December 31, 2014, 2013 and 2012 |
F-6 | |||
| Notes to Consolidated Financial Statements |
F-7 | |||
| (2) Financial Statement Schedules
|
||||
| Schedule II—Valuation and Qualifying Accounts |
F-29 | |||
| (b) | Exhibits. |
The information required by this Item is set forth on the exhibit index that follows the signature page of this Annual Report on Form 10-K.
79
Table of Contents
Pursuant to the requirements of Section 13 or 15(d) of the Securities Exchange Act of 1934, the registrant has duly caused this report to be signed on its behalf by the undersigned, thereunto duly authorized.
Date: March 25, 2015
| CONNECTURE, INC. | ||
| By: | /s/ Robert Douglas Schneider | |
| Robert Douglas Schneider | ||
| President and Chief Executive Officer | ||
80
Table of Contents
SIGNATURES AND POWER OF ATTORNEY
Each person whose individual signature appears below hereby authorizes and appoints Robert Douglas Schneider and James P. Purko, and each of them, with full power of substitution and resubstitution and full power to act without the other, as his or her true and lawful attorney-in-fact and agent to act in his or her name, place and stead and to execute in the name and on behalf of each person, individually and in each capacity stated below, and to file any and all amendments to this Annual Report on Form 10-K, and to file the same, with all exhibits thereto, and other documents in connection therewith, with the Securities and Exchange Commission, granting unto said attorneys-in-fact and agents, and each of them, full power and authority to do and perform each and every act and thing, ratifying and confirming all that said attorneys-in-fact and agents or any of them or their or his substitute or substitutes may lawfully do or cause to be done by virtue thereof.
Pursuant to the requirements of the Securities Exchange Act of 1934, this report has been signed below by the following persons on behalf of the registrant and in the capacities indicated.
| Signature |
Title |
Date | ||
| /s/ Robert Douglas Schneider Robert Douglas Schneider |
President, Chief Executive Officer (Principal Executive Officer) and Director | March 25, 2015 | ||
| /s/ James P. Purko James P. Purko |
Chief Financial Officer (Principal Financial and Accounting Officer) | March 25, 2015 | ||
| /s/ David A. Jones, Jr. David A. Jones, Jr. |
Chairman of the Board of Directors | March 25, 2015 | ||
| /s/ A. John Ansay A. John Ansay |
Director | March 25, 2015 | ||
| /s/ Vickie L. Capps Vickie L. Capps |
Director | March 25, 2015 | ||
| /s/ Paul Kusserow Paul Kusserow |
Director | March 25, 2015 | ||
| /s/ Russell S. Thomas Russell S. Thomas |
Director | March 25, 2015 | ||
| /s/ Alan J. Ying Alan J. Ying |
Director | March 25, 2015 | ||
81
Table of Contents
F-1
Table of Contents
REPORT OF INDEPENDENT REGISTERED PUBLIC ACCOUNTING FIRM
To the Board of Directors and Stockholders of Connecture, Inc. and Subsidiaries
Brookfield, Wisconsin
We have audited the accompanying consolidated balance sheets of Connecture, Inc. and Subsidiaries (the “Company”), as of December 31, 2014 and 2013 and the related consolidated statements of operations and comprehensive loss, stockholders’ deficit, and cash flows for the each of the three years in the period ended December 31, 2014. Our audits also included the financial statement schedule listed in the Index at Item 15. These consolidated financial statements and financial statement schedule are the responsibility of the Company’s management. Our responsibility is to express an opinion on the consolidated financial statements and financial statement schedule based on our audits.
We conducted our audits in accordance with the standards of the Public Company Accounting Oversight Board (United States). Those standards require that we plan and perform the audit to obtain reasonable assurance about whether the financial statements are free of material misstatement. The Company is not required to have, nor were we engaged to perform, an audit of its internal control over financial reporting. Our audits included consideration of internal control over financial reporting as a basis for designing audit procedures that are appropriate in the circumstances, but not for the purpose of expressing an opinion on the effectiveness of the Company’s internal control over financial reporting. Accordingly, we express no such opinion. An audit also includes examining, on a test basis, evidence supporting the amounts and disclosures in the financial statements, assessing the accounting principles used and significant estimates made by management, as well as evaluating the overall financial statement presentation. We believe that our audits provide a reasonable basis for our opinion.
In our opinion, such consolidated financial statements present fairly, in all material respects, the financial position of the Company as of December 31, 2014, and 2013, and the results of their operations and their cash flows for each of the three years in the period ended December 31, 2014, in conformity with accounting principles generally accepted in the United States of America. Also, in our opinion, such financial statement schedule, when considered in relation to the basic consolidated financial statements taken as a whole, present fairly in all material respects the information set forth therein.
/s/ Deloitte & Touche LLP
Milwaukee, Wisconsin
March 25, 2015
F-2
Table of Contents
CONNECTURE, INC. AND SUBSIDIARIES
CONSOLIDATED BALANCE SHEETS AS OF DECEMBER 31, 2014 AND 2013
(In thousands, except share and per share information)
| 2014 | 2013 | |||||||
| ASSETS |
||||||||
| CURRENT ASSETS: |
||||||||
| Cash and cash equivalents |
$ | 28,252 | $ | 2,277 | ||||
| Accounts receivable — net of allowances of $246 and $266 as of December 31, 2014 and 2013, respectively |
12,128 | 20,935 | ||||||
| Prepaid expenses and other current assets |
1,557 | 1,010 | ||||||
|
|
|
|
|
|||||
| Total current assets |
41,937 | 24,222 | ||||||
| PROPERTY AND EQUIPMENT — Net |
1,892 | 1,974 | ||||||
| GOODWILL |
26,779 | 26,779 | ||||||
| OTHER INTANGIBLE ASSETS — Net |
15,350 | 19,414 | ||||||
| DEFERRED IMPLEMENATION COSTS |
24,552 | 19,899 | ||||||
| OTHER ASSETS |
1,834 | 1,945 | ||||||
|
|
|
|
|
|||||
| TOTAL ASSETS |
$ | 112,344 | $ | 94,233 | ||||
|
|
|
|
|
|||||
| LIABILITIES, REDEEMABLE CONVERTIBLE PREFERRED STOCK AND STOCKHOLDERS’ DEFICIT |
||||||||
| CURRENT LIABILITIES: |
||||||||
| Accounts payable |
$ | 5,737 | $ | 8,445 | ||||
| Accrued payroll and related liabilities |
3,880 | 6,397 | ||||||
| Other liabilities |
4,373 | 7,737 | ||||||
| Current maturities of debt |
4,479 | 5,431 | ||||||
| Deferred revenue |
42,578 | 43,528 | ||||||
|
|
|
|
|
|||||
| Total current liabilities |
61,047 | 71,538 | ||||||
| DEFERRED REVENUE |
31,159 | 44,327 | ||||||
| DEFERRED TAX LIABILITY |
19 | 15 | ||||||
| LONG-TERM DEBT |
48,581 | 32,818 | ||||||
| OTHER LONG-TERM LIABILITIES |
379 | 1,844 | ||||||
|
|
|
|
|
|||||
| Total liabilities |
141,185 | 150,542 | ||||||
|
|
|
|
|
|||||
| COMMITMENTS AND CONTINGENCIES (Note 7) |
||||||||
| REDEEMABLE CONVERTIBLE PREFERRED STOCK: |
||||||||
| Series A convertible preferred stock |
— | 27,769 | ||||||
| Series B convertible preferred stock |
— | 21,976 | ||||||
|
|
|
|
|
|||||
| Total redeemable convertible preferred stock |
— | 49,745 | ||||||
|
|
|
|
|
|||||
| STOCKHOLDERS’ DEFICIT: |
||||||||
| Common stock, $0.001 par value, 75,000,000 and 54,700,000 shares authorized, as of December 31, 2014 and 2013, respectively, and 21,689,223 and 184,051 shares issued and outstanding as of December 31, 2014 and 2013, respectively |
22 | 1 | ||||||
| Additional paid-in capital |
96,365 | 9,013 | ||||||
| Accumulated deficit |
(125,228 | ) | (115,068 | ) | ||||
|
|
|
|
|
|||||
| Total stockholders’ deficit |
(28,841 | ) | (106,054 | ) | ||||
|
|
|
|
|
|||||
| TOTAL LIABILITIES, REDEEMABLE CONVERTIBLE PREFERRED STOCK AND STOCKHOLDERS’ DEFICIT |
$ | 112,344 | $ | 94,233 | ||||
|
|
|
|
|
|||||
The accompanying notes to the consolidated financial statements are an integral part of the statements.
F-3
Table of Contents
CONNECTURE, INC. AND SUBSIDIARIES
CONSOLIDATED STATEMENTS OF OPERATIONS AND COMPREHENSIVE LOSS FOR
THE YEARS ENDED DECEMBER 31, 2014, 2013 AND 2012
(In thousands, except share and per share information)
| 2014 | 2013 | 2012 | ||||||||||
| REVENUE |
$ | 84,579 | $ | 58,326 | $ | 29,626 | ||||||
| COST OF REVENUE |
52,431 | 50,173 | 22,886 | |||||||||
|
|
|
|
|
|
|
|||||||
| GROSS MARGIN |
32,148 | 8,153 | 6,740 | |||||||||
|
|
|
|
|
|
|
|||||||
| OPERATING EXPENSES: |
||||||||||||
| Research and development |
18,125 | 11,806 | 7,371 | |||||||||
| Sales and marketing |
7,729 | 6,800 | 6,644 | |||||||||
| General and administrative |
10,552 | 12,187 | 7,492 | |||||||||
|
|
|
|
|
|
|
|||||||
| Total operating expenses |
36,406 | 30,793 | 21,507 | |||||||||
|
|
|
|
|
|
|
|||||||
| LOSS FROM OPERATIONS |
(4,258 | ) | (22,640 | ) | (14,767 | ) | ||||||
| OTHER EXPENSES: |
||||||||||||
| Interest expense |
5,937 | 4,644 | 1,992 | |||||||||
| Other (income) expense, net |
(68 | ) | — | — | ||||||||
|
|
|
|
|
|
|
|||||||
| Total other expense |
5,869 | 4,644 | 1,992 | |||||||||
|
|
|
|
|
|
|
|||||||
| LOSS BEFORE INCOME TAXES |
(10,127 | ) | (27,284 | ) | (16,759 | ) | ||||||
| (PROVISION) BENEFIT FOR INCOME TAXES |
(33 | ) | 900 | 3 | ||||||||
|
|
|
|
|
|
|
|||||||
| NET LOSS |
$ | (10,160 | ) | $ | (26,384 | ) | $ | (16,756 | ) | |||
|
|
|
|
|
|
|
|||||||
| COMPREHENSIVE LOSS |
$ | (10,160 | ) | $ | (26,384 | ) | $ | (16,756 | ) | |||
|
|
|
|
|
|
|
|||||||
| NET LOSS PER COMMON SHARE: |
||||||||||||
| Basic and diluted |
$ | (10.27 | ) | $ | (163.37 | ) | $ | (14.05 | ) | |||
|
|
|
|
|
|
|
|||||||
| WEIGHTED-AVERAGE COMMON SHARES OUTSTANDING: |
||||||||||||
| Basic and diluted |
1,362,109 | 184,051 | 1,353,862 | |||||||||
|
|
|
|
|
|
|
|||||||
The accompanying notes to the consolidated financial statements are an integral part of the statements.
F-4
Table of Contents
CONNECTURE, INC. AND SUBSIDIARIES
CONSOLIDATED STATEMENTS OF STOCKHOLDERS’ DEFICIT FOR THE YEARS ENDED
DECEMBER 31, 2014, 2013 AND 2012
(In thousands, except share and per share information)
| Common Stock | Additional Paid-In Capital |
Accumulated Deficit |
Total Stockholders’ Deficit |
|||||||||||||||||
| Shares | Amount | |||||||||||||||||||
| BALANCES—January 1, 2012 |
56,856,181 | $ | 171 | $ | 17,239 | $ | (71,928 | ) | $ | (54,518 | ) | |||||||||
| Preferred Stock dividends, Series D and Series D-1 Preferred Stock |
— | — | (786 | ) | — | (786 | ) | |||||||||||||
| 2010 stock option plan exercise |
11,379,000 | 34 | 466 | — | 500 | |||||||||||||||
| Reverse stock split |
(4,600,388 | ) | (204 | ) | 204 | — | — | |||||||||||||
| Shares exchanged for Series A stock |
(8,047,593 | ) | — | 1,258 | — | 1,258 | ||||||||||||||
| Shares exchanged for Series B stock |
(55,403,149 | ) | — | (5,546 | ) | — | (5,546 | ) | ||||||||||||
| Preferred Stock dividends, Series A and Series B Preferred Stock |
— | — | (1,476 | ) | — | (1,476 | ) | |||||||||||||
| Stock-based compensation expense |
— | — | 700 | — | 700 | |||||||||||||||
| Net loss |
— | — | — | (16,756 | ) | (16,756 | ) | |||||||||||||
|
|
|
|
|
|
|
|
|
|
|
|||||||||||
| BALANCES—December 31, 2012 |
184,051 | $ | 1 | $ | 12,059 | $ | (88,684 | ) | $ | (76,624 | ) | |||||||||
| Preferred Stock dividends, Series A and Series B Preferred Stock |
— | — | (3,685 | ) | — | (3,685 | ) | |||||||||||||
| Stock-based compensation expense |
— | — | 639 | — | 639 | |||||||||||||||
| Net loss |
— | — | — | (26,384 | ) | (26,384 | ) | |||||||||||||
|
|
|
|
|
|
|
|
|
|
|
|||||||||||
| BALANCES—December 31, 2013 |
184,051 | $ | 1 | $ | 9,013 | $ | (115,068 | ) | $ | (106,054 | ) | |||||||||
|
|
|
|
|
|
|
|
|
|
|
|||||||||||
| Preferred Stock dividends, Series A and Series B Preferred Stock |
— | — | (3,830 | ) | — | (3,830 | ) | |||||||||||||
| Stock-based compensation expense |
— | — | 1,436 | — | 1,436 | |||||||||||||||
| Exercise of stock options |
8,633 | — | 16 | — | 16 | |||||||||||||||
| Conversion of redeemable convertible preferred stock |
14,861,539 | 15 | 44,569 | — | 44,584 | |||||||||||||||
| Initial public offering, net of issuance costs |
6,635,000 | 6 | 45,161 | — | 45,167 | |||||||||||||||
| Net loss |
— | — | — | (10,160 | ) | (10,160 | ) | |||||||||||||
|
|
|
|
|
|
|
|
|
|
|
|||||||||||
| BALANCES—December 31, 2014 |
21,689,223 | $ | 22 | $ | 96,365 | $ | (125,228 | ) | $ | (28,841 | ) | |||||||||
|
|
|
|
|
|
|
|
|
|
|
|||||||||||
The accompanying notes to the consolidated financial statements are an integral part of the statements.
F-5
Table of Contents
CONNECTURE, INC. AND SUBSIDIARIES
CONSOLIDATED STATEMENTS OF CASH FLOWS FOR THE YEARS ENDED
DECEMBER 31, 2014, 2013 AND 2012
(Dollars in thousands)
| 2014 | 2013 | 2012 | ||||||||||
| CASH FLOWS FROM OPERATING ACTIVITIES: |
||||||||||||
| Net loss |
$ | (10,160 | ) | $ | (26,384 | ) | $ | (16,756 | ) | |||
| Adjustments to reconcile net loss to net cash (used in) provided by operating activities: |
||||||||||||
| Depreciation and amortization |
5,101 | 4,710 | 1,013 | |||||||||
| Bad debt expense |
25 | 25 | 135 | |||||||||
| Stock-based compensation expense |
1,436 | 639 | 700 | |||||||||
| Deferred tax expense (benefit) |
4 | (1,197 | ) | (1 | ) | |||||||
| Interest accretion on financing obligations |
1,983 | 2,474 | — | |||||||||
| Change in fair value of warrants |
— | — | 892 | |||||||||
| Change in fair value of contingent consideration |
(951 | ) | — | — | ||||||||
| Change in operating assets and liabilities, net of acquisition: |
||||||||||||
| Accounts receivable |
8,782 | (11,340 | ) | (495 | ) | |||||||
| Prepaid expenses and other assets |
(495 | ) | (989 | ) | (512 | ) | ||||||
| Deferred implementation costs |
(4,653 | ) | (15,403 | ) | (4,496 | ) | ||||||
| Accounts payable |
(3,463 | ) | 5,573 | 1,244 | ||||||||
| Accrued expenses and other liabilities |
(3,744 | ) | 1,754 | 2,790 | ||||||||
| Deferred revenue |
(14,118 | ) | 41,840 | 13,181 | ||||||||
|
|
|
|
|
|
|
|||||||
| Net cash (used in) provided by operating activities |
(20,253 | ) | 1,702 | (2,305 | ) | |||||||
|
|
|
|
|
|
|
|||||||
| CASH FLOWS FROM INVESTING ACTIVITIES: |
||||||||||||
| Purchases of property and equipment |
(837 | ) | (1,217 | ) | (1,081 | ) | ||||||
| Business acquisition, net of cash acquired |
— | (25,879 | ) | — | ||||||||
|
|
|
|
|
|
|
|||||||
| Net cash used in investing activities |
(837 | ) | (27,096 | ) | (1,081 | ) | ||||||
|
|
|
|
|
|
|
|||||||
| CASH FLOWS FROM FINANCING ACTIVITIES: |
||||||||||||
| Borrowings under revolving line of credit |
12,030 | 7,626 | 24,270 | |||||||||
| Repayments under revolving line of credit |
(16,791 | ) | (4,517 | ) | (24,270 | ) | ||||||
| Borrowings of term debt |
20,767 | 32,300 | — | |||||||||
| Repayments of term debt |
(2,375 | ) | (7,319 | ) | (806 | ) | ||||||
| Payment of capital lease obligations |
(489 | ) | (463 | ) | — | |||||||
| Financing fees paid |
(715 | ) | (1,182 | ) | — | |||||||
| Payment of deferred business acquisition purchase price |
(2,294 | ) | — | — | ||||||||
| Proceeds from initial public offering, net of issuance costs |
45,907 | — | — | |||||||||
| Dividends paid |
(8,991 | ) | — | — | ||||||||
| Repurchase of warrants |
— | (250 | ) | — | ||||||||
| Proceeds from stock option exercises |
16 | — | 500 | |||||||||
| Issuance of Series B preferred stock |
— | — | 4,000 | |||||||||
|
|
|
|
|
|
|
|||||||
| Net cash provided by financing activities |
47,065 | 26,195 | 3,694 | |||||||||
|
|
|
|
|
|
|
|||||||
| NET INCREASE IN CASH AND CASH EQUIVALENTS |
25,975 | 801 | 308 | |||||||||
| CASH AND CASH EQUIVALENTS—Beginning of year |
2,277 | 1,476 | 1,168 | |||||||||
|
|
|
|
|
|
|
|||||||
| CASH AND CASH EQUIVALENTS—End of year |
$ | 28,252 | $ | 2,277 | $ | 1,476 | ||||||
|
|
|
|
|
|
|
|||||||
| SUPPLEMENTAL CASH FLOW INFORMATION: |
||||||||||||
| Cash paid for interest |
$ | 5,627 | $ | 2,020 | $ | 957 | ||||||
|
|
|
|
|
|
|
|||||||
| Cash paid for income taxes |
$ | 245 | $ | 53 | $ | 93 | ||||||
|
|
|
|
|
|
|
|||||||
| Non-cash investing and financing activities: |
||||||||||||
| Purchase of property and equipment in accounts payable |
$ | 15 | $ | — | $ | 167 | ||||||
|
|
|
|
|
|
|
|||||||
| Direct issuance costs in accounts payable |
$ | 740 | $ | — | $ | — | ||||||
|
|
|
|
|
|
|
|||||||
| Accrued preferred stock dividends |
$ | — | $ | 3,685 | $ | 2,262 | ||||||
|
|
|
|
|
|
|
|||||||
| Acquisition consideration |
$ | — | $ | 6,309 | $ | — | ||||||
|
|
|
|
|
|
|
|||||||
| Capital leases entered into |
$ | 103 | $ | 1,232 | $ | — | ||||||
|
|
|
|
|
|
|
|||||||
The accompanying notes to the consolidated financial statements are an integral part of the statements.
F-6
Table of Contents
CONNECTURE, INC. AND SUBSIDIARIES
NOTES TO CONSOLIDATED FINANCIAL STATEMENTS
AS OF AND FOR THE YEARS ENDED DECEMBER 31, 2014, 2013 AND 2012
(Dollars in thousands, except share and per share information)
1. DESCRIPTION OF BUSINESS
Description of Business—Connecture, Inc. and its subsidiaries, including DestinationRx, Inc., or DRX, RxHealth Insurance Agency, Inc., and Insurix, Inc. (collectively, the “Company”), is a Delaware corporation. The Company is a web-based consumer shopping, enrollment and retention platform for health insurance distribution in the United States. The Company’s solutions support the industry evolution towards a consumer-centric experience that is transforming how health insurance is purchased and distributed. The Company’s solutions offer a personalized health insurance shopping experience that recommends the best fit insurance plan based on an individual’s preferences, health status, preferred providers, medications and expected out-of-pocket costs. The Company’s customers are health insurance marketplace operators, including health plans, brokers and exchange operators. The Company’s solutions automate key functions in the health insurance distribution process, allowing its customers to price and present plan options accurately to consumers and efficiently enroll, renew and manage plan members.
On January 15, 2013, the Company acquired DRX, a provider of web-based shopping and enrollment systems for consumers of Medicare health plans, as well as those used to compare name brand pharmaceuticals with therapeutic alternatives. This acquisition offers an integrated distribution platform for multiple health insurance marketplace operators, including health plans, brokers and exchange operators.
Initial Public Offering—In December 2014, the Company completed an initial public offering (“IPO”) in which it issued and sold 6,635,000 shares of its common stock at a public offering price of $8.00 per share. The Company received net proceeds of $45,167 after deducting underwriting discounts and commissions of $3,716 and other direct offering expenses of $4,197. Upon closing of the IPO, all shares of the Company’s then-outstanding Series A and Series B convertible preferred stock were converted, on a three for one basis, into 14,861,539 shares of $0.001 par value common stock.
2. SUMMARY OF SIGNIFICANT ACCOUNTING POLICIES
Basis of Presentation—The consolidated financial statements include the accounts of Connecture, Inc. and its wholly owned subsidiaries. All inter-company transactions and balances have been eliminated.
Use of Estimates—The preparation of financial statements in conformity with generally accepted accounting principles requires management to make extensive estimates and assumptions that affect the amounts reported in the financial statements and the accompanying notes. Actual results could differ from those estimates.
Cash and Cash Equivalents—The Company considers all highly liquid investments with maturities of three months or less when purchased to be cash equivalents. Cash and cash equivalents are maintained at financial institutions and, at times, balances may exceed federally insured limits. The Company has never experienced any losses related to these balances. Amounts on deposit in excess of federally insured limits as of December 31, 2014 approximated $28,000.
Accounts Receivable and Allowance for Doubtful Accounts—The Company’s normal and customary terms for customer payment is 30 days. The outstanding accounts receivable can vary significantly based on timing of billing milestones, renewals and other factors. The Company maintains an allowance for doubtful accounts for estimated losses resulting from the inability of its customers to make required payments. The estimates are based on the composition of the accounts receivable aging, historical bad debts, changes in payment patterns, customer creditworthiness, and current economic trends. The Company writes off uncollectible receivables after all reasonable efforts are made to collect payment.
F-7
Table of Contents
Property and Equipment—Property and equipment are stated at historical cost and depreciated using the straight-line method over the estimated useful lives of the assets, generally three to five years. Repairs and maintenance are charged to expense as incurred and major leasehold improvements are capitalized and amortized over the remaining term of the lease or their estimated useful lives, whichever is shorter. The Company records a gain or loss on the disposal of property and equipment based on the difference between the proceeds received, if any, and the net book value of the assets disposed on the date of disposal.
Impairment of Long-Lived Assets—The Company evaluates its long-lived assets for potential impairment when impairment indicators exist. Potential impairment is assessed when there is evidence that events or changes in circumstances have occurred that indicate that the carrying amount of an asset may not be recovered. The Company had no impairments during the years ended December 31, 2014, 2013 and 2012.
Intangible Assets—Intangible assets with definite lives are amortized using the straight-line method over their estimated useful lives, ranging from three to ten years. The carrying amount of intangible assets are reviewed whenever circumstances arise that indicate the carrying amount of an asset may not be recoverable. Recoverability of intangible assets is compared to the undiscounted future cash flows the assets are expected to generate. If the asset is considered to be impaired, the carrying value is compared to the fair value and this difference is recognized as an impairment loss. The Company had no impairments of intangible assets during the years ended December 31, 2014, 2013 and 2012.
Goodwill—Goodwill represents the excess of purchase price over the fair value of identifiable net assets acquired and liabilities assumed in a business combination. Goodwill is tested annually, as of October 31, for impairment at a reporting unit level.
The Company evaluates goodwill for impairment on an annual basis, or more frequently if an event or circumstance changes that would indicate that goodwill might be impaired. These events or circumstances would include a significant change in the business climate, legal factors, operating performance indicators, competition, sale or disposition of a significant portion of the business, or other factors.
No impairment was identified in the years ended December 31, 2014, 2013 and 2012.
Financial Instruments and Concentration of Credit Risk—The estimated fair values of the Company’s financial instruments, which include cash equivalents, accounts receivable and accounts payable, approximate their carrying values due to the short-term nature of these instruments.
Financial instruments that potentially subject the Company to concentrations of credit risk are principally cash and cash equivalents and accounts receivable. The Company’s credit risk is managed by investing its cash and cash equivalents in high quality money market instruments with established financial institutions. Concentrations of credit risk related to accounts receivable are limited to several customers to whom the Company makes substantial sales.
The Company has not experienced any material losses related to receivables from individual customers, geographic regions or groups of customers. As of and for the years ended December 31, 2014 and 2013, the Company had the following customers that accounted for 10% of total revenue and/or total accounts receivables.
| 2014 | 2013 | |||||||||||||||
| Customers |
Revenue | Accounts Receivable |
Revenue | Accounts Receivable |
||||||||||||
| A |
11.8 | % | — | % | 1.5 | % | 6.3 | % | ||||||||
| B |
8.6 | % | 15.2 | % | 3.8 | % | 8.7 | % | ||||||||
F-8
Table of Contents
Advertising Costs—Advertising costs are expensed as incurred. Advertising costs for the years ended December 31, 2014, 2013, and 2012, approximated $560, $368 and $142, respectively.
Fair Value Measurements—Financial Accounting Standards Board (FASB) Accounting Standards Codification (ASC) 820, “Fair Value Measurements”, establishes a hierarchy for inputs used in measuring fair value that maximizes the use of observable inputs and minimizes the use of unobservable inputs by requiring that inputs that are most observable be used when available. Observable inputs are inputs that market participants operating within the same marketplace as the Company would use in pricing the Company’s asset or liability based on independently derived and objectively determinable market data. Unobservable inputs are inputs that cannot be sourced from a broad active market in which assets or liabilities identical or similar to those of the Company are traded. The input hierarchy is broken down into three levels based on the degree to which the exit price is independently observable or determinable as follows:
Level 1—Valuation based on quoted market prices in active markets for identical assets or liabilities. Since valuations are based on quoted prices that are readily and regularly available in an active market, they do not entail a significant degree of judgment. The Company has no Level 1 financial instrument assets or liabilities.
Level 2—Valuation based on quoted market prices of investments that are not actively traded or for which certain significant inputs are not observable, either directly or indirectly, such as municipal bonds. The Company has no Level 2 financial instrument assets or liabilities.
Level 3—Valuation based on inputs that are unobservable and reflect management’s best estimate of what market participants would use as fair value. The Company’s only Level 3 financial instrument is the DRX acquisition contingent consideration (See Note 4).
Revenue Recognition—The Company’s revenue is derived from four sources: (a) the sales of implementation and ongoing support of the Company’s software automation solutions; (b) fees from brokers for the right to access our multi-payer quoting platform; (c) a government cost-plus-fixed-fee contract; and (d) commissions. In all contractual arrangements, the Company determines whether persuasive evidence of an arrangement exists, services have been rendered, the fee is fixed or determinable and collection is probable. If any of these criteria are not met, the Company does not recognize revenue until all of the criteria are met.
a) Software Automation Solutions Fees
Contractual terms for the delivery and ongoing support of the Company’s software automation solutions generally consist of multiple components including: (a) software license fees (non-hosted arrangements), (b) software maintenance fees, (c) software usage fees, (d) professional services fees, hosting fees and (f) production support fees.
Software license fees represent amounts paid for the right to use the solution. Software usage fees represent amounts paid to cover only a specific period of time, after which usage and access rights expire. Software maintenance fees typically accompany software license fees and represent amounts paid for the right to receive commercially available updates and upgrades to the solution. Professional services fees represent amounts charged for services performed in connection with the configuration, integration and implementation of the solutions in accordance with customer specifications. Hosting fees represent fees related to post implementation hosting and monitoring of the solution. Production support fees are charged for the ongoing rate, benefits and related content management of the platform.
The Company’s contracts with its customers typically bundle multiple services and are generally priced on a fixed fee basis. The term over which the Company is committed to deliver these services can range from several months to several years.
F-9
Table of Contents
The majority of the Company’s software automation solution services sold in the Enterprise/Commercial and Medicare segments and a portion of the Private Exchange segment are arrangements in which the Company hosts the web-based software automation solution and the customer pays a fee for access to and usage of the web-based software. The ownership of the technology and rights to the related code of such hosted web-based software remain with the Company and a customer has no contractual right to take possession of the software and run it on its own hardware platform. These arrangements are referred to as hosted arrangements and are accounted for as software-as-a-service under ASC 605, Revenue Recognition. A small percentage of the Company’s software automation solutions, sold primarily in the Enterprise/State segment, are arrangements in which the software is not hosted on the Company’s infrastructure. These arrangements include the licensed use of the software and are subject to accounting under ASC 985, Software Revenue Recognition.
For all arrangements (whether hosted or non-hosted) that include multiple elements, the Company evaluates each element in an arrangement to determine whether it represents a separate unit of accounting. An element constitutes a separate unit of accounting when the delivered item has standalone value and delivery of the undelivered element is probable. Elements generally include implementation services, software licensing or usage fees and maintenance or other services.
Accounting guidance for multiple element arrangements containing hosted software provide a hierarchy to use when determining the relative selling price for each unit of accounting. Vendor-specific objective evidence (VSOE) of selling price, based on the price at which the item is regularly sold by the vendor on a standalone basis, should be used if it exists. If VSOE of selling price is not available, third-party evidence of selling price is used to establish the selling price if it exists. If VSOE and third-party evidence do not exist, the Company allocates the arrangement fee to the separate units of accounting based on its best estimate of selling price.
For hosted arrangements with multiple elements that are separate units of accounting, VSOE and third- party evidence do not currently exist and accordingly, the Company allocates the arrangement fee to the separate units of accounting based on management’s best estimate of selling price, when available. The Company determines its best estimate of selling price for services based on its overall pricing objectives, taking into consideration market conditions and customer-specific factors and by reviewing historical data related to sales of the Company’s services.
Hosted arrangement revenue is recognized as follows by revenue element:
| • | Software usage fees and hosting fees—Recognized ratably over the longer of the customer contract or estimated customer relationship based on facts and circumstances of each relationship. |
| • | Professional services for new customer software solution implementation—Initially deferred and recognized ratably from completion of implementation through the longer of the customer contract or estimated customer relationship based on facts and circumstances of each relationship. |
| • | Professional services for modifications to existing customer software solutions—Initially deferred and then recognized in the period services are completed. |
| • | Production support fees—Recognized as the work is performed consistent with the contractual terms of the production support. |
Multiple deliverable arrangements accounting guidance for non-hosted arrangements provide an allocation of revenue to the separate elements based upon VSOE. To date, the elements of the Company’s non- hosted arrangements, whereby the customers take possession of the software, have not been sold separately. Therefore, the contractual consideration for a delivered element for the non-hosted arrangements does not qualify as a separate unit of accounting as VSOE does not currently exist for any element of the Company’s non-hosted arrangements. Accordingly, the delivered elements are combined with the other
F-10
Table of Contents
consideration for the remaining undelivered elements as a single unit of accounting. Revenue for non-hosted arrangements is recognized once all elements are delivered over the longer of the customer contract or expected customer relationship.
b) Broker Multi-Payer Quoting Platform Fees
The Company provides an online quoting platform service to insurance brokers through its Private Exchange segment. The Company charges the brokers a monthly fee for access to the service. Revenue from the access fees is recognized in the period that the service is provided.
c) Government Cost-Plus-Fixed-Fee
The Company uses a percentage-of-completion method of accounting for its federal government contract in its Medicare segment. Costs incurred to date are compared to total estimated project costs and revenue is recognized in proportion to costs incurred. The Company periodically evaluates the actual status of the project to ensure that the estimated cost to complete each contract remains accurate and estimated losses, if any, are recognized in the period in which such losses are determined. There was no unbilled revenue as of the consolidated balance sheet dates, relating to the government contract.
d) Commissions
Within the Private Exchange segment, the Company earns commissions on annual employee enrollments in which the Company’s health plan network and software solutions are used in connection with each enrollment. Commissions are recorded in the period the enrollment is completed.
Cost of Revenue—Cost of revenue primarily consists of employee compensation and benefits, professional services costs and depreciation and amortization of assets directly associated with generating revenue. In addition, the Company allocates a portion of overhead, such as rent, facility depreciation and utilities, to cost of revenue based on employee salary.
Deferred Implementation Costs—The Company’s accounting policy is to capitalize direct, incremental employee labor and fringe benefits along with third-party independent contractor costs related to implementing new customer software solutions, to the extent that they are deemed recoverable. Deferred implementation costs as of December 31, 2014, and 2013 are $24,552 and $19,899, respectively, with the increase due to the increase in customer implementations, offset by current period amortization. Deferred implementation costs are amortized over the respective term of the related customer contract arrangement consistent with the recognition of deferred revenue.
Stock-Based Compensation—The Company applies a fair-value based measurement method in accounting for share-based payment transactions with employees. Compensation cost is recognized based on the grant-date fair value, amortized on a straight-line basis over the vesting period.
Preferred Stock Dividends—Given the Company’s accumulated deficit, the Company’s accounting policy is to record the mandatorily payable dividends as a reduction of additional paid-in capital (APIC) with the offset as an increase to redeemable preferred stock on the consolidated balance sheets. As of December 31, 2014 there are no issued and outstanding shares of Preferred Stock.
Comprehensive Loss—The Company’s net loss equals comprehensive loss for the years ending December 31, 2014, 2013 and 2012.
Income Taxes—Deferred tax assets and liabilities are recognized for the future tax consequences attributable to differences between the financial statement carrying amounts of existing assets and liabilities and their respective
F-11
Table of Contents
tax bases. Deferred tax assets and liabilities are measured using enacted tax rates expected to apply to taxable income in the years in which those temporary differences are expected to be recovered or settled. The effect on deferred tax assets and liabilities of a change in tax rates is recognized in income in the period that the change becomes enacted. Valuation allowances are established when necessary to reduce deferred tax assets to the amounts expected to be realized. The Company’s policy for recording interest and penalties associated with uncertain tax positions is to record such items in income tax expense.
Basic and Diluted Net Loss Per Common Share—The Company uses the two-class method to compute net loss per common share because the Company has issued securities, other than common stock, that contractually entitle the holders to participate in dividends and earnings of the Company. The two-class method requires earnings for the period to be allocated between common stock and participating securities based upon their respective rights to receive distributed and undistributed earnings. Holders of each series of the Company’s redeemable convertible preferred stock are entitled to participate in distributions, when and if declared by the board of directors, that are made to common stockholders, and as a result are considered participating securities.
Under the two-class method, for periods with net income, basic net income per common share is computed by dividing the net income attributable to common stockholders by the weighted-average number of shares of common stock outstanding during the period. Net income attributable to common stockholders is computed by subtracting from net income the portion of current year earnings that the participating securities would have been entitled to receive pursuant to their dividend rights had all of the year’s earnings been distributed. No such adjustment to earnings is made during periods with a net loss, as the holders of the participating securities have no obligation to fund losses. Due to net losses for the years ended December 31, 2014, 2013,and 2012, basic and diluted loss per share were the same, as the effect of potentially dilutive securities would have been anti-dilutive.
New Accounting Standards—In May 2014, the Financial Accounting Standards Board, or FASB, issued Accounting Standards Update, or ASU, No. 2014-09, Revenue From Contracts With Customers (Topic 606), that outlines a single comprehensive model for entities to use in accounting for revenue arising from contracts with customers and supersedes most current revenue recognition guidance, including industry-specific guidance. The ASU is based on the principle that an entity should recognize revenue to depict the transfer of goods or services to customers in an amount that reflects the consideration to which the entity expects to be entitled in exchange for those goods or services. The ASU also requires additional disclosure about the nature, amount, timing and uncertainty of revenue and cash flows arising from customer contracts, including significant judgments and changes in judgments and assets recognized from costs incurred to fulfill a contract. Entities have the option of using either a full retrospective or a modified retrospective approach for the adoption of the new standard. The ASU becomes effective for the Company at the beginning of its 2018 fiscal year; early adoption is not permitted. The Company is currently assessing the impact that this standard will have on its consolidated financial statements.
In April 2014, the FASB issued ASU No. 2014-08, Presentation of Financial Statements (Topic 205), on reporting discontinued operations and disclosures of disposals of components of an entity. The new guidance changes the requirements for reporting discontinued operations. A discontinued operation may include a component of an entity or a group of components of an entity. A disposal of a component of an entity or a group of components of an entity is required to be reported in discontinued operations if the disposal represents a strategic shift that has (or will have) a major effect on an entity’s operations and financial results and when the component or group of components meets the criteria to be classified as held for sale, is disposed by sale or is disposed of by other than by sale. This guidance is effective on a prospective basis for annual periods beginning January 1, 2015. The Company does not expect the adoption of this guidance to have a material impact on the consolidated financial statements.
In August 2014, the FASB issued ASU No. 2014-15, Presentation of Financial Statements—Going Concern (Subtopic 205-40): Disclosure of Uncertainties about an Entity’s Ability to Continue as a Going Concern, providing guidance about management’s responsibility to evaluate whether there is substantial doubt about an
F-12
Table of Contents
entity’s ability to continue as a going concern and to provide related footnote disclosures. The amendments in this ASU are effective for the annual period ending after December 15, 2016, and for annual periods and interim periods thereafter. Early adoption is permitted. The Company does not expect the adoption of the amendments in this ASU to have a significant impact on the consolidated financial statements.
3. NET LOSS PER COMMON SHARE
Diluted loss per common share is the same as basic loss per common share for all periods presented because the effects of potentially dilutive items were anti-dilutive given the Company’s net loss. The following common share equivalent securities have been excluded from the calculation of weighted-average common shares outstanding because the effect is anti-dilutive for the periods presented:
| Year Ended December 31, | ||||||||||||
| 2014 | 2013 | 2012 | ||||||||||
| Anti-Dilutive Common Share Equivalents |
||||||||||||
| Redeemable convertible preferred stock |
14,047,208 | 14,861,539 | 12,286,394 | |||||||||
| Stock options |
1,373,895 | 576,809 | — | |||||||||
| Warrant to purchase common stock |
— | 132,095 | 101,455 | |||||||||
|
|
|
|
|
|
|
|||||||
| Total anti-dilutive common share equivalents |
15,421,103 | 15,570,443 | 12,387,849 | |||||||||
|
|
|
|
|
|
|
|||||||
Basic and diluted net loss per common share is calculated as follows:
| Year Ended December 31, | ||||||||||||
| 2014 | 2013 | 2012 | ||||||||||
| Numerator: |
||||||||||||
| Net loss |
$ | (10,160 | ) | $ | (26,384 | ) | $ | (16,756 | ) | |||
| Less: Preferred stock dividends |
3,830 | 3,685 | 2,262 | |||||||||
|
|
|
|
|
|
|
|||||||
| Net loss attributable to common stock |
$ | (13,990 | ) | $ | (30,069 | ) | $ | (19,018 | ) | |||
|
|
|
|
|
|
|
|||||||
| Denominator: |
||||||||||||
| Weighted-average common shares outstanding, basic and diluted |
1,362,109 | 184,051 | 1,353,862 | |||||||||
|
|
|
|
|
|
|
|||||||
| Net loss per common share, basic and diluted |
$ | (10.27 | ) | $ | (163.37 | ) | $ | (14.05 | ) | |||
|
|
|
|
|
|
|
|||||||
4. DRX ACQUISITION
On January 15, 2013, the Company completed the stock acquisition of DRX, for a cash purchase price of $27,000 plus a $3,000 note payable to sellers (subject to adjustment), a $1,000 deferred cash purchase price, and contingent consideration of up to $3,000.
F-13
Table of Contents
The contingent consideration consists of two annual earn-out payments based on actual 2013 and 2014 DRX revenue exceeding contractual targets. The contingent consideration is measured at fair value on a recurring basis, using Level 3 inputs (Defined in Note 2). The Company arrived at recorded fair value measurements using a probability-weighted estimate of future DRX revenue and resulting contingent earn-out payments, discounted at a risk-adjusted rate. The following is the change in the total recorded contingent consideration during the year ended December 31:
| 2014 | 2013 | |||||||
| Beginning at January 1 |
$ | 2,832 | $ | — | ||||
| Earn out related to acquisition |
— | 2,570 | ||||||
| Accretion |
119 | 262 | ||||||
| Non-cash settlement |
(538 | ) | — | |||||
| Change in fair value |
(951 | ) | — | |||||
| Payment |
(1,462 | ) | — | |||||
|
|
|
|
|
|||||
| End of year |
$ | — | $ | 2,832 | ||||
|
|
|
|
|
|||||
The amount of the achieved 2013 earn-out was $2,000. During the year ended December 31, 2014 the Company and DRX sellers agreed to a $538 non-cash acquisition working capital and indemnification claim settlement which reduced the earned 2013 earn-out. The non-cash settlement was recorded as a $261 increase to the principal of the DRX Seller Note (See Note 8) and a $277 non-operating gain within other expenses in the accompanying consolidated statements of operations and other comprehensive loss for the year ended December 31, 2014.
The 2014 earn-out target was not achieved and accordingly the Company recorded a $951 change in fair value of the contingent consideration as a reduction of general and administrative expenses in the accompanying consolidated statements of operations and other comprehensive loss in the fourth quarter of the year ended December 31, 2014.
The initial allocation of the purchase price for DRX as of December 31, 2013, is as follows:
| 2013 | ||||
| Cash and cash equivalents |
$ | 1,121 | ||
| Trade accounts receivable |
3,437 | |||
| Prepaid expenses and other current assets |
202 | |||
| Intangible assets |
20,400 | |||
| Goodwill |
18,411 | |||
| Other long-term assets |
443 | |||
| Accounts payable and other current liabilities |
(8,481 | ) | ||
| Deferred tax liability |
(1,201 | ) | ||
| Other long-term liabilities |
(1,023 | ) | ||
|
|
|
|||
| Total purchase price |
$ | 33,309 | ||
|
|
|
|||
The goodwill is primarily attributable to synergies with the software and services that DRX provides and the anticipated value of selling the Company’s software and services to DRX’s existing client base. The goodwill and intangible assets have been assigned to the Medicare and Private Exchange operating segments. The goodwill and intangible assets are not deductible for income tax purposes.
F-14
Table of Contents
The values allocated to intangible assets, are as follows:
| Gross Carrying Amount |
Weighted- Average Useful Life |
|||||||
| Customer relationships |
$ | 6,600 | 10 years | |||||
| Acquired technology |
10,300 | 5 years | ||||||
| Covenants not to compete |
700 | 2.5 years | ||||||
| Trademarks |
2,800 | 10 years | ||||||
Revenue and net income attributable to DRX from acquisition date through December 31, 2013 were approximately $21,000 and $3,000, respectively. The following unaudited supplemental pro forma information presents the Company’s results of operations as though the acquisition of DRX had occurred on January 1, 2012. The information is not indicative of the Company’s operating results which would have occurred had the acquisition been consummated as of that date. The pro forma information below does not include anticipated synergies, the impact of purchase accounting adjustments or certain other expected benefits of the acquisition and should not be used as a predictive measure of the Company’s future results of operations.
| (In thousands, except per share data) | Pro Forma Unaudited 2012 |
|||
| Total revenue |
$ | 46,909 | ||
| (Loss) from operations |
(16,590 | ) | ||
| Net (loss) |
(21,072 | ) | ||
| Net (loss) per share—basic and diluted |
$ | (15.56 | ) | |
The pro forma financial information has been adjusted, where applicable, for: (i) amortization of acquired intangible assets, (ii) additional interest expense on acquisition financing, and (iii) the income tax effect of the pro forma adjustments.
5. PROPERTY AND EQUIPMENT
Property and equipment consisted of the following as of December 31:
| 2014 | 2013 | |||||||
| Furniture and fixtures |
$ | 729 | $ | 449 | ||||
| Computer equipment |
3,134 | 2,480 | ||||||
| Leasehold improvements |
443 | 430 | ||||||
|
|
|
|
|
|||||
| Property and equipment—gross |
4,306 | 3,359 | ||||||
| Accumulated depreciation |
(2,414 | ) | (1,385 | ) | ||||
|
|
|
|
|
|||||
| Property and equipment—net |
$ | 1,892 | $ | 1,974 | ||||
|
|
|
|
|
|||||
Depreciation expense for the years ended December 31, 2014, 2013 and 2012 was $964, $852 and $500, respectively.
F-15
Table of Contents
6. GOODWILL AND OTHER INTANGIBLE ASSETS
Goodwill—The 2013 increase in the carrying value of Medicare and Private Exchange goodwill resulted from the January 15, 2013 DRX acquisition (See Note 4). The Company has no accumulated goodwill impairments as of December 31, 2014 or 2013.
| Total | Enterprise: Commercial |
Enterprise: State |
Medicare | Private Exchange |
||||||||||||||||
| Balance as of January 1, 2013 |
$ | 8,368 | $ | 7,732 | $ | — | $ | — | $ | 636 | ||||||||||
|
|
|
|
|
|
|
|
|
|
|
|||||||||||
| Acquisition |
18,411 | — | — | 14,711 | 3,700 | |||||||||||||||
|
|
|
|
|
|
|
|
|
|
|
|||||||||||
| Balance as of December 31, 2013 |
26,779 | 7,732 | — | 14,711 | 4,336 | |||||||||||||||
|
|
|
|
|
|
|
|
|
|
|
|||||||||||
| Balance as of December 31, 2014 |
$ | 26,779 | $ | 7,732 | $ | — | $ | 14,711 | $ | 4,336 | ||||||||||
|
|
|
|
|
|
|
|
|
|
|
|||||||||||
Other Intangible Assets—Other intangible assets consist of the following as of December 31, 2014:
| Useful Lives— In Years |
Gross Carrying Value |
Accumulated Amortization |
Net Carrying Value |
|||||||||||||
| Customer Relationship |
3-10 | $ | 7,298 | $ | (1,625 | ) | $ | 5,673 | ||||||||
| Covenants not to complete |
2.5-5 | 800 | (627 | ) | 173 | |||||||||||
| Acquired Technology |
3-5 | 11,792 | (5,266 | ) | 6,526 | |||||||||||
| Trademarks |
10 | 2,800 | (548 | ) | 2,252 | |||||||||||
| Software |
3 | 1,699 | (973 | ) | 726 | |||||||||||
|
|
|
|
|
|
|
|||||||||||
| $ | 24,389 | $ | (9,039 | ) | $ | 15,350 | ||||||||||
|
|
|
|
|
|
|
|||||||||||
Other intangible assets consist of the following as of December 31, 2013:
| Useful Lives— In Years |
Gross Carrying Value |
Accumulated Amortization |
Net Carrying Value |
|||||||||||||
| Customer Relationship |
3-10 | $ | 7,298 | $ | (906 | ) | $ | 6,392 | ||||||||
| Covenants not to complete |
2.5-5 | 800 | (327 | ) | 473 | |||||||||||
| Acquired Technology |
3-5 | 11,792 | (2,966 | ) | 8,826 | |||||||||||
| Trademarks |
10 | 2,800 | (268 | ) | 2,532 | |||||||||||
| Software |
3 | 1,626 | (435 | ) | 1,191 | |||||||||||
|
|
|
|
|
|
|
|||||||||||
| $ | 24,316 | $ | (4,902 | ) | $ | 19,414 | ||||||||||
|
|
|
|
|
|
|
|||||||||||
Amortization expense for the years ended December 31, 2014, 2013, and 2012, was $4,137, $3,858, and $513, respectively, and has been recorded in cost of revenue and general and administrative expenses.
Estimated future amortization expense for the Company’s intangible assets is as follows:
| Year Ending December 31 |
Amount | |||
| 2015 |
$ | 4,007 | ||
| 2016 |
3,257 | |||
| 2017 |
3,071 | |||
| 2018 |
1,086 | |||
| 2019 |
1,000 | |||
| thereafter |
2,929 | |||
|
|
|
|||
| Total future amortization expense |
$ | 15,350 | ||
|
|
|
|||
F-16
Table of Contents
7. COMMITMENTS AND CONTINGENCIES
Capital Leases—As of December 31, 2014 and 2013, capital lease obligations consisted of the following:
| 2014 | 2013 | |||||||
| 7.98% lease obligation on ERP software, expiring July 2016, payable in variable monthly installments |
$ | 411 | $ | 853 | ||||
| Various lease obligations on computer equipment and office furniture, expiring April 2017, payable in fixed monthly installments bearing interest of 3.7% to 11.8% |
156 | 122 | ||||||
|
|
|
|
|
|||||
| 567 | 975 | |||||||
| Less current maturities |
(418 | ) | (524 | ) | ||||
|
|
|
|
|
|||||
| Long-term portion |
$ | 149 | $ | 451 | ||||
|
|
|
|
|
|||||
Future minimum capital lease payments are as follows:
| Years Ended December 31 |
Amount | |||
| 2015 |
$ | 448 | ||
| 2016 |
126 | |||
| 2017 and thereafter |
35 | |||
|
|
|
|||
| 609 | ||||
| Less amount representing interest |
(42 | ) | ||
|
|
|
|||
| Total |
$ | 567 | ||
|
|
|
|||
The Company’s most significant capital lease relates to the 2013 lease of the Company’s enterprise resource planning, or ERP, software. The leased software asset is included in other intangible assets—net, in the accompanying December 31, 2014 and 2013 consolidated balance sheet as follows:
| 2014 | 2013 | |||||||
| ERP Software |
$ | 1,232 | $ | 1,232 | ||||
| Less accumulated amortization |
(753 | ) | (342 | ) | ||||
|
|
|
|
|
|||||
| Total |
$ | 479 | $ | 890 | ||||
|
|
|
|
|
|||||
Amortization of the software asset under capital lease totaled $411 and $342 for the years ended December 31, 2014 and 2013, respectively, and is included in general and administrative expenses in the accompanying consolidated statements of operations.
In addition to the accounting software capital lease obligation the Company is separately contracted with third-parties for maintenance and hosting obligations of approximately $30 per month through September 2017. The monthly maintenance and hosting obligations are cancellable for an immaterial amount, with customary advance notice to the maintenance and hosting vendors.
Operating Leases—The Company leases office space under operating leases that expire at various dates through 2025. Rent expense for the years ended December 31, 2014, 2013 and 2012, was approximately $1,587, $1,439 and $785, respectively.
F-17
Table of Contents
Future minimum lease payments under non-cancelable operating leases with initial or remaining terms equal to or exceeding one year are as follows:
| Year Ending December 31 |
Operating Leases |
|||
| 2015 |
$ | 1,720 | ||
| 2016 |
1,514 | |||
| 2017 |
1,380 | |||
| 2018 |
1,108 | |||
| 2019 |
1,077 | |||
| Thereafter |
3,234 | |||
|
|
|
|||
| Total minimum lease payments |
$ | 10,033 | ||
|
|
|
|||
The leases provide for escalating rent over the term of the leases. The rent costs associated with such leases are aggregated and recognized on a straight-line basis over the lease term. The difference between the monthly rent payment and the straight-line rent requires an accrual of rent to be recognized and then amortized over the term of the lease. Accrued straight-line rent as of December 31, 2014 and 2013 amounted to approximately $267 and $227, respectively, and is included in other liabilities and other long-term liabilities in the accompanying consolidated balance sheets.
Letter of Credit—As security for certain leased property, the Company was required to provide a lessor an unconditional and irrevocable letter of credit in the amount $200 as of December 31, 2014 and 2013.
Deposits—From time to time the Company has been required to remit security deposits as a condition of certain of its office leases. The deposits are included in other assets on the balance sheet and amount to approximately $710 and $740 as of December 31, 2014 and 2013, respectively.
Indemnifications—The Company provides certain indemnifications from time to time in the normal course of business to its customers in its professional services and software license agreements and to strategic partners through certain insurance industry association marketing agreements that contain certain indemnifications for claims that may arise from acts or omissions, patent or trademark infringement, breach of contractual representations and warranties or intentional or grossly negligent acts. These indemnifications may require the Company to reimburse the indemnified party for losses suffered or incurred by the indemnified party. The Company has not had an indemnification claim, and does not expect to have a material claim in the future. As such, the Company has not recorded any liability for these indemnifications in the consolidated financial statements.
In August 2013, a client of the Company’s acquired DRX subsidiary tendered a demand for indemnification for a claim filed against the client arising from the alleged incorrect ranking of plans on the client’s Medicare Part D website (the “Indemnification Claim”). DRX designed and hosted the interactive website. No specific damages were asserted in the claim, and the claim relates to services provided to the client prior to the Company’s acquisition of DRX. The DRX sellers have specifically indemnified the Company for any liability arising from this matter in the DRX Agreement and Plan of Merger. As of December 31, 2014, the Company has not accrued a loss contingency for this matter as subsequent to year end, the Indemnification Claim was settled and the Company incurred no loss (see Note 17).
Litigation—In the normal course of business, the Company and its subsidiaries are named as defendants in lawsuits and are party to contract terminations and settlements in which claims are or may be asserted against the Company. In the opinion of management, the liabilities, if any, which may ultimately result from such lawsuits and contract terminations are not expected to have a material effect on the Company’s consolidated financial statements.
F-18
Table of Contents
8. DEBT
Debt consisted of the following as of December 31, 2014 and 2013:
| 2014 | 2013 | |||||||
| Senior term loans |
$ | 20,250 | $ | 21,375 | ||||
| Senior revolving credit facility |
354 | 4,306 | ||||||
| Subordinated loans |
32,456 | 12,568 | ||||||
|
|
|
|
|
|||||
| 53,060 | 38,249 | |||||||
| Less: current maturities of debt |
(4,479 | ) | (5,431 | ) | ||||
|
|
|
|
|
|||||
| Long-term debt |
$ | 48,581 | $ | 32,818 | ||||
|
|
|
|
|
|||||
Senior Debt—On January 15, 2013, the Company entered into a bank credit facility to provide for short-term working capital and long-term investment needs (the “Credit Facility” as amended and restated from time-to-time). The Credit Facility is collateralized by all of the Company’s assets. The Credit Facility replaced the Company’s previous bank facility, which was paid in full on January 15, 2013.
The Credit Facility provides for $22,500 of term loans (the “Senior Term Loans”) and $10,000 of revolving credit (the “Senior Revolving Credit Facility”) through January 15, 2018 (the “Maturity Date”). The Senior Term Loans require quarterly principal payments of $281 commencing on March 31, 2013, with the unpaid principal balance payable in full on the Maturity Date. At December 31, 2014, the Company had $200 in letters of credit issued under the Credit Facility and $9,446 in available revolving credit under the Credit Facility.
The Senior Term Loans accrue interest at a rate based on LIBOR plus a LIBOR Margin payable monthly. The Senior Revolving Credit Facility accrues interest monthly at a rate based on LIBOR, the Fed Funds Rate or bank’s Prime Rate. The interest rate on the outstanding Senior Term Loans and Senior Revolving Credit Facility advances were 6.50% to 8.25% as of December 31, 2014.
The Credit Facility contains customary representations, warranties and covenants of the Company, as well as various limitations on the activities of the Company as they relate to additional indebtedness, junior liens, investments, capital expenditures, and mergers and acquisitions. Furthermore, the Credit Facility does not permit the payment of cash dividends if such payment would result in a covenant violation. As of December 31, 2014, the Company was in compliance with financial covenants, and subsequent to year-end, the Credit Facility was amended to define the 2015 covenants (See Note 17).
THL Promissory Note—On March 18, 2013 the Company entered into a Senior Subordinated Term Loan Agreement with THL Corporate Finance, Inc., (the “THL Note”, as amended from time-to-time), for total proceeds of $10,000 less $200 of original issue discount, or OID, to finance the repayment of the Harbert Notes and to provide working capital.
During the year ended December 31, 2014, the Company amended the THL Note to, among other things, provide $20,000 of additional subordinated term note financing reduced by approximately $500 of original issue discount. The proceeds from the additional financing were used to repay then outstanding amounts due on the Senior Revolving Credit Facility and fund working capital needs.
The THL Note maturity date is July 15, 2018, with the principal balance payable in full at the maturity date. The THL Note provides for contingent prepayment penalties of up to 5.0% of the THL Note. Interest on the THL Note accrues at a variable rate of LIBOR plus a LIBOR Margin, as defined, and is payable monthly. As of December 31, 2014, the rate was 12.0% and the outstanding balance, net of OID, was $29,456. Subsequent to year-end, the THL Note was amended (See Note 17).
F-19
Table of Contents
DRX Seller Note—On January 15, 2013, the Company entered into a subordinated promissory note with the sellers of DRX (the “DRX Seller Note”). The $3,000 principal amount is subject to adjustment upon resolution of the Closing Day Working Capital, as defined in the Company’s purchase agreement with the DRX sellers. The principal was adjusted down by $261 to $2,739 during the year ended December 31, 2013, and subsequently adjusted up to $3,000 during the nine months ended September 30, 2014 due settlement of an acquisition related working capital and indemnification claim. As of December 31, 2014 the adjusted principal was $3,000 and accrues annual interest at 8.0% payable with the adjusted principal on the January 15, 2015 maturity date. Subsequent to December 31, 2014, the Company repaid the final adjusted principal and interest (See Note 17).
Related Party Bridge Loan—On May 29, 2014, the Company entered into a $1,250 subordinated, one-year term note financing from two related party stockholders or entities controlled by stockholders of the Company. The note accrues interest at a fixed 14.0% and contains a contingent exit fee of $625 payable upon occurrence of a Deemed Liquidation Event (as defined in the Fifth Amended and Restated Certificate of Incorporation of the Company, as amended). The proceeds were used to fund working capital needs. The $1,250 note and accrued interest of $105 was repaid on December 29, 2014 resulting in the extinguishment of the note.
Harbert Note—On February 16, 2011, the Company entered into a promissory note with Harbert Mezzanine Partners (the “Harbert Note” as amended from time to time) for total proceeds of $6,000 to finance the cash portion of a prior acquisition and to provide working capital. Interest accrued on the Harbert Note at a rate of 13.5% and was payable monthly. Simultaneous with the Harbert Note the Company issued four warrants for 2,478,699, 527,250, 580,660 and 409,203 shares of Common, Series C Preferred, Series D Preferred and Series D-1 Preferred stock, respectively. The fair value of the warrants on the issuance date amounted to approximately $701, recognized on the balance sheet as a discount on notes payable to be amortized to interest expense over the term of the Harbert Note using the effective interest rate method.
On January 15, 2013, the Harbert Note was amended to include a warrant to purchase shares of Series A and Series B Preferred Stock and common stock equivalent to 4.5% of the fully diluted outstanding shares of the Company, in the event the Harbert Note was not paid in full by July 1, 2013. On March 15, 2013, the Harbert Note was paid in full and the warrant was purchased for $250 by the Company and retired.
Insurix Seller Notes—On February 16, 2011, the Company entered into promissory notes (the “Insurix Notes” as amended from time to time) with the sellers of Insurix totaling $1,000 with an interest rate of 4% plus the Prime Rate, payable monthly. The Insurix Notes were repaid during the year ended December 31, 2013.
Future principal payments on debt as of December 31, 2014, are as follows:
| Years Ending December 31 |
||||
| 2015 |
$ | 4,479 | ||
| 2016 |
1,125 | |||
| 2017 |
844 | |||
| 2018 |
47,156 | |||
|
|
|
|||
| 53,604 | ||||
| Less original issue discount |
(544 | ) | ||
|
|
|
|||
| Total |
$ | 53,060 | ||
|
|
|
|||
Based on rates for instruments with comparable maturities and credit quality, which are classified as Level 2 inputs (Defined in Note 2), the estimated fair value of the Company’s total debt approximated carrying value as of December 31, 2014 and approximated $37,300 as of December 31, 2013.
F-20
Table of Contents
9. RECAPITALIZATION
On August 3, 2012, the Company completed a recapitalization which included the following transactions:
The Company authorized the issuance of 25,000,000, 20,000,000, and 52,500,000 shares of Series A
Preferred Stock, Series B Preferred Stock, and Common Stock, respectively.
Certain stockholders exchanged 94,689,947 shares of Series C, Series D, and Series D-1 Preferred Stock for 23,966,622 shares of Series A Preferred Stock, which comprised approximately 51% of fully diluted ownership of the Company. In addition, 8,047,593 shares of Common Stock were exchanged for 921,451 shares of Series A Preferred Stock.
Certain stockholders of the Company exchanged 165,375,473 shares of Series C, Series D, Series D-1 Preferred Stock, and Common Stock for 12,666,520 shares of Series B Preferred Stock. All previously issued and outstanding warrants for the purchase of Common Stock, Series C, Series D and Series D-1 Preferred Stock were exercised and simultaneously exchanged for 1,736,298 shares of Series B Preferred Stock. In addition, 11,299,000 options to purchase Common Stock were exercised and simultaneously exchanged for 1,293,735 shares of Series B Preferred Stock. Following these exchanges, holders of the Series B Preferred Stock (collectively the “Sellers”), comprised approximately 33% of fully diluted ownership of the Company. The Sellers then sold 15,696,553 shares of Series B Preferred Stock to a new investor in the Company.
Following the completion of these transactions, the Company issued 2,000,000 shares of Series B Preferred Stock to the new investor and 2,000,000 shares of Series B Preferred Stock to an existing investor in an offering raising $4,000 of cash.
10. REDEEMABLE CONVERTIBLE PREFERRED STOCK
In connection with the Company’s December 2014 initial public offering, all then issued and outstanding shares of Series A and B Preferred Stock were converted on a three-for-one basis into common stock.
The following table summarizes the number of shares designated, issued and outstanding as of December 31, 2013:
| Series A Redeemable Convertible Preferred Stock (Series A Preferred Stock)—26,100,000 shares designated |
24,888,073 | |||
| Series B Redeemable Convertible Preferred Stock (Series B Preferred Stock)—20,700,000 shares designated |
19,696,553 | |||
|
|
|
|||
| Total preferred stock shares issued and outstanding |
44,584,626 | |||
|
|
|
Dividends—In connection with the Company’s December 2014 initial public offering, the Company paid $8,991 of dividends to holders of Series A and B Preferred Stock. Cumulative undeclared Series A and B Preferred Stock dividends were zero and $5,161 as of December 31, 2014 and 2013, respectively.
11. STOCKHOLDERS’ DEFICIT
Common Stock—As of December 31, 2014, and 2013, the Company has authorized the issuance of 75,000,000, and 54,700,000 shares of common stock, respectively, par value of $0.001 per share.
Reserved Shares—As of December 31, 2014, the Company has 3,106,357 shares of common stock reserved for issuance in connection with the Company’s stock incentive plans.
August 2012 Recapitalization—In connection with the August 2012 recapitalization, all holders of options granted under the then frozen 2002 Incentive Stock Plan were paid a cash bonus in exchange for forfeiting those options as the option exercise prices were higher than fair value at the time of the recapitalization. The cash bonus totaled approximately $147 and was recognized as compensation expense in 2012.
F-21
Table of Contents
On August 3, 2012, in connection with the recapitalization, 11,379,000 options previously granted under the 2010 Incentive Stock Plan (the “2010 Plan”) were exercised by the holders of the options and the shares simultaneously sold by the holders for cash. The vesting period on these options was accelerated to facilitate the exercise and $272 of stock-based compensation expense was recognized as a result of the accelerated vesting. The aggregate exercise price paid to exercise the options was approximately $500.
Equity Incentive Plans—In connection with the Company’s December 2014 initial public offering, the Board of Directors approved the 2014 Equity Incentive Plan (the 2014 “Plan”) as a replacement to the 2010 Plan. The Company will not grant any additional awards under the 2010 Plan; however the 2010 Plan will continue to govern the terms and conditions of all outstanding equity awards previously granted under the 2010 Plan.
The 2014 Plan provides for the awarding of stock options, stock appreciation rights, restricted stock, restricted stock units, performance shares and performance units, and other stock-based or cash settled equity awards as deemed appropriate by the compensation committee of the Company’s board of directors. As of December 31, 2014, there were no equity incentives awarded under the 2014 Plan.
Activity under the Company’s stock incentive plans is summarized as follows:
| Number of Shares |
Average Price(a) |
Average Life (Years)(b) |
Aggregate Intrinsic Value (in 000s) |
|||||||||||||
| Outstanding—January 1, 2013 |
1,913,516 | $ | 1.866 | 9.66 | ||||||||||||
| Options exercised |
— | $ | — | |||||||||||||
| Options forfeited |
(194,328 | ) | $ | 1.866 | ||||||||||||
| Options granted |
120,867 | $ | 2.931 | |||||||||||||
|
|
|
|||||||||||||||
| Outstanding as of December 31, 2013 |
1,840,054 | $ | 1.905 | 8.72 | ||||||||||||
| Options exercised |
(8,633 | ) | $ | 1.866 | ||||||||||||
| Options forfeited |
(88,740 | ) | $ | 1.778 | ||||||||||||
| Options granted |
95,400 | $ | 2.268 | |||||||||||||
|
|
|
|||||||||||||||
| Outstanding as of December 31, 2014 |
1,838,082 | $ | 1.931 | 7.39 | $ | 13,012 | ||||||||||
|
|
|
|||||||||||||||
| Exercisable—December 31, 2014 |
1,370,220 | $ | 1.867 | 7.44 | $ | 9,787 | ||||||||||
|
|
|
|||||||||||||||
| (a) | Weighted-average exercise price |
| (b) | Weighted-average contractual life remaining |
The consolidated statements of operations and comprehensive loss include $1,436, $639 and $700 in stock-based compensation expense for the years ended December 31, 2014, 2013 and 2012, respectively. As of December 31, 2014 approximately $1,455 of total unrecognized compensation costs related to unvested awards is expected to be recognized over the remaining vesting periods of approximately 1.5 years.
The weighted average estimated fair value of the Company’s granted stock options at grant date were $16.20 and $15.66 per option during the years ended December 31, 2014 and 2013, respectively.
The weighted average fair value of stock options is estimated at the date of grant using a Black-Scholes option-pricing model. Because the Company does not have a sufficient history to estimate the expected term, the Company has elected to use the simplified method for estimating expected term equal to the midpoint between the vesting period and the contractual term. The Company currently estimates volatility by using the weighted average historical volatility of comparable public companies. The risk-free interest rate is the rate available as of the option date on zero-coupon U.S. government issues with a remaining term equal to the expected term of the option. The Company has not paid dividends in the past and does not plan to pay any dividends in the foreseeable
F-22
Table of Contents
future. The Company has estimated forfeitures in determining the weighted average fair value calculation. The forfeiture rate used for the years ended December 31, 2014 and 2013 was zero and 11%, respectively. The Company’s estimate of forfeitures will be adjusted over the requisite service period based on the extent to which actual forfeitures differ, or are expected to differ, from the estimate. The following are significant weighted average assumptions used for estimating the fair value of options granted for the years ended December 31:
| 2014 | 2013 | |||||||
| Common stock share value |
$ | 18.12 | $ | 18.12 | ||||
| Expected life (years) |
5.75 | 6.00 | ||||||
| Volatility |
50.33 | % | 50.21 | % | ||||
| Interest rate |
2.03 | % | 1.61 | % | ||||
| Dividend yield |
0.00 | % | 0.00 | % | ||||
Employee Stock Purchase Plan—In November 2014, the Company’s board of directors approved the 2014 Employee Stock Purchase Plan (the “ESPP”), which is a broadly-based stock purchase plan in which any eligible employee may elect to participate by authorizing the Company to make payroll deductions in a specific amount or designated percentage to purchase shares of the Company’s common stock at 90% of the lower of the fair market value on the first day of trading of the offering period or on the purchase date. In no event will an employee be granted ability under the ESPP that would permit the purchase of common stock with a fair market value in excess of $25,000 in any calendar year. The ESPP is designed to comply with Section 423 of the Code, and thus is eligible for the favorable tax treatment afforded by Section 423.
At December 31, 2014, a total of 240,000 shares of common stock have been reserved for issuance under the ESPP. The ESPP provides that on January 1, 2015 and each subsequent anniversary through 2024, the available shares of common stock shall generally be increased by (a) 100,000 shares or (b) 0.25% of issued and outstanding shares of common stock on the immediately preceding December 31.
During the year ended December 31, 2014, no shares were purchased under the ESPP.
12. INCOME TAXES
The (provision) benefit for income taxes for the years ended December 31, 2014, 2013 and 2012, consists of:
| 2014 | 2013 | 2012 | ||||||||||
| Current tax expense: |
||||||||||||
| Federal |
$ | — | $ | (91 | ) | $ | — | |||||
| State |
(29 | ) | (206 | ) | 2 | |||||||
|
|
|
|
|
|
|
|||||||
| Total current tax (provision) benefit |
(29 | ) | (297 | ) | 2 | |||||||
|
|
|
|
|
|
|
|||||||
| Deferred tax expense: |
||||||||||||
| Federal |
(3 | ) | 1,044 | 2 | ||||||||
| State |
(1 | ) | 153 | (1 | ) | |||||||
|
|
|
|
|
|
|
|||||||
| Total deferred tax (provision) benefit |
(4 | ) | 1,197 | 1 | ||||||||
|
|
|
|
|
|
|
|||||||
| Total (provision) benefit for income taxes |
$ | (33 | ) | $ | 900 | $ | 3 | |||||
|
|
|
|
|
|
|
|||||||
F-23
Table of Contents
The (provision) benefit for income taxes for the years ended December 31, 2014, 2013 and 2012 differs from the amount of income tax determined by applying the applicable U.S. statutory federal income tax rate to the loss before (provision) benefit for income taxes as a result of the following:
| 2014 | 2013 | 2012 | ||||||||||
| Federal statutory rate |
34.0 | % | 34.0 | % | 34.0 | % | ||||||
| Effect of: |
||||||||||||
| State income taxes, net of federal benefit |
(0.2 | )% | (0.1 | )% | 0.0 | % | ||||||
| Valuation allowance |
(33.7 | )% | (32.4 | )% | (31.9 | )% | ||||||
| Other, net |
(0.4 | )% | 1.8 | % | (2.1 | )% | ||||||
|
|
|
|
|
|
|
|||||||
| Overall income tax rate |
(0.3 | )% | 3.3 | % | 0.0 | % | ||||||
|
|
|
|
|
|
|
|||||||
Deferred income taxes reflect the net effect of temporary differences between the carrying amounts of assets and liabilities for financial reporting purposes and the amounts used for income tax purposes. Significant components of the Company’s deferred tax assets are comprised of the following as of December 31:
| 2014 | 2013 | |||||||
| Deferred tax assets: |
||||||||
| Net operating loss carryforward |
$ | 24,248 | $ | 17,917 | ||||
| Deferred revenue |
25,673 | 31,809 | ||||||
| Research and development credit |
45 | 45 | ||||||
| Accrued payroll and related liabilities |
1,470 | 2,252 | ||||||
| Other |
249 | 518 | ||||||
| Valuation allowance |
(36,420 | ) | (37,896 | ) | ||||
|
|
|
|
|
|||||
| Net deferred tax assets |
$ | 15,265 | $ | 14,645 | ||||
|
|
|
|
|
|||||
| Deferred tax liabilities: |
||||||||
| Intangible assets |
$ | (5,708 | ) | $ | (6,899 | ) | ||
| Deferred implementation costs |
(9,576 | ) | (7,761 | ) | ||||
|
|
|
|
|
|||||
| Total deferred tax liabilities |
(15,284 | ) | (14,660 | ) | ||||
|
|
|
|
|
|||||
| Net deferred tax liability |
$ | (19 | ) | $ | (15 | ) | ||
|
|
|
|
|
|||||
Based on the uncertainties associated with future realization of the deferred tax asset, the Company established a valuation allowance, which reduces the deferred tax assets to an amount whose realization is more likely than not. The net change in the valuation allowance for the deferred tax asset was $(1,476), $10,830 and $2,794 for the years ended December 31, 2014, 2013 and 2012, respectively. Differences between effective and statutory tax rates are caused substantially by the change in the valuation allowance.
As of December 31, 2014 and 2013, the Company has federal net operating loss carryforwards of approximately $66,203 and $46,805, respectively, available to offset future earnings and federal research and development credits of approximately $45, also available to offset future federal income tax. The net operating loss carryforwards and research and development tax credit carryforwards expire at various dates from 2020 through 2034. As of December 31, 2014 and 2013, state net operating loss carryforwards were approximately $31,484 and $44,201, respectively. As of December 31, 2014 and 2013, management has recorded a full valuation allowance against net operating losses because management believes it is more likely than not that some portion or all of these deferred tax assets will not be realized.
Under the provisions of the Internal Revenue Code (IRC), certain substantial changes in the Company’s ownership may result in a limitation of the amount of net operating loss and tax credit carryforwards which can be used in future years. As of December 31, 2014 the Company completed an assessment of the net operating
F-24
Table of Contents
loss carryforwards that are limited under the IRC due to prior ownership changes and as a result reduced net operating loss carryforward deferred tax assets and related valuation allowances by approximately $4,900, respectively.
The Company has recorded no liability for unrecognized tax benefits and related interest and penalties as of December 31, 2014 and 2013.
The Company files income tax returns in the US federal tax jurisdiction and various state jurisdictions. The federal tax years for 2011 through 2014 remain open for examination. State tax years open for examination are generally 2010 through 2014, depending on the state. The Company is currently not under examination by any income tax jurisdictions for any years.
13. EMPLOYEE RETIREMENT PLAN
The Company sponsors a 401(k) profit sharing plan. All eligible employees of the Company who have reached the age of eighteen may participate in the plan. Each plan year, the Company’s Board of Directors will determine the amount, if any, that the Company will contribute to the plan as a Company matching contribution for that year. The Company recognized expense of approximately $373, $270, and zero for the years ended December 31, 2014, 2013 and 2012, respectively, to fund Company contributions to the plan.
14. SEGMENTS OF BUSINESS
Operating segments are defined as components of an enterprise for which discrete financial information is available that is evaluated regularly by the chief operating decision maker, or CODM, for purposes of allocating resources and evaluating financial performance. The Company’s CODM is the Chief Executive Officer and the CODM reviews financial information presented on a consolidated basis and for each operating segment, for purposes of allocating resources and evaluating financial performance.
The Company is organized into four reportable segments, which are based on software and service offerings. The Company’s reportable segments are consistent with its operating segments and are as follows:
Enterprise/Commercial—Offers the Company’s insurance distribution solutions to health plans.
Enterprise/State—Offers the Company’s sales automation solutions to state governments, which allows the Company’s state customers to offer customized individual and small group exchanges.
Medicare—Offers web-based Medicare plan comparison, prescription drug comparison and enrollment tools for health plans, pharmacy benefit managers, pharmacies, field marketing organizations, and call centers.
Private Exchange—Offers defined-contribution benefit exchange solutions to benefit consultants, brokers, exchange operators and aggregators.
The accounting policies of the segments are the same as those described in the summary of significant accounting policies. The Company does not allocate property and equipment assets or capital expenditures to reportable segments.
The Company evaluates the performance of its segments based on gross margin, which is regularly reviewed by the CODM and provides insight into our individual segments and their ability to contribute to future debt service and working capital requirements of the Company.
F-25
Table of Contents
Unallocated corporate expenses, and assets that are not considered when the Company’s CODM evaluates segment performance are grouped within Corporate in the following segment information:
| Year Ended December 31, | ||||||||||||
| 2014 | 2013 | 2012 | ||||||||||
| Revenue from external customers by segment: |
||||||||||||
| Enterprise/Commercial |
$ | 40,369 | $ | 33,028 | $ | 28,341 | ||||||
| Enterprise/State |
21,632 | 3,177 | 65 | |||||||||
| Medicare |
16,175 | 15,941 | — | |||||||||
| Private Exchange |
6,403 | 6,180 | 1,220 | |||||||||
|
|
|
|
|
|
|
|||||||
| Consolidated revenue |
$ | 84,579 | $ | 58,326 | $ | 29,626 | ||||||
|
|
|
|
|
|
|
|||||||
| Gross margin by segment: |
||||||||||||
| Enterprise/Commercial |
$ | 10,323 | ($ | 747 | ) | $ | 7,241 | |||||
| Enterprise/State |
11,038 | (1,121 | ) | (784 | ) | |||||||
| Medicare |
9,451 | 7,839 | — | |||||||||
| Private Exchange |
1,336 | 2,182 | 283 | |||||||||
|
|
|
|
|
|
|
|||||||
| Consolidated gross margin |
$ | 32,148 | $ | 8,153 | $ | 6,740 | ||||||
|
|
|
|
|
|
|
|||||||
| Consolidated operating expenses: |
||||||||||||
| Research and development |
$ | 18,125 | $ | 11,806 | $ | 7,371 | ||||||
| Sales and marketing |
7,729 | 6,800 | 6,644 | |||||||||
| General and administrative |
10,552 | 12,187 | 7,492 | |||||||||
|
|
|
|
|
|
|
|||||||
| Total consolidated operating expenses |
$ | 36,406 | $ | 30,793 | $ | 21,507 | ||||||
|
|
|
|
|
|
|
|||||||
| Consolidated loss from operations |
($ | 4,258 | ) | ($ | 22,640 | ) | ($ | 14,767 | ) | |||
|
|
|
|
|
|
|
|||||||
| Depreciation and amortization by segment: |
||||||||||||
| Enterprise/Commercial |
$ | 584 | $ | 523 | $ | 486 | ||||||
| Enterprise/State |
121 | 123 | 65 | |||||||||
| Medicare |
2,569 | 2,514 | — | |||||||||
| Private Exchange |
896 | 862 | 266 | |||||||||
| Corporate |
931 | 688 | 196 | |||||||||
|
|
|
|
|
|
|
|||||||
| Consolidated depreciation and amortization |
$ | 5,101 | $ | 4,710 | $ | 1,013 | ||||||
|
|
|
|
|
|
|
|||||||
| As of December 31, | ||||||||
| 2014 | 2013 | |||||||
| Indentifiable assets by segment: |
||||||||
| Enterprise/Commercial |
$ | 32,749 | $ | 31,353 | ||||
| Enterprise/State |
6,349 | 11,712 | ||||||
| Medicare |
28,314 | 31,943 | ||||||
| Private Exchange |
10,107 | 10,362 | ||||||
| Corporate |
34,825 | 8,863 | ||||||
|
|
|
|
|
|||||
| Consolidated assets |
$ | 112,344 | $ | 94,233 | ||||
|
|
|
|
|
|||||
All Company assets were held and all revenue was generated in the United States during the years ended December 31, 2014, 2013 and 2012.
F-26
Table of Contents
15. RELATED PARTIES
During 2014, the Company entered into a $1,250 subordinated term note financing with two related party stockholders or entities controlled by stockholders of the Company (See Note 8). The Company expensed and paid interest of $105 during 2014. The Company repaid the subordinated term note financing principal and interest in full on December 29, 2014.
During 2013, the Company expensed and paid approximately $600 of fees to a Company stockholder for services in connection with the Company’s January 15, 2013 acquisition of DRX. The transaction fees are a component of general and administrative expenses in the accompanying December 31, 2013 statement of operations.
On January 15, 2013, the Company acquired DRX (See Note 4). Current employees of the Company, including the Company’s current Chief Innovation Officer, New Markets, were employees and stockholders of DRX at the time of its acquisition, and as stockholders of DRX they received an interest in the $3,000 DRX Seller Note (See Note 8). None of the employees with an interest in the DRX Seller Note were employees of the Company at the time of the DRX acquisition.
16. CONOSOLIDATED SELECTED QUARTERLY FINANCIAL DATA (unaudited)
The following sets forth selected quarterly financial data for each of the eight quarters in the years ended December 31, 2014 and 2013.
| Quarter Ended | ||||||||||||||||||||||||||||||||
| Dec 31, 2014(3) |
Sept 30, 2014(2) |
Jun 30, 2014 |
Mar 30, 2014 |
Dec 31, 2013 |
Sept 30, 2013 |
Jun 30, 2013 |
Mar 30, 2013(1) |
|||||||||||||||||||||||||
| Consolidated Statements of Operation: | (in thousands, except share amounts) | |||||||||||||||||||||||||||||||
| Revenue |
$ | 27,825 | $ | 21,503 | $ | 19,201 | $ | 16,050 | $ | 24,957 | $ | 14,081 | $ | 10,013 | $ | 9,275 | ||||||||||||||||
| Gross margin |
13,590 | 8,661 | 6,414 | 3,483 | 9,688 | 816 | (2,060 | ) | (291 | ) | ||||||||||||||||||||||
| Total operating expenses |
7,635 | 10,026 | 9,732 | 9,013 | 7,916 | 7,721 | 7,665 | 7,491 | ||||||||||||||||||||||||
| Income (loss) from operations |
5,955 | (1,365 | ) | (3,318 | ) | (5,530 | ) | 1,772 | (6,905 | ) | (9,725 | ) | (7,782 | ) | ||||||||||||||||||
| Net income (loss) |
$ | 4,784 | $ | (2,873 | ) | $ | (5,438 | ) | $ | (6,633 | ) | $ | 690 | $ | (8,079 | ) | $ | (10,828 | ) | $ | (8,167 | ) | ||||||||||
| Net income (loss) per common share: |
||||||||||||||||||||||||||||||||
| Basic |
0.80 | (21.06 | ) | (34.77 | ) | (41.34 | ) | (1.25 | ) | (48.90 | ) | (63.84 | ) | (49.39 | ) | |||||||||||||||||
| Diluted |
0.30 | (21.06 | ) | (34.77 | ) | (41.34 | ) | (1.25 | ) | (48.90 | ) | (63.84 | ) | (49.39 | ) | |||||||||||||||||
| Weighted-average common shares outstanding: |
||||||||||||||||||||||||||||||||
| Basic |
4,857,869 | 184,051 | 184,051 | 184,051 | 184,051 | 184,051 | 184,051 | 184,051 | ||||||||||||||||||||||||
| Diluted |
12,979,040 | 184,051 | 184,051 | 184,051 | 184,051 | 184,051 | 184,051 | 184,051 | ||||||||||||||||||||||||
| (1) | During the three months ended March 31, 2013, the Company recognized a $1,201 income tax benefit that was attributable to a the impact of acquired DRX deferred tax liabilities and the ability to reduce the Company’s income tax valuation allowance established in prior periods. |
| (2) | During the three months ended September 30, 2014, the Company recognized approximately $4,900 of previously deferred revenue and approximately $4,200 of gross margin resulting from the termination of a state exchange contract. |
| (3) | During the three months ended December 31, 2014, the Company recognized a $951 benefit related to the change in fair value of contingent acquisition consideration obligation. |
The sum of 2014 quarterly net income (loss) per common share does not equal the net loss per common share for the entire year due to the impact on weighted-average shares outstanding of the conversions of the Series A and B Preferred Stock and issuance of IPO shares in the fourth quarter of 2014.
F-27
Table of Contents
17. SUBSEQUENT EVENTS
On January 23, 2015, the Company granted 189,250 restricted stock units (RSU’s) pursuant to the terms of the 2014 Equity Incentive Plan. The RSUs were valued at $1,860 and are expected to vest in full during the year ended December 31, 2015.
On February 10, 2015, the Company, the Company’s client and DRX sellers settled the Indemnification Claim for $100 (See Note 7). Pursuant to the terms of the DRX Agreement and Plan of Merger, the DRX sellers and the Company offset the Indemnification Claim settlement against the $3,000 DRX Seller Note. Subsequently, the Company paid $2,900 of principal and $480 of interest to settle the DRX Seller Note. The $480 interest was paid to two related party stockholders, or entities controlled by the stockholders of the Company, pursuant to a note guarantee agreement the DRX sellers had with such related parties.
On March 10, 2015, the Company amended the Credit Facility and THL Notes to, among other things, establish financial covenants for the year ended December 31, 2015. The amendments establish (i) quarterly building EBITDA covenants and (ii) minimum liquidity covenants, as defined in each agreement. The Company expect to be in compliance with the 2015 financial covenants.
* * * * * *
F-28
Table of Contents
FINANCIAL STATEMENT SCHEDULE
Schedule II—Valuation and Qualifying Accounts (in thousands)
| Balance at Beginning of Period |
Additions (Reversals) Charged to Expense |
Additions (Reversals) Charged to Revenue |
Acquired | Deductions | Balance at End of Period |
|||||||||||||||||||
| Trade receivable allowances: |
||||||||||||||||||||||||
| Year ended December 31, 2014 |
$ | 266 | $ | 25 | $ | — | $ | — | $ | (45 | ) | $ | 246 | |||||||||||
| Year ended December 31, 2013 |
144 | 25 | (40 | ) | 262 | (125 | ) | 266 | ||||||||||||||||
| Year ended December 31, 2012 |
34 | 135 | — | — | (25 | ) | 144 | |||||||||||||||||
| Deferred tax asset valuation allowance: |
||||||||||||||||||||||||
| Year ended December 31, 2014 |
$ | 37,896 | $ | 3,421 | N/A | $ | — | $ | (4,897 | ) | $ | 36,420 | ||||||||||||
| Year ended December 31, 2013 |
27,066 | 10,211 | N/A | 619 | — | 37,896 | ||||||||||||||||||
| Year ended December 31, 2012 |
24,271 | 2,795 | N/A | — | — | 27,066 | ||||||||||||||||||
F-29
Table of Contents
EXHIBIT INDEX
| Incorporated by Reference | ||||||||||
| Exhibit Number |
Description |
Form | File No. | Exhibit | Filing Date | |||||
| 2.1 | Agreement and Plan of Merger, dated January 14, 2013, by and among the Registrant, DRX Acquisition Co., DestinationRx, Inc. and the principal stockholders named therein | S-1 | 333-199484 | 2.1 | October 20, 2014 | |||||
| 2.2 | Stock Purchase Agreement, dated February 16, 2011, by and among the Registrant, Patrick Downend and Aaron Downend | S-1 | 333-199484 | 2.2 | October 20, 2014 | |||||
| 2.3 | Exchange Agreement, dated August 3, 2012, by and among the Registrant and the stockholders party thereto. | S-1 | 333-199484 | 2.3 | October 20, 2014 | |||||
| 3.1* | Sixth Amended and Restated Certificate of Incorporation, dated December 16, 2014 | |||||||||
| 3.2 | Amended and Restated Bylaws of the Registrant | S-1/A | 333-199484 | 3.4 | November 10, 2014 | |||||
| 4.1.1 | Investor Rights Agreement, dated August 3, 2012 | S-1 | 333-199484 | 4.1 | October 20, 2014 | |||||
| 4.1.2 | First Amendment to Investor Rights Agreement, dated November 6, 2014 | S-1/A | 333-199484 | 4.1.1 | November 10, 2014 | |||||
| 10.1 | Form of Indemnification Agreement for directors and officers | S-1/A | 333-199484 | 10.1 | November 26, 2014 | |||||
| 10.2† | 2010 Stock Plan, as amended, and form of agreement thereunder | S-1 | 333-199484 | 10.2 | October 20, 2014 | |||||
| 10.3.1† | 2014 Equity Incentive Plan and forms of agreement thereunder | S-1/A | 333-199484 | 10.13 | November 26, 2014 | |||||
| 10.3.2* | Form of Restricted Stock Units Agreements under the Registrant’s 2014 Equity Incentive Plan | |||||||||
| 10.4† | 2014 Employee Stock Purchase Plan | S-1/A | 333-199484 | 10.14 | November 26, 2014 | |||||
| 10.5.1** | Credit Agreement, dated January 15, 2013, by and among Wells Fargo Bank, National Association, as administrative agent for the lenders named therein, the Registrant and DestinationRx, Inc. | S-1/A | 333-199484 | 10.3.1 | November 26, 2014 | |||||
| 10.5.2 | First Amendment to Credit Agreement, dated March 18, 2013 | S-1 | 333-199484 | 10.3.2 | October 20, 2014 | |||||
| 10.5.3 | Second Amendment to Credit Agreement, dated December 10, 2013 | S-1 | 333-199484 | 10.3.3 | October 20, 2014 | |||||
| 10.5.4 | Third Amendment to Credit Agreement, dated March 12, 2014 | S-1 | 333-199484 | 10.3.4 | October 20, 2014 | |||||
Table of Contents
| 10.5.5 | Fourth Amendment to Credit Agreement, dated May 29, 2014 | S-1 | 333-199484 | 10.3.5 | October 20, 2014 | |||||
| 10.5.6 | Fifth Amendment to Credit Agreement, dated June 12, 2014 | S-1 | 333-199484 | 10.3.6 | October 20, 2014 | |||||
| 10.5.7 | Sixth Amendment to Credit Agreement, dated December 5, 2014 | S-1/A | 333-199484 | 10.3.7 | December 8, 2014 | |||||
| 10.5.8* | Seventh Amendment to Credit Agreement, dated December 11, 2014 | |||||||||
| 10.5.9* | Limited Waiver to Credit Agreement, dated December 29, 2014 | |||||||||
| 10.5.10 | Eighth Amendment to the Credit Agreement, dated March 10, 2015 | 8-K | 001-36778 | 10.1 | March 13, 2015 | |||||
| 10.5.11 | Guaranty and Security Agreement, dated January 15, 2013, by and among Wells Fargo Bank, National Association, as administrative agent for the lenders named therein, the Registrant and DestinationRx, Inc. | S-1 | 333-199484 | 10.3.7 | October 20, 2014 | |||||
| 10.5.12 | Trademark Security Agreement, dated January 15, 2013, by and among Wells Fargo Bank, National Association, as administrative agent for the lenders named therein, the Registrant and DestinationRx, Inc. | S-1 | 333-199484 | 10.3.8 | October 20, 2014 | |||||
| 10.5.13 | Patent Security Agreement, dated January 15, 2013, by and among Wells Fargo Bank, National Association, as administrative agent for the lenders named therein, the Registrant and DestinationRx, Inc. | S-1 | 333-199484 | 10.3.9 | October 20, 2014 | |||||
| 10.5.14 | Copyright Security Agreement, dated January 15, 2013, by and among Wells Fargo Bank, National Association, as administrative agent for the lenders named therein, the Registrant and DestinationRx, Inc. | S-1 | 333-199484 | 10.3.10 | October 20, 2014 | |||||
| 10.6.1** | Second Lien Term Loan Agreement, dated March 18, 2013, by and among THL Corporate Finance, Inc., as administrative agent for the lenders named therein, the Registrant and DestinationRx, Inc. | S-1/A | 333-199484 | 10.4.1 | November 26, 2014 | |||||
| 10.6.2 | First Amendment to Term Loan Agreement, dated December 4, 2013 | S-1 | 333-199484 | 10.4.2 | October 20, 2014 | |||||
| 10.6.3 | Second Amendment to Term Loan Agreement, dated March 20, 2014 | S-1 | 333-199484 | 10.4.3 | October 20, 2014 | |||||
| 10.6.4 | Third Amendment to Term Loan Agreement, dated May 29, 2014 | S-1 | 333-199484 | 10.4.4 | October 20, 2014 | |||||
| 10.6.5 | Fourth Amendment to Term Loan Agreement, dated June 12, 2014 | S-1 | 333-199484 | 10.4.5 | October 20, 2014 | |||||
| 10.6.6 | Fifth Amendment to Term Loan Agreement, dated December 5, 2014 | S-1/A | 333-199484 | 10.4.6 | December 8, 2014 | |||||
Table of Contents
| 10.6.7* | Sixth Amendment to Second Lien Term Loan Agreement, dated December 11, 2014 | |||||||||
| 10.6.8* | Limited Waiver to Second Lien Term Loan Agreement, dated December 29, 2014 | |||||||||
| 10.6.9 | Seventh Amendment to Term Loan Agreement, dated March 10, 2015 | 8-K | 001-36778 | 10.2 | March 13, 2015 | |||||
| 10.7.1 | Note Purchase Agreement, dated May 29, 2014, by and among the Registrant, GPP—Connecture, LLC and Chrysalis Ventures II, L.P. | S-1 | 333-199484 | 10.5 | October 20, 2014 | |||||
| 10.7.2 | Note Purchase Agreement Correction, dated October 31, 2014, by and among the Registrant, GPP—Connecture, LLC, Chrysalis Ventures II, L.P. and Great Point Partners, LLC | S-1/A | 333-199484 | 10.5.2 | November 10, 2014 | |||||
| 10.8.1 | Subordinated Promissory Note, dated January 15, 2013, by and among the Registrant and Randall P. Herman, on behalf of the stockholders DestinationRx, Inc. | S-1 | 333-199484 | 10.6.1 | October 20, 2014 | |||||
| 10.8.2 | Subordinated Note Guaranty, dated January 15, 2013, by and among GPP—Connecture, LLC and Chrysalis Ventures II, L.P. and Randall P. Herman | S-1 | 333-199484 | 10.6.2 | October 20, 2014 | |||||
| 10.9.1 | Lease Agreement, dated May 10, 2012, by and among CORE Realty Holdings Management, Inc. and the Registrant | S-1 | 333-199484 | 10.7.1 | October 20, 2014 | |||||
| 10.9.2 | First Amendment to Lease Agreement, dated January 31, 2013, by and among CORE Realty Holdings Management, Inc. and the Registrant | S-1 | 333-199484 | 10.7.2 | October 20, 2014 | |||||
| 10.9.3 | Second Amendment to Lease Agreement, dated February 4, 2014, by and among CORE Realty Holdings Management, Inc. and the Registrant | S-1 | 333-199484 | 10.7.3 | October 20, 2014 | |||||
| 10.10.1 | Lease Agreement, dated September 30, 2013, by and among TR 55 Allen Plaza LLC and the Registrant | S-1 | 333-199484 | 10.8.1 | October 20, 2014 | |||||
| 10.10.2 | First Amendment to Lease Agreement, dated December 31, 2013, by and among TR 55 Allen Plaza LLC and the Registrant | S-1 | 333-199484 | 10.8.2 | October 20, 2014 | |||||
| 10.11 | Lease Agreement, dated November 1, 2011, by and among 600 Wilshire Property LLC and the Registrant | S-1 | 333-199484 | 10.9 | October 20, 2014 | |||||
| 10.12.1† | Employment Agreement, effective as of December 31, 2011, by and among the Registrant and Robert Douglas Schneider | S-1 | 333-199484 | 10.10.1 | October 20, 2014 | |||||
Table of Contents
| 10.12.2† | Letter Agreement, dated October 18, 2014, by and among the Registrant and Robert Douglas Schneider | S-1 | 333-199484 | 10.10.2 | October 20, 2014 | |||||
| 10.12.3† | Transaction Bonus Agreement, dated October 26, 2012, by and among the Registrant and Robert Douglas Schneider | S-1 | 333-199484 | 10.10.3 | October 20, 2014 | |||||
| 10.12.4† | Bonus Agreement, dated December 31, 2013, by and among the Registrant and Robert Douglas Schneider | S-1 | 333-199484 | 10.10.4 | October 20, 2014 | |||||
| 10.12.5† | Separation Pay Agreement, dated December 31, 2011, as amended, by and among the Registrant and Robert Douglas Schneider | S-1 | 333-199484 | 10.10.5 | October 20, 2014 | |||||
| 10.13.1† | Bonus Agreement, dated December 31, 2013, by and among the Registrant and David A. Sockel | S-1 | 333-199484 | 10.11.1 | October 20, 2014 | |||||
| 10.13.2† | Separation Pay Agreement, dated July 23, 2012, by and among the Registrant and David A. Sockel | S-1 | 333-199484 | 10.11.2 | October 20, 2014 | |||||
| 10.13.1† | Bonus Agreement, dated December 31, 2013, by and among the Registrant and Mark E. Granville | S-1 | 333-199484 | 10.12.1 | October 20, 2014 | |||||
| 10.13.2† | Separation Pay Agreement, dated September 10, 2012, by and among the Registrant and Mark E. Granville | S-1 | 333-199484 | 10.12.2 | October 20, 2014 | |||||
| 10.14.1*† | Bonus Agreement, dated December 31, 2013, by and among the Registrant and James P. Purko | |||||||||
| 10.14.2*† | Separation Pay Agreement, dated July 23, 2012, by and among the Registrant and James P. Purko | |||||||||
| 21.1 | List of Subsidiaries of the Registrant | S-1 | 333-199484 | 21.1 | October 20, 2014 | |||||
| 23.1* | Consent of Deloitte & Touche LLP, Independent Registered Public Accounting Firm relating to the Registrant | |||||||||
| 24.1* | Power of Attorney (see page 81 to this Annual Report on Form 10-K) | |||||||||
| 31.1* | Certification of Principal Executive Officer Required Under Rule 13a-14(a) and 15d-14(a) of the Securities Exchange Act of 1934, as amended | |||||||||
| 31.2* | Certification of Principal Financial Officer Required Under Rule 13a-14(a) and 15d-14(a) of the Securities Exchange Act of 1934, as amended | |||||||||
Table of Contents
| 32.1# | Certification of Chief Executive Officer Required Under Rule 13a-14(a) and 15d-14(a) of the Securities Exchange Act of 1934, as amended, and 18 U.S.C. §1350 as adopted pursuant to Section 906 of The Sarbanes-Oxley Act of 2002 | |||||||||
| 32.2# | Certification of Chief Financial Officer Required Under Rule 13a-14(a) and 15d-14(a) of the Securities Exchange Act of 1934, as amended, and 18 U.S.C. §1350 as adopted pursuant to Section 906 of the Sarbanes-Oxley Act of 2002 | |||||||||
| † | Management contract, compensatory plan or arrangement. |
| * | Filed herewith |
| # | Furnished herewith |
| ** | Portions of this agreement have been redacted pursuant to a request for confidential treatment that was granted by the Securities and Exchange Commission. |