Attached files
| file | filename |
|---|---|
| EX-10.8.5 - EX-10.8.5 - CONNECTURE INC | cnxr-ex1085_254.htm |
| EX-32.2 - EX-32.2 - CONNECTURE INC | cnxr-ex322_8.htm |
| EX-32.1 - EX-32.1 - CONNECTURE INC | cnxr-ex321_10.htm |
| EX-31.2 - EX-31.2 - CONNECTURE INC | cnxr-ex312_6.htm |
| EX-31.1 - EX-31.1 - CONNECTURE INC | cnxr-ex311_9.htm |
| EX-23.1 - EX-23.1 - CONNECTURE INC | cnxr-ex231_11.htm |
UNITED STATES
SECURITIES AND EXCHANGE COMMISSION
Washington, D.C. 20549
FORM 10-K
|
☒ |
ANNUAL REPORT PURSUANT TO SECTION 13 OR 15(d) OF THE SECURITIES EXCHANGE ACT OF 1934 |
For the fiscal year ended December 31, 2017
OR
|
☐ |
TRANSITION REPORT PURSUANT TO SECTION 13 OR 15(d) OF THE SECURITIES EXCHANGE ACT OF 1934 |
For the Transition Period from to
Commission File Number 001-36778
CONNECTURE, INC.
(Exact name of registrant as specified in its charter)
|
Delaware |
|
58-2488736 |
|
|
|
|
|
(State or other jurisdiction of incorporation or organization) |
|
(I.R.S. Employer Identification Number) |
18500 West Corporate Drive, Suite 250
Brookfield, WI 53045
(Address of principal executive offices and zip code)
(262) 432-8282
(Registrant’s telephone number, including area code)
Securities registered pursuant to Section 12(b) of the Act:
|
Common Stock, par value $0.001 per share |
|
The OTCQX US Market |
Securities registered pursuant to Section 12(g) of the Act:
None
Indicate by check mark if the registrant is a well-known seasoned issuer, as defined in Rule 405 of the Securities Act. Yes ☐ No ☒
Indicate by check mark if the registrant is not required to file reports pursuant to Section 13 or Section 15(d) of the Act. Yes ☐ No ☒
Indicate by check mark whether the registrant (1) has filed all reports required to be filed by Section 13 or 15(d) of the Securities Exchange Act of 1934 during the preceding 12 months (or for such shorter period that the registrant was required to file such reports), and (2) has been subject to such filing requirements for the past 90 days. Yes ☒ No ☐
Indicate by check mark whether the registrant has submitted electronically and posted on its corporate Web site, if any, every Interactive Data File required to be submitted and posted pursuant to Rule 405 of Regulation S-T (§ 232.405 of this chapter) during the preceding 12 months (or for such shorter period that the registrant was required to submit and post such files). Yes ☒ No ☐
Indicate by check mark if disclosure of delinquent filers pursuant to Item 405 of Regulation S-K (§ 229.405 of this chapter) is not contained herein, and will not be contained, to the best of registrant’s knowledge, in definitive proxy or information statements incorporated by reference in Part III of this Form 10-K or any amendment to this Form 10-K. ☐
Indicate by check mark whether the registrant is a large accelerated filer, an accelerated filer, a non-accelerated filer, or a smaller reporting company. See the definitions of “large accelerated filer,” “accelerated filer” and “smaller reporting company” in Rule 12b-2 of the Exchange Act.
|
Large accelerated filer |
☐ |
|
Accelerated filer |
☐ |
|
|
|
|
|
|
|
Non-accelerated filer |
☐ |
(Do not check if a smaller reporting company) |
Smaller reporting company |
☒ |
|
|
|
|
|
|
|
Emerging growth company |
☒ |
|
|
|
|
If an emerging growth company, indicate by check mark if the registrant has elected not to use the extended transition period for complying with any new or revised financial accounting standards provided pursuant to Section 13(a) of the Exchange Act. ☐
|
||||
Indicate by check mark whether the registrant is a shell company (as defined in Rule 12b-2 of the Act). Yes ☐ No ☒
As of June 30, 2017, the date of the registrant’s most recently completed second quarter, the aggregate fair market value of the registrant’s common stock held by non-affiliates was approximately $9.0 million based on the closing sales price as reported on the NASDAQ Global Market.
As of March 27, 2018, there were 23,255,102 shares of the registrant’s common stock, par value $0.001, issued and outstanding.
Form 10-K
For the Year Ended December 31, 2017
TABLE OF CONTENTS
|
|
|
|
|
Page |
|
|
|
|
|
|
|
|
|
|
|
|
|
Item 1. |
|
|
1 |
|
|
Item 1A. |
|
|
12 |
|
|
Item 1B. |
|
|
33 |
|
|
Item 2. |
|
|
33 |
|
|
Item 3. |
|
|
33 |
|
|
Item 4. |
|
|
33 |
|
|
|
|
|
|
|
|
|
|
|
|
|
|
Item 5. |
|
|
34 |
|
|
Item 6. |
|
|
37 |
|
|
Item 7. |
|
Management’s Discussion and Analysis of Financial Condition and Results of Operations |
|
41 |
|
Item 7A. |
|
|
61 |
|
|
Item 8. |
|
|
61 |
|
|
Item 9. |
|
Changes in and Disagreements with Accountants on Accounting and Financial Disclosure |
|
61 |
|
Item 9A. |
|
|
62 |
|
|
Item 9B. |
|
|
63 |
|
|
|
|
|
|
|
|
|
|
|
|
|
|
Item 10. |
|
|
64 |
|
|
Item 11. |
|
|
68 |
|
|
Item 12. |
|
Security Ownership of Certain Beneficial Owners and Management and Related Stockholder Matters |
|
73 |
|
Item 13. |
|
Certain Relationships and Related Transactions and Director Independence |
|
75 |
|
Item 14. |
|
|
80 |
|
|
|
|
|
|
|
|
|
|
|
|
|
|
Item 15. |
|
|
82 |
|
|
Item 16. |
|
|
82 |
|
|
|
87 |
|||
Forward Looking Statements
Except for the historical financial information contained herein, the matters discussed in this Annual Report on Form 10-K (as well as documents incorporated herein by reference) may be considered “forward-looking” statements within the meaning of Section 27A of the Securities Act of 1933, as amended, and Section 21E of the Securities Exchange Act of 1934, as amended. All statements, other than statements of historical fact, are statements that could be deemed forward-looking statements, including, but not limited to, statements regarding our future financial position, business strategy and plans and objectives of management for future operations. When used in this Annual Report, the words “believe,” “may,” “could,” “will,” “estimate,” “continue,” “intend,” “expect,” “anticipate,” “plan,” “project” and similar expressions are intended to identify forward-looking statements.
We have based these forward-looking statements largely on our current expectations and projections about future events and financial trends that we believe may affect our financial condition, results of operations, business strategy, short-term and long-term business operations and objectives, and financial needs. These forward-looking statements are subject to certain risks and uncertainties that could cause our actual results to differ materially from those reflected in the forward-looking statements. Factors that could cause or contribute to such differences include, but are not limited to, those discussed in this report, and in particular, the risks discussed under Part 1, Item 1A: “Risk Factors” and those discussed in other documents we file with the Securities and Exchange Commission. Except as required by law, we do not intend to update these forward-looking statements publicly or to update the reasons actual results could differ materially from those anticipated in these forward-looking statements, even if new information becomes available in the future.
In light of these risks, uncertainties and assumptions, the forward-looking events and circumstances discussed in this report and in the documents incorporated in this report may not occur and actual results could differ materially and adversely from those anticipated or implied in the forward-looking statements. Accordingly, readers are cautioned not to place undue reliance on such forward-looking statements.
Unless otherwise indicated, references to “Connecture,” “the Company,” “we,” “our” and “us” in this Annual Report on Form 10-K refer to Connecture, Inc. and its consolidated subsidiaries.
Overview
We are a leading web-based consumer shopping, enrollment and retention platform for health insurance distribution. Our solutions offer a personalized health insurance shopping experience that recommends the best fit insurance plan based on an individual’s preferences, health status, preferred providers, medications and expected out-of-pocket costs. Our customers are payers, brokers, government agencies, and web-based insurance marketplace operators, who distribute health and ancillary insurance. Our solutions automate key functions in the insurance distribution process, allowing our customers to price and present plan options accurately to consumers and efficiently enroll, renew and manage plan members.
The United States health insurance marketplace continues to experience structural changes that alter how health insurance is purchased and distributed. Consumer access to and plan choices for health insurance continues to grow. As a result, consumers need effective decision-support tools to help them optimize their health insurance choices. Concurrently, the traditional distribution approaches for health plans and brokers have had to evolve from offering a more limited set of plans to employers through group coverage to cost-effectively selling insurance in the more fragmented individual market and in public and private exchanges. These exchanges are essentially online marketplaces sponsored either by a non-government entity, such as an employer, insurance broker or other distributor (in the case of private exchanges) or by a federal or state government entity (in the case of public exchanges). This evolution calls for technology solutions that allow individuals and businesses to compare products and make purchases directly from health plans in a way that is cost-effective for health plan distributors.
In 1999 we incorporated in Delaware, and since then, we have provided technology-enabled health plan sales automation solutions. As of December 31, 2017, our customer base included more than 70 health plans, including 20 of the top 25 health plans (based on total enrollment). Our personalized health insurance shopping experience is available to the approximately 53 million Medicare beneficiaries through our provision of shopping, price comparison, plan ranking and enrollment software for Medicare.gov and 1-800-Medicare call center agents.
As further discussed below under “Related Party Transactions—Merger Agreement,” on January 4, 2018, we entered into an Agreement and Plan of Merger (the “Merger Agreement”) with entities affiliated with Francisco Partners, pursuant to which those entities have agreed to pay $0.35 per share for each share of our common stock not held by our existing preferred investors, Francisco
1
Partners and Chrysalis Ventures, and their affiliates (the “Merger”). Upon completion of the Merger, we will become a privately-held company.
Industry Background
The United States health insurance industry is responsible for the administration of healthcare benefits to over 178 million individuals covered by employer-based health insurance and is experiencing a structural transformation in which shopping for and enrollment in health insurance products is transitioning from a wholesale or group-based distribution model to an individual or retail-oriented consumer marketplace. This transformation, in conjunction with regulatory and competitive pressure on distribution and overhead costs, places substantial new business and technology requirements on health plans, brokers and aggregators and has created an attractive opportunity in the markets we serve.
Consumer-Centric Marketplace
We believe the role of the consumer will only continue to be more important. Responsibility for health insurance purchasing will largely fall to individuals and will place a continued importance on better, more informed decision-making.
There is a continued evolution of health insurance technology toward supporting more effective and consumer-friendly solutions that help consumers to better compare and enroll in plans based on their actual healthcare needs and to optimize their increased health insurance responsibility and spend.
Pressure to Manage Distribution Costs and Operating Expenses
While health plans and brokers need to support a more individualized and fragmented health insurance shopping and enrollment process, they are under increasing pressure to lower distribution costs. Federal regulations brought about as part of the Patient Protection and Affordable Care Act, or PPACA, had a material effect on health plan profitability and increased the competition for gaining and retaining members. This forced health plans to find better ways to manage areas of non-medical cost structure, such as sales commissions and internal information technology development. As a result, health plans have undertaken efforts to lower brokerage commissions and to implement innovative third-party technologies to reduce investment in internally-developed software. Similarly, brokers who now face depressed commissions from health plans need to leverage technology-based, automated processes to sell more cost-effectively and to identify product cross-selling opportunities, such as with ancillary products, as part of the plan selection process.
Increasing Opportunity for Technology
As shopping and enrollment in health insurance transitions to an individual, retail-oriented consumer marketplace, we believe there is opportunity for intuitive, web-based technologies to automate and lower the cost of health insurance distribution, as well as increase enrollment opportunities and member retention.
The Connecture Sales Automation Solution
Our leading web-based consumer shopping, quoting, enrollment and engagement solutions support a range of health insurance products and services, including Group, Individual and Medicare coverage, with a focus on providing a consumer-centric experience. We simplify the health plan and prescription drug shopping experience with data-driven tools that empower consumers to make smarter, more personalized coverage choices. For health plan, broker and exchange operator customers, we deliver powerful and unified distribution solutions that we believe help them increase their revenue opportunity as they serve a growing, but fragmented population, while also reducing the costs associated with acquiring new and retaining current members.

2
We automate the following key functions of the health and ancillary insurance distribution process for our customers:
|
|
• |
Rate Setting and Modeling: prices and presents plan options accurately to consumers; |
|
|
• |
Shopping and Quoting: allows consumers to view and compare plans, including estimated premiums, out-of-pocket costs and plan benefits; |
|
|
• |
Application and Enrollment: streamlines application and enrollment operations, eliminating manual processes and paper processing; |
|
|
• |
Renewal Management: streamlines the renewal process, eliminating manual processes and paper processing; |
|
|
• |
Member Management: updates plan offering details based on members’ work or life changes; and |
|
|
• |
Exchange Integration: connects to state and federal exchanges to determine subsidy eligibility. |
We believe the breadth, depth and scale of our solutions across key functional areas are critical to our success in the complex and changing health insurance marketplace. In particular, our personalized and data-driven shopping experience helps customers make better health insurance purchasing decisions. Our web-based solutions are designed to maximize enrollment and member retention opportunities, and our technology enables rapid deployment of benefits and engagement technology to help our customers adapt to evolving market needs and build stronger relationships with their members.
Our Competitive Strengths
We believe we have the following key competitive strengths:
Health plan shopping and enrollment leadership
While the health insurance industry is in the midst of adapting to rapidly changing requirements, and many start-up competitors are struggling to adapt to the uncertain future direction of the PPACA, we have built our flexible platform infrastructure to be relevant over the long-haul, no matter the political environment. We have nearly a two-decade history in the technology-enabled health plan shopping and enrollment marketplace serving individuals both under and over-65, including the following:
|
|
• |
Leadership in the commercial under-65 health insurance market; |
|
|
• |
Over ten years as the web-based technology solution for Medicare.gov; |
|
|
• |
Relationships with a broad range of health plans and brokers, including 20 of the top 25 health plans (based on total enrollment). |
Domain and technology development expertise
The health insurance market is characterized by high levels of regulation and complexity. There are many plan types and configurations available to individuals and ensuring that the options are presented and marketed effectively is key. Further, our technology assists our customers to compete more effectively by allowing them to introduce new products and change pricing and benefit designs dynamically. We also believe that our solutions allow our customers to more effectively enter new markets and distribute new products faster and more efficiently. We believe our depth of knowledge and our proven ability to innovate positions us to be a leader in our industry.
Configurable and scalable solutions to meet customer needs
Many of our solutions are designed to handle both high degrees of configurability and significant growth in users without requiring major software re-engineering or capital expenditures by our customers. Our solutions are cost-effective for our customers because we offer a platform that is comprehensive across key sales automation functions, but also has individual software applications that can integrate with common existing customer software applications. We deliver quick deployment solutions in the cloud as well as large scale enterprise solutions. Today, our technology is used by many of the largest health plans and brokers to power their critical shopping and enrollment functions. We also power the country’s largest multi-payer exchange, Medicare.gov, and successfully handle more than two million Medicare Advantage and Medicare Part D enrollments annually.
Large database of health plan and drug cost information and ancillary products
We believe that our large database of health plan and drug cost information enables us to deliver higher value to our customers and consumers alike. We are a primary source of health plan and pharmacy data for Medicare products available on Medicare.gov and
3
the broad range of our health plan relationships makes us a valuable and extensive source of permission-based health plan information. These data are critical for consumers to make difficult decisions about trade-offs between plan premiums vs. out-of-pocket costs, physician networks and pharmaceutical formularies. Our large dataset of health plan and drug cost information powers our empirically-driven recommendations engine that we believe provides consumers with more precise decision-support tools. In addition, our platform also supports many ancillary products such as dental, life insurance, critical illness and wellness which allows health plans and brokers to sell a more customized package of insurance products, thereby helping to differentiate the consumer shopping experience and maximize our customers’ revenue opportunity.
Reportable Segments
Our reportable segments, Enterprise/Commercial, Enterprise/State, Medicare and Private Exchanges are based on software and service offerings. Financial information for our reportable segments is included in Note 14 of the Notes to Consolidated Financial Statements included in Part II, Item 8: “Financial Statements and Supplementary Data” of this Annual Report on Form 10-K.
Our portfolio of web-based software solutions allows customers to offer solutions for Group, Individual and Medicare markets. Each application is modular and functions independently, yet can integrate together to create a comprehensive and robust solution. Our portfolio of solutions is summarized below by reportable segment.
Enterprise Commercial Solution for Health Plans
Connecture’s primary Enterprise Commercial solution automates sales and enrollment processing in order to allow health plans to operate more cost-effectively, extend reach and provide a better consumer and/or employer/broker experience. The full consumer lifecycle for sales automation is managed, from business acquisition through renewals. Our platform allows a broad range of consumers (individual plan sales, group sales, or single health plan private exchanges) to make better health insurance decisions. Consumers, brokers and other agents can more easily shop for, purchase and renew insurance. The software solution can be configured for any size of health plan and streamlines workflow for health insurance distribution and automates multiple lines of business, including health, dental, group life, vision, accidental death and dismemberment, short-term disability and long-term disability. The solution is web-based, secure and scalable.
Key capabilities offered by our Enterprise Solution for the Individual Market:
Shopping
The Shopping application allows for the capture of consumer information, the comparison of plans and viewing of rates. In addition, users can retrieve previously saved quotes, copy and create new quotes and indicate acceptance of plans online. The functionality supports all the applicable rules related to open enrollment, metal tier plan information and member-level rate display.
The solution also offers a Plan Advisor Tool which allows the consumer, broker or sales representative to shop and compare plans, products and key benefit features via an interactive “guided shopping” experience based on questions around the consumer’s individual risk tolerance, ability to pay more up-front/higher deductible, personal health factors, desired add-on plans or riders. These questions are then rated and scored and plans are presented based on how the consumer answered each question. There are also subsidy and cost calculators to help the prospective member gauge financial cost of their healthcare choices.
Enrollment
An Online Application steps the user through an easy to navigate electronic application. Questions (or fields) can be standard or dynamic. Enrollment enables the health plan to combine enrollment forms for multiple products into one online application. Once an electronic application has been started, the user can save and return at a later time to complete it. A consumer can also receive assistance with completing the application from the broker or sales representative. The broker or sales representative may aid in determining the best coverage fit for his or her customer, based on presented plan details and prices. The broker or sales representative can start the online application process for his or her customer and then forward the application to the customer for completion. eSignature is also supported.
Administrative Review
Applications that do not meet the health plan’s established rules will be routed to an internal user where they can review and approve, withdraw or indicate that an applicant is not eligible for the coverage requested. To expedite the approval process, administrative reviewers can also edit individual new business enrollments. For example, enrollments held for approval due to circumstances such as home address checks, health plan specific configuration checks or attachment uploads can be edited to allow the process to continue moving forward.
4
The renewal application is comprised of a series of workflow steps which will allow for the automatic initiation of the renewal process without manual intervention; health plans, however, can also configure business rules to denote renewal groups and subject such groups to the manual renewal process. Functionality includes renewal import, renewal quoting and acceptance, renewal export, package generation and distribution, recommended and alternate plan mapping and agent/broker PDF generation.
Member Management
The member management application allows members the ability to update their profiles with work and life event changes at any point throughout the year through an online portal. The system will track the requested change of coverage through a defined approval process.
The member is able to perform the following functions within the system:
|
|
• |
View and modify subscriber and dependent information (e.g., name, address, phone numbers, e-mail, student status, date of birth, gender, social security number); |
|
|
• |
Add and remove dependents from coverage; |
|
|
• |
View current benefits and rates; |
|
|
• |
View address information; and |
|
|
• |
View and modify payment information. |
Health plans can also determine unique business rules to determine if administrative review is necessary for specific policy changes.
Key capabilities offered by our Enterprise Solution for the Group Market:
Quoting
New Business Quoting provides a guided workflow to capture basic employer demographic information and employee census details in order to view available plans and corresponding rates. Within each new business quote, the user can view the composite/age rates, estimated premiums, plan benefits and benefit comparisons.
It also provides a guided workflow designed specifically for defined contribution in addition to traditional defined benefit plans. Users can initiate a defined contribution quote by selecting an array of plans options. These options are defined by the health plan and configured within the product server and rate repository. The collection of employer demographics and census information can serve both defined contribution and defined benefit quoting.
Employer and Employee Shopping
The Shopping application allows for the capture of basic consumer information, the comparison of plans and viewing of rates. In addition, users can retrieve previously saved quotes, copy and create new quotes and indicate acceptance of plans online. The functionality supports any of the mandated rules related to open enrollment, metal tier plan information and member-level rate display.
The solution for groups also offers a Plan Advisor Tool, which allows employee-consumers, or the human resources administrator at the employer or the broker or sales representative working with them, to shop and compare plans, products and key benefit features via an interactive “guided shopping” experience based on questions around their own individual risk tolerance, ability to pay more up-front/higher deductible, personal health factors, desired add-on plans or riders, etc. These questions are rated and scored. Plans are presented based on how the consumer answers each question. There is both a subsidy calculator and a cost calculator to help the prospective member gauge financial risk.
Enrollment and Renewals
Developed specifically for the group market, the solution leverages common capabilities from the Individual applications and delivers necessary functionality tailored for employer group and employee enrollment. Comprehensive functionality also supports the group renewal process.
5
The Group Policy Administration application allows human resources administrators and members the ability to update profiles with work and life event changes at any point throughout the year through an online portal. The system tracks the requested change of coverage through a defined approval process.
Other Capabilities
We offer single-health plan private exchanges as an extension to the Enterprise Commercial solution. These private exchanges enable insurance health plans to offer more choices to their employer customers. They facilitate an array of defined contribution and defined benefit plans, promote flexibility and consumer personalization and include medical and ancillary products in the consumer offering. We enable a one-stop shopping and enrollment experience that allows employers to make available to their employees a list of plans and benefits for consideration, pricing, selection and enrollment, including recommendation of best fit plans.
We also offer integration of a health plan’s consumer enrollment website to the Federal exchange through a Direct Enrollment capability currently supported by the Federal exchange, which provides the health plans the opportunity to maximize member retention by presenting only their Qualified Health Plans.
Medicare Solution
We provide innovative, web-based Medicare plan comparison and enrollment tools for health plans, Pharmacy Benefit Managers, or PBMs, pharmacies, field marketing organizations, or FMOs, and call centers. These products are used by the Medicare population through commercial health plans, retiree transition exchanges (group to individual, group to group) provided by benefits consulting firms and Medicare.gov.
Key capabilities offered for our Medicare solution include:
Consumer Plan Comparison and Shopping
The plan comparison and shopping solution is deployable in multiple portal website configurations including consumer, agent/broker and call center representative. The application supports the most common Medicare plan options including Medicare Advantage, or MA, Medicare Advantage Prescription Drug, or MAPD, Prescription Drug, or PDP, and Medicare Supplement plans. In addition to operating as a stand-alone website, the offering can also be made available as an Application Programming Interface or API. This allows the customer to embed the functionality within their existing internet assets without the need for a separate website.
Plan Comparison and Retention
Our Medicare solution utilizes features from the shopping application to improve the efficiency of the policy renewal process. Medicare beneficiaries can receive their forms pre-populated with their personal information from the new business enrollment process, seeing plan options and cost estimates built on known information, such as age and pharmaceutical drug utilization. These pre-filled forms minimize potential errors and can expedite the enrollment process. Beneficiaries are also offered a Short Enrollment Request Form to facilitate enrolling in a different plan offered by the same health plan (when allowed by Centers for Medicare and Medicaid Services, or CMS).
On-line Enrollment
The On-line Enrollment application can be fully integrated with the solution. The application unifies multiple distribution channels (e.g., brokers, field marketing organizations, call centers, etc.) into a single automated application submission to the health plan. Reporting is also available on an integrated basis. Common Medicare plan options including MA, MAPD, PDP and Medicare Supplement plans are supported with dynamic form generation coupled with extensive customization options.
Mobile Field Enrollment
In many cases brokers and agents are in the field and do not have access to the internet at the time of meeting with prospective beneficiaries. Our Mobile Field Enrollment application allows the user to store the enrollment data locally on their tablet and sync with the health plan once they are online. Customer information can also be loaded from the agent/broker’s contact address book located on their tablet. In addition to enrollment forms, other sales information, including presentations and scope of appointment forms are available electronically on the tablet as well.
6
Our Private Exchange reportable segment provides benefit consultants, brokers, exchange operators and aggregators with group defined-contribution benefit exchange solutions. Our solutions enable users to provide their employer and individual customers with a compliant benefit shopping, enrollment and post-enrollment benefits management experience. Brokers are empowered with a custom-branded private exchange environment that provides analytics and decision support. Our Private Exchange solutions expand upon our single-plan shopping and enrollment tools by allowing users to compare plans, premiums and products from among multiple health plans within a specific geography. Our solutions also allow customers to sell individual, group and Medicare health insurance.
Through our RxHealth Insurance Agency, Inc. and ConnectedHealth, LLC subsidiaries, we are a CMS-approved Web-broker Entity, which allows us to assist customers online with (i) completing enrollment in Qualified Health Plans offered in the individual market through the Federal Exchange; (ii) applying for tax credits and cost sharing reductions for Qualified Health Plans; and (iii) other customer service assistance related to health insurance coverage and enrollment processes through the Federal Exchange. Using Web-broker Entity services allows brokers, agencies and aggregators to provide a CMS-approved technology platform to consumers shopping for Qualified Health Plans.
Key capabilities offered for our Private Exchange solutions include:
Under 65 Plan Comparison and Enrollment
Building upon our shopping and enrollment applications, our Private Exchange applications deliver individual consumer and group quoting in a multi-payer configuration. The ability to intake an employer’s employee roster is supported to pre-fill demographic information and decrease process time. Brokers can monitor in-progress activity of the employees and analyze their sold group business, as well as create customized proposals for their customers.
Consumers and employees are provided medical plan decision support, including demographic and health condition analysis, provider network lookup, financial/out-of-pocket decision modeling, out-of-pocket cost calculator and drug comparison services as described below. In addition to medical products, ancillary and supplemental products (e.g., dental, vision, disability, etc.) are also supported in a single user shopping experience. Once the end-user has made plan selections, electronic enrollment during both annual open enrollment and special enrollment periods is available.
The solution includes integration with third-party benefits administration, consumer-directed health account management (FSA/HSA), call center services and population health and wellness management vendors.
Retiree Group Plan Comparison and Enrollment
Developed for the employer seeking to transition its retirees from its current group coverage to individual Medicare plans, the retiree group plan comparison application allows for the creation of customized employer websites. The roster of eligible retirees can be pre-populated prior to making the site available for the retiree to select a new coverage plan. Health plans that have been selected by the employer are displayed to the retiree. Our Private Exchange solutions not only include technology, but also a repository of participating health plan and ancillary health plan data and integration connectivity. This repository enables the broker and exchange operator to deploy an offering quickly by avoiding an independent sourcing effort.
Enterprise State Solution for State Exchanges
We have offered to state governments a solution that enabled states the ability to create public health insurance exchanges under PPACA. The state solution was customized for the government exchange market and includes three major functional components that facilitate plan selection:
|
|
• |
Individual or AHBE Shopping and Enrollment Applications—Intuitive tools that help consumers examine, compare and enroll in the best insurance options available for them and their families. Our individual shopping solution for state exchanges includes a range of plan comparison, consumer decision support and provider search tools. |
|
|
• |
Small Group or SHOP Exchanges—For employer and employee shopping, quoting and enrollment. |
Due to limited market opportunities, we have continued to reduce our focus and dependency on this segment. As of December 31, 2017, we provide limited professional services to support one remaining customer.
7
Drug Compare
We offer our customers, including PBMs, private exchanges and the federal government’s Medicare.gov website, a member engagement tool for drug pricing comparison called DrugCompare. We believe DrugCompare is one of the most widely-used and comprehensive drug pricing comparison database in the industry. The DrugCompare application presents dose equivalent therapeutic alternatives that are priced according to the shopper’s or member’s benefit and formulary. Lower cost formulary options are suggested, including direct generics, generic alternatives, brands, over the counter drugs, pill-splitting and alternative dosing schedules. Side-by-side pricing and safety comparisons are provided, as well as alerts regarding potential medication management interactions for a member. Our data network includes the ability to comparison shop across the country in retail and mail-order pharmacy locations.
Professional Services and Customer Support
We deliver and support the Connecture platforms and solutions utilizing teams of highly qualified industry and technical personnel. We have implementation teams in place to ensure seamless deployment and effective utilization of our solutions. Once deployed, our production support team is able to help customers with the option of maintaining various business rules, rates, plans and products on their own utilizing our proprietary tools, or having us maintain the platform on their behalf. And through working with our software application maintenance teams, customers are able to complete regular upgrades to the licensed applications, including updates for common regulatory items and new functionality.
Customers
Our customers include many of the nation’s leading commercial and Medicare health plans, public and private exchanges and PBMs. Our customer contracts are generally only cancellable by the customer in an instance of our uncured breach, although some of our customers (including government customers) are able to terminate their respective contracts without cause or for convenience, or lack of adequate funding, generally with 30 days’ written notice, which we believe is customary for government contracts. Of our top 20 customers by 2017 revenue, some customers can terminate their contract for convenience upon written notice. These customers represented $31.7 million, or 40.4% of our Contracted Backlog balance as of December 31, 2017.
Sales and Marketing
We sell substantially all of our software solutions through our direct sales organization, comprised of health plan-focused and exchange-focused field sales professionals. These sales efforts are supported by multi-channel marketing tactics including modern digital outreach, websites, email, hosted webinars, print media, event marketing and public relations.
We generate prospect leads, accelerate sales opportunities and build brand awareness through our marketing programs and strategic relationships. Our marketing programs target insurance and benefits executives, technology professionals and government department leaders as well as pharmaceutical benefits managers as direct outreach, but also address other influencers through nurturing programs and public relations.
For a discussion of our contracted backlog, see the section titled “Management’s Discussion and Analysis of Financial Condition and Results of Operations,” including the subsections titled “Overview” and “Key Financial and Operating Performance Metrics.”
Competition
While we do not believe any single competitor provides the breadth or the depth of the comprehensive Connecture solution set, we do face non-traditional competition from various sources.
Our competition includes:
|
|
• |
insurance health plans and national brokers that have invested in internally developed customer acquisition and retention solutions; |
|
|
• |
various niche software vendors; |
|
|
• |
systems integrators and large consulting firms; |
|
|
• |
third party administrators and call centers that may look to add technology capabilities; and |
|
|
• |
general enterprise resource planning or CRM software vendors. |
8
We believe that we are differentiated primarily on the following factors:
|
|
• |
user experience and personalization; |
|
|
• |
breadth and depth of application functionality; |
|
|
• |
nearly 20 years of longevity as a company in this market and domain expertise in health insurance, benefits and healthcare consumerism, as well as in commercial and government sectors; |
|
|
• |
capability for customization through configuration, integration, security, scalability and reliability of applications; |
|
|
• |
size and variety of customer base; |
|
|
• |
extensive health plan and API data network; |
|
|
• |
cloud-based and on-premise delivery model options; |
|
|
• |
ability to integrate with legacy enterprise infrastructures and third-party applications such as CRM, and rapidly innovate and respond to customer needs and regulatory requirements. |
We believe that we compete effectively based upon these criteria. Nonetheless, the increasing acceptance of automated solutions in the health insurance marketplace and the adoption of more sophisticated technology and legislative reform will likely result in increased competition.
Within the business segments that we serve, examples of our competitive positions include:
|
|
• |
Enterprise/Commercial: |
While we do not believe that any single competitor is dominant in this segment, we believe that we are seen as a leader in the individual and small group markets. We believe the larger group market has more competitive pressures and the field of players includes large, established enrollment management firms and core health plan administrative companies.
|
|
• |
Medicare: |
We believe that we are a leading technology solution vendor in this segment. This position is reflected in our role as the shopping technology for Medicare.gov, as well as the number of Medicare health plans we support, which as of December 31, 2017, was over 50 health plans. Additionally, we believe that we currently have a strong competitive position relative to other Medicare shopping and enrollment solutions, although some large health plans may possess the capability to develop their own solution that would compete with us, rather than procuring a solution externally.
|
|
• |
Private Exchange: |
We believe this segment is relatively immature and the competitive environment is still evolving. As such, no competitor, or small group of competitors is dominant in the segment. A range of technology, benefits administration and call center vendors support private exchanges to varying degrees and these vendors differ as to the scope of software and services provided. We believe that our technology capabilities are robust and that our history of working with health plans in single and multi-plan solutions provide us an advantage, as well as our experience in the retiree exchange business. In addition, our flexible and scalable technology allows us to meet the unique needs of customers ranging from large national brokers to smaller regional customers.
|
|
• |
Enterprise/State: |
Due to limited market opportunities, we have continued to reduce our focus and dependency on this segment. As of December 31, 2017, we provide limited professional services to support one remaining customer.
Technology Infrastructure and Operations
We have primarily deployed our software solutions using hosted and software-as-a-service, or SaaS, models. Our customers typically access our software via the web or mobile devices, rather than by installing software on their premises. Through both our single-tenant and multi-tenant platforms, our customers have options as to the configuration that best meets their needs. The multi-tenant approach provides significant operating leverage and improved efficiency as it helps us to reduce our fixed cost base and minimize unused capacity on our hardware. In addition, we believe our software architecture gives us an advantage over vendors of legacy systems, who may be using a less flexible architecture that would require significant time and expense to update. Our enterprise customers utilize a single-tenant software application which allows improved configurability and support for a variety of unique integrations.
9
We host our applications and serve our hosted customers from several data centers and hosting providers in different locations. We rely on third-party vendors to operate these data centers and provide services, which are designed to host mission-critical computer systems and have industry-standard measures in place to minimize service interruptions. Our technical operations staff manages the technology stacks supporting our platforms and uses automated monitoring tools throughout our system to detect unusual events or malfunctions that could interfere with our customers’ use of the Connecture solutions. We monitor application health by verifying that the applications, interfaces and supporting middleware are operational. If our monitoring tools detect a problem, they notify our technical operations staff, who respond immediately to diagnose and resolve the problem. We take the security of our data and our systems very seriously, and we focus on minimizing the risk of vulnerabilities in our system at the levels of software design and system and network administration.
Research and Development
We believe that successfully developing and selling innovation is key to our long-term growth. Research and development expenses were $16.7 million, $22.3 million, and $22.7 million for the years ended December 31, 2017, 2016 and 2015, respectively.
Compliance and Certifications
We voluntarily obtain third-party security examinations relating to security and data privacy. In addition, on an annual basis, we have a qualified security assessor complete an audit of compliance against the Payment Card Industry Data Security Standards, or PCI-DSS, applicable to Level 2 service providers. These standards focus on application and network security controls for companies that process, transmit or store credit card data on behalf of customers. As of December 31, 2017, we have demonstrated compliance with PCI-DSS 3.2 as determined by a qualified security assessor. During the year ended December 31, 2017, we also obtained our most recent independent SSAE16 SOC2® Report—Report on Controls at a Service Organization Relevant to Security, Availability, Process Integrity, Confidentiality or Privacy with no exceptions noted. We meet the requirements for a Business Associate as required by the Health Insurance Portability and Accountability Act, or HIPAA.
Intellectual Property
We rely on a combination of trade secret, copyright and trademark laws, license agreements, confidentiality procedures, confidentiality and nondisclosure agreements and technical measures to protect the intellectual property used in our business. We generally enter into confidentiality and nondisclosure agreements with our employees, consultants, vendors and customers. We also seek to control access to and distribution of our software, documentation and other proprietary information.
We use several registered trademarks for our products and services, such as “Connecture,” “DRX,” “DestinationRX” “InsureAdvantage,” and “ConnectedHealth,” which are registered marks of Connecture in the United States. Through claimed common law trademark protection, we also protect other marks which identify our services, such as RxHealth, and we have reserved numerous domain names, including “connecture.com.”
We also rely on certain intellectual property rights that we license from third parties.
Government Regulation
The healthcare and health insurance industries are highly regulated and entities are required to comply with extensive and complex United States laws and regulations at the federal and state levels. Although many regulatory and governmental requirements do not directly apply to our business, our customers are required to comply with a variety of United States laws, and we may be impacted by these laws as a result of our contractual obligations. We have attempted to structure our operations to comply with applicable legal requirements, but there can be no assurance that our operations will not be challenged or impacted by enforcement initiatives.
Requirements of PPACA
In March 2010, then-President Obama signed into law the Patient Protection and Affordable Care Act, or PPACA. As enacted, PPACA has impacted how healthcare services are covered, delivered and reimbursed through expanded coverage of uninsured individuals, reduced Medicare program spending and insurance market reforms.
While many of the provisions of PPACA have not been directly applicable to us, PPACA, as enacted, has affected the business of many of our customers. Health plans and large employers have experienced changes in the numbers of individuals they insure as a result of Medicaid expansion and the creation of state and national exchanges. Although we are unable to predict with any reasonable certainty or otherwise quantify any future likely impact of PPACA on our business model, financial condition or results of operations, changes in the business of our customers and the number of individuals they insure may negatively impact our business. While in
10
2017 the PPACA remained in force, efforts under the current presidential administration have modified and may continue to modify, substantially change, or possibly repeal the PPACA in its entirety. For example, the tax reform bill (known as the Tax Cuts and Jobs Act of 2017) that was enacted into law in December 2017 has removed the individual mandate and associated tax penalties of the PPACA.
Requirements Regarding the Confidentiality, Privacy and Security of Personal Information
HIPAA and Other Privacy and Security Requirements.
There are numerous federal and state laws and regulations related to the privacy and security of personal health and other sensitive information. In particular, regulations promulgated pursuant to HIPAA established privacy and security standards that limit the use and disclosure of individually identifiable health information and require the implementation of administrative, physical and technological safeguards to ensure the confidentiality, integrity and availability of individually identifiable health information in electronic form. Health plans, healthcare clearinghouses and most providers are considered by the HIPAA regulations to be “Covered Entities.” With respect to our operations, we are a Business Associate of our health plan customers and we are directly subject to the privacy and security regulations and oversight established under HIPAA. We enter into written Business Associate Agreements with our customers, under which we are required to safeguard individually identifiable health information and comply with restrictions on how we may use and disclose such information.
Violations of the Privacy Standards and Security Standards might result in civil and criminal penalties, and the American Recovery and Reinvestment Act of 2009 (ARRA) increased the penalties for HIPAA violations and strengthened the enforcement provisions of HIPAA. For example, ARRA authorizes state attorneys general to bring civil actions seeking either injunctions or damages in response to violations of Privacy Standards and Security Standards that threaten the privacy of state residents. Additionally, some health plans interpret HIPAA requirements differently than we do, and as our customers are the Covered Entity under HIPAA we may be required to comply with their interpretations.
We might not be able to adequately address the business risks created by HIPAA implementation. Furthermore, we are unable to predict what changes to HIPAA or other laws or regulations might be made in the future or how those changes could affect our business or the costs of compliance.
In addition to the Privacy Standards and Security Standards, most states have enacted patient confidentiality laws that protect against the disclosure of confidential medical and/or health information, and many states have adopted or are considering further legislation in this area, including privacy safeguards, security standards and data security breach notification requirements. Such state laws, if more stringent than HIPAA requirements, are not preempted by the federal requirements and we are required to comply with them. Additionally, other laws or standards may apply to our operations, including requirements related to handling certain financial information, federal tax information, or FTI, and payment card association operating rules with respect to credit card data.
Failure by us to comply with any state standards regarding patient privacy may subject us to penalties, including civil monetary penalties and, in some circumstances, criminal penalties. Such failure may injure our reputation and adversely affect our ability to retain customers and attract new customers.
Medicare and Medicaid Regulatory Requirements
We have contracts with insurance health plans who offer Medicare Managed Care (also known as Medicare Advantage or Medicare Part C) and Medicaid managed care plans. We also have contracts with insurance health plans who offer Medicare prescription drug benefits (also known as Medicare Part D) plans. The activities of the Medicare plans are regulated by CMS, and Medicaid is regulated at both the state and federal level. Though our health plan customers remain responsible to comply with CMS and other regulatory requirements, we operate as a First Tier, Downstream & Related Entity, or FDR, in support of our Medicare customers. Some of the activities that we might perform, such as the enrollment of beneficiaries, may be subject to CMS and/or state regulation, and such regulations may force us to change the way we do business or otherwise restrict our ability to provide services to such plans. Moreover, the regulatory environment with respect to these programs has become, and will likely continue to become, increasingly complex.
Financial Services-Related Laws and Rules
Financial services and electronic payment processing services are subject to numerous laws, regulations and industry standards, some of which might impact our operations and subject us, our vendors and our customers to liability as a result of the solutions we offer. In addition, our solutions might be impacted by payment card association operating rules, certification requirements and rules governing electronic funds transfers. If we fail to comply with applicable payment processing rules or requirements, we might be subject to fines and changes in transaction fees and may lose our ability to process credit and debit card transactions or facilitate other types of billing and payment solutions. Moreover, payment transactions processed using the Automated Clearing House Network, or
11
ACH, are subject to network operating rules promulgated by the National Automated Clearing House Association and to various federal laws regarding such operations, including laws pertaining to electronic funds transfers, and these rules and laws might impact our billing and payment solutions.
Insurance Broker Laws
Insurance laws in the United States are often complex, and states have broad authority to adopt regulations regarding brokerage activities. These regulations typically include the licensing of insurance brokers and agents and govern the handling and investment of customer funds held in a fiduciary capacity. We and our broker/agency customers may be subject to some of these regulations, and may not be able to fully comply.
ERISA and Third-Party Administrator Laws
The Employee Retirement Income Security Act of 1974, as amended, or ERISA, regulates how employee benefits are provided to or through certain types of employer-sponsored health benefits plans. ERISA is a set of laws and regulations that is subject to periodic interpretation by the United States Department of Labor as well as the federal courts.
Numerous states in which we do business have adopted regulations governing entities engaged in third-party administrator, or TPA, activities. TPA regulations typically impose requirements regarding enrollment into benefits plans, claims processing and payments and the handling of customer funds. Although we do not believe we are currently acting as a TPA, changes in state regulations could result in us being obligated to comply with such regulations, which might require us to obtain licenses to provide TPA services in such states.
Employees
As of December 31, 2017, we had 320 employees, all of whom are based in the United States. We consider our current relationship with our employees to be good. None of our employees is represented by a labor union or is a party to a collective bargaining agreement.
Quarterly Trends and Seasonality
Our overall operating results, including cash flow from operations, fluctuate from quarter to quarter as a result of a variety of factors, some of which are out of our control. These fluctuations are primarily driven by an increase in the third and fourth quarters in activity at our customers in preparation for and during the annual insurance enrollment cycle, which occurs annually during our fourth quarter. Our historical results should not be considered a reliable indicator of our future results of operations.
Available Information
Our Internet address is www.connecture.com and our investor relations website is located at http://investors.connecture.com. We make available free of charge on our investor relations website under the headings “Financials” and “SEC Filings” our Annual Reports on Form 10-K, Quarterly Reports on Form 10-Q, Current Reports on Form 8-K and amendments to those reports as soon as reasonably practicable after such materials are electronically filed with (or furnished to) the SEC. Information contained on our websites is not incorporated by reference into this Annual Report on Form 10-K. In addition, the public may read and copy materials we file with the SEC at the SEC’s Public Reference Room at 100 F Street, NE, Washington, DC 20549. The public may obtain information on the operation of the Public Reference Room by calling the SEC at 1-800-SEC-0330. In addition, the SEC maintains an Internet site, www.sec.gov, that includes filings of and information about issuers that file electronically with the SEC.
Our business, prospects, financial condition or operating results could be materially adversely affected by any of these risks. The trading price of our common stock could decline due to any of the risks and uncertainties described below, and you may lose all or part of your investment. In assessing these risks, you should also refer to the other information contained in this Annual Report on Form 10-K, including our consolidated financial statements and related notes.
Risks Related to the Proposed Merger
On January 4, 2018, we entered into the Merger Agreement with affiliates of Francisco Partners, pursuant to which we will become a privately-held company. The Merger is considered a “going-private” transaction under the SEC’s rules.
12
Failure to complete the Merger or an alternative transaction as contemplated under the Merger Agreement could negatively affect our business, the market price of our common stock, and our ability to continue as a going concern.
If the Merger is not completed for any reason and we do not enter into an alternative transaction as contemplated under the Merger Agreement, we will be subject to a number of material risks, including the disruption to our business resulting from the announcement of the signing of the Merger Agreement, the diversion of management’s attention from our day-to-day business, expenses incurred in connection with the proposed Merger and the restrictions imposed by the Merger Agreement on the operation of our business during the period before the completion of the Merger, which may make it difficult for us to achieve our business goals if the Merger does not occur.
In addition, in such a scenario, our stockholders will not receive any payment for their shares in connection with the Merger. Instead, we will remain an independent public company, and our common shares will continue to be quoted on the OTCQX.
However, if the Merger is not completed, and depending on the circumstances that would have caused the Merger not to be completed, the price of the shares of our common stock may decline significantly. If that were to occur, it is uncertain when, if ever, the price of the shares would return to the prices at which the shares currently trade. Accordingly, if the Merger is not completed, there can be no assurance as to the effect of these risks on the future value of shares held by our stockholders.
Furthermore, failure to complete the Merger or an alternative transaction could accelerate our obligations under our Senior Credit Facility with Wells Fargo, which could lead to a default under the credit agreement. In the event that we default on our Senior Credit Facility, our debt would accelerate, and Wells Fargo could demand repayment, which would severely restrict our ability to operate our business. On January 4, 2018, we entered into an amendment to our Senior Credit Facility with Wells Fargo in order to, among other things, (i) increase the available revolving credit facility by $5.5 million through the later of June 4, 2018, and the approved outside date of an alternative acquisition as contemplated under the Merger Agreement (the “Outside Date”), (ii) defer scheduled March 31, 2018 Term Loan principal repayments until the Outside Date, at which time the deferred $1.3 million is due and quarterly principal repayments of $1.3 million will resume through March 31, 2021; (iii) replace the existing covenants with a minimum liquidity requirement of $1.5 million at all times from March 1, 2017, through the Outside Date. The Outside Date will be deemed to have occurred prior to the date set forth above upon (i) an event of default under the credit facility, (ii) termination of the Merger Agreement under certain circumstances and (iii) the consummation of the Merger or alternative acquisition as contemplated under the Merger Agreement. If we fail to consummate the Merger before the Outside Date, we may breach our obligations under the credit facility. If we breach these obligations, we would be forced to negotiate with our lender to waive or delay the obligations, and if we are unsuccessful, this could significantly affect our ability to operate our business and continue as a going concern. There can be no assurance that in the future we will be able to refinance our debt on favorable terms, or at all.
Failure to complete the Merger could trigger the payment of a termination fee.
The Merger Agreement contains certain termination rights, including our right to terminate the Merger Agreement to accept a superior proposal, subject to specified limitations, and provides that, if the Special Committee of our board of directors authorizes us to terminate the Merger Agreement in order to accept a superior proposal, we will be required to pay the Parent a termination fee consisting of the reimbursement of certain expenses up to $2 million.
Uncertainties associated with the Merger may cause us to lose key customers or suppliers and make it more difficult to retain and hire key personnel.
As a result of the uncertainty surrounding the conduct of our business following the completion of the Merger, we may lose key customers and suppliers. In addition, our employees may be uncertain about their future roles and relationships with us following the completion of the Merger, which may adversely affect our ability to retain them or to hire new employees.
Litigation in connection with the Merger Agreement may be costly, prevent consummation of the Merger, divert management’s attention and otherwise materially harm our business.
Regardless of the outcome of any current or future litigation related to the Merger Agreement and the transactions it contemplates, such litigation may be time-consuming and expensive and may distract our management from running the day-to-day operations of our business. The litigation costs and diversion of management’s attention and resources to address the claims and counterclaims in any litigation related to the Merger Agreement and the transactions it contemplates may materially adversely affect our business, financial condition and/or operating results. Furthermore, if the Merger is not consummated, for any reason, litigation could be filed in connection with the failure to consummate the Merger. Any litigation related to the Merger may result in negative publicity or an unfavorable impression of us, which could negatively impact the trading price of our common stock, impair our ability to recruit or retain employees, damage our relationships with merchants, or otherwise materially harm our operations and financial performance.
13
If the Merger is not completed for any reason or we do not enter into an alternative transaction, we expect that management will operate our business in a manner similar to that in which it is being operated today. Therefore, in addition to the specific risks noted above, our stockholders would continue to be subject to the following risks related to our business, including without limitation risks related to the competitive health insurance marketplace software industry in which we operate and adverse economic conditions in general.
We have a history of losses and we may be unable to achieve or sustain profitability.
We experienced a net loss of $15.5 million, $26.5 million and $7.3 million in 2017, 2016 and 2015, respectively. We cannot predict if we will achieve profitability in the near future or at all. We expect to make significant future expenditures to develop and expand our business. Our prior growth in revenue may not return or be sustainable, and we might not achieve sufficient revenue to achieve or maintain profitability. We may incur significant losses in the future for a number of reasons, including the other risks described in this Annual Report on Form 10-K, and we may encounter unforeseen expenses, difficulties, complications and delays and other unknown events. Accordingly, we may not be able to achieve or maintain profitability, and we may incur significant losses for the foreseeable future. Information on our going concern and management’s plan to address is included in Note 3 of the Notes to Consolidated Financial Statements included in Part II, Item 8: “Financial Statements and Supplementary Data” of this Annual Report on Form 10-K.
Absent the Merger Agreement and the financing to be incurred in connection with the Merger, or an alternative source of financing if the Merger is not completed, we do not have enough cash to fund our operations to profitability and are unable to conclude that we will be able to continue as a going concern entity for at least twelve months following the date of this Annual Report on Form 10-K.
On December 31, 2017, we had cash and cash equivalents of $7.7 million. As noted above, we amended our Senior Credit Facility with Wells Fargo on January 4, 2018 to, among other things, increase our revolving credit facility by $5.5 million to a total of $6.0 million of temporary revolving credit availability. We believe our cash and cash equivalents and temporary revolving credit availability will meet our liquidity needs through the anticipated consummation of the Merger. However, should the Merger not occur before June 4, 2018, the minimum liquidity covenant of the Senior Credit Facility increases from $1.5 million to $15.0 million and we currently have no alternative plans to meet this covenant. As a result, should the Merger not close before June 4, 2018, all $32.6 million of our indebtedness as of December 31, 2017 will become due. Since we do not control our ability to consummate the Merger before June 4, 2018, we cannot be certain we will be able to negotiate with Wells Fargo or secure the necessary funds to refinance our Senior Credit Facility before June 4, 2018, and accordingly, we cannot conclude that we will be able to continue as a going concern entity for at least twelve months following the date of this Annual Report on Form 10-K.
In the event that the Merger is not completed but we are able to negotiate for an extension of our indebtedness with Wells Fargo, we would still likely need additional capital, which may not be available to us on favorable terms, or at all, and may dilute the ownership of our common stock. Our ability to raise additional capital may be impaired by the requirement that the holders of our Series A Convertible Preferred Stock (the “Series A Preferred Stock”) and the holders of our Series B Convertible Preferred Stock (the “Series B Preferred Stock”) consent to the issuance of senior equity and that the holders of our Series B Preferred Stock consent to the incurrence of additional indebtedness outside of the ordinary course of business. If we raise additional funds through new issuances of equity or convertible debt securities, our existing stockholders could suffer significant dilution, and any new equity securities we issue could have rights, preferences and privileges superior to those of holders of our common stock. Any debt financing secured by us in the future could involve restrictive covenants relating to our capital-raising activities and other financial and operational matters, which might make it more difficult for us to obtain additional capital and to pursue business opportunities, including potential acquisitions. In addition, we might not be able to obtain additional financing on terms favorable to us, if at all. Similarly, upon the occurrence of certain fundamental events, the holders of our Series A Preferred Stock and our Series B Preferred Stock (which we refer to collectively as our “Preferred Stock”) will have the right to require us to repurchase any or all of our outstanding Series A Preferred Stock and Series B Preferred Stock, respectively. It is possible that we would not have sufficient funds at the time that we are required to make any such purchase of Preferred Stock. We cannot assure the holders of our Preferred Stock that we will have sufficient financial resources, or will be able to arrange financing, to pay the repurchase price in cash with respect to any such Preferred Stock that holders have requested to be repurchased upon the occurrence of such an event. If we are unable to obtain adequate financing or financing on terms satisfactory to us when we require it, our ability to continue to support our business and to respond to business challenges could be significantly limited.
14
Our history of incurring substantial levels of indebtedness could adversely affect our ability to raise additional capital to fund our operations, limit our ability to react to changes in the economy or our industry, expose us to interest rate risk to the extent of our variable rate debt and prevent us from meeting obligations on our indebtedness.
We have a history of incurring substantial amounts of indebtedness. As of December 31, 2017, our total indebtedness was $32.6 million. Our indebtedness, combined with our other existing and any future financial obligations and contractual commitments, including the requirement that the holders of our outstanding Series B Convertible Preferred Stock (the “Series B Preferred Stock”) consent before we incur any additional indebtedness outside of the ordinary course of business, could have important adverse consequences. For example, it could:
|
|
• |
make it more difficult for us to satisfy our obligations with respect to our indebtedness, including making interest payments on our debt obligations, and any failure to comply with the obligations under any of our debt instruments, including restrictive covenants, could result in an event of default under the agreements governing such indebtedness; |
|
|
• |
require us to dedicate a substantial portion of our cash flow from operations to payments on our indebtedness, thereby reducing funds available for working capital, capital expenditures, selling and marketing efforts, research and development and other purposes; |
|
|
• |
cause us to incur substantial fees from time to time in connection with debt amendments or refinancing; |
|
|
• |
increase our exposure to rising interest rates because a portion of our borrowings is at variable interest rates; |
|
|
• |
place us at a disadvantage compared to our competitors that have less debt; |
|
|
• |
limit our ability to pursue acquisitions; |
|
|
• |
limit our flexibility in planning for, or reacting to, changes in our business and the health insurance industry; |
|
|
• |
limit our ability to borrow additional funds, or to dispose of assets to raise funds, if needed, for working capital, capital expenditures, acquisitions, selling and marketing efforts, research and development and other corporate purposes; and |
|
|
• |
increase our vulnerability to adverse economic and industry conditions, which could place us at a competitive disadvantage compared to our competitors that have relatively less indebtedness. |
See the section titled “Liquidity and Capital Resources—Senior Credit Facility” for a description of our bank credit facility.
The market for health insurance in the United States is rapidly evolving and volatile, which makes it difficult to forecast adoption rates, regulatory changes, and demand for our solutions, and could have a material adverse effect on our business and results of operations.
The market for health insurance in the United States is rapidly evolving and volatile. Accordingly, our future financial performance will depend in part on growth in this market and on our ability to adapt to emerging demands and trends in this market. The market for health insurance sales automation software is relatively new and unproven, and it is uncertain whether it will achieve and sustain high levels of demand and market acceptance. The volatility and rapidly evolving nature of the market in which we operate, as well as other factors that are beyond our control, reduces our ability to accurately evaluate our long-term outlook and forecast annual performance.
Additionally, our success depends in part upon widespread individual and health plan acceptance of the Internet as a shopping platform and marketplace for the purchase and sale of health insurance. Individuals, employers, employees and health plans may choose to depend on more traditional sources, such as individual agents, or alternative sources may develop, including as a result of significant reforms to healthcare legislation through the Patient Protection and Affordable Care Act, or PPACA, and the Healthcare and Education Reconciliation Act of 2010, or HCERA, or any potential successors to or modifications of PPACA that may be enacted.
A reduction or slowdown in demand for health insurance sales automation software caused by shifts in the marketplace, regulatory requirements, lack of acceptance, technological challenges, and competing solutions, or as a result of individuals, brokers, or health plans determining that other distribution channels for health insurance are superior to ours, would have a material adverse effect on our business, future growth, results of operations and financial condition.
15
If our existing customers do not continue or renew their agreements with us, renew at lower fee levels, decline to purchase additional software-as-a-service and other professional services from us, or if customers with variable usage fees are unable to effectively increase their transaction volumes, it could have a material adverse effect on our business and operating results, including cash flows from operations.
We derive a significant portion of our revenue from renewal of existing customer agreements and sales of additional software-as-a-service and other professional services to existing customers and expect to continue to do so. As a result, achieving a high renewal rate of our customer agreements and selling additional software-as-a-service and professional services is critical to our future operating results and cash flow.
We generally sell our software-as-a-service and other professional services pursuant to agreements for terms of multiple years. Our customers may choose not to renew these contracts after the initial contract period expires. Additionally, some of our customers are able to terminate their respective contracts without cause or for convenience at any time, or may terminate if they cease to participate in a market segment or the health insurance business altogether. We may not be able to accurately predict future trends in customer renewals, and our customers’ renewal rates may decline or fluctuate. Without the continuance or renewal of our customer contracts our business and operating results may suffer.
Factors that may affect the renewal rate for our existing contracts, and our ability to sell additional software-as-a-service and other professional services, include:
|
|
• |
the price, performance and functionality of our offering; |
|
|
• |
the availability, price, performance and functionality of competing solutions; |
|
|
• |
our ability to develop complementary applications and services; |
|
|
• |
our continued ability to access the pricing and other data necessary to enable us to deliver reliable offerings to customers; |
|
|
• |
the stability, performance and security of our hosting infrastructure and hosting services; |
|
|
• |
changes in healthcare laws, regulations or trends; and |
|
|
• |
the business environment of our customers. |
If any of our customers terminate or do not renew their contracts for our services, renew on less favorable terms, or do not purchase additional functionality or software-as-a-service, our revenue may grow more slowly than expected or decline, and our profitability and gross margins may be harmed.
We derive a portion of our revenue from arrangements having variable usage and commission revenue dependent on actual customer usage and consumer enrollments in health and ancillary insurance policies. Our customers may not be successful at maintaining or increasing transaction volumes processed through our web-based software solutions. As a result, we may not be able to achieve desired business and operating results from such variable usage and commission transaction arrangements.
A significant amount of our revenue is derived from a limited number of customers, and any reduction in revenue from any of these customers could have a material adverse effect on our business.
Our ten largest customers by revenue accounted for approximately 50.0% of our consolidated revenue in 2017. If any of our key customers decides not to renew its contracts with us, or to renew on less favorable terms, our business, revenue, reputation, and our ability to obtain new customers could be materially and adversely affected. One customer accounted for 10% or more of our revenue in 2017.
Failure to manage our anticipated long-term growth effectively could increase our expenses, decrease our revenue and prevent us from implementing our business strategy.
To manage our anticipated future growth effectively, we must continue to maintain and enhance our information technology infrastructure, financial and accounting systems and controls. We also must attract, train and retain qualified software engineers, technical and management personnel, sales and marketing personnel, customer support personnel and professional services personnel. Failure to effectively manage our anticipated long-term growth could lead us to over-invest or under-invest in development and operations, result in weaknesses in our infrastructure, systems or controls, give rise to operational mistakes, losses, loss of productivity or business opportunities and result in loss of employees and reduced productivity of remaining employees. Our anticipated long-term growth could require significant capital expenditures and might divert financial resources from other projects such as the development of new products and services. If our management is unable to effectively manage our anticipated long-term growth, our expenses might increase more than expected, our revenue could decline or might grow more slowly than expected, and we might be unable to
16
implement our business strategy. The quality of our products and services might suffer, which could negatively affect our reputation and harm our ability to retain and attract customers.
We have experienced quarterly fluctuations, and expect to continue to experience quarterly fluctuations, in our operating results, including cash flows from operations, due to a number of factors, including the seasonality of our revenue, the sales and implementation cycles for our products and services, dependence on variable customer usage and transaction volumes, and other factors, that make our future results difficult to predict and could cause our operating results to fall below expectations.
Our business is subject to seasonal fluctuations and our operating results are traditionally strongest in the fourth quarter of each year as a result of the open enrollment period established by PPACA and other requirements and regulations with respect to the sales and marketing of Medicare plans. Therefore, our stock price might be based on expectations of future performance that we might not meet and, if our revenue or operating results fall below the expectations of investors or securities analysts, the price of our common stock could decline substantially.
The sales cycle for our products and services can vary from, on average, two to 12 or more months, from initial contact to contract execution, depending on the client and complexity of the solution. After a customer contract is signed, we provide an implementation process for the customer which typically ranges from two to four months for our cloud-based implementations and from three to 15 months for complex enterprise implementations, each from contract execution to completion of implementation.
During the sales and implementation cycles for our enterprise segments, we expend substantial time and effort, and incur significant additional operating expenses. Accounting principles require us to defer revenue until implementation is complete and the services are available for use by our customers, at which time we begin recognition of implementation revenue over the life of the contract or the estimated period of customer benefit, whichever is longer. As a result, the period of time between contract signing and recognition of associated revenue may be lengthy, and we are not able to predict with certainty the period in which implementation will be completed. Unanticipated difficulties and delays in implementation might arise as a result of failure by us or our customers to complete one or more of our or their respective responsibilities and, if implementation periods are extended or implementations are cancelled, revenue recognition could be delayed or fail to occur.
Our operating results have varied in the past. In addition to the other risk factors listed in this section, some of the important factors that may cause fluctuations in our operating results include:
|
|
• |
the timing and amount of cash payments received from the delivery of our software solutions; |
|
|
• |
our dependency on transaction volumes to generate variable usage and commission revenue; |
|
|
• |
the extent to which our products and services achieve or maintain market acceptance; |
|
|
• |
our ability to introduce new products and services and enhancements to our existing products and services on a timely basis; |
|
|
• |
new competitors and the introduction of enhanced products and services from competitors; |
|
|
• |
the financial condition of our current and potential customers; |
|
|
• |
changes in customer budgets and procurement policies; |
|
|
• |
the amount and timing of our investment in research and development activities; |
|
|
• |
technical difficulties with our products or interruptions in our services; |
|
|
• |
our ability to hire and retain qualified personnel, including our sales force; |
|
|
• |
changes in the legislative and regulatory environment related to benefits and healthcare; |
|
|
• |
regulatory compliance costs; |
|
|
• |
the timing, size and ability to successfully integrate potential future acquisitions; and |
|
|
• |
unforeseen legal expenses, including litigation and settlement costs. |
In addition, a significant portion of our operating expense is relatively fixed in nature, and planned expenditures are based in part on expectations regarding future revenue. Accordingly, unexpected revenue shortfalls might decrease our gross margins and could cause significant changes in our operating results from quarter to quarter. If this occurs, the trading price of our common stock could fall substantially, either suddenly or over time.
17
We operate in the highly competitive software industry. If we are not able to compete effectively, our business and operating results will be harmed.
The software market is highly competitive and is likely to attract increased competition, which could make it hard for us to succeed. Small, specialized providers continue to become more sophisticated and effective. In addition, large, well-financed, and technologically sophisticated software companies might focus more on our market. The size and financial strength of these entities is increasing as a result of continued consolidation in both the IT and health insurance industries. We expect large integrated software companies to become more active in our market, both through acquisitions and internal investment. As costs fall and technology improves, increased market saturation might change the competitive landscape in favor of our competitors.
Some of our current competitors have greater name recognition, longer operating histories, and significantly greater resources than we do. As a result, our competitors might be able to respond more quickly and effectively than we can to new or changing opportunities, technologies, standards, or customer requirements. In addition, current and potential competitors have established, and might in the future establish, cooperative relationships with vendors of complementary products, technologies, or services to increase the availability of their products in the marketplace. Accordingly, new competitors or alliances might emerge that have greater market share, a larger customer base, more widely adopted proprietary technologies, greater marketing expertise, greater financial resources and larger sales forces than we have, which could put us at a competitive disadvantage. Further, in light of these advantages, even if our products and services are more effective than those of our competitors, current or potential customers might accept competitive offerings in lieu of purchasing our offerings. Increased competition is likely to result in pricing pressures, which could negatively impact our sales, profitability or market share. In addition to new niche vendors, who offer stand-alone products and services, we face competition from existing enterprise vendors, including those currently focused on software solutions that have information systems in place with potential customers in our target market. These existing enterprise vendors might promise products or services that offer ease of integration with existing systems and which leverage existing vendor relationships. In addition, large health plans often have internal technology staffs and proprietary software for benefits and distribution management, making them less likely to buy our solutions.
If our transition from our current technology platforms to new platforms does not occur rapidly or as efficiently as anticipated, it could have a material adverse effect on our business and results of operations.
We are expanding our software-as-a-service, or SaaS, and other cloud based and hosted offerings, including building new shared capabilities such as consumer shopping and personalization. Our ability to (i) complete that development and (ii) efficiently transition existing enterprise-platform customers to updated components is important to our future operating results. We are also investing in platform delivery improvements that will lower our cost of implementation and configuration and improve competitiveness. Our SaaS business model depends heavily on achieving economies of scale because the initial upfront investment is costly and the associated revenue is recognized on a ratable basis. If we fail to achieve efficient transitions, improvements to our capabilities, appropriate economies of scale or if we fail to manage or anticipate the evolution and demand of the SaaS pricing model, then our business and operating results could be adversely affected.
In the event that our proprietary software does not operate properly, our reputation would suffer, claims would likely be asserted against us, and we would likely be required to divert our resources from other purposes, any of which could have a material adverse effect on our business.
Proprietary software development is time-consuming, expensive and complex. We may experience difficulties with software development, industry standards, design or marketing that could delay or prevent the development, introduction, or implementation of new solutions and enhancements. If our solutions do not function reliably or fail to achieve customer expectations in terms of performance, customers could assert liability claims against us and/or attempt to cancel their contracts with us. This could damage our reputation and impair our ability to attract or maintain customers.
Moreover, software as complex as ours has in the past contained, and may in the future contain, or develop, undetected defects or errors. Material performance problems or defects in our products and services might arise in the future. Errors might result from the interface of our services with legacy systems and data, which we did not develop and the function of which is outside of our control. Defects or errors might arise in our existing or new software or service processes. Because changes in health plan and legal requirements and practices relating to health insurance are frequent, we must continuously monitor for defects and errors in our software and service processes compared against these requirements and practices. Any failure by us to identify and address defects and errors could result in loss of enrollment by our customers, loss of revenue or market share, liability to customers or others, failure to achieve market acceptance or expansion, diversion of development and other resources, injury to our reputation, and increased service and maintenance costs. Defects or errors in our product or service processes might discourage existing or potential customers from purchasing services from us. Correcting defects or errors could prove to be impossible or impracticable. The costs incurred in correcting any defects or errors or in responding to resulting claims or liability might be substantial and could adversely affect our operating results.
18
Our customers might assert claims against us in the future alleging that they suffered damages due to a defect, error, or other failure of our product or service processes. A claim could subject us to significant legal defense costs and adverse publicity regardless of the merits or eventual outcome of such claim.
We rely on data center providers, Internet infrastructure, bandwidth providers, third-party computer hardware and software, other third parties, and our own systems for providing services to our customers, and any failure of or interruption in the services provided by these third parties, our own systems or other external events could expose us to litigation and may negatively impact our relationships with customers, adversely affecting our brand and our business.
We currently serve our customers from several data centers and hosting providers in different locations. While we control and have access to our servers, we do not control the operation of these facilities. The owners of our data center facilities have no obligation to renew their agreements with us on commercially reasonable terms, or at all. We may have to, or choose to, transfer our servers and other infrastructure to new data center facilities, and we may incur significant costs and possible service interruption in connection with doing so. Problems faced by our third-party data center locations, with the telecommunications network providers with whom we or they contract, or with the systems by which our telecommunications providers allocate capacity among their customers, including us, could adversely affect the experience of our customers. Our third-party data centers operators could decide to close their facilities without adequate notice. In addition, any financial difficulties, such as bankruptcy faced by our third-party data centers operators or any of the service providers with whom we or they contract may have negative effects on our business, the nature and extent of which are difficult to predict.
In addition, our ability to deliver our web-based services depends on the development and maintenance of the infrastructure of the Internet by third parties. This includes maintenance of a reliable network backbone with the necessary speed, data capacity, bandwidth capacity and security. Our services are designed to operate without interruption in accordance with our service level commitments, and we have implemented various measures to protect against interruptions of customers’ access to our platform. If customers’ access is interrupted because of problems in the operation of our facilities, we could be exposed to significant claims by customers. Our plans for disaster recovery and business continuity rely on third-party providers of related services. If those vendors fail us at a time when our systems are not operating correctly, we could incur a loss of revenue and liability for failure to fulfill our obligations. Any significant instances of system downtime could negatively affect our reputation and ability to retain customers and sell our services, which would adversely impact our revenue.
We have experienced and expect that we will experience future interruptions and delays in services and availability from time to time. In the event of a catastrophic event with respect to one or more of our systems, we may experience an extended period of system unavailability, which could negatively impact our relationship with customers. To operate without interruption, both we and our service providers must guard against:
|
|
• |
damage from fire, power loss, or telecommunications failure; |
|
|
• |
fire, flood, hurricane or other natural disasters, civil unrest, war and/or terrorism, and other force majeure events outside our control; |
|
|
• |
software and hardware errors, failures and crashes in or own systems and in other systems; |
|
|
• |
security breaches, computer viruses, hacking, denial-of-service attacks and similar disruptive problems; and |
|
|
• |
other potential interruptions. |
We also rely on purchased or leased computer hardware and software licensed from third parties in order to offer our services. These licenses are generally commercially available on varying terms. However, it is possible that this hardware and software might not continue to be available on commercially reasonable terms, or at all. Any loss of the right to use any of this hardware or software could result in delays in the provisioning of our services until equivalent technology is either developed by us, or, if available, is identified, obtained and integrated.
We exercise limited control over third-party vendors, which increases our vulnerability to problems with technology and information services they provide. Interruptions in our network access and services might in connection with third-party technology and information services reduce our revenue, cause us to issue refunds to customers for prepaid and unused subscription services, subject us to potential liability, or adversely affect our renewal rates. Although we maintain insurance for our business, the coverage under our policies might not be adequate to compensate us for all losses that may occur. In addition, we might not be able to continue to obtain adequate insurance coverage at an acceptable cost, if at all.
19
If our security measures are breached or fail, and unauthorized persons gain access to customers’ and consumers’ data, our products and services might be perceived as being unsecure, customers and consumers might curtail or stop using our products and services, and we might incur significant liabilities.
Our products and services involve the collection, processing, storage and transmission of customers’ and consumers’ confidential information, which may include sensitive individually identifiable information that is subject to stringent statutory and regulatory obligations. Because of the sensitivity of this information, security features of our software and applications are very important. From time to time we may detect vulnerabilities in our systems, which, even if they do not result in a security breach, may reduce customer confidence and require substantial resources to address. If our security measures or those of our third-party service providers are breached or fail and/or are bypassed as a result of third-party action, employee error, malfeasance, or otherwise, someone might be able to obtain unauthorized access to our customers’ confidential information and/or sensitive customer data. As a result, our reputation could be damaged, our business might suffer, and we could face damages for contract breach, penalties for violation of applicable laws or regulations, and significant costs for remediation efforts to prevent future occurrences.
In addition, we rely on various third parties, including health plans, brokers and other third-party service providers and consumers themselves, as users of our system, for key activities to protect and promote the security of our systems and the data and information accessible within them, such as enrollment information, consumer status changes and payment. On occasion, certain individuals have failed to perform these activities. For example, authorized users have failed to administer and use the login/password appropriately, which may allow the system to be accessed by unauthorized third parties. When we become aware of such breaches or incidents, we work with our customers to remedy the issue, terminate inappropriate access as necessary, and provide additional instruction in order to avoid the reoccurrence of such problems. Although to date these breaches have not resulted in claims against us or in material harm to our business, failures to perform these activities might result in claims against us, which could expose us to significant expense, legal liability, and harm to our reputation, which might result in loss of business.
Our security measures, and those of our third-party service providers, may not detect or prevent all attempts to hack our systems, denial-of-service attacks, viruses, malicious software, security breaches or other attacks and similar disruptions that may jeopardize the security of information stored in or transmitted by our sites, networks and systems or that we or our third-party service providers otherwise maintain, including payment card systems which may subject us to fines or higher transaction fees or limit or terminate our access to certain payment methods. Because techniques used to obtain unauthorized access or to sabotage systems change frequently and generally are not recognized until launched against a target, we and our hosting service providers might not be able to detect or prevent these techniques or to implement adequate preventive measures until after the techniques or other attacks have already been launched. If an actual or perceived breach of our security or that of our hosting service providers occurs, the market perception of the effectiveness of our security measures could be harmed and we could lose sales and customers. In addition, our customers might authorize or enable third parties to access their information and data that is stored on our systems. Because we do not control such access, we cannot ensure the complete integrity or security of such data in our systems.
For a more detailed discussion of the risks associated with a failure by us to comply with any of the federal and state standards regarding patient privacy, identity theft prevention and detection and data security, see the risk factor below under “—Risks Related to Regulation—The healthcare and health insurance industries are heavily regulated. Our failure to comply with regulatory requirements could create liability for us, result in adverse publicity and negatively affect our business.”
If we do not continue to provide innovative products and services, along with high quality support services, that are useful to our customers and consumers of insurance products, we might not remain competitive and our newer solutions may not be adopted by new and existing customers, which would have a material adverse effect on our business and results of operations.
Our success depends in part on our ability to successfully develop and sell innovative products and services that health insurance plans and brokers and their customers will utilize. We must continue to invest significant resources in research and development in order to enhance our existing products and services and introduce new high-quality products and services that customers will want. If we are unable to predict preferences of our customers or consumers or industry changes, or if we are unable to modify our products and services on a timely basis, we might lose customers. Our operating results would also suffer if our innovations are not responsive to the needs of our customers, are not appropriately timed with market opportunity, or are not effectively brought to market. As technology continues to develop, our competitors might be able to offer results that are, or that are perceived to be, substantially similar to or better than those generated by us. This would force us to compete on additional product and service attributes and to expend significant resources in order to remain competitive.
Our success also depends on providing high quality support services to resolve any issues related to our products and services. High quality education and customer support are important for the successful marketing and sale of our products and services and for the renewal of existing customers. If we do not help our customers quickly resolve issues and provide effective ongoing support, our ability to sell additional products and services to existing customers would suffer and our reputation with existing or potential customers would be harmed.
20
Failure to adequately develop and deploy our direct sales force could impede our results.
We believe that our future performance will depend on the continued development of our direct sales force and its ability to obtain new customers and sell additional products and services to existing customers. Identifying and recruiting qualified personnel and training them in the use of our software requires significant time, expense, and attention. It can take up to nine months or longer before a new sales representative is fully trained and productive. Our business may be adversely affected if our efforts to retain, attract, and train our direct sales force do not generate a corresponding increase in revenue. In particular, if we are unable to hire and develop sufficient numbers of productive direct sales personnel or if new direct sales personnel are unable to achieve desired productivity levels in a reasonable period of time, sales of our products and services will suffer and our results will be impeded.
Because we recognize revenue and expense relating to delivery of software-as-a-service, transaction fees and professional services over varying periods, downturns or upturns in sales are not immediately reflected in full in our operating results.
We recognize recurring revenue monthly over the term of our contracts and recognize the majority of our professional services revenue ratably over the contract term or the estimated period of customer benefit, whichever is longer. As a result, a portion of the revenue we report each quarter is the recognition of deferred revenue from contracts we entered into during previous quarters. Consequently, a shortfall in demand for our software solutions and professional services or a decline in new or renewed contracts in any one quarter might not significantly reduce our revenue for that quarter, but could negatively affect our revenue in future quarters. Accordingly, the effect of significant downturns in new or renewed sales of our products and services is not reflected in full in our results of operations until future periods. Our revenue recognition model also makes it difficult for us to rapidly increase our revenue through additional sales in any period, because revenue from new customers must be recognized over the applicable term of the contracts or the estimated period of customer benefit, whichever is longer. A number of our client arrangements include variable transaction-based fees that are dependent on market conditions and our customers’ success in using our software services to transact annual insurance enrollments. The amount of revenue from such arrangements largely occurs in the fourth quarter of each calendar year in conjunction with the traditional annual health insurance renewal cycles of our customers. In addition, we recognize professional services expenses as incurred, which could cause professional services gross margin to be negative.
We have recorded a significant amount of goodwill, intangible assets and deferred implementation costs. We may need to record additional write-downs from future impairments of these assets, which could adversely affect our costs and business operations.
Our consolidated balance sheet includes significant goodwill, intangible assets and deferred implementation costs, including $30.9 million in goodwill, $5.9 million in other intangible assets and $24.3 million of deferred implementation costs, together representing approximately 73.5% of our total assets as of December 31, 2017. The determination of related estimated useful lives and whether these assets are impaired involves significant judgments and our ability to accurately predict future cash flows related to these intangible assets may not be accurate. We test our goodwill for impairment each fiscal year, but we also test goodwill, other intangible assets and deferred implementation costs for impairment at any time when there is a change in circumstances that indicates that the carrying value of these assets may be impaired. We recorded an impairment charge of $0.2 million for the year ended December 31, 2017. Any future determination that these assets are carried at greater than their fair value could result in substantial non-cash impairment charges, which could significantly impact our reported operating results.
Our estimate of the market size for our solutions may prove to be inaccurate, and even if the market size is accurate, we cannot assure you that our business will serve a significant portion of the market.
Our estimate of the market size for our solutions is subject to significant uncertainty and is based on assumptions and estimates, including our internal analysis and industry experience, which may not prove to be accurate. Our ability to serve a significant portion of this estimated market is subject to many factors, including our success in implementing our business strategy, which is subject to many risks and uncertainties. Accordingly, even if our estimate of the market size is accurate, we cannot assure you that our business will serve a significant portion of this estimated market for our solutions.
We might not be able to utilize a significant portion of our net operating loss or other tax credit carryforwards, which could adversely affect our future operating cash flows.
As of December 31, 2017, we had federal and state net operating loss carryforwards due to prior period losses, which if not utilized, will begin to expire in 2020. These carryforwards could expire unused and be unavailable to offset future income tax liabilities, which could adversely affect our future operating cash flows.
In addition, under Section 382 of the Internal Revenue Code of 1986, as amended, our ability to utilize net operating loss carryforwards or other tax attributes in any taxable year may be limited if we experience an “ownership change.” A Section 382 “ownership change” generally occurs if one or more stockholders or groups of stockholders who own at least 5% of our stock increase their collective ownership by more than 50 percentage points over their lowest ownership percentage within a rolling three-year period. Similar rules might apply under state tax laws. As a result of prior equity issuances and other transactions in our stock, we
21
have experienced “ownership changes” under Section 382 which limit the amount of net operating losses available to us. Further, an additional “ownership change” will occur upon the anticipated closing of the Merger Agreement dated January 4, 2018. Accordingly, the application of Section 382 could have a material effect on the use of our net operating loss carryforwards or other tax attributes, which could adversely affect our future operating cash flows.
As of December 31, 2017, and 2016, we have recorded a full valuation allowance against net operating loss carryforwards, because we believe it is more likely than not that these deferred tax assets will not be realized.
Our government business relies on working effectively with the prime contractor that hold the contract with the government customer and that contract being renewed or extended, as applicable. To the extent those relationships are not positively maintained and our subcontract in connection with the Centers for Medicare and Medicaid Services, or CMS, contract, is not renewed or extended, it could have a material adverse effect on our business.
In our government business to date, we have primarily worked as a subcontractor to prime contractors that contract directly with the federal or state government customer. In the scope of these relationships, we have provided specified components of the applicable government entity’s overall request. Based on our risk analysis of multiple factors, including the scope of the government entity’s request, the total potential contract value and the terms and conditions of the applicable contract, we have determined that operating in a subcontractor role has been most appropriate for our government business. It may or may not be more beneficial for us to contract directly with the government due to various factors including insurance, risk and liability issues. In order to secure government business, it is important that we identify and market our capabilities to the prime contractor community, participate on joint requests for proposals, and maintain effective working relationships throughout the term of the contract.
In many cases, payment for our products and services is dependent upon the prime contractor getting paid by the government customer. As such, we may not be paid on a timely basis or at all if the prime contractor or other subcontractors have not completed their work.
We use staff contracting firms located internationally or that source their resources from outside the United States to augment our employee base and assist in the development, distribution and delivery of our solutions. Future work with these firms might expose us to risks that could have a material adverse effect on our business.
We use staff contracting firms (both onshore and offshore) to scale up or down based on customer needs, work across various time zones to meet speed to market requirements, and lower our total cost of delivery. For over ten years, we have used staff contracting firms with employees located internationally. Associated risks include:
|
|
• |
operating in international markets requires significant resources and management attention and might subject us to regulatory, economic, and political risks that are different from those in the United States, including data privacy and security considerations; |
|
|
• |
ability of our vendor firms to continue to identify and staff local talent that meets our quality and turnaround requirements; |
|
|
• |
currency fluctuations which raises the price of offshore labor and does not allow us to obtain cost efficiencies; |
|
|
• |
difficulties in working with firms that staff and manage foreign operations; |
|
|
• |
weaker protection for intellectual property and other legal rights than in the United States and practical difficulties in enforcing intellectual property and other rights outside of the United States; |
|
|
• |
adverse tax consequences; and |
|
|
• |
unstable regional economic and political conditions. |
In addition, our customers may require us to staff projects with only employed or domestically-based staff. That requirement could increase our cost of delivery, which in turn could decrease our competiveness and lower our overall profitability.
Any future litigation against us could be costly and time-consuming to defend and could have a material adverse effect on our business, financial condition and results of operations.
We may become subject, from time to time, to legal proceedings and claims that arise in the ordinary course of business such as claims brought by our customers in connection with commercial disputes or employment claims made by our current or former employees. Litigation might result in substantial costs and may divert management’s attention and resources, which might seriously harm our business, overall financial condition, and operating results. We generally intend to defend ourselves vigorously; however, we cannot be certain of the ultimate outcomes of any claims that may arise in the future. Insurance might not cover such claims, might not
22
provide sufficient payments to cover all the costs to resolve one or more such claims, and might not continue to be available on terms acceptable to us. A claim brought against us that is uninsured or underinsured could result in unanticipated costs, thereby reducing our operating results and leading analysts or potential investors to reduce their expectations of our performance, which could reduce the trading price of our stock. Additionally, certain litigation or the resolution of certain litigation may affect the availability or cost of some of our insurance coverage, which could adversely impact our results of operations and cash flows, expose us to increased risks that would be uninsured and adversely impact our ability to attract officers and directors.
We might be unable to adequately protect our intellectual property, and intellectual property claims against us could result in the loss of significant rights. Even if we are successful in enforcing our intellectual property rights, we may incur significant costs in doing so, which could have a material adverse effect on our business.
Our success depends in part upon our ability to protect our core technology and intellectual property. To accomplish this, we rely on a combination of intellectual property rights, including trademark, copyright, trade secret and other intellectual property rights, as well as customary contractual protections. Our intellectual property rights extend to our technologies and software applications. We also rely on intellectual property licensed from third parties. Our attempts to protect our intellectual property might be challenged by others or invalidated through administrative process or litigation. To the extent that our intellectual property and other proprietary rights are not adequately protected, third parties might gain access to our proprietary information, develop and market products or services similar to ours, or use trademarks similar to ours, each of which could materially harm our business.
From time to time, third parties have alleged, and may allege in the future that we have violated their intellectual property rights. If we are forced to defend ourselves against intellectual property infringement claims, regardless of the merit or ultimate result of such claims, we may face costly litigation, diversion of technical and management personnel, limitations on our ability to market or provide our products and services. As a result of any such dispute, we may have to:
|
|
• |
develop non-infringing technology; |
|
|
• |
pay damages or refund fees; |
|
|
• |
enter into or modify royalty or licensing agreements; |
|
|
• |
cease providing certain products or services; or |
|
|
• |
take other actions to resolve the claims. |
Moreover, if we are unable to implement one or more of the remedial actions described above, we may be prevented from continuing to offer, and our customers may be prevented from continuing to use, any of our affected products or services.
The use of open source software in our products and solutions may expose us to additional risks and harm our intellectual property rights.
Some of our products and solutions use or incorporate software that is subject to one or more open source licenses. Open source software is typically freely accessible, usable, and modifiable. Certain open source software licenses require a user who intends to distribute the open source software as a component of the user’s software to disclose publicly part or all of the source code to the user’s software. In addition, certain open source software licenses require the user of such software to make any derivative works of the open source code available to others on potentially unfavorable terms or at no cost.
The terms of many open source licenses to which we are subject have not been interpreted by United States or foreign courts. Accordingly, there is a risk that those licenses could be construed in a manner that imposes unanticipated conditions or restrictions on our ability to commercialize our solutions. In that event, we could be required to seek licenses from third parties in order to continue offering our products or solutions, to re-develop our products or solutions, to discontinue sales of our products or solutions, or to release our proprietary software code under the terms of an open source license, any of which could harm our business. Further, given the nature of open source software, it may be more likely that third parties might assert copyright and other intellectual property infringement claims against us based on our use of these open source software programs.
While we monitor the use of all open source software in our products, solutions, processes, and technology and try to ensure that no open source software is used in such a way as to require us to disclose the source code to the related product or solution when we do not wish to do so, it is possible that such use may have inadvertently occurred in deploying our proprietary solutions. In addition, if a third-party software provider has incorporated certain types of open source software into software we license from such third party for our products and solutions without our knowledge, we could, under certain circumstances, be required to disclose the source code to our products and solutions. This could harm our intellectual property position and our business, results of operations, and financial condition.
23
Our confidentiality arrangements with employees and others may not adequately prevent disclosure of trade secrets and other proprietary information, and any such disclosure could have a material adverse effect on our business.
We have devoted substantial resources to the development of our technology, business operations and business plans. In order to protect our trade secrets and proprietary information, we rely in significant part on confidentiality arrangements with our employees, independent contractors, advisers and customers. These arrangements may not be effective to prevent disclosure of confidential information, including trade secrets, and may not provide an adequate remedy in the event of unauthorized disclosure of confidential information. In addition, others may independently discover trade secrets and proprietary information, and in such cases we would not be able to assert trade secret rights against such parties. The loss of trade secret protection could make it easier for third parties to compete with our products and services by copying functionality. In addition, any changes in, or unexpected interpretations of, the trade secret and other intellectual property laws may compromise our ability to enforce our trade secret and intellectual property rights. Costly and time-consuming litigation could be necessary to enforce and determine the scope of our proprietary rights, and failure to obtain or maintain trade secret protection could have a material adverse effect on our business.
If we acquire companies or technologies in the future, they could prove difficult to integrate, disrupt our business, dilute stockholder value, and adversely affect our operating results and the value of our common stock.
As part of our business strategy, we might acquire, enter into joint ventures with, or make investments in complementary companies, services, and technologies in the future. These investments involve numerous risks, including:
|
|
• |
difficulties in identifying and acquiring products, technologies or businesses that will help our business; |
|
|
• |
difficulties in integrating operations, technologies, services and personnel; |
|
|
• |
diversion of financial and managerial resources from existing operations; |
|
|
• |
risk of entering new markets in which we have little to no experience; and |
|
|
• |
delays in customer purchases due to uncertainty and the inability to maintain relationships with customers of the acquired businesses. |
If we fail to properly evaluate acquisitions or investments, we might not achieve the anticipated benefits of any such acquisitions, we might incur costs in excess of what we anticipate, and management resources and attention might be diverted from other necessary or valuable activities, which would have a material adverse effect on our business and results of operations.
Consolidation in the health insurance industry in which our customers operate could cause us to lose customers or could reduce the volume of services purchased by consolidated customers following an acquisition or merger, which could have a material adverse effect on our business.
Consolidation in the health insurance industry has accelerated in recent years, and this trend could continue. We may lose customers due to industry consolidation, and we may not be able to expand sales of our solutions and services to new customers to replace lost customers. In addition, new companies or organizations that result from such consolidation may decide that our solutions are no longer needed because of their own internal processes or the use of alternative solutions. As these entities consolidate, competition to provide solutions and services to industry participants will become more intense and the importance of establishing relationships with large industry participants will become greater. These industry participants may try to use their market power to negotiate price reductions for our solutions. Also, if consolidation of larger current customers occurs, the combined company may represent a larger percentage of business for us and, as a result, we are likely to rely more significantly on the combined company’s revenue to achieve growth. As a result, industry consolidation or consolidation among current customers or potential customers could adversely affect our business.
We depend on our senior management team and other key employees, and the loss of one or more key personnel or an inability to attract hire, integrate and retain highly skilled personnel could adversely affect our business.
Our success depends largely upon the continued services of key personnel. We also rely on our leadership team in the areas of research and development, marketing, services, and general and administrative functions, and on mission-critical individual contributors in research and development. From time to time, there may be changes in our executive management team resulting from the hiring or departure of executives, which could disrupt our business. The loss of one or more of our executive officers or other key employees could have a serious adverse effect on our business. The replacement of one or more of our executive officers or other key employees would involve significant time and expense and may significantly delay or prevent the achievement of our business objectives.
To continue to execute our strategy, we also must identify, hire and retain highly skilled personnel. Competition is intense for engineers with high levels of experience in designing and developing software and Internet-related services. We might not be successful in maintaining our unique culture and continuing to attract and retain qualified personnel. We have from time to time in the past experienced, and we expect to continue to experience in the future, difficulty in hiring and retaining highly skilled personnel with
24
appropriate qualifications. The pool of qualified personnel is limited overall and specifically in the geographic regions in which our principal offices are located. Failure to identify, hire and retain necessary key personnel could have a material adverse effect on our business, financial condition and results of operations.
Consumers of health insurance are increasingly relying on mobile devices as part of their decision-making process. If we are unsuccessful in expanding the capabilities of our shopping tools for mobile platforms, it could adversely affect our business.
We believe that consumers of health insurance are increasingly relying on mobile devices, such as smartphones and tablets, in connection with their health insurance purchasing decisions. Traditionally, our solutions have been designed for desktop platforms, and we must develop new capabilities to deliver compelling user experiences via mobile devices. To deliver high quality mobile offerings, it is important that our solutions integrate with a wide range of other mobile technologies, systems, networks and standards that we do not control. We may not be successful in developing products that operate effectively with these technologies, systems, networks or standards. Further, our success on mobile platforms will be dependent on our interoperability with popular mobile operating systems that we do not control, such as Android, iOS and Windows Mobile, and any change in such systems that degrade our functionality or give preferential treatment to competitive products could adversely affect usage of our solutions through mobile devices. If we fail to achieve success with our mobile offerings, our ability to deliver compelling user experiences to consumers as they increasingly rely on mobile devices in connection with their health insurance purchasing decisions will be constrained and our business could be adversely affected.
If we cannot maintain or enhance our corporate culture, we could lose the innovation, teamwork, passion and focus on execution that we believe contribute to our success, which could have a material adverse effect on our business.
We believe that a critical component to our business has been our corporate culture. We have invested substantial time and resources in building our team. We may find it difficult to maintain the innovation, teamwork, passion and focus on execution that we believe are important aspects of our corporate culture. Failure to enhance or preserve our culture could negatively affect our future success, including our ability to retain and recruit personnel and to effectively focus on and pursue our corporate objectives.
Failure by our customers to obtain proper permissions and waivers might result in claims against us or may limit or prevent our use of data, which could have a material adverse effect on our business.
We require our customers to provide necessary notices and to obtain necessary permissions and waivers for use and disclosure of information on our platform, and we require contractual assurances from them that they have done so and will do so. If, however, despite these requirements and contractual obligations, our customers do not obtain necessary permissions and waivers, then our use and disclosure of information that we receive from them or on their behalf might be limited or prohibited by state or federal privacy laws or other laws. This could impair our functions, processes and databases that reflect, contain, or are based upon such data and might prevent use of such data. In addition, this could interfere with, or prevent creation or use of, rules, analyses, or other data-driven activities that benefit us and our business. Moreover, we might be subject to claims or liability for use or disclosure of information by reason of lack of valid notices, agreements, permissions or waivers. These claims or liabilities could subject us to unexpected costs and adversely affect our operating results.
If we are required to collect sales and use taxes in additional jurisdictions, we might be subject to liability for additional sales and use taxes and our future sales may decrease.
We might incur significant expenses, and, as a result, lose sales, if states successfully impose broader guidelines on state sales and use taxes or successfully argue that current guidelines apply to us. A successful assertion by one or more states requiring us to collect sales or other taxes on the licensing of our software or sale of our services could result in substantial tax liabilities for past transactions and otherwise harm our business. Each state has different rules and regulations governing sales and use taxes, and these rules and regulations are subject to varying interpretations that change over time. We review these rules and regulations periodically and, when we believe we are subject to sales and use taxes in a particular state, voluntarily engage with state tax authorities in order to determine how to comply with their rules and regulations. We cannot assure you that we will not be subject to sales and use taxes or related interest and penalties for past sales or use taxes in states where we currently believe no such taxes are required.
Vendors of services, like us, are typically held responsible by taxing authorities for the collection and payment of any applicable sales and similar taxes. If one or more taxing authorities determines that taxes should have, but have not, been paid with respect to our services, we might be liable for past taxes in addition to taxes going forward. Liability for past taxes might also include substantial interest and penalty charges. Our customer contracts typically provide that our customers must pay all applicable sales and similar taxes. Nevertheless, our customers might be reluctant to pay back taxes and might refuse responsibility for interest or penalties associated with those taxes. If we are required to collect and pay back taxes and the associated interest and penalties, and if our customers fail or refuse to reimburse us for all or a portion of these amounts (or if we decline to seek reimbursement from our clients), we will incur unplanned expenses that may be substantial. Moreover, imposition of such taxes on us going forward will effectively
25
increase the cost of our software and services to our customers and might adversely affect our ability to retain existing customers or to gain new customers in the areas in which such taxes are imposed.
Risks Related to Regulation
The healthcare and health insurance industries are heavily regulated. Our failure to comply with regulatory requirements could create liability for us, result in adverse publicity and negatively affect our business.
The healthcare and health insurance industries are highly regulated and are subject to changing political, legislative, regulatory, and other influences. Existing and new laws and regulations could create unexpected liabilities for us, cause us to incur additional costs and restrict our operations. These laws and regulations are complex and their application to specific services and relationships are not always clear. In particular, many existing laws and regulations affecting healthcare and health insurance and related benefits or products when enacted, did not anticipate the services that we provide, and these laws and regulations might be applied to our services in ways that we do not anticipate. Our failure to accurately anticipate the application of these laws and regulations, or our failure to comply, could require us to change our operations or cease using certain datasets, create liability for us, result in adverse publicity, and negatively affect our business. Some of the risks we face from the regulation of healthcare and health insurance are as follows:
|
|
• |
Patient Protection and Affordable Care Act. The current United States Congress and executive administration has made and may make additional changes to aspects of the PPACA or replace it entirely. For example, the Tax Cuts and Jobs Act of 2017 has removed the individual mandate and associated individual tax penalties of the PPACA. Such changes, or the uncertainty and instability in the market that may arise from the possibility of such changes, in turn may affect our business. Additionally, numerous lawsuits have challenged and continue to challenge the constitutionality and other aspects of the PPACA, and regulations and regulatory guidance continue to be issued or modified on various aspects of the PPACA. While many of the provisions of the PPACA are not directly applicable to us, the PPACA, as enacted, affects the business of many of our customers. Our customers have experienced changes in the numbers of individuals they insure as a result of Medicaid expansion and the creation of state and national exchanges and may experience additional changes if provisions related to the PPACA, including Medicaid expansion, are altered as a result of administrative changes or a repeal and replacement of the PPACA. Although we are unable to predict with any reasonable certainty or otherwise quantify the likely impact of efforts to modify or repeal the PPACA, including the market uncertainty and instability that may result from such efforts, on our business model, financial condition, or results of operations, changes in the business of our customers and the number of individuals they insure may negatively impact our business. |
|
|
• |
HIPAA and Other Privacy and Security Requirements. There are numerous federal and state laws and regulations related to the privacy and security of personal health information. In particular, regulations promulgated pursuant to the Health Insurance Portability and Accountability Act of 1996, or HIPAA, established privacy and security standards, or Privacy Standards and Security Standards, that limit the use and disclosure of individually identifiable health information, and require the implementation of administrative, physical, and technological safeguards to ensure the confidentiality, integrity, and availability of individually identifiable health information in electronic form. Health plans, healthcare clearinghouses, and most providers are considered by the HIPAA regulations to be “Covered Entities.” With respect to our operations, we are a Business Associate of our health plan customers and we are directly subject to the privacy and security regulations established under HIPAA. We enter into written Business Associate Agreements with our health plan customers, under which we are required to safeguard individually identifiable health information and comply with restrictions how we may use and disclose such information. Effective February 2010, the American Recovery and Reinvestment Act of 2009, or ARRA, and effective March 2013, the HIPAA Omnibus Final Rules extended the direct application of certain provisions of the Privacy Standards and Security Standards to Business Associates. ARRA and the HIPAA Omnibus Final Rule also subject Business Associates to direct oversight and audit by the HHS. |
Violations of the Privacy Standards and Security Standards might result in civil and criminal penalties, and ARRA increased the penalties for HIPAA violations and strengthened the enforcement provisions of HIPAA. For example, ARRA authorizes state attorneys general to bring civil actions seeking either injunctions or damages in response to violations of Privacy Standards and Security Standards that threaten the privacy of state residents. Additionally, some health plans interpret HIPAA requirements differently than we do, and as our customers are the Covered Entity under HIPAA we may be required to comply with their interpretations.
We might not be able to adequately address the business risks created by HIPAA implementation. Furthermore, we are unable to predict what changes to HIPAA or other laws or regulations might be made in the future or how those changes could affect our business or the costs of compliance.
In addition to the Privacy Standards and Security Standards, most states have enacted patient confidentiality laws that protect against the disclosure of confidential medical and/or health information, and many states have adopted or are considering further legislation in this area, including privacy safeguards, security standards, and data security breach notification requirements. Such state laws, if more stringent than HIPAA requirements, are not preempted by the federal requirements and we are required to comply with them. Additionally, other laws or standards may apply to our operations,
26
including requirements related to handling certain financial information, federal tax information, or FTI, and payment card association operating rules with respect to credit card data.
Failure by us to comply with any state standards regarding patient privacy may subject us to penalties, including civil monetary penalties and, in some circumstances, criminal penalties. Such failure may injure our reputation and adversely affect our ability to retain customers and attract new customers.
|
|
• |
Insurance Broker Laws. Insurance laws in the United States are often complex, and states have broad authority to adopt regulations regarding brokerage activities. These regulations typically include the licensing of insurance brokers and agents and govern the handling and investment of customer funds held in a fiduciary capacity. We and our broker/agency customers may be subject to some of these regulations, and may not be able to fully comply. |
|
|
• |
Medicare and Medicaid Regulatory Requirements. We have contracts with health plans that offer Medicare Managed Care (also known as Medicare Advantage or Medicare Part C). We also have contracts with health plans that offer Medicare prescription drug benefits (also known as Medicare Part D) plans. The activities of the Medicare plans are regulated by CMS. Though our health plan customers remain responsible to comply with CMS requirements, we operate as a First Tier, Downstream & Related Entity, or FDR, in support of our customers. Some of the activities that we might perform, such as the enrollment of beneficiaries, may be subject to CMS and/or state regulation, and such regulations may force us to change the way we do business or otherwise restrict our ability to provide services to such plans. Moreover, the regulatory environment with respect to these programs has become, and will likely continue to become, increasingly complex. |
|
|
• |
Financial Services-Related Laws and Rules. Financial services and electronic payment processing services are subject to numerous laws, regulations and industry standards, some of which might impact our operations and subject us, our vendors, and our customers to liability as a result of the payment distribution and processing solutions we offer. In addition, payment distribution and processing solutions might be impacted by payment card association operating rules, certification requirements, and rules governing electronic funds transfers. If we fail to comply with applicable payment processing rules or requirements, we might be subject to fines and changes in transaction fees and may lose our ability to process credit and debit card transactions or facilitate other types of billing and payment solutions. Moreover, payment transactions processed using the Automated Clearing House Network, or ACH, are subject to network operating rules promulgated by the National Automated Clearing House Association and to various federal laws regarding such operations, including laws pertaining to electronic funds transfers, and these rules and laws might impact our billing and payment solutions. Further, our solutions might impact the ability of our payer customers to comply with state prompt payment laws. These laws require payers to pay healthcare claims meeting the statutory or regulatory definition of a “clean claim” within a specified time frame. |
|
|
• |
False or Fraudulent Claim Laws. There are numerous federal and state laws that forbid submission of false information or the failure to disclose information in connection with submission and payment of claims for reimbursement from the government. In some cases, these laws also forbid abuse of existing systems for such submission and payment. Any contract we have with a government entity or in support of a government entity requires us to comply with these laws and regulations. Any failure of our services to comply with these laws and regulations could result in substantial liability, including but not limited to criminal liability, could adversely affect demand for our services, and could force us to expend significant capital, research and development, and other resources to address the failure. Any determination by a court or regulatory agency that our services with government customers violate these laws and regulations could subject us to civil or criminal penalties, invalidate all or portions of some of our government customer contracts, require us to change or terminate some portions of our business, require us to refund portions of our services fees, cause us to be disqualified from serving not only government customers but also all customers doing business with government payers, and have an adverse effect on our business. |
|
|
• |
ERISA. The Employee Retirement Income Security Act of 1974, as amended, or ERISA, regulates how employee benefits are provided to or through certain types of employer-sponsored health benefits plans. ERISA is a set of laws and regulations that is subject to periodic interpretation by the United States Department of Labor as well as the federal courts. In some circumstances, and under certain customer contracts, we might be deemed to have assumed duties that make us an ERISA fiduciary, and thus be required to carry out our operations in a manner that complies with ERISA in all material respects. Our current operations may render us subject to ERISA fiduciary obligations, and while we believe we are in compliance with ERISA and that any such compliance does not currently have a material adverse effect on our operations, there can be no assurance that continuing ERISA compliance efforts or any future changes to ERISA will not have a material adverse effect on us. |
|
|
• |
Third-Party Administrator Laws. Numerous states in which we do business have adopted regulations governing entities engaged in third-party administrator, or TPA, activities. TPA regulations typically impose requirements regarding enrollment into benefits plans, claims processing and payments, and the handling of customer funds. Additions to our service offerings and/or changes in state regulations could result in us being obligated to comply with such regulations, which might require us to obtain licenses to provide TPA services in such states. |
27
The growth in the Medicare plan market is important to the overall growth rate of our business. The marketing and sale of Medicare plans are subject to numerous, complex and frequently changing laws and regulations, and the impact of changes in laws related to Medicare or any failure to comply with them could harm our business, results of operations and financial condition.
The number of people eligible for Medicare is one of the most significant drivers in the growth of Medicare plans. Any changes in the eligibility requirements for Medicare such as raising the age of eligibility would decrease the available pool of recipients and lower our growth expectations.
The marketing and sale of Medicare plans are subject to numerous laws, regulations and guidelines at both the Federal and state level. The marketing and sale of Medicare Advantage and Medicare Part D prescription drug plans are principally regulated by CMS, which is a division of the United States Department of Health and Human Services, and the marketing and sale of Medicare supplement plans is principally regulated on a state- by- state basis by state departments of insurance. The laws and regulations applicable to the marketing and sale of Medicare plans lack clarity, are numerous and complex, were not drafted to contemplate health insurance exchanges, and change frequently, particularly with respect to regulations and guidance issued by CMS for Medicare Advantage and Medicare Part D prescription drug plans and by the various state departments of insurance for Medicare supplement plans.
As a result of these laws, regulations and guidelines, we have altered, and will need to continue to alter, our business operations and procedures to comply with these changing requirements. Though our health plan customers remain responsible to comply with CMS requirements, we operate as an FDR, in support of our customers. Changes to the laws, regulations and guidelines relating to Medicare plans, the scope of their application to our business, their interpretation by regulators or our health plan customers, or the manner in which they are enforced could be incompatible with our business model. As a result, our business could be slowed or we could be prevented from operating portions of our business altogether, either of which would materially harm our results of operations and financial condition, particularly if this occurred during the Medicare annual enrollment period, which is when the vast majority of Medicare plans are sold.
Health plans may adjust their commission rates to comply with regulatory guidelines, such as those published by CMS with respect to the marketing of Medicare Advantage and Medicare Part D prescription drug plans. If these contractual changes result in reduced commissions, our revenue may decline. Because insurance rates may vary between health plans, plans and enrollment dates, changes in enrollment mix may impact our commission revenue. Future changes in health plan pricing practices could harm our business, results of operations and financial condition.
In March 2010, the Federal government enacted significant reforms to healthcare legislation through the PPACA and the HCERA, which we refer to collectively as Healthcare Reform. In addition, one of the elements of the Budget Control Act of 2011 is the creation of a joint select committee on deficit reduction to develop recommendations, including changes to entitlement programs such as Medicare, to reduce the national debt by at least $1.5 trillion over 10 years. In connection with the United States Congress’s failure to agree on a proposal to lower the national deficit, the Budget Control Act mandates automatic cuts to domestic and defense spending, including a significant reduction in Medicare spending. The impact that Healthcare Reform and the Budget Control Act will have on the market for Medicare plans could change the demand for Medicare plans, the way these plans are delivered, or the commissions that health plans pay to us in connection with their sale or otherwise adversely impact us. Likewise, efforts to modify or repeal PPACA, and the resulting uncertainty within the market as such efforts are contemplated, could alter the market for Medicare plans in a manner that adversely affects our business and operations.
In the event that these laws and regulations or changes in these laws and regulations, or other laws and regulations that impact the marketing and sale of Medicare plans, adversely impact our ability or our customers’ ability to market any type of Medicare plan on an exchange platform or the commissions that we receive for selling these plans, our business, results of operations and financial condition would be harmed.
Additional regulatory requirements placed on our software, services, and content could impose increased costs on us, delay or prevent our introduction of new service types, and impair the function or value of our existing service types.
Our products and services are and are likely to continue to be subject to increasing regulatory requirements in a number of ways. As these requirements proliferate, we must change or adapt our products and services to comply. Changing regulatory requirements might render our services obsolete or might prevent us from pursuing our business objectives or developing new services. This might in turn impose additional costs upon us to comply or to further develop our products and services. It might also make introduction of new product or service types costlier or more time-consuming than we currently anticipate. It might even prevent introduction by us of new products or services or cause the continuation of our existing products or services to become unprofitable or impossible.
28
Potential government subsidy of services similar to ours, or creation of a single-payer system, might reduce customer demand.
Entities including brokers and United States federal and state governments have offered to subsidize adoption of online benefits platforms or clearinghouses. In addition, prior proposals regarding healthcare reform have included the concept of creation of a single payer for health insurance. This kind of consolidation of critical benefits activity could negatively impact the demand for our services.
Risks Related to Ownership of Our Common Stock
As noted above, if the Merger is not completed for any reason or we do not enter into an alternative transaction, we expect that management will operate our business in a manner similar to that in which it is being operated today. Therefore, in addition to the specific risks with respect to the Merger and our business, our stockholders would also continue to be subject to the following risks related to ownership of our common stock.
As a result of the quoting of our common stock on the OTCQX US Market (“OTCQX”), the liquidity of our common stock and our ability to raise additional capital may be impaired, which could adversely affect our business, financial condition and results of operations.
On October 30, 2017, we filed a Form 25 with the Securities and Exchange Commission to effect the voluntary withdrawal of our common stock from The Nasdaq Global Market. In connection with the withdrawal, we secured approval from OTC Markets, Inc. so that our common stock could be quoted on the OTCQX US Market under its current trading symbol “CNXR” beginning on October 31, 2017. As previously disclosed, we received notices from Nasdaq that we were not in compliance with the $15 million minimum market value of publicly held shares continued listing standard, as required by Nasdaq Listing Rule 5450(b)(2)(C), and the minimum bid price of $1 per share continued listing standard, as set forth in Nasdaq Listing Rule 5450(a)(1). If our stock were to have remained on The Nasdaq Global Market without regaining compliance with such Nasdaq Listing Rules by October 31, 2017 and November 27, 2017, respectively, our common stock would have been subject to delisting. Our Board of Directors approved the voluntary withdrawal of our common stock from listing on The Nasdaq Global Market as a result of its assessment of the probability of regaining compliance with the Nasdaq Listing Rules, our common stock’s then-current trading volume and price, and the costs of seeking to maintain eligibility to list our common stock on The Nasdaq Global Market.
Having our common stock quoted on the OTCQX, rather than The Nasdaq Global Market or another securities exchange, could adversely affect our ability to attract new investors, decrease the liquidity of our outstanding shares of common stock, reduce our flexibility to raise additional capital, reduce the price at which our common stock trades, and increase the transaction costs inherent in trading such shares with overall negative effects for our stockholders. In addition, it could deter broker-dealers from making a market in or otherwise seeking or generating interest in our common stock and might deter certain institutions and persons from investing in our securities at all. We may also face other material adverse consequences as a result of no longer being listed on a national securities exchange, such as negative publicity, diminished investor and/or employee confidence, and the loss of business development opportunities. In addition, if we are unable to maintain compliance with the continued quotation standards of the OTCQX, we may be required to transfer the quotation of our common stock to another over-the-counter market, which may result in a further decrease in the trading price and liquidity of our common stock.
Our stock price may be volatile and trading may be sporadic, which could depress the market price of our common stock and make it difficult for our stockholders to resell their shares.
The trading price of our common stock may be highly volatile and could be subject to wide fluctuations in response to various factors, including the risk factors described in this “Risk Factors” section and elsewhere in this Annual Report on Form 10-K and other factors which are beyond our control. These factors include:
|
|
• |
our operating performance and the operating performance of similar companies; |
|
|
• |
the overall performance of the equity markets; |
|
|
• |
announcements by us or our competitors of acquisitions, business plans, or commercial relationships; |
|
|
• |
threatened or actual litigation; |
|
|
• |
changes in laws or regulations relating to the sale of health insurance, including market conditions for health plans; |
|
|
• |
any major change in our Board of Directors or management; |
|
|
• |
the significant ownership position controlled by a limited number of stockholders; |
|
|
• |
publication of research reports or news stories about us, our competitors, or our industry, or positive or negative recommendations or withdrawal of research coverage by securities analysts; |
29
|
|
• |
general political and economic conditions. |
In addition, because our common stock is quoted on the OTCQX and not on a national securities exchange, trading in our common stock may be sporadic and characterized by wide fluctuations in trading prices. This volatility and sporadic trading could depress the market price of our common stock for reasons unrelated or disproportionate to our operating performance and make it more difficult for our stockholders to resell their shares. Securities class action litigation has often been instituted against companies following periods of volatility in the overall market and in the market price of a company’s securities. With the decrease in the trading price of our common stock, we may face increased risk of this litigation, which if instituted against us, could result in substantial costs, divert our management’s attention and resources, and harm our business, operating results, and financial condition.
Francisco Partners controls a majority of our voting securities, which may limit the ability of our stockholders to influence corporate matters and may give rise to conflicts of interest.
On May 2, 2016, we completed the sale of 52,000 shares of our Series A Preferred Stock (the “Series A Financing”) pursuant to an Investment Agreement, dated March 11, 2016, as amended, by and among the Company, Francisco Partners IV, L.P. and Francisco Partners IV-A, L.P. (together, “Francisco Partners”) and Chrysalis Ventures II, L.P. (“Chrysalis”). As of December 31, 2016, Francisco Partners beneficially owned approximately 43% of our outstanding capital stock on an as-converted basis by virtue of its ownership of shares of our Series A Preferred Stock and shares of our common stock it purchased in market transactions. On March 10, 2017, we completed the sale of 17,500 shares of our Series B Preferred Stock (the “Series B Financing”) pursuant to an Investment Agreement, dated March 10, 2017, by and among the Company, Francisco Partners and Chrysalis. As a result of that purchase, Francisco Partners owned, as of the closing of the Series B Financing, approximately 56% of our outstanding capital stock on an as-converted basis. Subject to certain protective provisions applicable to our Preferred Stock, shares of our outstanding common stock, Series A Preferred Stock and Series B Preferred Stock vote together on an as-converted basis, meaning that Francisco Partners controlled approximately 56% of our voting securities as of March 10, 2017. As of December 31, 2017, Francisco Partners held approximately 57% of our voting securities on an as-converted basis.
In addition, under the terms of the Investor Rights Agreement entered into with Francisco Partners in connection with the closing of the Series B Financing, for so long as Francisco Partners owns at least 10% of the aggregate shares of our Series B Preferred Stock, Series A Preferred Stock and common stock that it held as of March 10, 2017, it can: (i) for so long as it holds at least 5% of our aggregate outstanding securities (on an as-converted basis), designate a proportionate share of our Board of Directors based upon its percentage ownership of our outstanding securities on an as-converted basis, rounded up to the nearest whole director, which designees are entitled to serve on each committee of the Board, subject to applicable legal and OTCQX requirements, and (ii) if no director designated by Francisco Partners is serving on the Board, designate one Board observer. As of the closing of the Series B Financing, Francisco Partners had one designee serving on our Board of Directors and one vacancy existed, which vacancy will be filled by Francisco Partners.
Francisco Partners, as the controlling shareholder of both our Series A Preferred Stock and our Series B Preferred Stock, also must consent before we take certain corporate actions, including:
|
|
• |
amending our organizational documents in a manner that would have an adverse effect on the Series A Preferred Stock or Series B Preferred Stock; |
|
|
• |
issuing securities that are senior to, or equal in priority with, the Series A Preferred Stock or Series B Preferred Stock; and |
|
|
• |
incurring indebtedness other than in the ordinary course of business or from our existing senior secured lender, Wells Fargo, up to the maximum amount authorized as of March 10, 2017. |
Accordingly, Francisco Partners may be able to exert significant influence over us and any action requiring the approval of the holders of our common stock, including the election of directors, the amendment of our amended and restated certificate of incorporation and amended and restated bylaws and the approval of mergers or other business combination transactions. Furthermore, the interests of Francisco Partners may not be aligned with our other stockholders, which could lead to actions that may not be in the best interests of our other stockholders. Francisco Partners and its affiliates are in the business of making or advising on investments in companies, including businesses that may directly or indirectly compete with certain portions of our business, and they may have interests that diverge from, or even conflict with, those of our other stockholders. They may also pursue acquisition opportunities that may be complementary to our business, and, as a result, those acquisition opportunities may not be available to us. In addition, Francisco Partner’s significant ownership in us may discourage, delay or prevent a third party from making a significant equity investment in us, or could discourage, delay or prevent transactions involving a change in control, including transactions in which our stockholders might otherwise receive a premium for their shares over the then-current market price. Likewise, Francisco Partners’ ability to prevent our acceptance of any senior equity or indebtedness other than in the ordinary course of business or from Wells Fargo under our existing credit facility, may make it more difficult for us to secure additional capital in the future if needed, which could significantly limit our ability to continue to support our business and to respond to business challenges.
30
In addition, as of December 31, 2017, Chrysalis beneficially owned approximately 11% of our outstanding capital stock on an as-converted basis, which includes shares of our common stock, Series A Preferred Stock and Series B Preferred Stock. Chrysalis has a representative, David A. Jones, Jr., that serves on our Board of Directors as Chairman of the Board of Directors. Collectively, as of December 31, 2017, our directors, executive officers, and their affiliated entities beneficially owned approximately 70% of our outstanding capital stock on an as-converted basis. These stockholders, if they act together, could exert substantial influence over matters requiring approval by our stockholders, including the amendment of our amended and restated certificate of incorporation and amended and restated bylaws, and the approval of mergers or other business combination transactions, which may further discourage, delay or prevent a third party from making a significant equity investment in us, or could discourage, delay or prevent transactions involving a change in control, including transactions in which our stockholders might otherwise receive a premium for their shares over the then-current market price. Furthermore, as a result of the concentration in ownership of our securities, our common stock may be less attractive to some investors or otherwise harmed. If some investors find our common stock less attractive as a result, there may be a less active trading market for our common stock and our stock price may be more volatile.
The issuance of shares of our Series A Preferred Stock and Series B Preferred Stock reduces the relative voting power of holders of our common stock, dilutes the ownership of such holders and may adversely affect the market price of our common stock.
Holders of Series A Preferred Stock are entitled to a cumulative dividend at the rate of 7.5% per annum (subject to adjustment), payable quarterly in arrears. The dividends are to be paid in-kind, through an increase in the number of shares of common stock into which shares of Series A Preferred Stock are convertible, through at least May 2, 2018, and thereafter in cash or in-kind at our option. Upon the occurrence of certain events, the dividend rate will increase. Holders of Series B Preferred Stock are entitled to a cumulative dividend at the rate of 15% per annum (subject to adjustment), payable quarterly in arrears. The dividends are to be paid in-kind, through an increase in the number of shares of common stock into which shares of Series B Preferred Stock are convertible, through at least March 10, 2019, and thereafter in cash or in-kind at our option. Upon the occurrence of certain events, the dividend rate will increase.
As of the closing of the Series B Financing, the outstanding shares of Series B Preferred Stock represented approximately 20% of our outstanding capital stock, on an as-converted basis and the outstanding shares of Series A Preferred Stock represented approximately 31% of our outstanding capital stock, on an as-converted basis (which includes the effect of an adjustment to the conversion ratio of the Series A Preferred Stock that occurred as a result of the Series B Financing and pursuant to the terms of the Series A Preferred Stock). Francisco Partners holds approximately 95% of such shares of Preferred Stock as of the closing of the Series B Financing. As holders of our Preferred Stock are entitled to vote, on an as-converted basis, together with holders of our common stock on all matters submitted to a vote of the holders of our common stock, the issuance of the Preferred Stock, and the subsequent increase in the number of shares of common stock issuable upon conversion of the Preferred Stock through the payment of dividends, effectively reduces the relative voting power of the holders of our common stock.
In addition, the conversion of the Preferred Stock to common stock would dilute the ownership interest of existing holders of our common stock, and any sales in the public market of the common stock issuable upon conversion of the Preferred Stock could adversely affect prevailing market prices of our common stock. We granted the holders of the Preferred Stock customary registration rights in respect of their shares of Preferred Stock, and any shares of common stock issued upon conversion of the Preferred Stock. We registered all outstanding shares of Series A Preferred Stock and the number of shares of common stock into which such shares of Series A Preferred Stock may be convertible as of May 3, 2018 on a Registration Statement on Form S-3 that was declared effective by the SEC on September 23, 2016. We registered all outstanding shares of Series B Preferred Stock and the number of shares of common stock into which such shares of Series B Preferred Stock may be convertible as of March 10, 2019 on a Registration Statement on Form S-3 that was declared effective by the SEC on June 1, 2017. The registration statements for the Preferred Stock will facilitate the resale of such securities into the public market, and any such resale would increase the number of shares of our common stock available for public trading. Sales by the holders of our Preferred Stock in the public market, or the perception that such sales might occur, could have a material adverse effect on the price of our common stock.
Our Preferred Stock has rights, preferences and privileges that are not held by, and are preferential to, the rights of our common stockholders, which could adversely affect our liquidity and financial condition, and may result in the interests of the holders of our Preferred Stock differing from those of our common stockholders.
The holders of Preferred Stock have the right to receive a liquidation preference entitling them to be paid out of our assets available for distribution to stockholders before any payment may be made to holders of any other class or series of capital stock, an amount equal to the greater of the stated value of such holder’s shares of Preferred Stock or the amount that such holder would have been entitled to receive upon our liquidation, dissolution and winding up if all outstanding shares of such series of Preferred Stock had been converted into common stock immediately prior to such liquidation, dissolution or winding up, plus accrued but unpaid dividends.
In addition, dividends on the Series A Preferred Stock accrue and are cumulative at the rate of 7.5% per annum, payable quarterly in arrears and on the Series B Preferred Stock at the rate of 15% per annum, payable quarterly in arrears. Upon the
31
occurrence of certain events, the dividend rate for each series of Preferred Stock will increase. The dividends are to be paid in-kind, through an increase in the number of shares of common stock into which shares of Preferred Stock are convertible, until May 2, 2018 with respect to the Series A Preferred Stock and March 10, 2019 with respect to the Series B Preferred Stock, and thereafter in cash or in-kind at our option. The holders of our Preferred Stock also have certain redemption rights, including the right to require us to repurchase all or any portion of the Preferred Stock upon the occurrence of certain events.
These dividend and share repurchase obligations could impact our liquidity and reduce the amount of cash flows available for working capital, capital expenditures, growth opportunities, acquisitions, and other general corporate purposes. Our obligations to the holders of Preferred Stock, including the requirement that we obtain the consent of the holders of Series B Preferred Stock prior to incurring additional indebtedness other than in the ordinary course or pursuant to our current arrangements with Wells Fargo, could also limit our ability to obtain additional financing or increase our borrowing costs, which could have an adverse effect on our financial condition. The preferential rights could also result in divergent interests between the holders of shares of Preferred Stock and holders of our common stock. In addition to Ezra Perlman, who serves as a director at the designation of Francisco Partners, David A. Jones, Jr., the chairman of our Board of Directors, is affiliated with Chrysalis, which in addition to holding shares of our common stock, also holds shares of our Series A Preferred Stock and Series B Preferred Stock. Notwithstanding the fact that all directors are subject to fiduciary duties to us and to applicable law, the interests of the directors designated by Francisco Partners and of Mr. Jones may differ from the interests of our security holders as a whole or of our other directors.
If securities or industry analysts do not continue to publish research or reports about our business, or publish inaccurate or unfavorable research or reports about our business, our stock price and trading volume could decline.
The trading market for our common stock, to some extent, depends on the research and reports that securities or industry analysts publish about us and our business. We do not have any control over these analysts. As a result of the voluntary withdrawal of our common stock from The Nasdaq Global Market, analysts who have previously covered our company have ceased coverage of our company. If new analysts do not begin to cover our company, we could lose visibility in the financial markets, which could cause our stock price or trading volume to decline.
We do not currently intend to pay dividends on our common stock and, consequently, your ability to achieve a return on your investment will depend on appreciation in the price of our common stock.
We have never declared or paid any cash dividends on our common stock and do not currently intend to do so for the foreseeable future. We currently intend to invest our future earnings, if any, to fund our growth strategy. Therefore, you are not likely to receive any dividends on your common stock for the foreseeable future, and the success of an investment in shares of our common stock will depend upon future appreciation in its value, if any. There is no guarantee that shares of our common stock will appreciate in value or even maintain the price at which our stockholders purchased their shares.
Provisions in our amended and restated certificate of incorporation and amended and restated bylaws and Delaware law might discourage, delay, or prevent a change in control of our company or changes in our management and, therefore, depress the trading price of our common stock.
Provisions of our amended and restated certificate of incorporation and amended and restated bylaws and Delaware law might discourage, delay, or prevent a merger, acquisition, or other change in control that stockholders consider favorable, including transactions in which you might otherwise receive a premium for your shares of our common stock. These provisions might also prevent or frustrate attempts by our stockholders to replace or remove our management. These provisions include:
|
|
• |
limitations on the removal of directors; |
|
|
• |
advance notice requirements for stockholder proposals and nominations; |
|
|
• |
limitations on the ability of stockholders to call special meetings; |
|
|
• |
the inability of stockholders to cumulate votes at any election of directors; |
|
|
• |
the classification of our Board of Directors into three classes with only one class, representing approximately one-third of our directors, standing for election at each annual meeting; and |
|
|
• |
the ability of our Board of Directors to make, alter or repeal our amended and restated bylaws. |
Our Board of Directors has the ability to designate the terms of and issue new series of preferred stock without stockholder approval. In addition, Section 203 of the Delaware General Corporation Law prohibits a publicly held Delaware corporation from engaging in a business combination with an interested stockholder, generally a person which together with its affiliates owns, or within the last three years has owned, 15% of our voting stock, for a period of three years after the date of the transaction in which the person became an interested stockholder, unless the business combination is approved in a prescribed manner.
32
The existence of the foregoing provisions and anti-takeover measures could limit the price that investors are willing to pay in the future for shares of our common stock. They could also deter potential acquirers of our company, thereby reducing the likelihood that you could receive a premium for your common stock in an acquisition.
We currently qualify as an emerging growth company under the JOBS Act and we cannot be certain if the reduced disclosure requirements applicable to emerging growth companies will make our common stock less attractive to investors.
The JOBS Act permits “emerging growth companies” like us to take advantage of certain exemptions from various reporting requirements applicable to other public companies that are not emerging growth companies.
In addition, Section 107 of the JOBS Act also provides that an emerging growth company can take advantage of the exemption from complying with new or revised accounting standards provided in Section 7(a)(2)(B) of the Securities Act as long as we are an emerging growth company. An emerging growth company can therefore delay the adoption of certain accounting standards until those standards would otherwise apply to private companies.
For as long as we continue to be an emerging growth company, we intend to take advantage of certain other exemptions from various reporting requirements that are applicable to other public companies including, but not limited to, reduced disclosure obligations regarding executive compensation in our periodic reports and proxy statements, exemptions from the requirements of holding a nonbinding advisory vote on executive compensation and stockholder approval of any golden parachute payments not previously approved, and exemptions from the requirements of auditor attestation reports on the effectiveness of our internal control over financial reporting. We have elected to take advantage of the extended transition period for complying with new or revised accounting standards under Section 102(B)(1), which will allow us to delay the adoption of new or revised accounting standards that have different effective dates for public and private companies until those standards apply to private companies. As a result of this election, our financial statements may not be comparable to companies that comply with public company effective dates.
We cannot predict if investors will find our common stock less attractive because we will rely on these exemptions. If some investors find our common stock less attractive as a result, there may be a less active trading market for our common stock and our stock price may be more volatile.
We will remain an emerging growth company until the earlier of (1) the last day of the fiscal year (a) ending December 31, 2019, (b) in which we have total annual gross revenue of at least $1.07 billion, or (c) in which we become a large accelerated filer, which means that we have been public for at least 12 months, have filed at least one annual report and the market value of our common stock that is held by non-affiliates exceeds $700 million as of the last day of our then most recently completed second fiscal quarter, and (2) the date on which we have issued more than $1.0 billion in non-convertible debt during the prior three-year period.
None.
We are headquartered in Brookfield, Wisconsin, where we lease approximately 32,000 square feet of office space under a lease expiring in August 2022. We also lease office space in Chicago, Illinois, Atlanta, Georgia, Raleigh, North Carolina, Farmington, Connecticut, and Baltimore, Maryland. We believe our current and planned office facilities will be adequate for our needs for the foreseeable future.
For additional information regarding obligations under operating leases, see Note 8 of the Notes to Consolidated Financial Statements included in Part II, Item 8: “Financial Statements and Supplementary Data” of this Annual Report on Form 10-K.
From time to time, we may become involved in litigation related to claims arising from the ordinary course of our business. We believe that there are no claims or actions pending or threatened against us, the ultimate disposition of which would have a material adverse effect on us.
Not applicable.
33
|
Item 5. |
Market for Registrant’s Common Equity, Related Stockholder Matters and Issuer Purchases of Equity Securities |
Market Information
Our common stock was listed on the NASDAQ Global Market under the symbol “CNXR” from December 12, 2014 through October 30, 2017. On October 31, 2017 our common stock began to be quoted on the OTCQX US Market under its current trading symbol “CNXR”. Prior to December 12, 2014, there was no public trading market for our common stock. The following table sets forth the high and low intra-day sale prices per share of our common stock as reported for the respective periods on the NASDAQ Global Market and OTCQX US Market:
|
Year ended December 31, 2017 |
|
High |
|
|
Low |
|
||
|
Fourth Quarter |
|
$ |
0.72 |
|
|
$ |
0.10 |
|
|
Third Quarter |
|
|
1.08 |
|
|
|
0.48 |
|
|
Second Quarter |
|
|
1.17 |
|
|
|
0.53 |
|
|
First Quarter |
|
|
2.44 |
|
|
|
0.96 |
|
|
Year ended December 31, 2016 |
|
|
|
|
|
|
|
|
|
Fourth Quarter |
|
$ |
2.13 |
|
|
$ |
1.55 |
|
|
Third Quarter |
|
|
2.77 |
|
|
|
1.50 |
|
|
Second Quarter |
|
|
3.24 |
|
|
|
1.15 |
|
|
First Quarter |
|
|
3.90 |
|
|
|
1.72 |
|
On March 27, 2018, the last reported sale price of our common stock on quoted on the OTCQX US Market was $0.35 per share, and there were 24 holders of record of our common stock. The actual number of holders of common stock is greater than these numbers of record holders and includes stockholders who are beneficial owners, but whose shares are held in street name by brokers and nominees. The number of holders of record also does not include stockholders whose shares may be held in trust by other entities.
Dividend Policy
We have never declared or paid any cash dividends on our common stock. Neither Delaware law nor our amended and restated certificate of incorporation requires our board of directors to declare dividends on our common stock. Any future determination to declare cash dividends on our common stock will be made at the discretion of our board of directors and will depend on our financial condition, results of operations, capital requirements, general business conditions, covenants under our Senior Credit Facility, limitations imposed by the terms of our Preferred Stock, and other factors that our board of directors may deem relevant. We do not anticipate paying cash dividends on our common stock for the foreseeable future.
Equity Compensation Plan Information
We currently maintain three compensation plans that provide for the issuance of our Common Stock to officers and other employees, directors and consultants. These consist of the 2010 Stock Incentive Plan (the “2010 Stock Plan”), the 2014 Equity Incentive Plan (the “2014 Plan”) and the 2014 Employee Stock Purchase Plan (the “2014 Purchase Plan”), each of which has been approved by our stockholders. The following table sets forth information regarding outstanding options and shares reserved for future issuance under the foregoing plans as of December 31, 2017:
|
Plan Category |
|
Number of shares to be |
|
|
Weighted- |
|
|
Number of shares |
|
|||
|
Equity compensation plans approved by stockholders |
|
|
3,531,325 |
|
|
$ |
3.26 |
(1) |
|
|
1,174,512 |
(2) |
|
Equity compensation plans not approved by stockholders |
|
|
— |
|
|
|
— |
|
|
|
— |
|
|
Total |
|
|
3,531,325 |
|
|
|
|
|
|
|
1,174,512 |
(2) |
|
(1) |
The weighted average exercise price is calculated based solely on outstanding stock option units. It does not take into account the shares of our common stock underlying RSUs, which have no exercise price. |
34
|
outstanding on the immediately preceding December 31, or (ii) an amount determined by our board of directors. Our board of directors determined not to increase the number of shares reserved for issuance under the 2014 Plan on January 2, 2018. The reserve under the 2014 Plan also will be increased to include any shares subject to outstanding stock options under the 2010 Stock Plan at the time of its termination that are forfeited or lapse for any reason prior to exercise or settlement and would otherwise have returned to the share reserve under the 2010 Stock Plan. The 2014 Purchase Plan provides that the number of shares reserved for issuance under that plan will automatically increase on January 1, 2018 and each subsequent anniversary through 2024 equal to the smallest of (i) 100,000 shares, (ii) 0.25% of the issued and outstanding shares of our common stock on the immediately preceding December 31 or (iii) such other amount as may be determined by our board of directors. Our board determined not to increase the number of shares reserved for issuance under the 2014 Purchase Plan on January 1, 2018 and has suspended purchases under the 2014 Purchase Plan. |
Issuer Purchases of Equity Securities
Under our equity incentive plan, participants may satisfy the statutory minimum federal, state and local withholding tax obligation arising in connection with plan awards by electing to have the Company withhold shares of common stock otherwise issuable under the award. The following table provides information about such withholding, which is deemed an issuer repurchase, during the quarter ended December 31, 2017:
|
|
|
Total Number of |
|
|
Average Price Paid |
|
||
|
Period |
|
Shares Purchased (1) |
|
|
per Share |
|
||
|
10/1/2017 – 10/31/2017 |
|
|
2,021 |
|
|
$ |
0.64 |
|
|
11/1/2017 – 11/30/2017 |
|
|
2,021 |
|
|
$ |
0.23 |
|
|
12/1/2017 – 12/31/2017 |
|
|
2,021 |
|
|
$ |
0.13 |
|
|
Total |
|
|
6,063 |
|
|
$ |
0.33 |
|
|
(1) |
Represents shares of common stock delivered to us as payment of taxes on the vesting of restricted stock units under our equity incentive plan. |
Performance Graph
Notwithstanding any statement to the contrary in any of our filings with the SEC, the following information shall not be deemed “filed” with the SEC or “soliciting material” under the Securities Exchange Act of 1934 and shall not be incorporated by reference into any such filings irrespective of any general incorporation language contained in such filing.
35
The following graph compares the total cumulative stockholder return on our common stock with the total cumulative return of the S&P 500 Index and the S&P Software and Services Index during the period commencing on December 12, 2014, the initial trading day of our common stock, and ending on December 31, 2017. The graph assumes that $100 was invested at the beginning of the period in our common stock and in each of the comparative indices, and the reinvestment of any dividends. Historical stock price performance should not be relied upon as an indication of future stock price performance.
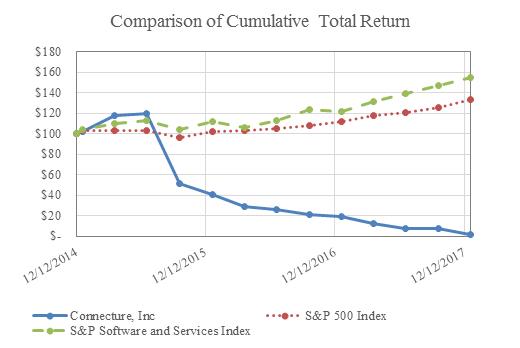
36
Selected Consolidated Financial and Other Data
The tables on the following pages set forth the consolidated financial and operating data as of and for the periods indicated. The consolidated statements of operations data presented below for the years ended December 31, 2017, 2016, and 2015, and the consolidated balance sheet data as of December 31, 2017 and 2016 have been derived from our audited consolidated financial statements contained with this annual report on Form 10-K. The selected consolidated statement of operations data for each of the years ended December 31, 2014 and 2013, and the selected consolidated balance sheet data as of December 31, 2015, 2014 and 2013, have been derived from our audited consolidated financial statements not included herein.
The following information should be read in conjunction with our consolidated financial statements and related notes, the sections titled “Risk Factors” and “Management’s Discussion and Analysis of Financial Condition and Results of Operations” and the other information included elsewhere in this Annual Report on Form 10-K. Our historical results should not be considered a reliable indicator of our future results of operations.
Consolidated Statements of Operations Data
|
|
|
Year Ended December 31, |
|
|||||||||||||||||
|
|
|
2017 |
|
|
2016 |
|
|
2015 |
|
|
2014 |
|
|
2013 |
|
|||||
|
|
|
(in thousands, except share and per share amounts) |
|
|||||||||||||||||
|
Consolidated Statements of Operations Data: |
|
|
|
|
|
|
|
|
|
|
|
|
|
|
|
|
|
|
|
|
|
Revenue |
|
$ |
76,746 |
|
|
$ |
81,894 |
|
|
$ |
95,847 |
|
|
$ |
84,579 |
|
|
$ |
58,326 |
|
|
Cost of Revenue (1) |
|
|
47,062 |
|
|
|
56,895 |
|
|
|
50,670 |
|
|
|
52,431 |
|
|
|
50,173 |
|
|
Gross Margin |
|
|
29,684 |
|
|
|
24,999 |
|
|
|
45,177 |
|
|
|
32,148 |
|
|
|
8,153 |
|
|
Operating Expenses: |
|
|
|
|
|
|
|
|
|
|
|
|
|
|
|
|
|
|
|
|
|
Research and Development (1) |
|
|
16,679 |
|
|
|
22,297 |
|
|
|
22,718 |
|
|
|
18,125 |
|
|
|
11,806 |
|
|
Sales and Marketing (1) |
|
|
9,356 |
|
|
|
10,410 |
|
|
|
9,507 |
|
|
|
7,729 |
|
|
|
6,800 |
|
|
General and Administrative (1) |
|
|
15,378 |
|
|
|
13,162 |
|
|
|
14,439 |
|
|
|
10,552 |
|
|
|
12,187 |
|
|
Total Operating Expenses |
|
|
41,413 |
|
|
|
45,869 |
|
|
|
46,664 |
|
|
|
36,406 |
|
|
|
30,793 |
|
|
Loss from Operations |
|
|
(11,729 |
) |
|
|
(20,870 |
) |
|
|
(1,487 |
) |
|
|
(4,258 |
) |
|
|
(22,640 |
) |
|
Other Expenses: |
|
|
|
|
|
|
|
|
|
|
|
|
|
|
|
|
|
|
|
|
|
Interest Expense |
|
|
3,286 |
|
|
|
3,485 |
|
|
|
5,665 |
|
|
|
5,937 |
|
|
|
4,644 |
|
|
Other Expense (Income), net |
|
|
509 |
|
|
|
2,239 |
|
|
|
140 |
|
|
|
(68 |
) |
|
|
- |
|
|
Loss before Income Taxes |
|
|
(15,524 |
) |
|
|
(26,594 |
) |
|
|
(7,292 |
) |
|
|
(10,127 |
) |
|
|
(27,284 |
) |
|
Income Tax (Provision) Benefit |
|
|
(20 |
) |
|
|
60 |
|
|
|
(51 |
) |
|
|
(33 |
) |
|
|
900 |
|
|
Net Loss |
|
$ |
(15,544 |
) |
|
$ |
(26,534 |
) |
|
$ |
(7,343 |
) |
|
$ |
(10,160 |
) |
|
$ |
(26,384 |
) |
|
Net loss per common share - basic and diluted |
|
$ |
(0.96 |
) |
|
$ |
(1.31 |
) |
|
$ |
(0.34 |
) |
|
$ |
(10.27 |
) |
|
$ |
(163.37 |
) |
|
Weighted Average Common Shares Outstanding - basic and diluted |
|
|
22,791,178 |
|
|
|
22,275,256 |
|
|
|
21,813,407 |
|
|
|
1,362,109 |
|
|
|
184,051 |
|
|
Other Financial Data: |
|
|
|
|
|
|
|
|
|
|
|
|
|
|
|
|
|
|
|
|
|
Adjusted gross margin (2) |
|
|
34,033 |
|
|
|
29,545 |
|
|
|
49,945 |
|
|
|
36,163 |
|
|
|
11,984 |
|
|
Adjusted EBITDA (3) |
|
|
(1,889 |
) |
|
|
(13,607 |
) |
|
|
8,268 |
|
|
|
1,328 |
|
|
|
(17,291 |
) |
|
(1) |
Cost of revenue and operating expenses include stock-based compensation expense as follows: |
|
|
|
Year Ended December 31, |
|
|||||||||||||||||
|
|
|
2017 |
|
|
2016 |
|
|
2015 |
|
|
2014 |
|
|
2013 |
|
|||||
|
|
|
(dollars in thousands) |
|
|||||||||||||||||
|
Cost of Revenue |
|
$ |
482 |
|
|
$ |
689 |
|
|
$ |
922 |
|
|
$ |
123 |
|
|
$ |
92 |
|
|
Research and Development |
|
|
172 |
|
|
|
422 |
|
|
|
1,379 |
|
|
|
78 |
|
|
|
55 |
|
|
Sales and Marketing |
|
|
187 |
|
|
|
243 |
|
|
|
518 |
|
|
|
32 |
|
|
|
34 |
|
|
General and Administrative |
|
|
1,386 |
|
|
|
1,308 |
|
|
|
1,893 |
|
|
|
1,203 |
|
|
|
458 |
|
37
|
(3) |
We defined adjusted EBITDA as net income (loss) before net interest, other expense, taxes, depreciation and amortization expense, adjusted to eliminate stock-based compensation, the merger transaction expense, the facility lease termination expense, and non-cash changes in fair value of contingent consideration and impairments of goodwill, intangible and long-lived assets, if any. See the section titled “Adjusted Gross Margin and Adjusted EBITDA” below for more information and for a reconciliation of adjusted EBITDA to EBITDA, the most directly comparable financial measure calculated and presented in accordance with GAAP. |
Our Segments
|
|
|
Year Ended December 31, |
|
|||||||||||||||||
|
|
|
2017 |
|
|
2016 |
|
|
2015 |
|
|
2014 |
|
|
2013 |
|
|||||
|
|
|
(dollars in thousands) |
|
|||||||||||||||||
|
Segment Statements of Operations Data |
|
|
|
|
|
|
|
|
|
|
|
|
|
|
|
|
|
|
|
|
|
Revenue |
|
|
|
|
|
|
|
|
|
|
|
|
|
|
|
|
|
|
|
|
|
Enterprise/Commercial |
|
$ |
40,187 |
|
|
$ |
49,081 |
|
|
$ |
55,487 |
|
|
$ |
40,369 |
|
|
$ |
33,028 |
|
|
Enterprise/State |
|
|
2,144 |
|
|
|
3,453 |
|
|
|
13,372 |
|
|
|
21,632 |
|
|
|
3,177 |
|
|
Medicare |
|
|
22,101 |
|
|
|
18,565 |
|
|
|
17,973 |
|
|
|
16,175 |
|
|
|
15,941 |
|
|
Private Exchange |
|
|
12,314 |
|
|
|
10,795 |
|
|
|
9,015 |
|
|
|
6,403 |
|
|
|
6,180 |
|
|
Total Revenue |
|
$ |
76,746 |
|
|
$ |
81,894 |
|
|
$ |
95,847 |
|
|
$ |
84,579 |
|
|
$ |
58,326 |
|
|
Gross Margin |
|
|
|
|
|
|
|
|
|
|
|
|
|
|
|
|
|
|
|
|
|
Enterprise/Commercial |
|
$ |
13,216 |
|
|
$ |
11,906 |
|
|
$ |
23,715 |
|
|
$ |
10,323 |
|
|
$ |
(747 |
) |
|
Enterprise/State |
|
|
1,469 |
|
|
|
1,325 |
|
|
|
6,300 |
|
|
|
11,038 |
|
|
|
(1,121 |
) |
|
Medicare |
|
|
14,872 |
|
|
|
11,460 |
|
|
|
10,651 |
|
|
|
9,451 |
|
|
|
7,839 |
|
|
Private Exchange |
|
|
127 |
|
|
|
308 |
|
|
|
4,511 |
|
|
|
1,336 |
|
|
|
2,182 |
|
|
Total Gross Margin |
|
$ |
29,684 |
|
|
$ |
24,999 |
|
|
$ |
45,177 |
|
|
$ |
32,148 |
|
|
$ |
8,153 |
|
Consolidated Balance Sheet Data
|
|
|
Year Ended December 31, |
|
|||||||||||||||||
|
|
|
2017 |
|
|
2016 |
|
|
2015 |
|
|
2014 |
|
|
2013 |
|
|||||
|
|
|
(dollars in thousands) |
|
|||||||||||||||||
|
Condensed Consolidated Balance Sheet Data |
|
|
|
|
|
|
|
|
|
|
|
|
|
|
|
|
|
|
|
|
|
Cash and cash equivalents |
|
$ |
7,743 |
|
|
$ |
6,208 |
|
|
$ |
5,424 |
|
|
$ |
28,252 |
|
|
$ |
2,277 |
|
|
Accounts receivable — net of allowances |
|
|
11,094 |
|
|
|
8,390 |
|
|
|
10,792 |
|
|
|
12,128 |
|
|
|
20,935 |
|
|
Total assets(1) |
|
|
83,078 |
|
|
|
82,488 |
|
|
|
82,689 |
|
|
|
111,390 |
|
|
|
93,202 |
|
|
Deferred revenue, total |
|
|
37,670 |
|
|
|
40,916 |
|
|
|
52,578 |
|
|
|
73,737 |
|
|
|
87,855 |
|
|
Capital lease obligations, total |
|
|
— |
|
|
|
34 |
|
|
|
140 |
|
|
|
567 |
|
|
|
975 |
|
|
Current maturities of long-term debt(2) |
|
|
32,616 |
|
|
|
578 |
|
|
|
1,441 |
|
|
|
4,479 |
|
|
|
5,431 |
|
|
Long-term debt(1) (2) |
|
|
— |
|
|
|
31,944 |
|
|
|
46,964 |
|
|
|
47,627 |
|
|
|
31,787 |
|
|
Total liabilities(1) |
|
|
85,163 |
|
|
|
87,978 |
|
|
|
113,869 |
|
|
|
140,231 |
|
|
|
149,511 |
|
|
Total redeemable preferred stock |
|
|
75,140 |
|
|
|
51,894 |
|
|
|
— |
|
|
|
— |
|
|
|
49,745 |
|
|
Common stock |
|
|
23 |
|
|
|
23 |
|
|
|
22 |
|
|
|
22 |
|
|
|
1 |
|
|
Additional paid-in capital |
|
|
97,723 |
|
|
|
101,985 |
|
|
|
101,546 |
|
|
|
96,365 |
|
|
|
9,013 |
|
|
Total stockholders' deficit |
|
|
(77,225 |
) |
|
|
(57,384 |
) |
|
|
(31,180 |
) |
|
|
(28,841 |
) |
|
|
(106,054 |
) |
|
(1) |
As of December 31, 2015, we early-adopted Accounting Standard No. 2015-03, Simplifying the Presentation of Debt Issuance Costs, issued by the Financial Accounting Standards Board in April 2015. The effect of the adoption on the Company’s consolidated balance sheet is a reduction in Other Assets and Long-Term Debt of $954 and $1,031 as of December 31, 2014, and 2013, respectively. |
38
|
to the date set forth above upon (i) an event of default under the Senior Credit Facility, (ii) termination of the Merger Agreement under certain circumstances and (iii) the consummation of the Merger or alternative acquisition as contemplated under the Merger Agreement. On March 29, 2018, we obtained a waiver of the requirement to deliver Audited Financial Statements for the fiscal 2017 year without a “going concern” emphasis of matter paragraph. Because of the foregoing amendment and waiver, we have classified our entire December 31, 2017 outstanding Senior Term Note as short-term, which reflects the Company’s conclusion that absent the consummation of the January 4, 2018 Merger Agreement or some other financing alternative before June 4, 2018, the Company could not meet the existing restrictive covenants of the Senior Term Note. |
Adjusted Gross Margin and Adjusted EBITDA
Within the Annual Report on Form 10-K, we use adjusted gross margin and adjusted earnings before interest, taxes, depreciation and amortization, or adjusted EBITDA, to provide investors with additional information regarding our financial results. Adjusted gross margin and adjusted EBITDA are non-GAAP financial measures. We have provided below reconciliations of these measures to the most directly comparable GAAP financial measures, which for adjusted gross margin is gross margin, and for adjusted EBITDA is net loss.
We have included adjusted gross margin and adjusted EBITDA in this filing because they are key measures used by our management and board of directors to understand and evaluate our core operating performance and trends, to prepare and approve our annual budget, and to develop short- and long-term operational plans. We believe the exclusion of non-cash charges such as depreciation, amortization, goodwill impairment charges, loss on facility lease termination and stock-based compensation, along with our one-time Merger transaction costs from adjusted EBITDA and adjusted gross margin allows us to have additional insight into the core operating performance of our business. The amount of such expenses in any specific period may not directly correlate with the underlying performance of our business operations during the period and such expenses can vary significantly between periods. The use of adjusted EBITDA and adjusted gross margin provides consistency and comparability with our past financial performance and facilitates period-to-period comparisons of operations that could otherwise be masked by the effect of the expenses that we exclude from these non-GAAP financial measures and facilitates comparisons with other peer companies, many of which use similar non-GAAP financial measures to supplement their GAAP results. Additionally, securities analysts use a measure similar to adjusted EBITDA and adjusted gross margin as supplemental measures to evaluate the overall operating performance and comparison of companies, and we anticipate that our investor and analyst presentations will continue to include these measures. Accordingly, we believe that adjusted gross margin and adjusted EBITDA provide useful information to investors and others in understanding and evaluating our operating results.
Our use of adjusted gross margin and adjusted EBITDA as analytical tools has limitations, and you should not consider them in isolation or as substitutes for analysis of our financial results as reported under GAAP. Some of these limitations are:
|
|
• |
although depreciation and amortization are non-cash charges, the assets being depreciated and amortized might have to be replaced in the future, and adjusted gross margin and adjusted EBITDA do not reflect cash capital expenditure requirements for such replacements or for new capital expenditure requirements; |
|
|
• |
although loss on facility lease termination is a non-cash charge, the liability recorded will require future cash to extinguish; |
|
|
• |
adjusted gross margin and adjusted EBITDA do not reflect changes in, or cash requirements for, our working capital needs; |
|
|
• |
adjusted gross margin and adjusted EBITDA do not reflect the potentially dilutive impact of stock-based compensation; |
|
|
• |
adjusted gross margin and adjusted EBITDA do not reflect interest or tax payments that could reduce the cash available to us; and |
|
|
• |
other companies, including companies in our industry, might calculate adjusted gross margin and adjusted EBITDA or similarly titled measures differently, which reduces their usefulness as comparative measures. |
39
Because of these and other limitations, you should consider adjusted gross margin and adjusted EBITDA alongside other GAAP-based financial performance measures, including various cash flow metrics, gross margin, net loss and our other GAAP financial results. The following table presents a reconciliation of adjusted gross margin to gross margin and adjusted EBITDA to net loss for each of the periods indicated:
|
|
|
Year Ended December 31, |
|
|||||||||||||||||
|
|
|
2017 |
|
|
2016 |
|
|
2015 |
|
|
2014 |
|
|
2013 |
|
|||||
|
|
|
(dollars in thousands) |
|
|||||||||||||||||
|
Reconciliation from Gross Margin to Adjusted Gross Margin |
|
|
|
|
|
|
|
|
|
|
|
|
|
|
|
|
|
|
|
|
|
Gross Margin |
|
$ |
29,684 |
|
|
$ |
24,999 |
|
|
$ |
45,177 |
|
|
$ |
32,148 |
|
|
$ |
8,153 |
|
|
Depreciation and amortization |
|
|
3,867 |
|
|
|
3,857 |
|
|
|
3,846 |
|
|
|
3,892 |
|
|
|
3,739 |
|
|
Stock-based compensation expense |
|
|
482 |
|
|
|
689 |
|
|
|
922 |
|
|
|
123 |
|
|
|
92 |
|
|
Adjusted Gross Margin |
|
$ |
34,033 |
|
|
$ |
29,545 |
|
|
$ |
49,945 |
|
|
$ |
36,163 |
|
|
$ |
11,984 |
|
|
Reconciliation from Net Loss to Adjusted EBITDA |
|
|
|
|
|
|
|
|
|
|
|
|
|
|
|
|
|
|
|
|
|
Net Loss |
|
$ |
(15,544 |
) |
|
$ |
(26,534 |
) |
|
$ |
(7,343 |
) |
|
$ |
(10,160 |
) |
|
$ |
(26,384 |
) |
|
Depreciation and amortization |
|
|
4,403 |
|
|
|
4,601 |
|
|
|
5,043 |
|
|
|
5,101 |
|
|
|
4,710 |
|
|
Interest expense |
|
|
3,286 |
|
|
|
3,485 |
|
|
|
5,665 |
|
|
|
5,937 |
|
|
|
4,644 |
|
|
Other expense (income), net |
|
|
509 |
|
|
|
2,239 |
|
|
|
140 |
|
|
|
(68 |
) |
|
|
— |
|
|
Income tax provision (benefit) |
|
|
20 |
|
|
|
(60 |
) |
|
|
51 |
|
|
|
33 |
|
|
|
(900 |
) |
|
Stock-based compensation expense |
|
|
2,227 |
|
|
|
2,662 |
|
|
|
4,712 |
|
|
|
1,436 |
|
|
|
639 |
|
|
Impairment of goodwill |
|
|
200 |
|
|
|
— |
|
|
|
— |
|
|
|
— |
|
|
|
— |
|
|
Loss on facility lease termination |
|
|
1,988 |
|
|
|
— |
|
|
|
— |
|
|
|
— |
|
|
|
— |
|
|
Fixed asset impairment expense |
|
|
63 |
|
|
|
— |
|
|
|
— |
|
|
|
— |
|
|
|
— |
|
|
Merger transaction expense |
|
|
959 |
|
|
|
— |
|
|
|
— |
|
|
|
— |
|
|
|
— |
|
|
Change in fair value of contingent consideration |
|
|
— |
|
|
|
— |
|
|
|
— |
|
|
|
(951 |
) |
|
|
— |
|
|
Total Net Adjustments |
|
$ |
13,655 |
|
|
$ |
12,927 |
|
|
$ |
15,611 |
|
|
$ |
11,488 |
|
|
$ |
9,093 |
|
|
Adjusted EBITDA |
|
$ |
(1,889 |
) |
|
$ |
(13,607 |
) |
|
$ |
8,268 |
|
|
$ |
1,328 |
|
|
$ |
(17,291 |
) |
40
The statements included herein that are not based solely on historical facts are “forward looking statements.” Such forward-looking statements are based on current expectations and assumptions that are subject to risks and uncertainties. Our actual results could differ materially from those anticipated by us in these forward-looking statements as a result of various factors, including those discussed below and elsewhere in this Annual Report on Form 10-K, particularly under the section titled “Risk Factors.”
The following discussion and analysis of our financial condition and results of operations should be read in conjunction with our consolidated financial statements and related notes included elsewhere in this Annual Report on Form 10-K. In addition to historical consolidated financial information, the following discussion contains forward-looking statements that reflect our plans, estimates and beliefs. Our actual results could differ materially from those discussed in the forward-looking statements. Factors that could cause or contribute to these differences include those discussed below and elsewhere in this Annual Report on Form 10-K, particularly in the section titled “Risk Factors.”
Overview
We are a leading web-based consumer shopping, enrollment and retention platform for health insurance distribution. Our solutions offer a personalized health insurance shopping experience that recommends the best fit insurance plan based on an individual’s preferences, health status, preferred providers, medications and expected out-of-pocket costs. Our customers are payers, brokers, government agencies, and web-based insurance marketplace operators, who distribute health and ancillary insurance. Our solutions automate key functions in the insurance distribution process, allowing our customers to price and present plan options accurately to consumers and efficiently enroll, renew and manage plan members.
Management is focused on risks that could have an adverse impact on our operations and our key financial and operating performance metrics, as described below, and takes actions to mitigate those risks. In our Enterprise/Commercial segment, for example, while fluctuations in bookings are not uncommon given the sales cycle for software solution services in that segment, management routinely assesses staffing levels required to support contracted business volume and adjusts staffing levels accordingly. As part of its ongoing assessment of our software capabilities, management also considers industry trends, such as consumers’ increased reliance on mobile devices, to determine where to allocate research and development funding. One of our overall strategic initiatives is to continue to increase the percentage of software services revenue (and reduce professional services revenue as a percentage of total revenue) as we believe this will have a positive impact on overall gross margins in the future.
Key Financial and Operating Performance Metrics
We regularly monitor a number of financial and operating metrics in order to measure our current performance and project our future performance. These metrics help us develop and refine our growth strategies and make strategic decisions. We discuss consolidated revenue, gross margin and the components of operating loss, as well as segment revenue and components of segment gross margin, in “Management’s Discussion and Analysis of Financial Condition and Results of Operations—Components of Operating Results.” In addition, we utilize other key metrics as described below.
Contracted Backlog
We believe the balance of contracted future billings, or Contracted Backlog, is an important indicator of the economic health of our business, as it provides an important source of visibility into our future sources of revenue.
We have generally signed multiple-year subscription contracts for our software services. The timing of our invoices to our customer is a negotiated term and thus varies among our customers. For multiple-year agreements, it is common to invoice an initial amount at contract signing for implementation work that is deferred, followed by subsequent annual, quarterly or monthly invoices once we launch a customer, which is when our product is usable by the customer. At any point in the contract term, there may be amounts that we have not yet been contractually able to invoice. Until such time as these amounts are invoiced, they are not recorded in revenue, deferred revenue or elsewhere in our consolidated financial statements and are considered by us to be Contracted Backlog. We define Contracted Backlog as the fixed amount of our customer agreements that we have not yet billed, which was approximately $78.4 million and $86.7 million as of December 31, 2017 and 2016, respectively.
Our customer contracts are generally only cancellable by the customer in an instance of our uncured breach, although some of our customers (including government customers) are able to terminate their respective contracts without cause or for convenience. Of our top 20 customers by 2017 revenue, some customers can terminate their contract for convenience upon written notice. These customers represented $31.7 million, or 40.4% of our Contracted Backlog balance as of December 31, 2017.
41
We fulfill a portion of the Contracted Backlog associated with a customer contract when the customer implementation process is complete. Our implementation timelines can vary between one and 15 months based on the type of solution, source and condition of the data we receive from third parties, the configurations that we agree to provide and the size of the customer. As a result, our implementation timelines are subject to significant uncertainties, which can have a material impact on our total Contracted Backlog and Contracted Backlog that we fulfill within a year. The anticipated impact of the December 31, 2017 Contracted Backlog on each future year’s billings is as follows:
|
Year ending December 31 |
|
Millions of Dollars |
|
|
|
2018 |
|
$ |
36.6 |
|
|
2019 |
|
|
19.2 |
|
|
2020 |
|
|
18.8 |
|
|
Thereafter |
|
|
3.8 |
|
|
TOTAL |
|
$ |
78.4 |
|
We expect that the amount of our Contracted Backlog relative to the total value of our contracts will change from period to period for several reasons, including the amount of cash collected early in the contract term, the specific timing and duration of large customer contracts, varying invoicing cycles of customer contracts, potential customer upsells dependent on our customer contracts, the specific timing of customer renewal and changes in customer financial circumstances. Our Contracted Backlog does not reflect any estimated variable usage fees. Accordingly, we believe that fluctuations in our Contracted Backlog may not be a reliable indicator of our future revenue beyond one year.
Software Revenue Retention Rate
We believe that our ability to retain our customers and expand the revenue we generate from them over time is an important component of our strategy and reflects the long-term value of our customer relationships. We measure our performance on this basis using a metric we refer to as our Software Revenue Retention Rate. We calculate this metric for a particular period by establishing the group of our customers that had active contracts for a given period (excluding our Enterprise/State customers, of which there was one, customer during the years ended December 31, 2017 and 2016 and two customers during the year ended December 31, 2015). We then calculate our Software Revenue Retention Rate by taking the amount of software revenue we recognized for this group in the subsequent comparable period (for which we are reporting the rate) and dividing it by the software revenue we recognized for the group in the prior period.
For the years ended December 31, 2017, 2016 and 2015, our Software Revenue Retention Rate was in excess of 91%.
Adjusted Gross Margin and Adjusted EBITDA
Adjusted gross margin represents our gross margin before depreciation and amortization expense, as well as stock-based compensation expense. Adjusted earnings before interest, taxes, depreciation and amortization, or adjusted EBITDA, represents net income (loss) before net interest, other expense, taxes, depreciation and amortization expense, adjusted to eliminate stock-based compensation, loss on facility lease termination, merger transaction expense, and non-cash changes in fair value of contingent consideration and impairments of goodwill, intangible, and other long-lived assets, if any. Adjusted gross margin and adjusted EBITDA are not measures calculated in accordance with GAAP, or Generally Accepted Accounting Principles. Please refer to “Selected Consolidated Financial Data—Adjusted Gross Margin and Adjusted EBITDA” in this Annual Report on Form 10-K for a discussion of the limitations of adjusted gross margin and adjusted EBITDA and reconciliations of adjusted gross margin to gross margin and adjusted EBITDA to net loss, the most comparable GAAP measurements, respectively, for the years ended December 31, 2017, 2016, 2015, 2014 and 2013.
Components of Operating Results
Revenue
We derive most of our revenue from software services fees, which primarily consist of subscription fees paid to us for access to, usage and hosting of our web-based software solutions, and related production support services.
Software services fees paid to us from our Enterprise/Commercial customers are contracted rates based on the size of the health plan using our solutions for a specified period of time, which usually ranges from three to five years, and the number of software modules used. Software services fees paid to us from our Enterprise/State customers have been based on contracted rates and the number of software solution modules being used for a specified period of time, which have ranged from one to three years. Software services fees paid to us from our Medicare and Private Exchange customers are based on the volume of enrollments for which our software solutions are utilized for a contracted period, which usually ranges from one to three years. Our customer contracts are
42
generally only cancellable by the customer in an instance of our uncured breach, although some of our customers are able to terminate their respective contracts without cause or for convenience. Software services revenue accounted for approximately 80%, 69% and 67% of our total revenue during the years ended December 31, 2017, 2016 and 2015, respectively.
Another component of our revenue is professional services, which we primarily derive from the implementation of our customers onto our platform, typically including discovery, configuration and deployment, integration, testing and training. In general, it takes from six to fifteen months to implement a new enterprise customer’s solution and from one to three months to implement a new Medicare or Private Exchange solution. Professional services revenue accounted for approximately 17%, 27% and 30% of our total revenue during the years ended December 31, 2017, 2016 and 2015, respectively.
We also derive a small portion of other revenue from commissions earned on annual employee enrollments in which our health plan network and web-based software solutions are used in connection with each enrollment.
For all contractual arrangements that include multiple elements, we allocate revenue from a customer contract to software services and professional services based on the type of multiple element arrangement. For instance, with respect to multiple-element arrangements containing hosted software, we identify each software and professional services unit of accounting based on the terms of the customer contract and allocate revenue to each unit of accounting based on the relative selling price of each deliverable. Revenue from each element is recognized as each element is delivered. Similarly, for multiple-element arrangements containing non-hosted software, during the periods reported we accounted for the entire arrangement as a single unit of accounting, because some or all of the deliverable elements did not have stand-alone value when the related contracts were executed. In these situations, all revenue has been deferred until delivery of the final element, at which time the contract value is recognized ratably over the longer of the contract or estimated period of customer benefit. For purposes of presentation in management’s discussion and analysis, management classifies a portion of the overall arrangement fee as software and professional services fees based on an evaluation of various available indicators of fair value, including relative contract value of the software and professional services elements to total contractual value, and applies judgment to reasonably classify the arrangement fee. Our classification of multiple element arrangement fees does not affect the timing or amount of revenue recognized.
We generally invoice our customers for software services in advance, in monthly, quarterly or annual installments. We typically invoice our Medicare and Private Exchange customers for implementation fees at the inception of the arrangement. We generally invoice our Enterprise/Commercial customers for implementation fees at various contractually defined times throughout the implementation process. Implementation fees that have been invoiced are initially recorded as deferred revenue until recognized.
The Enterprise/State segment had one remaining customer as of December 31, 2017 and we anticipate this customer relationship will terminate in 2018.
Overhead Allocation
Expenses associated with our facilities and depreciation are allocated between cost of revenue and operating expenses based on employee payroll costs determined by the nature of work performed.
Cost of Revenue
Cost of revenue primarily consists of salaries and other personnel-related costs, including benefits, bonuses and stock-based compensation, for employees providing services to our customers and supporting our web-based software services. Additional expenses in cost of revenue include third-party contract labor, co-location facility costs for our data centers, depreciation expense for computer equipment directly associated with generating revenue, infrastructure maintenance costs, amortization expenses associated with deferred implementation costs and acquired intangible assets, allocated overhead and other direct costs.
Our cost of revenue is expensed as we incur the costs, with the exception of certain direct, incremental costs associated with new customer implementation efforts, which we defer. The related revenue from fees we receive for our implementation services performed before a customer is operating on our platform is deferred until the commencement of the usage of our software services, at which time the revenue is recognized ratably over the longer of the related contract term or the estimated period of customer benefit. Therefore, certain costs incurred in providing these services are expensed in periods prior to the recognition of the corresponding revenue. Our cost associated with providing implementation services has been significantly higher as a percentage of revenue than our cost associated with providing our on-going services due to the labor associated with providing implementation services. We took certain costs reduction actions in 2016 and 2017, which we anticipate will reduce our cost of revenue in future periods in terms of dollars and as a percentage of revenue.
43
Operating expenses consist of research and development, sales and marketing, and general and administrative expenses. Salaries and personnel-related costs are the most significant component of each of these expense categories. We expect our operating expenses to decrease in aggregate dollars and as a percentage of revenue over the near term as we implement changes to improve profitability.
Research and development expense. The nature of our research and development activities includes market requirements and definition, product design, software development, quality assurance and product release. Research and development expense consists primarily of salaries and other personnel-related costs, including benefits, bonuses and stock-based compensation for our research and development employees. Additional expenses include costs related to the development, quality assurance, and testing of new technology, and enhancement of our existing platform technology, consulting, travel and allocated overhead. We believe continuing to invest in research and development efforts is essential to maintaining our competitive position. We have continued to invest in a common software platform intended to reduce future software implementation and maintenance costs and to increase margins, but we expect our research and development expense to decrease as a percentage of revenue over the longer term to a target of under twenty percent of revenue.
Sales and marketing expense. Sales and marketing expense consists primarily of salaries and other personnel-related costs, including benefits, bonuses, stock-based compensation and commissions for our sales and marketing employees. We record expense for commissions at the time of contract signing. Additional expenses include advertising, lead generation, promotional event programs, corporate communications, travel and allocated overhead.
General and administrative expense. General and administrative expense consists primarily of salaries and other personnel-related costs, including benefits, bonuses and stock-based compensation for administrative, finance and accounting, legal, information technology and human resource employees. Additional expenses include consulting and professional fees, insurance and other corporate expenses, travel, and expenses incurred as a result of operating as a public company, including costs associated with compliance with the Sarbanes-Oxley Act and other regulations governing public companies, costs of directors’ and officers’ liability insurance, professional services expenses, costs associated with an investor relations function and any goodwill impairments.
Other Expenses
Other expenses primarily consist of interest expense incurred on outstanding borrowings under our financing obligations, existing notes and credit facilities, along with financing related expenses to amend or extinguish existing notes and credit facilities.
Income Tax (Provision) Benefit
Income taxes primarily consist of United States federal and state income tax net operating loss benefits, net of changes in valuation allowances. Valuation allowances are recorded to reduce deferred tax assets to the amount we believe is more likely than not to be realized.
Our income tax (provision) benefit was insignificant in the years ended December 31, 2017, 2016, and 2015 due to the recorded valuation allowance.
As a result of cumulative net operating losses, we have net operating loss carryforwards for federal income tax purposes of approximately $133.0 million as of December 31, 2017. State net operating loss carryforwards were approximately $92.0 million as of December 31, 2017. Our net operating losses will expire at various dates beginning in 2020, if not utilized. As a result of prior equity issuances and other transactions in our stock, we have experienced “ownership changes” under Section 382 which limit the amount of net operating loss carryforwards available to us. Our last completed Section 382 limitation study was through the tax year ended December 31, 2013. We anticipate completing an updated Section 382 limitation study following the consummation of the January 4, 2018 Merger Agreement, which we believe will qualify as an ownership change and result in further limitation of the amount of net operating losses which may be available in future years. At December 31, 2017 we had a full tax valuation allowance offsetting the recorded tax benefit of our federal and state net operating loss carryforwards.
44
Statements of Operations Data
The following table sets forth our consolidated statements of operations data for each of the periods indicated:
|
|
|
Year Ended December 31, |
|
|||||||||
|
|
|
2017 |
|
|
2016 |
|
|
2015 |
|
|||
|
|
|
(dollars in thousands, except share and per share amounts) |
|
|||||||||
|
Revenue |
|
$ |
76,746 |
|
|
$ |
81,894 |
|
|
$ |
95,847 |
|
|
Cost of Revenue (1) |
|
|
47,062 |
|
|
|
56,895 |
|
|
|
50,670 |
|
|
Gross Margin |
|
|
29,684 |
|
|
|
24,999 |
|
|
|
45,177 |
|
|
Operating Expenses: |
|
|
|
|
|
|
|
|
|
|
|
|
|
Research and Development (1) |
|
|
16,679 |
|
|
|
22,297 |
|
|
|
22,718 |
|
|
Sales and Marketing (1) |
|
|
9,356 |
|
|
|
10,410 |
|
|
|
9,507 |
|
|
General and Administrative (1) |
|
|
15,378 |
|
|
|
13,162 |
|
|
|
14,439 |
|
|
Total Operating Expenses |
|
|
41,413 |
|
|
|
45,869 |
|
|
|
46,664 |
|
|
|
|
|
|
|
|
|
|
|
|
|
|
|
|
Loss from Operations |
|
|
(11,729 |
) |
|
|
(20,870 |
) |
|
|
(1,487 |
) |
|
Other Expenses: |
|
|
|
|
|
|
|
|
|
|
|
|
|
Interest Expense |
|
|
3,286 |
|
|
|
3,485 |
|
|
|
5,665 |
|
|
Other Expense (Income), net |
|
|
509 |
|
|
|
2,239 |
|
|
|
140 |
|
|
Loss before Income Taxes |
|
|
(15,524 |
) |
|
|
(26,594 |
) |
|
|
(7,292 |
) |
|
Income Tax (Provision) Benefit |
|
|
(20 |
) |
|
|
60 |
|
|
|
(51 |
) |
|
Net Loss |
|
$ |
(15,544 |
) |
|
$ |
(26,534 |
) |
|
$ |
(7,343 |
) |
|
Net loss per common share - basic and diluted |
|
$ |
(0.96 |
) |
|
$ |
(1.31 |
) |
|
$ |
(0.34 |
) |
|
Weighted Average Common Shares Outstanding - basic and diluted |
|
|
22,791,178 |
|
|
|
22,275,256 |
|
|
|
21,813,407 |
|
|
Other Financial Data: |
|
|
|
|
|
|
|
|
|
|
|
|
|
Adjusted gross margin |
|
|
34,033 |
|
|
|
29,545 |
|
|
|
49,945 |
|
|
Adjusted EBITDA |
|
|
(1,889 |
) |
|
|
(13,607 |
) |
|
|
8,268 |
|
|
(1) |
Cost of revenue and operating expenses include stock-based compensation expense as follows: |
|
|
|
Year Ended December 31, |
|
|||||||||
|
|
|
2017 |
|
|
2016 |
|
|
2015 |
|
|||
|
|
|
(dollars in thousands) |
|
|||||||||
|
Cost of Revenue |
|
$ |
482 |
|
|
$ |
689 |
|
|
$ |
922 |
|
|
Research and Development |
|
|
172 |
|
|
|
422 |
|
|
|
1,379 |
|
|
Sales and Marketing |
|
|
187 |
|
|
|
243 |
|
|
|
518 |
|
|
General and Administrative |
|
|
1,386 |
|
|
|
1,308 |
|
|
|
1,893 |
|
45
The following table sets forth segment results for revenue and gross margin for the periods indicated:
|
|
|
Year Ended December 31, |
|
|||||||||
|
|
|
2017 |
|
|
2016 |
|
|
2015 |
|
|||
|
|
|
(dollars in thousands) |
|
|||||||||
|
Segment Statements of Operations Data: |
|
|
|
|
|
|
|
|
|
|
|
|
|
Revenue: |
|
|
|
|
|
|
|
|
|
|
|
|
|
Enterprise/Commercial |
|
$ |
40,187 |
|
|
$ |
49,081 |
|
|
$ |
55,487 |
|
|
Enterprise/State |
|
|
2,144 |
|
|
|
3,453 |
|
|
|
13,372 |
|
|
Medicare |
|
|
22,101 |
|
|
|
18,565 |
|
|
|
17,973 |
|
|
Private Exchange |
|
|
12,314 |
|
|
|
10,795 |
|
|
|
9,015 |
|
|
Total Revenue |
|
$ |
76,746 |
|
|
$ |
81,894 |
|
|
$ |
95,847 |
|
|
Gross Margin: |
|
|
|
|
|
|
|
|
|
|
|
|
|
Enterprise/Commercial |
|
$ |
13,216 |
|
|
$ |
11,906 |
|
|
$ |
23,715 |
|
|
Enterprise/State |
|
|
1,469 |
|
|
|
1,325 |
|
|
|
6,300 |
|
|
Medicare |
|
|
14,872 |
|
|
|
11,460 |
|
|
|
10,651 |
|
|
Private Exchange |
|
|
127 |
|
|
|
308 |
|
|
|
4,511 |
|
|
Total Gross Margin |
|
$ |
29,684 |
|
|
$ |
24,999 |
|
|
$ |
45,177 |
|
Comparison of Years Ended December 31, 2017 and 2016
Revenue
|
|
|
Year Ended December 31, |
|
|
|
|
||||||||||||||||||
|
|
|
2017 |
|
|
2016 |
|
|
Period-to-Period Change |
|
|||||||||||||||
|
|
|
Amount |
|
|
% of Revenue |
|
|
Amount |
|
|
% of Revenue |
|
|
Amount |
|
|
% |
|
||||||
|
|
|
(dollars in thousands) |
|
|||||||||||||||||||||
|
Revenue by Type: |
|
|
|
|
|
|
|
|
|
|
|
|
|
|
|
|
|
|
|
|
|
|
|
|
|
Software services |
|
$ |
61,110 |
|
|
|
79.6 |
% |
|
$ |
56,688 |
|
|
|
69.2 |
% |
|
$ |
4,422 |
|
|
|
7.8 |
% |
|
Professional services |
|
|
13,253 |
|
|
|
17.3 |
% |
|
|
22,354 |
|
|
|
27.3 |
% |
|
|
(9,101 |
) |
|
|
(40.7 |
%) |
|
Other |
|
|
2,383 |
|
|
|
3.1 |
% |
|
|
2,852 |
|
|
|
3.5 |
% |
|
|
(469 |
) |
|
|
(16.4 |
%) |
|
Total revenue |
|
$ |
76,746 |
|
|
|
100.0 |
% |
|
$ |
81,894 |
|
|
|
100.0 |
% |
|
$ |
(5,148 |
) |
|
|
(6.3 |
%) |
The increase in software services revenue was primarily attributable to a $3.9 million increase in revenue from our Medicare software solutions and a $1.6 million increase from our Private Exchange software solutions, partially offset by a $1.1 million year-over-year decrease from our Enterprise/State and Enterprise/Commercial software solutions. The increases in software services revenue in our Medicare and Private Exchange segments were primarily attributable to incremental revenue from implemented new customer solutions and existing customers, as well as incremental transaction volume-based revenue. The decrease in Enterprise/State and Enterprise/Commercial software services revenue was attributable to the non-renewal of our last remaining Enterprise/State customer and several Enterprise/Commercial customers existing the Individual & Family Health Plan (IFP) marketplace in 2017 and consequently not renewing Company provided IFP software and services agreements.
The decrease in professional services revenue was primarily attributable to the inclusion of approximately $5.5 million of revenue in the comparable period related to the satisfaction of contractual obligations with certain Enterprise/Commercial customers that did not repeat in the year ended December 31, 2017, along with a decrease in professional services revenue attributable to the recognition of previously deferred revenue related to pre-2016 software implementations where certain customers made a renewal decision in the last twelve months and either renewed without incurring similar upfront implementation professional services, or did not renew.
The $0.5 million decrease in other revenue was primarily due to less Private Exchange segment variable commission transactions in 2017 compared to 2016.
46
|
|
|
Year Ended December 31, |
|
|
|
|
||||||||||||||||||
|
|
|
2017 |
|
|
2016 |
|
|
Period-to-Period Change |
|
|||||||||||||||
|
|
|
Amount |
|
|
% of Revenue |
|
|
Amount |
|
|
% of Revenue |
|
|
Amount |
|
|
% |
|
||||||
|
|
|
(dollars in thousands) |
|
|||||||||||||||||||||
|
Revenue by Segment: |
|
|
|
|
|
|
|
|
|
|
|
|
|
|
|
|
|
|
|
|
|
|
|
|
|
Enterprise/Commercial |
|
$ |
40,187 |
|
|
|
52.4 |
% |
|
$ |
49,081 |
|
|
|
59.9 |
% |
|
$ |
(8,894 |
) |
|
|
(18.1 |
%) |
|
Enterprise/State |
|
|
2,144 |
|
|
|
2.8 |
% |
|
|
3,453 |
|
|
|
4.2 |
% |
|
|
(1,309 |
) |
|
|
(37.9 |
%) |
|
Medicare |
|
|
22,101 |
|
|
|
28.8 |
% |
|
|
18,565 |
|
|
|
22.7 |
% |
|
|
3,536 |
|
|
|
19.0 |
% |
|
Private Exchange |
|
|
12,314 |
|
|
|
16.0 |
% |
|
|
10,795 |
|
|
|
13.2 |
% |
|
|
1,519 |
|
|
|
14.1 |
% |
|
Total Revenue |
|
$ |
76,746 |
|
|
|
100.0 |
% |
|
$ |
81,894 |
|
|
|
100.0 |
% |
|
$ |
(5,148 |
) |
|
|
(6.3 |
%) |
The decrease in our Enterprise/Commercial revenue was primarily attributable to a decrease in professional services revenue. The decrease in professional services revenue was primarily attributable to the inclusion of approximately $5.5 million of revenue in the comparable period related to the satisfaction of contractual obligations with certain Enterprise/Commercial customers that did not repeat in the year ended December 31, 2017, along with the scheduled conclusion of amortization and recognition of previously deferred upfront software implementation revenue for certain customers.
The growth in revenue in each of our Medicare and Private Exchange segments was primarily attributable to an increase in software services revenue in each segment, driven by an increase in both the number of health plans and broker customers using our software solutions, including our therapeutic alternatives engagement solution, DrugCompare, and the volume of variable usage fee transactions processed through our software solutions. The increase in revenue in our Private Exchange segment included an incremental $1.0 million of revenue in the year ended December 31, 2017 from customers on software solutions acquired in our June 2016 acquisition of ConnectedHealth, LLC.
Our Enterprise/State revenue reflects the impact of the wind down of our software services for the sole remaining customer. We anticipate future efforts and revenue from this customer will cease in 2018.
Cost of Revenue
|
|
|
Year Ended December 31, |
|
|
|
|
|
|
|
|
|
|||||||||||||
|
|
|
2017 |
|
|
2016 |
|
|
Period-to-Period Change |
|
|||||||||||||||
|
|
|
Amount |
|
|
% of Revenue |
|
|
Amount |
|
|
% of Revenue |
|
|
Amount |
|
|
% |
|
||||||
|
|
|
(dollars in thousands) |
|
|||||||||||||||||||||
|
Cost of Revenue |
|
$ |
47,062 |
|
|
|
61.3 |
% |
|
$ |
56,895 |
|
|
|
69.5 |
% |
|
$ |
(9,833 |
) |
|
|
(17.3 |
%) |
The decrease in cost of revenue was primarily attributable to a $7.2 million decrease in personnel-related and contractor costs supporting implemented solutions due, in part, to our fourth quarter 2016 cost alignment initiatives which continued into 2017, as well as a $2.8 million decrease in the recognition of previously deferred software implementation costs, partially offset by a $0.2 million increase in facility, third-party hosting and other expenses incurred to support current customers.
Segment Gross Margin
|
|
|
Year Ended December 31, |
|
|
|
|
||||||||||||||||||
|
|
|
2017 |
|
|
2016 |
|
|
Period-to-Period Change |
|
|||||||||||||||
|
|
|
Amount |
|
|
% of Revenue |
|
|
Amount |
|
|
% of Revenue |
|
|
Amount |
|
|
% |
|
||||||
|
|
|
(dollars in thousands) |
|
|||||||||||||||||||||
|
Segment Gross Margin: |
|
|
|
|
|
|
|
|
|
|
|
|
|
|
|
|
|
|
|
|
|
|
|
|
|
Enterprise/Commercial |
|
$ |
13,216 |
|
|
|
32.9 |
% |
|
$ |
11,906 |
|
|
|
24.3 |
% |
|
$ |
1,310 |
|
|
|
11.0 |
% |
|
Enterprise/State |
|
|
1,469 |
|
|
|
68.5 |
% |
|
|
1,325 |
|
|
|
38.4 |
% |
|
|
144 |
|
|
|
10.9 |
% |
|
Medicare |
|
|
14,872 |
|
|
|
67.3 |
% |
|
|
11,460 |
|
|
|
61.7 |
% |
|
|
3,412 |
|
|
|
29.8 |
% |
|
Private Exchange |
|
|
127 |
|
|
|
1.0 |
% |
|
|
308 |
|
|
|
2.9 |
% |
|
|
(181 |
) |
|
|
(58.8 |
%) |
|
Total Gross Margin |
|
$ |
29,684 |
|
|
|
38.7 |
% |
|
$ |
24,999 |
|
|
|
30.5 |
% |
|
$ |
4,685 |
|
|
|
18.7 |
% |
47
The increase in Enterprise/Commercial gross margin was driven by the $10.2 million decrease in cost of revenue, partially offset by a $8.9 million decrease in revenue. The decrease in cost of revenue is primarily attributed to a $6.7 million decrease in personnel related costs resulting from improved alignment and operating leverage of delivery costs, and a $3.5 million decrease in the recognition of previously deferred upfront software implementation costs. The decrease in upfront software implementation costs was primarily due to the satisfaction of contractual obligations with certain Enterprise/Commercial customers in 2016 that did not repeat in 2017. The decrease in revenue was primarily due to the inclusion of approximately $5.5 million of revenue in the comparable period related to the satisfaction of contractual obligations with certain Enterprise/Commercial customers that did not repeat in the year ended December 31, 2017, along with the scheduled conclusion of amortization and recognition of previously deferred upfront software implementation revenue for certain customers.
The increase in Enterprise/State gross margin was driven by certain one-time wind down arrangements with the sole remaining customer.
The increase in Medicare gross margin was attributable to a $3.5 million increase in revenue primarily related to both an increase in the number of health plans and broker customers using our platform, including our therapeutic alternatives engagement solution, DrugCompare, and the volume of variable usage fee transactions processed through our software solutions, partially offset by a $0.1 million increase in cost of revenue primarily related to infrastructure and hosting delivery costs to support the increased customers.
The decrease in Private Exchange gross margin was attributable to a $1.7 million increase in cost of revenue, partially offset by a $1.5 million increase in revenue. The increase in cost of revenue was primarily due to an increase in our cost structure to support current and expected customer growth in the segment. The increase in revenue was primarily attributable to an increase in the number of customers using our software solutions, including an incremental $1.0 million of revenue in the year ended December 31, 2017 from customers on software solutions acquired in our June 2016 acquisition of ConnectedHealth, LLC.
Research and Development
|
|
|
Year Ended December 31, |
|
|
|
|
|
|
|
|
|
|||||||||||||
|
|
|
2017 |
|
|
2016 |
|
|
Period-to-Period Change |
|
|||||||||||||||
|
|
|
Amount |
|
|
% of Revenue |
|
|
Amount |
|
|
% of Revenue |
|
|
Amount |
|
|
% |
|
||||||
|
|
|
(dollars in thousands) |
|
|||||||||||||||||||||
|
Research and Development |
|
$ |
16,679 |
|
|
|
21.7 |
% |
|
$ |
22,297 |
|
|
|
27.2 |
% |
|
$ |
(5,618 |
) |
|
|
(25.2 |
%) |
The decrease in research and development expense was primarily attributable to a decrease in personnel-related costs as compared to the year ended December 31, 2016 from workforce rationalization and optimization efforts in late 2016 and continuing into 2017. Our 2016 research and development expense includes approximately $0.6 million of severance related to personnel reductions and leadership change actions taken in 2016. The expense reductions are intended to better align resources around initiatives that are core to our long-term growth strategy.
While we expect to continue our research and development investment in new software solutions and functionality, we believe such expense will decline, over time, to our long-term target of less than twenty percent of annual revenue.
Sales and Marketing
|
|
|
Year Ended December 31, |
|
|
|
|
|
|
|
|
|
|||||||||||||
|
|
|
2017 |
|
|
2016 |
|
|
Period-to-Period Change |
|
|||||||||||||||
|
|
|
Amount |
|
|
% of Revenue |
|
|
Amount |
|
|
% of Revenue |
|
|
Amount |
|
|
% |
|
||||||
|
|
|
(dollars in thousands) |
|
|||||||||||||||||||||
|
Sales and Marketing |
|
$ |
9,356 |
|
|
|
12.2 |
% |
|
$ |
10,410 |
|
|
|
12.7 |
% |
|
$ |
(1,054 |
) |
|
|
(10.1 |
%) |
The decrease in sales and marketing expense was primarily attributable to a $0.9 million decrease in salaries and personnel-related costs related to a decrease in our sales and marketing headcount and discrete costs in the comparable 2016 period related to the end of service by our former Executive Vice President of Sales and Marketing. In addition, there was a $0.2 million increase in commission expense associated with higher commissionable booking levels in 2017 compared to 2016, offset by a $0.4 million decrease in other expenses. The increase in commission expense was attributable to revamping of our sales organization in 2016, which led to more commissionable bookings in 2017.
48
|
|
|
Year Ended December 31, |
|
|
|
|
|
|
|
|
|
|||||||||||||
|
|
|
2017 |
|
|
2016 |
|
|
Period-to-Period Change |
|
|||||||||||||||
|
|
|
Amount |
|
|
% of Revenue |
|
|
Amount |
|
|
% of Revenue |
|
|
Amount |
|
|
% |
|
||||||
|
|
|
(dollars in thousands) |
|
|||||||||||||||||||||
|
General and Administrative |
|
$ |
15,378 |
|
|
|
20.0 |
% |
|
$ |
13,162 |
|
|
|
16.1 |
% |
|
$ |
2,216 |
|
|
|
16.8 |
% |
The increase in general and administrative expense was primarily attributable to a $2.0 million expense related to the Company’s decision to cease using and exit a leased facility, a $0.2 million goodwill impairment charge related to our Enterprise/Commercial business, along with approximately $1.0 million of professional fees incurred to evaluate and execute the January 4, 2018 Merger Agreement, all of which occurred in the fourth quarter of 2017. These costs were partly offset by a $1.0 million decrease of personnel related expenses, professional fees and other costs. Our 2016 general and administrative expense includes approximately $0.4 million of severance related to personnel reductions and leadership change actions taken in 2016 and $0.2 million of acquisition expenditures related to the June 2016 acquisition of ConnectedHealth, LLC.
Interest Expense
|
|
|
Year Ended December 31, |
|
|
|
|
|
|
|
|
|
|||||||||||||
|
|
|
2017 |
|
|
2016 |
|
|
Period-to-Period Change |
|
|||||||||||||||
|
|
|
Amount |
|
|
% of Revenue |
|
|
Amount |
|
|
% of Revenue |
|
|
Amount |
|
|
% |
|
||||||
|
|
|
(dollars in thousands) |
|
|||||||||||||||||||||
|
Interest Expense |
|
$ |
3,286 |
|
|
|
4.3 |
% |
|
$ |
3,485 |
|
|
|
4.3 |
% |
|
$ |
(199 |
) |
|
|
(5.7 |
%) |
The decrease in interest expense was primarily attributable to a decrease in average borrowings outstanding during the year ended December 31, 2017, as compared to the year ended December 31, 2016. The decrease in our interest expense is directly attributable to our efforts to increase our balance sheet liquidity through our May 2, 2016, $52.0 million preferred stock offering, and repayment of our $30.0 million subordinated THL Note.
Other Expense
|
|
|
Year Ended December 31, |
|
|
|
|
|
|
|
|||||||||||||
|
|
|
2017 |
|
|
2016 |
|
|
Period-to-Period Change |
||||||||||||||
|
|
|
Amount |
|
|
% of Revenue |
|
|
Amount |
|
|
% of Revenue |
|
|
Amount |
|
|
% |
|||||
|
|
|
(dollars in thousands) |
||||||||||||||||||||
|
Other expense (income), net |
|
$ |
509 |
|
|
|
0.7 |
% |
|
$ |
2,239 |
|
|
|
2.7 |
% |
|
$ |
(1,730 |
) |
|
* |
|
* |
Not meaningful |
The decrease in other expense, net was primarily attributable to the inclusion of a $0.6 million breakage fee and the $0.5 million recognition of original issue discount (OID) and deferred financing costs triggered by the early extinguishment of the THL Note, in addition to $0.7 million of refinancing fees and the recognition if $0.4 million of previously deferred financing costs triggered by the amendment of our bank Senior Credit Facility during the year ended December 31, 2016. These decreases were partially offset by the recognition of current and previously deferred financing costs in the year ended December 31, 2017 triggered by the March 10, 2017 amendment of our bank Senior Credit Facility.
49
Comparison of Years Ended December 31, 2016 and 2015
Revenue
|
|
|
Year Ended December 31, |
|
|
|
|
||||||||||||||||||
|
|
|
2016 |
|
|
2015 |
|
|
Period-to-Period Change |
|
|||||||||||||||
|
|
|
Amount |
|
|
% of Revenue |
|
|
Amount |
|
|
% of Revenue |
|
|
Amount |
|
|
% |
|
||||||
|
|
|
(dollars in thousands) |
|
|||||||||||||||||||||
|
Revenue by Type: |
|
|
|
|
|
|
|
|
|
|
|
|
|
|
|
|
|
|
|
|
|
|
|
|
|
Software services |
|
$ |
56,688 |
|
|
|
69.2 |
% |
|
$ |
64,393 |
|
|
|
67.2 |
% |
|
$ |
(7,705 |
) |
|
|
(12.0 |
%) |
|
Professional services |
|
|
22,354 |
|
|
|
27.3 |
% |
|
|
28,648 |
|
|
|
29.9 |
% |
|
|
(6,294 |
) |
|
|
(22.0 |
%) |
|
Other |
|
|
2,852 |
|
|
|
3.5 |
% |
|
|
2,806 |
|
|
|
2.9 |
% |
|
|
46 |
|
|
|
1.6 |
% |
|
Total revenue |
|
$ |
81,894 |
|
|
|
100.0 |
% |
|
$ |
95,847 |
|
|
|
100.0 |
% |
|
$ |
(13,953 |
) |
|
|
(14.6 |
%) |
The decrease in software services revenue was primarily attributable to a $7.1 million year-over-year decrease from the completion of contractual relationships with two Enterprise/State customer contracts, and a $2.7 million decrease in the volume of software services delivered to Enterprise/Commercial customers due in part to transitioning customers to our upgraded software platforms, partially offset by a $2.1 million increase in software services delivered to Medicare and Private Exchange customers added during the past year and other volume and mix changes across all segments except Enterprise/State which has one remaining customer at December 31, 2016.
The decrease in professional services revenue was primarily attributable to a $2.9 million year-over-year decrease related to the previously mentioned Enterprise/State customers, and the accelerated recognition of $3.6 million of revenue from the second quarter 2015 termination of our contractual relationships with two Enterprise/Commercial customers, partially offset by other volume and mix changes across all segments except Enterprise/State which has one remaining customer at December 31, 2016.
Segment Revenue
|
|
|
Year Ended December 31, |
|
|
|
|
||||||||||||||||||
|
|
|
2016 |
|
|
2015 |
|
|
Period-to-Period Change |
|
|||||||||||||||
|
|
|
Amount |
|
|
% of Revenue |
|
|
Amount |
|
|
% of Revenue |
|
|
Amount |
|
|
% |
|
||||||
|
|
|
(dollars in thousands) |
|
|||||||||||||||||||||
|
Revenue by Segment: |
|
|
|
|
|
|
|
|
|
|
|
|
|
|
|
|
|
|
|
|
|
|
|
|
|
Enterprise/Commercial |
|
$ |
49,081 |
|
|
|
59.9 |
% |
|
$ |
55,487 |
|
|
|
57.9 |
% |
|
$ |
(6,406 |
) |
|
|
(11.5 |
%) |
|
Enterprise/State |
|
|
3,453 |
|
|
|
4.2 |
% |
|
|
13,372 |
|
|
|
14.0 |
% |
|
|
(9,919 |
) |
|
|
(74.2 |
%) |
|
Medicare |
|
|
18,565 |
|
|
|
22.7 |
% |
|
|
17,973 |
|
|
|
18.8 |
% |
|
|
592 |
|
|
|
3.3 |
% |
|
Private Exchange |
|
|
10,795 |
|
|
|
13.2 |
% |
|
|
9,015 |
|
|
|
9.3 |
% |
|
|
1,780 |
|
|
|
19.7 |
% |
|
Total Revenue |
|
$ |
81,894 |
|
|
|
100.0 |
% |
|
$ |
95,847 |
|
|
|
100.0 |
% |
|
$ |
(13,953 |
) |
|
|
(14.6 |
%) |
The decrease in our Enterprise/Commercial revenue was primarily attributable to the accelerated recognition of $3.6 million of revenue from the second quarter 2015 termination of our contractual relationships with two customers and a $2.7 million decrease in the volume of software services delivered to Enterprise/Commercial customers due in part to transitioning customers to our upgraded software platforms. The decrease in our Enterprise/State revenue was primarily attributable to a year-over-year decrease from the completion of contractual relationships with two state exchange contracts in 2015, resulting in a reduction of subsequent software and professional services revenue. The Enterprise/State segment had one remaining customer at December 31, 2016. As a result of the customer decline we anticipate future Enterprise/State revenue will be lower than prior periods.
The growth in our Medicare revenue was primarily attributable to an increase in software services and professional services as a result of an increase in customers. The growth in our Private Exchange revenue was driven primarily by an increase in the number of customers using our software services, including $0.8 million from our June 2016 acquisition of ConnectedHealth, LLC.
50
|
|
|
Year Ended December 31, |
|
|
|
|
|
|
|
|
|
|||||||||||||
|
|
|
2016 |
|
|
2015 |
|
|
Period-to-Period Change |
|
|||||||||||||||
|
|
|
Amount |
|
|
% of Revenue |
|
|
Amount |
|
|
% of Revenue |
|
|
Amount |
|
|
% |
|
||||||
|
|
|
(dollars in thousands) |
|
|||||||||||||||||||||
|
Cost of Revenue |
|
$ |
56,895 |
|
|
|
69.5 |
% |
|
$ |
50,670 |
|
|
|
52.9 |
% |
|
$ |
6,225 |
|
|
|
12.3 |
% |
The increase in cost of revenue was primarily attributable to a $4.1 million increase in the amortization of previously deferred upfront direct software implementation costs as an increasing number of customers became implemented on our software solutions. Additionally, cost of revenue included a $1.8 million increase in salaries and personnel-related costs, including $0.6 million of severance, a $0.9 million increase in outside contractor costs, and a $2.2 million increase in other costs primarily related to outside call center and commissions to third-party partners in our Private Exchange segment, partially offset by a $2.8 million increase in capitalization of deferred implementation costs related to the implementation of new customer solutions including several large Private Exchange customers.
In dollars and as a percentage of revenue, our cost of revenue increase was primarily attributed to higher than anticipated initial support costs for several Enterprise/Commercial customers and reflects the impact of adding to Private Exchange the relatively higher fixed cost structure of ConnectedHealth, LLC since the June 7, 2016 acquisition. We took certain costs reduction actions in 2016 and 2017, which we anticipate will reduce our cost of revenue in future periods in terms of dollars and as a percentage of revenue.
Segment Gross Margin
|
|
|
Year Ended December 31, |
|
|
|
|
||||||||||||||||||
|
|
|
2016 |
|
|
2015 |
|
|
Period-to-Period Change |
|
|||||||||||||||
|
|
|
Amount |
|
|
% of Revenue |
|
|
Amount |
|
|
% of Revenue |
|
|
Amount |
|
|
% |
|
||||||
|
|
|
(dollars in thousands) |
|
|||||||||||||||||||||
|
Segment Gross Margin: |
|
|
|
|
|
|
|
|
|
|
|
|
|
|
|
|
|
|
|
|
|
|
|
|
|
Enterprise/Commercial |
|
$ |
11,906 |
|
|
|
24.3 |
% |
|
$ |
23,715 |
|
|
|
42.7 |
% |
|
$ |
(11,809 |
) |
|
|
(49.8 |
%) |
|
Enterprise/State |
|
|
1,325 |
|
|
|
38.4 |
% |
|
|
6,300 |
|
|
|
47.1 |
% |
|
|
(4,975 |
) |
|
|
(79.0 |
%) |
|
Medicare |
|
|
11,460 |
|
|
|
61.7 |
% |
|
|
10,651 |
|
|
|
59.3 |
% |
|
|
809 |
|
|
|
7.6 |
% |
|
Private Exchange |
|
|
308 |
|
|
|
2.9 |
% |
|
|
4,511 |
|
|
|
50.0 |
% |
|
|
(4,203 |
) |
|
|
(93.2 |
%) |
|
Total Gross Margin |
|
$ |
24,999 |
|
|
|
30.5 |
% |
|
$ |
45,177 |
|
|
|
47.1 |
% |
|
$ |
(20,178 |
) |
|
|
(44.7 |
%) |
The Enterprise/Commercial gross margin decrease consisted of a $6.4 million decrease in revenue and a $5.4 million increase in cost of revenue. The decrease in revenue was primarily attributable to the $3.6 million second quarter 2015 accelerated recognition of revenue from the termination of our contractual relationship with two Enterprise/Commercial customers and a $2.7 million decrease in the volume of software services delivered to Enterprise/Commercial customers due in part to transitioning customers to our upgraded software platforms. The increase in cost of revenue was primarily attributable to a $4.5 million increase in the recognition of previously deferred costs related to software implementations and a greater than anticipated $0.5 million increase in salaries and personnel-related costs and outside contractor costs to support certain installed customers. Our Enterprise/Commercial gross margin included $0.5 million and $0.4 million, respectively, of depreciation and amortization for each of the years ended December 31, 2016 and 2015.
The Enterprise/State gross margin decrease consisted of a $9.9 million decrease in revenue and a corresponding $4.9 million decrease in cost of revenue. The decrease in revenue was primarily attributable to the termination of a state exchange contract and the non-renewal of a state exchange customer, as previously disclosed, resulting in a reduction of subsequent software and professional services revenue. The reduction in costs of revenue relate to staffing realignment efforts consistent with current and expected future needs of our Enterprise/State segment. Our Enterprise/State gross margin included less than $0.1 million of depreciation and amortization for each of the years ended December 31, 2016 and 2015.
The Medicare gross margin increase consisted of a $0.6 million increase in revenue and $0.2 million decrease in cost of revenue. The increase in revenue was primarily from variable software usage fees which better leverage our semi-fixed delivery costs. The decrease in cost of revenue was primarily attributable to lower personnel-related costs. Our Medicare gross margin included $2.5 million of depreciation and amortization for each of the years ended December 31, 2016 and 2015.
The Private Exchange gross margin decrease consisted of a $1.8 million increase in revenue and $6.0 million increase in cost of revenue. The increase in cost of revenue was primarily attributable to a $4.7 million increase in delivery costs and the inclusion of a
51
$1.3 million one-time gain on extinguishment of a vendor obligation in the fourth quarter of 2015. The higher delivery costs were partially to support some non-traditional client arrangements with variable fee compensation arrangements that were implemented in 2016. The fourth quarter 2016 transaction volumes and revenue from these arrangements did not materialize as expected, which caused these delivery costs to be underutilized and decreased our Private Exchange gross margins. Our Private Exchange gross margin included $0.9 million of depreciation and amortization for each of the years ended December 31, 2016 and 2015.
Research and Development
|
|
|
Year Ended December 31, |
|
|
|
|
|
|
|
|
|
|||||||||||||
|
|
|
2016 |
|
|
2015 |
|
|
Period-to-Period Change |
|
|||||||||||||||
|
|
|
Amount |
|
|
% of Revenue |
|
|
Amount |
|
|
% of Revenue |
|
|
Amount |
|
|
% |
|
||||||
|
|
|
(dollars in thousands) |
|
|||||||||||||||||||||
|
Research and Development |
|
$ |
22,297 |
|
|
|
27.2 |
% |
|
$ |
22,718 |
|
|
|
23.7 |
% |
|
$ |
(421 |
) |
|
|
(1.9 |
%) |
The decrease in research and development expense was primarily attributable to a $1.0 million decrease in share-based compensation, partially offset by a $0.6 million increase in engineering consulting fees and other costs for product development efforts expected to benefit our Enterprise/Commercial and Private Exchange segments. Our 2016 research and development expense includes approximately $0.6 million of severance related to personnel reductions and leadership change actions taken in 2016.
The research and development spending during the year ended December 31, 2016 was a continuation of our efforts to invest in a common software platform intended to reduce future software implementation and maintenance costs and increase margins. While we expect to continue our research and development investment in new software solutions and functionality, we believe such expense as a percent of revenue will decline over time to our long-term target of under twenty percent of revenue.
Sales and Marketing
|
|
|
Year Ended December 31, |
|
|
|
|
|
|
|
|
|
|||||||||||||
|
|
|
2016 |
|
|
2015 |
|
|
Period-to-Period Change |
|
|||||||||||||||
|
|
|
Amount |
|
|
% of Revenue |
|
|
Amount |
|
|
% of Revenue |
|
|
Amount |
|
|
% |
|
||||||
|
|
|
(dollars in thousands) |
|
|||||||||||||||||||||
|
Sales and Marketing |
|
$ |
10,410 |
|
|
|
12.7 |
% |
|
$ |
9,507 |
|
|
|
9.9 |
% |
|
$ |
903 |
|
|
|
9.5 |
% |
The increase in sales and marketing expense was primarily attributable to a $0.6 million increase in salaries and personnel-related costs related to an increase in our sales and marketing headcount and discrete costs related to the end of service by our former Executive Vice President of Sales and Marketing. In addition, there was a $0.4 million increase in commission expense associated with higher commissionable booking levels in the fourth quarter of 2016 as compared to the fourth quarter of 2015, offset by a $0.1 million decrease in other expenses. The increase in commission expense was attributable to revamping of our sales organization, which led to more commissionable bookings in the fourth quarter of 2016 as compared to a year prior.
General and Administrative
|
|
|
Year Ended December 31, |
|
|
|
|
|
|
|
|
|
|||||||||||||
|
|
|
2016 |
|
|
2015 |
|
|
Period-to-Period Change |
|
|||||||||||||||
|
|
|
Amount |
|
|
% of Revenue |
|
|
Amount |
|
|
% of Revenue |
|
|
Amount |
|
|
% |
|
||||||
|
|
|
(dollars in thousands) |
|
|||||||||||||||||||||
|
General and Administrative |
|
$ |
13,162 |
|
|
|
16.1 |
% |
|
$ |
14,439 |
|
|
|
15.1 |
% |
|
$ |
(1,277 |
) |
|
|
(8.8 |
%) |
The decrease in general and administrative expense was primarily attributable to a $0.6 million decrease in share-based compensation, a $0.5 million decrease in amortization resulting from the full amortization of a covenant not to compete from our January 2013 DRX acquisition, and a $0.4 million decrease in professional fees. These costs were partly offset by $0.2 million of acquisition expenditures related to the June 2016 acquisition of ConnectedHealth, LLC, and other costs. Our 2016 general and administrative expense includes approximately $0.4 million of severance related to personnel reductions and leadership change actions taken in 2016.
52
|
|
|
Year Ended December 31, |
|
|
|
|
|
|
|
|
|
|||||||||||||
|
|
|
2016 |
|
|
2015 |
|
|
Period-to-Period Change |
|
|||||||||||||||
|
|
|
Amount |
|
|
% of Revenue |
|
|
Amount |
|
|
% of Revenue |
|
|
Amount |
|
|
% |
|
||||||
|
|
|
(dollars in thousands) |
|
|||||||||||||||||||||
|
Interest Expense |
|
$ |
3,485 |
|
|
|
4.3 |
% |
|
$ |
5,665 |
|
|
|
5.9 |
% |
|
$ |
(2,180 |
) |
|
|
(38.5 |
%) |
The decrease in interest expense was primarily attributable to a decrease in average borrowings outstanding during the year ended December 31, 2016, as compared to the year ended December 31, 2015. The decrease in our interest expense is directly attributable to our efforts to increase our balance sheet liquidity through our May 2, 2016, $52.0 million preferred stock offering, and repayment of our $30.0 million subordinated THL Note.
Other Expense
|
|
|
Year Ended December 31, |
|
|
|
|
|
|
|
|||||||||||||
|
|
|
2016 |
|
|
2015 |
|
|
Period-to-Period Change |
||||||||||||||
|
|
|
Amount |
|
|
% of Revenue |
|
|
Amount |
|
|
% of Revenue |
|
|
Amount |
|
|
% |
|||||
|
|
|
(dollars in thousands) |
||||||||||||||||||||
|
Other expense (income), net |
|
$ |
2,239 |
|
|
|
2.7 |
% |
|
$ |
140 |
|
|
|
0.1 |
% |
|
$ |
2,099 |
|
|
* |
|
* |
Not meaningful |
The increase in other expense, net was primarily attributable to a $0.6 million breakage fee and the $0.5 million recognition of original issue discount (OID) and deferred financing costs triggered by the early extinguishment of the THL Note, in addition to $0.7 million of refinancing fees and the recognition if $0.4 million of previously deferred financing costs triggered by the amendment of our bank Senior Credit Facility during the year ended December 31, 2016.
Critical Accounting Policies and Significant Judgments and Estimates
Our management’s discussion and analysis of our financial condition and results of operations is based on our consolidated financial statements, which have been prepared in accordance with GAAP. The preparation of these consolidated financial statements requires us to make estimates and assumptions that affect the reported amounts of assets and liabilities, disclosure of contingent liabilities at the date of the consolidated financial statements, and the reported amounts of revenue and expenses. In accordance with GAAP, we base our estimates on historical experience and on various other assumptions that we believe reasonable under the circumstances. Actual results might differ from these estimates under different assumptions or conditions.
While our significant accounting policies are more fully described in Note 2 to our consolidated financial statements appearing in Part II, Item 8: “Financial Statements and Supplementary Data” of this Annual Report on Form 10-K, we believe the following accounting policies are critical to the process of making significant judgments and estimates in the preparation of our consolidated financial statements.
We have elected to take advantage of the extended transition period for complying with new or revised accounting standards under Section 102(B)(1), which will allow us to delay the adoption of new or revised accounting standards that have different effective dates for public and private companies until those standards apply to private companies. As a result of this election, our financial statements may not be comparable to companies that comply with public company effective dates.
Revenue Recognition and Deferred Revenue
We derive our revenue primarily from the following sources: (a) the sale, implementation and ongoing support of our insurance distribution solutions; (b) fees from brokers for the right to access our multi-payer quoting platform; (c) our Medicare.gov contract, which was a cost-plus-fixed-fee contract through the fourth quarter of 2015; and (d) commissions earned on annual employee enrollments in which our health plan network and software solutions are used in connection with each enrollment. In all contractual arrangements, we determine whether persuasive evidence of an arrangement exists, services have been rendered, the fee is fixed or determinable, and collection is probable. If any of these criteria are not met, the Company does not recognize revenue until all of the criteria are met.
53
We have multiple sources of revenue, which fall under different sets of revenue recognition rules including accounting for revenue under multiple-element hosted arrangements and percentage of completion accounting. The determination of separability of the elements and fair value assessments require judgment.
We recognize revenue for upfront license and implementation fees over the longer of the term of the customer agreement or the estimated period of customer benefit based on various factors including, but not limited to, contract terms, contract extensions and renewals, customer attrition, the nature and pace of technology advancements and obsolescence, and the anticipated impact of demand, competition, and other regulatory and economic factors.
Most of our deferred revenue relates to professional services performed for our Enterprise/Commercial customers, which require a more extensive and lengthy implementation. We expect to continue to evaluate the term over which our Enterprise/Commercial implementation fee revenue is recognized as we gain more experience with customer contract renewals.
At December 31, 2017, deferred revenue related to the Enterprise/Commercial segment was $23.3 million and is being recognized in our statements of operations over a weighted average period of approximately 3.5 years. If the weighted average period had been increased by one year to 4.5 years, the Enterprise/Commercial revenue for the year ended December 31, 2017 would have decreased by approximately $1.0 million.
Deferred Implementation Costs
We capitalize certain direct, incremental costs associated with new customer implementation efforts, and we account for those costs as deferred implementation costs, to the extent that they are deemed recoverable. We had $24.3 and $23.3 million of deferred implementation costs recorded as of December 31, 2017 and 2016, respectively. Deferred implementation costs are amortized consistent with the recognition of deferred revenue. The deferred implementation cost balance is subject to periodic impairment evaluation to determine recoverability of the asset. At every reporting period, we evaluate the recoverability of the deferred implementation costs, factoring in the remaining implementation schedule, estimated cost to complete the implementation effort and the probability of revenue in excess of deferred costs capitalized.
Goodwill and Acquired Intangible Assets
Goodwill represents the excess of the aggregate of the fair value of consideration transferred in a business combination over the fair value of assets acquired, net of liabilities assumed. Goodwill is not amortized but is subject to an annual impairment test. We test goodwill for impairment at the reporting unit level annually on October 31, or more frequently if events or changes in business circumstances indicate the carrying value may not be recoverable.
Determining the fair value of a reporting unit involves significant estimates and assumptions, which we believe to be reasonable, in light of the inherent uncertain nature of predicting the future economic prospects of our reporting units. We determine if the fair value of the reporting unit exceeds the unit’s carrying value, and the fair value of the reporting unit is less than its carrying value, we record an impairment charge.
Our Enterprise/Commercial, Medicare, and Private Exchange reporting units have goodwill of $7.5 million, $14.7 million, and $8.6 million, respectively, as of December 31, 2017, net of accumulated impairments. To determine the fair value of our reporting units, we use a discounted cash flow analysis and market comparisons, each being weighted equally. A discounted cash flow analysis requires significant assumptions and estimates about future operations. Significant judgments inherent in this discounted cash flow (“DCF”) analysis include the expected revenue growth and operating margins and the determination of an appropriate discount rate. The excess fair value over carrying value as of our latest assessment was $71.5 million for Medicare and approximately $1.4 million for Private Exchange. The Enterprise/Commercial carrying value exceeded fair value resulting in the recording of a $0.2 million non-cash goodwill impairment charge in 2017.
The Private Exchange reporting unit had approximately 16% excess fair value over carrying value, while Medicare has greater than 100% excess fair value. The following provides a summary of significant DCF judgments and estimates in the for the Enterprise/Commercial and Private Exchange reporting unit goodwill impairment tests as of October 31, 2017:
|
(Dollars in Millions) |
|
Approximate Discount Rate |
|
Approximate Impact on DCF Fair value of 0.5% Increase to Discount Rate |
|
|
|
Enterprise/Commercial |
|
17.0% |
|
$ |
(0.6 |
) |
|
Private Exchange |
|
19.5% |
|
|
(0.4 |
) |
54
The Enterprise/Commercial reporting unit anticipates a compounded annual growth rate of approximately 5.0% through 2025 before an assumed 3.0% terminal growth rate. The combination of revenue growth from anticipated new customers and add-on sales to existing customers, along with better leverage of operating costs are anticipated to result in future cash flows sufficient to recover the remaining goodwill. Should market conditions, especially in the individual and family plan market, not recover, or if our existing customers’ willingness to pay more for our software-as-a-service solutions falls short of our expectations, we may not be able to reduce operating expense to a level that allows us to recover the remaining $7.5 million of recorded goodwill.
The Private Exchange reporting unit anticipates a compounded annual growth rate of approximately 8.0% through 2025 before an assumed 3.0% terminal growth rate. The revenue growth is anticipated to come from new and existing client software service arrangements that include variable transaction-based fees. The amount of actual revenue and cash these variable fee arrangements generate is dependent on market conditions and our customers’ success in using our software services to transact insurance enrollments. Should either market conditions or our customers’ efforts to generate transaction volumes fall short of our expectations, some or all of our reporting units’ goodwill may not be recoverable.
We review acquired intangible assets for impairment whenever events or changes in circumstances indicate the carrying amount of the asset may not be recoverable. Recoverability is assessed by comparing the carrying amount of the asset to the undiscounted future cash flows expected to be generated by the asset. Measurement of any impairment loss is based on estimated fair value.
Given the significance of our goodwill and intangible assets, an adverse change in fair value could result in an impairment charge, which could be material to our financial statements.
Liquidity and Capital Resources
Sources of Liquidity
Our primary need for liquidity is to fund working capital requirements, capital expenditures and for general corporate purposes, including to develop new technologies, make investments in or acquisitions of other businesses, solutions or technologies, and to repay portions of outstanding borrowings and interest on such borrowings. We have funded our operations primarily through cash from operating activities, debt borrowings, and the issuance of common and convertible preferred stock. As of December 31, 2017, we had cash and cash equivalents of $7.7 million.
For the years ended December 31, 2017, 2016, and 2015, our losses from operations were $11.7 million, $20.9 million, and $1.5 million, respectively, and cash used in operations was $14.6 million, $24.5 million, and $16.2 million, respectively. As a result of our lower than anticipated new client bookings and several unexpected Enterprise Commercial segment customers leaving the Individual and Family Health Plan (IFP) market and not renewing their IFP solutions in 2017, along with our continued efforts to grow our client base and invest in our software solutions, our December 31, 2017 liquidity was less than we previously expected.
The Company has taken a number of actions in 2016 through first quarter of 2018 to continue to support its operations and meet its obligations including the following:
|
|
• |
On May 2, 2016, we issued and sold the newly created Series A Preferred Stock for an aggregate purchase price of $52.0 million. Net of customary transaction costs, we received cash of approximately $49.3 million, of which we used approximately $30.6 million to subsequently repay the principal balance, accrued interest, loan termination and professional fees associated with the THL Note; |
|
|
• |
On June 8, 2016, we amended our existing senior credit facility (“Senior Credit Facility”), resulting in the extension of the facility to June 8, 2021 from January 18, 2018 and increased the term loan funding to $35.0 million from approximately $20.0 million; |
|
|
• |
During the second half of 2016 and in 2017 we put a greater focus on our overall profitability and aligning our cost structure with revenue and customer billings. We reduced our headcount to 320 at December 31, 2017, compared to 411 at December 31, 2015. We also consolidated the procurement of outside contract labor resources to reduce our cost of delivery; |
|
|
• |
On March 10, 2017, we completed the issuance of a newly created Series B Preferred Stock for an aggregate purchase price of $17.5 million. Net of customary transaction costs, we received cash of approximately $16.8 million, of which we used approximately $0.6 million to repay our outstanding Senior Credit Facility revolving line of credit balance, with the remainder of the net proceeds available for general corporate purposes; |
55
|
|
Minimum Liquidity covenants, and (iii) increase the available revolving credit facility from $500 to $6,000 through the later of June 4, 2018 or the Outside Date. The Outside Date will be deemed to have occurred prior to the date set forth above upon (i) an event of default under the Senior Credit Facility, (ii) termination of the Merger Agreement under certain circumstances and (iii) the consummation of the Merger or alternative acquisition as contemplated under the Merger Agreement; and |
|
|
• |
Finally, on January 4, 2018, we entered into an Agreement and Plan of Merger (the “Merger Agreement”) with FP Healthcare Holdings, Inc. (“Parent”), and FP Healthcare Merger Sub Corporation, a wholly owned subsidiary of Parent (“Merger Subsidiary”), providing for the merger of Merger Subsidiary with and into the Company (the “Merger”), with the Company surviving the Merger as a wholly owned subsidiary of Parent. The Merger, if consummated by June 4, 2018, will result in the Company becoming a privately held company, which will eliminate the ongoing public company expense. Additionally, the Parent sponsors have agreed to invest up to $15.0 million of new capital and the Parent has secured a New Senior Credit Facility (“New Credit Facility”) that upon consummation of the Merger would provide the Company up to a $42.0 million term loan and $5.0 million line of credit. Although we believe the proposed Merger and related equity and debt financing are likely to occur and should provide us sufficient financing to meet our operating needs, successful completion of the Merger and financing are dependent on factors outside of our control. As such, we cannot conclude that the Merger will be effectively implemented within one year after the date that the consolidated financial statements are issued. |
While our historical operating results indicate conditions exist that raise uncertainty related to our ability to continue as a going concern, we believe the actions taken and the Merger and related equity and debt financing discussed above is likely of occurring and mitigating the uncertainty raised by our historical operating results. We recognize, however, that successful and timely completion of the Merger is dependent on factors outside of our control. As such we cannot conclude that our Merger and related equity and debt financing will be effectively implemented before the existing minimum liquidity financial covenant of the Senior Credit Facility increases from $1.5 million to $15.0 million, and if we cannot meet our Senior Credit Facility Minimum Liquidity and EBITDA covenants, all of our outstanding indebtedness (approximately $32.6 million as of December 31, 2017) would become immediately payable and result in our inability to continue as a going concern without new financing.
Refer to Notes 3, 9, 10 and 15 of the Notes to Consolidated Financial Statements included in Part II, Item 8: “Financial Statements and Supplementary Data” of this Annual Report on Form 10-K for further detail.
Senior Credit Facility
We have a bank credit facility, as amended and restated from time to time (the “Senior Credit Facility”) that provides for short-term working capital and long-term investment needs.
On June 8, 2016, the Senior Credit Facility was amended and restated (the “June 2016 Amendment”), to among other things (i) extend the maturity date to June 8, 2021 from January 18, 2018, (ii) continue to provide for up to $10.0 million of revolving credit through maturity date (the “Senior Revolving Credit Facility”), and (iii) increase the term loan funding to $35.0 million (the “Senior Term Loan”).
The June 2016 Amendment was accounted for as an extinguishment of debt resulting in the immediate recognition of $0.4 million of previous deferred financing costs, which was recorded in Other expense, net in the statements of operations for the year ended December 31, 2016.
On November 4, 2016, we amended the Senior Credit Facility (the “November 2016 Amendment”), to among other things, (i) remove the Net Leverage Covenant and replace it with a trailing twelve month EBITDA covenant, as defined in the November 2016 Amendment, to be measured quarterly effective as of September 30, 2016, (ii) increase the Minimum Liquidity covenant from $10.0 million to $11.5 million, effective November 4, 2016, and $15.0 million effective September 30, 2017, (iii) increase the annual principal repayments on the Senior Term Loan, and (iv) increase the interest rate on applicable borrowings effective November 4, 2016. In connection with this amendment, we repaid $2.0 million of the outstanding Senior Term Loan and incurred bank fees of approximately $0.3 million.
On March 10, 2017, we amended the Senior Credit Facility (the “March 2017 Amendment”), to among other things, (i) defer scheduled Senior Term Loan principal repayments until March 31, 2018, at which time quarterly principal repayments of $1.3 million will resume through March 31, 2021; (ii) replace the existing covenants with (a) a trailing twelve month EBITDA covenant of negative $12.0 million as of December 31, 2016 and a quarterly building EBITDA covenant through December 31, 2017, and a trailing twelve month EBITDA covenant from March 31, 2018 forward, as defined in the March 2017 Amendment, and (b) a minimum liquidity requirement of $1.5 million at all times from March 1, 2017 through March 31, 2018, and $15.0 million thereafter; and (iii) provide for an incremental 2.50% per annum paid-in-kind interest on all obligations from March 10, 2017 through the
56
maturity date, which shall increase the outstanding principal balance of the Senior Term Loan. The quarterly building EBITDA, as defined in the March 2017 Amendment, requires achievement of at least negative $3,000 for twelve months ended December 31, 2017 and March 31, 2018, positive $8,000 for the twelve months ended June 30, 2018 and September 30, 2018, and positive $9,000 for the twelve months ended December 31, 2018 and March 31, 2019.
On January 4, 2018, we amended the Senior Credit Facility (the “January 2018 Amendment”), to among other things, (i) increase the available Senior Revolving Credit Facility by $5,500 to $6,000 through the later of June 4, 2018 and the approved outside date of an alternative acquisition as contemplated under the January 4, 2018 Merger Agreement (the “Outside Date”), (ii) defer scheduled March 31, 2018 Term Loan principal repayments until the Outside Date, at which time the deferred $1,313 is due and quarterly principal repayments of $1,313 will resume through March 31, 2021; (iii) replace the existing covenants with a minimum liquidity requirement of $1,500 at all times from March 1, 2017 through the Outside Date. The Outside Date will be deemed to have occurred prior to the date set forth above upon (i) an event of default under the Senior Credit Facility, (ii) termination of the Merger Agreement under certain circumstances and (iii) the consummation of the Merger or alternative acquisition as contemplated under the Merger Agreement.
The Senior Credit Facility contains covenants and customary representations and warranties, as well as various limitations on the activities of the Company as they relate to additional indebtedness, junior liens, investments, capital expenditures, paying dividends, and mergers and acquisitions. As of December 31, 2017, we were in compliance with the financial covenants under the Senior Credit Facility, and on March 29, 2018, we obtained a waiver of the Senior Credit Facility requirement to deliver audited financial statements without a “going concern” emphasis of matter paragraph. The Company expects to be in compliance with the Senior Credit Facility covenants from the waiver date through the anticipated second quarter 2018 Merger consummation date.
As of December 31, 2017, the interest rates on our outstanding Senior Term Loan and the Senior Revolving Credit Facility were 10.33% and 12.50%, respectively, including the incremental 2.50% per annum paid-in-kind interest.
Subordinated Loans
Prior to May 3, 2016 we had a Senior Subordinated Term Loan Agreement with THL Corporate Finance, Inc., or the THL Note, for total proceeds of $30.0 million less $0.7 million of original issue discount. On May 3, 2016, we repaid the $30.0 million principal and accrued interest to settle the THL Note. The early extinguishment of the THL Note triggered a $0.6 million breakage fee and the immediate recognition of the remaining $0.5 million of OID and deferred financing costs, which were recorded in Other expense, net in the consolidated statement of operations and comprehensive loss for the year ended December 31, 2016 (see Note 8 of the Notes to Consolidated Financial Statements included in Part II, Item 8: “Financial Statements and Supplementary Data” of this Annual Report on Form 10-K).
Outstanding Senior Credit Facility and Loan Balances
The Following table summarizes the principal balances of our outstanding borrowings as of December 31, 2017:
|
|
|
Outstanding |
|
|
|
|
|
Principal Balance |
|
|
|
|
|
(in thousands) |
|
|
|
Credit Facility: Revolving line of credit |
|
$ |
— |
|
|
Credit Facility: Term loans |
|
|
32,616 |
|
|
|
|
$ |
32,616 |
|
Preferred Stock
On May 2, 2016, we issued and sold a newly created Series A Preferred Stock for an aggregate purchase price of $52.0 million. Net of customary transaction costs, we received cash of approximately $49.3 million, of which we used approximately $30.6 million to subsequently repay the principal balance, accrued interest, loan termination and professional fees associated with the THL Note and the balance was available for general corporate purposes.
The shares of Series A Preferred Stock are convertible into shares of our common stock (the “Series A Conversion Shares”) at the option of the investors at any time and they are redeemable at the option of the investors after May 2, 2023, or if there is a Fundamental Change (as that term is defined in the Certificate of Designations, Preferences and Rights of the Series A Convertible Preferred Stock). Beginning May 2, 2018, we may force conversion if the closing price of the common stock is at least 175% of the conversion price of the Series A Preferred Stock for 45 consecutive trading days, with a minimum average trading volume of at least 75,000 shares for 40 of such 45 trading days. Each share of Series A Preferred Stock is convertible into a number of Series A Conversion Shares equal to (i) the sum of (a) the stated value per share of Series A Preferred Stock, plus (b) all accrued and unpaid
57
dividends thereon up to but not including the conversion date, divided by (ii) the conversion price of the Series A Preferred Stock at such time (which initially is $4.50 per share, subject to customary anti-dilution adjustments). On March 10, 2017, the conversion price of the Series A Preferred Stock was adjusted to $3.96 per share as a result of the issuance of Series B Preferred Stock.
On March 10, 2017, we issued and sold a newly created Series B Preferred Stock for an aggregate purchase price of $17.5 million. Net of customary transaction costs, we received cash of approximately $16.8 million, of which we used approximately $0.6 million to repay our outstanding revolving line of credit balance, with the remainder of the net proceeds available for general corporate purposes.
The shares of Series B Preferred Stock are convertible into shares of our common stock (the “Series B Conversion Shares”) at the option of the investors at any time and they are redeemable at the option of the investors after May 2, 2023, or if there is a Fundamental Change (as that term is defined in the Certificate of Designations, Preferences and Rights of Series B Convertible Preferred Stock). Beginning March 10, 2019, we may force conversion if the closing price of the common stock is at least 175% of the conversion price of the Series B Preferred Stock for 45 consecutive trading days, with a minimum average trading volume of at least 75,000 shares for 40 of such 45 trading days. Each share of Series B Preferred Stock is convertible into a number of Series B Conversion Shares equal to (i) the sum of (a) the stated value per share of Series B Preferred Stock, plus (b) all accrued and unpaid dividends thereon up to but not including the conversion date, divided by (ii) the conversion price of the common stock at such time (which initially is $1.91 per share, subject to certain anti-dilution adjustments).
Preferred Stock Dividends
There have been no cash dividends paid in connection with the Series A or Series B Preferred Stock.
Holders of Series A Preferred Stock are entitled to a cumulative dividend at the rate of 7.5% per annum (subject to adjustment), payable quarterly in arrears. The dividends are to be paid in-kind, through an increase in the number of shares of common stock into which shares of Series A Preferred Stock are convertible, through at least May 2, 2018, and thereafter in cash or in-kind at our option. Upon the occurrence of certain events, the dividend rate will increase.
Holders of Series B Preferred Stock are entitled to a cumulative dividend at the rate of 15% per annum (subject to adjustment), payable quarterly in arrears. The dividends are to be paid in-kind, through an increase in the number of shares of common stock into which shares of Series B Preferred Stock are convertible, through at least March 10, 2019, and thereafter in cash or in-kind at our option. Upon the occurrence of certain events, the dividend rate will increase.
Cash Flows
Our cash flows were as follows for the years ended December 31, 2017, 2016 and 2015:
|
|
|
Year Ended December 31, |
|
|||||||||
|
|
|
2017 |
|
|
2016 |
|
|
2015 |
|
|||
|
|
|
(in thousands) |
|
|
|
|
|
|||||
|
Net cash flows (used in) provided by: |
|
|
|
|
|
|
|
|
|
|
|
|
|
Operating activities |
|
$ |
(14,620 |
) |
|
$ |
(24,469 |
) |
|
$ |
(16,192 |
) |
|
Investing activities |
|
|
(232 |
) |
|
|
(5,682 |
) |
|
|
(1,317 |
) |
|
Financing activities |
|
|
16,387 |
|
|
|
30,935 |
|
|
|
(5,319 |
) |
|
Net increase (decrease) in cash and cash equivalents |
|
$ |
1,535 |
|
|
$ |
784 |
|
|
$ |
(22,828 |
) |
Operating Activities
For the year ended December 31, 2017, our net cash and cash equivalents used in operating activities of $14.6 million consisted of a net loss of $15.5 million and $8.7 million of cash used by changes in working capital, partially offset by $9.6 million in adjustments for non-cash items. The cash used in working capital primarily consisted of a decrease in deferred revenue of $3.2 million, a $2.7 million increase in accounts receivable due to timing of certain contractual billing milestones, a $1.8 million decrease in accounts payable and a $1.0 million decrease in deferred implementation costs for amortization of previously installed customer solutions. The decrease in deferred revenue was a result of recognizing previously deferred upfront fees which are recognized as revenue ratably over the longer of the estimated period of customer benefit or contract, beginning once the software services have commenced. Overall the operating cash used was primarily a result of (i) lower than expected 2017 bookings, particularly in the Enterprise/Commercial segment, (ii) continued investment in research and development, and (iii) severance and workforce alignment cash expenditures as we continued to execute on our executive leadership, sales organization, and go to market transition strategy begun in late 2016.
For the year ended December 31, 2016, our net cash and cash equivalents used in operating activities of $24.5 million consisted of a net loss of $26.5 million and $7.8 million of cash used by changes in working capital, partially offset by $9.8 million in
58
adjustments for non-cash items. The cash used in working capital primarily consisted of a decrease in deferred revenue of $12.2 million, partially offset by a $2.8 million decrease in accounts receivable due to increased collection efforts, and a $1.3 million increase in deferred implementation costs for new customers. The decrease in deferred revenue was a result of recognizing previously deferred upfront fees which are recognized as revenue ratably over the longer of the estimated period of customer benefit or contract, beginning once the software services have commenced. Overall the operating cash used was primarily a result of (i) lower than expected 2016 bookings and fourth quarter variable transaction revenue, (ii) continued investment in research and development, and (iii) higher than anticipated costs of delivery during a year of executive leadership, sales organization, and go to market transitions. Between the cost reduction actions taken in 2016 and those planned in 2017, we expect to decrease our total cost structure and reduce the cash used in operations by at least $15.0 million from 2016 levels.
For the year ended December 31, 2015, our net cash and cash equivalents used in operating activities of $16.2 million consisted of a net loss of $7.3 million and $19.4 million of cash used by changes in working capital, partially offset by $10.6 million in adjustments for non-cash items. The decrease in cash resulting from changes in working capital primarily consisted of a decrease in deferred revenue of $21.2 million. The decrease in deferred revenue was a result of recognizing previously deferred upfront fees which are recognized as revenue ratably over the longer of the estimated period of customer benefit or contract, beginning once the software services have commenced.
A substantial amount of revenue in a period comes from the recognition of previously collected and deferred revenue, while period-end accounts receivable balances are directly influenced by the timing of contractually negotiated milestone and time-based advance billings and their subsequent collection. We generally have the contractual right to invoice and collect fees from customers ahead of delivery and revenue recognition of our software and professional services.
Investing Activities
For the year ended December 31, 2017, net cash used in investing activities was $0.2 million, consisting $0.3 million for the purchase of property and equipment offset by $0.1 million of cash received from the finalization of the working capital adjustment related to the June 2016 acquisition of ConnectedHealth.
For the year ended December 31, 2016, net cash used in investing activities was $5.7 million, consisting of $4.7 million for the acquisition of ConnectedHealth, net of cash acquired, and $1.0 million, for the purchase of property and equipment.
For the year ended December 31, 2015, net cash used in investing activities was $1.3 million, for the purchase of property and equipment.
Financing Activities
Net cash provided by financing activities totaled $16.4 million for 2017, consisting of $16.8 million net proceeds from our March 10, 2017 Series B Preferred Stock offering. The proceeds were partially offset by payment of $0.4 million of financing and other fees. As a result of our March 10, 2017 amendment to the Senior Credit Facility we were permitted to defer all Senior Term Loan principal repayments until March 31, 2018.
Net cash provided by financing activities totaled $30.9 for 2016, consisting of $49.3 million net proceeds from our May 2, 2016 Series A Preferred Stock offering and $16.2 million of term debt borrowings under our Senior Credit Facility. The proceeds were partially offset by the $33.3 million repayment of the THL Note and term debt borrowings and payment of $1.1 million of financing and other fees.
For the year ended December 31, 2015, net cash used in financing activities totaled $5.3 million and consisted of $4.8 million in repayments of debt and capital lease obligations and $0.7 million in payments of offering costs related to our December 2014 IPO, offset by $0.3 million in net proceeds from employee stock option transactions.
Operating and Capital Expenditure Requirements
We believe that our existing cash and cash equivalent balances, the $6.0 million available revolving credit facility following the January 4, 2018 amendment of the Senior Credit Facility, and the proposed Merger related equity capital and debt financing, along with our actions to reduce our operating expenses and increase pricing for our software services will provide liquidity sufficient to meet our anticipated cash requirements through at least the next 12 months, including expected capital expenditure requirements of approximately $0.8 million. We recognize, however, that the successful and timely completion of the Merger is dependent on factors outside of our control, and as such there can be no assurance that the proposed Merger and related refinancing will occur before our existing Senior Credit Facility financial covenants become more restrictive. If we are unable to meet or amend the Senior Credit Facility financial covenants and cannot generate sufficient additional liquidity through the proposed Merger described above or
59
through additional support from the Company’s investor base or some combination of other actions, all of the Company’s scheduled senior indebtedness (approximately $32.6 million at December 31, 2017) would become immediately due and payable in the event of default.
If our existing cash and cash equivalents and available Senior Revolving Credit Facility are insufficient to fund our operation prior to the consummation of the proposed Merger, or if the proposed Merger is not consummated as planned, we may seek to sell additional equity or convertible debt securities or enter into an additional credit facility. The sale of equity and convertible debt securities may result in dilution to our stockholders and those securities may have rights senior to those of our common shares. If we raise additional funds through the issuance of convertible debt securities, these securities could contain covenants that would restrict our operations. We may require additional capital beyond our currently anticipated amounts. Additional capital may not be available on reasonable terms, or at all.
Quarterly Trends and Seasonality
Our overall operating results fluctuate from quarter to quarter as a result of a variety of factors, some of which are out of our control. These fluctuations are primarily driven by an increase in the third and fourth quarters in activity at our customers in preparation for and during the annual insurance enrollment cycle, which occurs annually during our fourth quarter. Our historical results should not be considered a reliable indicator of our future results of operations.
Contractual Obligations and Commitments
Our principal commitments consist of obligations under our outstanding debt facilities, non-cancelable leases for our office space and computer equipment, purchase commitments for our co-location and other support services.
The following table reflects our revised estimated principal and interest payments as of December 31, 2017. Future events could cause actual payments to differ from these estimates.
|
|
|
|
|
|
|
Less than 1 |
|
|
|
|
|
|
|
|
|
|
More than 5 |
|
||
|
Contractual Obligations: |
|
Total |
|
|
year |
|
|
1-3 years |
|
|
3-5 years |
|
|
years |
|
|||||
|
|
|
(In thousands) |
|
|||||||||||||||||
|
Long-term debt—Revolving line of credit |
|
|
|
|
|
|
|
|
|
|
|
|
|
|
|
|
|
|
|
|
|
Principal (1) |
|
$ |
— |
|
|
$ |
— |
|
|
$ |
— |
|
|
$ |
— |
|
|
$ |
— |
|
|
Interest (2) |
|
|
— |
|
|
|
— |
|
|
|
— |
|
|
|
— |
|
|
|
— |
|
|
Long-term debt—Other senior and subordinated(4) |
|
|
|
|
|
|
|
|
|
|
|
|
|
|
|
|
|
|
|
|
|
Principal (3) |
|
|
34,823 |
|
|
|
5,250 |
|
|
|
10,500 |
|
|
|
19,073 |
|
|
|
— |
|
|
Interest (2) |
|
|
6,798 |
|
|
|
2,423 |
|
|
|
3,776 |
|
|
|
599 |
|
|
|
— |
|
|
Operating lease obligations |
|
|
7,120 |
|
|
|
1,414 |
|
|
|
2,303 |
|
|
|
1,983 |
|
|
|
1,420 |
|
|
Total |
|
$ |
48,741 |
|
|
$ |
9,087 |
|
|
$ |
16,579 |
|
|
$ |
21,655 |
|
|
$ |
1,420 |
|
|
(1) |
Repayment of the revolving line of credit is due at end of the term in June 2021. The January 4, 2018 amendment increased the availability on the Revolving line of credit from $0.5 million to $6.0 million. There have been no borrowings subsequent to December 31, 2017 through the date of this Annual Report on Form 10-K. |
|
(2) |
Includes estimated interest payments based on contractual rates as of December 31, 2017. |
|
(3) |
Principal includes the 2.50% per annum paid-in-kind interest, which increases the outstanding principal balance of the term loan and is payable at maturity. |
|
(4) |
Amounts are classified as current on the December 31, 2017 in the Consolidated Financial Statements included in Part II, Item 8, because if the proposed Merger doesn’t close as we anticipate we may not be in compliance with certain covenants of our Senior Credit Facility during 2018, which would result in such amounts becoming due immediately, as discussed further in Notes 3, 9 and 17 to Consolidated Financial Statements included in Part II, Item 8: “Financial Statements and Supplementary Data” of this Annual Report on Form 10-K. |
Off-Balance Sheet Arrangements
None.
Recent Accounting Pronouncements
See Note 2 to the Consolidated Financial Statements for information on new accounting standards.
60
The JOBS Act contains provisions that, among other things, reduce certain reporting requirements for qualifying public companies. As defined in the JOBS Act, a public company whose initial public offering of common equity securities occurred after December 8, 2011 and whose annual gross revenue is less than $1.07 billion will, in general, qualify as an “emerging growth company” until the earliest of:
|
|
• |
the last day of its fiscal year following the fifth anniversary of the date of its initial public offering of common equity securities; |
|
|
• |
the last day of its fiscal year in which it has annual gross revenue of $1.07 billion or more; |
|
|
• |
the date on which it has, during the previous three-year period, issued more than $1.0 billion in non-convertible debt; and |
|
|
• |
the date on which it is deemed to be a “large accelerated filer,” which will occur at such time as the company (a) has an aggregate worldwide market value of common equity securities held by non-affiliates of $700 million or more as of the last business day of its most recently completed second fiscal quarter, and (b) has been required to file annual and quarterly reports under the Securities Exchange Act of 1934 for a period of at least 12 months and (c) has filed at least one annual report pursuant to the Securities Act of 1934. |
Under this definition, we are an “emerging growth company” and could remain an emerging growth company until as late as December 31, 2019.
As an “emerging growth company” we have chosen to rely on such exemptions and are therefore not required to, among other things, (i) provide an auditor’s attestation report on our system of internal controls over financial reporting pursuant to Section 404, (ii) provide all of the compensation disclosure that may be required of non-emerging growth public companies under the Dodd-Frank Wall Street Reform and Consumer Protection Act and (iii) comply with any requirement that may be adopted by the PCAOB regarding mandatory audit firm rotation or a supplement to the auditor’s report providing additional information about the audit and the financial statements (auditor discussion and analysis).
We have operations solely in the United States and are exposed to market risks in the ordinary course of our business. Market risk is the risk of loss to future earnings, values or future cash flows that may result from changes in the price of a financial instrument. The value of a financial instrument might change as a result of changes in interest rates, exchange rates, commodity prices, equity prices and other market changes. We do not use derivative financial instruments for speculative, hedging or trading purposes, although in the future we might enter into exchange rate hedging arrangements to manage the risks described below.
Interest Rate Risk
We are exposed to market risk related to changes in interest rates. Borrowings under the term loan and revolving line of credit with Wells Fargo Bank, which was entered into in January 2013, as amended, bear interest at rates that are variable. Increases in the LIBOR or Prime Rate would increase the amount of interest payable under these borrowings. We had total borrowings subject to a variable interest rate of $32.6 million and $32.5 million as of December 31, 2017, and 2016, respectively. As a result, each change of one percentage point in interest rates would result in an approximately $0.3 million and approximately $0.3 million change in our annual interest expense on our outstanding borrowings as of December 31, 2017 and 2016, respectively. Any debt we incur in the future may also bear interest at variable rates.
Inflation Risk
We do not believe that inflation has had a material effect on our business, financial condition, or results of operations. We continue to monitor the impact of inflation in order to minimize its effects through pricing strategies, productivity improvements and cost reductions. If our costs were to become subject to significant inflationary pressures, we may not be able to fully offset such higher costs through price increases. Our inability or failure to do so could harm our business, financial condition, and results of operations.
The information required by this item is incorporated by reference to the consolidated financial statements and accompanying notes set forth on pages F-1 through F-27 of this Annual Report on Form 10-K.
None.
61
Disclosure Controls and Procedures
The term “disclosure controls and procedures,” as defined in Rules 13a-15(e) and 15d-15(e) under the Exchange Act, refers to controls and procedures that are designed to ensure that information required to be disclosed by a company in the reports that it files under the Exchange Act is recorded, processed, summarized and reported, within the time periods specified in the SEC’s rules and forms. Disclosure controls and procedures include, without limitation, controls and procedures designed to ensure that such information is accumulated and communicated to a company’s management, including its principal executive and principal financial officers, as appropriate to allow timely decisions regarding required disclosure.
Our management, with the participation of our Chief Executive Officer and Chief Financial Officer, has evaluated the effectiveness of our disclosure controls and procedures as of December 31, 2017, the end of the period covered by this Annual Report on Form 10-K. Based upon such evaluation, our Chief Executive Officer and Chief Financial Officer have concluded that our disclosure controls and procedures were not effective as of such date, due to the material weakness in our internal control over financial reporting discussed below.
Material Weakness in Internal Control over Financial Reporting
In the fourth quarter of 2017, a material weakness in our internal control over financial reporting was identified. A material weakness is a deficiency, or combination of deficiencies, in internal control over financial reporting, such that there is a reasonable possibility that a material misstatement of our annual or interim financial statements will not be prevented or detected on a timely basis. The material weakness identified was related to our preparation and review of our annual goodwill impairment evaluation, which resulted in an initial incorrect assessment and measurement of a goodwill impairment charge related to our Enterprise/Commercial segment. The error has been corrected and the reported goodwill impairment charge for the year ended December 31, 2017 and the Enterprise/Commercial segment goodwill, net of accumulated impairments, as of December 31, 2017 is correctly stated in our annual report included in this Form 10-K. While our current and prior consolidated financial statements, as filed with the SEC, have not been misstated as a result of this material weakness, our management has determined that the control deficiency could have resulted in the misstatement of account balances or disclosures that could be material to our annual or interim consolidated financial statements, and such misstatement may not have been prevented or detected. Accordingly, our management has determined this control deficiency is a material weakness.
Remediation Plan
The control found to be deficient occurs when there are indicators of potential impairment of goodwill, and at least annually. We anticipate enhancing the review process for our goodwill impairment evaluation, including formalizing the review process activities and documentation of those activities. We believe that this enhancement will remediate the material weakness, but the material weakness will not be considered remediated until the revised control operates for a sufficient period of time and management can thoroughly test and conclude that the control is designed and operating effectively.
Changes in Internal Control Over Financial Reporting
Except for the identification of the material weakness described above, there were no changes during the quarter ended December 31, 2017 in our internal control over financial reporting that have materially affected, or are reasonably likely to materially affect, our internal control over financial reporting.
Management’s Report on Internal Control Over Financial Reporting and Attestation Report of Registered Public Accounting Firm
Our management is responsible for establishing and maintaining adequate internal control over financial reporting, as such term is defined in Exchange Act Rules 13a-15(f) and 15d-15(f). Under the supervision and with the participation of our management, including our principal executive officer and principal financial officer, we conducted an evaluation of the effectiveness of our internal control over financial reporting based on the framework in Internal Control—Integrated Framework (2013) issued by the Committee of Sponsoring Organizations of the Treadway Commission. Based on the evaluation, our management concluded that our internal control over financial reporting was not effective as of December 31, 2017, due to the material weakness in our internal control over financial reporting discussed above.
Because of its inherent limitations, internal control over financial reporting may not prevent or detect misstatements. Therefore, even those systems determined to be effective can provide only reasonable assurance with respect to financial statement preparation and presentation. Also, projections of any evaluation of the effectiveness of internal control over financial reporting to future periods are subject to the risk that the controls may become inadequate because of changes in conditions, or that the degree of compliance with the policies or procedures may deteriorate.
62
The JOBS Act permits “emerging growth companies” like us to take advantage of certain exemptions from various reporting requirements applicable to other public companies that are not emerging growth companies. Because we are an emerging growth company, we are exempt from the requirements of auditor attestation reports on the effectiveness of our internal control over financial reporting. We will continue to be exempt until we no longer qualify as an emerging growth company.
Limitations on Controls
Our disclosure controls and procedures and internal control over financial reporting are designed to provide reasonable assurance of achieving their objectives as specified above. Management does not expect, however, that our disclosure controls and procedures or our internal control over financial reporting will prevent or detect all error and fraud. Any control system, no matter how well designed and operated, is based upon certain assumptions and can provide only reasonable, not absolute, assurance that its objectives will be met. Further, no evaluation of controls can provide absolute assurance that misstatements due to error or fraud will not occur or that all control issues and instances of fraud, if any, within our company have been detected.
On March 29, 2018, the Company and its wholly owned-subsidiary, DestinationRX, Inc., entered into a limited waiver of the Amended and Restated Credit Agreement with Wells Fargo Bank, National Association, as administrative agent for the lenders named therein (the “Agent”), pursuant to which the Agent, on behalf of the lenders, agreed to a limited waiver of the requirement under the Senior Credit Facility that the Company deliver audited financial statements for the Company’s 2017 fiscal year without a “going concern” or like qualification or exception (the “Waiver”).
As discussed in Note 3 of the Notes to Consolidated Financial Statements included in Part II, Item 8: “Financial Statements and Supplementary Data” of this Annual Report on Form 10-K, we have concluded the timing of the proposed Merger is outside of our control and may not occur before the Company expects it would not be in compliance with certain of the financial covenants under the Senior Credit Facility. As such, if the proposed Merger does not occur as anticipated the Company would likely not have sufficient capital to repay the loans under the Senior Credit Facility, which would become immediately due upon covenant default, which raises substantial doubt about our ability to continue as a going concern and has resulted in our Registered Public Accounting Firm’s issuance of an unqualified audit opinion with an explanatory “going concern” paragraph related to the Consolidated Financial Statements included in Part II, Item 8: “Financial Statements and Supplementary Data” of this Annual Report on Form 10-K.
The Company anticipates continued compliance with the Senior Credit Facility covenants from the date of the Waiver through the anticipated closing date of the proposed Merger.
The Waiver is filed as Exhibit 10.8.5 to this Annual Report on Form 10-K and incorporated into this Item 9B by reference, and the foregoing summary of the Waiver is qualified in its entirety by reference to such exhibit.
63
Directors
We have a classified board of directors consisting of four Class I directors, two Class II directors and three Class III directors. At each annual meeting of stockholders, directors are elected for a term of three years to succeed those directors whose terms expire at the annual meeting date. Information regarding our directors as of March 16, 2018 is set forth below.
|
Name |
|
Position |
|
Age |
|
Director Since |
|
Class I Directors Whose Terms Expire at the 2018 Annual Meeting of Stockholders: |
||||||
|
David A. Jones, Jr. |
|
Chairman |
|
60 |
|
2004 |
|
Kraig McEwen |
|
Director |
|
45 |
|
2017 |
|
Jeffery A. Surges |
|
President, Chief Executive Officer and Director |
|
50 |
|
2015 |
|
Russell S. Thomas |
|
Director |
|
55 |
|
2015 |
|
Class II Directors Whose Terms Expire at the 2019 Annual Meeting of Stockholders: |
||||||
|
A. John Ansay |
|
Director |
|
61 |
|
2014 |
|
Ezra Perlman |
|
Director |
|
46 |
|
2016 |
|
Class III Directors Whose Terms Expire at the 2020 Annual Meeting of Stockholders: |
||||||
|
Vickie L. Capps |
|
Director |
|
56 |
|
2014 |
|
Paul Kusserow |
|
Director |
|
56 |
|
2014 |
Directors Continuing in Office Until the 2018 Annual Meeting of Stockholders
Jeffery A. Surges has served as our Chief Executive Officer and as a member of our board of director since November 2015 and as our President since August 2016. Prior to joining the Company, Mr. Surges served as President of Healthgrades Operating Company, Inc., an online resource for comprehensive information about physicians and hospitals, from June 2014 through April 2015. Previously, Mr. Surges served as the Chief Executive Officer of Merge Healthcare Inc., a medical imaging company acquired by IBM in 2015, from November 2010 through August 2013, and as President of Sales for Allscripts Healthcare Solutions, Inc., a provider of healthcare information technology solutions, from January 2008 through November 2010. Mr. Surges also served as Chief Executive Officer of Extended Care Information Network, Inc. from 1999 through its acquisition by Allscripts Healthcare Solutions in December 2007. Mr. Surges currently serves on the board of directors of Orthus Health, Inc. and previously served as the chairman of the board of directors of Strategic Health Services, a privately held company, and previously served on the board of directors of Merge Healthcare from May 2010 through August 2013. Mr. Surges holds a B.A. from Eastern Illinois University. We believe that Mr. Surges’ extensive leadership experience with healthcare information technology companies and in the healthcare industry, along with his perspective as our Chief Executive Officer, makes him a crucial member of our board of directors.
David A. Jones, Jr. has been a member of our board of directors since 2004 and Chairman of the Board since 2011. Mr. Jones is the Chairman of Chrysalis Ventures, LLC, a venture capital firm which he founded in 1993. Mr. Jones has served on the board of directors of Humana Inc. (NYSE: HUM), a leading health and well-being company, since 1993 and served as chairman of the board from 2005 through 2010. In addition, Mr. Jones currently serves on the boards of Foundation Radiology Group, Inc., Insider Louisville, and meQuilibrium. Mr. Jones also serves on the board of the Humana Foundation and is a member of the Health Executives Network. Mr. Jones has a B.A. from Yale University and a J.D. from Yale Law School. We believe Mr. Jones’ diverse experience in the healthcare industry and his knowledge of emerging technologies and business models through his experience as a successful venture capital investor make him a valuable member and Chairman of our board of directors.
Kraig McEwen has been a member of our board of directors since May 2017. Since January 2017, Mr. McEwen has served as the Executive Chair and Board Member of TrellisRx, Inc., a specialty pharmacy services company. Prior to TrellisRx, Mr. McEwen was Chief Executive Officer of Aesynt, Inc., a provider of medication management systems for health systems, from November 2011 through January 2016. Mr. McEwen serves on the private company boards of Foundation Radiology Group Inc., Quantros, Inc., and Alung, Inc. Mr. McEwen holds a B.S. from Penn State University and an M.B.A. from University of Pittsburgh. We believe Mr. McEwen’s business leadership experience in the healthcare technology and services businesses make him a valuable member of our board of directors.
Russell S. Thomas has been a member of our board of directors since January 2015. Mr. Thomas currently serves as the Chief Executive Officer of Availity LLC, a provider of health information exchange services to healthcare providers and health plans, where he previously served as President and Chief Operating Officer from January 2008 to March 2012. Prior to joining Availity, Thomas served as the CEO of Gold Standard, Inc., a health information technology company. Mr. Thomas also serves on the board of directors of the eHealth Initiative, a non-profit, membership organization for the healthcare industry focused on information technology.
64
Mr. Thomas holds a B.A. from Virginia Tech and a J.D. from the University of Virginia School of Law. We believe that Mr. Thomas’ significant experience in the healthcare industry and with health information companies makes him a valuable member of our board of directors.
Directors Continuing in Office Until the 2019 Annual Meeting of Stockholders
A. John Ansay has been a member of our board of directors since August 2014. Mr. Ansay is the co-founder of Equian, LLC (formerly Health Systems International, Inc.), a payment integrity service and technology provider to the commercial health and workers’ compensation markets that he co-founded in 2001. He has also served as a Principal for Ansay & Associates, LLC, an independent insurance agency, since 1980. He was on the board of directors of Equian, Ansay & Associates and The Retirement Advantage, a third-party administrator for retirement plans. Mr. Ansay holds a B.S. in business from Marquette University. He was a Certified Insurance Counselor (CIC) and holds an inactive Certified Public Accountant (CPA) license. We believe that Mr. Ansay’s diverse experience in the healthcare industry and insurance industries makes him a valuable member of our board of directors.
Ezra Perlman has been a member of our board of directors since April 2016. Mr. Perlman is a Co-President of Francisco Partners and focuses primarily on investments in the software and services sectors, with a specific emphasis on healthcare technology. Prior to joining Francisco Partners in 2003, Mr. Perlman was a venture capitalist with Battery Ventures, where he was involved in identifying, executing and managing private equity investments in software companies. Mr. Perlman serves on the board of directors of Avalon Healthcare Solutions, LLC, eSolutions Inc., HealthcareSource HR, Inc., Landmark Health, LLC, Nextech Systems, LLC, and QGenda, Inc., all privately held companies. Mr. Perlman holds a B.A. in applied mathematics from Harvard University and an M.B.A. from the Stanford Graduate School of Business. We believe Mr. Perlman’s diverse experience in the healthcare industry and his experience as a successful venture capital and private equity investor make him a valuable member of our board of directors. Mr. Perlman was elected to our board of directors by designation of Francisco Partners.
Directors Continuing in Office Until the 2020 Annual Meeting of Stockholders
Vickie L. Capps has been a member of our board of directors since August 2014. Ms. Capps was the Chief Financial Officer of DJO Global, Inc., a medical device company, from 2002 to 2013. Prior to joining DJO Global, Inc., Ms. Capps served as the chief financial officer of several other public and private companies and as a senior audit and accounting professional at Ernst & Young LLP. Ms. Capps has served as a member of the board of directors of Otonomy, Inc. (Nasdaq: OTIC), a biopharmaceutical company, since March 2014 and is the chair of its audit committee and a member of its nominating and governance committee. Ms. Capps has also served as a member of the board of directors of NuVasive, Inc. (Nasdaq: NUVA), a medical device company, since June 2015 and is a member of its audit and nominating and governance committees. In addition, Ms. Capps is a member of the Senior Advisory Board of Consonance Capital Partners, a healthcare investment firm, and is a member of the board of directors of its portfolio company Eagle Rx, Inc., a provider of pharmacy services to the hospice industry. Ms. Capps is also a member of the board of directors of OmniGuide, Inc., a privately held medical device company. From December 2013 to August 2015, Ms. Capps served as a member of the board of directors of RF Surgical Systems, Inc. and the chair of its audit committee, prior to the company’s acquisition by Medtronic plc (NYSE: MDT). From 2007 to July 2010, Ms. Capps served as a member of the board of directors of SenoRx, Inc., a medical device company, prior to its acquisition by C. R. Bard, Inc. (NYSE: BCR) in July 2010. Ms. Capps is a California Certified Public Accountant and was recognized as CFO of the Year by the San Diego Business Journal in 2009 and 2010. She also serves on the boards of directors of the San Diego State University Research Foundation and The Santaluz Club. Ms. Capps holds a bachelor’s degree in business administration/accounting from San Diego State University. We believe that Ms. Capps’ strong skill set consisting of corporate finance, accounting, operations, investor relations, capital markets and strategic business development, along with her experience in the healthcare industry, makes her a valuable member of our board of directors.
Paul Kusserow has been a member of our board of directors since October 2014. Mr. Kusserow is the President and Chief Executive Officer and a member of the board of directors of Amedisys, Inc. (Nasdaq: AMED), a leading home health and hospice company that he joined in December 2014. Prior to joining Amedisys, Mr. Kusserow served as the Vice Chairman and President of Alignment Healthcare, Inc., an integrated clinical care company, from June 2014 to December 2014 and provided executive advisory services to companies and investors in the healthcare industry from December 2013 to June 2014. Previously, Mr. Kusserow was Senior Vice President and Chief Strategy, Innovations and Corporate Development Officer of Humana Inc., a leading health and well-being company, from January 2008 through December 2013. Mr. Kusserow currently serves on the board of directors of Amedisys, Inc., as well as on the boards of directors of New Century Health, Inc. and Picwell, Inc., both privately held companies. Mr. Kusserow previously served as the chairman of the board of directors of Availity Inc. and Healthsense, Inc., both privately held companies. Mr. Kusserow holds a B.A. from Wesleyan University and an M.A. from Oxford University. We believe Mr. Kusserow’s extensive experience in the healthcare industry makes him a valuable member of our board of directors.
Audit Committee
The members of the audit committee are Messrs. Ansay and Thomas and Ms. Capps, each of whom is a non-employee member of our board of directors. Ms. Capps serves as the chair of the audit committee. Our board of directors determined that each of Messrs. Ansay and Thomas and Ms. Capps is independent for purposes of the SEC rules and regulations as they apply to audit committee
65
members. Our board of directors has determined that each of Messrs. Ansay and Thomas and Ms. Capps meet the requirements for financial literacy and sophistication, and that Ms. Capps qualifies as an “audit committee financial expert,” under the applicable SEC rules and regulations. The composition of our audit committee complies with all applicable requirements in the SEC rules and regulations.
Director Nominations
As described above under “Risk Factors – Risks Related to Ownership of Our Common Stock”, Francisco Partners has the right to designate a number of directors to our board of directors proportionate to its ownership of our outstanding voting securities and the Investor Committee of our board of directors has the sole authority to formally elect directors designated by Francisco Partners to our board of directors. For all other directors, our nominating and corporate governance committee is responsible for, among other things, assisting our board of directors in identifying qualified director nominees and recommending nominees for each annual meeting of stockholders. The nominating and corporate governance committee’s goal is to assemble a board that brings to our company a diversity of experience in areas that are relevant to our business and that complies with the applicable SEC rules and regulations. While we do not have a formal diversity policy for board membership, the nominating and corporate governance committee generally considers the diversity of nominees in terms of knowledge, experience, background, skills, expertise and other demographic factors. When considering nominees for election as directors, the nominating and corporate governance committee reviews the needs of the board for various skills, background, experience and expected contributions and the qualification standards established from time to time by the nominating and corporate governance committee. The nominating and corporate governance committee believes that directors must also have an inquisitive and objective outlook and mature judgment. Director candidates must have sufficient time available in the judgment of the nominating and corporate governance committee to perform all board and committee responsibilities. Members of the board of directors are expected to rigorously prepare for, attend and participate in all meetings of the board and applicable committee meetings.
Other than the foregoing and the applicable rules regarding director qualification, there are no stated minimum criteria for director nominees. However, at least one director must be a “financial expert” under the Exchange Act and the applicable SEC rules and regulations. The nominating and corporate governance committee also believes it appropriate for our Chief Executive Officer to participate as a member of the board of directors.
The nominating and corporate governance committee will evaluate annually the current members of the board whose terms are expiring and who are willing to continue in service against the criteria set forth above in determining whether to recommend these directors for election. Subject to the rights of Francisco Partners, the nominating and corporate governance committee will assess regularly the optimum size of the board and its committees and the needs of the board for various skills, background and business experience in determining if the board requires additional candidates for nomination.
Candidates for director nominations come to our attention from time to time through incumbent directors, management, stockholders or third parties. These candidates may be considered at meetings of the nominating and corporate governance committee at any point during the year. Such candidates are to be evaluated against the criteria set forth above. If the nominating and corporate governance committee believes at any time that it is desirable that the board consider additional candidates for nomination, the committee may poll directors and management for suggestions or conduct research to identify possible candidates and may engage, if the nominating and corporate governance committee believes it is appropriate, a third-party search firm to assist in identifying qualified candidates.
Our bylaws permit stockholders to nominate directors for consideration at an annual meeting. The nominating and corporate governance committee will consider director candidates validly recommended by stockholders.
To our knowledge, the current director appointed to our board of directors under an arrangement with Francisco Partners, Ezra Perlman, does not receive any additional compensation from Francisco Partners or any other third party specifically related to his service on our board of directors.
Code of Ethics
We have adopted a Code of Business Conduct and Ethics (the “Code”) that applies to all of our employees, officers (including our principal executive officer, principal financial officer, principal accounting officer or controller, or persons performing similar functions), directors and consultants. The Code is available on the investor relations section of our website at http://investors.connecture.com. A printed copy of the Code may also be obtained by any stockholder free of charge upon request to the Corporate Secretary, Connecture, Inc., 18500 West Corporate Drive, Suite 250, Brookfield, Wisconsin 53045. Any substantive amendment to or waiver of any provision of the Code may be made only by the board of directors, and will be disclosed on our website as well as via any other means then required by applicable law.
66
Corporate Governance Guidelines
We have adopted Corporate Governance Guidelines (the “Guidelines”) that address the composition of the board, criteria for board membership and other board governance matters. These Guidelines are available on the investor relations section of our website at http://investors.connecture.com. A printed copy of the Guidelines may also be obtained by any stockholder free of charge upon request to the Corporate Secretary, Connecture, Inc., 18500 West Corporate Drive, Suite 250, Brookfield, Wisconsin 53045.
Executive Officers
Information regarding our executive officers as of March 16, 2018 is set forth below. Mr. Surges’ biography can be found on page 64 of this Form 10-K with the biographies of the other members of the board of directors. Biographies for our other executive officers, including our other named executive officers, are below.
|
Name |
|
Age |
|
Position |
|
Jeffery A. Surges |
|
50 |
|
President, Chief Executive Officer and Director |
|
Brian D. Lindstrom |
|
47 |
|
Chief Financial Officer and Secretary |
|
Mark E. Granville |
|
62 |
|
Chief Delivery Officer |
|
Vincent E. Estrada |
|
53 |
|
Executive Vice President, Corporate Development |
|
Lea DeVillers |
|
49 |
|
General Counsel |
Brian D. Lindstrom has served as our Chief Financial Officer and Secretary since December 4, 2017. Prior to joining the Company, Mr. Lindstrom served as Chief Operating Officer of Datica Health, Inc., a provider of HIPAA compliant, cloud-based infrastructure for developers across healthcare, from December 2016 through November 2017. Previously, Mr. Lindstrom served as the Chief Financial Officer of Influence Health, Inc., a developer of clinical and digital marketing software for healthcare providers, from May 2013 through November 2016, and as Corporate Controller for Epic Systems, Inc., a provider of inpatient and ambulatory enterprise healthcare management software, from May 2007 through April 2013. Mr. Lindstrom is a CPA, holds a B.S. in accounting from Bradley University, M.S. from Purdue University and Advanced Management Program from University of Chicago.
Mark E. Granville has served as our Chief Delivery Officer since August 2016. Mr. Granville was our Senior Vice President and General Manager, InsureAdvantage from October 2012 until August 2016. Previously, Mr. Granville worked for the healthcare business of Thomson Reuters (now Truven Health Analytics Inc.), a provider of healthcare data, analytics and advisory services, where he served as Senior Vice President, Analytic Consulting, from January 2012 to October 2012 and as Senior Vice President, Client Experience from August 2009 to December 2012. He holds a B.B.A. in management information systems from Bowling Green State University and an MBA from the University of Wyoming–Casper.
Vincent E. Estrada has served as our Executive Vice President, Corporate Development, since December 4, 2017 and previously served as our Chief Financial Officer and Secretary beginning in January 2017. Before that, Mr. Estrada served as Chief Financial Officer and Executive Vice President of Business Development for HealthMEDX, LLC, a developer of electronic medical record (EMR) solutions for long-term and other non-acute care providers, during his tenure from December 2011 through its October 2016 acquisition by Netsmart Technologies, Inc. Mr. Estrada started his career as a Certified Public Accountant with Arthur Andersen & Co. in 1986, after receiving a BSA in Accounting and Finance from the University of Illinois.
Lea DeVillers has served as our General Counsel since June 2013. Previously, she was Corporate Counsel for us from December 2010 to June 2013. Prior to joining Connecture, she was in-house counsel for Blue Cross Blue Shield of Minnesota, a health insurance company, from 1996 to 2002, where she provided legal advice to the government programs business unit on a variety of transactional, regulatory compliance, and policy and legislative affairs matters. Ms. DeVillers was not employed from 2002 to 2010 when she was devoting her full time to family matters. Ms. DeVillers holds a B.A. from the University of Wisconsin–Milwaukee and a J.D. from the University of Virginia School of Law.
Section 16(a) Beneficial Ownership Reporting Compliance
Section 16(a) of the Exchange Act requires our executive officers and directors and persons who beneficially own more than 10% of our common stock to file initial reports of beneficial ownership and reports of changes in beneficial ownership with the SEC. Such persons are required by SEC regulations to furnish us with copies of all Section 16(a) forms filed by such person.
Based solely on our review of such forms furnished to us, and written representations from certain reporting persons, with the exceptions below, we believe that all filing requirements applicable to our executive officers, directors and greater-than-10% stockholders during the fiscal year ended December 31, 2017 were satisfied.
Jeffery A. Surges filed two late reports with respect to transactions that occurred on January 12, 2017 and February 12, 2017. Brian D. Lindstrom filed a late Form 3 on December 15, 2017.
67
Summary Compensation Table
The following table presents compensation information for fiscal 2017 and 2016 paid to, or earned by, our principal executive officer and our two other most highly compensated persons serving as executive officers as of December 31, 2017. We refer to these executive officers as our “named executive officers” in this Form 10-K.
|
Name and Principal Position |
|
Year |
|
Salary |
|
|
Bonus(1) |
|
|
Stock Awards(2) |
|
|
Option Awards(2) |
|
|
All Other Compensation(3) |
|
|
Total |
|
||||||
|
Jeffery A. Surges |
|
2017 |
|
$ |
450,000 |
|
|
$ |
168,750 |
|
|
$ |
352,950 |
|
|
$ |
— |
|
|
$ |
11,214 |
|
|
$ |
982,914 |
|
|
President and Chief Executive Officer |
|
2016 |
|
|
450,000 |
|
|
|
— |
|
|
|
914,125 |
|
|
|
— |
|
|
|
7,020 |
|
|
|
1,371,145 |
|
|
Vincent E. Estrada(4) |
|
2017 |
|
|
300,000 |
|
|
|
112,500 |
|
|
|
386,475 |
|
|
|
103,607 |
|
|
|
5,214 |
|
|
|
907,796 |
|
|
Executive Vice President, Corporate Development |
|
|
|
|
|
|
|
|
|
|
|
|
|
|
|
|
|
|
|
|
|
|
|
|
|
|
|
Mark E. Granville |
|
2017 |
|
|
315,000 |
|
|
|
178,125 |
|
|
|
132,356 |
|
|
|
— |
|
|
|
10,188 |
|
|
|
635,669 |
|
|
Chief Delivery Officer |
|
2016 |
|
|
300,417 |
|
|
30,000 |
|
|
|
— |
|
|
|
54,587 |
|
|
|
9,118 |
|
|
|
394,122 |
|
|
|
(1) |
Amounts reflect aggregate amount earned under the 2017 Executive Bonus Plan approved by the board of directors. Additionally, Mr. Granville’s 2017 Bonus includes a $60,000 discretionary retention bonus and Mr. Granville’s 2016 bonus includes a $30,000 discretionary bonus paid in connection with Mr. Granville’s promotion to Chief Delivery Officer, both of which were approved by the compensation committee of the board of directors. |
|
(2) |
Amounts reflect the aggregate grant date fair value of restricted stock unit (“RSU”) awards and stock option awards granted during the indicated fiscal year, computed in accordance with ASC Topic 718, Compensation-Stock Compensation. Assumptions used in calculating these amounts are described in Note 11 of the Notes to Consolidated Financial Statements in this Annual Report on Form 10-K. The amounts reported reflect the accounting cost for these awards, and do not correspond to the actual economic value that our named executive officers may receive from these awards. |
|
(3) |
Unless otherwise noted, represents fiscal 2017 and 2016 401(k) matching contributions and the taxable value of Company-provided life insurance. |
|
(4) |
Mr. Estrada served as our Chief Financial Officer from January 1, 2017 until December 4, 2017. |
Potential Payments Upon Termination and Change in Control
Generally
Jeffery A. Surges, our President and Chief Executive Officer, is party to an employment agreement with us effective November 12, 2015. Mr. Surges’ employment agreement has no specific term and constitutes at-will employment. Mr. Surges’ annual base salary is $450,000, and beginning in fiscal 2016, he was eligible to receive an annual bonus of 50% of his annual base salary. Mr. Surges is also eligible to receive benefits that are substantially similar to those of our other employees. Except as set forth in our 2017 executive retention compensation plan (the “Retention Plan”), payment of any bonus to Mr. Surges is subject to the sole and absolute discretion of the Compensation Committee. Pursuant to Mr. Surges’ agreement, in the event Mr. Surges is terminated without cause or if Mr. Surges voluntarily terminates his employment with us for good reason, we are obligated to pay him (i) an amount equal to 100% of his then-current annual base salary, to be paid out in monthly installments over a period of 12 months, (ii) the premium for Mr. Surges and his dependents’ group health care continuation coverage for 12 months, (iii) vested benefits under any employee benefit plan and any earned but unpaid bonus, and (iv) if such termination is after June 30, a prorated target bonus. If such termination occurs within 12 months of a change in control (as defined in our 2014 Equity Incentive Plan), 100% of Mr. Surges’ outstanding but unvested equity awards will vest in full. For purposes of Mr. Surges’ agreement, “cause” means (i) theft, dishonesty, willful misconduct, breach of fiduciary duty for personal profit, or falsification of any Company documents or records; (ii) material failure to abide by the Company’s code of conduct or other policies, which failure, to the extent such failure can be cured, is not cured within a reasonable period of time after written notice; (iii) unauthorized use, misappropriation, destruction or diversion of any tangible or intangible asset or corporate opportunity of the Company; (iv) any intentional act that has a material detrimental effect on the Company’s reputation or business; (v) repeated failure to perform any reasonable assigned duties after written notice of, and a reasonable opportunity to cure, such failure; (vi) any material breach of any employment, service, non-disclosure, non-competition, non-solicitation or other similar agreement with the Company, which breach is not cured pursuant to the terms of such agreement; or (vii) conviction (including any plea of guilty or nolo contendere) of any criminal act involving fraud, dishonesty, misappropriation or moral turpitude or that impairs Mr. Surges’ ability to perform his duties. For purposes of Mr. Surges’ agreement, “good reason” is defined as Mr. Surges’ resignation (i) if we, without his written consent, (a) materially reduce Mr. Surges’ then-current authority, duties or responsibilities; (b) materially reduce Mr. Surges’ then-current base salary, unless substantially all other executive management employees’ base salaries are similarly or proportionally reduced; (c) materially change the geographic location at which Mr. Surges must perform services for us; or (d) materially breach the employment agreement; and (ii) Mr. Surges provides written notice of the action to us within 60 days, we do not remedy the action within 30 days (the cure period) and Mr. Surges resigns within ten days of the expiration of the cure period. Mr. Surges is also subject to certain restrictive requirements that provide that Mr. Surges
68
will (i) not solicit our employees or customers during employment and for a period of 12 months after the termination of employment, (ii) not compete with us or assist any other person to compete with us during employment and a period of 12 months after the termination of employment and (iii) protect our confidential and proprietary information and to assign to us intellectual property developed during the course of employment.
Vincent E. Estrada is party to an employment agreement with us effective January 1, 2017, as amended. Mr. Estrada’s employment agreement has no specific term and constitutes at-will employment. Mr. Estrada’s annual base salary was $300,000 until December 31, 2017, and $85,000 thereafter. In fiscal 2017, he was eligible to receive an annual bonus of 50% of his annual base salary of $300,000. Mr. Estrada is also eligible to receive benefits that are substantially similar to those of our other employees. Payment of any bonus to Mr. Estrada is subject to the sole and absolute discretion of the Compensation Committee. Pursuant to Mr. Estrada’s agreement, in the event Mr. Estrada is terminated without cause or if Mr. Estrada voluntarily terminates his employment with us for good reason, we are obligated to pay him (i) an amount equal to 100% of his then-current annual base salary, to be paid out in monthly installments over a period of 12 months, (ii) the premium for Mr. Estrada and his dependents’ group health care continuation coverage for 12 months, and (iii) vested benefits under any employee benefit plan. For purposes of Mr. Estrada’s agreement, “cause” means (i) theft, dishonesty, willful misconduct, breach of fiduciary duty for personal profit, or falsification of any Company documents or records; (ii) material failure to abide by the Company’s code of conduct or other policies, which failure, to the extent such failure can be cured, is not cured within a reasonable period of time after written notice; (iii) unauthorized use, misappropriation, destruction or diversion of any tangible or intangible asset or corporate opportunity of the Company; (iv) any intentional act that has a material detrimental effect on the Company’s reputation or business; (v) repeated failure to perform any reasonable assigned duties after written notice of, and a reasonable opportunity to cure, such failure; (vi) any material breach of any employment, service, non-disclosure, non-competition, non-solicitation or other similar agreement with the Company, which breach is not cured pursuant to the terms of such agreement; or (vii) conviction (including any plea of guilty or nolo contendere) of any criminal act involving fraud, dishonesty, misappropriation or moral turpitude or that impairs Mr. Estrada’s ability to perform his duties. For purposes of Mr. Estrada’s agreement, “good reason” is defined as Mr. Estrada’s resignation (i) if we, without his written consent, (a) materially reduce Mr. Estrada’s then-current authority, duties or responsibilities; (b) materially reduce Mr. Estrada’s then-current base salary, unless substantially all other executive management employees’ base salaries are similarly or proportionally reduced; (c) materially change the geographic location at which Mr. Estrada must perform services for us; or (d) materially breach the employment agreement; and (ii) Mr. Estrada provides written notice of the action to us within 60 days, we do not remedy the action within 30 days (the cure period) and Mr. Estrada resigns within ten days of the expiration of the cure period. Mr. Estrada is also subject to certain restrictive requirements that provide that Mr. Estrada will (i) not solicit our employees or customers during employment and for a period of 12 months after the termination of employment, (ii) not compete with us or assist any other person to compete with us during employment and a period of 12 months after the termination of employment and (iii) protect our confidential and proprietary information and to assign to us intellectual property developed during the course of employment.
Messrs. Surges and Estrada are also party to separation pay agreements with us, each dated July 21, 2017. Pursuant to the separation pay agreements, Messrs. Surges and Estrada will be entitled to cash severance of $225,000 and $150,000, respectively, in the event that either officer is terminated by us without cause or resigns for good reason, subject to compliance with the terms of such officer’s employment agreement with respect to the payment of separation benefits. The cash severance provided for in the separation pay agreement is in addition to any separation benefits provided for by the officer’s existing employment agreements.
Mark E. Granville is party to a separation pay agreement with us, dated September 10, 2012, as amended. Pursuant to Mr. Granville’s agreement, in the event Mr. Granville is terminated without cause, we are obligated to (i) pay him an amount equal to 75% of his then-current annual base salary, to be paid out in equal monthly installments over a period of nine months, and (ii) pay the premium for Mr. Granville and his dependents’ group health care continuation coverage for nine months. Mr. Granville is also party to a letter agreement with us, dated March 30, 2017. Pursuant to the letter agreement, if Mr. Granville remains employed with us through December 31, 2017 or if he is terminated by us without cause prior to that date, we will pay him a bonus of $30,000. For purposes of Mr. Granville’s separation pay agreement and letter agreement, “without cause” was defined as any termination for reasons other than (i) death; (ii) disability; (iii) mutual agreement; or (iv) cause. “Cause” was defined as (i) willful insubordination; (ii) any act or omissions that is, or is likely to be, intentionally injurious to the Company or the business reputation of the Company; (iii) willful misconduct, dishonesty, fraud or malfeasance that results in injury to the Company; or (iv) indictment for, conviction or the entry of a plea of guilty or no contest to a felony or crime involving moral turpitude. Mr. Granville is also subject to certain restrictive requirements that provide that Mr. Granville will (i) not solicit our employees or customers during employment and for a period of 12 months after the termination of employment, (ii) not compete with us or assist any other person to compete with us during employment and a period of 12 months after the termination of employment and (iii) protect our confidential and proprietary information and to assign to us intellectual property developed during the course of employment.
Messrs. Surges, Estrada and Granville are also participants in our Retention Plan and party to executive bonus agreements under the Retention Plan. Pursuant to the Retention Plan, participating employees may receive equity awards or cash awards, or both. All equity awards are in the form of RSUs to be settled in shares of our common stock pursuant to our 2014 Stock Incentive Plan, as amended (the “2014 Plan”) upon a qualifying change in control and feature a combination of RSUs with time-based and performance-
69
based vesting conditions as specified in the Retention Plan. Cash awards consist of retention bonus arrangements (the “Bonus Arrangements”), pursuant to which the recipient will be entitled to a retention bonus and a contingent bonus. The retention bonus will be payable in cash upon a change in control or if a change in control has not occurred within five years of the date of the Retention Plan, in shares of our common stock. The contingent bonus will be payable in cash only upon a change in control that occurs within five years of the date of the Retention Plan and in which the consideration payable for a share of our common stock equals or exceeds a threshold established by our board of directors as of the approval of the Retention Plan. In the event that a change in control occurs within six months of either Messrs. Surges or Estrada being terminated by us without cause or resigning for good reason (each as defined in the respective officer’s employment agreement), such officer will be entitled to receive the retention bonus and contingent bonus if the criteria for payment are satisfied. For all other participating employees, the recipient must be employed by us on the date of payment in order to receive either bonus award. In addition, in order for a Bonus Arrangement to be payable, the applicable change in control must satisfy the conditions for such event set forth in the Retention Plan.
Although the Retention Plan provided for potential grants of performance-based RSUs, these potential grants were subject to (a) approval by our stockholders of an amendment to the 2014 Plan to increase the number of shares of our common stock available for issuance under the 2014 Plan and (b) approval by our board of directors of individual grants. We did not adopt, and our stockholders did not approve, an amendment to the 2014 Plan, and our board of directors did not approve any individual grants of performance-based RSUs under the Retention Plan. Accordingly, no performance-based RSUs have been granted pursuant to the Retention Plan.
The amounts payable to the Company’s principal executive officer, principal financial officer and current named executive officers pursuant to the Retention Compensation Plan are as follows:
|
Name and Principal Position |
|
RSUs with Time-Based Vesting |
|
|
Retention Bonus |
|
|
Contingent Bonus |
|
|||
|
Jeffery A. Surges, Chief Executive Officer |
|
|
500,000 |
|
|
$ |
750,000 |
|
|
$ |
250,000 |
|
|
Vincent E. Estrada, Executive Vice President of Corporate Development and Former Chief Financial Officer |
|
|
250,000 |
|
|
$ |
375,000 |
|
|
$ |
125,000 |
|
|
Mark E. Granville, Chief Delivery Officer |
|
|
187,500 |
|
|
$ |
100,000 |
|
|
$ |
33,333 |
|
In addition, under our 2014 Plan, certain stock option agreements and restricted stock unit agreement applicable to our named executive officers provide that in the event of a change in control, the respective awards granted to our named executive officers will vest in full immediately before and contingent upon the change in control, subject to continuous service through the date of the change in control. Specifically, with respect to Mr. Surges, upon a change in control all unvested shares subject to any outstanding equity grants issued to Mr. Surges for which the vesting is time based will accelerate and vest in full. In addition, with respect to equity grants to Mr. Surges for which the testing is based on the Company’s stock price, to the extent that the price per share of the Company’s Common Stock as of the closing of the change in control transaction meets or exceeds a stock price threshold in the applicable vesting schedule, such threshold will be deemed to have been achieved notwithstanding any durational requirements for the market price of the Company’s Common Stock otherwise contained in award agreement. As noted above, if Mr. Surges is terminated without cause or resigns for good reason within 12 months of a change in control, all of Mr. Surges’ outstanding but unvested equity awards will vest in full.
Merger Agreement with Francisco Partners
As further discussed below under “Related Party Transactions—Merger Agreement,” on January 4, 2018, we entered into an Agreement and Plan of Merger (the “Merger Agreement”) with FP Healthcare Holdings, Inc., a Delaware corporation (“Parent”), FP Healthcare Merger Sub Corporation, a Delaware corporation and indirect subsidiary of Parent (“Merger Sub,” and together with Parent, “Purchasers”). Pursuant to the Merger Agreement, Merger Sub will be merged with and into the Company (the “Merger”), the separate corporate existence of Merger Sub will cease and we will continue our corporate existence under Delaware law as the surviving corporation in the Merger. Parent will own 100% of our equity interests following the transactions contemplated by the Merger Agreement.
Payments to Executive Officers and Directors in Respect of Company Equity Awards
Pursuant to the terms of the Merger Agreement, other than as described below, all unvested RSUs held by our executive officers will be canceled for no consideration. In addition, all vested and unvested stock options held by our executive officers have exercise prices in excess of the merger consideration of $0.35 per share, and therefore, such stock options will be canceled as of the effective
70
time of the Merger for no consideration. As discussed above, certain of our named executive officers were issued retention bonus awards and time-based RSUs pursuant to the Retention Plan that are payable or entitled to settlement, respectively, only upon a qualifying change in control as set forth in the Retention Plan. The Merger does not constitute a qualifying change in control pursuant to the Retention Plan, and therefore, such unvested RSUs will be canceled for no consideration and the cash retention bonus awards will not be payable in connection with the Merger.
Pursuant to the terms of their respective employment agreements, Messrs. Surges and Estrada are entitled to full acceleration of their other unvested equity awards with time-based vesting conditions upon completion of the Merger. As all unvested stock options held by Messrs. Surges and Estrada have exercise prices in excess of the merger consideration of $0.35 per share, such stock options will be canceled as of the effective time of the Merger for no consideration. However, Messrs. Surges and Estrada will receive payment in respect of unvested RSUs with time-based vesting conditions (other than those granted pursuant to the Retention Plan).
The table below sets forth the total number of shares of common stock subject to unvested RSUs that will accelerate upon the effective time of the Merger with respect to each named executive officer who holds such RSUs, assuming that the closing of the Merger were to occur on March 27, 2018. The amount payable listed below reflects the number of shares subject to unvested RSUs that will accelerate multiplied by the merger consideration of $0.35 per share, without regard to any required withholding of taxes.
Payments Resulting from Acceleration of Unvested Equity Awards
|
Name |
|
Unvested RSUs Accelerating |
|
|
Merger Consideration Payable ($) |
|
||
|
Jeffery A. Surges |
|
|
49,928 |
|
|
$ |
17,475 |
|
|
Vincent E. Estrada |
|
|
83,338 |
|
|
$ |
29,168 |
|
Additional Severance Arrangements
As discussed above, pursuant to the terms of separation pay agreements entered into with Mr. Surges and Mr. Estrada on July 21, 2017, Mr. Surges and Mr. Estrada are entitled to additional cash severance of $225,000 and $150,000, respectively, in the event of a qualifying termination (i.e., a termination by the Company without “cause” or by Mr. Surges or Mr. Estrada with “good reason”) within 12 months of the Merger.
In addition, under the terms of his employment agreement, Mr. Surges would receive acceleration of vesting of all unvested equity awards he holds with performance-vesting conditions upon a qualifying termination within 12 months of the Merger, but all such awards will be canceled without consideration as of the effective time of the Merger.
401(k)
We have established a tax-qualified employee savings and retirement plan for all employees who satisfy certain eligibility requirements, including requirements relating to age and length of service. Under our 401(k) plan, employees may elect to reduce their current compensation by up to the statutory limit, $18,000 for those under age 50 and $24,000 for those 50 and older in 2017, and have us contribute the amount of this reduction to the 401(k) plan. In 2017, we matched up to 40% of the first 6% of employee contributions. Our contributions were approximately $0.7 million in the years ended December 31, 2017 and 2016. We intend for the 401(k) plan to qualify under Section 401 of the Code so that contributions by employees or by us to the 401(k) plan, and income earned on plan contributions, are not taxable to employees until withdrawn from the 401(k) plan.
Pension Benefits
We did not sponsor any defined benefit pension or other actuarial plan for our named executive officers during fiscal 2017.
Nonqualified Deferred Compensation
We did not maintain any nonqualified defined contribution or other deferred compensation plans or arrangements for our named executive officers during fiscal 2017.
71
Outstanding Equity Awards at December 31, 2017
The following table sets forth information regarding outstanding equity awards held by our named executive officers at December 31, 2017.
|
|
|
Option Awards |
|
Stock Awards |
|
|||||||||||||||
|
Name |
|
Number of Securities Underlying Unexercised Options Exercisable(1) |
|
|
Number of Securities Underlying Unexercised Options Unexercisable(1) |
|
|
Option Exercise Price |
|
|
Option Expiration Date |
|
Number of Shares or Units of Stock That Have Not Vested(1) |
|
Market Value of Shares or Units of Stock That Have Not Vested(1) |
|
||||
|
Jeffery A. Surges |
|
|
— |
|
|
65,000(2) |
|
|
$ |
3.93 |
|
|
11/12/2025 |
|
68,693(3) |
|
$ |
10,991 |
|
|
|
|
|
24,314(4) |
|
|
10,686(4) |
|
|
$ |
3.93 |
|
|
11/12/2025 |
|
355,000(5) |
|
$ |
56,800 |
|
||
|
|
|
|
|
|
|
|
|
|
|
|
|
|
|
|
|
500,000(6) |
|
$ |
80,000 |
|
|
Vincent E. Estrada |
|
|
— |
|
|
125,000(7) |
|
|
$ |
1.68 |
|
|
1/1/2027 |
|
125,000(8) |
|
$ |
20,000 |
|
|
|
|
|
|
|
|
|
|
|
|
|
|
|
|
|
|
|
250,000(6) |
|
$ |
40,000 |
|
|
Mark E. Granville |
|
155,410(9) |
|
|
|
— |
|
|
$ |
1.866 |
|
|
10/26/2022 |
|
3,334(10) |
|
$ |
533 |
|
|
|
|
|
24,177(11) |
|
|
5,823(11) |
|
|
$ |
11.37 |
|
|
4/29/2025 |
|
187,500(6) |
|
$ |
30,000 |
|
||
|
(1) |
Shares of common stock. |
|
(2) |
This option grant vests in accordance with certain milestones based on the price per share of the Company’s common stock. |
|
(3) |
This RSU award vested with respect to 1/3 of the shares on November 12, 2016, and vests as to 1/36 of the shares on each full month following November 12, 2016, until fully vested. |
|
(4) |
This option grant vested with respect to 1/3 of the shares on November 12, 2016, and vests as to 1/36 of the shares on each full month following November 12, 2016, until fully vested. |
|
(5) |
This RSU award vests in accordance with certain milestones based on the price per share of the Company’s common stock. |
|
(6) |
This RSU award vests upon the satisfaction of both an event condition and service condition before July 21, 2022. The event condition is a qualified Change in Control while employed or July 21, 2022, whichever is earlier. The service condition vests as to 1/3 of the shares on each anniversary of the July 21, 2017 grant date. |
|
(7) |
This option vested with respect to 1/3 of the shares on January 1, 2018 and vests as to 1/3 on each of January 1, 2019 and 2020. |
|
(8) |
This RSU grant vested with respect to 1/3 of the shares on January 1, 2018 and vests as to 1/3 on each of January 1, 2019 and 2020. |
|
(9) |
This option grant was fully vested as of December 31, 2017 and is fully exercisable. |
|
(10) |
This RSU award vested with respect to 1/3 of the shares on each of July 1, 2016 and 2017, and vests as to 1/3 of the shares on each of July 1, 2018. |
|
(11) |
This option grant vested with respect to 1/3 of the shares on July 1, 2016, and vests as to 1/36 of the shares on each full month following July 1, 2016, until fully vested. |
Compensation of Directors
In connection with our initial public offering, in December 2014, we implemented a director compensation policy, pursuant to which our non-employee directors and directors not affiliated with our institutional investors are entitled to receive an annual cash fee of $44,000 and an annual equity award of $66,000 in restricted stock. The number of shares underlying the restricted stock units is determined by dividing $66,000 by the closing price of our common stock on the date of grant, and the restricted stock units vest quarterly over four quarters beginning one quarter following the date of grant, provided that the director continues to serve as a director through such vesting date. The audit committee chairperson receives an annual fee of $12,000. The compensation committee chairperson receives an annual fee of $10,000. The nominating and corporate governance committee chairperson receives an annual fee of $10,000. Members of our board of directors are also reimbursed for travel and other out-of-pocket expenses in connection with attending meetings.
In addition, Kraig McEwen provides consulting services to senior management of the Company as requested by the Board pursuant to an Independent Contractor Consulting Agreement (the “McEwen Consulting Agreement”), effective as of May 10, 2017, between Mr. McEwen and the Company. Under the terms of the McEwen Consulting Agreement, Mr. McEwen received a number of RSUs for shares of the Company’s common stock in an amount equal to $110,000 divided by the closing price of a share of the Company’s common stock on May 10, 2017, the effective date of the McEwen Consulting Agreement, which closing price was $0.82. The RSUs vest quarterly over a one-year period beginning on the first day of the first quarter following the date of grant, subject in each case to continuous service pursuant to the McEwen Consulting Agreement as of each vesting date. The RSUs are in addition to, and separate from, Mr. McEwen’s compensation for his service as a director and constitute the sole consideration payable to Mr. McEwen for his services pursuant to the McEwen Consulting Agreement during its initial one-year term.
72
In connection with the November 2017 indication of interest from Francisco Partners (the “Initial Proposal”) to acquire all of the outstanding common equity securities of the Company that it did not already own (the “Proposed Transaction”), a special committee of independent directors was formed to analyze, investigate and negotiate the Proposed Transaction and any alternative transaction to the Proposed Transaction. The board approved a monthly cash fee of $16,875 and $10,313 for the committee chairperson and each committee member, respectively.
The following table sets forth information concerning the compensation earned during the last fiscal year by each director who received such compensation. Our President and Chief Executive Officer, Jeffery Surges, did not receive additional compensation for his services as a director and, consequently, is not included in the table. The compensation received by Mr. Surges as an employee is presented in the Summary Compensation Table.
|
Name |
|
Fees Earned or Paid in Cash ($) |
|
|
Stock Awards ($)(1) |
|
|
Total ($) |
|
|||
|
A. John Ansay(2) |
|
$59,469(8) |
|
|
$66,000 |
|
|
$125,469 |
|
|||
|
Vickie L. Capps(3) |
|
81,313(9) |
|
|
|
66,000 |
|
|
147,313 |
|
||
|
David A. Jones, Jr.(4) |
|
|
— |
|
|
|
— |
|
|
|
— |
|
|
Paul Kusserow(5) |
|
69,469(10) |
|
|
|
66,000 |
|
|
135,469 |
|
||
|
Kraig McEwen(6) |
|
|
28,165 |
|
|
|
176,000 |
|
|
|
204,165 |
|
|
Ezra Perlman(4) |
|
|
— |
|
|
|
— |
|
|
|
— |
|
|
Russell S. Thomas(7) |
|
44,000(11) |
|
|
66,000 |
|
|
110,000 |
|
|||
|
(1) |
Unless otherwise noted, amount represents the grant date fair value of RSUs granted on May 25, 2017, as computed in accordance with ASC Topic 718, Compensation-Stock Compensation. Assumptions used in calculating these amounts are described in Note 11 of the Notes to Consolidated Financial Statements in this Annual Report on Form 10-K. The amounts reported reflect the accounting cost for these awards, and do not correspond to the actual economic value that our directors may receive from these awards. |
|
(2) |
Mr. Ansay held 40,244 unvested restricted stock units as of December 31, 2017. |
|
(3) |
Ms. Capps held 40,244 unvested restricted stock units as of December 31, 2017. |
|
(4) |
Messrs. Jones and Perlman did not receive compensation for their services as directors in 2017 pursuant to our director compensation policy, which provides that non-employee directors affiliated with our institutional investors do not receive such compensation. Neither Messrs. Jones and Perlman personally held any unvested restricted stock units or any unexercised option awards as of December 31, 2017. |
|
(5) |
Mr. Kusserow held 40,244 unvested restricted stock units as of December 31, 2017. |
|
(6) |
Mr. McEwen held 107,317 unvested restricted stock units as of December 31, 2017, which includes 67,073 of unvested restricted stock units issued pursuant to the McEwen Consulting Agreement. |
|
(7) |
Mr. Thomas held 40,244 unvested restricted stock units as of December 31, 2017. |
|
(8) |
Consists of a $44,000 annual cash fee for service on the board of directors and a $15,469 cash fee for service on the special committee of the board of directors. |
|
(9) |
Consists of a $44,000 annual cash fee for service on the board of directors, a $12,000 cash fee for service as the audit committee chair, and a $25,313 cash fee for service as the special committee chair. |
|
(10) |
Consists of a $44,000 annual cash fee for service on the board of directors, a $10,000 cash fee for service as the compensation committee chair, and a $15,469 cash fee for service on the special committee of the board of directors. |
|
(11) |
Consists of a $44,000 annual cash fee for service on the board of directors. |
|
Item 12. |
Security Ownership of Certain Beneficial Owners and Management and Related Stockholder Matters |
Security Ownership of Management and Certain Beneficial Owners
|
|
• |
The following table and footnotes set forth information with respect to the beneficial ownership of our common stock as of March 27, 2018, by each stockholder, or group of affiliated stockholders, who we know beneficially owns more than 5% of the outstanding shares of our common stock; |
|
|
• |
each of our named executive officers; |
|
|
• |
each of our current directors; and |
|
|
• |
all of our current directors and current executive officers as a group. |
Beneficial ownership of shares is determined under the rules of the SEC and generally includes any shares over which a person exercises sole or shared voting or investment power.
73
Applicable percentage ownership for our common stock in the following table is based on 23,255,102 shares of Common Stock outstanding as of March 27, 2018, and the assumed conversion as of such date, of all 52,000 outstanding shares of our Series A Preferred Stock into 15,125,711 shares of Common Stock and all 17,500 shares of our Series B Preferred Stock into 10,694,902 shares of Common Stock, for an aggregate of 49,075,715 shares of Common Stock deemed outstanding for voting purposes (excluding shares of Common Stock subject to equity awards). Each share of Series A Preferred Stock is convertible, at the option of the holder, into a number of shares of Common Stock determined by dividing the sum of the stated value of such share of Series A Preferred Stock on the conversion date and any accrued and unpaid dividends with respect to such share by a conversion price initially equal to $4.50 per share of Series A Preferred Stock, which was adjusted to $3.96 as a result of the issuance of our Series B Preferred Stock. Each share of Series B Preferred Stock is convertible, at the option of the holder, into a number of shares of Common Stock determined by dividing the sum of the stated value of such share of Series B Preferred Stock on the conversion date and any accrued and unpaid dividends with respect to such share by a conversion price initially equal to $1.91 per share of Series B Preferred Stock. Each share of our Series A Preferred Stock and our Series B Preferred Stock is entitled to cast one vote for each share of our common stock that would be issuable upon conversion of such share of Preferred Stock if such Preferred Stock had converted to Common Stock on the record date.
Shares of Common Stock subject to equity awards currently exercisable or exercisable within 60 days of March 27, 2018, are deemed to be outstanding for calculating the number and percentage of outstanding shares of the person holding such equity awards, but are not deemed to be outstanding for calculating the percentage ownership of any other person. Applicable percentage ownership for shares of our Series A Preferred Stock and our Series B Preferred Stock in the following table is based on 52,000 shares of Series A Preferred Stock and 17,500 shares of our Series B Preferred Stock outstanding, respectively, as of March 27, 2018. Beneficial ownership or voting power representing less than 1% is denoted with an asterisk (*).
Shares shown in the table below include shares held in the beneficial owner’s name or jointly with others, or in the name of a bank, nominee or trustee for the beneficial owner’s account. Unless otherwise indicated and subject to applicable community property laws, to our knowledge, each stockholder named in the following table possesses sole voting and investment power over the shares listed, except for those jointly owned with that person’s spouse.
Unless otherwise noted below, the address of each person listed on the table is c/o Connecture, Inc., 18500 West Corporate Drive, Suite 250, Brookfield, Wisconsin 53045.
|
|
|
Shares of Common Stock Beneficially Owned |
|
|
Shares of Series A Preferred Stock Beneficially Owned |
|
|
Shares of Series B Preferred Stock Beneficially Owned |
|
|||||||||||||||
|
Name of Beneficial Owner |
|
Shares |
|
|
Percentage |
|
|
Shares |
|
|
Percentage |
|
|
Shares |
|
|
Percentage |
|
||||||
|
Holders of More Than 5% of Any Class of the Company’s Voting Securities: |
|
|
|
|
|
|
|
|
|
|
|
|
|
|
|
|
|
|
|
|
|
|
|
|
|
Entities affiliated with Francisco Partners(1) |
|
|
28,251,740 |
|
|
|
57.6 |
% |
|
|
50,000 |
|
|
|
96.2 |
% |
|
|
16,500 |
|
|
|
94.3 |
% |
|
Chrysalis Ventures II, L.P.(2) |
|
|
5,200,057 |
|
|
|
10.6 |
% |
|
|
2,000 |
|
|
|
3.8 |
% |
|
|
1,000 |
|
|
|
5.7 |
% |
|
GPP-Connecture, LLC(3) |
|
|
4,127,232 |
|
|
|
8.4 |
% |
|
|
— |
|
|
|
— |
|
|
|
— |
|
|
|
— |
|
|
Ahsan Rahim(4) |
|
|
1,550,000 |
|
|
|
3.2 |
% |
|
|
— |
|
|
|
— |
|
|
|
— |
|
|
|
— |
|
|
Named Executive Officers and Directors: |
|
|
|
|
|
|
|
|
|
|
|
|
|
|
|
|
|
|
|
|
|
|
|
|
|
Jeffery A. Surges(5) |
|
|
227,782 |
|
|
* |
|
|
|
— |
|
|
|
— |
|
|
|
— |
|
|
|
— |
|
|
|
Brian D. Lindstrom(6) |
|
|
— |
|
|
* |
|
|
|
— |
|
|
|
— |
|
|
|
— |
|
|
|
— |
|
|
|
Vincent E. Estrada(7) |
|
|
67,659 |
|
|
* |
|
|
|
— |
|
|
|
— |
|
|
|
— |
|
|
|
— |
|
|
|
Mark Granville(8) |
|
|
190,423 |
|
|
* |
|
|
|
— |
|
|
|
— |
|
|
|
— |
|
|
|
— |
|
|
|
A. John Ansay(9) |
|
|
146,898 |
|
|
* |
|
|
|
— |
|
|
|
— |
|
|
|
— |
|
|
|
— |
|
|
|
Vickie L. Capps(10) |
|
|
136,898 |
|
|
* |
|
|
|
— |
|
|
|
— |
|
|
|
— |
|
|
|
— |
|
|
|
Paul Kusserow(11) |
|
|
121,898 |
|
|
* |
|
|
|
— |
|
|
|
— |
|
|
|
— |
|
|
|
— |
|
|
|
Kraig McEwen(12) |
|
|
214,634 |
|
|
* |
|
|
|
— |
|
|
|
— |
|
|
|
— |
|
|
|
— |
|
|
|
Russell S. Thomas(13) |
|
|
113,648 |
|
|
* |
|
|
|
— |
|
|
|
— |
|
|
|
— |
|
|
|
— |
|
|
|
David A. Jones, Jr.(14) |
|
|
5,257,753 |
|
|
|
10.7 |
% |
|
|
2,000 |
|
|
|
3.8 |
% |
|
|
1,000 |
|
|
|
5.7 |
% |
|
Ezra Perlman(15) |
|
|
28,251,740 |
|
|
|
57.6 |
% |
|
|
50,000 |
|
|
|
96.2 |
% |
|
|
16,500 |
|
|
|
94.3 |
% |
|
All executive officers and directors as a group (12 persons)(16) |
|
|
34,747,565 |
|
|
|
70.2 |
% |
|
|
52,000 |
|
|
|
100.0 |
% |
|
|
17,500 |
|
|
|
100.0 |
% |
74
|
Stock into which such shares of Series A Preferred Stock and Series B Preferred Stock, respectively, would be convertible as of March 27, 2018, and 1,209,972 shares of Common Stock directly held by FP IV-A as of January 4, 2018, according to a Schedule 13D/A report filed by FP IV-A with the SEC on January 4, 2018. Francisco Partners GP IV, L.P. (“FP GP IV”) is the general partner of FP IV and FP IV-A, and as such may be deemed to have voting and dispositive power over the shares held by FP IV and FP IV-A. Francisco Partners GP IV Management Limited (“FP GP Management”) is the general partner of FP GP IV and provides management services to FP IV and FP IV-A at the request of FP GP IV, and as such may be deemed to have voting and dispositive power over the shares held by FP IV and FP IV-A. The Directors of FP GP Management are Mr. Dipanjan Deb and Mr. Tom Ludwig (the “FP Directors”) and the Investment Committee of FP GP Management consists of Mr. Deb, Mr. David Golob, Mr. Ezra Perlman, and Mr. Keith Geeslin (the “FP Investment Committee”), and as such, each of the FP Directors and each of the members of the FP Investment Committee may be deemed to have voting and dispositive power over the shares held by FP IV. Mr. Perlman is a member of our board of directors. The address of FP IV, FP IV-A, FP GP IV, and FP GP Management is One Letterman Drive, Building C – Suite 410, San Francisco, California 94129. Other than with respect to the number of shares of common stock issuable upon conversion of Preferred Stock, all information is based on a review of a Schedule 13D/A report filed by FP-IV, FP IV-A, FP GP IV and FP GP with the SEC on January 4, 2018. |
|
(2) |
Reflects 2,000 shares of Series A Preferred Stock and 1,000 shares of Series B Preferred Stock held by Chrysalis Ventures II, L.P. (“CV II LP”), 581,758 shares of Common Stock and 611,137 shares of Common Stock into which such shares of Series A Preferred Stock and Series B Preferred Stock, respectively, would be convertible as of March 27, 2018, and 4,007,162 shares of Common Stock directly held by CV II LP as of January 8, 2018, according to a Schedule 13D report filed by CV II LP with the SEC on January 8, 2018. Chrysalis Partners II, LLC (“CP II LLC”) is the general partner of CV II LP, and as such may be deemed to have voting and dispositive power over the shares held by CV II LP. Investment and voting decisions with respect to the shares held by CV II LP are made by an advisory committee of CP II LLC that consists of David A. Jones, Jr., who is the chairman of our board of directors, Ralston W. Steenrod and Irv Bailey, each of whom is a member of CP II LLC. The address of CV II LP and CP II LLC is 101 South Fifth Street, Suite 1650, Louisville, KY 40202. Other than with respect to the number of shares of common stock issuable upon conversion of Preferred Stock, all information is based on a review of a Schedule 13D report filed by CV II LP and CP II LLC with the SEC on March 20, 2017. |
|
(3) |
Great Point Partners I, LP (“GPP I LP”) is the sole manager and controlling member of GPP–Connecture, LLC (“GPPC”). Great Point Partners I GP, LLC (“GPP I GP”) is the general partner of GPP I LP and Great Point Partners, LLC (“Great Point”) is the investment manager of GPP I LP and by virtue of such status, Great Point may be deemed to be the beneficial owner of the shares held by GPPC. Each of Great Point, GPP I LP, GPP I GP and GPPC shares voting and dispositive power with respect to the shares held by GPPC. Each of Dr. Jeffrey R. Jay, M.D., as senior managing member of Great Point, and Mr. David Kroin, as special managing member of Great Point, has voting and dispositive power with respect to the shares held by GPPC and therefore may be deemed to be the beneficial owner of the shares held by GPPC. The address of GPPC, GPP I LP, GPP I GP, Great Point, Dr. Jay and Mr. Kroin is 165 Mason Street, 3rd Floor, Greenwich, CT 06830. All information is based on a review of a Schedule 13D/A report filed by of GPPC, GPP I LP, GPP I GP, Great Point, Dr. Jay and Mr. Kroin with the SEC on February 14, 2018. |
|
(4) |
The address of Mr. Rahim is 1427 Lakewood Drive, Lake Forest, Illinois 60045. All information is based on a review of a Schedule 13G/A report filed by Mr. Rahim with the SEC on January 29, 2018. |
|
(5) |
Includes an aggregate of 41,689 shares issuable upon the vesting of restricted stock units vesting within 60 days of March 27, 2018, and shares issuable upon the exercise of options exercisable within 60 days of March 27, 2018. Mr. Surges is our Chief Executive Officer and a member of our board of directors. |
|
(6) |
Mr. Lindstrom is our Chief Financial Officer. |
|
(7) |
Includes 41,662 shares issuable upon the exercise of options exercisable within 60 days of March 27, 2018. Mr. Estrada is our former Chief Financial Officer and current Executive Vice President, Corporate Development. |
|
(8) |
Includes 183,757 shares issuable upon the exercise of options exercisable within 60 days of March 27, 2018. Mr. Granville is our Chief Delivery Officer. |
|
(9) |
Mr. Ansay is a member of our board of directors. |
|
(10) |
Ms. Capps is a member of our board of directors. |
|
(11) |
Mr. Kusserow is a member of our board of directors. |
|
(12) |
Mr. McEwen is a member of our board of directors. |
|
(13) |
Mr. Thomas is a member of our board of directors. |
|
(14) |
Represents shares held by CV II LP and 57,696 shares of common stock held by the David A. Jones, Jr. Revocable Trust, of which Mr. Jones is a trustee. Mr. Jones is a member of the advisory committee of CP II LLC that makes investment and voting decisions with respect to the shares held by CV II LP and, by virtue of such status, may be deemed to be the beneficial owner of the shares held by CV II LP. Mr. Jones is the chairman of our board of directors. |
|
(15) |
Reflects shares held by FP IV and FP IV-A. Mr. Perlman is an officer of FP GP Management and, by virtue of such status, may be deemed to be the beneficial owner of the shares held by FP IV and FP IV-A. Mr. Perlman is a member of our board of directors. |
|
(16) |
Includes an aggregate of 150,588 shares issuable upon the vesting of restricted stock units vesting within 60 days of March 27, 2018, and shares issuable upon the exercise of options exercisable within 60 days of March 27, 2018. |
Related Party Transaction Policy
We have a written policy on authorizations, the Related Party Transactions Policy, which includes specific provisions for related party transactions. Pursuant to the Related Party Transactions Policy, related party transactions include any transaction, arrangement
75
or relationship, or series of such transactions, including any indebtedness or guarantees, in which the amount involved exceeds $120,000 and in which any of our directors, executive officers, holders of more than 5% of any class of our voting securities, or any member of the immediate family of any of the foregoing persons, had or will have a direct or indirect material interest. In the event that a related party transaction is identified, such transaction must be reported to our Corporate Secretary and subsequently must be reviewed and approved or ratified by the chairman of our audit committee or our full audit committee, depending on the amount of the transaction. Any member of the audit committee who is one of the parties in the related party transaction and who has a direct material interest in the transaction may not participate in the approval of the transaction. The audit committee has pre-approved certain potential related party transactions in advance including employment of executive officers and director compensation.
Related Party Transactions
Since the beginning of fiscal 2016, there has not been, nor is there currently proposed, any transaction or series of similar transactions to which we were or are a party in which the amount involved exceeded or exceeds $120,000 and in which any of our directors, executive officers, holders of more than 5% of any class of our voting securities, or any member of the immediate family of any of the foregoing persons, had or will have a direct or indirect material interest, except for the compensation and other arrangements described in Item 11, “Executive Compensation,” in this Form 10-K and the transactions described below.
Merger Agreement
On January 4, 2018, we entered into the Merger Agreement with Parent and Merger Sub. Pursuant to the Merger Agreement, Merger Sub will be merged with and into the Company (the “Merger”), the separate corporate existence of Merger Sub will cease and we will continue our corporate existence under Delaware law as the surviving corporation in the Merger. Parent will own 100% of our equity interests following the transactions contemplated by the Merger Agreement. Parent is affiliated with Francisco Partners IV, L.P. and Francisco Partners IV-A, L.P. (together, the “FP Investors”), which own approximately 58% of the total number of outstanding shares of capital stock of the Company (on an as-converted-to-common-stock basis) as of March 27, 2018. The FP Investors are affiliated with Francisco Partners, a global private equity firm specializing in investments in technology and technology-enabled services businesses.
At the effective time of the Merger, each share of our common stock, par value $0.001 per share (the “Common Stock”), issued and outstanding immediately prior to the effective time of the Merger (other than shares held by (a) Parent or Merger Sub, (b) us in treasury or any wholly owned subsidiary of us, (c) holders of Common Stock who have properly demanded appraisal rights (and who have not failed to perfect or effectively withdraw such demand or otherwise waive or lose their rights to appraisal), and (d) the FP Investors, Chrysalis Ventures II, L.P. (“Chrysalis”) and certain of affiliates of Chrysalis (collectively, the “Rollover Investors”)) will be converted into the right to receive $0.35, in cash, without interest and less any required withholding taxes, and automatically canceled. The Rollover Investors have entered into a Rollover Agreement pursuant to which the Rollover Investors have agreed to contribute all shares of the Company’s Common Stock, as well as all shares of Series A Convertible Preferred Stock and Series B Convertible Preferred Stock held by such Rollover Investors, to Parent.
Our board of directors, based in part on the unanimous recommendation of a special committee of independent and disinterested members of the board, for purposes of serving on the special committee (the “Special Committee”), that was established to evaluate and negotiate a potential transaction with the assistance of its own independent legal and financial advisors, has unanimously (a) determined that the Merger Agreement and the related transactions contemplated thereby are fair and in the best interests of the Company and its stockholders other than the Rollover Investors, (b) approved and declared advisable the Merger Agreement and the related transactions contemplated thereby, and (c) resolved to recommend that the Company’s stockholders approve the adoption of the Merger Agreement and the related transactions contemplated thereby. In evaluating the potential transaction, the Special Committee consulted with its independent legal and financial advisors and in making its determination considered a number of factors, and our board of directors made its recommendation after consultation with its advisors and consideration of a number of factors, including the recommendation of the Special Committee. The Special Committee and our board did not assess whether the Rollover Agreement was fair and in the best interests of the Rollover Investors.
For more information regarding the Merger, the Merger Agreement, and the approval of the Merger Agreement by our board of directors and the Special Committee, see our definitive proxy statement filed with the Securities and Exchange Commission on February 12, 2018, and the text of the Merger Agreement attached to this Form 10-K as Exhibit 2.5.
Voting and Support Agreement
Concurrently with the execution and delivery of the Merger Agreement, and as a condition and inducement to our willingness to enter into the Merger Agreement, the FP Investors and Chrysalis (the “Sponsor Entities”) entered into a Voting and Support Agreement with us, dated as of January 4, 2018. As of the date of the Voting Agreement, the Sponsor Entities party to the Voting
76
Agreement owned 32,940,853 shares of common stock, on an as-converted basis, representing approximately 68% of the outstanding voting power of our capital stock as of such date.
Pursuant to the Voting Agreement, the Sponsor Entities have agreed, unless our board of directors or the Special Committee has changed its recommendation that the stockholders adopt the Merger Agreement, to vote all shares of our capital stock owned by them in favor of the adoption of the Merger Agreement and the approval of the transactions contemplated thereby and against any other action or agreement not recommended by the Board of Directors that would reasonably be expected to (i) result in a breach of any covenant, representation or warranty or any other obligation or agreement of us under the Merger Agreement, (ii) result in any of the conditions to the consummation of the Merger under the Merger Agreement not being fulfilled or (iii) impede, frustrate, interfere with, delay, postpone or adversely affect the Merger and the other transactions contemplated by the Merger Agreement.
In addition, pursuant to the Voting Agreement, if we enter into a definitive agreement with respect to a superior proposal that will result in the Preferred Stock’s being redeemed in accordance with its terms, among other conditions, the Sponsor Entities have agreed to vote their shares in favor of such superior proposal. The Sponsor Entities have also agreed to refrain from exercising their rights with respect to control of our board of directors until the Voting Agreement is terminated according to its terms.
Finally, pursuant to the Voting Agreement, the Sponsor Entities have agreed, if requested to do so by our board of directors or the Special Committee, to explore in good faith the possibility of working with any third parties regarding alternative acquisition proposals to the extent we are permitted to do so under the Merger Agreement, including by reviewing and responding to proposals and taking part in meetings and negotiations with respect thereto, and have represented that they are not subject to any agreement that would prevent them from doing so. The Voting Agreement will terminate at the effective time of the Merger or, if earlier, the date of the termination of the Merger Agreement, unless there is a superior proposal, in which case the termination will occur upon the earliest of (i) the consummation of the superior proposal, (ii) the termination of the definitive agreement reflecting the superior proposal in accordance with its terms, and (iii) the date that is five months after the termination of the Merger Agreement by us in order to pursue a superior proposal.
We will be entitled to specific performance of the terms of the Voting Agreement, including an injunction or injunctions, restraining order, or such other equitable relief as a court of competent jurisdiction may deem necessary or appropriate to enforce specifically the terms and provisions of the Voting Agreement. The Voting Agreement is governed by Delaware law and is subject to the jurisdiction of the Delaware Court of Chancery.
Private Placement Transactions
On May 2, 2016, we completed the sale of 52,000 shares of our Series A Preferred Stock to the Sponsor Entities (the “Series A Financing”) for a purchase price of $1,000 per share, for an aggregate purchase price of $52 million pursuant to an Investment Agreement, dated March 11, 2016, as amended, by and among the Company and the Sponsor Entities. The Series A Preferred Stock issued in the Series A Financing was authorized pursuant to a Certificate of Designations, Preferences and Rights of Series A Convertible Preferred Stock of Connecture, Inc. that we filed with the Secretary of State of the State of Delaware on April 29, 2016. Prior to the Series A Financing, the FP Investors did not have an ownership interest in the Company. Chrysalis, which also participated in the Series A Financing, was an existing investor of the Company prior to the Series A Financing.
On March 10, 2017, we completed the sale of 17,500 shares of our Series B Preferred Stock to the Sponsor Entities (the “Series B Financing”) for a purchase price of $1,000 per share, for an aggregate purchase price of $17,500,000, pursuant to an Investment Agreement, dated March 10, 2017, as amended, by and among the Company and the Sponsor Entities. The Series B Preferred Stock issued in the Series B Financing was authorized pursuant to a Certificate of Designations, Preferences and Rights of Series B Convertible Preferred Stock of Connecture, Inc. that we filed with the Secretary of State of the State of Delaware on March 10, 2017. We refer to the Series A Financing, the Series B Financing, and the transactions contemplated thereby collectively as the “Private Placement Transactions.”
Holders of our Series A Preferred Stock are entitled to a cumulative dividend at the rate of 7.5% per annum (subject to adjustment), payable quarterly in arrears. The dividends are to be paid in-kind, through an increase in the number of shares of common stock into which shares of Series A Preferred Stock are convertible, through at least May 2, 2018, and thereafter in cash or in-kind at our option. Upon the occurrence of certain events, the dividend rate will increase. Holders of our Series B Preferred Stock are entitled to a cumulative dividend at the rate of 15% per annum (subject to adjustment), payable quarterly in arrears. The dividends are to be paid in kind, through an increase in the number of shares of common stock into which shares of Series B Preferred Stock are convertible, through at least March 10, 2019, and thereafter in cash or in kind at our option. Upon the occurrence of certain events, the dividend rate will increase.
Each share of Series A Preferred Stock is convertible into a number of shares of Common Stock equal to (i) the sum of (a) the stated value per share of Series A Preferred Stock (initially $1,000 per share and subsequently increased by the payment of in-kind dividends), plus (b) all accrued and unpaid dividends thereon up to but not including the conversion date, divided by (ii) the conversion price of the Series A Preferred Stock at such time (which initially was $4.50 per share, subject to customary anti-dilution
77
adjustments, and was subsequently adjusted to $3.96 as a result of the Series B Financing). Each share of Series B Preferred Stock is convertible into a number of Series B Conversion Shares equal to (i) the sum of (a) the stated value per share of Series B Preferred Stock (initially $1,000 per share and subsequently increased by the payment of in-kind dividends), plus (b) all accrued and unpaid dividends thereon up to but not including the conversion date, divided by (ii) the conversion price of the common stock at such time (which initially is $1.91 per share, subject to customary anti-dilution adjustments). As of March 27, 2018, the Series A Preferred Stock and Series B Preferred Stock were convertible into 15,125,711 and 10,694,902 shares of Common Stock, respectively.
We filed a registration statement on Form S-3 to register for resale the shares of Series A Preferred Stock that was declared effective by the SEC on September 23, 2016, and a second registration statement on Form S-3 to register for resale the shares of Series B Preferred Stock that was declared effective by the SEC on June 1, 2017.
The certificates of designations, preferences and rights of the Series A Preferred Stock and the Series B Preferred Stock contain certain redemption and other rights that are triggered by certain fundamental changes with respect to the Company, including the Merger. In addition, the separate consent, which may be in writing, of the Series A Preferred Stock and the Series B Preferred Stock is required to make certain amendments to the certificate of incorporation of the Company that affect the Series A Preferred Stock or the Series B Preferred Stock, respectively. The Sponsor Entities have indicated that they will waive the treatment of the Merger as a “fundamental change” under the certificates of designation and agree to the amendment of the Company’s certificate of incorporation in connection with the Merger, to the extent necessary to consummate the Merger.
In connection with the closing of the Series A Financing, we entered into an Investor Rights Agreement with the Sponsor Entities (the “Series A Rights Agreement”), which granted the Sponsor Entities certain registration rights with respect to the Series A Preferred Stock and the common stock issuable upon conversion of the Series A Preferred Stock (the “Series A Registrable Securities”), along with certain rights related to the composition of the Board of Directors.
In connection with the closing of the Series B Financing, we entered into an Investor Rights Agreement with the Sponsor Entities (the “Series B Rights Agreement”), granting the Sponsor Entities certain registration rights with respect to the Series B Preferred Stock and the common stock issuable upon conversion of the Series B Preferred Stock (the “Series B Registrable Securities”).
The Series B Rights Agreement also provides that for so long as the FP Investors own at least 10% of the aggregate shares of Series B Preferred Stock, Series A Preferred Stock and Common Stock that it held as of the Closing, it can (i) for so long as it holds at least 5% of the aggregate outstanding securities of the Company (on an as-converted basis) designate a proportionate share of the Board of Directors based upon its percentage ownership of the Company’s outstanding securities on an as-converted basis, rounded up to the nearest whole director, which designees will be entitled to serve on each committee of the Board of Directors, subject to applicable legal requirements, and (ii) if no director designated by the FP Investors is serving on the Board of Directors, designate one board observer.
In connection with the FP Investors’ rights with respect to the designation of directors, a new committee of the Board (the “Investor Committee”) was formed as of the closing of the Series B Financing, which Investor Committee has the sole authority to effect the exercise of the FP Investors’ rights with respect to the designation of directors by increasing the size of the Board and appointing directors designated by the FP Investors to fill vacancies on the Board and committees thereof. Only directors designated by the FP Investors will serve on the Investor Committee, which currently consists of Ezra Perlman. In addition, as of the closing of the Series B Financing, the size of the Board was increased from seven to eight directors, with the eighth seat initially vacant and subsequently filled by Kraig McEwen upon designation by the FP Investors. The rights granted to the FP Investors with respect to the designation of directors supersede all similar prior rights granted to the FP Investors pursuant to the Series A Rights Agreement.
Concurrently with the execution and delivery of the Merger Agreement, the Sponsor Entities entered into the Voting Agreement with the Company. Pursuant to the Voting Agreement, the Sponsor Entities have agreed, unless the Board of Directors or the Special Committee has changed its recommendation that the stockholders adopt the Merger Agreement, to vote all shares of the Company’s capital stock owned by them in favor of the adoption of the Merger Agreement and the approval of the transactions contemplated thereby and against any other action or agreement not recommended by the Board of Directors that would reasonably be expected to (i) result in a breach of any covenant, representation or warranty or any other obligation or agreement of the Company under the Merger Agreement, (i) result in any of the conditions to the consummation of the Merger under the Merger Agreement not being fulfilled or (iii) impede, frustrate, interfere with, delay, postpone or adversely affect the Merger and the other transactions contemplated by the Merger Agreement.
In addition, pursuant to the Voting Agreement, if the Company enters into a definitive agreement with respect to a superior proposal that will result in the Preferred Stock being redeemed in accordance with its terms, among other conditions, the Sponsor Entities have agreed to vote their shares in favor of such superior proposal. The Sponsor Entities have also agreed to refrain from exercising their rights with respect to control of the Board of Directors until the Voting Agreement is terminated according to its terms.
78
Finally, pursuant to the Voting Agreement, the Sponsor Entities have agreed, if requested to do so by the Board of Directors or the Special Committee, to explore in good faith the possibility of working with any third parties regarding alternative acquisition proposals to the extent the Company is permitted to do so under the Merger Agreement, including by reviewing and responding to proposals and taking part in meetings and negotiations with respect thereto, and have represented that they are not subject to any agreement that would prevent them from doing so. The Voting Agreement will terminate at the effective time of the Merger or, if earlier, the date of the termination of the Merger Agreement, unless there is a superior proposal, in which case the termination will occur upon the earliest of (i) the consummation of the superior proposal, (ii) the termination of the definitive agreement reflecting the superior proposal in accordance with its terms, and (iii) the date that is five months after the termination of the Merger Agreement by the Company in order to pursue a superior proposal.
Humana Payments
David A. Jones, the chairman of our board of directors, is also on the board of directors of Humana, Inc. In fiscal 2016, we paid Humana approximately $0.6 million for health care premium payments. Under our arrangement with Humana, Inc., the premiums charged and benefits provided are comparable to those Humana extends to other non-affiliated customers. The payments to Humana did not continue in fiscal 2017.
Stock Options Granted to Executive Officers and Directors
We have granted stock options and restricted stock units to our executive officers. We have also granted stock options and restricted stock units to certain members of our board of directors. For more information regarding certain of these equity awards, see Item 11, “Executive Compensation—Summary Compensation Table” and “Executive Compensation—Compensation of Directors” in this Form 10-K.
Private Company Investors’ Rights Agreement
We are party to an investors’ rights agreement, as amended, with certain holders of our stockholders that were preferred stockholders prior to our initial public offering, which we refer to as our Private Company Investors’ Rights Agreement. The Private Company Investors’ Rights Agreement, as amended, grants such stockholders certain registration rights, which include demand registration rights, piggyback registration rights and short-form registration rights, with respect to shares of our common stock.
Employment Agreements
We have entered into employment agreements with certain of our executive officers. These employment agreements provide for severance payments upon termination of the executive in certain circumstances and acceleration of vesting of stock options upon the occurrence of a change in control. Please see Item 11, “Executive Compensation—Potential Payments upon Termination and Change in Control” elsewhere in this Form 10-K for a summary of the potential payments to our named executive officers upon the occurrence of a change in control.
Indemnification of Officers and Directors
As permitted by Delaware law, our amended and restated certificate of incorporation provides that, to the fullest extent permitted by Delaware law, no director will be personally liable to us or our stockholders for monetary damages for breach of fiduciary duty as a director. Pursuant to Delaware law such protection would be not available for liability:
|
|
• |
for any breach of a duty of loyalty to us or our stockholders; |
|
|
• |
for acts or omissions not in good faith or that involve intentional misconduct or a knowing violation of law; |
|
|
• |
for any transaction from which the director derived an improper benefit; or |
|
|
• |
for an act or omission for which the liability of a director is expressly provided by an applicable statute, including unlawful payments of dividends or unlawful stock repurchases or redemptions as provided in Section 174 of the Delaware General Corporation Law. |
Our amended and restated certificate of incorporation also provides that if Delaware law is amended after the approval by our stockholders of the amended and restated certificate of incorporation to authorize corporate action further eliminating or limiting the personal liability of directors, then the liability of our directors will be eliminated or limited to the fullest extent permitted by Delaware law. In addition, our amended and restated bylaws provide that we are required to advance expenses to our directors and officers as incurred in connection with legal proceedings against them for which they may be indemnified and that the rights conferred in the amended and restated bylaws are not exclusive.
79
We have entered into indemnity agreements with each of our directors and executive officers. These agreements, among other things, require us to indemnify each director and officer to the fullest extent permitted by Delaware law and our amended and restated certificate of incorporation and bylaws for expenses such as, among other things, attorneys’ fees, judgments, fines and settlement amounts incurred by the director or executive officer in any action or proceeding, including any action by or in our right, arising out of the person’s services as our director or executive officer or as the director or executive officer of any subsidiary of ours or any other company or enterprise to which the person provides services at our request. We also maintain directors’ and officers’ liability insurance.
Director Independence
For purposes of the determination of independence of directors under Item 407(a) of Regulation S-K, our board of directors has adopted the definition of independence as set forth in the continued listing standards of the Nasdaq Stock Market as its standard for assessing independence (the “Nasdaq Listing Rules”). Our board of directors has determined that each of Messrs. Ansay, Kusserow and Thomas and Ms. Capps is an “independent director” for purposes of the Nasdaq Listing Rules as the term relates to membership on the board of directors.
The definition of independence under the Nasdaq Listing Rules includes a series of objective tests, such as that the director is not, and has not been for at least three years, one of our employees and that neither the director, nor any of his or her family members, has engaged in various types of business dealings with us. In addition, as further required by the Nasdaq Listing Rules, our board has made a subjective determination as to each independent director that no material relationships exist that, in the opinion of our board, would interfere with his or her exercise of independent judgment in carrying out the responsibilities of a director. In making these determinations, our board reviewed and discussed information provided by the directors in questionnaires with questions tailored to the Nasdaq Listing Rules with regard to each director’s business and personal activities as they may relate to us and our management.
During its independence review, our board of directors considered that Mr. Ansay is an officer, part-owner and board member of Ansay & Associates, LLC, an independent insurance agency that in June 2014 entered into an agreement with us pursuant to which Ansay & Associates licensed certain of our products in the ordinary course of business through the 2016 termination of the agreement. Our board of directors determined that this relationship does not impair Mr. Ansay’s independence or result in a material relationship with us that could compromise Mr. Ansay’s ability to exercise independent judgment in carrying out his responsibilities because the agreement was entered into in the ordinary course of business for both Ansay & Associates and us, and the fees we received under the agreement do not otherwise require disclosure pursuant to Item 404(a) of Regulation S-K or otherwise impair Mr. Ansay’s independence under the Nasdaq Listing Rules.
The following table sets forth the aggregate fees billed by Deloitte & Touche LLP (“Deloitte”), our independent registered public accounting firm, for the fiscal years ended December 31, 2017 and 2016:
|
|
|
Fiscal 2017 |
|
|
Fiscal 2016 |
|
||
|
Audit fees (1) |
|
$ |
708,000 |
|
|
$ |
662,000 |
|
|
Audit-related fees (2) |
|
|
10,000 |
|
|
|
83,000 |
|
|
Tax fees (3) |
|
|
93,000 |
|
|
|
69,000 |
|
|
All other fees (4) |
|
|
— |
|
|
|
— |
|
|
Total fees |
|
$ |
811,000 |
|
|
$ |
814,000 |
|
|
(1) |
Audit fees consist of fees billed for professional services rendered for the audit of our consolidated annual financial statements, the review of the interim consolidated financial statements included in quarterly reports and services that are normally provided by the independent auditor in connection with statutory and regulatory filings or engagements. |
|
(2) |
Audit-related fees consist of fees billed for assurance and related services that are reasonably related to the performance of the audit or review of our consolidated financial statements and are not reported under “Audit Fees.” |
|
(3) |
Tax fees consist of fees billed for professional services rendered for tax compliance, tax advice and tax planning. These services include assistance regarding federal and state tax compliance and acquisitions. |
|
(4) |
All other fees consist of fees for products and services other than the services reported above. |
80
Policy on Audit Committee Pre-approval of Audit and Non-Audit Services Performed by Independent Registered Public Accounting Firm
The audit committee has determined that all services performed by Deloitte are compatible with maintaining the independence of Deloitte. The audit committee’s policy is to pre-approve all audit and permissible non-audit services provided by our independent registered public accounting firm. These services may include audit services, audit-related services, tax services and other services. Unless the specific service has been pre-approved with respect to that year, the audit committee must approve the permitted service before the independent registered public accounting firm is engaged to perform it. The audit committee has pre-approved all services since the pre-approved policy was adopted. The independent registered public accounting firm and management are required to periodically report to the audit committee regarding the extent of services provided by the independent registered public accounting firm in accordance with this pre-approval process.
81
(a) Documents Filed with Report
(1) Consolidated Financial Statements
|
|
|
Page |
|
|
F-2 |
|
|
Consolidated Balance Sheets as of December 31, 2017 and 2016 |
|
F-3 |
|
|
F-4 |
|
|
|
F-5 |
|
|
Consolidated Statements of Cash Flows for the years ended December 31, 2017, 2016 and 2015 |
|
F-6 |
|
|
F-7 |
|
|
|
|
|
|
(2) Financial Statement Schedule |
|
|
|
|
|
|
|
|
F-27 |
(b) Exhibits.
The information required by this Item is set forth on the exhibit index that follows the signature page of this Annual Report on Form 10-K.
None.
82
|
Exhibit |
|
|
|
Incorporated by Reference |
||||||
|
Number |
|
Description |
|
Form |
|
File No. |
|
Exhibit |
|
Filing Date |
|
|
|
|
|
|
|
|
|
|
|
|
|
2.1 |
|
|
S-1 |
|
333-199484 |
|
2.1 |
|
October 20, 2014 |
|
|
|
|
|
|
|
|
|
|
|
|
|
|
2.2 |
|
|
S-1 |
|
333-199484 |
|
2.2 |
|
October 20, 2014 |
|
|
|
|
|
|
|
|
|
|
|
|
|
|
2.3 |
|
|
S-1 |
|
333-199484 |
|
2.3 |
|
October 20, 2014 |
|
|
|
|
|
|
|
|
|
|
|
|
|
|
2.4 |
|
|
8-K |
|
001-36778 |
|
2.1 |
|
June 9, 2016 |
|
|
|
|
|
|
|
|
|
|
|
|
|
|
2.5 |
|
|
8-K |
|
001-36778 |
|
2.1 |
|
January 4, 2018 |
|
|
|
|
|
|
|
|
|
|
|
|
|
|
3.1.1 |
|
Sixth Amended and Restated Certificate of Incorporation, dated December 16, 2014 |
|
10-K |
|
001-36778 |
|
3.1 |
|
March 25, 2015 |
|
|
|
|
|
|
|
|
|
|
|
|
|
3.1.2 |
|
Certificate of Designations, Preferences and Rights of Series A Convertible Preferred Stock |
|
8-K |
|
001-36778 |
|
3.1 |
|
May 4, 2016 |
|
|
|
|
|
|
|
|
|
|
|
|
|
3.1.3 |
|
Certificate of Designations, Preferences and Rights of Series B Convertible Preferred Stock |
|
8-K |
|
001-36778 |
|
3.1 |
|
March 14, 2017 |
|
|
|
|
|
|
|
|
|
|
|
|
|
3.2 |
|
|
S-1/A |
|
333-199484 |
|
3.4 |
|
November 10, 2014 |
|
|
|
|
|
|
|
|
|
|
|
|
|
|
4.1.1 |
|
|
S-1 |
|
333-199484 |
|
4.1 |
|
October 20, 2014 |
|
|
|
|
|
|
|
|
|
|
|
|
|
|
4.1.2 |
|
First Amendment to Investor Rights Agreement, dated November 6, 2014 |
|
S-1/A |
|
333-199484 |
|
4.1.1 |
|
November 10, 2014 |
|
|
|
|
|
|
|
|
|
|
|
|
|
4.2 |
|
|
8-K |
|
001-36778 |
|
4.1 |
|
May 4, 2016 |
|
|
|
|
|
|
|
|
|
|
|
|
|
|
4.3 |
|
|
8-K |
|
001-36778 |
|
4.1 |
|
March 14, 2017 |
|
|
|
|
|
|
|
|
|
|
|
|
|
|
10.1 |
|
Form of Indemnification Agreement for directors and officers |
|
S-1/A |
|
333-199484 |
|
10.1 |
|
November 26, 2014 |
|
|
|
|
|
|
|
|
|
|
|
|
|
10.2† |
|
2010 Stock Plan, as amended, and form of agreement thereunder |
|
S-1 |
|
333-199484 |
|
10.2 |
|
October 20, 2014 |
|
|
|
|
|
|
|
|
|
|
|
|
|
10.3.1† |
|
2014 Equity Incentive Plan, as amended, and forms of agreement thereunder |
|
8-K |
|
001-36778 |
|
10.1 |
|
September 26, 2016 |
|
|
|
|
|
|
|
|
|
|
|
|
|
10.3.2† |
|
Form of Restricted Stock Units Agreements under the Registrant’s 2014 Equity Incentive Plan |
|
10-K |
|
001-36778 |
|
10.3.2 |
|
March 25, 2015 |
|
|
|
|
|
|
|
|
|
|
|
|
|
10.4† |
|
|
S-1/A |
|
333-199484 |
|
10.14 |
|
November 26, 2014 |
|
83
|
Exhibit |
|
|
|
Incorporated by Reference |
||||||
|
Number |
|
Description |
|
Form |
|
File No. |
|
Exhibit |
|
Filing Date |
|
|
|
|
|
|
|
|
|
|
|
|
|
10.5.1 |
|
|
8-K |
|
001-36778 |
|
10.1 |
|
March 14, 2016 |
|
|
|
|
|
|
|
|
|
|
|
|
|
|
10.5.2 |
|
|
8-K |
|
001-36778 |
|
10.1 |
|
May 4, 2016 |
|
|
|
|
|
|
|
|
|
|
|
|
|
|
10.6 |
|
|
8-K |
|
001-36778 |
|
10.1 |
|
March 14, 2017 |
|
|
|
|
|
|
|
|
|
|
|
|
|
|
10.7 |
|
|
8-K |
|
001-36778 |
|
99.1 |
|
January 4, 2018 |
|
|
|
|
|
|
|
|
|
|
|
|
|
|
10.8.1** |
|
|
10-Q |
|
001-36778 |
|
10.2 |
|
August 9, 2016 |
|
|
|
|
|
|
|
|
|
|
|
|
|
|
10.8.2 |
|
Amendment No. 1 to Amended and Restated Credit Agreement, dated November 4, 2016 |
|
10-Q |
|
001-36778 |
|
10.1 |
|
November 9, 2016 |
|
|
|
|
|
|
|
|
|
|
|
|
|
10.8.3 |
|
Amendment No. 2 to Amended and Restated Credit Agreement, dated March 10, 2017 |
|
8-K |
|
001-36778 |
|
10.2 |
|
March 14, 2017 |
|
|
|
|
|
|
|
|
|
|
|
|
|
10.8.4 |
|
Amendment No. 3 to Amended and Restated Credit Agreement, dated January 4, 2018 |
|
8-K |
|
001-36778 |
|
10.1 |
|
January 4, 2018 |
|
|
|
|
|
|
|
|
|
|
|
|
|
10.8.5* |
|
|
|
|
|
|
|
|
|
|
|
|
|
|
|
|
|
|
|
|
|
|
|
10.9.1 |
|
|
S-1 |
|
333-199484 |
|
10.3.7 |
|
October 20, 2014 |
|
|
|
|
|
|
|
|
|
|
|
|
|
|
10.9.2 |
|
|
S-1 |
|
333-199484 |
|
10.3.8 |
|
October 20, 2014 |
|
|
|
|
|
|
|
|
|
|
|
|
|
|
10.9.3 |
|
|
S-1 |
|
333-199484 |
|
10.3.9 |
|
October 20, 2014 |
|
|
|
|
|
|
|
|
|
|
|
|
|
|
10.9.4 |
|
|
S-1 |
|
333-199484 |
|
10.3.10 |
|
October 20, 2014 |
|
|
|
|
|
|
|
|
|
|
|
|
|
|
10.10.1 |
|
|
S-1 |
|
333-199484 |
|
10.7.1 |
|
October 20, 2014 |
|
84
85
|
Exhibit |
|
|
|
Incorporated by Reference |
||||||
|
Number |
|
Description |
|
Form |
|
File No. |
|
Exhibit |
|
Filing Date |
|
|
|
|
|
|
|
|
|
|
|
|
|
31.1* |
|
|
|
|
|
|
|
|
|
|
|
|
|
|
|
|
|
|
|
|
|
|
|
31.2* |
|
|
|
|
|
|
|
|
|
|
|
|
|
|
|
|
|
|
|
|
|
|
|
32.1# |
|
|
|
|
|
|
|
|
|
|
|
|
|
|
|
|
|
|
|
|
|
|
|
32.2# |
|
|
|
|
|
|
|
|
|
|
|
|
|
|
|
|
|
|
|
|
|
|
|
101.INS |
|
XBRL Taxonomy Document |
|
|
|
|
|
|
|
|
|
101.SCH |
|
XBRL Taxonomy Extension Schema |
|
|
|
|
|
|
|
|
|
101.CAL |
|
XBRL Taxonomy Extension Calculation Linkbase |
|
|
|
|
|
|
|
|
|
101.LAB |
|
XBRL Taxonomy Extension Label Linkbase |
|
|
|
|
|
|
|
|
|
101.PRE |
|
XBRL Taxonomy Extension Presentation Linkbase |
|
|
|
|
|
|
|
|
|
101.DEF |
|
XBRL Taxonomy Extension Definition Linkbase |
|
|
|
|
|
|
|
|
|
† |
Management contract, compensatory plan or arrangement |
|
* |
Filed herewith |
|
# |
Furnished herewith |
|
** |
Portions of this agreement have been redacted pursuant to a request for confidential treatment that was granted by the Securities and Exchange Commission. |
86
Pursuant to the requirements of Section 13 or 15(d) of the Securities Exchange Act of 1934, the registrant has duly caused this report to be signed on its behalf by the undersigned, thereunto duly authorized.
Date: April 2, 2018
|
CONNECTURE, INC. |
||
|
|
|
|
|
By: |
|
/s/ Jeffery A. Surges |
|
|
|
Jeffery A. Surges |
|
|
|
Chief Executive Officer |
87
SIGNATURES AND POWER OF ATTORNEY
Each person whose individual signature appears below hereby authorizes and appoints Jeffery A. Surges and Brian D. Lindstrom, and each of them, with full power of substitution and resubstitution and full power to act without the other, as his or her true and lawful attorney-in-fact and agent to act in his or her name, place and stead and to execute in the name and on behalf of each person, individually and in each capacity stated below, and to file any and all amendments to this Annual Report on Form 10-K, and to file the same, with all exhibits thereto, and other documents in connection therewith, with the Securities and Exchange Commission, granting unto said attorneys-in-fact and agents, and each of them, full power and authority to do and perform each and every act and thing, ratifying and confirming all that said attorneys-in-fact and agents or any of them or their or his substitute or substitutes may lawfully do or cause to be done by virtue thereof.
Pursuant to the requirements of the Securities Exchange Act of 1934, this report has been signed below by the following persons on behalf of the registrant and in the capacities indicated.
|
Signature |
|
Title |
|
Date |
|
|
|
|
|
|
|
/s/ Jeffery A. Surges |
|
President and Chief Executive Officer (Principal Executive Officer) and Director |
|
April 2, 2018 |
|
Jeffery A. Surges |
||||
|
|
|
|
|
|
|
/s/ Brian D. Lindstrom |
|
Chief Financial Officer (Principal Financial and Accounting Officer) |
|
April 2, 2018 |
|
Brian D. Lindstrom |
||||
|
|
|
|
|
|
|
/s/ David A. Jones, Jr. |
|
Chairman of the Board of Directors |
|
April 2, 2018 |
|
David A. Jones, Jr. |
||||
|
|
|
|
|
|
|
/s/ A. John Ansay |
|
Director |
|
April 2, 2018 |
|
A. John Ansay |
||||
|
|
|
|
|
|
|
/s/ Vickie L. Capps |
|
Director |
|
April 2, 2018 |
|
Vickie L. Capps |
||||
|
|
|
|
|
|
|
/s/ Paul Kusserow |
|
Director |
|
April 2, 2018 |
|
Paul Kusserow |
||||
|
|
|
|
|
|
|
/s/ Kraig McEwen |
|
Director |
|
April 2, 2018 |
|
Kraig McEwen |
||||
|
|
|
|
|
|
|
/s/ Ezra Perlman |
|
Director |
|
April 2, 2018 |
|
Ezra Perlman |
||||
|
|
|
|
|
|
|
/s/ Russell S. Thomas |
|
Director |
|
April 2, 2018 |
|
Russell S. Thomas |
88
|
|
|
Page |
|
|
F-2 |
|
|
Consolidated Balance Sheets as of December 31, 2017 and 2016 |
|
F-3 |
|
|
F-4 |
|
|
|
F-5 |
|
|
Consolidated Statements of Cash Flows for the years ended December 31, 2017, 2016 and 2015 |
|
F-6 |
|
|
F-7 |
|
|
|
F-27 |
F-1
REPORT OF INDEPENDENT REGISTERED PUBLIC ACCOUNTING FIRM
To the Stockholders and the Board of Directors of Connecture, Inc. and subsidiaries
Opinion on the Financial Statements
We have audited the accompanying consolidated balance sheets of Connecture, Inc. and subsidiaries (the "Company") as of December 31, 2017 and 2016, the related consolidated statements of operations and comprehensive loss, stockholders’ deficit, and cash flows, for each of the three years in the period ended December 31, 2017, and the related notes and the schedule listed in the Index at Item 15 (collectively referred to as the "financial statements"). In our opinion, the financial statements present fairly, in all material respects, the financial position of the Company as of December 31, 2017 and 2016, and the results of its operations and its cash flows for each of the three years in the period ended December 31, 2017, in conformity with accounting principles generally accepted in the United States of America.
Going Concern
The accompanying financial statements have been prepared assuming that the Company will continue as a going concern. As discussed in Note 3 to the consolidated financial statements, the Company currently projects that it will not comply with certain covenants of its Senior Credit Facility during the twelve-month period following issuance of these financial statements and may not have sufficient funds to repay such loans, which could become immediately due and payable in the event of default of the covenants. These matters raise substantial doubt about the Company’s ability to continue as a going concern. Management's plans in regard to these matters are also described in Note 3. The financial statements do not include any adjustments that might result from the outcome of this uncertainty.
Basis for Opinion
These financial statements are the responsibility of the Company's management. Our responsibility is to express an opinion on the Company's financial statements based on our audits. We are a public accounting firm registered with the Public Company Accounting Oversight Board (United States) (PCAOB) and are required to be independent with respect to the Company in accordance with the U.S. federal securities laws and the applicable rules and regulations of the Securities and Exchange Commission and the PCAOB.
We conducted our audits in accordance with the standards of the PCAOB. Those standards require that we plan and perform the audit to obtain reasonable assurance about whether the financial statements are free of material misstatement, whether due to error or fraud. The Company is not required to have, nor were we engaged to perform, an audit of its internal control over financial reporting. As part of our audits, we are required to obtain an understanding of internal control over financial reporting but not for the purpose of expressing an opinion on the effectiveness of the Company’s internal control over financial reporting. Accordingly, we express no such opinion.
Our audits included performing procedures to assess the risks of material misstatement of the financial statements, whether due to error or fraud, and performing procedures that respond to those risks. Such procedures included examining, on a test basis, evidence regarding the amounts and disclosures in the financial statements. Our audits also included evaluating the accounting principles used and significant estimates made by management, as well as evaluating the overall presentation of the financial statements. We believe that our audits provide a reasonable basis for our opinion.
/s/ Deloitte & Touche LLP
Milwaukee, Wisconsin
April 2, 2018
We have served as the Company's auditor since 2013.
F-2
CONNECTURE, INC. AND SUBSIDIARIES
CONSOLIDATED BALANCE SHEETS AS OF DECEMBER 31, 2017 and 2016
(In thousands, except share and per share information)
|
|
|
2017 |
|
|
2016 |
|
||
|
ASSETS |
|
|
|
|
|
|
|
|
|
CURRENT ASSETS: |
|
|
|
|
|
|
|
|
|
Cash and cash equivalents |
|
$ |
7,743 |
|
|
$ |
6,208 |
|
|
Accounts receivable |
|
|
11,094 |
|
|
|
8,390 |
|
|
Prepaid expenses and other current assets |
|
|
1,033 |
|
|
|
1,153 |
|
|
Total current assets |
|
|
19,870 |
|
|
|
15,751 |
|
|
PROPERTY AND EQUIPMENT — Net |
|
|
1,079 |
|
|
|
1,957 |
|
|
GOODWILL |
|
|
30,872 |
|
|
|
31,072 |
|
|
OTHER INTANGIBLE ASSETS — Net |
|
|
5,910 |
|
|
|
9,188 |
|
|
DEFERRED IMPLEMENTATION COSTS |
|
|
24,264 |
|
|
|
23,257 |
|
|
OTHER ASSETS |
|
|
1,083 |
|
|
|
1,263 |
|
|
TOTAL ASSETS |
|
$ |
83,078 |
|
|
$ |
82,488 |
|
|
LIABILITIES, REDEEMABLE PREFERRED STOCK AND STOCKHOLDERS’ |
|
|
|
|
|
|
|
|
|
DEFICIT |
|
|
|
|
|
|
|
|
|
CURRENT LIABILITIES: |
|
|
|
|
|
|
|
|
|
Accounts payable |
|
$ |
5,589 |
|
|
$ |
7,387 |
|
|
Accrued payroll and related liabilities |
|
|
4,598 |
|
|
|
4,945 |
|
|
Other liabilities |
|
|
2,919 |
|
|
|
1,950 |
|
|
Current maturities of debt |
|
|
32,616 |
|
|
|
578 |
|
|
Deferred revenue |
|
|
28,830 |
|
|
|
31,606 |
|
|
Total current liabilities |
|
|
74,552 |
|
|
|
46,466 |
|
|
DEFERRED REVENUE |
|
|
8,840 |
|
|
|
9,310 |
|
|
DEFERRED TAX LIABILITY |
|
|
23 |
|
|
|
23 |
|
|
LONG-TERM DEBT |
|
|
— |
|
|
|
31,944 |
|
|
OTHER LONG-TERM LIABILITIES |
|
|
1,748 |
|
|
|
235 |
|
|
Total liabilities |
|
|
85,163 |
|
|
|
87,978 |
|
|
COMMITMENTS AND CONTINGENCIES (Note 8) |
|
|
|
|
|
|
|
|
|
REDEEMABLE PREFERRED STOCK - SERIES A |
|
|
56,109 |
|
|
|
51,894 |
|
|
REDEEMABLE PREFERRED STOCK - SERIES B |
|
|
19,031 |
|
|
|
— |
|
|
STOCKHOLDERS’ DEFICIT: |
|
|
|
|
|
|
|
|
|
Common stock, $0.001 par value, 75,000,000 shares authorized as of December 31, |
|
|
|
|
|
|
|
|
|
2017 and December 31, 2016, and 23,080,978 and 22,524,655 shares issued and |
|
|
|
|
|
|
|
|
|
outstanding as of December 31, 2017 and December 31, 2016, respectively |
|
|
23 |
|
|
|
23 |
|
|
Additional paid-in capital |
|
|
97,723 |
|
|
|
101,985 |
|
|
Accumulated deficit |
|
|
(174,649 |
) |
|
|
(159,105 |
) |
|
Treasury stock, at cost |
|
|
(322 |
) |
|
|
(287 |
) |
|
Total stockholders’ deficit |
|
|
(77,225 |
) |
|
|
(57,384 |
) |
|
TOTAL LIABILITIES, REDEEMABLE PREFERRED STOCK AND |
|
|
|
|
|
|
|
|
|
STOCKHOLDERS’ DEFICIT |
|
$ |
83,078 |
|
|
$ |
82,488 |
|
The accompanying notes to the consolidated financial statements are an integral part of the statements.
F-3
CONNECTURE, INC. AND SUBSIDIARIES
CONSOLIDATED STATEMENTS OF OPERATIONS AND COMPREHENSIVE LOSS FOR
THE YEARS ENDED DECEMBER 31, 2017, 2016 and 2015
(In thousands, except share and per share information)
|
|
|
2017 |
|
|
2016 |
|
|
2015 |
|
|||
|
|
|
|
|
|
|
|
|
|
|
|
|
|
|
REVENUE |
|
$ |
76,746 |
|
|
$ |
81,894 |
|
|
$ |
95,847 |
|
|
COST OF REVENUE |
|
|
47,062 |
|
|
|
56,895 |
|
|
|
50,670 |
|
|
GROSS MARGIN |
|
|
29,684 |
|
|
|
24,999 |
|
|
|
45,177 |
|
|
OPERATING EXPENSES: |
|
|
|
|
|
|
|
|
|
|
|
|
|
Research and development |
|
|
16,679 |
|
|
|
22,297 |
|
|
|
22,718 |
|
|
Sales and marketing |
|
|
9,356 |
|
|
|
10,410 |
|
|
|
9,507 |
|
|
General and administrative |
|
|
15,378 |
|
|
|
13,162 |
|
|
|
14,439 |
|
|
Total operating expenses |
|
|
41,413 |
|
|
|
45,869 |
|
|
|
46,664 |
|
|
LOSS FROM OPERATIONS |
|
|
(11,729 |
) |
|
|
(20,870 |
) |
|
|
(1,487 |
) |
|
OTHER EXPENSES: |
|
|
|
|
|
|
|
|
|
|
|
|
|
Interest expense |
|
|
3,286 |
|
|
|
3,485 |
|
|
|
5,665 |
|
|
Other expense (income), net |
|
|
509 |
|
|
|
2,239 |
|
|
|
140 |
|
|
Total other expenses |
|
|
3,795 |
|
|
|
5,724 |
|
|
|
5,805 |
|
|
LOSS BEFORE INCOME TAXES |
|
|
(15,524 |
) |
|
|
(26,594 |
) |
|
|
(7,292 |
) |
|
BENEFIT (PROVISION) FOR INCOME TAXES |
|
|
(20 |
) |
|
|
60 |
|
|
|
(51 |
) |
|
NET LOSS |
|
$ |
(15,544 |
) |
|
$ |
(26,534 |
) |
|
$ |
(7,343 |
) |
|
COMPREHENSIVE LOSS |
|
$ |
(15,544 |
) |
|
$ |
(26,534 |
) |
|
$ |
(7,343 |
) |
|
NET LOSS PER COMMON SHARE: |
|
|
|
|
|
|
|
|
|
|
|
|
|
Basic and diluted |
|
$ |
(0.96 |
) |
|
$ |
(1.31 |
) |
|
$ |
(0.34 |
) |
|
WEIGHTED-AVERAGE COMMON SHARES OUTSTANDING: |
|
|
|
|
|
|
|
|
|
|
|
|
|
Basic and diluted |
|
|
22,791,178 |
|
|
|
22,275,256 |
|
|
|
21,813,407 |
|
The accompanying notes to the consolidated financial statements are an integral part of the statements.
F-4
CONNECTURE, INC. AND SUBSIDIARIES
CONSOLIDATED STATEMENTS OF STOCKHOLDERS’ DEFICIT FOR THE YEARS ENDED
DECEMBER 31, 2017, 2016 and 2015
(In thousands, except share and per share information)
|
|
|
|
|
|
|
|
|
|
|
Additional |
|
|
Treasury |
|
|
|
|
|
|
Total |
|
|||
|
|
|
Common Stock |
|
|
Paid-In |
|
|
Stock, at |
|
|
Accumulated |
|
|
Stockholders’ |
|
|||||||||
|
|
|
Shares |
|
|
Amount |
|
|
Capital |
|
|
Cost |
|
|
Deficit |
|
|
Deficit |
|
||||||
|
BALANCES — December 31, 2014 |
|
|
21,689,223 |
|
|
$ |
22 |
|
|
$ |
96,365 |
|
|
$ |
— |
|
|
$ |
(125,228 |
) |
|
$ |
(28,841 |
) |
|
Stock-based compensation expense |
|
|
|
|
|
|
|
|
|
|
4,712 |
|
|
|
|
|
|
|
|
|
|
|
4,712 |
|
|
Exercise of stock options and issuance of other stock awards |
|
|
424,283 |
|
|
|
— |
|
|
|
469 |
|
|
|
|
|
|
|
|
|
|
|
469 |
|
|
Treasury stock acquired |
|
|
(50,149 |
) |
|
|
— |
|
|
|
|
|
|
|
(177 |
) |
|
|
|
|
|
|
(177 |
) |
|
Net loss |
|
|
|
|
|
|
|
|
|
|
|
|
|
|
|
|
|
|
(7,343 |
) |
|
|
(7,343 |
) |
|
BALANCES — December 31, 2015 |
|
|
22,063,357 |
|
|
$ |
22 |
|
|
$ |
101,546 |
|
|
$ |
(177 |
) |
|
$ |
(132,571 |
) |
|
$ |
(31,180 |
) |
|
Preferred stock dividends, Series A |
|
|
|
|
|
|
|
|
|
|
(2,643 |
) |
|
|
|
|
|
|
|
|
|
|
(2,643 |
) |
|
Stock-based compensation expense |
|
|
|
|
|
|
|
|
|
|
2,662 |
|
|
|
|
|
|
|
|
|
|
|
2,662 |
|
|
Exercise of stock options and issuance of other stock awards |
|
|
512,489 |
|
|
|
1 |
|
|
|
420 |
|
|
|
|
|
|
|
|
|
|
|
421 |
|
|
Treasury stock acquired |
|
|
(51,191 |
) |
|
|
— |
|
|
|
|
|
|
|
(110 |
) |
|
|
|
|
|
|
(110 |
) |
|
Net loss |
|
|
|
|
|
|
|
|
|
|
|
|
|
|
|
|
|
|
(26,534 |
) |
|
|
(26,534 |
) |
|
BALANCES — December 31, 2016 |
|
|
22,524,655 |
|
|
$ |
23 |
|
|
$ |
101,985 |
|
|
$ |
(287 |
) |
|
$ |
(159,105 |
) |
|
$ |
(57,384 |
) |
|
Preferred stock dividends, Series A and Series B |
|
|
|
|
|
|
|
|
|
|
(6,445 |
) |
|
|
|
|
|
|
|
|
|
|
(6,445 |
) |
|
Stock-based compensation expense |
|
|
|
|
|
|
|
|
|
|
2,074 |
|
|
|
|
|
|
|
|
|
|
|
2,074 |
|
|
Exercise of stock options and issuance of other stock awards |
|
|
596,279 |
|
|
|
— |
|
|
|
109 |
|
|
|
|
|
|
|
|
|
|
|
109 |
|
|
Treasury stock acquired |
|
|
(39,956 |
) |
|
|
— |
|
|
|
|
|
|
|
(35 |
) |
|
|
|
|
|
|
(35 |
) |
|
Net loss |
|
|
|
|
|
|
|
|
|
|
|
|
|
|
|
|
|
|
(15,544 |
) |
|
|
(15,544 |
) |
|
BALANCES — December 31, 2017 |
|
|
23,080,978 |
|
|
$ |
23 |
|
|
$ |
97,723 |
|
|
$ |
(322 |
) |
|
$ |
(174,649 |
) |
|
$ |
(77,225 |
) |
The accompanying notes to the consolidated financial statements are an integral part of the statements.
F-5
CONNECTURE, INC. AND SUBSIDIARIES
CONSOLIDATED STATEMENTS OF CASH FLOWS FOR THE YEARS ENDED
DECEMBER 31, 2017, 2016 and 2015
(Dollars in thousands)
|
|
|
2017 |
|
|
2016 |
|
|
2015 |
|
|||
|
CASH FLOWS FROM OPERATING ACTIVITIES: |
|
|
|
|
|
|
|
|
|
|
|
|
|
Net loss |
|
$ |
(15,544 |
) |
|
$ |
(26,534 |
) |
|
$ |
(7,343 |
) |
|
Adjustments to reconcile net loss to net cash used in operating activities |
|
|
|
|
|
|
|
|
|
|
|
|
|
Depreciation and amortization |
|
|
4,403 |
|
|
|
4,601 |
|
|
|
5,043 |
|
|
Stock-based compensation expense |
|
|
2,227 |
|
|
|
2,662 |
|
|
|
4,712 |
|
|
Interest accretion on financing obligations |
|
|
102 |
|
|
|
489 |
|
|
|
921 |
|
|
Other financing fees and non-cash adjustments |
|
|
656 |
|
|
|
2,063 |
|
|
|
49 |
|
|
Loss on facility lease termination |
|
|
1,988 |
|
|
|
— |
|
|
|
— |
|
|
Impairment of goodwill |
|
|
200 |
|
|
|
— |
|
|
|
— |
|
|
Impairment of property, plant and equipment |
|
|
63 |
|
|
|
— |
|
|
|
— |
|
|
Change in operating assets and liabilities, net of acquisition: |
|
|
|
|
|
|
|
|
|
|
|
|
|
Accounts receivable |
|
|
(2,704 |
) |
|
|
2,831 |
|
|
|
1,291 |
|
|
Prepaid expenses and other assets |
|
|
14 |
|
|
|
(546 |
) |
|
|
757 |
|
|
Deferred implementation costs |
|
|
(1,007 |
) |
|
|
1,308 |
|
|
|
(13 |
) |
|
Accounts payable |
|
|
(1,797 |
) |
|
|
263 |
|
|
|
1,856 |
|
|
Accrued expenses and other liabilities |
|
|
25 |
|
|
|
623 |
|
|
|
(2,306 |
) |
|
Deferred revenue |
|
|
(3,246 |
) |
|
|
(12,229 |
) |
|
|
(21,159 |
) |
|
Net cash used in operating activities |
|
|
(14,620 |
) |
|
|
(24,469 |
) |
|
|
(16,192 |
) |
|
|
|
|
|
|
|
|
|
|
|
|
|
|
|
CASH FLOWS FROM INVESTING ACTIVITIES: |
|
|
|
|
|
|
|
|
|
|
|
|
|
Purchases of property and equipment |
|
|
(314 |
) |
|
|
(999 |
) |
|
|
(1,317 |
) |
|
Business acquisition, net of cash acquired |
|
|
82 |
|
|
|
(4,683 |
) |
|
|
— |
|
|
Net cash used in investing activities |
|
|
(232 |
) |
|
|
(5,682 |
) |
|
|
(1,317 |
) |
|
|
|
|
|
|
|
|
|
|
|
|
|
|
|
CASH FLOWS FROM FINANCING ACTIVITIES: |
|
|
|
|
|
|
|
|
|
|
|
|
|
Borrowings under revolving line of credit |
|
|
— |
|
|
|
3,550 |
|
|
|
— |
|
|
Repayments under revolving line of credit |
|
|
— |
|
|
|
(3,550 |
) |
|
|
(340 |
) |
|
Borrowings of term debt |
|
|
— |
|
|
|
16,156 |
|
|
|
— |
|
|
Repayments of term debt |
|
|
— |
|
|
|
(33,337 |
) |
|
|
(4,025 |
) |
|
Payment of financing fees |
|
|
(457 |
) |
|
|
(1,372 |
) |
|
|
(103 |
) |
|
Payment of capital lease obligations |
|
|
(31 |
) |
|
|
(74 |
) |
|
|
(418 |
) |
|
Proceeds from initial public offering, net of issuance costs |
|
|
— |
|
|
|
— |
|
|
|
(725 |
) |
|
Proceeds from preferred stock, net |
|
|
16,801 |
|
|
|
49,251 |
|
|
|
— |
|
|
Other |
|
|
74 |
|
|
|
311 |
|
|
|
292 |
|
|
Net cash provided by (used in) financing activities |
|
|
16,387 |
|
|
|
30,935 |
|
|
|
(5,319 |
) |
|
NET INCREASE (DECREASE) IN CASH AND CASH EQUIVALENTS |
|
|
1,535 |
|
|
|
784 |
|
|
|
(22,828 |
) |
|
CASH AND CASH EQUIVALENTS — Beginning of period |
|
|
6,208 |
|
|
|
5,424 |
|
|
|
28,252 |
|
|
CASH AND CASH EQUIVALENTS — End of period |
|
$ |
7,743 |
|
|
$ |
6,208 |
|
|
$ |
5,424 |
|
|
SUPPLEMENTAL CASH FLOW INFORMATION: |
|
|
|
|
|
|
|
|
|
|
|
|
|
Cash paid for interest |
|
$ |
3,171 |
|
|
$ |
3,363 |
|
|
$ |
5,721 |
|
|
Cash (received) paid for income taxes |
|
$ |
9 |
|
|
$ |
(15 |
) |
|
$ |
15 |
|
|
Non-cash investing and financing activities: |
|
|
|
|
|
|
|
|
|
|
|
|
|
Purchase of property and equipment in accounts payable |
|
$ |
3 |
|
|
$ |
4 |
|
|
$ |
- |
|
|
Accrued preferred stock dividends |
|
$ |
6,445 |
|
|
$ |
2,643 |
|
|
$ |
— |
|
The accompanying notes to the consolidated financial statements are an integral part of the statements.
F-6
CONNECTURE, INC. AND SUBSIDIARIES
NOTES TO CONSOLIDATED FINANCIAL STATEMENTS
AS OF AND FOR THE YEARS ENDED DECEMBER 31, 2017, 2016 and 2015
(Dollars in thousands, except share and per share information)
1. DESCRIPTION OF BUSINESS
Description of Business—Connecture, Inc. and its subsidiaries, including DestinationRx, Inc., or DRX, RxHealth Insurance Agency, Inc., ConnectedHealth, LLC, and Insurix, Inc. (collectively, the “Company”), is a Delaware corporation. The Company is a web-based consumer shopping, enrollment and retention platform for health insurance distribution in the United States. The Company’s solutions offer a personalized health insurance shopping experience that recommends the best fit insurance plan based on an individual’s preferences, health status, preferred providers, medications and expected out-of-pocket costs. The Company’s customers are payers, brokers, government agencies, and web-based insurance marketplace operators, who distribute health and ancillary insurance. The Company’s solutions automate key functions in the insurance distribution process, allowing customers to price and present plan options accurately to consumers and efficiently enroll, renew and manage plan members.
On June 7, 2016, the Company acquired ConnectedHealth, LLC, a benefits technology company with a software and services platform that makes it easier for consumers and employees to shop for personalized insurance benefits online.
On January 4, 2018, the Company entered into a Merger Agreement, which is expected to result in the Company becoming privately held in 2018 (See Note 17).
2. SUMMARY OF SIGNIFICANT ACCOUNTING POLICIES
Basis of Presentation—The consolidated financial statements include the accounts of Connecture, Inc. and its wholly owned subsidiaries. All inter-company transactions and balances have been eliminated.
Use of Estimates—The preparation of financial statements in conformity with generally accepted accounting principles requires management to make extensive estimates and assumptions that affect the amounts reported in the financial statements and the accompanying notes. We use estimates in accounting for revenue recognition, deferred implementation costs, goodwill impairment, share-based compensation, and acquisitions, among other items. Actual results could differ from those estimates.
Cash and Cash Equivalents—The Company considers all highly liquid investments with maturities of three months or less when purchased to be cash equivalents. Cash and cash equivalents are maintained at financial institutions and, at times, balances may exceed federally insured limits. The Company has never experienced any losses related to these balances. Amounts on deposit in excess of federally insured limits as of December 31, 2017 were $7,493.
Accounts Receivable and Allowance for Doubtful Accounts—The Company’s normal and customary terms for customer payment is 30 days. The outstanding accounts receivable can vary significantly based on timing of billing milestones, renewals and other factors. When necessary, the Company maintains an allowance for doubtful accounts for estimated losses resulting from the inability of its customers to make required payments. The estimates are based on the composition of the accounts receivable aging, historical bad debts, changes in payment patterns, customer creditworthiness, and current economic trends. The Company writes off uncollectible receivables after all reasonable efforts are made to collect payment.
Property and Equipment—Property and equipment are stated at historical cost and depreciated using the straight-line method over the estimated useful lives of the assets, generally three to five years. Repairs and maintenance are charged to expense as incurred and major leasehold improvements are capitalized and amortized over the remaining term of the lease or their estimated useful lives, whichever is shorter. The Company records a gain or loss on the disposal of property and equipment based on the difference between the proceeds received, if any, and the net book value of the assets disposed on the date of disposal.
Impairment of Long-Lived Assets—The Company evaluates its long-lived assets for potential impairment when impairment indicators exist. Potential impairment is assessed when there is evidence that events or changes in circumstances have occurred that indicate that the carrying amount of an asset may not be recovered. The Company had no material impairments during the years ended December 31, 2017, 2016 and 2015.
Intangible Assets—Intangible assets with definite lives are amortized using the straight-line method over their estimated useful lives, ranging from three to ten years. The carrying amount of intangible assets are reviewed whenever circumstances arise that indicate the carrying amount of an asset may not be recoverable. Recoverability of intangible assets is compared to the undiscounted future cash flows the assets are expected to generate. If the asset is considered to be impaired, the carrying value is compared to the fair value and
F-7
this difference is recognized as an impairment loss. The Company had no impairments of intangible assets during the years ended December 31, 2017, 2016 and 2015.
Goodwill—Goodwill represents the excess of purchase price over the fair value of identifiable net assets acquired and liabilities assumed in a business combination. Goodwill is tested annually, as of October 31, for impairment at a reporting unit level.
The Company evaluates goodwill for impairment on an annual basis, or more frequently if an event or circumstance changes that would indicate that goodwill might be impaired. These events or circumstances would include a significant change in the business climate, legal factors, operating performance indicators, competition, sale or disposition of a significant portion of the business, or other factors.
Financial Instruments and Concentration of Credit Risk—The estimated fair values of the Company’s financial instruments, which include cash equivalents, accounts receivable and accounts payable, approximate their carrying values due to the short-term nature of these instruments.
Financial instruments that potentially subject the Company to concentrations of credit risk are principally cash and cash equivalents and accounts receivable. The Company’s credit risk is managed by investing its cash and cash equivalents in high quality money market instruments with established financial institutions. Concentrations of credit risk related to accounts receivable are limited to several customers to whom the Company makes substantial sales.
The Company has not experienced any material losses related to receivables from individual customers, geographic regions or groups of customers. As of and for the year ended December 31, 2017, the Company had the following customers that accounted for 10% or more of total revenue and/or total accounts receivable:
|
|
|
2017 |
||
|
Customers |
|
Revenue |
|
Accounts Receivable |
|
A |
|
17.8% |
|
27.6% |
Advertising Costs—Advertising costs are expensed as incurred. Advertising costs for the years ended December 31, 2017, 2016 and 2015, were $313, $486 and $502, respectively.
Fair Value Measurements—Financial Accounting Standards Board (FASB) Accounting Standards Codification (ASC) 820, “Fair Value Measurements”, establishes a hierarchy for inputs used in measuring fair value that maximizes the use of observable inputs and minimizes the use of unobservable inputs by requiring that inputs that are most observable be used when available. Observable inputs are inputs that market participants operating within the same marketplace as the Company would use in pricing the Company’s asset or liability based on independently derived and objectively determinable market data. Unobservable inputs are inputs that cannot be sourced from a broad active market in which assets or liabilities identical or similar to those of the Company are traded. The input hierarchy is broken down into three levels based on the degree to which the exit price is independently observable or determinable as follows:
Level 1—Valuation based on quoted market prices in active markets for identical assets or liabilities. Since valuations are based on quoted prices that are readily and regularly available in an active market, they do not entail a significant degree of judgment. The Company has no Level 1 financial instrument assets or liabilities.
Level 2—Valuation based on quoted market prices of investments that are not actively traded or for which certain significant inputs are not observable, either directly or indirectly, such as municipal bonds. The Company has no Level 2 financial instrument assets or liabilities.
Level 3—Valuation based on inputs that are unobservable and reflect management’s best estimate of what market participants would use as fair value.
Revenue Recognition—The Company’s revenue is derived from four sources: (a) the sales of implementation and ongoing support of the Company’s software automation solutions; (b) fees from brokers for the right to access our multi-payer quoting platform; (c) a government cost-plus-fixed-fee contract; and (d) commissions. In all contractual arrangements, the Company determines whether persuasive evidence of an arrangement exists, services have been rendered, the fee is fixed or determinable and collection is probable. If any of these criteria are not met, the Company does not recognize revenue until all of the criteria are met.
F-8
a) Software Automation Solutions Fees
Contractual terms for the delivery and ongoing support of the Company’s software automation solutions generally consist of multiple components including: (a) software license fees (non-hosted arrangements), (b) software usage fees, (c) software maintenance fees, (d) professional services fees, (e) hosting fees and (f) production support fees.
Software license fees represent amounts paid for the right to use the solution. Software usage fees represent amounts paid to cover only a specific period of time, after which usage and access rights expire. Software maintenance fees typically accompany software license fees and represent amounts paid for the right to receive commercially available updates and upgrades to the solution. Professional services fees represent amounts charged for services performed in connection with the configuration, integration and implementation of the solutions in accordance with customer specifications. Hosting fees represent fees related to post implementation hosting and monitoring of the solution. Production support fees are charged for the ongoing rate, benefits and related content management of the platform.
The Company’s contracts with its customers typically bundle multiple services and are generally priced on a fixed fee basis. The term over which the Company is committed to deliver these services can range from several months to several years.
Nearly all of the Company’s software automation solution services sold in the Enterprise/Commercial, Medicare, and Private Exchange segments are arrangements in which the Company hosts the web-based software automation solution and the customer pays a fee for access to and usage of the web-based software. The ownership of the technology and rights to the related code of such hosted web-based software remain with the Company and a customer has no contractual right to take possession of the software and run it on its own hardware platform. These arrangements are referred to as hosted arrangements and are accounted for as software-as-a-service under ASC 605, Revenue Recognition. A small percentage of the Company’s software automation solutions, previously sold in the Enterprise/State segment, were arrangements in which the software was not hosted on the Company’s infrastructure. These arrangements included the licensed use of the software and were subject to accounting under ASC 985, Software Revenue Recognition. The last remaining arrangement ended in 2017 when the customer elected not to renew their contract.
For all arrangements (whether hosted or non-hosted) that include multiple elements, the Company evaluates each element in an arrangement to determine whether it represents a separate unit of accounting. An element constitutes a separate unit of accounting when the delivered item has standalone value and delivery of the undelivered element is probable. Elements generally include implementation services, software licensing or usage fees and maintenance or other services.
Accounting guidance for multiple element arrangements containing hosted software provide a hierarchy to use when determining the relative selling price for each unit of accounting. Vendor-specific objective evidence (VSOE) of selling price, based on the price at which the item is regularly sold by the vendor on a standalone basis, should be used if it exists. If VSOE of selling price is not available, third-party evidence of selling price is used to establish the selling price if it exists. If VSOE and third-party evidence do not exist, the Company allocates the arrangement fee to the separate units of accounting based on its best estimate of selling price.
For hosted arrangements with multiple elements that are separate units of accounting, VSOE and third- party evidence do not currently exist and accordingly, the Company allocates the arrangement fee to the separate units of accounting based on management’s best estimate of selling price. The Company determines its best estimate of selling price for services based on its overall pricing objectives, taking into consideration market conditions and customer-specific factors and by reviewing historical data related to sales of the Company’s services.
Hosted arrangement revenue is recognized as follows by revenue element:
|
|
• |
Software usage fees and hosting fees—Recognized ratably over the longer of the customer contract or estimated period of customer benefit based on facts and circumstances of each relationship. |
|
|
• |
Professional services for new customer software solution implementation—Initially deferred and recognized ratably from completion of implementation through the longer of the customer contract or estimated period of customer benefit based on facts and circumstances of each relationship. |
|
|
• |
Professional services to existing customers—Initially deferred and then recognized in the period services are completed. |
|
|
• |
Production support fees—Recognized as the work is performed consistent with the contractual terms of the production support. |
Multiple deliverable arrangements accounting guidance for non-hosted arrangements provide an allocation of revenue to the separate elements based upon VSOE. For the majority of the Company’s non-hosted arrangements, whereby the customers take possession of the software, have not sold the various deliverables separately and have therefore not established VSOE. As a result, the contractual consideration for a delivered element for the non-hosted arrangements generally does not qualify as a separate unit of accounting as VSOE does not currently exist for any element of the Company’s non-hosted arrangements.
F-9
Accordingly, the delivered elements are combined with the other consideration for the remaining undelivered elements as a single unit of accounting. Revenue for non-hosted arrangements is recognized once all elements are delivered over the longer of the customer contract or estimated period of customer benefit. As of December 31, 2017, all of the Company’s non-hosted Enterprise/State contracts have either expired or terminated and the Company is providing transition services to one remaining Enterprise/State customer.
b) Broker Multi-Payer Quoting Platform Fees
The Company provides an online quoting platform service to insurance brokers through its Private Exchange segment. The Company charges the brokers a monthly fee for access to the service. Revenue from the access fees is recognized in the period that the service is provided.
c) Government Cost-Plus-Fixed-Fee
The Company used a percentage-of-completion method of accounting for its federal government contract in its Medicare segment prior to the fourth quarter of 2015. Under percentage-of-completion, the costs incurred to date had been compared to total estimated project costs and revenue was recognized in proportion to costs incurred. In the fourth quarter of 2015, the contract was renewed as a fixed fee contract and is accounted for as a multiple element arrangement.
d) Commissions
Within the Private Exchange segment, the Company earns commissions on annual employee enrollments in which the Company’s health plan network and software solutions are used in connection with each enrollment. Commissions are recorded in the period the enrollment is completed.
Cost of Revenue—Cost of revenue primarily consists of employee compensation and benefits, professional services costs and depreciation and amortization of assets directly associated with generating revenue. In addition, the Company allocates a portion of overhead, such as rent, facility depreciation and utilities, to cost of revenue based on employee salary.
Deferred Implementation Costs—The Company’s accounting policy is to capitalize direct, incremental employee labor and fringe benefits along with third-party independent contractor costs related to implementing new customer software solutions, to the extent that they are deemed recoverable. Deferred implementation costs as of December 31, 2017, and 2016 are $24,264 and $23,257, respectively, with the increases for new customer implementations, offset by current period amortization on installed customer solutions. Deferred implementation costs are amortized over the respective term of the customer arrangement consistent with the recognition of deferred revenue.
Stock-Based Compensation—The Company applies a fair-value based measurement method in accounting for stock-based payment transactions. Compensation cost is determined based on the grant-date fair value for stock options and performance-based restricted stock units and the grant-date closing market value for time-vested restricted stock units. Compensation cost is amortized on a straight-line basis over the vesting period for time-based awards and over the derived service period for performance-based restricted stock units.
Preferred Stock Dividends—Given the Company’s accumulated deficit, the Company’s accounting policy is to record the mandatorily payable dividends as a reduction of additional paid-in capital (APIC) with the offset as an increase to redeemable preferred stock on the consolidated balance sheets.
Comprehensive Loss—The Company’s net loss equals comprehensive loss for the years ending December 31, 2017, 2016 and 2015.
Income Taxes—Deferred tax assets and liabilities are recognized for the future tax consequences attributable to differences between the financial statement carrying amounts of existing assets and liabilities and their respective tax bases. Deferred tax assets and liabilities are measured using enacted tax rates expected to apply to taxable income in the years in which those temporary differences are expected to be recovered or settled. The effect on deferred tax assets and liabilities of a change in tax rates is recognized in income in the period that the change becomes enacted. Valuation allowances are established when necessary to reduce deferred tax assets to the amounts expected to be realized. The Company’s policy for recording interest and penalties associated with uncertain tax positions is to record such items in income tax expense.
Basic and Diluted Net Loss Per Common Share— The Company uses the two-class method to compute net earnings per common share because the Company has issued securities, other than common stock, that contractually entitle the holders to participate in dividends and earnings of the Company. The two-class method requires earnings for the period to be allocated between common stock and participating securities based upon their respective rights to receive distributed and undistributed earnings. Holders of the
F-10
Company’s redeemable convertible preferred stock are entitled to participate in distributions, when and if declared by the Board of Directors that are made to common stockholders, and as a result are considered participating securities.
Under the two-class method, for periods with net income, basic net income per common share is computed by dividing the net income attributable to common stockholders by the weighted-average number of shares of common stock outstanding during the period. Net income attributable to common stockholders is computed by subtracting from net income the portion of current year earnings that the participating securities would have been entitled to receive pursuant to their dividend rights had all of the year’s earnings been distributed. No such adjustment to earnings is made during periods with a net loss, as the holders of the participating securities have no obligation to fund losses.
Due to net losses for the years ended December 31, 2017, 2016 and 2015, basic and diluted loss per share were the same, as the effect of potentially dilutive securities would have been anti-dilutive.
New Accounting Standards—In May 2014, the Financial Accounting Standards Board, or FASB, issued Accounting Standards Update, or ASU, No. 2014-09, Revenue from Contracts with Customers (Topic 606), that outlines a single comprehensive model for entities to use in accounting for revenue arising from contracts with customers and supersedes most current revenue recognition guidance, including industry-specific guidance. The ASU is based on the principle that an entity should recognize revenue to depict the transfer of goods or services to customers in an amount that reflects the consideration to which the entity expects to be entitled in exchange for those goods or services. The ASU also requires additional disclosure about the nature, amount, timing and uncertainty of revenue and cash flows arising from customer contracts, including significant judgments and changes in judgments and assets recognized from costs incurred to fulfill a contract. Entities have the option of using either a full retrospective or a modified retrospective approach for the adoption of the new standard. Assuming the Company remains an emerging growth company (EGC), the ASU becomes effective for the Company in the fiscal year ended December 31, 2019; early adoption is permitted. The Company has established a team that is currently analyzing customer contracts and assessing the accounting and disclosure impacts this standard will have on its consolidated financial statements.
In February 2016, the FASB issued ASU 2016-02, Leases, which amends the existing accounting standards for lease accounting, including requiring lessees to recognize most leases on their balance sheet. Assuming the Company remains an EGC through December 31, 2019, the provisions of this update are expected to be effective for the Company beginning in the first quarter of 2020. Early adoption of ASU 2016-02 is permitted. The new leases standard requires a modified retrospective transition approach for all leases existing at, or entered into after, the date of initial application, with an option to use certain transition relief. The Company is currently assessing the impact that this standard will have on its consolidated financial statements.
In March 2016, the FASB issued ASU No. 2016-09, Compensation – Stock Compensation, which simplifies several aspects of the accounting for stock compensation, including the accounting for income tax effects, forfeitures, statutory tax withholdings, and cash flow classifications. Assuming the Company remains an EGC through December 31, 2019, the provisions of this update are effective for the fiscal year ended December 31, 2018. Early adoption is permitted in any interim or annual period. The Company is currently assessing the impact that this standard will have on its consolidated financial statements.
In August 2016, the FASB issued ASU No. 2016-15, Statement of Cash Flows – Classification of Certain Cash Receipts and Cash Payments, which clarifies cash flow statement classifications to be used for debt prepayment and debt extinguishment costs, settlement of debt instruments with coupon interest rates that are insignificant in relation to the effective interest rate of the borrowing, contingent consideration payments made after a business acquisition, proceeds from the settlement of insurance claims, and other cash flow transactions. Assuming the Company remains an EGC through December 31, 2019, the provisions of this update are effective for the fiscal year ended December 31, 2019 and interim periods thereafter. Early adoption is permitted in any interim or annual period. The Company is currently assessing the impact that this standard will have on its consolidated financial statements.
In January 2017, the FASB issued ASU No. 2017-04, Simplifying the Test for Goodwill Impairment, which eliminates Step 2 of the goodwill impairment test requiring a hypothetical purchase price allocation. A goodwill impairment will now be the amount by which a reporting unit’s carrying value exceeds its fair value, not to exceed the carrying amount of goodwill. Additionally, the one-step impairment test will be applied to goodwill at all reporting units, even those with zero or negative carrying amounts. The provisions of this update are effective for annual and any interim impairment tests for periods beginning after December 15, 2019. Early adoption is permitted for any impairment tests performed after January 1, 2017. As the standard simplifies the goodwill impairment test, the Company adopted early for fiscal 2017 goodwill testing (See Note 7).
In July 2017, the FASB issued ASU No. 2017-11, Earnings per Share (Topic:260); Distinguishing Liabilities from Equity (Topic 480); Derivatives and Hedging (Topic 815). This standard addresses narrow issues identified as a result of the complexities associated with applying GAAP for certain financial instruments with characteristics of liabilities and equity. Part I addresses the complexity of accounting for certain financial instruments with “down round” features. Part II addresses the difficulty of navigating Topic 480, Distinguishing Liabilities from Equity, because of the existence of pending content in the Accounting Standards Codification (“ASC”) that results from the indefinite deferral of accounting requirements concerning mandatory redeemable financial instruments of certain non-public entities and certain mandatorily redeemable non-controlling interests. Assuming the Company remains an EGC through
F-11
December 31, 2019, the provisions of this update are effective for annual reporting periods beginning after December 15, 2019, with early adoption permitted. The Company is currently assessing the impact that this standard will have on its consolidated financial statements.
3. GOING CONCERN
The Company’s primary need for liquidity is to fund anticipated near-term operating losses and working capital requirements, capital expenditures and for general corporate purposes, including debt repayment. For the years ended December 31, 2017, 2016, and 2015, losses from operations were $11,729, $20,870, and $1,487, respectively, and cash used in operations was $14,620, $24,469, and $16,192, respectively. The Company has taken a number of actions from 2016 through the first quarter of 2018 to continue to support its operations.
As discussed in Note 10, in May 2016, the Company completed the issuance of a newly created Series A Convertible Preferred Stock (the “Series A Preferred Stock”) for an aggregate purchase price of $52,000. In addition, as discussed in Note 9, the Company completed a June 2016 amendment and extension of its existing senior credit facility resulting in the extension of the facility to June 8, 2021 and increased the term loan funding to $35,000 from approximately $20,000. The funds received from these actions were used to repay $30,000 of outstanding subordinated term loans, to fund working capital and for other general corporate purposes.
In the second half of 2016 and in 2017, the Company put a greater focus on overall profitability and aligning its cost structure with revenue and customer billings. The Company reduced its headcount to 320 at December 31, 2017, compared to 411 at December 31, 2015. The Company also consolidated the procurement of outside contract labor resources.
In addition, in March 2017, the Company completed the issuance of a newly created Series B Convertible Preferred Stock (the “Series B Preferred Stock”) for an aggregate purchase price of $17,500 less approximately $675 of transaction fees (see Note 10). The Company used $624 of the proceeds to repay the outstanding balance on the Company's senior revolving credit facility, with the remainder of the net proceeds available for general corporate purposes.
In March 2017 and again in January 2018, the Company amended its senior credit facility (“Senior Credit Facility”) to, among other things, (i) defer scheduled Senior Term Loan principal repayments until the later of June 4, 2018 and the approved outside date of an alternative acquisition as contemplated under the Merger Agreement (the “Outside Date”), (ii) revise the EBITDA and Minimum Liquidity covenants, and (iii) increase the available revolving credit facility from $500 to $6,000 through the later of June 4, 2018 or the Outside Date (See Note 9). The Outside Date will be deemed to have occurred prior to the date set forth above upon (i) an event of default under the Senior Credit Facility, (ii) termination of the Merger Agreement under certain circumstances and (iii) the consummation of the Merger or alternative acquisition as contemplated under the Merger Agreement.
Finally, on January 4, 2018, the Company entered into an Agreement and Plan of Merger (the “Merger Agreement”) with FP Healthcare Holdings, Inc. (“Parent”), and FP Healthcare Merger Sub Corporation, a wholly owned subsidiary of Parent (“Merger Subsidiary”), providing for the merger of Merger Subsidiary with and into the Company (the “Merger”), with the Company surviving the Merger as a wholly owned subsidiary of Parent. The Merger, if consummated by June 4, 2018, will result in the Company becoming a privately held company reducing the ongoing public company expense. Additionally, the Parent sponsors have agreed to invest up to $15,000 of new capital and the Parent has secured a New Senior Credit Facility (“New Credit Facility”) that upon consummation of the Merger would provide the Company up to a $42,000 term loan and $5,000 line of credit. Although the Company believes the Merger and related equity and debt financing will likely of close and should provide the Company sufficient financing to meet its needs, successful completion of the Merger and financing are dependent on factors outside the Company’s control. As such, the Company cannot assure that the Merger and related refinancing will be effectively implemented within one year after the date that the consolidated financial statements are issued.
The Company’s historical operating results indicate conditions exist that raise uncertainty related to the Company's ability to continue as a going concern. As discussed above, the Company has taken certain actions to mitigate the uncertainty raised by the Company’s historical operating results, however, the Senior Credit Facility contains a minimum adjusted EBITDA covenant for the twelve months ending March 31, 2018 of at least negative $3,000 and a minimum liquidity covenant of $1,500 at all times prior to the earlier of (a) the Merger date, (b) June 4, 2018, or (c) an acquisition termination event, and $15,000 at all times thereafter. Without considering the effects of Merger, the Company currently projects that it will not comply with certain covenants during the twelve-month period following issuance of these consolidated financial statements. If the Company is unable to meet or amend the Senior Credit Facility financial covenants, all of the Company’s scheduled senior indebtedness ($32,616 at December 31, 2017) could become immediately due and payable in the event of default. If the Company cannot generate sufficient additional liquidity through the proposed Merger described above or through additional support from the Company’s investor base, or some combination of other actions, the Company may not have sufficient funds to repay the debt. The conditions described above result in substantial doubt about the Company’s ability to continue as a going concern for the twelve-month period following the issuance of these consolidated financial statements.
F-12
Diluted loss per common share is the same as basic loss per common share for all periods presented because the effects of potentially dilutive items were anti-dilutive given the Company’s net loss. The following common share equivalent securities have been excluded from the calculation of weighted-average common shares outstanding because the effect is anti-dilutive for the periods presented:
|
|
|
Year Ended December 31 |
|
|||||||||
|
|
|
2017 |
|
|
2016 |
|
|
2015 |
|
|||
|
Anti-Dilutive Common Share Equivalents |
|
|
|
|
|
|
|
|
|
|
|
|
|
Redeemable convertible preferred stock |
|
|
22,042,755 |
|
|
|
7,888,440 |
|
|
|
— |
|
|
Restricted Stock Units |
|
|
— |
|
|
|
1,047 |
|
|
|
53,454 |
|
|
Stock options |
|
|
6,195 |
|
|
|
177,010 |
|
|
|
1,069,243 |
|
|
Total anti-dilutive common share equivalents |
|
|
22,048,950 |
|
|
|
8,066,497 |
|
|
|
1,122,697 |
|
The increase in redeemable convertible preferred stock is directly attributable to the additional Series B issuance in March 2017 and the modification to the share conversion for the Series A issuance as a result of the Series B issuance (see Note 10).
Basic and diluted net loss per common share is calculated as follows:
|
|
|
Year Ended December 31 |
|
|||||||||
|
|
|
2017 |
|
|
2016 |
|
|
2015 |
|
|||
|
Numerator: |
|
|
|
|
|
|
|
|
|
|
|
|
|
Net loss |
|
$ |
(15,544 |
) |
|
$ |
(26,534 |
) |
|
$ |
(7,343 |
) |
|
Less: Preferred stock dividends |
|
|
6,445 |
|
|
|
2,643 |
|
|
|
— |
|
|
Net loss attributable to common stock |
|
$ |
(21,989 |
) |
|
$ |
(29,177 |
) |
|
$ |
(7,343 |
) |
|
Denominator: |
|
|
|
|
|
|
|
|
|
|
|
|
|
Weighted-average common shares outstanding, basic and diluted |
|
|
22,791,178 |
|
|
|
22,275,256 |
|
|
|
21,813,407 |
|
|
Net loss per common share, basic and diluted |
|
$ |
(0.96 |
) |
|
$ |
(1.31 |
) |
|
$ |
(0.34 |
) |
5. CONNECTEDHEALTH ACQUISITION
On June 7, 2016, the Company completed the acquisition of all equity units of ConnectedHealth, LLC (“ConnectedHealth”) for a cash purchase price of $4,601, net of cash acquired and a working capital adjustment, using available excess cash. ConnectedHealth is a benefits technology company with a software and services platform that makes it easier for consumers and employees to shop for personalized insurance benefits online. The Company completed the acquisition to acquire ConnectedHealth’s software technology.
The acquisition of ConnectedHealth was accounted for as a business combination in accordance with FASB ASC Topic 805, Business Combinations. Assets acquired and liabilities assumed were recorded at their fair value as of the acquisition date based on valuations using the income approach. The excess of purchase price over the estimated fair values of tangible assets, intangible assets and assumed liabilities was recorded as goodwill.
The allocation of the purchase price for ConnectedHealth as of December 31, 2016, is as follows:
|
Cash and cash equivalents |
|
$ |
25 |
|
|
Trade accounts receivable |
|
|
428 |
|
|
Prepaid expenses and other current assets |
|
|
31 |
|
|
Intangible assets |
|
|
1,200 |
|
|
Goodwill |
|
|
4,293 |
|
|
Other long-term assets |
|
|
54 |
|
|
Accounts payable and other current liabilities |
|
|
(1,225 |
) |
|
Other long-term liabilities |
|
|
(180 |
) |
|
Total purchase price |
|
$ |
4,626 |
|
The goodwill is primarily attributable to synergies with the software and services that ConnectedHealth provides and the anticipated value of selling the Company’s software and services to ConnectedHealth’s existing client base. The goodwill and intangible assets have been assigned to the Private Exchange segment. The goodwill and intangible assets are deductible for income tax purposes.
F-13
Revenue attributable to the acquired ConnectedHealth software solutions and technology was approximately $1,800 for the year ended December 31, 2017, and approximately $832 from the acquisition date through December 31, 2016.
The following unaudited supplemental pro forma information presents the Company’s results of operations as though the acquisition of ConnectedHealth had occurred on January 1, 2015. The information is not indicative of the Company’s operating results which would have occurred had the acquisition been consummated as of that date. The pro forma information below does not include anticipated synergies, the impact of purchase accounting adjustments, or certain other expected benefits of the acquisition and should not be used as a predictive measure of the Company’s future results of operations.
|
|
|
Year Ended December 31, |
|
|||||
|
|
|
2016 |
|
|
2015 |
|
||
|
Total revenue |
|
$ |
82,864 |
|
|
$ |
98,448 |
|
|
Net (loss) |
|
|
(27,157 |
) |
|
|
(13,879 |
) |
|
Weighted average common shares outstanding - basic and diluted |
|
|
22,275,256 |
|
|
|
21,813,407 |
|
|
Net (loss) per share - basic and diluted |
|
$ |
(1.34 |
) |
|
$ |
(0.64 |
) |
The pro forma financial information has been adjusted, where applicable, for: (i) amortization of acquired intangible assets, (ii) additional interest expense on presumed acquisition financing, (iii) the income tax effect of the pro forma adjustments, and (iv) to exclude acquisition related expenses.
The acquisition related expenses were approximately $200 and are recorded in General and Administrative expenses in the Consolidated Statements of Operations and Comprehensive Loss for the year ended December 31, 2016.
6. PROPERTY AND EQUIPMENT
Property and equipment consisted of the following as of December 31:
|
|
|
2017 |
|
|
2016 |
|
||
|
Furniture and fixtures |
|
$ |
344 |
|
|
$ |
818 |
|
|
Computer equipment |
|
|
4,994 |
|
|
|
5,136 |
|
|
Leasehold improvements |
|
|
717 |
|
|
|
628 |
|
|
Property and equipment—gross |
|
|
6,055 |
|
|
|
6,582 |
|
|
Accumulated depreciation |
|
|
(4,976 |
) |
|
|
(4,625 |
) |
|
Property and equipment—net |
|
$ |
1,079 |
|
|
$ |
1,957 |
|
Depreciation expense for the years ended December 31, 2017, 2016 and 2015 was $1,043, $1,191 and $1,020, respectively.
7. GOODWILL AND OTHER INTANGIBLE ASSETS
Goodwill—The following is a summary of the carrying amount of goodwill by goodwill reporting unit as of December 31:
|
2017 |
|
Enterprise/ Commercial |
|
|
Enterprise/ State |
|
|
Medicare |
|
|
Private Exchange |
|
|
Total |
|
|||||
|
Carrying Amount |
|
$ |
7,732 |
|
|
$ |
— |
|
|
$ |
14,711 |
|
|
$ |
8,629 |
|
|
$ |
31,072 |
|
|
Accumulated Impairment |
|
|
(200 |
) |
|
|
— |
|
|
|
— |
|
|
|
— |
|
|
|
(200 |
) |
|
Net |
|
|
7,532 |
|
|
|
— |
|
|
|
14,711 |
|
|
|
8,629 |
|
|
|
30,872 |
|
|
|
|
|
|
|
|
|
|
|
|
|
|
|
|
|
|
|
|
|
|
|
|
2016 |
|
|
|
|
|
|
|
|
|
|
|
|
|
|
|
|
|
|
|
|
|
Carrying Amount |
|
$ |
7,732 |
|
|
$ |
— |
|
|
$ |
14,711 |
|
|
$ |
8,629 |
|
|
$ |
31,072 |
|
|
Accumulated Impairment |
|
|
— |
|
|
|
— |
|
|
|
— |
|
|
|
— |
|
|
|
— |
|
|
Net |
|
|
7,732 |
|
|
|
— |
|
|
|
14,711 |
|
|
|
8,629 |
|
|
|
31,072 |
|
The Company recorded a $200 pre-tax non-cash impairment charge to reduce the carrying value of Enterprise/Commercial’s goodwill in the fourth quarter of 2017. The charge has been recorded in general and administrative expenses in the consolidated statement of operations and comprehensive loss.
F-14
Although Enterprise/Commercial’s performance for fiscal 2017 was near plan, projected future cash flows have fallen below the levels we previously anticipated due to 2017 booking shortfalls and customer non-renewals, attributable to the unexpected decline of customers and prospective customers participating in the Individual and Family Plan (IFP) marketplace.
The fair value of Enterprise/Commercial was calculated using an equal weighting of the fair value implied by a discounted cash flow analysis and a market approach utilizing market values of similar publicly traded companies, which are classified as Level 3 inputs (defined in Note 2). We believe the blended use of both models compensates for the inherent risk associated with either model if used on a stand-alone basis, and this combination is indicative of the factors a market participant would consider when performing a similar valuation.
Other Intangible Assets—Other intangible assets consist of the following as of December 31, 2017:
|
|
|
Useful Lives - In Years |
|
Gross Carrying Value |
|
|
Accumulated Amortization |
|
|
Net Carrying Value |
|
|||
|
Customer Relationship |
|
3-10 |
|
$ |
7,398 |
|
|
$ |
(3,817 |
) |
|
$ |
3,581 |
|
|
Acquired Technology |
|
3-5 |
|
|
12,892 |
|
|
|
(12,050 |
) |
|
|
842 |
|
|
Trademarks |
|
10 |
|
|
2,800 |
|
|
|
(1,388 |
) |
|
|
1,412 |
|
|
Software |
|
3 |
|
|
1,852 |
|
|
|
(1,777 |
) |
|
|
75 |
|
|
|
|
|
|
$ |
24,942 |
|
|
$ |
(19,032 |
) |
|
$ |
5,910 |
|
Other intangible assets consisted of the following as of December 31, 2016:
|
|
|
Useful Lives - In Years |
|
Gross Carrying Value |
|
|
Accumulated Amortization |
|
|
Net Carrying Value |
|
|||
|
Customer Relationship |
|
3-10 |
|
$ |
7,398 |
|
|
$ |
(3,077 |
) |
|
$ |
4,321 |
|
|
Acquired Technology |
|
3-5 |
|
|
12,892 |
|
|
|
(9,770 |
) |
|
|
3,122 |
|
|
Trademarks |
|
10 |
|
|
2,800 |
|
|
|
(1,108 |
) |
|
|
1,692 |
|
|
Software |
|
3 |
|
|
1,770 |
|
|
|
(1,717 |
) |
|
|
53 |
|
|
|
|
|
|
$ |
24,860 |
|
|
$ |
(15,672 |
) |
|
$ |
9,188 |
|
Amortization expense for the years ended December 31, 2017, 2016 and 2015, was $3,360, $3,410 and $4,023, respectively, and has been recorded in cost of revenue and general and administrative expenses.
Estimated future amortization expense for the Company’s intangible assets is as follows:
|
Year Ending December 31 |
|
Amount |
|
|
|
2018 |
|
$ |
1,364 |
|
|
2019 |
|
|
1,269 |
|
|
2020 |
|
|
1,247 |
|
|
2021 |
|
|
1,050 |
|
|
2022 |
|
|
940 |
|
|
Thereafter |
|
|
40 |
|
|
Total future amortization expense |
|
$ |
5,910 |
|
8. COMMITMENTS AND CONTINGENCIES
Operating Leases—The Company leases office space under operating leases that expire at various dates through 2025. Rent expense for the years ended December 31, 2017, 2016 and 2015, was approximately $1,945, $1,775 and $1,746, respectively.
F-15
Future minimum lease payments under non-cancelable operating leases with initial or remaining terms equal to or exceeding one year are as follows:
|
Years Ended December 31 |
|
Amount |
|
|
|
2018 |
|
$ |
1,414 |
|
|
2019 |
|
|
1,392 |
|
|
2020 |
|
|
911 |
|
|
2021 |
|
|
906 |
|
|
2022 |
|
|
1,077 |
|
|
Thereafter |
|
|
1,420 |
|
|
Total minimum lease payments |
|
$ |
7,120 |
|
The leases provide for escalating rent over the term of the leases. The rent costs associated with such leases are aggregated and recognized on a straight-line basis over the lease term. The difference between the monthly rent payment and the straight-line rent requires an accrual of rent to be recognized and then amortized over the term of the lease. Net accrued straight-line rent as of December 31, 2017 and 2016 amounted to approximately $343 and $199, respectively, and is included in other assets, other liabilities and other long-term liabilities in the accompanying consolidated balance sheets.
Restructuring Charges—As of December 31, 2017, the Company concluded its strategic assessment of the Company’s long-term facility needs, resulting in the recording of a lease termination charge of $1,988, net of estimated sub-lease income of approximately $3,300, for the remaining approximately seven-year operating lease obligation for an office facility the Company vacated and will cease to benefit from. Additionally, a charge of $63 related to the write-down of leasehold improvements at this office facility was record with the lease termination charge and both charges are included in general and administration expenses in the consolidated statement of operations and comprehensive loss. The facility has been primarily used by the Enterprise Commercial segment.
Letter of Credit—As security for certain leased property, the Company was required to provide a lessor an unconditional and irrevocable letter of credit in the amount $200 as of December 31, 2016. The letter of credit was extinguished when the related property lease expired and the Company exited the leased facility in fourth quarter of 2017.
Deposits—From time to time the Company has been required to remit security deposits as a condition of certain of its office leases. Deposits of $856 at December 31, 2017 and 2016, are included in other assets on the consolidated balance sheet.
Retention Compensation Plan – In July 2017, the Company’s Board of Directors approved the 2017 Executive Retention Plan (the “Retention Compensation Plan”), which provides for, among other things, up to a $1,875 fixed retention bonus that will be payable in cash upon a qualifying change in control of the Company or if a change in control has not occurred within five years of the date of the Retention Compensation Plan, in shares of the Company’s common stock. The fixed retention bonus is therefore accounted for as a share-based liability award (see Note 11).
In addition, an up to $625 contingent bonus will be payable in cash upon a qualifying change in control that occurs within five years of the date of the Retention Compensation Plan and in which the consideration payable for a share of the Company’s common stock equals or exceeds a threshold established by the Board. The proposed Merger (see Note 17) is not a qualifying change in control and it is anticipated that no payments will be made under the Retention Compensation Plan as a result of the Merger.
Indemnifications—The Company provides certain indemnifications from time to time in the normal course of business to its customers in its professional services and software license agreements and to strategic partners through certain insurance industry association marketing agreements that contain certain indemnifications for claims that may arise from acts or omissions, patent or trademark infringement, breach of contractual representations and warranties or intentional or grossly negligent acts. These indemnifications may require the Company to reimburse the indemnified party for losses suffered or incurred by the indemnified party. The Company has not had an indemnification claim, and does not expect to have a material claim in the future. As such, the Company has not recorded any liability for these indemnifications in the consolidated financial statements.
Litigation—In the normal course of business, the Company and its subsidiaries are named as defendants in lawsuits and are party to contract terminations and settlements in which claims are or may be asserted against the Company. In the opinion of management, the liabilities, if any, which may ultimately result from such lawsuits and contract terminations are not expected to have a material effect on the Company’s consolidated financial statements.
F-16
Debt consisted of the following as of December 31:
|
|
|
2017 |
|
|
2016 |
|
||
|
Senior term loans |
|
$ |
32,616 |
|
|
$ |
31,944 |
|
|
Senior revolving credit facility |
|
|
— |
|
|
|
578 |
|
|
|
|
|
32,616 |
|
|
|
32,522 |
|
|
Less: original issue discounts and deferred financing costs |
|
|
— |
|
|
|
— |
|
|
Less: current maturities of debt |
|
|
(32,616 |
) |
|
|
(578 |
) |
|
Long-term debt |
|
$ |
— |
|
|
$ |
31,944 |
|
Senior Debt— The Company has a bank senior credit facility, as amended and restated from time to time that provides for short-term working capital and long-term investment needs (the “Senior Credit Facility”). The Senior Credit Facility is collateralized by all of the Company’s assets.
On June 8, 2016, the Senior Credit Facility was amended and restated (the “June 2016 Amendment”), to among other things, (i) extend the maturity date to June 8, 2021 from January 18, 2018, (ii) continue to provide for up to $10,000 of revolving credit through the maturity date (the “Senior Revolving Credit Facility”), and (iii) increase the term loan funding to $35,000 from approximately $20,000 at June 8, 2016 (the “Senior Term Loan”).
The June 2016 Amendment was accounted for as an extinguishment of debt resulting in the immediate recognition of $381 of previously deferred financing costs, which was recorded in Other expense, net in the statements of operations for the year ended December 31, 2016.
On November 4, 2016, the Company amended the Senior Credit Facility (the “November 2016 Amendment”), to among other things, (i) remove the Net Leverage Covenant and replace it with a trailing twelve month EBITDA covenant, as defined in the November 2016 Amendment, to be measured quarterly effective as of September 30, 2016, (ii) increase the Minimum Liquidity covenant from $10,000 to $11,500, effective November 4, 2016, and $15,000 effective September 30, 2017, (iii) increase the annual principal repayments on the Senior Term Loan, and (iv) increase the interest rate on applicable borrowings effective November 4, 2016. In connection with this amendment, the Company repaid $2,000 of the outstanding Senior Term Loan and incurred bank fees of approximately $300, which were recorded in Other expense, net in the consolidated statements of operations for the year ended December 31, 2016.
On March 10, 2017, the Company amended the Senior Credit Facility (the “March 2017 Amendment”), to among other things, (i) defer scheduled Senior Term Loan principal repayments until March 31, 2018, at which time quarterly principal repayments of $1,313 will resume through March 31, 2021; (ii) replace the EBITDA and Minimum Liquidity covenants with (a) a trailing twelve month EBITDA covenant of negative $12,000 as of December 31, 2016, a quarterly building EBITDA covenant through December 31, 2017, and a trailing twelve month EBITDA from March 31, 2018 forward, as defined in the March 2017 Amendment, and (b) a minimum liquidity requirement of $1,500 at all times from March 1, 2017 through March 31, 2018, and $15,000 thereafter; and (iii) provide for an incremental 2.50% per annum paid-in-kind interest on all obligations from March 10, 2017 through the maturity date, which shall increase the outstanding principal balance of the Senior Term Loan. The quarterly building EBITDA, as defined in the March 2017 Amendment, requires the Company achieve at least negative $3,000 for twelve months ended December 31, 2017 and March 31, 2018, positive $8,000 for the twelve months ended June 30, 2018 and September 30, 2018, and positive $9,000 for the twelve months ended December 31, 2018 and March 31, 2019.
On January 4, 2018, the Company amended the Senior Credit Facility (the “January 2018 Amendment”), to among other things, (i) increase the available Senior Revolving Credit Facility by $5,500 to $6,000 through the later of June 4, 2018 and the approved outside date of an alternative acquisition as contemplated under the January 4, 2018 Merger Agreement (the “Outside Date”), (ii) defer scheduled March 31, 2018 Term Loan principal repayments until the Outside Date, at which time the deferred $1,313 is due and quarterly principal repayments of $1,313 will resume through March 31, 2021; (iii) replace the existing covenants with a minimum liquidity requirement of $1,500 at all times from March 1, 2017 through the Outside Date. The Outside Date will be deemed to have occurred prior to the date set forth above upon (i) an event of default under the Senior Credit Facility, (ii) termination of the Merger Agreement under certain circumstances and (iii) the consummation of the Merger or alternative acquisition as contemplated under the Merger Agreement.
The Senior Credit Facility contains covenants and customary representations and warranties of the Company, as well as various limitations on the activities of the Company as they relate to additional indebtedness, junior liens, investments, capital expenditures, paying dividends, and mergers and acquisitions. As of December 31, 2017, the Company was in compliance with the financial
F-17
covenants under the Senior Credit Facility, and on March 29, 2018 the Company obtained a waiver from the bank to permit delivery of audited financial statement for the year ended December 31, 2017 with a going concern explanatory paragraph (see Note 3 for discussion of going concern).
As of December 31, 2017, the interest rates on our outstanding Senior Term Loan and the Senior Revolving Credit Facility were 10.33% and 12.50%, respectively, including the incremental 2.50% per annum paid-in-kind interest.
THL Promissory Note—The Company had a Senior Subordinated Term Loan Agreement with THL Corporate Finance, Inc., (the “THL Note”) for total proceeds of $30,000 less $683 of original issue discount, or OID. On May 3, 2016, the Company repaid the $30,000 principal and accrued interest to settle the THL Note. The early extinguishment of the THL Note triggered a $560 breakage fee and the immediate recognition of the remaining $480 of OID and deferred financing costs, which were recorded in Other expense, net in the consolidated statement of operations and comprehensive loss for the year ended December 31, 2016.
Future principal payments on debt as of December 31, 2017, are as follows:
|
Years Ending December 31 |
|
|
|
|
|
2018 |
|
$ |
32,616 |
|
|
2019 |
|
|
— |
|
|
2020 |
|
|
— |
|
|
2021 and thereafter |
|
|
— |
|
|
|
|
|
32,616 |
|
|
Less original issue discount and deferred financing costs |
|
|
— |
|
|
Total |
|
$ |
32,616 |
|
While the Agreement provides for principal repayments of $1,313 per quarter resuming in 2018 through March 31, 2021, with remaining principal and deferred PIK due in June 2021, the March 29, 2018 covenant violation waiver and potential covenant violation should the Merger Agreement not close, along with the Company’s intention to refinance the Agreement upon consummation of the Merger Agreement have resulted in the current classification of the outstanding debt as of December 31, 2017.
Based on rates for instruments with comparable maturities and credit quality, which are classified as Level 2 inputs (defined in Note 2), the estimated fair value of the Company’s total debt approximated $34,500 as of December 31, 2017, and $29,000 as of December 31, 2016.
10. STOCKHOLDERS’ DEFICIT
Common Stock—As of December 31, 2017 and 2016, the Company has authorized the issuance of 75,000,000 shares of common stock, respectively, par value of $0.001 per share.
Preferred Stock— On May 2, 2016, the Company issued and sold newly created Series A Preferred Stock, par value $0.001, for an aggregate purchase price of $52,000. The shares of Series A Preferred Stock are convertible into shares of the Company’s common stock (the “Series A Conversion Shares”) at the option of the investors at any time and they are redeemable at the option of the investors after May 2, 2023, or if there is a Fundamental Change (as that term is defined in the Certificate of Designations, Preferences and Rights of Series A Convertible Preferred Stock). Beginning May 2, 2018, the Company may force conversion if the closing price of the common stock is at least 175% of the conversion price of the Series A Preferred Stock for 45 consecutive trading days, with a minimum average trading volume of at least 75,000 shares for 40 of such 45 trading days. Each share of Series A Preferred Stock is convertible into a number of Series A Conversion Shares equal to (i) the sum of (a) the stated value per share of Series A Preferred Stock, plus (b) all accrued and unpaid dividends thereon up to but not including the conversion date, divided by (ii) the conversion price of the Series A Preferred Stock at such time (which initially was $4.50 per share, subject to customary anti-dilution adjustments). On March 10, 2017, the conversion price of the Series A Preferred Stock was adjusted to $3.96 per share as a result of the issuance of Series B Preferred Stock.
The number of Conversion Shares underlying the Series A Preferred Stock will be increased annually by the accrual of 7.5% cumulative dividends payable in-kind (which will increase in certain circumstances, but in no event will be more than 16.5% annually). Following the second anniversary of the May 2, 2016 closing, the Company may elect to pay such cumulative dividends in cash. The conversion price for the Series A Preferred Stock is also subject to adjustment in the event of a stock split, reverse stock split, stock dividend, rights issuance, recapitalization, tender offer or similar transaction and to weighted-average price-based anti-dilution adjustments.
F-18
On March 10, 2017, the Company issued and sold newly created Series B Preferred Stock, par value $0.001, for an aggregate purchase price of $17,500. The shares of Series B Preferred Stock are convertible into shares of the Company’s common stock (the “Series B Conversion Shares”) at the option of the investors at any time and they are redeemable at the option of the investors after May 2, 2023, or if there is a Fundamental Change (as that term is defined in the Certificate of Designations, Preferences and Rights of Series B Convertible Preferred Stock). Beginning March 10, 2019, the Company may force conversion if the closing price of the common stock is at least 175% of the conversion price of the Series B Preferred Stock for 45 consecutive trading days, with a minimum average trading volume of at least 75,000 shares for 40 of such 45 trading days. Each share of Series B Preferred Stock is convertible into a number of Series B Conversion Shares equal to (i) the sum of (a) the stated value per share of Series B Preferred Stock, plus (b) all accrued and unpaid dividends thereon up to but not including the conversion date, divided by (ii) the conversion price of the common stock at such time (which initially is $1.91 per share, subject to customary anti-dilution adjustments).
The number of Conversion Shares underlying the Series B Preferred Stock will be increased annually by the accrual of 15.0% cumulative dividends payable in-kind (which will increase in certain circumstances, but in no event will be more than 20.0% annually). Following the second anniversary of the March 10, 2017 issuance, the Company may elect to pay such cumulative dividends in cash. The conversion price for the Series B Preferred is also subject to adjustment in the event of a stock split, reverse stock split, stock dividend, rights issuance, recapitalization, tender offer or similar transaction and to weighted-average price-based anti-dilution adjustments.
The Series A Preferred Stock and Series B Preferred Stock are entitled to vote with common stock on an as-converted basis.
Treasury Stock—The Company held 141,296 and 101,340 shares of common stock as of December 31, 2017 and 2016, respectively, which were acquired in the normal course of employees surrendering vested shares to settle withholding tax obligations triggered by stock-based compensation transactions.
Reserved Shares—As of December 31, 2017, the Company has 1,072,882 shares of common stock reserved for issuance in connection with the Company’s stock incentive plans.
11. STOCK-BASED COMPENSATION
The Company’s equity incentive plans provide for the awarding of various equity awards including stock options and restricted stock units.
The Company recognized stock-based compensation expense of $2,227, $2,662 and $4,712 for the years ended December 31, 2017, 2016 and 2015, respectively. Of the stock-based compensation expense recognized in the year ended December 31, 2017, $153 is related to a liability award for a fixed monetary amount that can be settled in a variable number of shares at the earliest of five years following the July 2017 grant date or upon certain events outside the Company’s control (the “Liability Award”).”
As of December 31, 2017, approximately $3,737 of total unrecognized compensation expense related to unvested stock option and restricted stock unit awards is expected to be recognized over the remaining vesting periods, approximately two years. Of that amount, $1,547 relates to the Liability Award. The maximum contractual term of equity awards is 10 years. As a result of proposed Merger substantially all unvested equity awards are expected to be cancelled for no consideration.
Equity Incentive Plans—In connection with the Company’s December 2014 initial public offering, the Board of Directors approved the 2014 Equity Incentive Plan (the 2014 “Plan”) as a replacement to the 2010 Plan. The Company will not grant any additional awards under the 2010 Plan; however, the 2010 Plan will continue to govern the terms and conditions of all outstanding equity awards previously granted under the 2010 Plan. The 2014 Plan provides for the awarding of stock options, stock appreciation rights, restricted stock, restricted stock units, performance shares and performance units, and other stock-based or cash settled equity awards as deemed appropriate by the compensation committee of the Company’s board of directors.
The 2014 Plan provides that on the first day of January each year through 2024, the available shares of common stock shall generally be increased by the smaller of (a) 2.00% of the number of issued and outstanding shares of common stock on the immediately preceding December 31, or (b) an amount determined by the Company’s Board.
On August 3, 2016, the Company’s Board of Directors approved an amendment to the 2014 Plan to increase the number of shares available for issuance under the 2014 Plan by 1,500,000 shares, subject to stockholder approval at a special meeting of stockholders. On September 26, 2016, a special meeting of stockholders was held and the amendment to the 2014 Plan to increase the shares reserved for issuance by 1,500,000 was approved and made effective as of such date.
F-19
Stock Options—A summary of stock option activity for the years ended December 31, 2017 and 2016 is presented below:
|
|
|
Number of Shares |
|
|
Average Exercise Price(a) |
|
|
Average Life (Years)(b) |
|
|
Aggregate Intrinsic Value |
|
||||
|
Outstanding — January 1, 2016 |
|
|
2,306,726 |
|
|
$ |
4.16 |
|
|
|
7.59 |
|
|
$ |
2,735 |
|
|
Granted |
|
|
572,200 |
|
|
$ |
2.53 |
|
|
|
|
|
|
|
|
|
|
Exercised |
|
|
(101,953 |
) |
|
$ |
1.85 |
|
|
|
|
|
|
$ |
100 |
|
|
Forfeited |
|
|
(486,274 |
) |
|
$ |
7.81 |
|
|
|
|
|
|
|
|
|
|
Expired |
|
|
(19,998 |
) |
|
$ |
11.37 |
|
|
|
|
|
|
|
|
|
|
Outstanding — December 31, 2016 |
|
|
2,270,701 |
|
|
$ |
3.01 |
|
|
|
5.04 |
|
|
$ |
- |
|
|
Granted |
|
|
160,000 |
|
|
$ |
1.73 |
|
|
|
|
|
|
|
|
|
|
Exercised |
|
|
(23,753 |
) |
|
$ |
1.75 |
|
|
|
|
|
|
$ |
14 |
|
|
Forfeited |
|
|
(1,219,343 |
) |
|
$ |
2.61 |
|
|
|
|
|
|
|
|
|
|
Outstanding — December 31, 2017 |
|
|
1,187,605 |
|
|
$ |
3.26 |
|
|
|
7.40 |
|
|
$ |
- |
|
|
Exercisable — December 31, 2017 |
|
|
710,420 |
|
|
$ |
3.60 |
|
|
|
6.59 |
|
|
$ |
- |
|
|
Vested and expected to vest — December 31, 2017 |
|
|
1,168,059 |
|
|
$ |
3.28 |
|
|
|
7.37 |
|
|
$ |
- |
|
|
(a) |
Weighted-average exercise price |
|
(b) |
Weighted-average contractual life remaining |
The weighted average fair value per option granted during the years ended December 31, 2017, 2016 and 2015 was $0.82, $1.00 and $4.30, respectively. The weighted average fair value of stock options is estimated at the date of grant using a Black-Scholes option-pricing model. The following are weighted average assumptions used for estimating the fair value of options granted for the years ended December 31:
|
|
|
2017 |
|
|
2016 |
|
|
2015 |
|
|||
|
Common stock share value |
|
$ |
1.73 |
|
|
$ |
2.53 |
|
|
$ |
10.31 |
|
|
Expected life (years) |
|
|
5.56 |
|
|
|
4.00 |
|
|
|
5.01 |
|
|
Volatility |
|
|
50.00 |
% |
|
|
50.00 |
% |
|
|
50.00 |
% |
|
Interest rate |
|
|
2.02 |
% |
|
|
1.01 |
% |
|
|
1.45 |
% |
|
Dividend yield |
|
|
0.00 |
% |
|
|
0.00 |
% |
|
|
0.00 |
% |
The Company currently estimates volatility by using the weighted average historical volatility of comparable public companies. The risk-free interest rate is the rate available as of the option date on zero-coupon U.S. government issues with a remaining term equal to the expected term of the option. The Company has not paid dividends in the past and does not plan to pay any dividends in the foreseeable future. The Company has estimated forfeitures in determining the weighted average fair value calculation. The forfeiture rate used for the years ended December 31, 2017, 2016 and 2015 was 0% for executive employees and 10% for all other employees. The Company’s estimate of forfeitures will be adjusted over the requisite service period based on the extent to which actual forfeitures differ, or are expected to differ, from the estimate.
The Company recognizes the grant date fair value of stock options that are expected to vest on a straight-line basis over the vesting period, which is generally three years from the date of grant.
F-20
Restricted Stock Units (RSUs)—A summary of RSU activity for the years ended December 31, 2017 and 2016 is presented below:
|
|
|
Shares |
|
|
Average Fair Value per Share(a) |
|
|
Aggregate Intrinsic Value |
|
|
|||
|
Outstanding — January 1, 2016 |
|
|
570,790 |
|
|
$ |
8.35 |
|
|
|
|
|
|
|
Granted |
|
|
503,440 |
|
|
$ |
2.45 |
|
|
|
|
|
|
|
Vested |
|
|
(260,523 |
) |
|
$ |
6.90 |
|
|
$ |
567 |
|
|
|
Forfeited |
|
|
(148,211 |
) |
|
$ |
9.31 |
|
|
|
|
|
|
|
Outstanding — December 31, 2016 |
|
|
665,496 |
|
|
$ |
4.24 |
|
|
|
|
|
|
|
Granted |
|
|
2,211,586 |
|
|
$ |
0.72 |
|
|
|
|
|
|
|
Vested |
|
|
(448,404 |
) |
|
$ |
2.63 |
|
|
$ |
353 |
|
|
|
Forfeited |
|
|
(84,958 |
) |
|
$ |
3.52 |
|
|
|
|
|
|
|
Outstanding — December 31, 2017 |
|
|
2,343,720 |
|
|
$ |
1.26 |
|
|
|
|
|
|
|
(a) |
Weighted-average grant date fair value |
The Company recognizes the grant date fair value of the RSUs that are expected to vest on a straight-line basis over the period of vesting. The Company recognizes the income tax benefits resulting from vesting of RSUs in the period they vest; to the extent the compensation expense has been recognized.
Employee Stock Purchase Plan—In November 2014, the Company’s Board of Directors approved the 2014 Employee Stock Purchase Plan (the “ESPP”), which is a broadly-based stock purchase plan in which any eligible employee may elect to participate by authorizing the Company to make payroll deductions in a specific amount or designated percentage to purchase shares of the Company’s common stock at 90% of the lower of the fair market value on the first day of trading of the offering period or on the purchase date. In no event will an employee be granted ability under the ESPP that would permit the purchase of common stock with a fair market value in excess of $25 in any calendar year. The ESPP is designed to comply with Section 423 of the Code, and thus is eligible for the favorable tax treatment afforded by Section 423.
At December 31, 2017, a total of 101,630 shares of common stock have been reserved for issuance under the ESPP. The ESPP provides that on the first day of January each year through 2024, the available shares of common stock shall generally be increased by (a) 100,000 shares or (b) 0.25% of issued and outstanding shares of common stock on the immediately preceding December 31.
During the years ended December 31, 2017, 2016, and 2015, shares purchased under the ESPP were 124,122, 150,013 and 29,927, respectively. Following the May 16, 2017 to November 15, 2017 offering period the Company’s Board of Directors indefinitely suspended the ESPP to new participants and the Company does not anticipate any future offerings under the ESPP.
12. INCOME TAXES
The (provision) benefit for income taxes for the years ended December 31 consists of:
|
|
|
2017 |
|
|
2016 |
|
|
2015 |
|
|||
|
Current tax expense: |
|
|
|
|
|
|
|
|
|
|
|
|
|
Federal |
|
$ |
— |
|
|
$ |
— |
|
|
$ |
— |
|
|
State |
|
|
(20 |
) |
|
|
60 |
|
|
|
(47 |
) |
|
Total current tax (provision) benefit |
|
|
(20 |
) |
|
|
60 |
|
|
|
(47 |
) |
|
Deferred tax expense: |
|
|
|
|
|
|
|
|
|
|
|
|
|
Federal |
|
|
— |
|
|
|
— |
|
|
|
(3 |
) |
|
State |
|
|
— |
|
|
|
— |
|
|
|
(1 |
) |
|
Total deferred tax (provision) benefit |
|
|
— |
|
|
|
— |
|
|
|
(4 |
) |
|
Total (provision) benefit for income taxes |
|
$ |
(20 |
) |
|
$ |
60 |
|
|
$ |
(51 |
) |
F-21
The (provision) benefit for income taxes for the years ended December 31, 2017, 2016 and 2015 differs from the amount of income tax determined by applying the applicable U.S. statutory federal income tax rate to the loss before (provision) benefit for income taxes as a result of the following:
|
|
|
2017 |
|
|
2016 |
|
|
2015 |
|
|||
|
Federal statutory rate |
|
|
34.0 |
% |
|
|
34.0 |
% |
|
|
34.0 |
% |
|
Effect of: |
|
|
|
|
|
|
|
|
|
|
|
|
|
State income taxes, net of federal benefit |
|
|
(0.1 |
)% |
|
|
0.1 |
% |
|
|
(0.5 |
)% |
|
Valuation allowance |
|
|
81.1 |
% |
|
|
(35.3 |
)% |
|
|
(32.9 |
)% |
|
Goodwill impairment |
|
|
(0.4 |
)% |
|
|
— |
|
|
|
— |
|
|
Change in federal tax law |
|
|
(112.5 |
)% |
|
|
— |
|
|
|
— |
|
|
Other, net |
|
|
(2.0 |
)% |
|
|
1.4 |
% |
|
|
(1.3 |
)% |
|
Overall income tax rate |
|
|
0.1 |
% |
|
|
0.2 |
% |
|
|
(0.7 |
)% |
In December 2017, the U.S. Congress passed, and the President signed, legislation commonly referred to as the Tax Cuts and Jobs Act (the “Tax Act”), which contains many significant changes to the U.S. tax code including reducing the corporate tax rate from 35% to 21%. We have completed our analysis of The Tax Act which included reducing the benefit of the Company’s recorded net deferred tax assets, and valuation allowance against such deferred tax assets. There was no impact to the total provision for income taxes for the year ended December 31, 2017.
The Other, net primarily includes the impact of stock-based compensation and changes in net operating loss carry forward deferred tax assets as a result of changes in state rates.
Deferred income taxes reflect the net effect of temporary differences between the carrying amounts of assets and liabilities for financial reporting purposes and the amounts used for income tax purposes. Significant components of the Company’s deferred tax assets are comprised of the following as of December 31:
|
|
|
2017 |
|
|
2016 |
|
||
|
Deferred tax assets: |
|
|
|
|
|
|
|
|
|
Net operating loss carryforward |
|
$ |
33,387 |
|
|
$ |
45,205 |
|
|
Deferred revenue |
|
|
6,736 |
|
|
|
12,199 |
|
|
Research and development credit |
|
|
45 |
|
|
|
45 |
|
|
Accrued payroll and related liabilities |
|
|
1,433 |
|
|
|
2,070 |
|
|
Other |
|
|
1,564 |
|
|
|
821 |
|
|
Valuation allowance |
|
|
(35,602 |
) |
|
|
(48,192 |
) |
|
Net deferred tax assets |
|
$ |
7,563 |
|
|
$ |
12,148 |
|
|
|
|
|
|
|
|
|
|
|
|
Deferred tax liabilities: |
|
|
|
|
|
|
|
|
|
Intangible assets |
|
$ |
(1,314 |
) |
|
$ |
(3,100 |
) |
|
Deferred implementation costs |
|
|
(6,272 |
) |
|
|
(9,070 |
) |
|
Total deferred tax liabilities |
|
|
(7,586 |
) |
|
|
(12,170 |
) |
|
Net deferred tax liability |
|
$ |
(23 |
) |
|
$ |
(22 |
) |
Based on the uncertainties associated with future realization of the deferred tax asset, the Company established a valuation allowance, which reduces the deferred tax assets to an amount whose realization is more likely than not. The net change in the valuation allowance for the deferred tax asset was $(12,590), $9,375 and $2,397 for the years ended December 31, 2017, 2016 and 2015, respectively. Differences between effective and statutory tax rates are caused substantially by the change in the valuation allowance.
As of December 31, 2017, and 2016, the Company has federal net operating loss carryforwards of approximately $133,000 and $121,000, respectively, available to offset future earnings and federal research and development credits of approximately $45, also available to offset future federal income tax. The net operating loss carryforwards and research and development tax credit carryforwards expire at various dates from 2020 through 2038. As of December 31, 2017, and 2016, state net operating loss carryforwards were approximately $92,000 and $77,800, respectively. As of December 31, 2017, and 2016, management has recorded a full valuation allowance against net operating losses because management believes it is more likely than not that some portion or all of these deferred tax assets will not be realized.
Under the provisions of the Internal Revenue Code (IRC), certain substantial changes in the Company’s ownership may result in a limitation of the amount of net operating loss and tax credit carryforwards which can be used in future years. Our last completed
F-22
Section 382 limitation study was through the tax year ended December 31, 2013. We anticipate completing an updated Section 382 limitation study following the consummation of the proposed Merger, which we believe will qualify as an ownership change and result in significant further limitations of the amount of net operating losses which may be available in future years.
The Company has recorded no liability for unrecognized tax benefits and related interest and penalties as of December 31, 2017 and 2016.
The Company files income tax returns in the US federal tax jurisdiction and various state jurisdictions. The federal tax years for 2014 through 2017 remain open for examination. State tax years open for examination are generally 2013 through 2017, depending on the state.
13. EMPLOYEE RETIREMENT PLAN
The Company sponsors a 401(k) profit sharing plan. All eligible employees of the Company who have reached the age of twenty-one may participate in the plan. Each plan year, the Company’s Board of Directors will determine the amount, if any, that the Company will contribute to the plan as a Company matching contribution for that year. The Company recognized expense of approximately $662, $729 and $679 for the years ended December 31, 2017, 2016 and 2015, respectively, to fund Company contributions to the plan.
14. SEGMENTS OF BUSINESS
Operating segments are defined as components of an enterprise for which discrete financial information is available that is evaluated regularly by the chief operating decision maker, or CODM, for purposes of allocating resources and evaluating financial performance. The Company’s CODM is the Chief Executive Officer and the CODM reviews financial information presented on a consolidated basis and for each operating segment, for purposes of allocating resources and evaluating financial performance.
The Company is organized into four reportable segments, which are based on software and service offerings. The Company’s reportable segments are consistent with its operating segments and are as follows:
Enterprise/Commercial —Offers the Company’s insurance distribution solutions to health plans.
Enterprise/State —Offers the Company’s sales automation solutions to state governments, which allows the Company’s state customers to offer customized individual and small group exchanges. The Enterprise/State segment had one remaining customer at December 31, 2017, 2016, and 2015, respectively.
Medicare—Offers web-based Medicare plan comparison, prescription drug comparison and enrollment tools for health plans, pharmacy benefit managers, pharmacies, field marketing organizations, and call centers.
Private Exchange—Offers defined-contribution benefit exchange solutions to benefit consultants, brokers, exchange operators and aggregators.
The accounting policies of the segments are the same as those described in the summary of significant accounting policies. The Company does not allocate cash, prepaid expenses, and property and equipment assets or capital expenditures to reportable segments.
The Company evaluates the performance of its segments based on gross margin, which is regularly reviewed by the CODM and provides insight into our individual segments and their ability to contribute to future debt service and working capital requirements of the Company.
F-23
Unallocated corporate expenses, and assets that are not considered when the Company’s CODM evaluates segment performance are grouped within Corporate in the following segment information:
|
|
|
Year Ended December 31 |
|
|||||||||
|
|
|
2017 |
|
|
2016 |
|
|
2015 |
|
|||
|
Revenue from external customers by segment: |
|
|
|
|
|
|
|
|
|
|
|
|
|
Enterprise/Commercial |
|
$ |
40,187 |
|
|
$ |
49,081 |
|
|
$ |
55,487 |
|
|
Enterprise/State |
|
|
2,144 |
|
|
|
3,453 |
|
|
|
13,372 |
|
|
Medicare |
|
|
22,101 |
|
|
|
18,565 |
|
|
|
17,973 |
|
|
Private Exchange |
|
|
12,314 |
|
|
|
10,795 |
|
|
|
9,015 |
|
|
Consolidated revenue |
|
$ |
76,746 |
|
|
$ |
81,894 |
|
|
$ |
95,847 |
|
|
|
|
|
|
|
|
|
|
|
|
|
|
|
|
Gross margin by segment: |
|
|
|
|
|
|
|
|
|
|
|
|
|
Enterprise/Commercial |
|
$ |
13,216 |
|
|
$ |
11,906 |
|
|
$ |
23,715 |
|
|
Enterprise/State |
|
|
1,469 |
|
|
|
1,325 |
|
|
|
6,300 |
|
|
Medicare |
|
|
14,872 |
|
|
|
11,460 |
|
|
|
10,651 |
|
|
Private Exchange |
|
|
127 |
|
|
|
308 |
|
|
|
4,511 |
|
|
Consolidated gross margin |
|
$ |
29,684 |
|
|
$ |
24,999 |
|
|
$ |
45,177 |
|
|
|
|
|
|
|
|
|
|
|
|
|
|
|
|
Consolidated operating expenses: |
|
|
|
|
|
|
|
|
|
|
|
|
|
Research and development |
|
$ |
16,679 |
|
|
$ |
22,297 |
|
|
$ |
22,718 |
|
|
Sales and marketing |
|
|
9,356 |
|
|
|
10,410 |
|
|
|
9,507 |
|
|
General and administrative |
|
|
15,378 |
|
|
|
13,162 |
|
|
|
14,439 |
|
|
Total consolidated operating expenses |
|
$ |
41,413 |
|
|
$ |
45,869 |
|
|
$ |
46,664 |
|
|
|
|
|
|
|
|
|
|
|
|
|
|
|
|
Consolidated loss from operations |
|
$ |
(11,729 |
) |
|
$ |
(20,870 |
) |
|
$ |
(1,487 |
) |
|
|
|
|
|
|
|
|
|
|
|
|
|
|
|
Depreciation and amortization by segment: |
|
|
|
|
|
|
|
|
|
|
|
|
|
Enterprise/Commercial |
|
$ |
555 |
|
|
$ |
642 |
|
|
$ |
543 |
|
|
Enterprise/State |
|
|
2 |
|
|
|
19 |
|
|
|
80 |
|
|
Medicare |
|
|
2,563 |
|
|
|
2,576 |
|
|
|
2,588 |
|
|
Private Exchange |
|
|
1,079 |
|
|
|
1,034 |
|
|
|
992 |
|
|
Corporate |
|
|
204 |
|
|
|
330 |
|
|
|
840 |
|
|
Consolidated depreciation and amortization |
|
$ |
4,403 |
|
|
$ |
4,601 |
|
|
$ |
5,043 |
|
|
|
|
As of December 31, |
|
|||||||||
|
|
|
2017 |
|
|
2016 |
|
|
2015 |
|
|||
|
Identifiable assets by segment: |
|
|
|
|
|
|
|
|
|
|
|
|
|
Enterprise/Commercial |
|
$ |
31,650 |
|
|
$ |
29,728 |
|
|
$ |
33,857 |
|
|
Enterprise/State |
|
|
85 |
|
|
|
627 |
|
|
|
1,975 |
|
|
Medicare |
|
|
21,662 |
|
|
|
23,248 |
|
|
|
26,198 |
|
|
Private Exchange |
|
|
18,666 |
|
|
|
18,247 |
|
|
|
11,255 |
|
|
Corporate |
|
|
11,015 |
|
|
|
10,638 |
|
|
|
9,404 |
|
|
Consolidated assets |
|
$ |
83,078 |
|
|
$ |
82,488 |
|
|
$ |
82,689 |
|
All Company assets were held and all revenue was generated in the United States during the years ended December 31, 2017, 2016 and 2015.
15. RELATED PARTIES
On May 2, 2016, Chrysalis Ventures II, L.P. (“Chrysalis”), a holder of more than 5% of the Company’s outstanding common stock as of March 31, 2016, purchased $2,000 of the Series A Preferred Stock offered in the transaction discussed in Note 10.
F-24
On March 10, 2017, Francisco Partners IV, L.P., Francisco Partners IV-A, L.P. (collectively, “Francisco Partners”) and Chrysalis, all holders of more than 5% of the Company’s outstanding common stock equivalents as of March 10, 2017, purchased $17,500 of the Series B Preferred Stock offered in the transaction discussed in Note 10. A member of the Company’s board of directors, is a Co-President of the managing companies of Francisco Partners and another member of the Company’s board of directors is a member of the general partner of Chrysalis.
On January 4, 2018, the Company entered into a Merger Agreement and Chrysalis and Francisco Partners are Rollover Investors as discussed in Note 17.
The Company paid approximately $650 of administrative fees to Humana, Inc. in connection with the administration of the Company’s employee health benefits plan for the years ended December 31, 2016 and 2015. The Company’s chairman of the board of directors is a member of the Humana, Inc. board of directors. The Company and Humana, Inc. did not renew the arrangement for 2017.
16. CONSOLIDATED SELECTED QUARTERLY FINANCIAL DATA (unaudited)
The following sets forth selected quarterly financial data for each of the eight quarters in the years ended December 31, 2017 and 2016.
|
|
|
Quarter Ended |
|
|||||||||||||||||||||||||||||
|
|
|
Dec 31, 2017(1) |
|
|
Sept 30, 2017 |
|
|
Jun 30, 2017 |
|
|
Mar 30, 2017 |
|
|
Dec 31, 2016 |
|
|
Sept 30, 2016(2) |
|
|
Jun 30, 2016 |
|
|
Mar 30, 2016 |
|
||||||||
|
|
|
(in thousands, except share amounts) |
|
|||||||||||||||||||||||||||||
|
Revenue |
|
$ |
19,639 |
|
|
$ |
20,533 |
|
|
$ |
18,302 |
|
|
$ |
18,272 |
|
|
$ |
20,879 |
|
|
$ |
24,729 |
|
|
$ |
18,729 |
|
|
$ |
17,557 |
|
|
Gross margin |
|
|
7,344 |
|
|
|
9,754 |
|
|
|
5,788 |
|
|
|
6,798 |
|
|
|
5,891 |
|
|
|
8,838 |
|
|
|
5,066 |
|
|
|
5,204 |
|
|
Total operating expenses |
|
|
13,137 |
|
|
|
9,029 |
|
|
|
9,771 |
|
|
|
9,476 |
|
|
|
11,189 |
|
|
|
11,349 |
|
|
|
12,225 |
|
|
|
11,106 |
|
|
Income (loss) from operations |
|
|
(5,793 |
) |
|
|
725 |
|
|
|
(3,983 |
) |
|
|
(2,678 |
) |
|
|
(5,298 |
) |
|
|
(2,511 |
) |
|
|
(7,159 |
) |
|
|
(5,902 |
) |
|
Net loss |
|
$ |
(6,662 |
) |
|
$ |
(171 |
) |
|
$ |
(5,011 |
) |
|
$ |
(3,700 |
) |
|
$ |
(6,232 |
) |
|
$ |
(3,066 |
) |
|
$ |
(9,900 |
) |
|
$ |
(7,336 |
) |
|
Net loss per common share: |
|
|
|
|
|
|
|
|
|
|
|
|
|
|
|
|
|
|
|
|
|
|
|
|
|
|
|
|
|
|
|
|
|
Basic |
|
|
(0.37 |
) |
|
|
(0.08 |
) |
|
|
(0.30 |
) |
|
|
(0.22 |
) |
|
|
(0.32 |
) |
|
|
(0.18 |
) |
|
|
(0.47 |
) |
|
|
(0.33 |
) |
|
Diluted |
|
|
(0.37 |
) |
|
|
(0.08 |
) |
|
|
(0.30 |
) |
|
|
(0.22 |
) |
|
|
(0.32 |
) |
|
|
(0.18 |
) |
|
|
(0.47 |
) |
|
|
(0.33 |
) |
|
Weighted-average common shares outstanding: |
|
|
|
|
|
|
|
|
|
|
|
|
|
|
|
|
|
|
|
|
|
|
|
|
|
|
|
|
|
|
|
|
|
Basic |
|
|
23,049,692 |
|
|
|
22,878,477 |
|
|
|
22,660,108 |
|
|
|
22,570,207 |
|
|
|
22,425,517 |
|
|
|
22,343,142 |
|
|
|
22,217,696 |
|
|
|
22,112,273 |
|
|
Diluted |
|
|
23,049,692 |
|
|
|
22,878,477 |
|
|
|
22,660,108 |
|
|
|
22,570,207 |
|
|
|
22,425,517 |
|
|
|
22,343,142 |
|
|
|
22,217,696 |
|
|
|
22,112,273 |
|
|
(1) |
During the three months ended December 31, 2017, the Company recognized $200 of goodwill impairment expense, $1,988 of lease termination expense and $959 of proposed merger related professional advisor expenses in operating expenses. |
|
(2) |
During the three months ended September 30, 2016, the Company recognized $4,600 of previously deferred revenue and approximately $2,000 of gross margin resulting from the satisfaction of a customer obligation |
The sum of the 2017 and 2016 quarterly net loss per common share does not equal the net loss per common share for the entire year due to the impact on weighted-average shares outstanding of the conversions of the Series A Preferred Stock outstanding during each respective period.
17. SUBSEQUENT EVENTS
Merger Agreement – On January 4, 2018, the Company entered into an Agreement and Plan of Merger, or Merger Agreement, with FP Healthcare Holdings, Inc. (“Parent”) and FP Healthcare Merger Sub Corporation, a wholly owned subsidiary of Parent (“Merger Subsidiary”), providing for the merger of Merger Subsidiary with and into the Company with the Company surviving the Merger as a wholly owned subsidiary of the Parent. The Parent and Merger Subsidiary are owned by affiliates of the private equity investment firm Francisco Partners.
At the Effective Time of the proposed Merger, each share of common stock, par value $0.001 per share, of the Company (the “Company Common Stock”) issued and outstanding as of immediately prior to the Effective Time (other than shares held by (a) Parent or Merger Subsidiary, (b) the Company in treasury or any wholly owned subsidiary of the Company, (c) holders of Common Stock who have properly demanded appraisal rights (and who have not failed to perfect or effectively withdraw such demand or otherwise waive or lose their rights to appraisal), and (d) Francisco Partners IV, L.P., Francisco Partners IV-A, L.P. and Chrysalis
F-25
Ventures II, L.P. and certain of their affiliates (collectively, the “Rollover Investors”)), will be canceled and cease to exist and automatically converted into the right to receive cash in an amount equal to $0.35, without interest (the “Per Share Price”). The Rollover Investors have entered into a Rollover Agreement pursuant to which the Rollover Investors have agreed to contribute shares of Company Common Stock, Series A Preferred Stock of the Company and Series B Preferred Stock of the Company to Parent.
Parent and Merger Subsidiary have secured committed financing, consisting of a combination of equity to be provided by investment funds affiliated with FP, and debt financing from PNC Bank, National Association, the aggregate proceeds of which will be sufficient for Parent and Merger Subsidiary to pay the aggregate merger consideration and all related fees and expenses. In addition, investment funds affiliated with FP have provided the Company with a guarantee in favor of the Company (the “Guarantee”). The Guarantee guarantees the payment of Merger Consideration owed by Parent to the holders of Company Common Stock pursuant to the Merger Agreement.
The Merger Agreement contains certain termination rights for the Company and Parent. Upon termination of the Merger Agreement under specified circumstances, such as the Company accepting a superior proposal, the Company would be required to pay Parent a termination fee of up to $2,000 for reasonable and documented out-of-pocket fees and expenses (including legal fees and expenses).
Other than the $959 of transaction expenses during the twelve months ended December 31, 2017, the terms of the Merger Agreement did not impact the Company’s consolidated financial statements.
Subject to certain conditions, including regulatory and shareholder approvals, and other customary covenants and closing conditions, the Company expects the transaction to close in the second quarter of 2018.
Credit Facility Amendment & Waiver - On January 4, 2018, the Company amended the Senior Credit Facility, to among other things, (i) increase the available Revolving Credit Facility by $5,500 through the later of June 4, 2018 and the approved outside date of an alternative acquisition as contemplated under the Merger Agreement (the “Outside Date”), (ii) defer scheduled March 31, 2018 Term Loan principal repayments until the Outside Date, at which time the deferred $1,313 is due and quarterly principal repayments of $1,313 will resume through March 31, 2021, (iii) replace the existing covenants with a minimum liquidity requirement of $1,500 at all times from March 1, 2017 through the Outside Date, and $15,000 thereafter. The Outside Date will be deemed to have occurred prior to the date set forth above upon (i) an event of default under the Senior Credit Facility, (ii) termination of the Merger Agreement under certain circumstances and (iii) the consummation of the proposed Merger or alternative acquisition as contemplated under the Merger Agreement.
On March 29, 2018, Wells Fargo provided the Company a waiver with regards to the Senior Credit Facility covenant concerning issuance of an audit opinion having an explanatory going concern paragraph for the year ended December 31, 2017.
* * * * * *
F-26
Schedule II—Valuation and Qualifying Accounts (in thousands)
|
|
|
Balance at Beginning of Period |
|
|
Additions (Reversals) Charged to Expense |
|
|
Additions (Reversals) Charged to Revenue |
|
|
Acquired |
|
|
Deductions |
|
|
Balance at End of Period |
|
||||||
|
Trade receivable allowances: |
|
|
|
|
|
|
|
|
|
|
|
|
|
|
|
|
|
|
|
|
|
|
|
|
|
Year ended December 31, 2017 |
|
$ |
— |
|
|
$ |
— |
|
|
$ |
— |
|
|
$ |
— |
|
|
$ |
— |
|
|
$ |
— |
|
|
Year ended December 31, 2016 |
|
|
— |
|
|
|
— |
|
|
|
— |
|
|
|
— |
|
|
|
— |
|
|
|
— |
|
|
Year ended December 31, 2015 |
|
|
246 |
|
|
|
45 |
|
|
|
(137 |
) |
|
|
— |
|
|
|
(154 |
) |
|
|
— |
|
|
Deferred tax asset valuation allowance: |
|
|
|
|
|
|
|
|
|
|
|
|
|
|
|
|
|
|
|
|
|
|
|
|
|
Year ended December 31, 2017 |
|
$ |
48,192 |
|
|
$ |
(12,590 |
) |
(i) |
N/A |
|
|
$ |
— |
|
|
$ |
— |
|
|
$ |
35,602 |
|
|
|
Year ended December 31, 2016 |
|
|
38,817 |
|
|
|
9,375 |
|
|
N/A |
|
|
|
— |
|
|
|
— |
|
|
|
48,192 |
|
|
|
Year ended December 31, 2015 |
|
|
36,420 |
|
|
|
2,397 |
|
|
N/A |
|
|
|
— |
|
|
|
— |
|
|
|
38,817 |
|
|
F-27