Attached files
| file | filename |
|---|---|
| EX-99.2 - EXHIBIT 99.2 - SCHULMAN A INC | shlm150316newsrelease.htm |
| 8-K - 8-K - SCHULMAN A INC | shlm150316pressrelease.htm |

0 38 84 229 162 38 0 119 193 157 194 75 117 167 192 83 94 125 192 77 55 127 127 127 89 89 89 Proposed Acquisition of Citadel Plastics Holdings, Inc. March 16, 2015

0 38 84 229 162 38 0 119 193 157 194 75 117 167 192 83 94 125 192 77 55 127 127 127 89 89 89 Cautionary Note on Forward-Looking Statements 2 A number of the matters discussed in this document that are not historical or current facts deal with potential future circumstances and developments and may constitute "forward- looking statements" within the meaning of the Private Securities Litigation Reform Act of 1995. Forward-looking statements can be identified by the fact that they do not relate strictly to historic or current facts and relate to future events and expectations. Forward-looking statements contain such words as "anticipate,” "estimate," "expect," "project," "intend," "plan," "believe," and other words and terms of similar meaning in connection with any discussion of future operating or financial performance. Forward-looking statements are based on management's current expectations and include known and unknown risks, uncertainties and other factors, many of which management is unable to predict or control, that may cause actual results, performance or achievements to differ materially from those expressed or implied in the forward-looking statements. Important factors that could cause actual results to differ materially from those suggested by these forward-looking statements, and that could adversely affect the Company's future financial performance, include, but are not limited to, the following: • worldwide and regional economic, business and political conditions, including continuing economic uncertainties in some or all of the Company's major product markets or countries where the Company has operations; • the effectiveness of the Company's efforts to improve operating margins through sales growth, price increases, productivity gains, and improved purchasing techniques; • competitive factors, including intense price competition; • fluctuations in the value of currencies in areas where the Company operates; • volatility of prices and availability of the supply of energy and raw materials that are critical to the manufacture of the Company's products, particularly plastic resins derived from oil and natural gas; • changes in customer demand and requirements; • effectiveness of the Company to achieve the level of cost savings, productivity improvements, growth and other benefits anticipated from acquisitions, joint ventures and restructuring initiatives; • escalation in the cost of providing employee health care; • uncertainties regarding the resolution of pending and future litigation and other claims; • the performance of the global automotive market as well as other markets served; • further adverse changes in economic or industry conditions, including global supply and demand conditions and prices for products; • operating problems with our information systems as a result of system security failures such as viruses, computer "hackers" or other causes; • our ability to consummate the acquisition of Citadel Plastics and the timing of the closing of such acquisition; • the failure to obtain the necessary debt financing arrangements set forth in the commitment letter received in connection with the acquisition of Citadel Plastics; • the impact of the indebtedness incurred to finance the transaction; • integration of the business of Citadel Plastics with our existing business, including the risk that the integration will be more costly or more time consuming and complex than anticipated; • our ability to achieve the anticipated synergies, cost savings and other benefits from the acquisition of Citadel Plastics; • transaction and acquisition-related costs incurred in connection with the acquisition of Citadel Plastics and related transactions; and • substantial time devoted by management to the integration of Citadel Plastics after the closing of such acquisition. The risks and uncertainties identified above are not the only risks the Company faces. Additional risk factors that could affect the Company's performance are set forth in the Company's Annual Report on Form 10-K for the fiscal year ended August 31, 2014. In addition, risks and uncertainties not presently known to the Company or that it believes to be immaterial also may adversely affect the Company. Should any known or unknown risks or uncertainties develop into actual events, or underlying assumptions prove inaccurate, these developments could have material adverse effects on the Company's business, financial condition and results of operations.

0 38 84 229 162 38 0 119 193 157 194 75 117 167 192 83 94 125 192 77 55 127 127 127 89 89 89 Use of Non-GAAP Measures 3 This presentation includes certain financial information determined by methods other than in accordance with accounting principles generally accepted in the United States ("GAAP"). The non-GAAP financial measure of adjusted EBITDA is considered relevant to aid analysis and understanding of the Company's results and business trends. However, non-GAAP measures are not in accordance with, nor are they a substitute for, GAAP measures. The most directly comparable GAAP financial measure for these purposes is net income attributable to A. Schulman, Inc. The Company's non-GAAP financial measure of adjusted EBITDA is not meant to be considered in isolation or as a substitute for comparable GAAP financial measures, and should be read only in conjunction with the Company's consolidated financial statements prepared in accordance with GAAP. While the Company believes that non-GAAP measures are useful supplemental information to investors, there are very significant limitations associated with its use. Non-GAAP financial measures are not prepared in accordance with GAAP, may not be reported by all of the Company's competitors and may not be directly comparable to similarly titled measures of the Company's competitors due to potential differences in the exact method of calculation. The Company compensates for these limitations by using these non-GAAP financial measures as supplements to GAAP financial measures and by reviewing the reconciliations of the non-GAAP financial measures to their most comparable GAAP financial measures. Citadel Plastics Holdings, Inc. (“Citadel”) historical and projected EBITDA in this presentation is not reflective of benefits from anticipated post acquisition synergies. Additionally, Citadel revenue includes its ownership interest in a joint venture in China as if the joint venture was consolidated at a 50% level.

0 38 84 229 162 38 0 119 193 157 194 75 117 167 192 83 94 125 192 77 55 127 127 127 89 89 89 Citadel Transaction Summary 4 • A. Schulman has signed a definitive agreement to acquire all of the issued and outstanding capital stock of privately held Citadel Plastics Holdings, Inc. for $800 million. • Citadel is a leading North American specialty engineered plastics company that produces thermoset composites and engineered plastic materials for specialty product applications spanning multiple industries including transportation, industrial & construction, consumer, electrical, energy and healthcare & safety. • Citadel has 1,200 employees and operates 21 manufacturing facilities around the world, including 10 engineered plastic facilities in the U.S. and Canada and 11 thermoset composite plants – seven in North America, one in Germany, one in Brazil, and a joint venture consisting of two plants in China. • We expect this transaction to close in A. Schulman’s third quarter of fiscal 2015 and will be accretive within 12 months of ownership. • The total transaction values Citadel at 10.6x FYE 2014 Adjusted EBITDA of approximately $75 million • Synergies of approximately $25 million drives multiple to 8x

0 38 84 229 162 38 0 119 193 157 194 75 117 167 192 83 94 125 192 77 55 127 127 127 89 89 89 A. Schulman & Citadel: An Excellent Strategic Fit 5 Citadel generates significant revenues in the U.S., enhancing A. Schulman’s regional scale and efficiencies, as well as balancing our current geographic footprint. Citadel also gives A. Schulman a second growth platform with its industry-leading, added-value specialty thermoset composites business. Citadel’s product offering not only enhances our existing portfolio, but presents attractive expansion opportunities in other fast-growing sectors such as aerospace, medical, LED lighting and oil & gas. Through this acquisition our portfolio becomes more highly specialized, which will enable us to better serve our customers. Like A. Schulman, Citadel enjoys long-time relationships with an impressive and diverse list of blue-chip OEMs Citadel Meets All Of A. Schulman’s Acquisition Criteria

0 38 84 229 162 38 0 119 193 157 194 75 117 167 192 83 94 125 192 77 55 127 127 127 89 89 89 Citadel’s Business Overview 6 Business Description Historical Pro Forma EBITDA Historical Pro Forma Revenue ■ Citadel is a leading plastics material science business, providing custom engineered solutions for specialized applications ■ Material agnostic solution provider, with an unmatched array of technical and formulation capabilities ■ Customized solutions are provided to a diverse base of multi- national OEMs for use across a variety of attractive applications ■ Company was built through a series of acquisitions and has a global footprint, including a leading N.A. market position ■ Has been a portfolio company of HGGC and Charlesbank since 2012 and is headquartered in West Chicago, IL 2014 Pro Forma Revenue Split Product End Market $406 $469 $484 $503 $527 15.6% 3.2% 3.8% 4.9% 2010 2011 2012 2013 2014 = Revenue ($mm) = % Growth = EBITDA ($mm) = % Margin Engineered Plastics 55% Thermoset Composites 45% Transportation 26% Industrial & Construction 20% Consumer 19% Electrical 18% Healthcare & Safety 2% Aerospace & Defense 1% Other 10% $49 $55 $67 $69 $75 12.1% 11.7% 13.9% 13.7% 14.3% 2010 2011 2012 2013 2014 Total Revenues = $527mm Total Revenues = $527mm Energy 4% Transportation 26% Industrial & Construction 20% Consumer 19% Electrical 18% 2014E sales = $527mm Other 16%

0 38 84 229 162 38 0 119 193 157 194 75 117 167 192 83 94 125 192 77 55 127 127 127 89 89 89 Citadel’s Business Segments 7 $288 / $32 $239 / $43 11% 18% ■ Polyolefins, engineered TP’s ■ Meltable, compression and injection-molded ■ Glass / mineral filled ■ Used in compression and injection molding ■ Highly filled compound, using short glass or carbon fibers ■ BMC, TMC, SMC ■ High performance composites ■ Flame retardance ■ Recyclable / remeltable ■ Color matching / custom color ■ High impact resistance ■ Heat / chemical / electrical resistance ■ Used in smaller, complex parts: easy to mold but with high resistance ■ Used in larger parts: high structural strength due to long fibers ■ Consumer ■ Electrical ■ Industrial & Construction ■ Healthcare & Safety ■ Transportation ■ Consumer ■ Electrical ■ Energy ■ Industrial & Construction ■ Transportation ■ Healthcare & safety Circuit Breakers Auto Front Lighting Aircraft Seating Food Service Blender Base Engine Components Lawn & Garden Hand Drills Recreational Equipment 2014E Proforma Revenue / EBITDA ($mm) EBITDA Margin (%) Material Capabilities End Markets Select Applications Engineered Plastics Thermoset Composites

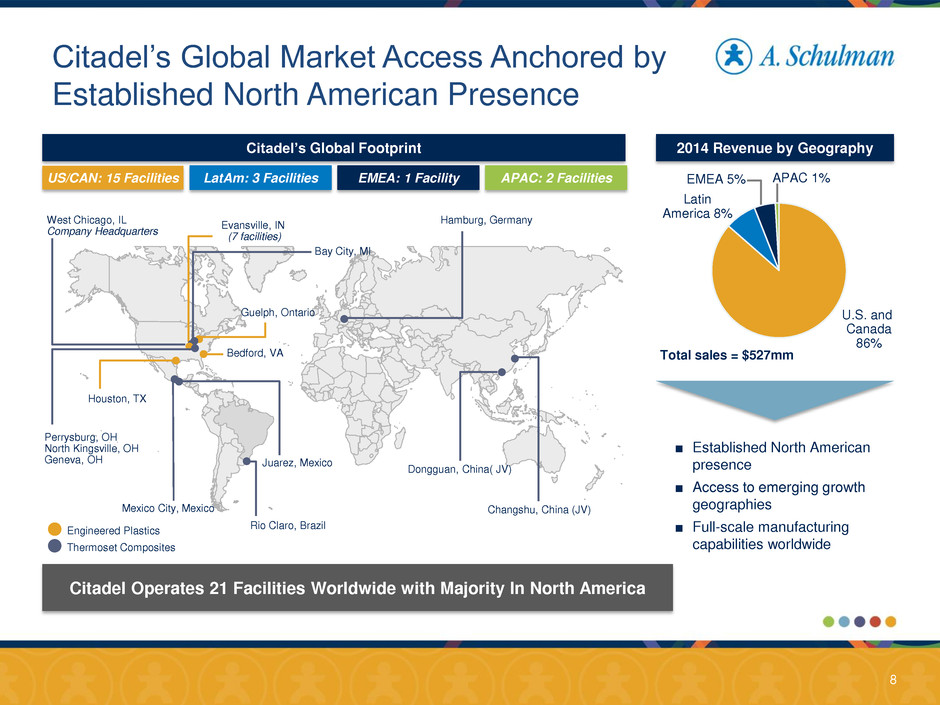
0 38 84 229 162 38 0 119 193 157 194 75 117 167 192 83 94 125 192 77 55 127 127 127 89 89 89 Citadel’s Global Market Access Anchored by Established North American Presence 8 2014 Revenue by Geography Citadel’s Global Footprint Bay City, MI Evansville, IN (7 facilities) West Chicago, IL Company Headquarters Perrysburg, OH North Kingsville, OH Geneva, OH Bedford, VA Juarez, Mexico Houston, TX Rio Claro, Brazil Dongguan, China( JV) Hamburg, Germany Changshu, China (JV) Mexico City, Mexico Guelph, Ontario U.S. and Canada 86% ■ Established North American presence ■ Access to emerging growth geographies ■ Full-scale manufacturing capabilities worldwide US/CAN: 15 Facilities Citadel Operates 21 Facilities Worldwide with Majority In North America Total sales = $527mm Latin America 8% APAC 1% EMEA 5% LatAm: 3 Facilities EMEA: 1 Facility APAC: 2 Facilities Engineered Plastics Thermoset Composites

0 38 84 229 162 38 0 119 193 157 194 75 117 167 192 83 94 125 192 77 55 127 127 127 89 89 89 Citadel’s Unparalleled Ability to Match Customers’ Needs With Material Solutions 9 Industrial & Construction Consumer Electrical Energy Healthcare & Safety Transportation Aerospace & Defense 26% 20% Forward Lighting Systems Exterior Luggage Systems Troller/Body Panels Throttle Bodies Transmission Sensors 19% 4% 18% 2% 1% Key End Markets End Market % of Revenue Key Applications Representative Customers Concrete reinforcement HVAC In-ground utility vaults Valve housings Street / industrial lighting Lawn & garden Dishware Appliances Power tools Frac plug components Centralizers, float valves Fuel cell plates Lithium-ion battery components Circuit breakers, switches Insulators Backup batteries Electric motors Patient handling systems and hospital bed components Sterilizing equipment CT scanners, wheel chair lifts Semi-structural aircraft components Weapon hand guards

0 38 84 229 162 38 0 119 193 157 194 75 117 167 192 83 94 125 192 77 55 127 127 127 89 89 89 Snapshot of A. Schulman and Citadel 10 Business Overview Summary Financials Revenue by Segment ■ Leading international supplier of high- performance plastic compounds and resins ■ Proprietary and custom-formulated engineered plastic compounds, color concentrates, and performance-enhancing additives ■ Serves a variety of end markets, including the consumer, packaging, industrial and automotive applications ■ Publicly traded (NASDAQ: SHLM) ■ Leading material science expert, providing custom engineered solutions for specialized applications ■ Material agnostic with an unmatched array of technical and formulation capabilities ■ Customized solutions are provided to a diverse base of multi-national OEMs for use across a variety of attractive applications ■ Owned by HGGC / Charlesbank FY 2014 Revenue: $2,447 million FY 2014 EBITDA: $146 million EMEA 64% Latin America 8% U.S. and Canada 20% Revenue by Region Masterbatch Solutions 33% Custom Performance Colors 7% Engineered Plastics 55% Thermoset Composites 45% Engineered Plastics 31% Distribution Services 15% Specialty Powders 14% Latin America 8% APAC 1% U.S. and Canada 86% EMEA 5% CY 2014 Revenue: $527 million CY 2014 EBITDA: $75 million Total sales = $2,447mm Total sales = $2,447mm Total sales = $527mm Total sales = $527mm Pro Forma ■ Leading supplier of high performance thermoplastic compounds and thermoset composites ■ Highly diversified across end markets, products and geographies ■ Superior technical and formulation capabilities ■ Combined footprint of 63 global production facilities maximizing growth opportunities and operating leverage and customer intimacy PF 2014 Revenue: $2,974million (+22%) PF 2014 EBITDA: $223 million (+51%) + = APAC 8% EMEA 54% Latin America 8% U.S. and Canada 31% Total sales = $2,974mm APAC 7% Engineered Plastics 35% Thermoset Composites 8% Masterbatch Solutions 27% Distribution Services 12% Specialty Powders 12% Total sales = $2,974mm Custom Performance Colors 6%

0 38 84 229 162 38 0 119 193 157 194 75 117 167 192 83 94 125 192 77 55 127 127 127 89 89 89 Pro Forma Financial Snapshot of A. Schulman and Citadel 11 2014 Pro Forma Revenue Historical Pro Forma Revenue ($mm) Historical Pro Forma EBITDA ($mm) E n d M arket s P rod u ct s $1,590 $2,159 $2,081 $2,133 $2,447 $406 $469 $484 $503 $527 $1,996 $2,628 $2,565 $2,636 $2,974 31.7% (2.4%) 2.8% 12.8% 2010 2011 2012 2013 2014 = A. Schulman = Citadel = % Growth = A. Schulman = Citadel = % Margin Packaging 26% Transportation / Mobility 21% Building & Construction 10% Electronics & Electrical 9% Agriculture 5% Custom Services 4% Other (e.g. Appliance / Consumer) 24% Engineered Plastics 35% Masterbatch Solutions 27% Distribution Services 12% Specialty Powders 12% Thermoset Composites 8% Custom Performance Colors 6% Total sales = $2,974mm Total sales = $2,974mm $93 $122 $127 $121 $146 $49 $55 $67 $69 $75 $142 $176 $194 $190 $221 7.1% 6.7% 7.6% 7.2% 7.4% 2010 2011 2012 2013 2014

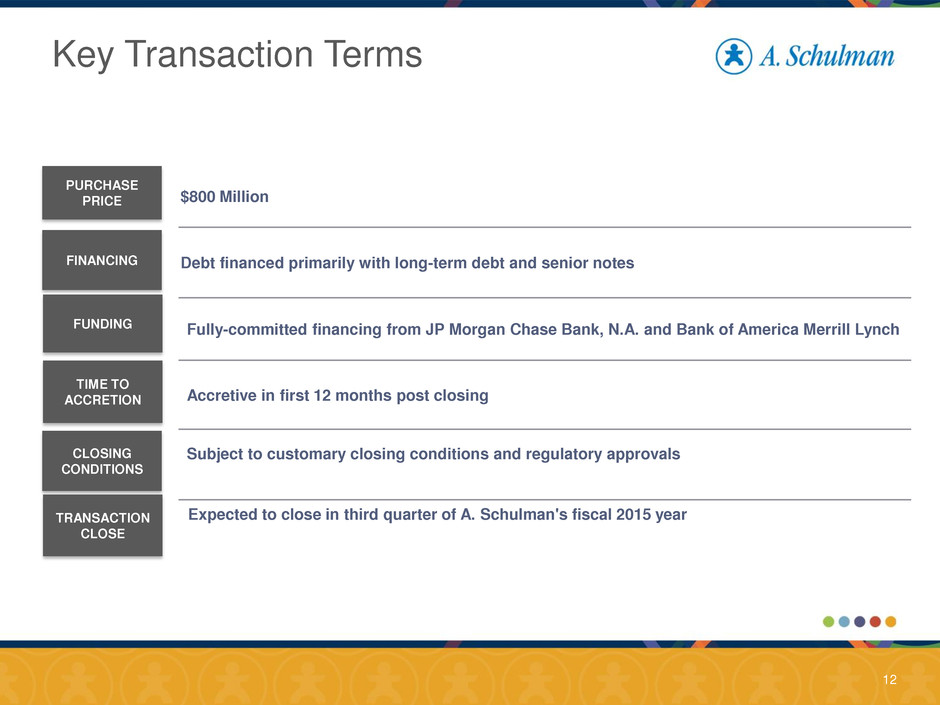
0 38 84 229 162 38 0 119 193 157 194 75 117 167 192 83 94 125 192 77 55 127 127 127 89 89 89 Key Transaction Terms 12 $800 Million Debt financed primarily with long-term debt and senior notes Fully-committed financing from JP Morgan Chase Bank, N.A. and Bank of America Merrill Lynch Accretive in first 12 months post closing Subject to customary closing conditions and regulatory approvals Expected to close in third quarter of A. Schulman's fiscal 2015 year PURCHASE PRICE FINANCING FUNDING TIME TO ACCRETION CLOSING CONDITIONS TRANSACTION CLOSE

0 38 84 229 162 38 0 119 193 157 194 75 117 167 192 83 94 125 192 77 55 127 127 127 89 89 89 APPENDIX 13

0 38 84 229 162 38 0 119 193 157 194 75 117 167 192 83 94 125 192 77 55 127 127 127 89 89 89 Greater Diversification of Customers, End Markets & Geographies will further strengthen the “New A. Schulman” 14 E n d M a rk et s P ro d u c ts Packaging 32% Building & Construction 8% Electronics & Electrical 7% Agriculture 6% Transportation 26% Industrial & Construction 20% Consumer 19% Electrical 18% Packaging 26% Transportation / Mobility 21% Building & Construction 10% Electronics & Electrical 9% Agriculture 5% Custom Services 4% Other (e.g. Appliance / Consumer) 25% Masterbatch Solutions 33% Engineered Plastics 30% Distribution Services 15% Specialty Powders 14% Custom Performance Colors 7% Engineered Plastics 55% Thermoset Composites 45% Engineered Plastics 35% Masterbatch Solutions 27% Distribution Services 12% Specialty Powders 12% Thermoset Composites 8% Custom Performance Colors 6% 2014A sales = $2,447mm 2014A sales = $2,974mm 2014 sales = $527mm 2014A sales = $2,447mm 2014A sales = $2,974mm 2014 sales = $527mm Other 17% Mobility 20% Custom Services 5% Other 22% Pro Forma

0 38 84 229 162 38 0 119 193 157 194 75 117 167 192 83 94 125 192 77 55 127 127 127 89 89 89 Reconciliation of GAAP to Non-GAAP Financial Measures: Adjusted EBITDA 15 2014 2013 2012 Net income attributable to A. Schulman, Inc. 56,193$ 26,099$ 50,887$ (Income) loss from discontinued operations, net of tax (3,202) 6,671 860 Interest expense, net 8,217 7,162 7,675 Income tax expense 18,542 19,733 13,918 Depreciation and amortization 48,569 41,091 39,310 Certain items: Costs related to acquisitions 6,021 2,661 1,425 Restructuring and related costs 9,618 13,687 9,256 Accelerated depreciation 107 1,058 - Asset impairment 104 1,873 3,392 Curtailment and settlement (gains) losses 214 333 (310) Inventory step-up 1,468 138 677 Adjusted EBITDA 145,851$ 120,506$ 127,090$ Net sales 2,446,998$ 2,133,402$ 2,081,272$ Adjusted EBITDA as a % of net sales 6.0% 5.6% 6.1% Fiscal Year Ended August 31, A. Schulman, Inc. Unaudited & In Thousands
