Attached files
| file | filename |
|---|---|
| EX-23.1 - EX-23.1 - FCB FINANCIAL HOLDINGS, INC. | d834689dex231.htm |
| EX-21.1 - EX-21.1 - FCB FINANCIAL HOLDINGS, INC. | d834689dex211.htm |
| EXCEL - IDEA: XBRL DOCUMENT - FCB FINANCIAL HOLDINGS, INC. | Financial_Report.xls |
| EX-31.2 - EX-31.2 - FCB FINANCIAL HOLDINGS, INC. | d834689dex312.htm |
| EX-32.2 - EX-32.2 - FCB FINANCIAL HOLDINGS, INC. | d834689dex322.htm |
| EX-31.1 - EX-31.1 - FCB FINANCIAL HOLDINGS, INC. | d834689dex311.htm |
| EX-32.1 - EX-32.1 - FCB FINANCIAL HOLDINGS, INC. | d834689dex321.htm |
Table of Contents
Index to Financial Statements
UNITED STATES
SECURITIES AND EXCHANGE COMMISSION
Washington, D.C. 20549
FORM 10-K
ANNUAL REPORT PURSUANT TO SECTION 13 OR 15(d)
OF THE SECURITIES EXCHANGE ACT OF 1934
For the fiscal year ended December 31, 2014
Commission file number: 001-36586
FCB Financial Holdings, Inc.
(Exact name of registrant as specified in its charter)
| Delaware | 27-0775699 | |
| (State of Incorporation) |
(I.R.S. Employer Identification No.) |
| 2500 Weston Road, Suite 300 Weston, Florida |
33301 | |
| (Address of principal executive offices) | (Zip code) |
(954) 984-3313
(Registrant’s telephone number, including area code)
Securities registered pursuant to Section 12(b) of the Act:
| Title of each class |
Name of each exchange on which registered | |
| Class A Common Stock, $0.001 par value | New York Stock Exchange |
Securities registered pursuant to Section 12(g) of the Act: None
Indicate by check mark if the registrant is a well-known seasoned issuer, as defined in Rule 405 of the Securities Act: Yes ¨ No x
Indicate by check mark if the registrant is not required to file reports pursuant to Section 13 or Section 15(d) of the Act:
Yes ¨ No x
Indicate by check mark whether the registrant (1) has filed all reports required to be filed by Section 13 or Section 15(d) of the Securities Exchange Act of 1934 during the preceding 12 months (or for such shorter period that the registrant was required to file such reports), and (2) has been subject to such filing requirements for the past 90 days. Yes x No ¨
Indicate by check mark whether the registrant has submitted electronically and posted on its corporate website, if any, every Interactive Data File required to be submitted and posted pursuant to Rule 405 of Regulation S-T (§232.405 of this chapter) during the preceding 12 months (or for such shorter period that the registrant was required to submit and post such files). Yes x No ¨
Indicate by check mark if disclosure of delinquent filers pursuant to Item 405 of Regulation S-K is not contained herein, and will not be contained, to the best of the registrant’s knowledge, in definitive proxy or information statements incorporated by reference in Part III of this Form 10-K or any amendment to this Form 10-K. x
Indicate by check mark whether the registrant is a large accelerated filer, an accelerated filer, a non-accelerated filer, or a smaller reporting company. (Check one):
| Large accelerated filer | ¨ | Accelerated filer | ¨ | |||
| Non-accelerated filer | x | Smaller reporting company | ¨ | |||
Indicate by check mark whether the registrant is a shell company (as defined in rule 12b-2 of the Act): Yes ¨ No x
The aggregate market value of the voting and non-voting common equity held by non-affiliates as of June 30, 2014, computed based on the last sale price of the registrant’s Class A common stock on August 1, 2014 (the date on which such securities were first traded on any exchange) was: $787.9 million.
As of February 28, 2015, the registrant had 34,776,594 shares of Class A Common Stock outstanding and 6,653,104 shares of Class B Common Stock outstanding.
DOCUMENTS INCORPORATED BY REFERENCE
Portions of our definitive Proxy Statement to be delivered to stockholders in connection with our 2015 Annual Meeting of Stockholders are incorporated by reference into Part III of this Form 10-K.
Table of Contents
Index to Financial Statements
FCB FINANCIAL HOLDINGS, INC.
FORM 10-K
Table of Contents
Index to Financial Statements
In this report, unless the context suggests otherwise, references to “FCB Financial Holdings,” “the Company,” “we,” “us,” and “our” mean the business of FCB Financial Holdings, Inc. (formerly known as Bond Street Holdings, Inc.) and its wholly-owned subsidiary, Florida Community Bank, National Association and its consolidated subsidiaries; and references to “the Bank” refer to Florida Community Bank, National Association, and its consolidated subsidiaries. References to the “Old Failed Banks” include Premier American Bank, or Old Premier, Florida Community Bank, or Old FCB, Peninsula Bank, or Old Peninsula, Sunshine State Community Bank, or Old Sunshine, First National Bank of Central Florida, or Old FNBCF, Cortez Community Bank, or Old Cortez, Coastal Bank, or Old Coastal, First Peoples Bank, or Old FPB, in each case, before the acquisition of certain assets and assumption of certain liabilities of each of the Old Failed Banks by the Bank. References to Great Florida Bank, or GFB, refer to such bank before its acquisition by the Bank; Great Florida Bank and the Old Failed Banks are collectively referred to as the Old Banks. References to our Class A Common Stock refer to our Class A voting common stock, par value $0.001 per share; references to our Class B Common Stock refer to our Class B non-voting common stock, par value $0.001 per share; and references to our common stock include, collectively, our Class A Common Stock and our Class B Common Stock.
CAUTIONARY NOTE REGARDING FORWARD-LOOKING INFORMATION
Some of the statements under “Business,” “Risk Factors,” “Management’s Discussion and Analysis of Financial Condition and Results of Operations” and elsewhere in this report may contain forward-looking statements that reflect our current views with respect to, among other things, future events and financial performance. We generally identify forward-looking statements by terminology such as “outlook,” “believes,” “expects,” “potential,” “continues,” “may,” “will,” “could,” “should,” “seeks,” “approximately,” “predicts,” “intends,” “plans,” “estimates,” “anticipates” or the negative version of those words or other comparable words. Any forward-looking statements contained in this report are based on our historical performance, the historical performance of the Old Banks or on our current plans, estimates and expectations. The inclusion of this forward-looking information should not be regarded as a representation by us or any other person that the future plans, estimates or expectations contemplated by us will be achieved. Such forward-looking statements are subject to various risks and uncertainties and assumptions relating to our operations, financial results, financial condition, business prospects, growth strategy and liquidity. If one or more of these or other risks or uncertainties materialize, or if our underlying assumptions prove to be incorrect, our actual results may vary materially from those indicated in these statements. These factors should not be construed as exhaustive and should be read in conjunction with the other cautionary statements that are included elsewhere in this report. We do not undertake any obligation to publicly update or review any forward-looking statement, whether as a result of new information, future developments or otherwise. A number of important factors could cause actual results to differ materially from those indicated by the forward-looking statements, including, but not limited to, those factors described in “Risk Factors” and “Management’s Discussion and Analysis of Financial Condition and Results of Operations.”
You should read this report and the documents that we reference in this report and have filed as exhibits to the various reports and registration statements that we have filed with the Securities and Exchange Commission completely and with the understanding that our actual future results, levels of activity, performance and achievements may be different from what we expect and that these differences may be material.
Business Overview
FCB Financial Holdings, Inc. is a bank holding company, headquartered in Weston, Florida, with one wholly-owned national bank subsidiary, Florida Community Bank, National Association. We provide a range of financial products and services to individuals, small and medium-sized businesses, some large businesses, and other local organizations and entities through 52 branches in south and central Florida. We target retail customers and commercial customers who are engaged in a wide variety of industries including healthcare and professional services; retail and wholesale trade; tourism; agricultural services; manufacturing; distribution and distribution-related industries; technology; automotive; aviation; food products; building materials; residential housing; and commercial real estate. We also selectively participate in syndicated loans to national credits.
3
Table of Contents
Index to Financial Statements
Since our formation in April 2009, we have raised equity capital and acquired certain assets and assumed certain liabilities of eight failed banks from the FDIC, as receiver. In January 2014, we acquired all the outstanding common stock of Great Florida Bank. Through the integration of the operations and systems of the acquired banks, we have transformed into a large, integrated commercial bank. Subsequent to the acquisitions, we have focused on internal growth. From the bank acquisitions and our internal growth, our consolidated total assets, total deposits and total stockholders’ equity were $5.96 billion, $3.98 billion and $851.7 million at December 31, 2014.
Acquisitions
Old Failed Bank Acquisitions
In six of the eight Old Failed Bank acquisitions, we entered into loss sharing agreements with the FDIC under which the FDIC bears a substantial portion of the risk of loss. The Old Failed Banks’ acquired assets, including loan portfolios and other real estate owned (“OREO”) that are covered under FDIC loss share arrangements, are referred to as “Covered Assets.” In general, under the terms of the loss sharing agreements, the FDIC’s obligation to reimburse us for losses with respect to Covered Assets begins with the first dollar of loss incurred. The FDIC agreed to assume 80% of losses and share 80% of loss recoveries on the first agreed-upon portion of losses on the acquired loans and OREO. The loss sharing agreements cover losses on single-family residential mortgage loans for 10 years and all other losses for five years (eight years for recoveries on non-residential loans). The reimbursable losses from the FDIC are based on the book value of the relevant loans as determined by the FDIC at the date of the transaction. The loss sharing agreements do not cover new loans made after that date. As of December 31, 2014, the Covered Assets included in our portfolio were $273.4 million, or 6.96% of our aggregate loan portfolio; $11.3 million, or 58.6%, of total nonperforming loans; and $25.1 million, or 33.7% of our total OREO holdings.
Recent Events
On March 4, 2015, the Bank entered into agreements with the FDIC that terminated all six of the then existing loss share agreements with the FDIC, and made a payment of $14.8 mililon to the FDIC as consideration for the early termination of such loss share agreements. All rights and obligations of the Bank under the loss share agreements, including the clawback provisions, were eliminated under the early termination agreements. As a consequence of the early termination of the loss share agreements, future projected amortization expense of the indemnification asset will be eliminated. Further, early termination of the loss share agreements will result in a one-time expense of approximately $40.3 million on a tax effected basis, or $65.5 million on a pre-tax basis. For further information of the financial impact of the termination of the loss share agreements, see Note 20 “Subsequent Events” to the Company’s consolidated financial statements.
4
Table of Contents
Index to Financial Statements
Great Florida Bank Acquisition
On January 31, 2014, we paid $14.1 million in cash, net of cash acquired, to purchase 100% of the issued and outstanding common stock of Great Florida Bank, a state chartered commercial bank, headquartered in Miami Lakes, Florida. The primary reasons for the transaction were to enhance stockholder value and to further expand our existing branch network. Great Florida Bank had total assets of $957.3 million and total liabilities of $962.2 million at fair value as of January 31, 2014. Holders of Great Florida Bank common stock received $3.24 per share in cash for each common share owned resulting in a total cash purchase price of $42.5 million. The acquisition of Great Florida Bank added to our branch network 25 banking locations within Southeast Florida and the Miami metropolitan area. The Company invested $125 million in the Bank at the time of the Great Florida Bank transaction. None of the assets acquired in the Great Florida Acquisition are covered by loss sharing agreements.
The transaction added approximately $864.0 million in deposits, $548.1 million in loans and $47.4 million in goodwill to our Consolidated Balance Sheet. Our Consolidated Income Statement includes the impact of business activity associated with the Great Florida Bank acquisition subsequent to January 31, 2014.
Initial Public Offering
On August 6, 2014, the Company completed the initial public offering of 7,520,000 shares of Class A Common Stock for $22.00 per share. Our Class A common stock is listed on the New York Stock Exchange under the trading symbol “FCB”.
5
Table of Contents
Index to Financial Statements
Overview of Products and Services
Commercial Credit and Depository Products: We offer an array of commercial credit and depository products including loans for corporate, middle market, and business banking clients such as lines of credit to finance working capital and trade activities, loans for owner-occupied real estate financing, equipment-financing and acquisition financing. For commercial real estate clients, we offer construction financing, mini-permanent and permanent financing, acquisition and development lending, land financing, and bridge lending. For clients with large credit needs, we lead and participate in club lending structures. We also provide a limited amount of specialty financing to owners and operators in the area of aviation and marine lending.
We provide credit products through standby letters of credit and the issuance of FCB branded corporate credit cards and purchasing cards issued by a third party provider. We also offer derivative products such as interest rate swaps and caps through a third party provider. Deposit products include checking accounts tailored to meet the needs of our commercial customers, savings accounts with customizable features, and money market accounts with competitive tiered rates.
Treasury Product Offerings: We offer a suite of treasury management services that are designed to help business customers streamline their financial transactions, manage their accounts more efficiently, and improve their business’ record keeping. Our treasury management products and solutions focus on four financial areas: payables, receivables, liquidity and information reporting.
Swap Program: Beginning in 2013 we entered into an interest rate swap program with The PNC Financial Services Group (“PNC Financial”) enabling us to provide our customers with the ability to swap their variable rate interest obligations into fixed rate payment obligations. We establish interest rate swap transactions with our clients and simultaneously enter into an offsetting interest rate swap transaction with PNC Financial. All interest rate risk on the swap transactions is held by PNC Financial and our client. PNC Financial collateralizes any net exposure to the Bank on the outstanding swap. We are compensated at the inception of these swap transactions by a fee received from PNC Financial.
Syndicated Loans: We participate in syndicated loans when we believe our participation will provide an attractive return and we are comfortable with the risk profile of the loan. In 2013, we expanded our syndicated loan program beyond our focus on Florida-based companies to a more geographically diversified portfolio that includes companies located throughout the United States. As of December 31, 2014 and 2013, we held approximately $445.6 million and $481.0 million of syndicated national loans, respectively.
Retail Deposit Product Offerings: We offer a variety of deposit products including demand deposit accounts, interest-bearing products, savings accounts and certificates of deposit. Our retail depository products include a variety of checking products designed to meet various customer needs as well as personal savings, money market accounts, certificates of deposit and IRAs.
Retail Credit Product Offerings: We provide a variety of customized loan programs to accommodate the needs of our retail client base. Consumer loans are primarily on a secured basis, while unsecured credit card products are offered and sold to our customers through Elan Services. Consumer loan products include personal loans, auto loans, recreational loans, and home improvement/second mortgage loans.
Additional Retail Services: In addition to traditional retail deposit and credit products, we also provide services such as online and mobile banking, safe deposit boxes and payment services. We continue to expand our product suite by introducing new products such as Workplace Community Checking and Consumer Remote Deposit Capture. Through our agreement with Raymond James Financial Services, we provide our customers with a number of non-deposit investment products and brokerage services, including securities brokerage services, investment advice and investment recommendations.
Loss Share with FDIC
As of December 31, 2014, 6.96% of our loans are covered by loss sharing agreements with the FDIC. Because of the loss protection provided by the FDIC, the risks associated with the loans and foreclosed real estate we acquired in the FDIC-assisted acquisitions covered by loss sharing agreements are different from the risks associated with our loans and foreclosed real estate that are not covered under the FDIC loss sharing agreements. As of December 31, 2014, our Covered Loans totaled $273.4 million and our non-Covered acquired loans totaled $552.8 million. Both
6
Table of Contents
Index to Financial Statements
the Commercial Loss Share Agreement and the Single Family Loss Share Agreement for each of our acquisitions with a loss sharing arrangement contain specific terms and conditions regarding the management of the Covered Assets that we must follow to receive reimbursement on losses from the FDIC. In general, under the loss sharing agreements, we must:
| • | Manage and administer Covered Loans and other assets and collect and effect charge-offs and recoveries in a manner consistent with our usual and prudent business and banking practices and, with respect to single family shared-loss loans, customary servicing procedures; |
| • | Exercise our best judgment in managing, administering and collecting amounts on Covered Loans and other assets and effecting charge-offs with respect to Covered Loans and other assets; |
| • | Use commercially reasonable efforts to maximize recoveries with respect to losses on single family shared-loss loans and use our best efforts to maximize collections with respect to shared-loss assets under the Commercial Loss Share Agreements; |
| • | Retain sufficient staff to perform the duties under the loss sharing agreements; |
| • | Adopt and implement accounting, reporting, record-keeping and similar systems with respect to the Commercial Loss Agreements; |
| • | Comply with the terms of the loan modification guidelines approved by the FDIC or another federal agency for any single-family shared-loss loan; and |
| • | File quarterly certificates with the FDIC specifying the amount of losses, charge-offs and recoveries. |
In addition, under both the Single Family Loss Share Agreements and Commercial Loss Share Agreements, the FDIC is not required to make any payments with respect to any charge-off or loss event that it determines we should not have effected. For instance, under the Single Family Loss Share Agreements, the FDIC can deny coverage if it finds we failed to undertake reasonable and customary loss mitigation efforts in accordance with the applicable modification guidelines or failed to follow customary servicing procedures. Under all of the loss sharing agreements, the FDIC must provide the Bank with notice and an opportunity to cure any such deficiency. Any unresolved disputes with the FDIC regarding losses or payments will be subject to binding arbitration.
To maintain compliance with the terms and conditions of the loss sharing agreements, we have created a robust workout platform from several departments to monitor, manage and administer the different aspects of the loss sharing agreements.
The cash payments we expect to receive in the future as a consequence of the collection, sale or other disposition of Covered Assets pursuant to the FDIC loss sharing agreements are reflected on our balance sheet as the FDIC loss share indemnification asset. The FDIC loss share indemnification asset as of December 31, 2014 had a carrying value of $63.2 million. Through December 31, 2014, we have filed with the FDIC claims totaling $427.9 million under the loss sharing agreements. See Note 20 “Subsequent Events” in the “Notes to Consolidated Financial Statements” for additional information regarding the FDIC indemnification asset and the FDIC clawback liability.
Acquired Assets Not Covered by Loss Sharing Agreements
The Bank also acquired assets in the Old Failed Bank acquisitions that are not covered by the loss sharing agreements with the FDIC, including loans (in the acquisitions of Old Sunshine and Old FPB), cash, certain investment securities purchased at fair market value (most of which were subsequently sold and the proceeds of which we used to acquire investment securities consistent with our investment strategy) and other tangible assets. In addition, the loss sharing agreements do not apply to assets acquired, purchased or originated after the date of the applicable loss sharing agreement or to investment securities.
The assets acquired from the acquisition of GFB on January 31, 2014 are also not covered by a loss sharing agreement with the FDIC. Additional information about the assets acquired and liabilities assumed from the Great Florida Acquisition can be found in Note 2 of our audited consolidated financial statements for the years ended December 31, 2014 and 2013 included elsewhere in this report.
7
Table of Contents
Index to Financial Statements
Competition
The banking business is highly competitive, and we experience competition in our markets from many other financial institutions. Competition among financial institutions is based upon interest rates offered on deposit accounts, interest rates charged on loans, other credit and service charges relating to loans, the quality and scope of the services offered, the convenience of banking facilities, reputation in the community and, in the case of loans to commercial borrowers, relative lending limits. We compete with commercial banks, credit unions, savings and loan associations, mortgage banking firms, consumer finance companies, securities brokerage firms, insurance companies, money market funds and other mutual funds, as well as super-regional, national and international financial institutions that operate offices within our market areas and beyond. Our largest banking competitors in our markets include Bank of America, BankUnited, BB&T, JPMorgan Chase, Regions Bank, SunTrust Bank, TD Bank and Wells Fargo.
Our top five market areas include the Miami-Fort Lauderdale-West Palm Beach MSA, Naples-Immokalee-Marco Island, FL MSA, Cape Coral-Fort Myers, FL MSA, North Port-Sarasota-Bradenton, FL MSA and Orlando-Kissimmee-Sanford, FL MSA of which we held 0.92%, 2.84%, 2.56%, 1.92% and 0.65%, respectively, of the deposit market share as of June 30, 2014. Overall, in the Florida marketplace, the Company ranks 16th in total deposits according to SNL Financial.
We believe that the Bank’s operation as a Florida-based regional bank with a broad base of local customers, as well as the local relationships of the Bank’s senior management team and existing and future relationship-oriented lending officers, enhances our ability to compete with those non-local financial institutions now operating in these markets, but no assurances can be given in this regard.
Employees
As of December 31, 2014, we had 638 full-time equivalent employees. None of our employees are parties to a collective bargaining agreement. We consider our relationships with our employees to be positive.
Available Information
Our website address is www.floridacommunitybank.net. Our electronic filings with the SEC (including Annual Reports on Form 10-K, Quarterly Reports on Form 10-Q, Current Reports on Form 8-K, and if applicable, amendments to those reports) are available free of charge on the website as soon as reasonably practicable after they are electronically filed with, or furnished to, the SEC. The information posted on our website is not incorporated into this Annual Report. In addition, the SEC maintains a website that contains reports and other information filed with the SEC. The website can be accessed at http://www.sec.gov.
SUPERVISION AND REGULATION
We are subject to numerous governmental regulations, some of which are highlighted below. Applicable laws and regulations restrict our permissible activities and investments and, among other things, require compliance with protections for loan and deposit customers; impose capital adequacy requirements; and restrict our ability to receive dividends from our bank subsidiary. In addition, we are subject to comprehensive examination and supervision by, among other regulatory bodies, the Board of Governors of the Federal Reserve System (Federal Reserve) and the Office of the Comptroller of the Currency (“OCC”) which result in examination reports that can impact the conduct and growth of our business. The consequences of noncompliance with applicable laws and regulations can include substantial monetary and nonmonetary sanctions.
FCB Financial Holdings, Inc. as a Bank Holding Company
As a bank holding company, we are subject to regulation under the Bank Holding Company Act of 1956, as amended, or BHCA, and to inspection, examination, supervision and enforcement by the Federal Reserve. Being a bank holding company enables us to focus on control investments and broadens the investment opportunities available to us as compared to a non-control investor, through access to both public and private financial institutions, failing and distressed financial institutions, seized assets and deposits, and FDIC auctions. Federal Reserve jurisdiction also extends to any company that is directly or indirectly controlled by a bank holding company, such as subsidiaries and other companies in which the bank holding company makes a controlling investment.
8
Table of Contents
Index to Financial Statements
Statutes, regulations and policies could restrict our ability to diversify into other areas of financial services, acquire depository institutions, and make distributions or pay dividends on our equity securities. They may also require us to provide financial support to any bank which we control, maintain capital balances in excess of those desired by management and pay higher deposit insurance premiums as a result of a general deterioration in the financial condition of the Bank or any other future depository institution subsidiary.
The Bank as a National Bank
The Bank is a national bank and is subject to supervision and regular examination by its primary banking regulator, the OCC. The Bank’s deposits are insured by the Deposit Insurance Fund (“DIF”) up to applicable limits in the manner and to the extent provided by law. The Bank is subject to the Federal Deposit Insurance Act, as amended, or FDI Act, and FDIC regulations relating to deposit insurance and may also be subject to supervision and examination by the FDIC under certain circumstances.
Prior to December 17, 2014, the Bank was subject to specific requirements pursuant to the OCC Agreement, which was entered into between the Bank and the OCC in connection with our first acquisition. The OCC Agreement required, among other things, that the Bank provide an updated business plan to the OCC each year, provide notice to, and obtain consent from, the OCC with respect to any additional failed bank acquisitions from the FDIC or the appointment of any new director or senior executive officer and to maintain various financial and capital ratios.
The Bank and, with respect to certain provisions, the Company, is also subject to an Order of the FDIC, dated January 22, 2010 (referred to as the Order), issued in connection with the FDIC’s approval of the Bank’s application for federal deposit insurance. The Order requires, among other things, that the Bank submit quarterly loss share reports, requires the Bank, the Company, our founders and certain of our stockholders comply with all applicable provisions of the FDIC’s Statement of Policy on Qualifications for Failed Bank Acquisitions (“SOP”) and requires the Bank to maintain capital levels sufficient to be well capitalized under regulatory standards during the remaining period of ownership of the investors (as defined in the Order) subject to the SOP. A failure by the Bank or the Company to comply with the requirements the Order, or the objection by the OCC or the FDIC to any materials or information submitted pursuant to the Order, could prevent us from executing our business strategy and materially and adversely affect our businesses and our results of operations, cash flows and financial condition.
Regulatory Notice and Approval Requirements
A bank holding company must obtain prior approval of the Federal Reserve in connection with any acquisition that results in the bank holding company owning or controlling more than 5% of any class of voting securities of a bank or another bank holding company. In acting on such applications, the Federal Reserve considers:
| • | The effect of the acquisition on competition; |
| • | The financial condition and future prospects of the applicant and the banks involved; |
| • | The managerial resources of the applicant and the banks involved; |
| • | The convenience and needs of the community, including the record of performance under the Community Reinvestment Act; and |
| • | The effectiveness of the applicant in combating money laundering activities. |
Our ability to make investments in depository institutions will depend on our ability to obtain approval of the Federal Reserve. The Federal Reserve could deny our application based on the criteria above or other considerations, including the condition or regulatory status of the Company, the Bank or any other future controlled depository institutions.
Federal and state laws impose additional notice, approval, and ongoing regulatory requirements on any stockholder or other party that seeks to acquire direct or indirect “control” of an FDIC-insured depository institution. These laws include the BHCA and the Change in Bank Control Act. Among other things, these laws require regulatory filings by a stockholder or other party that seeks to acquire direct or indirect “control” of an FDIC-insured depository
9
Table of Contents
Index to Financial Statements
institution. The determination whether an investor “controls” a depository institution is based on all of the facts and circumstances surrounding the investment. As a general matter, a party is deemed to control a depository institution or other company if the party owns or controls 25% or more of any class of voting securities. Subject to rebuttal, a party may be presumed to control a depository institution or other company if the investor owns or controls 10% or more of any class of voting securities. If a party’s ownership of the Company were to exceed certain thresholds, the investor could be deemed to “control” the Company for regulatory purposes. This could subject the investor to regulatory filings or other regulatory consequences.
Broad Supervision, Examination, and Enforcement Powers
A principal objective of the U.S. bank regulatory regime is to protect depositors by ensuring the financial safety and soundness of banks. To that end, the Federal Reserve and other bank regulators have broad regulatory, examination, and enforcement authority, including the power to issue cease and desist orders, impose substantial fines and other civil and criminal penalties, terminate deposit insurance and appoint a conservator or receiver. Bank regulators regularly examine the operations of banks and bank holding companies. In addition, banks and bank holding companies are subject to periodic reporting requirements.
Bank regulators have various remedies available if they determine that the financial condition, capital resources, asset quality, earnings prospects, management, liquidity, or other aspects of a banking institution’s operations are unsatisfactory. Bank regulators may also take action if they determine that the banking institution or its management is violating or has violated any law or regulation. Bank regulators have the power to, among other things:
| • | Enjoin “unsafe or unsound” practices; |
| • | Require affirmative actions to correct any violation or practice; |
| • | Issue administrative orders that can be judicially enforced; |
| • | Direct increases in capital; |
| • | Direct the sale of subsidiaries or other assets; |
| • | Limit dividends and distributions; |
| • | Restrict growth; |
| • | Assess civil monetary penalties; |
| • | Remove officers and directors; and |
| • | Terminate deposit insurance. |
The FDIC may terminate a bank’s deposit insurance upon a finding that the bank’s financial condition is unsafe or unsound or that the bank has engaged in unsafe or unsound practices or has violated any applicable rule, regulation, order or condition enacted or imposed by the bank’s regulatory agency. Engaging in unsafe or unsound practices or failing to comply with applicable laws, regulations, and supervisory agreements could subject us and our subsidiaries, Bond Street Management, LLC, or their officers, directors, and institution-affiliated parties to the remedies described above and other sanctions.
Bank Holding Company as a Source of Strength
It is a policy of the Federal Reserve that a bank holding company should serve as a source of financial and managerial strength to the banks that it controls. If a controlled bank is in financial distress, then the Federal Reserve could assert that the bank holding company must provide additional capital or financial support to the bank. If a controlled bank is undercapitalized, then the regulators could require the bank holding company to guarantee a capital restoration plan. If the Federal Reserve believes that a bank holding company’s activities, assets, or affiliates represent a significant risk to the financial safety, soundness, or stability of a controlled bank, then the Federal Reserve could require the bank holding company to terminate the activities, liquidate the assets, or divest the affiliates. The regulators may require these and other actions in support of controlled banks even if such action is not in the best interests of the bank holding company or its stockholders. Because we are a bank holding company, the Federal Reserve views us (and our consolidated assets) as a source of financial and managerial strength for our controlled depository institutions.
10
Table of Contents
Index to Financial Statements
Moreover, the Dodd-Frank Wall Street Reform and Consumer Protection Act of 2010, or Dodd-Frank Act directs federal bank regulators to require that all companies that directly or indirectly control an insured depository institution serve as a source of strength for the institution. The appropriate federal banking agency for such a depository institution may require reports from companies that own the insured depository institution to assess their ability to serve as a source of strength and to enforce compliance with the source-of-strength requirements. The term “source of financial strength” is defined as the ability of a company to provide financial assistance to its insured depository institution subsidiaries in the event of financial distress at such subsidiaries. The federal bank regulators have not yet proposed implementing regulations. Under this requirement, in the future we could be required to provide financial assistance to the Bank should it experience financial distress, including at times when we may not be in a financial position to provide such assistance or would otherwise determine not to provide it.
We control the Bank, which is a national bank. Consequently, the OCC could order an assessment of us if the Bank’s capital were to become impaired. If we failed to pay the assessment within three months, the OCC could order the sale of our equity in the Bank to cover the deficiency.
In addition, capital loans by us or the Bank to any of our future subsidiary banks will be subordinate in right of payment to deposits and certain other indebtedness of the subsidiary bank. In the event of our bankruptcy, any commitment by us to a federal bank regulatory agency to maintain the capital of a subsidiary bank will be assumed by the bankruptcy trustee and entitled to a priority of payment.
Permitted Activities and Investments of Bank Holding Companies
The BHCA generally prohibits a bank holding company from engaging in activities other than those determined by the Federal Reserve to be so closely related to banking as to be a proper incident thereto. Provisions of the Gramm-Leach-Bliley Financial Modernization Act of 1999, or GLB Act, expanded the permissible activities of a bank holding company that qualifies as and elects to become a financial holding company. Under the regulations implementing the GLB Act, a financial holding company may engage in additional activities that are financial in nature or incidental or complementary to a financial activity. Those activities include, among other activities, certain insurance and securities activities. We have not yet determined whether it would be appropriate or advisable in the future to elect to become a financial holding company.
FDIC Statement of Policy on Qualifications for Failed Bank Acquisitions
The FDIC approved our acquisition of Old Premier pursuant to the Order. The Order requires that the Bank, the Company, the Company’s founders and each investor holding more than 5% of our Class A Common Stock and any other investor determined to be engaged in concerted action with other investors comply with the applicable provisions of the FDIC Policy. The FDIC Policy imposes restrictions and requirements on certain institutions and their investors, to the extent that those institutions seek to acquire a failed bank from the FDIC. Certain provisions of the FDIC Policy are summarized below, including those relating to higher capital requirements for the Bank and limitations on certain transfers by holders of equity securities. As the agency responsible for resolving failed banks, the FDIC has discretion to determine whether a party is qualified to bid on a failed institution. The FDIC adopted the FDIC Policy on August 26, 2009. The FDIC issued guidance under the FDIC Policy on January 6, 2010 and April 23, 2010.
For those institutions and investors to which it applies, the FDIC Policy imposes the following provisions, among others. First, the institution is required to maintain a ratio of Tier 1 common equity to total assets of at least 10% for a period of three years following its first FDIC-assisted transaction, and thereafter maintain a capital level sufficient to be well capitalized under regulatory standards during the remaining period of ownership of the investors subject to the FDIC Policy. The Bank is currently subject to the well capitalized requirement but is no longer subject to the 10% Tier 1 common equity ratio requirement. Second, investors subject to the FDIC Policy that collectively own 80% or more of two or more depository institutions are required to pledge to the FDIC their proportionate interests in each institution to indemnify the FDIC against any losses it incurs in connection with the failure of one of the institutions. Third, the institution is prohibited from extending credit to its investors subject to the FDIC Policy and to affiliates of such investors. Fourth, investors subject to the FDIC Policy may not employ ownership structures that use entities domiciled in bank secrecy jurisdictions. The FDIC has interpreted this prohibition to apply to a wide range of non-U.S. jurisdictions. In its guidance, the FDIC has required that non-U.S. investors subject to the FDIC
11
Table of Contents
Index to Financial Statements
Policy invest through a U.S. subsidiary and adhere to certain requirements related to record keeping and information sharing. Fifth, without FDIC approval, investors subject to the FDIC Policy are prohibited from selling or otherwise transferring their securities in the institution for a three-year period following the institution’s first acquisition of a failed bank from the FDIC following their acquisition of their securities. The FDIC could condition our acquisition of another failed bank on one or more of our existing or future stockholders, including purchasers of our Class A Common Stock, agreeing to be bound by this three year prohibition on transfers. The transfer restrictions in the FDIC Policy do not, however, apply to investors that are otherwise subject to the FDIC Policy and are open-ended investment companies registered under the Investment Company Act, issue redeemable securities, and allow investors to redeem on demand. Sixth, investors subject to the FDIC Policy may not employ complex and functionally opaque ownership structures to invest in institutions. Seventh, investors subject to the FDIC Policy that own 10% or more of the equity of a failed institution are not eligible to bid for that failed institution in an FDIC auction. Eighth, investors subject to the FDIC Policy may be required to provide information to the FDIC, such as with respect to the size of the capital fund or funds, their diversification, their return profiles, their marketing documents, their management teams, and their business models. Ninth, the FDIC Policy does not replace or substitute for otherwise applicable regulations or statutes.
Regulatory Capital and Liquidity Requirements
Capital Requirements. Bank regulators view capital levels as important indicators of an institution’s financial soundness. FDIC-insured depository institutions and their holding companies are required to maintain minimum capital relative to the amount and types of assets they hold. The final supervisory judgment on an institution’s capital adequacy is based on the regulator’s individualized assessment of numerous factors.
As a bank holding company, we are subject to various regulatory capital adequacy requirements administered by the Federal Reserve. The Bank is also subject to similar capital adequacy requirements administered by the OCC. The Federal Deposit Insurance Corporation Improvement Act of 1991 required the federal regulatory agencies to adopt regulations defining five capital tiers for banks: well capitalized, adequately capitalized, undercapitalized, significantly undercapitalized and critically undercapitalized. Failure to meet minimum capital requirements can initiate certain mandatory and possibly additional discretionary actions by regulators that, if undertaken, could have a direct material effect on our business and financial condition.
As an additional means to identify problems in the financial management of depository institutions, the FDI Act requires federal bank regulatory agencies to establish certain non-capital safety and soundness standards for institutions for which they are the primary federal regulator. The standards relate generally to operations and management, asset quality, interest rate exposure and executive compensation. The agencies are authorized to take action against institutions that fail to meet such standards.
The current risk-based capital guidelines that apply to us and the Bank are based on the 1988 capital accord, referred to as Basel I, of the International Basel Committee on Banking Supervision (Basel Committee), a committee of central banks and bank supervisors, as implemented by federal bank regulators. Under the existing Basel I-based guidelines, the minimum ratio of total capital to risk-weighted assets (which are primarily the credit risk equivalents of balance sheet assets and certain off-balance sheet items such as standby letters of credit, but also include a nominal market risk equivalent balance related to foreign exchange and debt/equity trading activities) is 8%. At least half of the total capital must be composed of Tier 1 capital, which includes common stockholders’ equity (including retained earnings), qualifying non-cumulative perpetual preferred stock (and, for bank holding companies only, a limited amount of qualifying cumulative perpetual preferred stock and a limited amount of trust preferred securities), and minority interests in the equity accounts of consolidated subsidiaries, less goodwill, other disallowed intangibles, and disallowed deferred tax assets, among other items. The Federal Reserve also has adopted a minimum leverage ratio for bank holding companies, requiring Tier 1 capital of at least 3% of average quarterly total consolidated assets (as defined for regulatory purposes), net of the loan loss reserve, goodwill and certain other intangible assets.
In order to be deemed well capitalized, banks and their holding companies currently are required to maintain Tier 1 capital and the sum of Tier 1 and Tier 2 capital equal to at least 6% and 10%, respectively, of their total risk-weighted assets (including certain off-balance sheet items, such as standby letters of credit). The federal bank regulatory agencies may, however, set higher capital requirements for an individual bank or when a bank’s particular circumstances warrant.
12
Table of Contents
Index to Financial Statements
The Federal Reserve may also set higher capital requirements for holding companies whose circumstances warrant it. For example, holding companies experiencing internal growth or making acquisitions are expected to maintain strong capital positions substantially above the minimum supervisory levels, without significant reliance on intangible assets. Also, the Federal Reserve considers a “tangible Tier 1 leverage ratio” (deducting all intangibles) and other indications of capital strength in evaluating proposals for expansion or engaging in new activities. In addition, the federal bank regulatory agencies have established minimum leverage (Tier 1 capital to adjusted average total assets) guidelines for banks within their regulatory jurisdiction. These guidelines provide for a minimum leverage ratio of 5% for banks to be deemed well capitalized.
In addition, the OCC Agreement entered into by the Company at the time of the Company’s first acquisition in January 2010 required the Bank to maintain prescribed minimum capital ratios in excess of current regulatory requirements as follows: Tier 1 leverage ratio of 10%, Tier 1 risk-based capital ratio of 11% and total risk-based capital ratio of 12%. These ratios were in lieu of the current capital regulatory requirements to be considered well and adequately capitalized. On December 17, 2014, the OCC Agreement was terminated eliminating these minimum capital ratio requirements.
The Order issued in connection with the FDIC’s approval of the Bank’s application for federal deposit insurance requires the bank to maintain a capital level sufficient to be well capitalized under regulatory standards during the remaining period of ownership of the investors (as defined in the Order) subject to the FDIC Policy. Our regulatory capital ratios and those of the Bank are in excess of the levels established for well capitalized institutions.
In July 2013, the Company’s primary federal regulator, the Federal Reserve, and the Bank’s primary federal regulator, the OCC, approved final rules (the New Capital Rules) establishing a new comprehensive capital framework for U.S. banking institutions. The New Capital Rules generally implement the Basel Committee’s December 2010 final capital framework (referred to as Basel III) for strengthening international capital standards. The New Capital Rules substantially revise the risk-based capital requirements applicable to bank holding companies and their depository institution subsidiaries, including the Company and the Bank, as compared to the current U.S. general Basel-I based risk-based capital rules. The New Capital Rules also revise requirements with respect to leverage. The New Capital Rules revise the definitions and the components of regulatory capital, as well as address other issues affecting the numerator in banking institutions’ regulatory capital ratios. The New Capital Rules also address asset risk weights and other matters affecting the denominator in banking institutions’ regulatory capital ratios and replace the existing general risk-weighting approach, which was derived from the Basel Committee’s Basel I capital accords, with a more risk-sensitive approach based, in part, on the “standardized approach” in the Basel Committee’s 2004 “Basel II” capital accords. In addition, the New Capital Rules implement certain provisions of the Dodd-Frank Act, including the requirements of Section 939A to remove references to credit ratings from the federal bank regulators’ rules. The New Capital Rules are effective for the Company and the Bank on January 1, 2015, subject to phase-in periods for certain of their components and other provisions.
Among other matters, the New Capital Rules: (i) introduce a new capital measure called “Common Equity Tier 1” (CET1) and related regulatory capital ratio of CET1 to risk-weighted assets; (ii) specify that Tier 1 capital consists of CET1 and “Additional Tier 1 capital” instruments meeting certain revised requirements; (iii) mandate that most deductions/adjustments to regulatory capital measures be made to CET1 and not to the other components of capital; and (iv) expand the scope of the deductions from and adjustments to capital as compared to existing regulations. Under the New Capital Rules, for most banking institutions, the most common form of Additional Tier 1 capital is non-cumulative perpetual preferred stock and the most common form of Tier 2 capital is subordinated notes and a portion of the allocation for loan and lease losses, in each case, subject to the New Capital Rules’ specific requirements.
Pursuant to the New Capital Rules, the minimum and well capitalized ratios as of January 1, 2015 will be as follows:
Minimum Capital Ratios
| • | 4.5% CET1 to risk-weighted assets; |
| • | 6.0% Tier 1 capital (that is, CET1 plus Additional Tier 1 capital) to risk-weighted assets; |
13
Table of Contents
Index to Financial Statements
| • | 8.0% Total capital (that is, Tier 1 capital plus Tier 2 capital) to risk-weighted assets; and |
| • | 4% Tier 1 capital to average consolidated assets as reported on consolidated financial statements (known as the “leverage ratio”). |
Minimum to be Well Capitalized
| • | 6.5% CET1 to risk-weighted assets; |
| • | 8.0% Tier 1 capital (that is, CET1 plus Additional Tier 1 capital) to risk-weighted assets; |
| • | 10.0% Total capital (that is, Tier 1 capital plus Tier 2 capital) to risk-weighted assets; and |
| • | 5% Tier 1 capital to average consolidated assets as reported on consolidated financial statements (known as the “leverage ratio”). |
The New Capital Rules also introduce a new “capital conservation buffer”, composed entirely of CET1, on top of these minimum risk-weighted asset ratios. The capital conservation buffer is designed to absorb losses during periods of economic stress. Banking institutions with a ratio of CET1 to risk-weighted assets above the minimum but below the capital conservation buffer will face constraints on dividends, equity repurchases and compensation based on the amount of the shortfall. Thus, when fully phased-in on January 1, 2019, the Company and the Bank will be required to maintain such additional capital conservation buffer of 2.5% of CET1, effectively resulting in minimum ratios to be considered adequately capitalized of (i) CET1 to risk-weighted assets of at least 7%, (ii) Tier 1 capital to risk-weighted assets of at least 8.5%, and (iii) Total capital to risk-weighted assets of at least 10.5% and minimum ratios to be considered well capitalized of (i) CET1 to risk-weighted assets of at least 9%, (ii) Tier 1 capital to risk-weighted assets of at least 10.5%, and (iii) Total capital to risk-weighted assets of at least 12.5%.
The New Capital Rules provide for a number of deductions from and adjustments to CET1. These include, for example, the requirement that mortgage servicing rights, deferred tax assets arising from temporary differences that could not be realized through net operating loss carrybacks and significant investments in non-consolidated financial entities be deducted from CET1 to the extent that any one such category exceeds 10% of CET1 or all such items, in the aggregate, exceed 15% of CET1.
In addition, under the current Basel I-based general risk-based capital rules, the effects of accumulated other comprehensive income or loss (“AOCI”) items included in stockholders’ equity (for example, marks-to-market of securities held in the available-for-sale portfolio) under accounting principles generally accepted in the United States of America (“U.S. GAAP”) are reversed for the purposes of determining regulatory capital ratios. Pursuant to the New Capital Rules, the effects of certain AOCI items are not excluded; however, banking institutions, such as the Company and the Bank, that are not advanced approaches banking institutions (defined below) may make a one-time permanent election to continue to exclude these items. This election must be made concurrently with the first filing of certain of the Company’s and the Bank’s periodic regulatory reports in the beginning of 2015. The Company and the Bank are considering whether to make such election.
Implementation of the deductions and other adjustments to CET1 will begin on January 1, 2015 and will be phased-in over a 4-year period (beginning at 40% on January 1, 2015 and an additional 20% per year thereafter). The implementation of the capital conservation buffer will begin on January 1, 2016 at the 0.625% level and increase by 0.625% on each subsequent January 1, until it reaches 2.5% on January 1, 2019.
The New Capital Rules prescribe a new standardized approach for risk weightings that expand the risk-weighting categories from the current four Basel I-derived categories (0%, 20%, 50% and 100%) to a larger and more risk-sensitive number of categories, depending on the nature of the assets, generally ranging from 0% for U.S. government and agency securities, to 150% for commercial real estate loans that do not meet certain new underwriting requirements and 600% for certain equity exposures, and resulting in higher risk weights for a variety of asset classes. Furthermore, the New Capital Rules provide more advantageous risk weights for derivatives and repurchase-style transactions cleared through a qualifying central counterparty and increase the scope of eligible guarantors and eligible collateral for purposes of credit risk mitigation.
We believe that, as of December 31, 2014, the Company and the Bank each met all capital adequacy requirements under the New Capital Rules, including the capital conservation buffer, on a fully phased-in basis as if such requirements were currently effective.
14
Table of Contents
Index to Financial Statements
Although Basel III includes as a new international standard a minimum leverage ratio of 3%, calculated as the ratio of Tier 1 capital to balance sheet exposures plus certain off-balance sheet exposures, the New Capital Rules apply the Basel III leverage ratio (referred to in the New Capital Rules as the “supplemental leverage ratio”) only to advanced approaches banking institutions (i.e., banking institutions having $250 billion or more in total consolidated assets or $10 billion or more of foreign exposures).
Liquidity Requirements: Historically, the regulation and monitoring of bank and bank holding company liquidity has been addressed as a supervisory matter, without required formulaic measures. The Basel III liquidity framework requires banks and bank holding companies to measure their liquidity against specific liquidity tests that, although similar in some respects to liquidity measures historically applied by institutions and regulators for management and supervisory purposes, going forward would be required by regulation. One test, referred to as the liquidity coverage ratio (LCR), is designed to ensure that the banking institution maintains an adequate level of unencumbered high-quality liquid assets equal to the institution’s expected net cash outflow for a 30-day time horizon (or, if greater, 25% of its expected total cash outflow) under an acute liquidity stress scenario. The other test, referred to as the net stable funding ratio (NSFR), is designed to promote more medium- and long-term funding of the assets and activities of banking institutions over a one-year time horizon. These requirements may incentivize banking institutions to increase their holdings of securities that qualify as high-quality liquid assets and increase the use of long-term debt as a funding source. In September 2014, the federal bank regulators issued final rules for implementing the LCR for advanced approaches banking institutions and a modified version of the LCR for bank holding companies with at least $50 billion in total consolidated assets that are not advanced approach banking institutions, neither of which would apply to us or the Bank. The federal bank regulators have not yet proposed rules to implement the NSFR. In addition, in February 2014, the Federal Reserve adopted rules requiring bank holding companies with $50 billion or more in total consolidated assets to comply with enhanced liquidity standards, including a buffer of highly liquid assets based on projected funding needs for 30 days. The liquidity buffer is in addition to the Federal bank regulators’ proposal on the LCR and described by the Federal Reserve as being “complementary” to that proposal.
Prompt Corrective Action: The FDI Act requires federal bank regulatory agencies to take “prompt corrective action” with respect to FDIC-insured depository institutions that do not meet minimum capital requirements. A depository institution’s treatment for purposes of the prompt corrective action provisions will depend upon how its capital levels compare to various capital measures and certain other factors, as established by regulation.
Under this system, the federal banking regulators have established five capital categories, well capitalized, adequately capitalized, undercapitalized, significantly undercapitalized and critically undercapitalized, in which all depository institutions are placed. The federal banking regulators have also specified by regulation the relevant capital levels for each of the other categories. Under certain circumstances, a “well capitalized”, adequately capitalized or undercapitalized institution may be treated as if the institution were in the next lower capital category. Federal banking regulators are required to take various mandatory supervisory actions and are authorized to take other discretionary actions with respect to institutions in the three undercapitalized categories. The severity of the action depends upon the capital category in which the institution is placed. A depository institution that is undercapitalized is required to submit a capital restoration plan. Failure to meet capital guidelines could subject the bank to a variety of enforcement remedies by federal bank regulatory agencies, including: termination of deposit insurance by the FDIC; restrictions on certain business activities; and appointment of the FDIC as conservator or receiver. Generally, subject to a narrow exception, the banking regulator must appoint a receiver or conservator for an institution that is critically undercapitalized.
With respect to the Bank, the New Capital Rules revise the prompt corrective action levels by: (i) introducing a CET1 ratio requirement at each prompt corrective action category (other than critically undercapitalized), with the required CET1 ratio being 6.5% for well capitalized status; (ii) increasing the minimum Tier 1 capital ratio requirement for each category, with the minimum Tier 1 capital ratio for well capitalized status being 8% (as compared to the current 6%); and (iii) eliminating the current provision that provides that a bank with a composite supervisory rating of 1 may have a 3% leverage ratio and still be adequately capitalized. The New Capital Rules do not change the total risk-based capital requirement for any prompt corrective action category.
15
Table of Contents
Index to Financial Statements
Regulatory Limits on Dividends and Distributions
The Company is a legal entity separate and distinct from each of its subsidiaries. The ability of a bank to pay dividends and make other distributions, and to pay any management fee to its parent holding company, is limited by federal and state law. The specific limits depend on a number of factors, including the bank’s type of charter, recent earnings, recent dividends, level of capital, and regulatory status. The regulators are authorized, and under certain circumstances are required, to determine that the payment of dividends or other distributions by a bank would be an unsafe or unsound practice and to prohibit that payment. For example, the FDI Act generally prohibits a depository institution from making any capital distributions (including payment of a dividend) or paying any management fee to its parent holding company if the depository institution would thereafter be undercapitalized.
The ability of a bank holding company to pay dividends and make other distributions can also be limited. A bank holding company is subject to minimum risk-based and leverage capital requirements as summarized above. The Federal Reserve has authority to prohibit a bank holding company from paying dividends or making other distributions. The Federal Reserve has issued a policy statement with regard to the payment of cash dividends by bank holding companies. The policy statement provides that, as a matter of prudent banking, a bank holding company should not maintain a rate of cash dividends unless its net income available to common stockholders has been sufficient to fully fund the dividends, and the prospective rate of earnings retention appears to be consistent with the holding company’s capital needs, asset quality, and overall financial condition. Accordingly, a bank holding company should not pay cash dividends that exceed its net income or can only be funded in ways that weaken the bank holding company’s financial health, such as by borrowing. In addition, the Dodd-Frank Act and Basel III impose additional restrictions on the ability of banking institutions to pay dividends.
Our ability to pay dividends or make other distributions to our investors is limited by minimum capital and other requirements prescribed by law and regulation. The regulators have authority to impose additional limits on dividends and distributions by the Company and its subsidiaries. Certain restrictive covenants in future debt instruments, if any, may also limit the Bank’s or our ability to make dividend payments.
Reserve Requirements
Pursuant to regulations of the Federal Reserve, all banks are required to maintain average daily reserves at mandated ratios against their transaction accounts. In addition, reserves must be maintained on certain non-personal time deposits. These reserves must be maintained in the form of vault cash or in an account at a Federal Reserve Bank.
Limits on Transactions with Affiliates and Insiders
Banks are subject to restrictions on their ability to conduct transactions with affiliates, including parent holding companies and other related parties. Section 23A of the Federal Reserve Act imposes quantitative limits, qualitative requirements, and collateral requirements on certain transactions by a bank with, or for the benefit of, its affiliates. Transactions covered by Section 23A include loans, extensions of credit, investment in securities issued by an affiliate, and purchases of assets from an affiliate. Section 23B of the Federal Reserve Act requires that most types of transactions by a bank with, or for the benefit of, an affiliate be on terms at least as favorable to the bank as if the transaction were conducted with an unaffiliated third party. The Federal Reserve’s Regulation W also defines and limits the transactions in which the Bank may engage with us or with other affiliates.
The Dodd-Frank Act generally enhances the restrictions on transactions with affiliates under Section 23A and 23B of the Federal Reserve Act, including an expansion of the definition of “covered transactions” to include credit exposures related to derivatives, repurchase agreements and securities lending arrangements, and an increase in the amount of time for which collateral requirements regarding covered credit transactions must be satisfied. The definition of “affiliate” was expanded to include any investment fund to which we or an affiliate serves as an investment adviser. The ability of the Federal Reserve to grant exemptions from these restrictions is also narrowed by the Dodd-Frank Act, including by requiring coordination with other bank regulators.
The Federal Reserve’s Regulation O imposes restrictions and procedural requirements in connection with the extension of credit by a bank to its directors, executive officers, principal equity investors, and their related interests. All extensions of credit to insiders and their related interests must be on the same terms as, and subject to the same loan underwriting requirements as, loans to persons who are not insiders. In addition, Regulation O imposes lending limits on loans to insiders and their related interests and imposes, in certain circumstances, requirements for prior approval of the loans by the Bank’s board of directors.
16
Table of Contents
Index to Financial Statements
General Assessment Fees
The OCC currently charges assessments to all national banks based upon the asset size of the bank. In addition to the general assessment fees, the OCC imposes surcharges on national banks with a supervisory composite rating of 3, 4 or 5 in its most recent safety and soundness examination. The general assessment fee is paid to the OCC on a semi-annual basis. The Dodd-Frank Act provides various agencies with the authority to assess additional supervision fees.
Deposit Insurance Assessments
FDIC-insured depository institutions, such as the Bank, are required to pay deposit insurance premium assessments to the FDIC. The amount of a particular institution’s deposit insurance assessment is based on that institution’s risk classification under an FDIC risk-based assessment system. An institution’s risk classification is assigned based on its capital levels, the level of supervisory concern the institution poses to its regulators and other risk measures.
The Dodd Frank Act makes permanent the general $250,000 deposit insurance limit for insured deposits.
The Dodd-Frank Act changes the deposit insurance assessment framework, primarily by basing assessments on an institution’s total assets less tangible equity (subject to risk-based adjustments that would further reduce the assessment base for custodial banks) rather than domestic deposits, which is expected to shift a greater portion of the aggregate assessments to large banks. The Dodd-Frank Act also eliminates the upper limit for the reserve ratio designated by the FDIC each year, increases the minimum designated reserve ratio of the DIF from 1.15% to 1.35% of the estimated amount of total insured deposits by September 30, 2020, and eliminates the requirement that the FDIC pay dividends to depository institutions when the reserve ratio exceeds certain thresholds.
The Dodd-Frank Act requires the DIF to reach a reserve ratio of 1.35% of insured deposits by September 30, 2020. On December 14, 2010, the FDIC raised the minimum designated reserve ratio of DIF to 2%. The ratio is higher than the minimum reserve ratio of 1.35% as set by the Dodd-Frank Act. Under the Dodd-Frank Act, the FDIC is required to offset the effect of the higher reserve ratio on insured depository institutions with consolidated assets of less than $10 billion.
On February 7, 2011, the FDIC approved a final rule on Assessments, Dividends, Assessment Base and Large Bank Pricing. The final rule, mandated by the Dodd-Frank Act, changes the deposit insurance assessment system from one that is based on domestic deposits to one that is based on average consolidated total assets minus average tangible equity. Because the new assessment base under the Dodd-Frank Act is larger than the current assessment base, the final rule’s assessment rates are lower than the current rates, which achieves the FDIC’s goal of not significantly altering the total amount of revenue collected from the industry. In addition, the final rule adopts a “scorecard” assessment scheme for larger banks and suspends dividend payments if the DIF reserve ratio exceeds 1.5% but provides for decreasing assessment rates when the DIF reserve ratio reaches certain thresholds. The final rule also determines how the effect of the higher reserve ratio will be offset for institutions with less than $10 billion of consolidated assets.
Continued action by the FDIC to replenish the DIF as well as the changes contained in the Dodd-Frank Act may result in higher assessment rates, which would reduce our profitability or otherwise negatively impact our operations. In addition, we will face higher assessment rates if the Bank’s total consolidated assets reach $10 billion.
Depositor Preference
The FDI Act provides that, in the event of the “liquidation or other resolution” of an insured depository institution, the claims of depositors of the institution (including the claims of the FDIC as subrogee of insured depositors) and certain claims for administrative expenses of the FDIC as a receiver will have priority over other general unsecured claims against the institution. If we invest in or acquire an insured depository institution that fails, insured and uninsured depositors, along with the FDIC, will have priority in payment ahead of unsecured, non-deposit creditors, including us, with respect to any extensions of credit they have made to such insured depository institution and priority over any of the Bank’s stockholders, including us, or our investors or creditors.
17
Table of Contents
Index to Financial Statements
Liability of Commonly Controlled Institutions
Under the FDI Act, FDIC-insured depository institutions can be held liable for any loss incurred, or reasonably expected to be incurred, by the FDIC in connection with the default of an FDIC-insured depository institution controlled by the same bank holding company, and for any assistance provided by the FDIC to an FDIC-insured depository institution that is in danger of default and that is controlled by the same bank holding company. “Default” means generally the appointment of a conservator or receiver for the institution. “In danger of default” means generally the existence of certain conditions indicating that a default is likely to occur in the absence of regulatory assistance.
This cross-guarantee liability for a loss at a commonly controlled institution would be subordinated in right of payment to deposit liabilities, secured obligations, any other general or senior liability, and any obligation subordinated to depositors or other general creditors, other than obligations owed to any affiliate of the depository institution (with certain exceptions).
Federal Home Loan Bank System
The Bank is a member of the Federal Home Loan Bank of Atlanta “FHLB”, which is one of the 12 regional FHLB’s composing the FHLB system. Each FHLB provides a central credit facility primarily for its member institutions as well as other entities involved in home mortgage lending. Any advances from a FHLB must be secured by specified types of collateral, and all long-term advances may be obtained only for the purpose of providing funds for residential housing finance. As a member of the FHLB of Atlanta, the Bank is required to acquire and hold shares of capital stock in the FHLB of Atlanta.
Anti-Money Laundering Requirements
Under federal law, including the Bank Secrecy Act, the Uniting and Strengthening America by Providing Appropriate Tools Required to Intercept and Obstruct Terrorism Act of 2001, or Patriot Act, and the International Money Laundering Abatement and Anti-Terrorist Financing Act, financial institutions (including insured depository institutions, broker-dealers and certain other financial institutions) must maintain anti-money laundering programs that include established internal policies, procedures, and controls; a designated compliance officer; an ongoing employee training program; and testing of the program by an independent audit function. Among other things, these laws are intended to strengthen the ability of U.S. law enforcement agencies and intelligence communities to work together to combat terrorism on a variety of fronts. Financial institutions are prohibited from entering into specified financial transactions and account relationships and must meet enhanced standards for due diligence and customer identification in their dealings with non-U.S. financial institutions and non-U.S. customers. Financial institutions must take reasonable steps to conduct enhanced scrutiny of account relationships to guard against money laundering and to report any suspicious transactions, and law enforcement authorities have been granted increased access to financial information maintained by financial institutions. Bank regulators routinely examine institutions for compliance with these obligations and they must consider an institution’s compliance in connection with the regulatory review of applications, including applications for banking mergers and acquisitions. The regulatory authorities have imposed “cease and desist” orders and civil money penalty sanctions against institutions found to be violating these obligations.
The Office of Foreign Assets Control, or OFAC is responsible for helping to insure that U.S. entities do not engage in transactions with certain prohibited parties, as defined by various Executive Orders and Acts of Congress. OFAC publishes lists of persons, organizations and countries suspected of aiding, harboring or engaging in terrorist acts, known as Specially Designated Nationals and Blocked Persons. If we or the Bank find a name on any transaction, account or wire transfer that is on an OFAC list, we or the Bank must freeze or block such account or transaction, file a suspicious activity report and notify the appropriate authorities.
18
Table of Contents
Index to Financial Statements
Interstate Banking and Branching
Federal law permits an adequately capitalized and adequately managed bank holding company, with Federal Reserve approval, to acquire banking institutions located in states other than the bank holding company’s home state without regard to whether the transaction is prohibited under state law. In addition, national banks and state banks with different home states are permitted to merge across state lines, with the approval of the appropriate federal banking agency, unless the home state of a participating banking institution passed legislation prior to June 1, 1997 that expressly prohibits interstate mergers. The Dodd-Frank Act permits a national bank or a state bank, with the approval of its regulator, to open a branch in any state if the law of the state in which the branch is to be located would permit the establishment of the branch if the bank were a bank chartered in that state. National banks, such as the Bank, may provide trust services in any state to the same extent as a trust company chartered by that state.
Privacy and Security
Federal law establishes a minimum federal standard of financial privacy by, among other provisions, requiring banks to adopt and disclose privacy policies with respect to consumer information and setting forth certain rules with respect to the disclosure to third parties of consumer information. We have adopted and disseminated privacy policies pursuant to applicable law. Regulations adopted under federal law set standards for protecting the security, confidentiality and integrity of customer information, and require notice to regulators, and in some cases, to customers, in the event of security breaches. A number of states have adopted their own statutes concerning financial privacy and requiring notification of security breaches.
Consumer Laws and Regulations
Banks and other financial institutions are subject to numerous laws and regulations intended to protect consumers in transactions with banks. These laws include, among others:
| • | Truth in Lending Act; |
| • | Truth in Savings Act; |
| • | Electronic Funds Transfer Act; |
| • | Expedited Funds Availability Act; |
| • | Equal Credit Opportunity Act; |
| • | Fair and Accurate Credit Transactions Act; |
| • | Fair Housing Act; |
| • | Fair Credit Reporting Act; |
| • | Fair Debt Collection Practices Act; |
| • | GLB Act; |
| • | Home Mortgage Disclosure Act; |
| • | Right to Financial Privacy Act; |
| • | Real Estate Settlement Procedures Act; |
| • | Laws regarding unfair and deceptive acts and practices; and |
| • | Usury laws |
Many states and local jurisdictions have consumer protection laws analogous, and in addition, to those listed above. These federal, state, and local laws mandate certain disclosure requirements and regulate the manner in which financial institutions must deal with customers and monitor account activity when taking deposits, making loans, or conducting other types of transactions. Failure to comply with these laws and regulations could give rise to substantial penalties, reputational damage, regulatory sanctions, customer rescission rights, action by state and local attorneys general, and civil or criminal liability. The Dodd-Frank Act creates a new independent Consumer Financial Protection Bureau, or the Bureau, which will have broad authority to regulate consumer financial services and products provided by banks, such as the Bank, and various non-bank providers. It has authority to promulgate regulations and issue orders, guidance, policy statements, conduct examinations and bring enforcement actions. In general, banks with assets of $10 billion or less, such as the Bank, will be examined for consumer complaints by their primary bank regulator. The creation of the Bureau is likely to lead to enhanced and strengthened enforcement of consumer financial protection laws, even for banks not directly subject to its authority.
19
Table of Contents
Index to Financial Statements
The Community Reinvestment Act
The Bank is subject to the Community Reinvestment Act, or CRA. The CRA is intended to encourage banks to help meet the credit needs of their service areas, including low and moderate income neighborhoods, consistent with safe and sound bank operations. The regulators examine and assign each bank a public CRA rating. The CRA then requires bank regulators to take into account the bank’s record in meeting the needs of its service area when considering an application by a bank to establish a branch or to conduct certain mergers or acquisitions. The Federal Reserve is required to consider the CRA records of a bank holding company, controlled banks when considering an application by the bank holding company to acquire a bank or thrift or to merge with another bank holding company.
When we apply for regulatory approval to make certain investments, such as to acquire ownership or control of shares or assets of a bank or to merge with any other bank holding company, bank regulators will consider the CRA record of the target institution, the Bank and any future depository institution subsidiaries. An unsatisfactory CRA record could substantially delay approval or result in denial of an application. The regulatory agency’s assessment of the institution’s record is made available to the public. The OCC conducted its first CRA exam of the Bank in 2013, and the Bank received a “satisfactory” rating.
In addition, federal law requires the disclosure of agreements reached with community groups that relate to the CRA, and contains various other provisions designed to improve the delivery of financial services to consumers while maintaining an appropriate level of safety in the financial services industry.
Changes in Laws, Regulations, or Policies and the Dodd-Frank Act
Federal, state, and local legislators and regulators regularly introduce measures or take actions that would modify the regulatory requirements applicable to banks, their holding companies, and other financial institutions. Changes in laws, regulations, or regulatory policies could impact us or the Bank in ways we cannot predict.
On July 21, 2010, President Obama signed the Dodd-Frank Act into law. The Dodd-Frank Act has had and will have a broad impact on the financial services industry, imposing significant regulatory and compliance changes, including the designation of certain financial companies as systemically significant, the imposition of increased risk-based and leverage capital and liquidity requirements, and numerous other provisions designed to improve supervision and oversight of, and strengthen safety and soundness within, the financial services sector. Additionally, the Dodd-Frank Act establishes a framework of authority to conduct systemic risk oversight within the financial system to be distributed among new and existing federal regulatory agencies, including the Financial Stability Oversight Council (Council), the Federal Reserve, the OCC, and the FDIC.
The following items provide a brief description of certain provisions of the Dodd-Frank Act.
| • | Source of Strength. The Dodd-Frank Act requires all companies that directly or indirectly control an insured depository institution to serve as a source of strength for the institution. Under this requirement, in the future we could be required to provide financial assistance to the Bank should it experience financial distress. |
| • | Payment of Interest on Demand Deposits Permitted. The Dodd-Frank Act repealed the prohibition on banks and other financial institutions from paying interest on demand deposits. |
| • | Limitation on Federal Preemption. The Dodd-Frank Act significantly reduces the ability of national banks to rely upon federal preemption of state consumer financial laws. Although the OCC will have the ability to make preemption determinations where certain conditions are met, the broad rollback of federal preemption has the potential to create a patchwork of federal and state compliance obligations. This could, in turn, result in significant new regulatory requirements applicable to us, with potentially significant changes in our operations and increases in our compliance costs. It could also result in uncertainty concerning compliance, with attendant regulatory and litigation risks. |
20
Table of Contents
Index to Financial Statements
| • | Mortgage Loan Origination and Risk Retention. The Dodd-Frank Act contains additional regulatory requirements that may affect our operations and result in increased compliance costs. For example, the Dodd-Frank Act imposes new standards for mortgage loan originations on all lenders, including banks, in an effort to require steps to verify a borrower’s ability to repay. In January 2013, the Bureau adopted rules, effective January 2014, requiring creditors to make a reasonable, good faith determination of a consumer’s ability to repay any consumer credit transaction secured by a dwelling. In addition, the Dodd-Frank Act generally requires lenders or securitizers to retain an economic interest in the credit risk relating to loans the lender sells or mortgage and other asset-backed securities that the securitizer issues. The risk retention requirement generally will be 5%, but could be increased or decreased by regulation. Rules implementing the risk-retention requirements have been proposed but not yet adopted. |
| • | Imposition of Restrictions on Certain Activities. The Dodd-Frank Act requires new regulations for the over-the-counter derivatives market, including requirements for clearing, exchange trading, capital, margin, and reporting. Additionally, the Dodd-Frank Act requires that certain swaps and derivatives activities be “pushed out” of insured depository institutions and conducted in non-bank affiliates. The Dodd-Frank Act also significantly restricts the ability of a member of a depository institution holding company group to invest in or sponsor “covered funds” (as defined in the Volcker Rule), which may restrict our ability to hold certain securities, and broadly restricts such entities from engaging in “proprietary trading,” subject to limited exemptions. These restrictions may affect our ability to manage certain risks in our business. In addition, if our total consolidated assets exceed $10 billion, we would be required to develop and implement a compliance program under the Volcker Rule. |
| • | Expanded FDIC Resolution Authority. While insured depository institutions have long been subject to the FDIC’s resolution framework, the Dodd-Frank Act creates a new mechanism for the FDIC to conduct the orderly liquidation of certain “covered financial companies,” including bank holding companies and systemically significant non-bank financial companies. Upon certain findings being made, the FDIC may be appointed receiver for a covered financial company, and would be tasked to conduct an orderly liquidation of the entity. The FDIC liquidation process is generally modeled on the existing FDI Act, bank resolution regulations, and generally gives the FDIC more discretion than in the traditional bankruptcy context. |
| • | Consumer Financial Protection Bureau. The Dodd-Frank Act creates the Bureau within the Federal Reserve System. The Bureau is tasked with establishing and implementing rules and regulations under certain federal consumer protection laws with respect to the conduct of providers of certain consumer financial products and services. The Bureau has rulemaking authority over many of the statutes governing products and services offered to bank and thrift consumers. For depository institutions with assets of $10 billion or more, the Bureau has exclusive rule making and examination, and primary enforcement authority under federal consumer financial law. In addition, the Dodd-Frank Act permits states to adopt consumer protection laws and regulations that are stricter than those regulations promulgated by the Bureau. This new federal and state regulatory framework may result in significant new regulatory requirements applicable to us in respect of consumer financial products and services, with potentially significant increases in compliance costs and litigation risks. |
| • | Deposit Insurance. The Dodd-Frank Act makes permanent the general $250,000 deposit insurance limit for insured deposits. Amendments to the FDI Act also revise the assessment base against which an insured depository institution’s deposit insurance premiums paid to DIF will be calculated. Under these amendments, the assessment base will no longer be the institution’s deposit base, but rather its average consolidated total assets less its average tangible equity. Additionally, the Dodd-Frank Act makes changes to the minimum designated reserve ratio of the DIF, increasing the minimum from 1.15% to 1.35% of the estimated amount of total insured deposits, and eliminating the requirement that the FDIC pay dividends to depository institutions when the reserve ratio exceeds certain thresholds. |
| • | Transactions with Affiliates and Insiders. The Dodd-Frank Act generally enhances the restrictions on transactions with affiliates under Section 23A and 23B of the Federal Reserve Act, including an expansion of the definition of “covered transactions” and an increase in the amount of time for which collateral requirements regarding covered credit transactions must be satisfied. Insider transaction limitations are expanded through the strengthening of loan restrictions to insiders and the expansion of the types of transactions subject to the various limits, including derivatives transactions, repurchase agreements, reverse repurchase agreements and securities lending or borrowing transactions. Restrictions are also placed on certain asset sales to and from an insider to an institution, including requirements that such sales be on market terms and, in certain circumstances, approved by the institution’s board of directors. |
21
Table of Contents
Index to Financial Statements
| • | Enhanced Lending Limits. The Dodd-Frank Act strengthens the existing limits on a depository institution’s credit exposure to one borrower. The Dodd-Frank Act expands the scope of these restrictions to include credit exposure arising from derivative transactions, repurchase agreements, and securities lending and borrowing transactions. |
| • | Corporate Governance. The Dodd-Frank Act addresses many investor protections, corporate governance and executive compensation matters that will affect most U.S. publicly traded companies, including the Company. The Dodd-Frank Act (1) grants stockholders of U.S. publicly traded companies an advisory vote on executive compensation (although, as an emerging growth company, we are not required to seek such advisory votes); (2) enhances independence requirements for compensation committee members; (3) requires companies listed on national securities exchanges to adopt incentive-based compensation clawback policies for executive officers; and (4) provides the SEC with authority to adopt proxy access rules that would allow stockholders of publicly traded companies to nominate candidates for election as a director and have those nominees included in a company’s proxy materials. In addition, in February 2014, the Federal Reserve adopted rules that, beginning in 2015, require publicly traded bank holding companies with $10 billion or more in total consolidated assets to establish board-level risk committees. |
| • | Company-Run Stress Tests. In October 2012, the Federal Reserve and OCC adopted final rules regarding company-run stress testing of capital, as required by Dodd-Frank. The rules require bank holding companies and national banks with total consolidated assets greater than $10 billion to conduct an annual company-run stress test of capital, consolidated earnings and losses under base and stress scenarios provided by the bank regulators. The rules also require public disclosure of a summary of a covered entity’s stress tests results. |
| • | Limits on Debit Card Interchange Fees. Under the Dodd-Frank Act, the Federal Reserve has adopted rules concerning debit card transaction fees and network exclusivity arrangements for debit card issuers that, together with their affiliates, have more than $10 billion in total consolidated assets. |
Many of the requirements of the Dodd-Frank Act will be implemented over time and most will be subject to regulations implemented over the course of several years. Given the uncertainty surrounding the manner in which many of the Dodd-Frank Act’s provisions will be implemented by the various regulatory agencies and through regulations, the full extent of the impact on our operations is unclear. The changes resulting from the Dodd-Frank Act may impact the profitability of our business activities, require changes to certain of our business practices, impose upon us more stringent risk-based or leverage capital and liquidity requirements or otherwise adversely affect our business. These changes may also require us to invest significant management attention and resources to evaluate and make any changes necessary to comply with new statutory and regulatory requirements. Failure to comply with the new requirements may negatively impact our results of operations and financial condition. While we cannot predict what effect any presently contemplated or future changes in the laws or regulations or their interpretations would have on us, these changes could be materially adverse to our investors.
We are subject to a number of risks potentially impacting our business, financial condition, results of operation and cash flows. We encounter risk as part of the normal course of our business and we design risk management processes to help manage these risks.
22
Table of Contents
Index to Financial Statements
Risks Related to Our Business and Industry
We completed nine acquisitions between 2010 and 2014 and thus have a limited operating history as a single entity from which investors can evaluate our profitability and prospects.
The Company was organized in April 2009, acquired certain of the assets and assumed certain liabilities of eight failed banks in 2010 and 2011, and made a significant acquisition of an open bank—Great Florida Bank—which closed in January 2014. We have completed the process of integrating all of the acquired banking platforms into a single unified operating platform; however our limited time as the assignee of certain of the assets and liabilities of the Old Failed Banks and the successor to the operations of Great Florida Bank may make it difficult to predict our future prospects and financial performance based on the prior performance of the Old Failed Banks and Great Florida Bank.
We may not be able to effectively manage our growth.
We became a relatively large organization in a short period of time. Our operating results depend, to a large extent, on our ability to successfully manage our rapid growth and our ability to continue to recruit and retain qualified employees, especially seasoned relationship bankers. Our business plan includes, and is dependent upon, hiring and retaining highly qualified and motivated executives and employees at every level and, in particular, bankers that have long-standing relationships within their communities in order to grow our organic banking business. We expect these professionals will bring with them valuable customer relationships, and they will be an integral part of our ability to attract and grow deposits, generate new loan origination and grow in our market areas. We expect to experience substantial competition in our endeavor to identify, hire and retain the top-quality employees that we believe are keys to our success. If we are unable to continue to hire and retain qualified employees, we may not be able to successfully execute our business strategy. If we are unable to effectively manage and grow the Bank, our business and our consolidated results of operations and financial condition could be materially and adversely impacted.
Our current asset mix and our current investments may not be indicative of our future asset mix and investments, which may make it difficult to predict our future financial and operating performance.
Certain factors make it difficult to predict our future financial and operating performance including, among others: (i) our current asset mix may not be representative of our anticipated future asset mix and may change as we continue to execute on our plans for organic loan origination and banking activities and potentially grow through future acquisitions; (ii) our significant liquid securities portfolio may not necessarily be representative of our future liquid securities position; and (iii) our cost structure and capital expenditure requirements during the periods for which financial information is available may not be reflective of our anticipated cost structure and capital spending as we continue to realize efficiencies in our business, integrate future acquisitions and continue to grow our organic banking platform.
Since a significant portion of our revenue since inception was generated from accretion income on acquired loans, which over time has largely been replaced with performing interest-earning assets, the failure to generate sufficient new loan origination and other asset growth could have an adverse impact on our future financial condition and earnings.
As a result of our acquisitions, a significant portion of our current interest income has been derived from the realization of accretable discounts on acquired loans. For the year ended December 31, 2014, we recognized $77.3 million of interest income on acquired loans, or 38.0% of total interest income. For the year ended December 31, 2013, we recognized $64.9 million of interest income on acquired loans, or 44.6% of total interest income, and for the year ended December 31, 2012, we recognized $90.6 million of interest income on acquired loans, or 60.9% of total interest income, in each case, a portion of interest income is from the accretable discounts on our acquired loans. While our new loan portfolio has grown significantly over the last two years and represents 79.0% of our outstanding loans at December 31, 2014, if we are unable to continue to replace the remaining acquired loans and related interest income with new performing loans, our financial condition and earnings may be adversely affected.
23
Table of Contents
Index to Financial Statements
If we fail to effectively manage credit risk, our business and financial condition will suffer.
There are risks inherent in making or purchasing any loan, including risks with respect to the period of time over which the loan may be repaid, risks relating to proper loan underwriting and guidelines, risks resulting from changes in economic and industry conditions, risks inherent in dealing with individual borrowers and risks resulting from uncertainties as to the future value of collateral. As of December 31, 2014, approximately 21.0% of loans held by the Bank were obtained through acquisitions. In addition, we continue to grow our commercial loan origination business. There is no assurance that our credit risk monitoring and loan approval procedures are or will be adequate or will reduce the inherent risks associated with lending. Our credit administration personnel, policies and procedures may not adequately adapt to changes in economic or any other conditions affecting customers and the quality of our loan portfolio. Any failure to manage such credit risks may materially adversely affect our business and our consolidated results of operations and financial condition.
Economic and market developments, including the potential for inflation, may have an adverse effect on our business, possibly in ways that are not predictable or that we may fail to anticipate.
Economic and market disruptions that have existed in recent years and the potential for future economic disruptions and increase in inflation present considerable risks and challenges to us. Dramatic declines in the housing market and increasing business failures in the recent past have negatively impacted the performance of mortgage, commercial and construction loans and resulted in significant write downs of assets by many financial institutions. General downward economic trends, reduced availability of commercial credit and high unemployment have also negatively impacted the credit performance of commercial and consumer loans, resulting in additional write downs. These risks and challenges have significantly diminished overall confidence in the national economy, the financial markets and many financial institutions. This reduced confidence could further compound the overall market disruptions and risks to banks and bank holding companies, including us. These conditions, among others, are some of the factors that ultimately led to the failure of the Old Failed Banks whose assets we purchased from the FDIC, as receiver. Although, as a new market entrant in 2010, we benefited from these market dislocations as reflected in our purchase price for the acquired assets, continuation or further deterioration of weak real estate markets and related impacts, including increasing foreclosures, business failures and unemployment, may adversely affect our results of operations, especially as we attempt to increase our loan origination activities which will not be protected by loss sharing arrangements with the FDIC. A decline in real estate values could also lead to higher charge-offs in the event of defaults in our real estate loan portfolio. To the extent that our business may be similar in certain respects to the failed banks whose assets and liabilities we acquired, and that we may be serving the same general customer base with portions of a product mix which may be similar to that of the failed banks, there is no guarantee that similar economic conditions to those which adversely affected the failed banks’ results of operations will not similarly adversely affect our results of operations.
24
Table of Contents
Index to Financial Statements
Our business and operations are located in Florida, which experienced economic difficulties worse than many other parts of the United States during the last economic cycle, and as a result we are highly susceptible to downturns in the Florida economy.
In addition to general, regional, national and international economic conditions, our operating performance will be impacted by the economic conditions in Florida. During the most recent economic downturn, Florida was affected disproportionately relative to the rest of the country. As of December 2007, Florida’s unemployment rate was in line with the national average at 4.7% compared to 4.5% for the nation. By December 2009, Florida’s state unemployment rate was 11.6% relative to the national average of 8.8%, as reported by SNL Financial. Additionally, Florida’s GDP was significantly impacted. In 2009, Florida’s GDP decreased 5.9%, nearly double the national average of a 3.3% decline, as reported by the U.S. Bureau of Economic Analysis. Furthermore, Florida experienced significant volatility in real estate prices with home prices decreasing by approximately 50% from peak to trough in Miami, Orlando, and Tampa. These factors along with disruption in the credit markets and decreased availability of financing for commercial borrowers in Florida resulted in low consumer confidence, depressed real estate markets and a regional economic performance that trailed the United States as a whole. These conditions may continue or worsen in Florida, even if the general economic conditions in the United States show continued signs of improvement. In addition, the Florida economy is largely dependent on the tourism industry. If there is a significant decline in tourism, the resulting economic effect could have a material negative impact on our operating results by reducing our growth prospects, affecting the ability of our customers to repay their loans to us and generally adversely affecting our financial condition.
As of December 31, 2014, approximately 39.6% of our loan portfolio was secured by commercial properties and approximately 30.0% of our loan portfolio was secured by 1-4 single family residential properties located primarily in Florida. A substantial portion of our future loan activities may involve commercial and residential properties in Florida. A concentration of our loans in Florida subjects us to the risk that a failure of the Florida economy to recover or a further downturn could result in a lower than expected loan origination volume and higher than expected delinquency and foreclosure rates or losses on loans. Further, if Florida real estate markets do not recover, it will become more difficult and costly for us to liquidate foreclosed properties. The occurrence of a natural disaster in Florida, such as a hurricane, tropical storm or other severe weather event, or a manmade disaster could negatively impact regional economic conditions, cause a decline in the value or destruction of mortgaged properties and an increase in the risk of delinquencies, foreclosures or loss on loans originated by us, damage our banking facilities and offices and negatively impact our growth strategy. In addition, many residents and businesses in Florida have incurred significantly higher property and casualty insurance premiums on their properties which have and may continue to adversely affect real estate sales and values in our markets. We may suffer further losses due to the decline in the value of the properties underlying our mortgage loans, which could have a material adverse impact on our operations. Any individual factor or a combination of factors could materially negatively impact our business, financial condition, results of operations and prospects. A high rate of foreclosures or loan delinquencies, particularly if those loans were not covered by loss sharing agreements, could have a material adverse effect on our operations and our business.
Changes in national and local economic conditions could lead to higher loan charge-offs which could have a material adverse impact on our business.
Although the loan portfolios acquired in the Old Failed Bank acquisitions have been initially accounted for at fair value, impairment may result in additional charge-offs to the portfolio. The fluctuations in national, regional and local economic conditions, including those related to local residential, commercial real estate and construction markets, may increase the level of charge-offs that we make to our loan portfolio, including any loans we originate or acquire in the future, and, consequently, reduce our net income. These fluctuations are not predictable, cannot be controlled and may have a material adverse impact on our operations and financial condition even if other favorable events occur.
25
Table of Contents
Index to Financial Statements
Many of our loans are to commercial borrowers, which have a higher degree of risk than other types of loans.
As of December 31, 2014, commercial and industrial loans constituted $876.0 million, or 22.3%, and commercial real estate loans constituted $1.56 billion, or 39.6% of our total loan portfolio. We expect that over time, new loan originations will be more focused on commercial and industrial loans. To the extent that the Bank extends credit to commercial borrowers (both commercial and industrial borrowers and commercial real estate borrowers) such loans may involve greater risks than other types of lending. Because payments on such loans are often dependent on the successful operation or development of the property or business involved, repayment of such loans is more sensitive than other types of loans to adverse conditions in the real estate market or the general economy. Unlike residential mortgage loans, which generally are made on the basis of the borrowers’ ability to make repayment from their employment and other income and which are secured by real property whose value tends to be more easily ascertainable, commercial loans typically are made on the basis of the borrowers’ ability to make repayment from the cash flow of the related commercial venture. If the cash flow from business operations is reduced, the borrower’s ability to repay the loan may be impaired. Due to the larger average size of a commercial loan in comparison to other loans such as residential loans, as well as the collateral which is generally less readily-marketable, losses incurred on a small number of commercial loans, to the extent not covered by FDIC loss share arrangements, could have a material adverse impact on our financial condition and results of operations. In addition, commercial loan customers often have the ability to fund current interest payments through additional borrowings, and as a result the actual credit risk associated with these customers may be worse than anticipated.
The performance of our residential loan portfolio depends in part upon a third-party service provider and a failure by this third party to perform its obligations could adversely affect our results of operations or financial condition.
Substantially all of our residential loans are serviced by Dovenmuehle Mortgage, Inc., or DMI, which provides both primary servicing and special servicing. Primary servicing includes the collection of regular payments, processing of taxes and insurance, processing of payoffs, handling borrower inquiries and reporting to the borrower. Special servicing is focused on borrowers who are delinquent or on loans which are more complex or in need of more hands-on attention. If the housing market worsens, the number of delinquent mortgage loans serviced by DMI could increase. In the event that DMI, or any third-party servicer we may use in the future, fails to perform its servicing duties or performs those duties inadequately, we could experience a temporary interruption in collecting principal and interest, sustain credit losses on our loans or incur additional costs associated with obtaining a replacement servicer. Any of these events could have a material adverse impact on our results of operations or financial condition. Similarly, if DMI or any future third-party mortgage loan servicer becomes ineligible, unwilling or unable to continue to perform servicing activities, we could incur additional costs to obtain a replacement servicer and there can be no assurance that a replacement servicer could be retained in a timely manner or at similar rates.
We are exposed to risk of environmental liabilities with respect to properties to which we take title.
In the course of our business, we may own or foreclose and take title to real estate, and we could become subject to environmental liabilities with respect to these properties. We may be held liable to a governmental entity or to third parties for property damage, personal injury, investigation and clean-up costs incurred by these parties in connection with environmental contamination, or we may be required to investigate or clean up hazardous or toxic substances or chemical releases at a property. The costs associated with investigation or remediation activities could be substantial. In addition, if we were to become the owner or former owner of a contaminated site, we may be subject to common law claims by third parties based on damages and costs resulting from environmental contamination emanating from the property. If we ever become subject to significant environmental liabilities, our business, financial condition, liquidity and results of operations could be materially and adversely affected.
26
Table of Contents
Index to Financial Statements
We may be subject to losses due to the errors or fraudulent behavior of employees or third parties.
We are exposed to many types of operational risk, including the risk of fraud by employees and outsiders, clerical recordkeeping errors and transactional errors. Our business is dependent on our employees as well as third-party service providers to process a large number of increasingly complex transactions. We could be materially adversely affected if one of our employees causes a significant operational breakdown or failure, either as a result of human error or where an individual purposefully sabotages or fraudulently manipulates our operations or systems. When we originate loans, we rely upon information supplied by loan applicants and third parties, including the information contained in the loan application, property appraisal and title information, if applicable, and employment and income documentation provided by third parties. If any of this information is misrepresented and such misrepresentation is not detected prior to loan funding, we generally bear the risk of loss associated with the misrepresentation. Any of these occurrences could result in a diminished ability of us to operate our business, potential liability to customers, reputational damage and regulatory intervention, which could negatively impact our business, financial condition and results of operations.
Our deposit insurance premiums could be substantially higher in the future, which could have a material adverse effect on our future earnings.
The FDIC insures deposits at FDIC-insured depository institutions, such as the Bank, up to applicable limits. The amount of a particular institution’s deposit insurance assessment is based on that institution’s risk classification under an FDIC risk-based assessment system. An institution’s risk classification is assigned based on its capital levels and the level of supervisory concern the institution poses to its regulators. Recent market developments and bank failures significantly depleted the FDIC’s deposit insurance fund, or DIF, and reduced the ratio of reserves to insured deposits. As a result of recent economic conditions and the enactment of the Dodd-Frank Act, banks are now assessed deposit insurance premiums based on the bank’s average consolidated total assets, and the FDIC has modified certain risk-based adjustments which increase or decrease a bank’s overall assessment rate. This has resulted in increases to the deposit insurance assessment rates and thus raised deposit premiums for insured depository institutions. If these increases are insufficient for the DIF to meet its funding requirements, further special assessments or increases in deposit insurance premiums may be required. We are generally unable to control the amount of premiums that we are required to pay for FDIC insurance. If there are additional bank or financial institution failures, we may be required to pay even higher FDIC premiums than the recently increased levels. Any future additional assessments, increases or required prepayments in FDIC insurance premiums could reduce our profitability, may limit our ability to pursue certain business opportunities, or otherwise negatively impact our operations.
Changes in interest rates could negatively impact our net interest income, weaken demand for our products and services or harm our results of operations and cash flows.
Our earnings and cash flows are largely dependent upon net interest income, which is the difference between interest income earned on interest-earning assets such as loans and securities and interest expense paid on interest-bearing liabilities such as deposits and borrowed funds. Interest rates are highly sensitive to many factors that are beyond our control, including general economic conditions and policies of various governmental and regulatory agencies, particularly the Federal Reserve. Changes in monetary policy, including changes in interest rates, could influence the interest we receive on loans and securities and the amount of interest we pay on deposits and borrowings, but such changes could also adversely affect (1) our ability to originate loans and obtain deposits, (2) the fair value of our financial assets and liabilities, (3) our ability to realize gains on the sale of assets and (4) the average duration of our mortgage-backed investment securities portfolio. An increase in interest rates may reduce customers’ desire to borrow money from us as it increases their borrowing costs and may potentially adversely affect their ability to pay the principal or interest on loans. A portion of our loan portfolios are floating rate loans. Consequently, an increase in interest rates may lead to an increase in nonperforming assets and a reduction of income recognized, which could harm our results of operations and cash flows. In contrast, decreasing interest rates may have the effect of causing customers to refinance loans faster than originally anticipated. Any substantial, unexpected or prolonged change in market interest rates could have a material adverse effect on net interest income, asset quality, loan origination volume, financial condition, results of operations and loan prospects.
27
Table of Contents
Index to Financial Statements
The fair value of our investment securities can fluctuate due to market conditions out of our control.
As of December 31, 2014, the fair value of the Company’s investment securities portfolio was approximately $1.43 billion. Factors beyond our control can significantly influence the fair value of securities in our portfolio and can cause potential adverse changes to the fair value of these securities. These factors include but are not limited to rating agency downgrades of the securities, defaults by the issuer or with respect to the underlying securities, changes in market interest rates and continued instability in the credit markets. In addition, we have historically taken a conservative investment approach, with concentrations of government issuances of short duration. In the future, we may seek to increase yields through more aggressive investment strategies, which may include a greater percentage of corporate issuances and structured credit products. Any of these mentioned factors, among others, could cause other- than-temporary impairments in future periods and result in realized losses, which could have a material adverse effect on our business.
Any requested or required changes in how we determine the impact of loss share accounting on our financial information could have a material adverse effect on our reported results.
Our financial results are significantly affected by the application of loss share accounting, which is subject to assumptions and judgments made by us and the regulatory agencies to whom we report such information. Loss share accounting is a complex accounting methodology. To the extent future performance differs from our assumptions, the change or modification could have a material adverse effect on our financial condition, operations or our previously reported results. As such, any financial information generated through the use of loss share accounting is subject to modification or change. Any significant modification or change in such information could have a material adverse effect on our results of operations and our previously reported results.
Our financial information reflects the application of acquisition accounting. Any change in the assumptions used in such methodology could have an adverse effect on our results of operations.
As we acquired substantially all of our operating assets and assumed substantially all of our liabilities from third parties, our financial results are heavily influenced by the application of acquisition accounting. Acquisition accounting requires management to make assumptions regarding the assets purchased and liabilities assumed to determine their fair market value. If these assumptions are incorrect, any change or modification required could have a material adverse effect on our financial condition, operations or our previously reported results.
We depend on our senior management team, and the unexpected loss of one or more of our senior executives could adversely affect our business and financial results.
Our future success significantly depends on the continued services and performance of our key management personnel and our future performance will depend on our ability to motivate and retain these and other key personnel. The loss of the services of members of our senior management, or other key employees, or the inability to attract additional qualified personnel as needed, could materially and adversely affect our businesses and our consolidated results of operations and financial condition.
We may not be able to maintain a strong core deposit base or other low-cost funding sources.
We depend on checking, savings and money market deposit account balances and other forms of customer deposits as our primary source of funding for our lending activities. Our future growth will largely depend on our ability to maintain and grow a strong deposit base. We are also working to transition certain of our customers to lower cost traditional banking services as higher cost funding sources, such as high interest certificates of deposit, mature. There is no assurance customers will transition to lower yielding savings and investment products or continue their business with the Bank, which could adversely affect our operations. Further, even if we are able to grow and maintain our deposit base, the account and deposit balances can decrease when customers perceive alternative investments, such as the stock market, as providing a better risk/return tradeoff. If customers move money out of bank deposits and into investments (or similar deposit products at other institutions that may provide a higher rate of return), we could lose a relatively low cost source of funds, increasing our funding costs and reducing our net interest income and net income. Additionally, any such loss of funds could result in lower loan originations, which could materially negatively impact our growth strategy.
28
Table of Contents
Index to Financial Statements
We may not be able to meet the cash flow requirements of our depositors and borrowers if we do not maintain sufficient liquidity.
Liquidity is the ability to meet current and future cash flow needs on a timely basis at a reasonable cost. The Bank’s liquidity is used to make loans and to repay deposit liabilities as they become due or are demanded by customers. Potential alternative sources of liquidity include federal funds purchased and securities sold under repurchase agreements. The Bank maintains a portfolio of investment securities that may be used as a secondary source of liquidity to the extent the securities are not pledged for collateral. However, we do not expect to maintain our current level of investment securities (relative to the size of our business) as we pursue our acquisition growth strategy. Other potential sources of liquidity include the sale or securitization of loans, the utilization of available government and regulatory assistance programs, the ability to acquire national market non-core deposits, the issuance of additional collateralized borrowings such as FHLB, advances, the issuance of debt securities, issuance of equity securities and borrowings through the Federal Reserve’s discount window. However, there can be no assurance that these sources will continue to be available to us on terms acceptable to us or at all. Although we currently have sufficient liquidity to meet the anticipated cash flow requirements of our depositors and borrowers, there is no guarantee that we will continue to maintain such liquidity. Without sufficient liquidity, we may not be able to meet the cash flow requirements of our depositors and borrowers, which in turn could have a material adverse impact on our operations.
The borrowing needs of our clients may be unpredictable, especially during a challenging economic environment. We may not be able to meet our unfunded credit commitments, or adequately reserve for losses associated with our unfunded credit commitments, which could have a material adverse effect on our business, financial condition, results of operations and reputation.
A commitment to extend credit is a formal agreement to lend funds to a client as long as there is no violation of any condition established under the agreement. The actual borrowing needs of our clients under these credit commitments have historically been lower than the contractual amount of the commitments. A significant portion of these commitments expire without being drawn upon. Because of the credit profile of our clients, we typically have a substantial amount of total unfunded credit commitments, which is reflected off our balance sheet. Actual borrowing needs of our clients may exceed our expected funding requirements, especially during a challenging economic environment when our client companies may be more dependent on our credit commitments due to the lack of available credit elsewhere, the increasing costs of credit, or the limited availability of financings from venture firms. In addition, limited partner investors of our venture capital clients may fail to meet their underlying investment commitments due to liquidity or other financing issues, which may increase our clients’ borrowing needs. Any failure to meet our unfunded credit commitments in accordance with the actual borrowing needs of our clients may have a material adverse effect on our business, financial condition, results of operations and reputation.
An inadequate allowance for loan losses (“ALL”) would reduce our earnings.
Neither the loans acquired from Old Sunshine, Old FPB, or Great Florida Bank, nor any loan we originate (including loans in which we participate), are covered by any loss sharing arrangement with the FDIC. As we increase our loan origination and other product offerings, the percentage of assets not covered by the FDIC loss sharing agreements that make up our loan portfolio will increase. As such, the long-term success of our business will be largely attributable to the quality of our assets, particularly newly-originated loans. The risk of loss on originated loans not covered by FDIC loss sharing agreements that we hold on our balance sheet will vary with, among other things, general economic conditions, the relative product mix of loans being made, the creditworthiness of the borrower over the term of the loan and, in the case of a collateralized loan, the quality of the collateral for the loan. For our new loans, we will maintain an allowance for loan losses, or ALL, based on, among other things, historical rates, an evaluation of economic conditions, regular reviews of delinquencies and loan portfolio quality, and regulatory requirements. We account for loans acquired through business combination with deteriorated credit quality since origination under Financial Accounting Standards Board, or FASB, Accounting Standards Codification, or ASC, Topic 310-30, Loans and Debt Securities Acquired with Deteriorated Credit Quality, or ASC 310-30. For ASC 310-30 pools, a specific valuation allowance is established when it is probable that the Company will be unable to collect all of the cash flows expected at the acquisition date, plus the additional cash flows expected to be collected arising from changes in estimates after acquisition. Based upon the foregoing factors, we make assumptions and judgments about the ultimate collectability of loans and provide an allowance for probable loan losses based upon a percentage of the outstanding balances and for specific loans when their ultimate collectability is considered questionable. If any of these assumptions are incorrect, it could have a material adverse effect on our earnings.
29
Table of Contents
Index to Financial Statements
If borrowers and guarantors fail to perform as required by the terms of their loans, we will sustain losses.
Over time, as a more significant portion of our loan portfolio consists of loans originated by us or are otherwise not covered by any loss sharing arrangement, a significant source of risk arises from the possibility that losses will be sustained if the Bank’s borrowers and guarantors fail to perform in accordance with the terms of their loans and guaranties. This risk increases when the economy is weak. We have implemented underwriting and credit monitoring procedures and credit policies, including the establishment and review of the ALL, that we believe are appropriate to reduce this risk by assessing the likelihood of nonperformance and we are in the process of diversifying our credit portfolio. These policies and procedures, however, may not prevent unexpected losses that could materially adversely affect our results of operations.
Lack of seasoning of our loan portfolio may increase the risk of credit defaults in the future.
Due to the growth of the Bank over the past several years, a portion of the loans in our loan portfolio and our lending relationships are of relatively recent origin. As of December 31, 2014, loans included in our new loan portfolio that were originated within the previous 24-month period totaled $2.63 billion, or 84.8%, of total new loans held by the Company. In general, loans do not begin to show signs of credit deterioration or default until they have been outstanding for some period of time, a process we refer to as “seasoning.” As a result, a portfolio of older loans will usually behave more predictably than a portfolio of newer loans. Because our loan portfolio is relatively new, the current level of delinquencies and defaults may not be representative of the level that will prevail when the portfolio becomes more seasoned, which may be higher than current levels. If delinquencies and defaults increase, we may be required to increase our provision for loan losses, which would adversely affect our results of operations and financial condition.
Our acquisition of assets and assumption of deposits and other liabilities of failed banks involve a number of special risks.
Our acquisition of certain assets and assumption of certain liabilities of each of the Old Failed Banks followed the determination by these banks’ primary regulators that such banks had failed and the appointment of the FDIC as receiver. Although FDIC-assisted transactions mitigate certain risks, such as sharing exposure to loan losses and providing indemnification against certain liabilities of the failed institution (other than the acquisitions related to Old Sunshine and Old FPB), we are (and could be with respect to the Great Florida Acquisition and future similar transactions) subject to many of the same risks we would face in acquiring a non-failed bank in a negotiated transaction, including risks associated with stability of the deposit base, maintaining customer relationships and failure to realize the anticipated acquisition benefits in the amounts and within the timeframes we expect. In addition, because these acquisitions were conducted by the FDIC in a manner that did not allow us the time and access to information normally associated with preparing for and evaluating a negotiated acquisition, we may face additional risks, including additional strain on management resources, management of problem loans, integration of personnel and operating systems and impact to our capital resources requiring us to raise additional capital.
There may be key employees that have more knowledge or expertise about the history, region or past practices of the Old Failed Banks. Such key employees may also have important relationship ties with the community and one or more significant existing or potential customers. If we lose such key employees or if we fail to attract qualified personnel to meet our needs, our ability to continue to maintain and grow our businesses may suffer and our consolidated results of operations and financial condition may be materially and adversely impacted.
There is no assurance that we will be successful in overcoming these risks or any other problems encountered in connection with our FDIC-assisted transactions. Further, we may determine even in the context of future acquisitions of failed banks from the FDIC to acquire such banks without the benefit of loss share protection, in whole or in part. Our inability to overcome these risks could have a material adverse effect on our business, financial condition and operations.
30
Table of Contents
Index to Financial Statements
We are dependent on our information technology and telecommunications systems and third-party servicers, and systems failures, interruptions or breaches of security could have a material adverse effect on our financial condition and results of operations.
Our business is highly dependent on the successful and uninterrupted functioning of our information technology and telecommunications systems and third-party servicers. We outsource many of our major systems, such as data processing, loan servicing and deposit processing systems. The failure of these systems, or the termination of a third-party software license or service agreement on which any of these systems is based, could interrupt our operations. Because our information technology and telecommunications systems interface with and depend on third-party systems, we could experience service denials if demand for such services exceeds capacity or such third-party systems fail or experience interruptions. If sustained or repeated, a system failure or service denial could result in a deterioration of our ability to process new and renewal loans, gather deposits and provide customer service, compromise our ability to operate effectively, damage our reputation, result in a loss of customer business and/or subject us to additional regulatory scrutiny and possible financial liability, any of which could have a material adverse effect on our financial condition and results of operations.
In addition, we provide our customers the ability to bank remotely, including online over the Internet. The secure transmission of confidential information is a critical element of remote banking. Our network could be vulnerable to unauthorized access, computer viruses, phishing schemes, spam attacks, human error, natural disasters, power loss and other security breaches. We may be required to spend significant capital and other resources to protect against the threat of security breaches and computer viruses, or to alleviate problems caused by security breaches or viruses. Further, we outsource some of the data processing functions used for remote banking, and accordingly we are dependent on the expertise and performance of our third-party providers. To the extent that our activities, the activities of our customers, or the activities of our third-party service providers involve the storage and transmission of confidential information, security breaches and viruses could expose us to claims, litigation and other possible liabilities. Any inability to prevent security breaches or computer viruses could also cause existing customers to lose confidence in our systems and could adversely affect our reputation, results of operations and ability to attract and maintain customers and businesses. In addition, a security breach could also subject us to additional regulatory scrutiny, expose us to civil litigation and possible financial liability and cause reputational damage.
We rely on third parties to provide us with a variety of financial service products to offer our customers.
We rely on third parties, including Elan Services, Raymond James Financial Services and PNC Financial Services Group, or PNC Financial, who provide us with a variety of financial service products such as derivative and trade finance products, including interest rate swaps, as well as the offering of various investment related products for our retail customers. Any failure by such third parties to continue to provide, and any interruption in our ability to continue to offer, such products to our customers could have a material adverse effect on our results of operations.
We face strong competition from financial services companies and other companies that offer banking services which could negatively affect our business.
We currently conduct our banking operations primarily in Miami-Dade, Broward, Collier, Lee, Hendry, Charlotte, Palm Beach, Volusia, Sarasota, Orange, Seminole, Brevard, Hernando, St. Lucie, Martin and Indian River counties, all of which are located in Florida. We may not be able to compete successfully against current and future competitors, which may result in fewer customers and reduced loans and deposits. Many competitors offer banking services identical to those offered by us in our service areas. These competitors include national banks, regional banks and community banks. We also face competition from many other types of financial institutions, including without limitation, savings and loan institutions, finance companies, brokerage firms, insurance companies, credit unions, mortgage banks and other financial intermediaries. Some of these competitors may have a long history of successful operations in our markets and have greater ties to local businesses and banking relationships, as well as a more well-established depositor base. Competitors with greater resources may possess an advantage by being capable of maintaining numerous banking locations in more convenient locations, owning more ATMs and conducting extensive promotional and advertising campaigns or operating at a lower fixed-cost basis through the Internet.
31
Table of Contents
Index to Financial Statements
Additionally, banks and other financial institutions with larger capitalizations and financial intermediaries (some of which are not subject to bank regulatory restrictions) have larger lending limits than we have and thereby are able to serve the credit needs of larger customers. Specific areas of competition include interest rates for loans and deposits, efforts to obtain deposits and range and quality of products and services provided, including new technology-driven products and services. Technological innovation continues to contribute to greater competition in domestic and international financial services markets as technological advances enable more companies to provide financial services. Non-local banks with web-based banking are able to compete for business, further increasing competition without having a physical presence in the Florida market.
Our ability to compete successfully depends on a number of factors, including, among other things:
| • | The ability to develop, maintain and build upon long-term customer relationships based on quality service, high ethical standards and safe, sound assets; |
| • | The ability to expand our market position; |
| • | The scope, relevance and pricing of products and services offered to meet customer needs and demands; |
| • | The rate at which we introduce new products and services relative to our competitors; and |
| • | Customer satisfaction with our level of service. |
Failure to perform in any of these areas could significantly weaken our competitive position, which could adversely affect our growth and profitability, which, in turn, could materially harm our business, financial condition, results of operations and prospects.
The Bank’s ability to pay dividends or lend funds to us is subject to regulatory limitations, which, to the extent we are not able to access those funds, may impair our ability to accomplish our growth strategy and pay our operating expenses.
We have never paid a cash dividend; however, we may pay a cash dividend or acquire shares of our own stock in the future. The payment of dividends or acquisition of our own stock in the future, if any, will be contingent upon our revenues and earnings, if any, capital requirements and our general financial conditions. We are a bank holding company and accordingly, any dividends paid by us or the acquisition of our own shares is subject to various federal and state regulatory limitations. Since we are a bank holding company with no significant assets other than the capital stock of our banking subsidiary, if we exhaust the capital raised in our initial public offering and our prior offerings, we will need to depend upon dividends from the Bank for substantially all of our income or raise capital through future offerings. Accordingly, at such time, our ability to pay dividends to our stockholders or acquire shares of our own stock will depend primarily upon the receipt of dividends or other capital distributions from the Bank. The Bank’s ability to pay dividends to us is subject to, among other things, its earnings, financial condition and need for funds, as well as applicable governmental policies and regulations, which limit the amount that may be paid as dividends without prior approval. As such, we will have no ability to rely on dividends from the Bank. As a result, you may only receive a return on your investment in shares of our Class A Common Stock if its market price increases. See “Supervision and Regulation—Regulatory Limits on Dividends and Distributions.”
Risks Related to Future Acquisitions
Future growth and expansion opportunities through acquisition involve risks and may not be successful, and our market value and profitability may suffer.
Growth through acquisitions of banks in open or FDIC-assisted transactions, as well as the selective acquisition of assets, deposits and branches, represent an important component of our business strategy. Any future acquisitions will be accompanied by the risks commonly encountered in any acquisitions. These risks include, among other things: credit risk associated with the acquired bank’s loans and investments; difficulty of integrating operations; retaining and integrating key personnel; and potential disruption of our existing business. We expect that competition for suitable acquisition targets may be significant. We cannot assure you that we will be able to successfully identify and acquire suitable acquisition targets on terms and conditions we consider to be acceptable.
Failed bank acquisitions involve risks similar to acquiring open banks even though the FDIC might provide assistance to mitigate certain risks, such as sharing in exposure to loan losses and providing indemnification against certain liabilities of the failed institution. However, because these acquisitions are typically conducted by the FDIC
32
Table of Contents
Index to Financial Statements
in a manner that does not allow the time typically taken for a due diligence review or for preparing the integration of an acquired institution, we may face additional risks in transactions with the FDIC. These risks include, among other things, accuracy or completeness of due diligence materials, the loss of customers and core deposits, strain on management resources related to collection and management of problem loans and problems related to integration and retention of personnel and operating systems. There can be no assurance that we will be successful in overcoming these risks or any other problems encountered in connection with acquisitions (including FDIC-assisted transactions), nor that any FDIC-assisted opportunities will be available to the Bank in the Bank’s market. Our inability to overcome these risks could have a material adverse effect on our ability to achieve our business strategy and maintain our market value and profitability.
Competitive and regulatory dynamics may make FDIC-assisted acquisition opportunities unacceptable to us.
Our business strategy includes the consideration of potential acquisitions of failing banks that the FDIC plans to place in receivership. The FDIC may not place banks that meet our strategic objectives into receivership. Failed bank transactions are attractive opportunities in part because of loss sharing arrangements with the FDIC that limit the acquirer’s downside risk on the purchased loan portfolio and, apart from our assumption of deposit liabilities, we have significant discretion as to the non-deposit liabilities that we assume. In addition, assets purchased from the FDIC are marked to their fair value and in many cases there is little or no addition to goodwill arising from an FDIC-assisted transaction.
The bidding process for failing banks in our desired markets has become very competitive, and the increased competition may make it more difficult for us to bid on terms we consider to be acceptable. Our prior acquisitions should be viewed in the context of the recent opportunities available to us as a result of the confluence of our access to capital at a time when market dislocations of historical proportions resulted in what we perceived as attractive asset acquisition opportunities.
Additionally, pursuant to the FDIC Policy, we are subject to significant regulatory burdens as a result of having previously acquired failed banks, including heightened capital requirements. For specific details of these requirements and restrictions see “Supervision and Regulation—FDIC Statement of Policy on Qualifications for Failed Bank Acquisitions.” The FDIC has informed us that these requirements and restrictions of the FDIC Policy could be extended or reinstated if we complete additional failed bank acquisitions. As a result, we would consult closely with the FDIC prior to making any bid for a failed bank. It is possible that these regulatory burdens would make any failed bank acquisition undesirable and we would not place a bid. As economic and regulatory conditions change, we may be unable to execute this aspect of our growth strategy, which could impact our future earnings, reputation and results of operations.
As a result of acquisitions, we may be required to take write-downs or write-offs, as well as restructuring and impairment or other charges that could have a significant negative effect on our financial condition and results of operations.
We have conducted diligence in connection with our past acquisitions and must conduct due diligence investigations of any potential acquisition targets. Intensive due diligence is time consuming and expensive due to the operations, accounting, finance and legal professionals who must be involved in the due diligence process and the fact that such efforts do not always lead to a consummated transaction. Even if we conduct extensive due diligence on an entity we decide to acquire, this diligence may not reveal all material issues that may affect a particular entity. In addition, factors outside the control of the entity and outside of our control may later arise. If, during the diligence process, we fail to identify issues specific to an entity or the environment in which the entity operates, we may be forced to later write down or write off assets, restructure our operations, or incur impairment or other charges that could result in other reporting losses. In addition, charges of this nature may cause us to violate net worth or other covenants to which we may become subject if we obtain debt financing. The diligence process in failed bank transactions is also expedited due to the short acquisition timeline that is typical for failing depository institutions. There can be no assurance that we will not have to take write-downs or write-offs in connection with the acquisitions of certain of the assets and assumption of certain liabilities of each of the Old Banks, or any depository institution which we later acquire, a portion of which may not be covered by loss sharing agreements.
33
Table of Contents
Index to Financial Statements
We may acquire entities with significant leverage, increasing the entity’s exposure to adverse economic factors.
Our future acquisitions could include entities whose capital structures may have significant leverage. Although we will seek to use leverage in a manner we believe is prudent, any leveraged capital structure of such investments will increase the exposure of the acquired entity to adverse economic factors such as rising interest rates, downturns in the economy or deteriorations in the condition of the relevant entity or their industries. If an entity cannot generate adequate cash flow to meet its debt obligations, we may suffer a partial or total loss of capital invested in such entity. To the extent there is not ample availability of financing for leveraged transactions (e.g., due to adverse changes in economic or financial market conditions or a decreased appetite for risk by lenders); our ability to consummate certain transactions could be impaired.
Risks Related to the Regulation of Our Industry
We operate in a highly regulated environment and, as a result, are subject to extensive regulation and supervision that could adversely affect our financial performance and our ability to implement our business strategy.
We are subject to extensive regulation, supervision and legislation that govern almost all aspects of our operations. Regulatory bodies are generally charged with protecting the interests of customers, depositors and the deposit insurance fund, or DIF (but not holders of our securities, such as our Class A Common Stock) and the integrity and stability of the U.S. financial system as a whole. The laws and regulations, to which we are subject, among other things, prescribe minimum capital requirements, impose limitations on our business activities and restrict the Bank’s ability to guarantee our debt and engage in certain transactions with us. As discussed herein, if we continue to grow, we may become subject to additional regulatory requirements and supervision, which could increase our costs or limit our ability to pursue our business strategy. Further, our failure to comply with any laws or regulations applicable to us could subject us to restrictions on our business activities, fines and other penalties, any of which could adversely affect our results of operations, cash flows and financial condition.
The Bank and, with respect to certain provisions, the Company has been subject to an Order of the FDIC, dated January 22, 2010, or the Order, issued in connection with the FDIC’s approval of the Bank’s application for deposit insurance. Prior to December 17, 2014, the Bank was also subject to the OCC Agreement entered into in connection with the acquisition of Old Premier. A failure to comply with the requirements of the Order, or our inability to obtain the non-objection of the OCC to certain transactions or changes in our strategy, could prevent us from executing our business strategy and materially and adversely affect our business, results of operations and financial condition. See “Supervision and Regulation—The Bank as a National Bank” for additional information on the Order and the OCC Agreement.
Federal bank regulatory agencies periodically conduct examinations of us and the Bank, including for compliance with laws and regulations, and our failure to comply with any supervisory actions to which we are or become subject as a result of such examinations may adversely affect us.
The Federal Reserve may conduct examinations of our business and any nonbank subsidiary, including for compliance with applicable laws and regulations. In addition, the OCC periodically conducts examinations of the Bank, including for compliance with applicable laws and regulations. If, as a result of an examination, the Federal Reserve or the OCC determines that the financial condition, capital resources, asset quality, asset concentrations, earnings prospects, management, liquidity, sensitivity to market risk, or other aspects of any of our or the Bank’s operations are unsatisfactory, or that we or our management are in violation of any law, regulation or guideline in effect from time to time, the Federal Reserve or the OCC may take a number of different remedial actions, including the power to enjoin “unsafe or unsound” practices, to require affirmative actions to correct any conditions resulting from any violation or practice, to issue an administrative order that can be judicially enforced, to direct an increase in our or the Bank’s capital, to restrict our growth, to change the composition of our concentrations in portfolio or balance sheet assets, to assess civil monetary penalties against officers or directors, to remove officers and directors and, if such conditions cannot be corrected or there is an imminent risk of loss to depositors, the FDIC may terminate the Bank’s deposit insurance. Further, either the OCC or the FDIC may determine at any time to preclude us from participation in the bidding for failed banks or from acquiring banks in open bank transactions.
34
Table of Contents
Index to Financial Statements
The Federal Reserve may require us to commit capital resources to support the Bank.
As a matter of policy, the Federal Reserve has historically expected a bank holding company to act as a source of financial and managerial strength to a subsidiary bank and to commit resources to support its subsidiary bank. Under the “source of strength” doctrine, which the Dodd-Frank Act codified as a statutory requirement, the Federal Reserve may require a bank holding company to make capital injections into a troubled subsidiary bank and may charge the bank holding company with engaging in unsafe and unsound practices for failure to commit resources to such a subsidiary bank. Under this requirement, in the future, we could be required to provide financial assistance to the Bank, including at times when we would otherwise determine not to provide such assistance.
A capital injection may be required at times when we do not have the resources to provide it and therefore we may be required to raise capital or borrow funds. Any loans by a holding company to its subsidiary bank are subordinate in right of payment to deposits and to certain other indebtedness of the subsidiary bank. In the event of a bank holding company’s bankruptcy, the bankruptcy trustee will assume any commitment by the holding company to a federal bank regulatory agency to maintain the capital of a subsidiary bank. Moreover, bankruptcy law provides that claims based on any such commitment will be entitled to a priority of payment over the claims of the holding company’s general unsecured creditors, including the holders of its note obligations. Thus, any borrowing or capital raising that must be done by the holding company in order to make the required capital injection may be difficult and expensive and may adversely impact the holding company’s cash flows, financial condition, results of operations and prospects.
Regulatory developments, in particular the Dodd-Frank Act, have altered the regulatory framework within which we operate.
The key effects of recent regulatory developments, including the Dodd-Frank Act, on our business are changes to regulatory capital requirements, the creation of prescriptive regulatory liquidity requirements, the creation of new regulatory agencies, limitations on federal preemption, changes to deposit insurance assessments, changes to regulation of insured depository institutions, new requirements regarding mortgage loan origination and risk retention, and restrictions on investments in covered funds under the Volcker Rule. These and other changes resulting from regulatory developments may impact the profitability of our business activities, require changes to certain of our business practices, impose more stringent capital, liquidity and leverage requirements, require us to dispose of securities or otherwise adversely affect our business. These changes may also require us to invest significant management attention and resources to evaluate and make any changes necessary to comply with new requirements. Failure to comply with the new requirements may negatively impact our results of operations and financial condition. For additional information on regulatory developments, including the Dodd-Frank Act, see “Supervision and Regulation—Changes in Laws, Regulations, or Policies and the Dodd-Frank Act.”
The Volcker Rule collateralized loan obligation provisions could adversely affect our results of operations or financial condition.
The Volcker Rule restricts our ability to sponsor or invest in covered funds (as defined in the rule) and engage in certain types of proprietary trading. We have investments in special purpose entities that securitize a portfolio of primarily broadly syndicated loans. These entities are called collateralized loan obligations, or CLOs. CLOs are vehicles that, based on the existing characteristics of the securities and the CLO vehicles, are covered by the Volcker Rule and the final rules implementing the Volcker Rule. When the final rules were issued by the Federal Reserve, the final date for conformance of activities covered by the Volcker Rule was July 21, 2015. In April 2014, the Federal Reserve announced that it intends to extend the conformance period by two additional one-year extensions for ownership of certain non-conforming CLO securities, until July 21, 2017. We are continuing to evaluate the impact of the Volcker Rule and the final rules on our business and operations, and we take into account the prohibitions and applicable conformance periods under the Volcker Rule in managing our portfolio of investment securities. As of December 31, 2014, we owned $217.0 million of CLO securities with a weighted average yield of 2.82% that do not conform to the Volcker Rule. If we decide, or are required, to sell these securities, our future net interest income could be adversely impacted if alternative investment opportunities yield a lower rate. Further, if we are not able to continue to hold non-conforming CLO securities, we may be required to recognize losses on CLO securities that we hold or to sell CLO securities at times or prices at which we would otherwise determine not to sell them.
35
Table of Contents
Index to Financial Statements
The federal banking agencies have adopted new capital rules that will require insured depository institutions and their holding companies to hold more capital and have also adopted and proposed new liquidity standards. The impact of the new and proposed rules is uncertain but could be adverse to our business, results of operations or financial condition or the market price of our Class A Common Stock.
In July 2013, the federal banking agencies adopted final rules establishing a new comprehensive capital framework for U.S. banking organizations that substantially revise the risk-based capital requirements applicable to bank holding companies and their depository institution subsidiaries, including us and the Bank, as compared to the current U.S. general risk-based capital rules. For institutions such as us and the Bank, the rules phase in over time beginning January 1, 2015, and the increased minimum capital ratios will be fully phased in as of January 1, 2019. In October 2013, the federal banking agencies issued a proposal on minimum liquidity standards for globally large, internationally active banking organizations and bank holding companies with $50 billion or more in total consolidated assets, and, in February 2014, the Federal Reserve adopted complementary enhanced liquidity standards for bank holding companies with $50 billion or more in total consolidated assets. Although the October 2013 proposal and February 2014 rules would not apply directly to us, they may inform regulators’ assessments of our or the Bank’s liquidity. See “Supervision and Regulation—Regulatory Capital and Liquidity Requirements” for additional information on the new and proposed rules relating to capital and liquidity.
The application of more stringent capital or liquidity requirements could, among other things, result in lower returns on equity, require us to raise additional capital, alter our funding, increase our holdings of liquid assets or decrease our holdings in certain illiquid assets or limit our ability to make acquisitions, grow our business, pay dividends or repurchase our common stock. Any such impact could have an adverse effect on our business, results of operations or financial condition or the market price of our Class A Common Stock.
We will face additional regulatory requirements if we or the Bank have more than $10 billion in total consolidated assets, which could strain our resources and divert management’s attention.
Certain recent regulatory changes apply only to bank holding companies or depository institutions with more than $10 billion in total consolidated assets. Such changes include requirements to undergo company-run stress tests, establish an enterprise-wide board-level risk committee and develop and implement a compliance program under the Volcker Rule; limitations on debit card interchange fees; increased assessments for FDIC deposit insurance; and direct supervision and examination by the Consumer Financial Protection Bureau. Although we and the Bank each had less than $10 billion in total consolidated assets as of December 31, 2014, our business strategy contemplates additional acquisitions and organic growth, and if we or the Bank have more than $10 billion in total assets, our business and results of operations could be impacted as a result of these additional requirements.
We face a risk of noncompliance and enforcement action with the Bank Secrecy Act and other anti-money laundering statutes and regulations.
The federal Bank Secrecy Act, the Patriot Act, and other laws and regulations require financial institutions, among other duties, to institute and maintain an effective anti-money laundering program and file suspicious activity and currency transaction reports as appropriate. The federal Financial Crimes Enforcement Network, established by the U.S. Department of the Treasury to administer the Bank Secrecy Act, is authorized to impose significant civil money penalties for violations of those requirements, and has recently engaged in coordinated enforcement efforts with the individual federal banking regulators, as well as the U.S. Department of Justice, Drug Enforcement Administration, and Internal Revenue Service. There is also increased scrutiny of compliance with the rules enforced by OFAC. If our policies, procedures and systems are deemed deficient or the policies, procedures and systems of the financial institutions that we have already acquired or may acquire in the future are deficient, we could be subject to liability, including significant fines and other regulatory actions, such as restrictions on our ability to pay dividends and the necessity to obtain regulatory approvals to proceed with certain aspects of our business plan, including our acquisition plans and cost of compliance.
36
Table of Contents
Index to Financial Statements
We and certain of our stockholders are required to comply with the applicable provisions of the FDIC Statement of Policy on Qualifications for Failed Bank Acquisitions.
The Order requires that we, the Bank, our founders and certain of our existing and future stockholders comply with the applicable provisions of the FDIC Policy, including, among others, a higher capital requirement for the Bank, a three-year restriction on the sale or transfer of our securities by certain stockholders subject to the FDIC Policy following our first acquisition of a failed bank from the FDIC following such stockholders’ acquisitions of their securities, limitations on transactions with affiliates and cross-support undertakings by stockholders with an 80% or greater interest in us and one or more other depository institutions. The FDIC Policy applies to certain of our existing stockholders and, subject to certain exceptions, it will apply to any other person (or group of persons acting in concert) that directly or indirectly owns, controls or has the power to vote more than 5% of our Class A Common Stock or is otherwise determined to be engaged in concerted action with other stockholders. The FDIC has informed us that the requirements and restrictions under the FDIC Policy could be extended or reinstated if we complete additional failed bank acquisitions. It is possible that the potential extension or reinstatement of the requirements under the FDIC Policy could make a prospective failed bank acquisition undesirable and that we would, therefore, not place a bid. For example, the FDIC could condition the Bank’s ability to bid on a failed institution on additional stockholders of the Company, including purchasers of our Class A Common Stock, agreeing to be bound by provisions of the FDIC Policy which could be impracticable and could render us unable to bid on a failed institution. We may thus be less able or unable to execute our growth strategy, which could impact our business, results of operations and financial condition. Additionally, the FDIC Policy could discourage third parties from seeking to acquire significant interests in us or attempting to acquire control of us, which could adversely affect the market price of our Class A Common Stock. See “Supervision and Regulation—FDIC Statement of Policy on Qualifications for Failed Bank Acquisitions” for additional information on the requirements imposed by the FDIC Policy.
If we and certain of our stockholders are not in compliance with the applicable provisions of the FDIC Policy, we may be unable to bid on failed institutions in the future.
As the agency responsible for resolving the failure of banks, the FDIC has discretion to determine whether a party is qualified to bid on a failed institution. The FDIC Policy imposes restrictions and requirements on certain institutions—including the Company and the Bank—and our stockholders. If we and certain of our stockholders are not in compliance with the FDIC Policy, then the FDIC may not permit us to bid on a failed institution. As a condition to the Bank’s bidding on a failed institution, the FDIC could require that one or more of our existing or future stockholders, including purchasers of our Class A Common Stock, agree to be bound by provisions of the FDIC Policy. The FDIC Policy includes a three-year prohibition on transfers of our common stock without FDIC consent, which could impact existing or future stockholders. If the FDIC were to take this position, affected stockholders would need to agree to be bound by the FDIC Policy or the Bank would not be permitted to bid on the failed institution. Our inability to bid on failed institutions may limit our ability to grow. See “—Risks Related to the Regulation of Our Industry—We and certain of our stockholders are required to comply with the applicable provisions of the FDIC Statement of Policy on Qualifications for Failed Bank Acquisitions.”
We are subject to the Community Reinvestment Act and fair lending laws, and failure to comply with these laws could lead to material penalties.
The Community Reinvestment Act, or CRA, the Equal Credit Opportunity Act, the Fair Housing Act and other fair lending laws and regulations impose nondiscriminatory lending requirements on financial institutions. The Department of Justice and other federal agencies are responsible for enforcing these laws and regulations. A successful challenge to an institution’s performance under the CRA or fair lending laws and regulations could result in a wide variety of sanctions, including the required payment of damages and civil money penalties, injunctive relief, imposition of restrictions on mergers and acquisitions activity, and restrictions on expansion activity. Private parties may also have the ability to challenge an institution’s performance under fair lending laws in private class action litigation.
37
Table of Contents
Index to Financial Statements
Many of our new activities and expansion plans require regulatory approvals, and failure to obtain them may restrict our growth.
We may seek to complement and expand our business by pursuing strategic acquisitions of the assets and assuming the liabilities of failed banks, banks and other financial institutions. We must generally receive federal regulatory approval before we can acquire an institution or business. In determining whether to approve a proposed acquisition, federal bank regulators will consider, among other factors, the effect of the acquisition on competition, our financial condition, and our future prospects. The regulators also review current and projected capital ratios and levels, the competence, experience, and integrity of management and its record of compliance with laws and regulations, the convenience and needs of the communities to be served (including the acquiring institution’s record of compliance under the CRA) and the effectiveness of the acquiring institution in combating money laundering activities. Such regulatory approvals may not be granted on terms that are acceptable to us, or at all. We may also be required to sell branches as a condition to receiving regulatory approval, which condition may not be acceptable to us or, if acceptable to us, may reduce the benefit of any acquisition.
In addition to the acquisition of financial institutions, as opportunities arise, we plan to continue de novo branching as a part of our organic growth strategy. De novo branching carries with it numerous risks, including the inability to obtain all required regulatory approvals or the branch’s failing to perform as expected. The failure to obtain regulatory approvals for potential de novo branches or the failure of those branches to perform may impact our business plans, restrict our growth and adversely affect our results of operations.
Stockholders may be deemed to be acting in concert or otherwise in control of the Bank, which could impose prior approval requirements and result in adverse regulatory consequences for such holders.
We are a bank holding company regulated by the Federal Reserve. Any entity owning 25% or more of the outstanding shares of any class of our voting securities (such as our Class A Common Stock), or a lesser percentage if such holder otherwise exercises a “controlling influence” over us, may be subject to regulation as a “bank holding company” in accordance with the BHCA. In addition, (1) any bank holding company or foreign bank with a U.S. branch or agency is required to obtain the approval of the Federal Reserve under the BHCA to acquire or retain 5% or more of the outstanding shares of any class of our voting securities (such as our Class A Common Stock) and (2) any person (or group of persons acting in concert) other than a bank holding company may be required to obtain prior regulatory approval under the Change in Bank Control Act to acquire or retain 10% or more of the outstanding shares of any class of our voting securities (such as our Class A Common Stock). Any stockholder that is deemed to “control” the Company for bank regulatory purposes would become subject to prior approval requirements and ongoing regulation and supervision. Such a holder may be required to divest 5% or more of the voting shares of investments that may be deemed incompatible with bank holding company status, such as an investment in a company engaged in non-financial activities. Regulatory determination of “control” of a depository institution or holding company is based on all of the relevant facts and circumstances. Potential investors are advised to consult with their legal counsel regarding the applicable regulations and requirements.
Our common stock owned by holders determined by a bank regulatory agency to be acting in concert would be aggregated for purposes of determining whether those holders have control of a bank or bank holding company. Each stockholder obtaining control would be required to register as a bank holding company. “Acting in concert” generally means knowing participation in a joint activity or parallel action towards the common goal of acquiring control of a bank or a parent company, whether or not pursuant to an express agreement. How this definition is applied in individual circumstances can vary among the various federal bank regulatory agencies and cannot always be predicted with certainty. Many factors can lead to a finding of acting in concert, including where stockholders are: commonly controlled or managed; the holders are parties to an oral or written agreement or understanding regarding the acquisition, voting or transfer of control of voting securities of a bank or bank holding company; the holders each own stock in a bank and are also management officials, controlling stockholders, partners or trustees of another company; or both a holder and a controlling stockholder, partner, trustee or management official of the holder own equity in the bank or bank holding company.
38
Table of Contents
Index to Financial Statements
Risks Related to the Common Stock
There has been a limited public market for our common stock and an active trading market in our common stock may not develop or be sustained.
Because our initial public offering occurred recently, our Class A Common Stock has limited trading history. Although our shares of Class A Common Stock are listed on the New York Stock Exchange, we do not know whether third parties will find our common stock to be attractive or whether firms will be interested in making a market for our common stock and an active trading market in our common stock may not develop or be sustained. As a result, stockholders may be unable to liquidate their investments, or may encounter considerable delay in selling shares of our common stock.
Our Class A Common Stock price could be highly volatile and the market price of our Class A Common Stock could drop unexpectedly.
The market price of our Class A Common Stock could be subject to wide fluctuations in response to, among other things, the following factors:
| • | Our limited time running the operations of the banks from which we have acquired assets and assumed deposits and other liabilities may make it difficult to predict our future prospects and financial performance; |
| • | Any adverse change in the terms of, or loss of coverage under, our loss sharing arrangements with the FDIC; |
| • | The rapid growth and evolution of our business; |
| • | Quarterly variations in our results of operations or the quarterly financial results of companies perceived to be similar to us; |
| • | Changes in estimates of our financial results or recommendations by market analysts; |
| • | Any announcements by us or our competitors of significant acquisitions, strategic alliances or joint ventures, particularly as a result of the highly acquisitive nature of our business; |
| • | Changes in our capital structure, such as future issuances of securities or the incurrence of debt; |
| • | The use of our common stock as consideration in connection with an acquisition; |
| • | Future issuances or sales, or anticipated issuances or sales, of our Class A Common Stock or other securities convertible into or exchangeable or exercisable for our Class A Common Stock; |
| • | Additions or departures of key personnel; |
| • | Investors’ general perception of us; and |
| • | Changes in general economic, industry and market conditions in the United States, Florida or international markets. |
Many of these factors are beyond our control. Any of the foregoing factors could cause the stock price of our Class A Common Stock to fall and may expose us to securities class action litigation. Any securities class action litigation could result in substantial costs and the diversion of management’s attention and resources.
A significant portion of our total outstanding shares may be sold into the public market in the near future, which could cause the market price of our Class A Common Stock to drop.
Our certificate of incorporation provides that we may issue up to 100,000,000 shares of Class A Common Stock, par value $0.001 per share, and 50,000,000 shares of Class B common stock, par value $0.001 per share and 10,000,000 share of preferred stock, par value $0.001 per share. As of December 31, 2014, there were 34,469,650 shares of Class A Common Stock and 6,940,048 shares of Class B Common Stock issued and outstanding and no shares of preferred stock outstanding, which does not include shares held in treasury, shares of common stock reserved for issuance upon the exercise of outstanding options or warrants or additional shares reserved for issuance under our 2013 Stock Incentive Plan. As of December 31, 2014, there are no remaining awards available from the 2009 Option Plan.
39
Table of Contents
Index to Financial Statements
As of December 31, 2014, we had outstanding warrants to purchase 3,310,428 shares of Class A Common Stock, 6,305,750 shares subject to outstanding options, and an aggregate of 329,500 additional shares of common stock reserved for issuance under our 2013 Stock Incentive Plan, all of which are eligible for sale in the public market to the extent permitted by any applicable vesting requirements, and Rule 144 and Rule 701 under the Securities Act of 1933, as amended, or Securities Act.
We cannot predict what effect, if any, future sales of shares of our common stock, or the availability of shares for future sale, may have on the trading price of our Class A Common Stock. Future sales of shares of our common stock by our existing stockholders and other stockholders or by us, or the perception that such sales may occur, could adversely affect the market price of shares of our Class A Common Stock and may make it more difficult for stockholders to sell shares of our Class A Common Stock at a time and price that they determine appropriate. In addition, under most circumstances, our Board of Directors has the right, without stockholder approval, to issue authorized but unissued and non-reserved shares of our common stock. If a substantial number of these shares were issued, it would dilute the existing stockholders’ ownership and may depress the price of our Class A Common Stock. In addition, subject to the rules of the New York Stock Exchange, our Board of Directors has the authority, without stockholder approval, to create and issue additional stock options, warrants and one or more series of preferred stock and to determine the voting, dividend and other rights of the holders of such preferred stock. Depending on the rights, preferences and privileges granted when the preferred stock is issued, it may have the effect of delaying, deferring or preventing a change in control without further action by the stockholders, may discourage bids for our Class A Common Stock at a premium over the market price of the Class A Common Stock and may adversely affect the market price of and voting and other rights of the holders of our Class A Common Stock.
To the extent shares of our common stock or preferred stock are issued, or options or warrants are exercised, investors in our securities may experience further dilution and the presence of such derivative securities may make it more difficult to obtain any future financing. In addition, in the event any future financing should be in the form of, or be convertible into or exchangeable for, equity securities, upon the issuance of such equity securities, investors may experience additional dilution.
Certain of our existing stockholders could exert significant control over the Company and may not make decisions that further the best interests of all stockholders.
As of February 28, 2015, our executive officers, directors and three principal stockholders (holders of greater than 5% of our Class A Common Stock) together control outstanding shares representing, in the aggregate, approximately 32.2% of the presently outstanding shares of our Class A Common Stock (and after giving effect to the exercise of presently outstanding options and warrants could control up to approximately 40.4% of the outstanding shares of Class A Common Stock), including approximately 5.1% of the presently outstanding shares of Class A Common Stock held by Bond Street Investors LLC, in which six of our directors have an ownership interest, and for which three of such directors act as managers of the managing member. As a result, these stockholders, if they act individually or together, may exert a significant degree of influence over our management and affairs and over matters requiring stockholder approval, including the election of directors and approval of significant corporate transactions. Furthermore, the interests of this concentration of ownership may not always coincide with the interests of other stockholders and, accordingly, they could cause us to enter into transactions or agreements which we might not otherwise consider. In addition, this concentration of ownership of the Company’s Class A Common Stock may delay or prevent a merger or acquisition or other transaction resulting in a change in control of the Company even when other stockholders may consider the transaction beneficial, and might adversely affect the market price of our Class A Common Stock.
Provisions in our charter documents, applicable laws and certain provisions of the loss share agreements with the FDIC may prevent or delay a change of control of us and could also limit the market price of our Class A Common Stock.
Certain provisions of Delaware law and applicable regulatory law, and of our certificate of incorporation and bylaws could have the effect of making it more difficult for a third party to acquire, or of discouraging a third party from attempting to acquire, control of us, even if such a change in control would be beneficial to our stockholders or result in a premium for shares of our Class A Common Stock.
40
Table of Contents
Index to Financial Statements
These provisions may also prevent or frustrate attempts by our stockholders to replace or remove our management. These provisions include:
| • | Limitations on the removal of directors; |
| • | The ability of our Board of Directors, without stockholder approval, to issue preferred stock with terms determined by our Board of Directors and to issue additional shares of our common stock; |
| • | Vacancies on our Board of Directors, and any newly created director positions created by the expansion of the Board of Directors, may be filled only by a majority of remaining directors then in office; |
| • | Actions to be taken by our stockholders may only be effected at an annual or special meeting of our Stockholders and not by written consent; |
| • | Advance notice requirements for stockholder proposals and nominations; |
| • | The ability of our Board of Directors to make, alter or repeal our bylaws without stockholder approval; and |
| • | Certain regulatory ownership restrictions imposed on holders of our common stock because we are a bank holding company, as more fully described in “Supervision and Regulation—Regulatory Notice and Approval Requirements” and “Supervision and Regulation—FDIC Statement of Policy on Qualifications for Failed Bank Acquisitions.” |
Moreover, because our Board of Directors has the power to make, alter or repeal our bylaws without stockholder approval, our Board of Directors could amend our bylaws in the future in a manner which could further impact the interests of stockholders or the potential market price of our Class A Common Stock in the future in a manner which could further impact the interests of stockholders in a way they deem unfavorable, or negatively affect the market price of our Class A Common Stock.
Our certificate of incorporation also currently divides our Board of Directors into three classes, with each class serving for a staggered three-year term, which would prevent stockholders from electing an entirely new board of directors at any one annual meeting.
In addition, we are subject to the provisions of Section 203 of the General Corporation Law of the State of Delaware, or DGCL, which limits business combination transactions with stockholders of 15% or more of our outstanding voting stock that our Board of Directors has not approved. These provisions and other similar provisions make it more difficult for stockholders or potential acquirers to acquire us without negotiation. These provisions may apply even if some stockholders may consider the transaction beneficial to them.
Furthermore, banking laws impose notice, approval and ongoing regulatory requirements on any stockholder or other party that seeks to acquire direct or indirect “control” of an FDIC-insured depository institution. These laws include the BHCA and the Change in Bank Control Act. These laws could delay or prevent an acquisition.
In addition, our loss sharing agreements with the FDIC require that in order to maintain loss share coverage we must receive FDIC consent prior to us or certain of our stockholders engaging in certain transactions. When the consent of the FDIC is required under the loss sharing agreements, the FDIC may withhold its consent or may condition its consent on terms that we do not find acceptable. If the FDIC does not grant its consent to a transaction we would like to pursue, or conditions its consent on terms that we do not find acceptable, we may be unable to engage in certain corporate or strategic transactions that might otherwise benefit our stockholders or we may elect to pursue a transaction without obtaining FDIC consent. If we failed to obtain prior FDIC consent and the FDIC withdrew its loss share protection, there could be a material adverse effect on our financial condition, results of operations and cash flows.
These provisions and laws could limit the price that investors are willing to pay in the future for shares of our Class A Common Stock. These provisions might also discourage a potential acquisition proposal or tender offer, even if the acquisition proposal or tender offer is at a premium over the then current market price for our Class A Common Stock.
41
Table of Contents
Index to Financial Statements
Shares of our Class A Common Stock will not be an insured deposit.
An investment in our Class A Common Stock will not be a bank deposit and will not be insured or guaranteed by the FDIC or any other government agency. An investment in our Class A Common Stock will be subject to investment risk, and each investor must be capable of affording the loss of its entire investment.
We are an “emerging growth company” and we cannot be certain if the reduced disclosure requirements applicable to emerging growth companies will make our common stock less attractive to investors.
We are an “emerging growth company,” as defined in the Jumpstart Our Business Startups Act, or JOBS Act. As such, we are eligible to take advantage of certain exemptions from various reporting requirements that are generally unavailable to other public companies. As an emerging growth company:
| • | We are not required to include, in this report audited financial statements for any period prior to the earliest audited period presented in connection with our initial public offering of common equity securities. As such, we are permitted to provide less than five years of selected financial data; |
| • | We are exempt from the requirements to obtain an attestation and report from our auditors on management’s assessment of our internal control over financial reporting under Section 404 of the Sarbanes-Oxley Act of 2002; |
| • | We are permitted to have less extensive disclosure regarding executive compensation in our periodic reports and proxy statements; and |
| • | We are not required to seek from our stockholders a nonbinding advisory vote on executive compensation or golden parachute payments. |
We have elected to take advantage of the scaled disclosure related to financial statement presentation, including less than five years of selected financial data. We have also elected to take advantage of scaled disclosure related to executive compensation. We may continue to take advantage of some or all of the reduced regulatory and reporting requirements that will be available to us as long as we continue to qualify as an emerging growth company. It is possible that some investors could find our common stock less attractive because we may take advantage of these reduced requirements. If some investors find our common stock less attractive, there may be a less active trading market for our common stock and our stock price may be more volatile.
In addition, Section 107 of the JOBS Act also provides that an emerging growth company can take advantage of the extended transition period provided in Section 7(a)(2)(B) of the Securities Act for complying with new or revised accounting standards affecting public companies. In other words, an emerging growth company can delay the adoption of certain accounting standards until those standards would otherwise apply to private companies. We have elected to use the extended transition period provided in Section 7(a)(2)(B) of the Securities Act until the earlier of the date we (i) are no longer an emerging growth company or (ii) affirmatively and irrevocably opt out of the extended transition period provided in Section 7(a)(2)(B). As a result of this election, our financial statements may not be comparable to the financial statements of other public companies.
We could remain an emerging growth company until the earliest to occur of (a) the last day of the fiscal year in which the fifth anniversary of our initial public offering occurred, (b) the last day of the first fiscal year in which our annual gross revenues exceed $1 billion, (c) the date on which we are deemed to be a “large accelerated filer,” which will occur at such time as (i) the market value of our common stock that is held by non-affiliates exceeds $700 million as of the last business day of our most recently completed second fiscal quarter, (ii) we have been required to file annual and quarterly reports under the Securities Exchange Act of 1934, as amended, or Exchange Act, for a period of at least 12 months and (iii) we have filed at least one annual report pursuant to the Exchange Act or (d) the date on which we have issued more than $1 billion in non-convertible debt during the preceding three-year period.
42
Table of Contents
Index to Financial Statements
The requirements of being a public company may strain our resources, divert management’s attention and affect our ability to attract and retain executive management and qualified board members.
As a public company, we are subject to the reporting requirements of the Exchange Act, the Sarbanes-Oxley Act of 2002, the Dodd-Frank Act, the listing requirements of the New York Stock Exchange and other applicable securities rules and regulations. Compliance with these rules and regulations will increase our legal and financial compliance costs, make some activities more difficult, time-consuming or costly and increase demand on our systems and resources, particularly after we are no longer an “emerging growth company.” The Exchange Act requires, among other things, that we file annual, quarterly and current reports with respect to our business and operating results. The Sarbanes-Oxley Act requires, among other things, that we maintain effective disclosure controls and procedures and internal control over financial reporting. In order to maintain and, if required, improve our disclosure controls and procedures and internal control over financial reporting to meet this standard, significant resources and management oversight may be required. As a result, management’s attention may be diverted from other business concerns, including the integration of our acquired banks, which could adversely affect our business and operating results. Although we have already hired additional employees to comply with these requirements, we may need to hire more employees in the future or engage outside consultants, which will increase our costs and expenses.
Item 1B. Unresolved Staff Comments
None.
The Company’s executive offices are located at 2500 Weston Rd. Suite 300, Weston, Florida. The Company currently owns or leases 52 full-service banking locations under the Florida Community Bank brand in 16 Florida counties. Our main operating centers are located in Weston, Florida, Winter Park, Florida and in Naples, Florida. We evaluate our facilities to identify possible under-utilization and to determine the need for functional improvement and relocations. We believe that the facilities we lease are in good condition and are adequate to meet our current operational needs.
From time to time we may be a party to or involved with various legal proceedings, governmental investigations and inquiries, claims and litigation that are incidental to our business. We are not presently party to any legal proceedings the resolution of which we believe would have a material adverse effect on our business, operating results, financial condition or cash flow.
A bank-owned asset in Miami-Dade County was foreclosed in 2012, and later discovered to have been illegally infilled over protected wetlands by the prior owner. The bank has been working with Miami-Dade County environmental agencies to address the situation, along with bank environmental attorneys specializing in this area. We are currently evaluating various alternatives for the remediation which we anticipate will be within the reserves that were allocated to this asset.
The SEC is investigating the valuation and accounting treatment by GFB, prior to the Great Florida Acquisition by us, of an office building acquired by GFB in 2009 and the use of appraisals with respect to such valuation. The Bank is cooperating with the investigation. On the date of acquisition by the Bank, based on the Company’s plans and intended use of the acquired office building, the asset was classified as OREO and recorded at fair value, less estimated selling costs. The fair value of the office building was based on a third party real estate appraisal at the date of acquisition. The Company does not believe that the results of the SEC investigation relating to GFB are likely to have a material adverse effect on the financial condition or results of operations of the Company.
Item 4. Mine Safety Disclosures
Not Applicable.
43
Table of Contents
Index to Financial Statements
Item 5. Market for Registrant’s Common Equity, Related Stockholder Matters and Issuer Purchases of Equity Securities
Our Class A Common Stock has been traded on the New York Stock Exchange, or NYSE, under the symbol “FCB” since August 1, 2014. Prior to that, there was no public trading market for our Class A Common Stock. There is no public trading market for our Class B Non-Voting Common Stock and it is not listed on any stock exchange. The table below shows the high and low sale prices reported by the NYSE for our Class A Common Stock during the periods indicated.
| Market Price Range | ||||||||
| Year Ended December 31, 2014 | High | Low | ||||||
| Third Quarter (from Aug 1, 2014) |
$ | 23.17 | $ | 20.94 | ||||
| Fourth Quarter |
24.86 | 22.27 | ||||||
As of February 28, 2015, we had 34,776,594 shares of Class A Common Stock outstanding (exclusive of 927,312 shares held in treasury) and 6,653,104 shares of Class B Common Stock outstanding (exclusive of 192,132 shares held in treasury). As of February 28, 2015, FCB Financial Holdings, Inc. had approximately 21 and 19 stockholders of record for our Class A Common Stock and Class B Common Stock, respectively.
We have never paid a cash dividend on our common stock; however, our growth plans may provide the opportunity for us to consider a sustainable dividend program at some point in the future. The payment of any dividends is within the discretion of our board of directors. The payment of dividends or the acquisition of our own shares in the future, if any, will be contingent upon our revenues and earnings, if any, capital requirements and our general financial condition. We are a bank holding company and accordingly, any dividends paid by us or acquisitions of our own shares is subject to various federal and state regulatory limitations and also may be subject to the ability of our subsidiary depository institution(s) to make distributions or pay dividends to us. The ability of the Company to pay dividends is limited by minimum capital and other requirements prescribed by law and regulation. Banking regulators have authority to impose additional limits on dividends and distributions by the Company and its subsidiaries. Certain restrictive covenants in future debt instruments, if any, may also limit our ability to pay dividends or the Bank’s ability to make distributions or pay dividends to us. See “Supervision and Regulation—Regulatory Limits on Dividends and Distributions.”
Stock Performance Graph
The stock price performance graph below shall not be deemed incorporated by reference by any general statement incorporating by reference this Form 10-K into any filing under the Securities Act of 1933 or under the Securities Exchange Act of 1934, except to the extent the Company specifically incorporates this information by reference, and shall not otherwise be deemed filed under such Acts.
The following graph compares the cumulative total stockholders’ return on our Class A Common Stock compared to the cumulative total returns for the Standard & Poor’s (S&P) 500 Index and the KBW Bank Index from August 1, 2014 (the date our Class A Common Stock commenced trading on the NYSE) through December 31, 2014. The comparison assumes that $100 was invested on August 1, 2014 in our Class A Common Stock and in each of the indices. The cumulative total return on each investment assumes reinvestment of dividends (if applicable).
44
Table of Contents
Index to Financial Statements
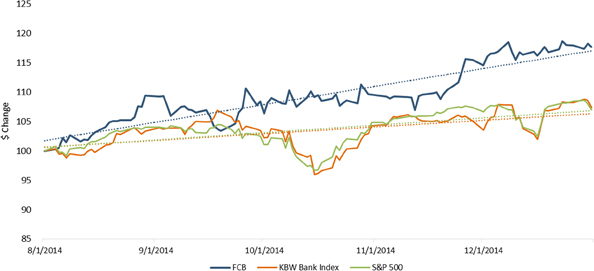
Item 6. Selected Financial Data
The following tables contain certain selected historical consolidated financial data for the periods and as of the dates indicated. You should read this information in conjunction with “Management’s Discussion and Analysis of Financial Condition and Results of Operations” and the consolidated financial statements and the related notes thereto included elsewhere in this report. The selected historical consolidated financial information set forth below as of and for the years ended December 31, 2014, 2013 and 2012 is derived from our audited financial statements included elsewhere in this report. On January 31, 2014, we acquired GFB and their operations are included in the consolidated financial statements from the date of acquisition and therefore may affect the comparability of the information presented below. The selected historical results shown below and elsewhere in this report are not necessarily indicative of our future performance.
45
Table of Contents
Index to Financial Statements
FCB FINANCIAL HOLDINGS, INC. AND SUBSIDIARIES
SELECTED FINANCIAL DATA
(Dollars in thousands, except share and per share data)
| Years Ended December 31, | ||||||||||||
| 2014 | 2013 | 2012 | ||||||||||
| Selected Balance Sheet Data |
||||||||||||
| Total Assets |
$ | 5,957,628 | $ | 3,973,370 | $ | 3,245,061 | ||||||
| New loans |
3,103,417 | 1,770,711 | 729,673 | |||||||||
| Acquired loans ($273,366, $359,255, and $478,176 covered by FDIC loss share, respectively) |
826,173 | 488,073 | 631,641 | |||||||||
| Allowance for loan losses |
(22,880 | ) | (14,733 | ) | (18,949 | ) | ||||||
|
|
|
|
|
|
|
|||||||
| Loans, net |
$ | 3,906,710 | $ | 2,244,051 | $ | 1,342,365 | ||||||
|
|
|
|
|
|
|
|||||||
| FDIC loss share indemnification asset |
$ | 63,168 | $ | 87,229 | $ | 125,949 | ||||||
| Total investment securities |
$ | 1,425,989 | $ | 1,182,323 | $ | 1,505,112 | ||||||
| Total deposits |
$ | 3,978,535 | $ | 2,793,533 | $ | 2,190,340 | ||||||
| Borrowings (including FHLB advances of $983,686 and $431,013, and $271,642 respectively) |
$ | 1,067,981 | $ | 435,866 | $ | 271,642 | ||||||
| Selected Income Statement Data |
||||||||||||
| Total interest income |
$ | 203,426 | $ | 145,263 | $ | 148,834 | ||||||
| Total interest expense |
28,254 | 22,940 | 27,506 | |||||||||
|
|
|
|
|
|
|
|||||||
| Net interest income |
$ | 175,172 | $ | 122,323 | $ | 121,328 | ||||||
|
|
|
|
|
|
|
|||||||
| Provision for loan losses |
10,243 | 2,914 | 26,101 | |||||||||
|
|
|
|
|
|
|
|||||||
| Net interest income after provision for loan losses |
$ | 164,929 | $ | 119,409 | $ | 95,227 | ||||||
|
|
|
|
|
|
|
|||||||
| Total noninterest income |
17,032 | 10,942 | 19,295 | |||||||||
| Total noninterest expense |
145,632 | 104,308 | 121,749 | |||||||||
| Income (loss) before income tax expense (benefit) |
36,329 | 26,043 | (7,227 | ) | ||||||||
| Income tax expense (benefit) |
13,957 | 8,872 | (2,399 | ) | ||||||||
|
|
|
|
|
|
|
|||||||
| Net income (loss) |
$ | 22,372 | $ | 17,171 | $ | (4,828 | ) | |||||
|
|
|
|
|
|
|
|||||||
| Per Share Data |
||||||||||||
| Earnings (loss) per share—Basic |
$ | 0.59 | $ | 0.46 | $ | (0.13 | ) | |||||
| Earnings (loss) per share—Diluted |
$ | 0.58 | $ | 0.46 | $ | (0.13 | ) | |||||
| Weighted average shares outstanding—Basic |
38,054,158 | 36,947,192 | 37,011,598 | |||||||||
| Weighted average shares outstanding—Diluted |
38,258,316 | 36,949,129 | 37,011,598 | |||||||||
| Performance Ratios |
||||||||||||
| Interest rate spread |
3.38 | % | 3.54 | % | 3.74 | % | ||||||
| Net interest margin |
3.53 | % | 3.79 | % | 4.00 | % | ||||||
| Return on average assets |
0.41 | % | 0.49 | % | -0.14 | % | ||||||
| Return on average equity |
2.89 | % | 2.35 | % | -0.67 | % | ||||||
| Efficiency ratio (company level) |
75.77 | % | 78.27 | % | 86.58 | % | ||||||
| Average interest-earning assets to average interest bearing liabilities |
118.45 | % | 130.73 | % | 125.79 | % | ||||||
| Loans receivable to deposits |
98.77 | % | 80.86 | % | 62.15 | % | ||||||
| Yield on interest-earning assets |
4.06 | % | 4.47 | % | 4.88 | % | ||||||
| Cost of interest-bearing liabilities |
0.68 | % | 0.93 | % | 1.14 | % | ||||||
| Asset Quality Ratios |
||||||||||||
| Asset and Credit Quality Ratios—Total loans |
||||||||||||
| Nonperforming loans to loans receivable |
0.49 | % | 1.51 | % | 0.73 | % | ||||||
| Nonperforming assets to total assets |
1.58 | % | 1.73 | % | 2.09 | % | ||||||
| Covered loans to total gross loans |
6.96 | % | 15.90 | % | 35.13 | % | ||||||
| ALL to nonperforming assets |
24.36 | % | 21.40 | % | 27.98 | % | ||||||
| ALL to total gross loans |
0.58 | % | 0.65 | % | 1.39 | % | ||||||
| Asset and Credit Quality Ratios—New Loans |
||||||||||||
| Nonperforming new loans to new loans receivable |
0.00 | % | 0.06 | % | 0.07 | % | ||||||
| Covered new loans to total gross new loans |
0.00 | % | 0.00 | % | 0.00 | % | ||||||
| New loan ALL to total gross new loans |
0.52 | % | 0.47 | % | 0.71 | % | ||||||
| Asset and Credit Quality Ratios—Acquired Loans |
||||||||||||
| Nonperforming acquired loans to acquired loans receivable |
2.34 | % | 6.78 | % | 1.50 | % | ||||||
| Covered acquired loans to total gross acquired loans |
33.09 | % | 73.60 | % | 75.70 | % | ||||||
| Acquired loan ALL to total gross acquired loans |
0.83 | % | 1.32 | % | 2.18 | % | ||||||
| Capital Ratios (Company) |
||||||||||||
| Average equity to average total assets |
14.23 | % | 20.90 | % | 21.20 | % | ||||||
| Tangible average equity to tangible average assets |
12.81 | % | 20.00 | % | 20.24 | % | ||||||
| Tangible common equity ratio (end of period) |
13.02 | % | 17.20 | % | 21.45 | % | ||||||
| Tier 1 leverage ratio |
12.80 | % | 18.03 | % | 20.58 | % | ||||||
| Tier 1 risk-based capital ratio |
17.02 | % | 24.78 | % | 36.08 | % | ||||||
| Total risk-based capital ratio |
17.56 | % | 25.34 | % | 37.09 | % | ||||||
46
Table of Contents
Index to Financial Statements
Item 7. Management’s Discussion and Analysis of Financial Condition and Results of Operations
The following discussion and analysis is intended to assist readers in understanding the consolidated financial condition and results of operations of the Company and should be read in conjunction with our Consolidated Financial Statements and notes thereto included in this report.
In addition to historical financial information, the following discussion and analysis contains forward-looking statements that reflect our plans, estimates and beliefs, but that also involve risks and uncertainties. Our actual results could differ materially from those discussed in the forward-looking statements. Please see “Cautionary Note Regarding Forward-Looking Information” and “Item 1A. Risk Factors” for discussions of the uncertainties, risks and assumptions associated with these statements.
Executive Summary
We have grown rapidly over the last few years. We manage our company for the long term by focusing on internal growth, deepening existing customer relationships and increasing fee income while reducing expenses. Our goal is to deliver positive operating results while managing risk, liquidity and capital. We continue to invest in our infrastructure, products, market and brand.
We face a number of risks that may impact various aspects of our risk profile from time to time. The extent of such impacts may vary depending on factors such as the current economic environment, competitive factors and operational challenges. Many of these risks are described in more detail elsewhere in this report.
Having acquired nine banks within the State of Florida, our priority for 2015 is to internally grow loans and deposits within the State of Florida. Our 52 branch retail network extends from Naples to Sarasota, and further to Brooksville, on the west coast of Florida, from Miami to Daytona Beach on the east coast of Florida, and to Orlando in Central Florida. This market footprint includes three of the four largest MSAs in Florida; Orlando, Miami and West Palm Beach.
In addition to branch activity, we also deploy middle market bankers and community bankers who focus on providing personalized, professional service to small and commercial businesses in our market. The middle market and community bankers partner with our treasury services professionals to provide financial solutions to business customers. The combination of the retail staff, in-market bankers and convenience products has allowed our customers to take advantage of a full range of products thus increasing product and service cross selling, and in turn, customer loyalty. We support these products with convenience technology such as internet banking, mobile and text banking as well as treasury services.
To support consumer and business awareness of our market presence, financial strength and product offerings, we utilize the traditional print and radio advertising channels as well as capitalize on opportunities to support local and state-wide causes that permit increased visibility of our logo, message, and experienced staff. During and following each acquisition the Company has implemented its “Stronger Than Ever” campaign which features outbound calling efforts and print advertising. The campaign communicates the newly acquired institutions’ continuity of staff combined with our financial strength and robust product offerings. By providing a consistent look and message in all marketing efforts we have been able to gain notoriety; increase brand awareness; and attract and retain new customers.
47
Table of Contents
Index to Financial Statements
With each distribution channel comes an additional opportunity and need for customer support. The Bank has ensured that customers receive the same level of support at each touch point by establishing a service excellence program and service protocols. The Bank also has a customer service call center which supports all segments of the Bank with dedicated channels for retail and high touch commercial clients.
To support our focus on internal growth, one of our top priorities has been to put in place and strengthen a truly comprehensive infrastructure and system of oversight, risk management and controls commensurate with our growth trajectory and the complexity of our business activities. Our efforts to date include:
| • | Enterprise Risk Management Initiatives—We continuously enhance and improve our risk management program and processes, and the related reporting and infrastructure used to manage the risks we face. The Bank has built out a comprehensive Enterprise Risk Management, or ERM, Program and has embedded the program and its principles into the Bank’s standardized operating methodologies. The ERM Program provides the Bank with an aggregate view of the risk across the organization, defines the ERM Framework, Policy and Governance, determines Risk Appetite and establishes an ERM Dashboard, amongst other initiatives. |
| • | Internal Controls—We continuously improve and enhance our overall internal control framework. |
| • | Continue to Upgrade Infrastructure and Technology— We have integrated the operations and systems of our bank acquisitions onto one single branded, statewide platform in Florida to deliver high-quality banking solutions and services; efficiency in communication and delivery systems; and cost efficiencies. We have also implemented key enhancements to our IT infrastructure, including server virtualization, desktop software management solutions, help desk enhancements, real-time monitoring and the build out of a redundancy solution, all of which are designed to enhance current operations and provide the ability to handle future growth in a manner compliant with all applicable policies and regulations. Management continuously looks for opportunities to enhance its information technology capabilities. |
Primary Factors Used to Evaluate Our Business
As a financial institution, we manage and evaluate various aspects of both our results of operations and our financial condition. We evaluate the levels and trends of the line items included in our consolidated balance sheet and income statement, as well as various financial ratios that are commonly used in our industry. We analyze these ratios and financial trends against our own historical performance, our budgeted performance and the financial condition and performance of comparable financial institutions in our region and nationally.
Comparison of our financial performance against other financial institutions is impacted by the accounting for loans acquired with deteriorated credit quality since origination as well as assets subject to loss sharing agreements with the FDIC.
Results of Operations
Our results of operations depend substantially on net interest income, which is the difference between interest income on interest-earning assets, consisting primarily of interest income on loans receivable, including accretion income on acquired loans, securities and other short-term investments, and interest expense on interest-bearing liabilities, consisting primarily of deposits and borrowings. Our results of operations are also dependent upon our generation of noninterest income, consisting of income from banking service fees, interest rate swap services, bank-owned life insurance (“BOLI”), recoveries on acquired assets and FDIC loss share related items including reimbursement of expenses on covered assets and amortization of the indemnification asset to fair value over the life of the contract. Other factors contributing to our results of operations include our provisions for loan losses, gains or losses on securities and income taxes, as well as the level of our noninterest expenses, such as compensation and benefits, occupancy and equipment and other miscellaneous operating expenses.
48
Table of Contents
Index to Financial Statements
Net Interest Income
Net interest income, a significant contributor to our revenues and net income, represents interest income less interest expense. We generate interest income from interest, dividends and fees received on interest-earning assets, including loans and investment securities we own. We incur interest expense from interest paid on interest-bearing liabilities, including interest-bearing deposits, and borrowings. To evaluate net interest income, we measure and monitor (1) yields on our loans and other interest-earning assets, (2) the costs of our deposits and other funding sources, (3) our net interest spread, (4) our net interest margin and (5) our provisions for loan and lease losses. Net interest spread is the difference between rates earned on interest-earning assets and rates paid on interest-bearing liabilities. Net interest margin is calculated as net interest income divided by average interest-earning assets. Because noninterest-bearing sources of funds, such as noninterest-bearing deposits and stockholders’ equity, also fund interest-earning assets, net interest margin includes the benefit of these noninterest-bearing sources.
We also recognize income from the accretable discounts associated with the purchase of interest-earning assets. Because of our acquisitions in 2010 and 2011, and on a going forward basis our January 31, 2014 acquisition of GFB, we derive a portion of our interest income from the accretable discounts on acquired loans. This accretion will continue to have an impact on our net interest income as long as loans acquired with evidence of credit deterioration at acquisition represent a meaningful portion of our interest-earning assets.
Changes in the market interest rates and interest rates we earn on interest-earning assets or pay on interest-bearing liabilities, as well as the volume and types of interest-earning assets, interest-bearing and noninterest-bearing liabilities and stockholders’ equity, are usually the largest drivers of periodic changes in net interest spread, net interest margin and net interest income. In addition, our interest income includes the accretion of the fair value discounts on our acquired loans, which will also affect our net interest spread, net interest margin and net interest income. We measure net interest income before and after provision for loan and lease losses required to maintain our ALL at acceptable levels.
Noninterest Income
Our noninterest income includes the following:
| • | Service charges and fees; |
| • | Interest rate swap services; |
| • | BOLI income; |
| • | Accretion income and amortization expense from FDIC loss share indemnification asset and clawback liability; |
| • | Reimbursement of expenses on assets covered by loss sharing agreements; |
| • | Income from resolution of acquired assets; and |
| • | Net gains and losses from the sale of OREO assets and investment securities. |
Noninterest Expense
Our noninterest expense includes the following:
| • | Salaries and employee benefits; |
| • | Occupancy and equipment expenses; |
| • | Other real estate and acquired loan resolution related expenses; |
| • | Professional services; |
| • | Data processing and network expense; |
| • | Regulatory assessments and insurance |
| • | Amortization of intangibles; and |
| • | Other. |
Financial Condition
The primary factors we use to evaluate and manage our financial condition include liquidity, asset quality and capital.
49
Table of Contents
Index to Financial Statements
Liquidity
We manage liquidity based upon factors that include the amount of core deposits as a percentage of total deposits, the level of diversification of our funding sources, the allocation and amount of our deposits among deposit types, the short-term funding sources used to fund assets, the amount of non-deposit funding used to fund assets, the availability of unused funding sources, off-balance sheet obligations, the availability of assets to be readily converted into cash without undue loss, the amount of cash and liquid securities we hold, and the re-pricing characteristics and maturities of our assets when compared to the re-pricing characteristics of our liabilities, the ability to securitize and sell certain pools of assets and other factors.
Asset Quality
We manage the diversification and quality of our assets based upon factors that include the level, distribution, severity and trend of problem, classified, delinquent, non-accrual, nonperforming and restructured assets, the adequacy of our ALL, discounts and reserves for unfunded loan commitments, the diversification and quality of loan and investment portfolios, the extent of counterparty risks and credit risk concentrations.
Capital
We manage capital based upon factors that include the level and quality of capital and overall financial condition of the Company, the trend and volume of problem assets, the adequacy of discounts and reserves, the level and quality of earnings, the risk exposures in our balance sheet, the levels of Tier 1 (core), risk-based and tangible equity capital, the ratios of Tier 1 (core), risk-based and tangible equity capital to total assets and risk-weighted assets and other factors.
Performance Highlights
Operating and financial highlights for the year ended December 31, 2014 include the following:
| • | Record net income available to common stockholders’ of $22.4 million, or $0.58 per diluted share, an increase of 30.3% over prior year |
| • | Net interest income of $175.2 million, an increase of 43.2% |
| • | Total loan portfolio increased 74.0% to $3.93 billion |
| • | Cost of deposits declined 17 basis points to 0.69% |
| • | Efficiency ratio declined to 75.8%, down from 78.3% for the prior year |
| • | Successful acquisition and integration of Great Florida Bank |
| • | Completed initial public offering of 7,520,000 of Class A Common Stock |
Analysis of Results of Operations
Net income available to common stockholders’ totaled $22.4 million, which generated diluted earnings per share (“EPS”) of $0.58 for the year ended December 31, 2014. Net income available to common stockholders for the year ended December 31, 2013 totaled $17.2 million, which generated diluted EPS of $0.46. The increase in earnings was primarily driven by an increase in interest income of $58.2 million and noninterest income of $6.1 million partially offset by an increase in noninterest expense of $41.3 million which included non-core expenses of $15.2 million in stock option expense, $4.1 million of warrant expense and $766 thousand of EAA expense in conjunction with the IPO. The Company’s results of operations for the year ended December 31, 2014 produced a return on average assets of 0.41% and a return on average common stockholders’ equity of 2.89% compared to prior year ratios of 0.49% and 2.35%, respectively.
50
Table of Contents
Index to Financial Statements
Net Interest Income and Net Interest Margin
The following tables present, for the periods indicated, information about (i) average balances, the total dollar amount of interest income from interest-earning assets and the resultant average yields; (ii) average balances, the total dollar amount of interest expense on interest-bearing liabilities and the resultant average rates; (iii) net interest income; (iv) the interest rate spread; and (v) the net interest margin. Yields have been calculated on a pre-tax basis:
| Years Ended December 31, | ||||||||||||||||||||||||||||||||||||
| 2014 | 2013 | 2012 | ||||||||||||||||||||||||||||||||||
| Average Balance (1) |
Interest/ Expense (2) |
Yield/Rate | Average Balance (1) |
Interest/ Expense (2) |
Yield/Rate | Average Balance (1) |
Interest/ Expense (2) |
Yield/Rate | ||||||||||||||||||||||||||||
| (Dollars in thousands) | ||||||||||||||||||||||||||||||||||||
| Interest-earning assets: |
||||||||||||||||||||||||||||||||||||
| Cash and cash equivalents |
$ | 100,849 | $ | 211 | 0.21 | % | $ | 100,293 | $ | 224 | 0.22 | % | $ | 70,142 | $ | 145 | 0.21 | % | ||||||||||||||||||
| New loans |
2,299,940 | 81,353 | 3.49 | % | 1,134,928 | 43,668 | 3.79 | % | 539,134 | 22,106 | 4.04 | % | ||||||||||||||||||||||||
| Acquired loans (3) |
888,444 | 77,317 | 8.70 | % | 548,111 | 64,853 | 11.83 | % | 725,563 | 90,610 | 12.49 | % | ||||||||||||||||||||||||
| Investment securities and other |
1,673,594 | 44,545 | 2.63 | % | 1,443,957 | 36,518 | 2.49 | % | 1,697,875 | 35,973 | 2.09 | % | ||||||||||||||||||||||||
|
|
|
|
|
|
|
|
|
|
|
|
|
|||||||||||||||||||||||||
| Total interest-earning assets |
4,962,827 | 203,426 | 4.06 | % | 3,227,289 | 145,263 | 4.47 | % | 3,032,714 | 148,834 | 4.88 | % | ||||||||||||||||||||||||
|
|
|
|
|
|
|
|
|
|
|
|
|
|||||||||||||||||||||||||
| Non-earning assets: |
||||||||||||||||||||||||||||||||||||
| FDIC loss share indemnification asset (4) |
76,851 | 107,153 | 170,805 | |||||||||||||||||||||||||||||||||
| Noninterest-earning assets |
407,289 | 167,869 | 180,587 | |||||||||||||||||||||||||||||||||
|
|
|
|
|
|
|
|||||||||||||||||||||||||||||||
| Total assets |
$ | 5,446,967 | $ | 3,502,311 | $ | 3,384,106 | ||||||||||||||||||||||||||||||
|
|
|
|
|
|
|
|||||||||||||||||||||||||||||||
| Interest-bearing liabilities: |
||||||||||||||||||||||||||||||||||||
| Interest-bearing demand deposits |
$ | 25,977 | $ | 53 | 0.20 | % | $ | — | $ | — | 0.00 | % | $ | — | $ | — | 0.00 | % | ||||||||||||||||||
| Interest-bearing NOW accounts |
245,998 | 749 | 0.30 | % | 70,454 | 76 | 0.11 | % | 65,407 | 67 | 0.10 | % | ||||||||||||||||||||||||
| Savings and money market accounts |
1,708,507 | 9,845 | 0.58 | % | 961,986 | 4,425 | 0.46 | % | 730,591 | 4,857 | 0.66 | % | ||||||||||||||||||||||||
| Time deposits (5) |
1,338,016 | 12,111 | 0.91 | % | 1,121,100 | 14,036 | 1.25 | % | 1,277,620 | 17,776 | 1.39 | % | ||||||||||||||||||||||||
| FHLB advances and other borrowings (5) |
871,296 | 5,496 | 0.62 | % | 315,099 | 4,403 | 1.38 | % | 337,405 | 4,806 | 1.40 | % | ||||||||||||||||||||||||
|
|
|
|
|
|
|
|
|
|
|
|
|
|||||||||||||||||||||||||
| Total interest-bearing liabilities |
$ | 4,189,794 | $ | 28,254 | 0.68 | % | $ | 2,468,639 | $ | 22,940 | 0.93 | % | $ | 2,411,023 | $ | 27,506 | 1.14 | % | ||||||||||||||||||
|
|
|
|
|
|
|
|
|
|
|
|
|
|||||||||||||||||||||||||
| Noninterest-bearing liabilities and shareholders’ equity: |
||||||||||||||||||||||||||||||||||||
| Noninterest-bearing demand deposits |
$ | 433,330 | $ | 260,994 | $ | 218,714 | ||||||||||||||||||||||||||||||
| Other liabilities |
48,856 | 40,564 | 36,779 | |||||||||||||||||||||||||||||||||
| Stockholders’ equity |
774,987 | 732,114 | 717,590 | |||||||||||||||||||||||||||||||||
|
|
|
|
|
|
|
|||||||||||||||||||||||||||||||
| Total liabilities and stockholders’ equity |
$ | 5,446,967 | $ | 3,502,311 | $ | 3,384,106 | ||||||||||||||||||||||||||||||
|
|
|
|
|
|
|
|
|
|
|
|
|
|||||||||||||||||||||||||
| Net interest income |
$ | 175,172 | $ | 122,323 | $ | 121,328 | ||||||||||||||||||||||||||||||
|
|
|
|
|
|
|
|
|
|
|
|
|
|||||||||||||||||||||||||
| Net interest spread |
3.38 | % | 3.54 | % | 3.74 | % | ||||||||||||||||||||||||||||||
|
|
|
|
|
|
|
|||||||||||||||||||||||||||||||
| Net interest margin |
3.53 | % | 3.79 | % | 4.00 | % | ||||||||||||||||||||||||||||||
|
|
|
|
|
|
|
|||||||||||||||||||||||||||||||
| (1) | Average balances presented are derived from daily average balances. |
| (2) | Interest income is presented on an actual basis and does not include taxable equivalent adjustments. |
| (3) | Includes loans on non-accrual status. |
| (4) | Amortization expense of FDIC loss share indemnification asset is not included in net interest income presentation. |
| (5) | Interest expense includes the impact from premium amortization. |
Increases and decreases in interest income and interest expense result from changes in average balances (volume) of interest-earning assets and liabilities, as well as changes in average interest rates. The following table shows the effect that these factors had on the interest earned on our interest-earning assets and the interest incurred on our interest-bearing liabilities for the periods indicated. The effect of changes in volume is determined by multiplying the change in volume by the prior period’s average rate. Similarly, the effect of rate changes is calculated by multiplying the change in average rate by the current period’s volume. Changes applicable to both volume and rate have been allocated to volume. Yields have been calculated on a pre-tax basis.
51
Table of Contents
Index to Financial Statements
A summary of increases and decreases in interest income and interest expense resulting from changes in average balances (volume) and average interest rates are as follows:
| Years ended December 31, 2014 compared to 2013 |
Years ended December 31, 2013 compared to 2012 |
|||||||||||||||||||||||
| Increase (Decrease) Due to | Increase (Decrease) Due to | |||||||||||||||||||||||
| Volume | Rate | Total | Volume | Rate | Total | |||||||||||||||||||
| (Dollars in thousands) | ||||||||||||||||||||||||
| Interest-earning assets: |
||||||||||||||||||||||||
| Cash and cash equivalents |
$ | 1 | $ | (14 | ) | $ | (13 | ) | $ | 66 | $ | 13 | $ | 79 | ||||||||||
| New loans |
41,473 | (3,788 | ) | 37,685 | 23,003 | (1,441 | ) | 21,562 | ||||||||||||||||
| Acquired loans (1) |
32,798 | (20,334 | ) | 12,464 | (21,202 | ) | (4,555 | ) | (25,757 | ) | ||||||||||||||
| Investment securities and other |
6,036 | 1,991 | 8,027 | (5,834 | ) | 6,379 | 545 | |||||||||||||||||
|
|
|
|
|
|
|
|
|
|
|
|
|
|||||||||||||
| Total change in interest income |
$ | 80,308 | $ | (22,145 | ) | $ | 58,163 | $ | (3,967 | ) | $ | 396 | $ | (3,571 | ) | |||||||||
|
|
|
|
|
|
|
|
|
|
|
|
|
|||||||||||||
| Interest-bearing liabilities: |
||||||||||||||||||||||||
| Interest-bearing demand deposits |
$ | 53 | $ | — | $ | 53 | $ | — | $ | — | $ | — | ||||||||||||
| Interest-bearing NOW accounts |
388 | 285 | 673 | 5 | 4 | 9 | ||||||||||||||||||
| Savings and money market accounts |
4,089 | 1,331 | 5,420 | 1,298 | (1,730 | ) | (432 | ) | ||||||||||||||||
| Time deposits (2) |
2,406 | (4,331 | ) | (1,925 | ) | (2,057 | ) | (1,683 | ) | (3,740 | ) | |||||||||||||
| FHLB advances and other borrowings (2) |
4,519 | (3,426 | ) | 1,093 | (313 | ) | (90 | ) | (403 | ) | ||||||||||||||
|
|
|
|
|
|
|
|
|
|
|
|
|
|||||||||||||
| Total change in interest expenses |
11,455 | (6,141 | ) | 5,314 | (1,067 | ) | (3,499 | ) | (4,566 | ) | ||||||||||||||
|
|
|
|
|
|
|
|
|
|
|
|
|
|||||||||||||
| Total change in net interest income |
$ | 68,853 | $ | (16,004 | ) | $ | 52,849 | $ | (2,900 | ) | $ | 3,895 | $ | 995 | ||||||||||
|
|
|
|
|
|
|
|
|
|
|
|
|
|||||||||||||
| (1) | Includes loans on non-accrual status. |
| (2) | Interest expense includes the impact from premium amortization. |
| (3) | Variances attributable to both volume and rate are allocated on a consistent basis between rate and volume based on the absolute value of the variances in each category. |
Year ended December 31, 2014 compared to Year ended December 31, 2013
Net interest income was $175.2 million for the year ended December 31, 2014, an increase of 43.2% compared to $122.3 million for the year ended December 31, 2013. The increase in net interest income reflects a $58.2 million increase in interest income partially offset by a $5.3 million increase in interest expense. For the year ended December 31, 2014, average earning assets increased $1.74 billion, or 53.8%, while average interest-bearing liabilities increased $1.72 billion, or 69.7%, compared to the year ended December 31, 2013.
The increase in interest income was primarily due to a $37.7 million increase in interest income on new loans. The average balance of new loans increased $1.17 billion, which offset the negative impact of the reduction in the average interest rate on new loans of 30 basis points. Interest income on acquired loans increased $12.5 million compared to prior year, primarily driven by a $340.3 increase in the average balance of acquired loans resulting from the GFB acquisition. The GFB acquisition contributed approximately $25.6 million to the increase in interest income on acquired loans, partially offset by a decrease of $13.1 million in legacy acquired loan income due to runoff of the acquired loan portfolio from the Old Failed Bank acquisitions.
Interest expense on deposits increased $4.2 million due to a $1.16 billion, or 54.1%, increase in the average balance of interest-bearing deposits, partially offset by a decline in the average rate paid on deposits. The increase in the average balance of deposits was primarily due to the GFB acquisition. The decline in the average rate paid on deposits was attributable to lower prevailing rates offered and the continued run-off of wholesale and longer-term time deposits assumed in the acquisitions. The average rate paid on time deposits, including the impact of premium amortization, was 0.91% and 1.25% for the years ended December 31, 2014 and 2013, respectively. Interest expense on FHLB advances and other borrowings totaled $5.5 million for the year ended December 31, 2014 as compared to $4.4 million for the prior year. The increase was primarily due to an increase of $556.2 million, or 176.5%, in the average balance of FHLB advances and other borrowings, partially offset by a decrease in average rate paid on borrowings of 76 basis points.
The net interest margin for the year ended December 31, 2014 was 3.53%, a decline of 26 basis points compared to 3.79% for the year ended December 31, 2013. The average yield on interest-earning assets declined by 41 basis points for the year ended December 31, 2014 as compared to the year ended December 31, 2013, while the average rate paid on interest-bearing liabilities decreased by 25 basis points. The decline in the average yield on interest-
52
Table of Contents
Index to Financial Statements
earning assets was due primarily to the runoff of higher yielding acquired loan balances. Although the average acquired loan portfolio balance increased 62.1% due to the GFB acquisition during the first quarter of 2014, the lower yielding loans acquired from the GFB acquisition resulted in a decline in the average rate for the combined acquired loan portfolio. The average rate on the acquired loan portfolio was 8.70% for the year ended December 31, 2014, down from 11.83% for the year ended December 31, 2013. At the date of acquisition, the weighted average accretion rate for the loans accounted for under ASC 310-30 was 4.65% and the weighted average contractual rate on acquired Non-ASC 310-30 loans was 4.55%.
Year ended December 31, 2013 compared to Year ended December 31, 2012
Net interest income was $122.3 million for the year ended December 31, 2013, an increase of $995 thousand, or 0.82% compared to $121.3 million for the prior year. The increase in net interest income reflects a $4.6 million decrease in interest expense and a $3.6 million decrease in interest income. For the year ended December 31, 2013, average interest earning assets increased by $194.6 million, or 6.4%, while average interest-bearing liabilities increased $57.6 million, or 2.4%, compared to the year ended December 31, 2012.
The decrease in interest income for the year ended December 31, 2013 was primarily due to a $25.8 million decrease in interest income on acquired loans which was partially offset by an increase of $21.6 million in interest income on new loans. The average balance of acquired loans decreased $177.5 million combined with a decrease in the average interest rate on acquired loans of 66 basis points led to the decrease in interest income on acquired loans. The decrease in the acquired loan portfolio was due to the runoff of the acquired loan portfolio from the Old Failed Bank acquisitions. The increase of interest income on new loans was driven by an increase in the average balance of $595.8 million, which offset the negative impact of the reduction in the average interest rate of 25 basis points.
Interest expense on deposits decreased $4.2 million for the year ended December 31, 2013 compared to prior year primarily due to a decrease in the average rate paid on deposits. The average rate paid on time deposits, including the impact of premium amortization, was 1.25% and 1.39% for the year ended December 31, 2013 and 2012, respectively. The decline in the average rate paid on deposits was attributable to lower prevailing rates offered and the continued run-off of wholesale and longer-term time deposits assumed in the Old Failed Bank acquisitions. Interest expense on FHLB advances and other borrowings totaled $4.4 million for the year ended December 31, 2013 as compared to $4.8 million for the prior year. The decrease was primarily due to a decrease of $22.3 million, or 6.6%, in the average balance of FHLB advances and other borrowings combined with a decrease in average rate paid on borrowings of 2 basis points.
The net interest margin for the year ended December, 2013 was 3.79%, a decline of 21 basis points compared to 4.00% for the year ended December 31, 2012. The average yield on interest-earning assets declined by 41 basis points for the year ended December 31, 2013 as compared to prior year, while the average rate paid on interest-bearing liabilities decreased by 21 basis points. The decline in the average yield on interest-earning assets was due primarily to the runoff of higher yielding legacy acquired loan balances combined with lower yielding new loans. The average rate on the acquired loan portfolio was 11.83% for the year ended December 31, 2013, down from 12.49% for the year ended December 31, 2012.
Provision for Loan Losses
Year ended December 31, 2014 compared to Year ended December 31, 2013
The provision for loan losses is used to maintain the ALL at a level that, in management’s judgment, is appropriate to absorb probable losses inherent in the portfolio at the balance sheet date. Provision for loan losses increased by $7.3 million, or 251.5%, to $10.2 million for the year ended December 31, 2014 as compared to the year ended December 31, 2013. Provision for loan loss expense for the year ended December 31, 2014 included an $8.1 million provision related to new loans and a $2.2 million provision for the acquired loan portfolio. The increase in the provision for new loans is attributable to the $1.33 billion increase in the new loan portfolio balance. The increase in the provision for acquired loans is primarily attributable to recording a provision on loans acquired in the GFB acquisition.
53
Table of Contents
Index to Financial Statements
Net charge-offs were $2.1 million for the year ended December 31, 2014, a decrease of 70.6% compared to prior year. The decrease in net charge-offs was due to resolution of acquired loans in the 1-4 single family residential, Construction, land and development, and CRE loan categories. Net charge-offs were 0.07% of average loans on for the year ended December 31, 2014 compared to 0.42% of average loans for the prior year.
Year ended December 31, 2013 compared to Year Ended December 31, 2012
Provision for loan losses totaled $2.9 million for the year ended December 31, 2013 as compared to $26.1 million for the year ended December 31, 2012. Provision for loan loss expense for the year ended December 31, 2013 included a $3.3 million provision related to new loans and a $(378) thousand provision for the acquired loan portfolio. The increase in the provision for new loans is attributable to the $1.04 billion increase in the new loan portfolio balance. The decrease in the provision for acquired loans is primarily attributable to better than expected performance of the legacy acquired loan portfolio resulting in a reversal of previously recorded provision expense.
Net charge-offs were $7.1 million for the year ended December 31, 2013, a decrease of 71.5% from the prior year. The decrease in net charge-offs was due to resolution of acquired loans in the Construction, land and development, and CRE loan categories. Net charge-offs were 0.42% of average loans for the year ended December 31, 2013 compared to 1.98% of average loans for the prior year.
Noninterest Income
The following tables present a summary of noninterest income. For expanded discussion of certain significant noninterest income items, refer to the discussion of each component following the table presented.
| Years Ended December 31, | ||||||||||||
| 2014 | 2013 | 2012 | ||||||||||
| (Dollars in thousands) | ||||||||||||
| Noninterest income: |
||||||||||||
| Service charges and fees |
$ | 2,963 | $ | 2,374 | $ | 2,082 | ||||||
| Loan and other fees |
6,793 | 5,057 | 1,009 | |||||||||
| Bank-owned life insurance income |
4,175 | 257 | — | |||||||||
| FDIC loss share indemnification loss |
(21,425 | ) | (18,533 | ) | (3,470 | ) | ||||||
| Income from resolution of acquired assets |
4,899 | 8,475 | 9,593 | |||||||||
| Gain (loss) on sales of other real estate owned |
144 | 1,267 | 5,153 | |||||||||
| Gain (loss) on investment securities |
12,105 | 8,682 | 2,321 | |||||||||
| Other noninterest income |
7,378 | 3,363 | 2,607 | |||||||||
|
|
|
|
|
|
|
|||||||
| Total noninterest income |
$ | 17,032 | $ | 10,942 | $ | 19,295 | ||||||
|
|
|
|
|
|
|
|||||||
Year ended December 31, 2014 compared to Year ended December 31, 2013
The Company reported noninterest income of $17.0 million for the year ended December 31, 2014, an increase of $6.1 million, or 55.7%, compared to the year ended December 31, 2013. The increase was primarily due to an increase in BOLI income, increased gains on investment securities and higher other noninterest income which were partially offset by a decrease in gains on sale of OREO, an increase in FDIC loss share indemnification loss and a decrease in income from resolution of acquired assets.
BOLI income totaled $4.2 million for the year ended December 31, 2014, an increase of $3.9 million compared to prior year. The increase is primarily due to recognizing income during the full year of 2014 compared to only two months of 2013 in addition to the increase in the cash surrender value of the policies primarily attributable to additional premium payments made during the current year.
Other noninterest income increased to $7.4 million for the year ended December 31, 2014, an increase of $4.0 million, or 119.4%, compared to $3.4 million recognized for the year ended December 31, 2013. The increase in other noninterest income was primarily due to increased rental income of $1.8 million from properties acquired through the GFB acquisition and $1.6 million of gain realized on life insurance proceeds.
54
Table of Contents
Index to Financial Statements
Net gain on investment securities totaled $12.1 million for the year ended December 31, 2014, an increase of $3.4 million, or 39.4%, compared to $8.7 million for the prior year. The increase was primarily the result of selling lower yielding investment securities in order to fund higher yielding loans.
Net gain on sales of OREO decreased by $1.1 million, or 88.6%, to $144 thousand for the year ended December 31, 2014. The decrease is primarily attributable to a decrease of $12.1 million in sales of OREO properties.
During the year ended December 31, 2014, the Company recognized $21.4 million in FDIC loss share indemnification loss as compared to $18.5 million for the prior year. The increase was driven primarily by an increase of $1.8 million in indemnification asset amortization and clawback liability expense and a $4.4 million decrease in reimbursable expenses partially offset by $2.7 million decrease in recoveries, a $1.1 million increase in impairment expenses and a $512 thousand decrease in OREO write-down expenses.
Recoveries recognized for the year ended December 31, 2014 totaled $4.9 million and were recognized through earnings as received, compared to $8.5 million for the year ended December 31, 2013
Year ended December 31, 2013 compared to Year ended December 31, 2012
The Company reported noninterest income of $10.9 million for the year ended December 31, 2013 a decrease of $8.4 million, or 43.3%, compared to the year ended December 31, 2012. The decrease was primarily due to a decrease in income from the resolution of acquired assets, an increase in FDIC loss share indemnification loss and a decrease in gains on sale of OREO partially offset by an increase in loan and other fees and increased gains on investment securities.
During the year ended December 31, 2013, the Company recognized $18.5 million in FDIC loss share indemnification loss as compared to $3.5 million for the prior year. The increase was driven primarily by a decrease of $9.5 million in indemnification asset amortization and clawback liability expense and a $5.3 million decrease in reimbursable expenses partially offset by $946 thousand decrease in recoveries, a $15.5 million decrease in impairment expenses resulting in a $321 thousand recoupment and a $5.1 million decrease in OREO write-down expenses
Recoveries recognized for the year ended December 31, 2013 totaled $8.5 million and were recognized through earnings as received, compared to $9.6 million for the year ended December 31, 2012.
Net gain on sales of OREO decreased by $3.9 million, or 75.4%, to $1.3 million for the year ended December 31, 2013.
Loan and other fees totaled $5.1 million for the year ended December 31, 2013, an increase of $4.1 million compared to the year ended December 31, 2012. The increase was primarily due to an increase in interest rate swap service fees of $3.3 million and an increase of $836 thousand in commitment fees.
Net gain on investment securities totaled $8.7 million for the year ended December 31, 2013, an increase of $6.4 million, or 274.1%, compared to $2.3 million for the prior year. The increase was due to rebalancing of the investment portfolio and selling lower yielding investment securities to fund higher yielding loans.
55
Table of Contents
Index to Financial Statements
Noninterest Expense
The following tables present a summary of noninterest expense. For expanded discussion of certain significant noninterest expense items, refer to the discussion of each component following the table presented.
| Years Ended December 31, | ||||||||||||
| 2014 | 2013 | 2012 | ||||||||||
| (Dollars in thousands) | ||||||||||||
| Noninterest expense: |
||||||||||||
| Salaries and employee benefits |
$ | 73,241 | $ | 46,914 | $ | 48,243 | ||||||
| Occupancy and equipment expenses |
14,064 | 9,872 | 9,772 | |||||||||
| Loan and other real estate related expenses |
14,868 | 19,158 | 31,993 | |||||||||
| Professional services |
5,629 | 6,403 | 10,466 | |||||||||
| Data processing and network |
10,744 | 7,280 | 6,927 | |||||||||
| Regulatory assessments and insurance |
7,839 | 5,414 | 7,327 | |||||||||
| Amortization of intangibles |
1,710 | 1,526 | 1,806 | |||||||||
| Other operating expenses |
17,537 | 7,741 | 5,215 | |||||||||
|
|
|
|
|
|
|
|||||||
| Total noninterest expense |
$ | 145,632 | $ | 104,308 | $ | 121,749 | ||||||
|
|
|
|
|
|
|
|||||||
Year ended December 31, 2014 compared to Year ended December 31, 2013
Salaries and employee benefits, the single largest component of our noninterest expense, totaled $73.2 million for the year ended December 31, 2014, an increase of $26.3 million, or 56.1%, compared to the year ended December 31, 2013. The increase was primarily due to increased stock-based compensation expense of $15.0 million incurred in conjunction with the IPO, increased salaries expense of $6.1 million due to increase head count and an increase of $4.7 million in bonuses and incentive compensation.
Occupancy and equipment expenses increased $4.2 million, or 42.5%, to $14.1 million for the year ended December 31, 2014, compared to $9.9 million for the year ended December 31, 2013. This increase is due in part to the Company’s assumption of the banking and operating locations of GFB that were predominantly leased facilities classified as operating leases.
Data processing and network expense increased $3.5 million, or 47.6%, to $10.7 million for the year ended December 31, 2014 compared to prior year due to the acquisition and conversion of GFB.
Regulatory assessments and insurance increased $2.4 million, or 44.8%, for the year ended December 31, 2014, compared to prior year, primarily due to increased deposit insurance assessments of $1.9 million and an increase in general insurance and other regulatory assessments of $511 thousand.
Other operating expenses increased $9.8 million for the year ended December 31, 2014, primarily due to warrant expenses of $4.1 million incurred in connection with the IPO and increased directors’ fees of $1.4 million.
Loan and other real estate related expenses decreased by $4.3 million, or 22.4%, for the year ended December 31, 2014 compared to the prior year due to less workout activity and decreased volume of the legacy acquired loan and legacy OREO portfolios.
Year ended December 31, 2013 compared to Year ended December 31, 2012
Other operating expenses increased $2.5 million for the year ended December 31, 2013 compared to prior year primarily due to increased directors’ fees of $2.3 million.
Salaries and employee benefits totaled $46.9 million for the year ended December 31, 2013, a decrease of $1.3 million, or 2.8%, compared to the year ended December 31, 2012. The decrease was primarily due to decreased stock-based compensation expense and bonuses of $1.7 million and $1.3 million, respectively, partially offset by increased salaries expense of $951 thousand and increased incentive pay of $440 thousand.
56
Table of Contents
Index to Financial Statements
Loan and other real estate related expenses decreased by $12.8 million, or 40.1%, for the year ended December 31, 2013 compared to prior year due to a $6.8 million decrease in OREO impairments and reduced loan workout activity expenses incurred related to the legacy acquired loan and OREO portfolios.
Professional services expense decreased $4.1 million, or 38.8%, compared to prior year due to reduced consulting fees.
Regulatory assessments and insurance decreased $1.9 million, or 26.1%, for the year ended December 31, 2013, compared to the year ended December 31, 2012, primarily due to decreased deposit insurance assessments of $1.7 million.
Provision for Income Taxes
Year ended December 31, 2014 compared to Year ended December 31, 2013
The income tax expense for the year ended December 31, 2014 totaled $14.0 million, an increase of $5.1 million, or 57.3%, compared to the year ended December 31, 2013. The increase in income tax expense was primarily due to an increase in taxable income that resulted in income before income taxes of $36.3 million for the year ended December 31, 2014. The effective income tax rate for the year ended December 31, 2014 was 38.3%, an increase in the effective tax rate of 4.3% compared to prior year. This increase primarily reflects the impact of warrants expense and certain stock-based compensation awards related to the completion of the Company’s initial public offering on August 6, 2014. These warrant and stock-based compensation expenses included $8.2 million of non-deductible expenses.
Year ended December 31, 2013 compared to Year ended December 31, 2012
The income tax expense for the year ended December 31, 2013 totaled $8.9 million, an increase of $11.3 million, compared to an income tax benefit of $2.4 million for the year ended December 31, 2012. The Company’s effective tax rate was 34.1% and (33.2)% for the years ended December 31, 2013 and 2012, respectively. The significant change in the income tax expense between periods is principally due to the change to a net taxable income position for the year ended December 31, 2013 compared to a net taxable loss position in the year ended December 31, 2012. The effective rate for the year ended December 31, 2013 is affected by the dividends received deduction from our investment securities holdings in preferred stock.
Analysis of Financial Condition
Total assets were $5.96 billion at December 31, 2014, an increase of $1.98 billion, or 49.9%, from December 31, 2013. The increase in total assets includes an increase of $1.66 billion in net loans, of which acquired loans increased $338.1 million over the period. The increase in acquired loans reflects the $548.1 million in net loans acquired through GFB on January 31, 2014, partially offset by the run-off of the acquired loan portfolio through receipt of payments, loan payoffs or resolution through foreclosure and transfers to OREO. Total securities portfolio was $1.43 billion at December 31, 2014, an increase of $243.7 million from December 31, 2013 primarily due to investment securities acquired from GFB. The remaining increase in total assets was mainly due to increases in goodwill and other intangible assets of $49.2 million, OREO of $39.8 million, BOLI of $64.6 million, deferred tax assets of $41.6 million and other assets of $42.1 million which were partially offset by a decrease in the FDIC loss share indemnification asset of $24.1 million and a decrease in FDIC receivables of $1.9 million.
Investment Securities
The Company’s investment policy has been established by the Board of Directors and dictates that investment decisions will be made based on, among other things, the safety of the investment, liquidity requirements, interest rate risk, potential returns, cash flow targets and consistency with our asset/liability management. The Bank’s Investment Committee is responsible for making securities portfolio decisions in accordance with the established
57
Table of Contents
Index to Financial Statements
policies and in coordination with the Board’s Asset/Liability Committee. The Bank’s Investment Committee members, and Bank employees under the direction of such committee, have been delegated authority to purchase and sell securities within specified investment policy guidelines. Portfolio performance and activity are reviewed by the Bank’s Investment Committee and full Board of Directors on a periodic basis.
The Bank’s investment policy provides specific limits on investments depending on a variety of factors, including its asset class, issuer, credit rating, size, maturity, etc. The Bank’s current investment strategy includes maintaining a high credit quality, liquid, diversified portfolio invested in fixed and floating rate securities with short- to intermediate-term maturities. The purpose of this approach is to create a safe and sound investment portfolio that minimizes exposure to interest rate and credit risk while providing attractive relative yield given market conditions.
The Company’s investment securities portfolio primarily consists of U.S. government agencies and sponsored enterprises obligations and mortgage-back securities, corporate debt, asset-backed securities and preferred stocks.
The following table summarizes the carrying value of our securities portfolio as of the periods presented:
| December 31, | ||||||||||||||||||||||||
| 2014 | 2013 | 2012 | ||||||||||||||||||||||
| Amortized | Fair | Amortized | Fair | Amortized | Fair | |||||||||||||||||||
| Cost | Value | Cost | Value | Cost | Value | |||||||||||||||||||
| (Dollars in thousands) | ||||||||||||||||||||||||
| Held to maturity: |
||||||||||||||||||||||||
| Foreign bonds |
$ | — | $ | — | $ | 365 | $ | 364 | $ | 549 | $ | 546 | ||||||||||||
|
|
|
|
|
|
|
|
|
|
|
|
|
|||||||||||||
| Available for sale: |
||||||||||||||||||||||||
| U.S. Government agencies and sponsored enterprises obligations |
$ | 6,078 | $ | 6,096 | $ | 51,553 | $ | 51,155 | $ | 145,795 | $ | 146,692 | ||||||||||||
| U.S. Government agencies and sponsored enterprises mortgage-backed securities |
497,384 | 501,652 | 243,062 | 241,638 | 289,745 | 294,785 | ||||||||||||||||||
| State and municipal obligations |
2,039 | 2,277 | 2,039 | 2,124 | 2,539 | 2,790 | ||||||||||||||||||
| Asset-backed securities |
482,969 | 478,201 | 385,979 | 387,965 | 616,254 | 619,412 | ||||||||||||||||||
| Corporate bonds and other debt securities |
256,155 | 258,683 | 375,373 | 379,225 | 401,293 | 410,735 | ||||||||||||||||||
| Preferred stock and other equity securities |
113,367 | 112,189 | 90,330 | 83,664 | — | — | ||||||||||||||||||
|
|
|
|
|
|
|
|
|
|
|
|
|
|||||||||||||
| Total available for sale |
$ | 1,357,992 | $ | 1,359,098 | $ | 1,148,336 | $ | 1,145,771 | $ | 1,455,626 | $ | 1,474,414 | ||||||||||||
|
|
|
|
|
|
|
|
|
|
|
|
|
|||||||||||||
Total investment securities increased $243.7 million, or 20.6% compared to December 31, 2013. The increase in investment securities was primarily due to securities acquired as part of the GFB acquisition and the investment of proceeds received from the IPO.
No securities were determined to be other-than-temporary impaired (“OTTI”) as of December 31, 2014 or 2013. All securities available for sale at December 31, 2014 and 2013 were investment grade based on ratings from recognized rating agencies.
As a member institution of the FHLB and the Federal Reserve Bank (“FRB”), the Bank is required to own capital stock in the FHLB and the FRB. As of December 31, 2014, and 2013, the Bank held approximately $66.9 million and $36.2 million, respectively, in FHLB and FRB stock. No market exists for this stock, and the Bank’s investment can be liquidated only through repurchase by the FHLB or FRB. Such repurchases have historically been at par value. We monitor our investment in FHLB and FRB stock for impairment through review of recent financial results, dividend payment history and information from credit agencies. As of December 31, 2014 and 2013, respectively, management did not identify any indicators of impairment of FHLB and FRB stock.
The following table shows contractual maturities and yields on our investment securities available for sale. Expected maturities may differ from contractual maturities because issuers may have the right to call or prepay obligations with or without call or prepayment penalties. Average yields are not presented on a taxable equivalent basis.
58
Table of Contents
Index to Financial Statements
| Maturity as of December 31, 2014 | ||||||||||||||||||||||||||||||||
| One Year or Less | After One Year through Five Years |
After Five Years through Ten Years |
After Ten Years | |||||||||||||||||||||||||||||
| Amortized Cost |
Average Yield |
Amortized Cost |
Average Yield |
Amortized Cost |
Average Yield |
Amortized Cost |
Average Yield |
|||||||||||||||||||||||||
| (Dollars in thousands) | ||||||||||||||||||||||||||||||||
| Securities available for sale: |
||||||||||||||||||||||||||||||||
| U.S. Government agencies and sponsored enterprises obligations |
$ | 293 | 5.01 | % | $ | — | — | $ | 5,785 | 2.57 | % | $ | — | — | ||||||||||||||||||
| U.S. Government agencies and sponsored enterprises mortgage-backed securities |
— | — | 25,207 | 1.65 | % | 329,278 | 2.02 | % | 142,899 | 2.25 | % | |||||||||||||||||||||
| State and municipal obligations |
— | — | — | — | — | — | 2,039 | 5.35 | % | |||||||||||||||||||||||
| Asset-backed securities |
— | — | 13,929 | 3.18 | % | 233,657 | 2.92 | % | 235,383 | 2.59 | % | |||||||||||||||||||||
| Corporate bonds and other debt securities |
— | — | 84,373 | 3.11 | % | 35,166 | 4.86 | % | 136,616 | 5.31 | % | |||||||||||||||||||||
| Preferred stock and other equity securities (1) |
— | — | — | — | — | — | 113,367 | 5.64 | % | |||||||||||||||||||||||
|
|
|
|
|
|
|
|
|
|
|
|
|
|
|
|
|
|||||||||||||||||
| Total securities available for sale |
$ | 293 | 5.01 | % | $ | 123,509 | 2.82 | % | $ | 603,886 | 2.54 | % | $ | 630,304 | 3.66 | % | ||||||||||||||||
|
|
|
|
|
|
|
|
|
|
|
|
|
|
|
|
|
|||||||||||||||||
| (1) | Preferred stock securities are all fixed-to-floating rate perpetual preferred stock that are callable between November 2014 and October 2024. |
As of December 31, 2014, the effective duration of the Bank’s investment portfolio is estimated to be approximately 2.9 years. This estimate is derived using a variety of inputs that are subject to change based on a variety of factors, including but not limited to, changes in interest rates and prepayment speeds.
The average balance of the securities portfolio for the year ended December 31, 2014 totaled $1.67 billion with a pre-tax yield of 2.63%.
Except for securities issued by U.S. government agencies and sponsored enterprise obligations, we did not have any concentrations where the total outstanding balances issued by a single issuer exceeded 10% of our stockholders’ equity as of December 31, 2014 or 2013.
59
Table of Contents
Index to Financial Statements
Loans
Loan concentration
The current concentrations in our loan portfolio may not be indicative of concentrations in our loan portfolio in the future. We plan to maintain a relatively diversified loan portfolio to help reduce the risk inherent in concentration in certain types of collateral. The following table summarizes the allocation of New Loans, Acquired ASC 310-30 loans and Acquired Non-ASC 310-30 loans as of the dates presented:
| December 31, | ||||||||||||||||||||||||
| 2014 | 2013 | 2012 | ||||||||||||||||||||||
| Amount | % of Total | Amount | % of Total | Amount | % of Total | |||||||||||||||||||
| (Dollars in thousands) | ||||||||||||||||||||||||
| New Loans: |
||||||||||||||||||||||||
| Commercial real estate |
$ | 853,074 | 21.7 | % | $ | 514,612 | 22.7 | % | $ | 212,581 | 15.6 | % | ||||||||||||
| Owner-occupied commercial real estate |
281,703 | 7.2 | % | 154,983 | 6.9 | % | 92,570 | 6.8 | % | |||||||||||||||
| 1-4 single family residential |
922,657 | 23.5 | % | 359,818 | 15.9 | % | 70,882 | 5.2 | % | |||||||||||||||
| Construction, land and development |
232,601 | 5.9 | % | 75,666 | 3.3 | % | 55,451 | 4.1 | % | |||||||||||||||
| Home equity loans and lines of credit |
11,826 | 0.3 | % | 19,303 | 0.9 | % | 393 | 0.0 | % | |||||||||||||||
|
|
|
|
|
|
|
|
|
|
|
|
|
|||||||||||||
| Total real estate loans |
$ | 2,301,861 | 58.6 | % | $ | 1,124,382 | 49.7 | % | $ | 431,877 | 31.7 | % | ||||||||||||
|
|
|
|
|
|
|
|
|
|
|
|
|
|||||||||||||
| Commercial and industrial |
795,000 | 20.2 | % | 645,153 | 28.6 | % | 295,315 | 21.7 | % | |||||||||||||||
| Consumer |
6,556 | 0.2 | % | 1,176 | 0.1 | % | 2,481 | 0.2 | % | |||||||||||||||
|
|
|
|
|
|
|
|
|
|
|
|
|
|||||||||||||
| Total new loans |
$ | 3,103,417 | 79.0 | % | $ | 1,770,711 | 78.4 | % | $ | 729,673 | 53.6 | % | ||||||||||||
|
|
|
|
|
|
|
|
|
|
|
|
|
|||||||||||||
| Acquired ASC 310-30 Loans: |
||||||||||||||||||||||||
| Commercial real estate |
$ | 336,935 | 8.6 | % | $ | 274,147 | 12.1 | % | $ | 331,217 | 24.3 | % | ||||||||||||
| 1-4 single family residential |
86,308 | 2.2 | % | 56,745 | 2.5 | % | 68,558 | 5.0 | % | |||||||||||||||
| Construction, land and development |
66,700 | 1.7 | % | 55,936 | 2.5 | % | 99,534 | 7.3 | % | |||||||||||||||
| Home equity loans and lines of credit |
— | 0.0 | % | — | 0.0 | % | — | 0.0 | % | |||||||||||||||
|
|
|
|
|
|
|
|
|
|
|
|
|
|||||||||||||
| Total real estate loans |
$ | 489,943 | 12.5 | % | $ | 386,828 | 17.1 | % | $ | 499,309 | 36.6 | % | ||||||||||||
|
|
|
|
|
|
|
|
|
|
|
|
|
|||||||||||||
| Commercial and industrial |
67,498 | 1.7 | % | 57,047 | 2.5 | % | 72,895 | 5.4 | % | |||||||||||||||
| Consumer |
2,803 | 0.1 | % | 3,992 | 0.2 | % | 8,406 | 0.6 | % | |||||||||||||||
|
|
|
|
|
|
|
|
|
|
|
|
|
|||||||||||||
| Total Acquired ASC 310-30 Loans |
$ | 560,244 | 14.3 | % | $ | 447,867 | 19.8 | % | $ | 580,610 | 42.6 | % | ||||||||||||
|
|
|
|
|
|
|
|
|
|
|
|
|
|||||||||||||
| Acquired Non-ASC 310-30 Loans: |
||||||||||||||||||||||||
| Commercial real estate |
$ | 70,146 | 1.8 | % | $ | 9,098 | 0.5 | % | $ | 10,241 | 0.8 | % | ||||||||||||
| Owner-occupied commercial real estate |
14,842 | 0.4 | % | 3,014 | 0.1 | % | 4,531 | 0.3 | % | |||||||||||||||
| 1-4 single family residential |
102,279 | 2.6 | % | 10,174 | 0.5 | % | 9,261 | 0.7 | % | |||||||||||||||
| Construction, land and development |
9,729 | 0.2 | % | — | 0.0 | % | 289 | 0.0 | % | |||||||||||||||
| Home equity loans and lines of credit |
54,704 | 1.4 | % | 11,998 | 0.5 | % | 18,595 | 1.4 | % | |||||||||||||||
|
|
|
|
|
|
|
|
|
|
|
|
|
|||||||||||||
| Total real estate loans |
$ | 251,700 | 6.4 | % | $ | 34,284 | 1.6 | % | $ | 42,917 | 3.2 | % | ||||||||||||
|
|
|
|
|
|
|
|
|
|
|
|
|
|||||||||||||
| Commercial and industrial |
13,548 | 0.3 | % | 5,633 | 0.2 | % | 7,828 | 0.6 | % | |||||||||||||||
| Consumer |
681 | 0.0 | % | 289 | 0.0 | % | 286 | 0.0 | % | |||||||||||||||
|
|
|
|
|
|
|
|
|
|
|
|
|
|||||||||||||
| Total Acquired Non-ASC 310-30 Loans |
265,929 | 6.7 | % | 40,206 | 1.8 | % | 51,031 | 3.8 | % | |||||||||||||||
|
|
|
|
|
|
|
|
|
|
|
|
|
|||||||||||||
| Total loans |
$ | 3,929,590 | 100.0 | % | $ | 2,258,784 | 100.0 | % | $ | 1,361,314 | 100.0 | % | ||||||||||||
|
|
|
|
|
|
|
|
|
|
|
|
|
|||||||||||||
Total loans were $3.93 billion at December 31, 2014, an increase of 74.0% compared to $2.26 billion at December 31, 2013.
Our new loan portfolio totaled $3.10 billion as of December 31, 2014, an increase of $1.33 billion, or 75.3%, from $1.77 billion as of December 31, 2013. The increase in new loans was primarily due to an increase in 1-4 single family residential loans and organic growth in commercial real estate and commercial and industrial loans. The Company purchased $377.1 million of loans during the year ended December 31, 2014. As of December 31, 2014 new loans made up 79% of our total loan portfolio as compared to 78% as of December 31, 2013.
Acquired loans were $826.2 million at December 31, 2014, an increase of 69.3% compared to $488.1 million at December 31, 2013. The increase during the year ended December 31, 2014 was primarily due to the acquisition of GFB on January 31, 2014. Acquired loans that are covered under loss sharing agreements totaled $273.4 million at December 31, 2014, a decrease of $85.9 million compared to $359.3 million at December 31, 2013. As of December 31, 2014 acquired loans made up 21% of our total loan portfolio as compared to 22% as of December 31, 2013.
60
Table of Contents
Index to Financial Statements
Loan Portfolio Maturities and Interest Rate Sensitivity
The following table summarized the loan contractual maturity distribution by type as of the period presented:
| December 31, 2014 | ||||||||||||||||
| One Year or Less |
After One but Within Five Years |
After Five Years |
Total | |||||||||||||
| (Dollars in thousands) | ||||||||||||||||
| New Loans: |
||||||||||||||||
| Real estate loans: |
||||||||||||||||
| Commercial real estate |
$ | 16,113 | $ | 500,935 | $ | 336,026 | $ | 853,074 | ||||||||
| Owner-occupied commercial real estate |
2,301 | 83,142 | 196,260 | 281,703 | ||||||||||||
| 1-4 single family residential |
3,718 | 26,699 | 892,240 | 922,657 | ||||||||||||
| Construction, land and development |
42,618 | 100,245 | 89,738 | 232,601 | ||||||||||||
| Home equity loans and lines of credit |
320 | 913 | 10,593 | 11,826 | ||||||||||||
|
|
|
|
|
|
|
|
|
|||||||||
| Total real estate loans |
65,070 | 711,934 | 1,524,857 | 2,301,861 | ||||||||||||
|
|
|
|
|
|
|
|
|
|||||||||
| Other loans: |
||||||||||||||||
| Commercial and industrial |
$ | 74,435 | $ | 637,369 | $ | 83,196 | $ | 795,000 | ||||||||
| Consumer |
3,758 | 2,741 | 57 | 6,556 | ||||||||||||
|
|
|
|
|
|
|
|
|
|||||||||
| Total other loans |
78,193 | 640,110 | 83,253 | 801,556 | ||||||||||||
|
|
|
|
|
|
|
|
|
|||||||||
| Total new loans |
$ | 143,263 | $ | 1,352,044 | $ | 1,608,110 | $ | 3,103,417 | ||||||||
|
|
|
|
|
|
|
|
|
|||||||||
| Acquired ASC 310-30 Loans: |
||||||||||||||||
| Real estate loans: |
||||||||||||||||
| Commercial real estate |
$ | 100,530 | 169,006 | 67,399 | 336,935 | |||||||||||
| Owner-occupied commercial real estate |
— | — | — | — | ||||||||||||
| 1-4 single family residential |
12,622 | 6,816 | 66,870 | 86,308 | ||||||||||||
| Construction, land and development |
29,932 | 27,311 | 9,457 | 66,700 | ||||||||||||
| Home equity loans and lines of credit |
— | — | — | — | ||||||||||||
|
|
|
|
|
|
|
|
|
|||||||||
| Total real estate loans |
143,084 | 203,133 | 143,726 | 489,943 | ||||||||||||
|
|
|
|
|
|
|
|
|
|||||||||
| Other loans: |
||||||||||||||||
| Commercial and industrial |
$ | 25,302 | $ | 32,538 | $ | 9,658 | $ | 67,498 | ||||||||
| Consumer |
763 | 874 | 1,166 | 2,803 | ||||||||||||
|
|
|
|
|
|
|
|
|
|||||||||
| Total other loans |
26,065 | 33,412 | 10,824 | 70,301 | ||||||||||||
|
|
|
|
|
|
|
|
|
|||||||||
| Total acquired ASC 310-30 loans |
$ | 169,149 | $ | 236,545 | $ | 154,550 | $ | 560,244 | ||||||||
|
|
|
|
|
|
|
|
|
|||||||||
| Acquired Non-ASC 310-30 Loans: |
||||||||||||||||
| Real estate loans: |
||||||||||||||||
| Commercial real estate |
$ | 11,684 | $ | 56,631 | $ | 1,831 | $ | 70,146 | ||||||||
| Owner-occupied commercial real estate |
2,436 | 7,077 | 5,329 | 14,842 | ||||||||||||
| 1-4 single family residential |
5,961 | 10,212 | 86,106 | 102,279 | ||||||||||||
| Construction, land and development |
3,316 | 6,413 | — | 9,729 | ||||||||||||
| Home equity loans and lines of credit |
1,812 | 5,039 | 47,853 | 54,704 | ||||||||||||
|
|
|
|
|
|
|
|
|
|||||||||
| Total real estate loans |
25,209 | 85,372 | 141,119 | 251,700 | ||||||||||||
|
|
|
|
|
|
|
|
|
|||||||||
| Other loans: |
||||||||||||||||
| Commercial and industrial |
$ | 12,091 | $ | 1,405 | $ | 52 | $ | 13,548 | ||||||||
| Consumer |
201 | 480 | — | 681 | ||||||||||||
|
|
|
|
|
|
|
|
|
|||||||||
| Total other loans |
12,292 | 1,885 | 52 | 14,229 | ||||||||||||
|
|
|
|
|
|
|
|
|
|||||||||
| Total acquired non-ASC 310-30 loans |
$ | 37,501 | $ | 87,257 | $ | 141,171 | $ | 265,929 | ||||||||
|
|
|
|
|
|
|
|
|
|||||||||
| Total Loans |
$ | 349,913 | $ | 1,675,846 | $ | 1,903,831 | $ | 3,929,590 | ||||||||
|
|
|
|
|
|
|
|
|
|||||||||
61
Table of Contents
Index to Financial Statements
The following table summarizes the loan contractual maturity distribution by related interest rate characteristics as of the period presented:
| December 31, 2014 | ||||||||
| After One but Within Five Years |
After Five Years |
|||||||
| (Dollars in thousands) | ||||||||
| New Loans: |
||||||||
| Predetermined (fixed) interest rates |
$ | 350,113 | $ | 615,169 | ||||
| Floating interest rates |
1,001,931 | 992,941 | ||||||
|
|
|
|
|
|||||
| Total |
1,352,044 | 1,608,110 | ||||||
|
|
|
|
|
|||||
| Acquired ASC 310-30 Loans: |
||||||||
| Predetermined (fixed) interest rates |
147,988 | 55,756 | ||||||
| Floating interest rates |
88,557 | 98,794 | ||||||
|
|
|
|
|
|||||
| Total |
236,545 | 154,550 | ||||||
|
|
|
|
|
|||||
| Acquired Non-ASC 310-30 Loans: |
||||||||
| Predetermined (fixed) interest rates |
68,625 | 51,522 | ||||||
| Floating interest rates |
18,632 | 89,649 | ||||||
|
|
|
|
|
|||||
| Total |
87,257 | 141,171 | ||||||
|
|
|
|
|
|||||
| Total Loans: |
||||||||
| Predetermined (fixed) interest rates |
566,726 | 722,447 | ||||||
| Floating interest rates |
1,109,120 | 1,181,384 | ||||||
|
|
|
|
|
|||||
| Total |
$ | 1,675,846 | $ | 1,903,831 | ||||
|
|
|
|
|
|||||
The expected life of our loan portfolio will differ from contractual maturities because borrowers may have the right to curtail or prepay their loans with or without prepayment penalties. Because a portion of the portfolio is accounted for under ASC 310-30, the carrying value is significantly affected by estimates and it is impracticable to allocate schedule payments for those loans based on those estimates. Consequently, the tables above include information limited to contractual maturities of the underlying loans.
62
Table of Contents
Index to Financial Statements
Asset Quality
The following table sets forth the composition of our nonperforming assets, including nonaccruals loans, accruing loans 90 days or more days past due and foreclosed assets as of the dates indicated:
| December 31, | ||||||||||||
| 2014 | 2013 | 2012 | ||||||||||
| (Dollars in thousands) | ||||||||||||
| Nonperforming Assets (Excluding acquired assets) |
||||||||||||
| Nonaccrual Loans: |
||||||||||||
| Commercial real estate |
$ | — | $ | — | $ | — | ||||||
| Owner-occupied commercial real estate |
— | — | — | |||||||||
| 1-4 single family residential |
116 | 1,052 | 427 | |||||||||
| Construction, land and development |
— | — | — | |||||||||
| Home equity loans and lines of credit |
— | — | — | |||||||||
| Commercial and industrial |
— | 24 | 88 | |||||||||
| Consumer |
— | — | — | |||||||||
|
|
|
|
|
|
|
|||||||
| Total nonaccrual loans |
116 | 1,076 | 515 | |||||||||
| Accruing loans 90 days or more past due |
— | — | — | |||||||||
|
|
|
|
|
|
|
|||||||
| Total nonperforming loans |
116 | 1,076 | 515 | |||||||||
|
|
|
|
|
|
|
|||||||
| Other real estate owned (OREO) |
— | — | — | |||||||||
| Other foreclosed property |
— | — | — | |||||||||
|
|
|
|
|
|
|
|||||||
| Total nonperforming assets (excluding acquired assets) |
$ | 116 | $ | 1,076 | $ | 515 | ||||||
|
|
|
|
|
|
|
|||||||
| Nonperforming Acquired Assets |
||||||||||||
| Nonaccrual Loans: |
||||||||||||
| Commercial real estate |
$ | 4,866 | $ | 5,400 | $ | 5,421 | ||||||
| Owner-occupied commercial real estate |
211 | 562 | 928 | |||||||||
| 1-4 single family residential |
1,766 | 144 | 186 | |||||||||
| Construction, land and development |
1,595 | 16,753 | — | |||||||||
| Home equity loans and lines of credit |
3,005 | 1,996 | 2,433 | |||||||||
| Commercial and industrial |
7,851 | 7,580 | 476 | |||||||||
| Consumer |
— | 644 | — | |||||||||
|
|
|
|
|
|
|
|||||||
| Total nonaccrual loans |
19,294 | 33,079 | 9,444 | |||||||||
| Accruing loans 90 days or more past due |
— | — | — | |||||||||
|
|
|
|
|
|
|
|||||||
| Total nonperforming loans |
19,294 | 33,079 | 9,444 | |||||||||
|
|
|
|
|
|
|
|||||||
| Other real estate owned (OREO) |
74,527 | 34,682 | 57,767 | |||||||||
| Other foreclosed property |
— | — | 2 | |||||||||
|
|
|
|
|
|
|
|||||||
| Total acquired nonperforming assets |
$ | 93,821 | $ | 67,761 | $ | 67,213 | ||||||
|
|
|
|
|
|
|
|||||||
| Total nonperforming assets |
$ | 93,937 | $ | 68,837 | $ | 67,728 | ||||||
|
|
|
|
|
|
|
|||||||
Nonaccrual loans totaled $19.4 million at December 31, 2014, a decrease of 43.2% from $34.2 million at December 31, 2013. Excluding acquired loans, nonperforming loans totaled $116 thousand at December 31, 2014, a decrease of 89.2% from $1.1 million at December 31, 2013.
Nonperforming assets totaled $93.9 million at December 31, 2014, an increase of $25.1 million, or 36.5%, from December 31, 2013. Excluding acquired assets, nonperforming assets totaled $116 thousand at December 31, 2014, a decrease of 89.2% from $1.1 million at December 31, 2013.
63
Table of Contents
Index to Financial Statements
Our policies related to when loans are placed on nonaccrual status conform to guidelines prescribed by bank regulatory authorities. Loans are placed on nonaccrual status when it is probable that principal or interest is not fully collectible, or generally when principal or interest becomes 90 days past due, whichever occurs first. Certain loans past due 90 days or more may remain on accrual status if management determines that it does not have concern over the collectability of principal and interest because the loan is secured by assets with a value in excess of the amounts owed and is in the process of collection. Loans are removed from nonaccrual status when they become current as to both principal and interest and concern no longer exists as to the collectability of principal and interest.
Loans accounted for under ASC 310-30 that are delinquent and/or on nonaccrual status continue to accrue income provided the respective pool in which those assets reside maintains a discount and recognizes accretion income. The aforementioned loans are characterized as performing loans greater than 90 days past due. If the pool no longer has a discount and accretion income can no longer be recognized, any loan within that pool on nonaccrual status will be classified as nonaccrual for presentation purposes.
Loans are identified for restructuring based on their delinquency status, risk rating downgrade, or at the request of the borrower. Borrowers that are 90 days delinquent and/or have a history of being delinquent, or experience a risk rating downgrade, are contacted to discuss options to bring the loan current, cure credit risk deficiencies, or other potential restructuring options that will reduce the inherent risk and improve collectability of the loan. In some instances, a borrower will initiate a request for loan restructure. The Bank requires borrowers to provide current financial information to establish the need for financial assistance and satisfy applicable prerequisite conditions required by the Bank. The Bank may also require the borrower to enter into a forbearance agreement.
Modification of loan terms may include the following: reduction of the stated interest rate; extension of maturity date or other payment dates; reduction of the face amount or maturity amount of the loan; reduction in accrued interest; forgiveness of past-due interest; or a combination of the above.
The following table sets forth our asset quality ratios for the periods presented:
| Years Ended December 31, | ||||||||||||
| 2014 | 2013 | 2012 | ||||||||||
| Asset Quality Ratios |
||||||||||||
| Asset and Credit Quality Ratios - New Loans |
||||||||||||
| Nonperforming new loans to new loans receivable |
0.00 | % | 0.06 | % | 0.07 | % | ||||||
| New loan ALL to total gross new loans |
0.52 | % | 0.47 | % | 0.71 | % | ||||||
| Asset and Credit Quality Ratios - Acquired Loans |
||||||||||||
| Nonperforming acquired loans to acquired loans receivable |
2.34 | % | 6.78 | % | 1.50 | % | ||||||
| Covered acquired loans to total gross acquired loans |
33.09 | % | 73.60 | % | 75.70 | % | ||||||
| Acquired loan ALL to total gross acquired loans |
0.83 | % | 1.32 | % | 2.18 | % | ||||||
| Asset and Credit Quality Ratios - Total loans |
||||||||||||
| Nonperforming loans to loans receivable |
0.49 | % | 1.51 | % | 0.73 | % | ||||||
| Nonperforming assets to total assets |
1.58 | % | 1.73 | % | 2.09 | % | ||||||
| Covered loans to total gross loans |
6.96 | % | 15.90 | % | 35.13 | % | ||||||
| ALL to nonperforming assets |
24.36 | % | 21.40 | % | 27.98 | % | ||||||
| ALL to total gross loans |
0.58 | % | 0.65 | % | 1.39 | % | ||||||
64
Table of Contents
Index to Financial Statements
Analysis of the Allowance for Loan Losses
The ALL reflects management’s estimate of probable credit losses inherent in the loan portfolio. The computation of the ALL includes elements of judgment and high levels of subjectivity. As a portion of the Company’s loans were acquired in failed bank acquisitions and were purchased at a substantial discount to their original book value, we segregate loans into three buckets when assessing and analyzing the ALL: new loans, acquired ASC 310-30 loans, acquired Non-ASC 310-30 loans.
The following tables summarize the allocation of the ALL related to our loans for the periods presented. This allocation is calculated on an approximate basis and is not necessarily indicative of future losses or allocations. The entire amount of the allowance is available to absorb losses occurring in any category of loans.
| Commercial Real Estate |
Owner- Occupied Commercial Real Estate |
1- 4 Single Family Residential |
Construction, Land and Development |
Home Equity Loans and Lines of Credit |
Commercial and Industrial |
Consumer | Total | |||||||||||||||||||||||||
| (Dollars in thousands) | ||||||||||||||||||||||||||||||||
| Balance at January 1, 2014 |
$ | 4,458 | $ | 376 | $ | 1,443 | $ | 1,819 | $ | 265 | $ | 6,198 | $ | 174 | $ | 14,733 | ||||||||||||||||
|
|
|
|
|
|
|
|
|
|
|
|
|
|
|
|
|
|||||||||||||||||
| Provision (credit) for ASC 310-30 loans |
735 | — | 271 | 107 | — | (716 | ) | 245 | 642 | |||||||||||||||||||||||
| Provision (credit) for non-ASC 310-30 loans |
490 | 53 | 362 | 75 | 442 | 67 | 35 | 1,524 | ||||||||||||||||||||||||
| Provision (credit) for New loans |
2,678 | 591 | 2,695 | 895 | (56 | ) | 1,229 | 45 | 8,077 | |||||||||||||||||||||||
|
|
|
|
|
|
|
|
|
|
|
|
|
|
|
|
|
|||||||||||||||||
| Total provision |
3,903 | 644 | 3,328 | 1,077 | 386 | 580 | 325 | 10,243 | ||||||||||||||||||||||||
|
|
|
|
|
|
|
|
|
|
|
|
|
|
|
|
|
|||||||||||||||||
| Charge-offs for ASC 310-30 loans |
(270 | ) | — | (31 | ) | (1,244 | ) | — | (678 | ) | (113 | ) | (2,336 | ) | ||||||||||||||||||
| Charge-offs for non-ASC 310-30 loans |
— | — | — | — | (296 | ) | (24 | ) | (29 | ) | (349 | ) | ||||||||||||||||||||
| Charge-offs for New loans |
— | — | — | (6 | ) | — | (348 | ) | — | (354 | ) | |||||||||||||||||||||
|
|
|
|
|
|
|
|
|
|
|
|
|
|
|
|
|
|||||||||||||||||
| Total charge-offs |
(270 | ) | — | (31 | ) | (1,250 | ) | (296 | ) | (1,050 | ) | (142 | ) | (3,039 | ) | |||||||||||||||||
|
|
|
|
|
|
|
|
|
|
|
|
|
|
|
|
|
|||||||||||||||||
| Recoveries for ASC 310-30 loans |
115 | — | — | 810 | — | 13 | 1 | 939 | ||||||||||||||||||||||||
| Recoveries for non-ASC 310-30 loans |
— | — | — | — | — | — | — | — | ||||||||||||||||||||||||
| Recoveries for New loans |
— | — | — | — | — | 4 | — | 4 | ||||||||||||||||||||||||
|
|
|
|
|
|
|
|
|
|
|
|
|
|
|
|
|
|||||||||||||||||
| Total recoveries |
115 | — | — | 810 | — | 17 | 1 | 943 | ||||||||||||||||||||||||
|
|
|
|
|
|
|
|
|
|
|
|
|
|
|
|
|
|||||||||||||||||
| Ending ALL balance |
||||||||||||||||||||||||||||||||
| ASC 310-30 loans |
3,255 | — | 325 | 658 | — | 958 | 290 | 5,486 | ||||||||||||||||||||||||
| Non-ASC 310-30 loans |
495 | 58 | 414 | 75 | 285 | 49 | 6 | 1,382 | ||||||||||||||||||||||||
| New loans |
4,456 | 962 | 4,001 | 1,723 | 70 | 4,738 | 62 | 16,012 | ||||||||||||||||||||||||
|
|
|
|
|
|
|
|
|
|
|
|
|
|
|
|
|
|||||||||||||||||
| Balance at December 31, 2014 |
$ | 8,206 | $ | 1,020 | $ | 4,740 | $ | 2,456 | $ | 355 | $ | 5,745 | $ | 358 | $ | 22,880 | ||||||||||||||||
|
|
|
|
|
|
|
|
|
|
|
|
|
|
|
|
|
|||||||||||||||||
| Commercial Real Estate |
Owner- Occupied Commercial Real Estate |
1- 4 Single Family Residential |
Construction, Land and Development |
Home Equity Loans and Lines of Credit |
Commercial and Industrial |
Consumer | Total | |||||||||||||||||||||||||
| (Dollars in thousands) | ||||||||||||||||||||||||||||||||
| Balance at January 1, 2013 |
$ | 3,734 | $ | 373 | $ | 3,049 | $ | 5,239 | $ | 67 | $ | 6,054 | $ | 433 | $ | 18,949 | ||||||||||||||||
|
|
|
|
|
|
|
|
|
|
|
|
|
|
|
|
|
|||||||||||||||||
| Provision (credit) for ASC 310-30 loans |
1,263 | — | (1,558 | ) | 601 | — | (1,493 | ) | 510 | (677 | ) | |||||||||||||||||||||
| Provision (credit) for non-ASC 310-30 loans |
(3 | ) | (7 | ) | 30 | (3 | ) | 415 | (130 | ) | (4 | ) | 298 | |||||||||||||||||||
| Provision (credit) for New loans |
541 | 10 | 684 | (141 | ) | 122 | 2,120 | (43 | ) | 3,293 | ||||||||||||||||||||||
|
|
|
|
|
|
|
|
|
|
|
|
|
|
|
|
|
|||||||||||||||||
| Total provision |
1,801 | 3 | (844 | ) | 457 | 537 | 497 | 463 | 2,914 | |||||||||||||||||||||||
|
|
|
|
|
|
|
|
|
|
|
|
|
|
|
|
|
|||||||||||||||||
| Charge-offs for ASC 310-30 loans |
(1,387 | ) | — | (830 | ) | (4,052 | ) | — | (201 | ) | (723 | ) | (7,193 | ) | ||||||||||||||||||
| Charge-offs for non-ASC 310-30 loans |
— | — | — | — | (339 | ) | (163 | ) | — | (502 | ) | |||||||||||||||||||||
| Charge-offs for New loans |
— | — | — | (193 | ) | — | — | — | (193 | ) | ||||||||||||||||||||||
|
|
|
|
|
|
|
|
|
|
|
|
|
|
|
|
|
|||||||||||||||||
| Total charge-offs |
(1,387 | ) | — | (830 | ) | (4,245 | ) | (339 | ) | (364 | ) | (723 | ) | (7,888 | ) | |||||||||||||||||
|
|
|
|
|
|
|
|
|
|
|
|
|
|
|
|
|
|||||||||||||||||
| Recoveries for ASC 310-30 loans |
310 | — | 68 | 368 | — | 11 | 1 | 758 | ||||||||||||||||||||||||
| Recoveries for non-ASC 310-30 loans |
— | — | — | — | — | — | — | — | ||||||||||||||||||||||||
| Recoveries for New loans |
— | — | — | — | — | — | — | — | ||||||||||||||||||||||||
|
|
|
|
|
|
|
|
|
|
|
|
|
|
|
|
|
|||||||||||||||||
| Total recoveries |
310 | — | 68 | 368 | — | 11 | 1 | 758 | ||||||||||||||||||||||||
|
|
|
|
|
|
|
|
|
|
|
|
|
|
|
|
|
|||||||||||||||||
| Ending ALL balance |
||||||||||||||||||||||||||||||||
| ASC 310-30 loans |
2,675 | — | 85 | 985 | — | 2,339 | 157 | 6,241 | ||||||||||||||||||||||||
| Non-ASC 310-30 loans |
5 | 5 | 52 | — | 139 | 6 | — | 207 | ||||||||||||||||||||||||
| New loans |
1,778 | 371 | 1,306 | 834 | 126 | 3,853 | 17 | 8,285 | ||||||||||||||||||||||||
|
|
|
|
|
|
|
|
|
|
|
|
|
|
|
|
|
|||||||||||||||||
| Balance at December 31, 2013 |
$ | 4,458 | $ | 376 | $ | 1,443 | $ | 1,819 | $ | 265 | $ | 6,198 | $ | 174 | $ | 14,733 | ||||||||||||||||
|
|
|
|
|
|
|
|
|
|
|
|
|
|
|
|
|
|||||||||||||||||
65
Table of Contents
Index to Financial Statements
| Commercial Real Estate |
Owner- Occupied Commercial Real Estate |
1- 4 Single Family Residential |
Construction, Land and Development |
Home Equity Loans and Lines of Credit |
Commercial and Industrial |
Consumer | Total | |||||||||||||||||||||||||
| (Dollars in thousands) | ||||||||||||||||||||||||||||||||
| Balance at January 1, 2012 |
$ | 1,271 | $ | 446 | $ | 5,464 | $ | 1,844 | $ | 84 | $ | 8,628 | $ | 105 | $ | 17,842 | ||||||||||||||||
|
|
|
|
|
|
|
|
|
|
|
|
|
|
|
|
|
|||||||||||||||||
| Provision (credit) for ASC 310-30 loans |
10,255 | — | (1,667 | ) | 11,065 | — | 3,473 | 594 | 23,720 | |||||||||||||||||||||||
| Provision (credit) for non-ASC 310-30 loans |
96 | (39 | ) | 18 | (35 | ) | 9 | 718 | 49 | 816 | ||||||||||||||||||||||
| Provision (credit) for New loans |
673 | (34 | ) | 466 | 609 | 4 | (200 | ) | 47 | 1,565 | ||||||||||||||||||||||
|
|
|
|
|
|
|
|
|
|
|
|
|
|
|
|
|
|||||||||||||||||
| Total provision |
11,024 | (73 | ) | (1,183 | ) | 11,639 | 13 | 3,991 | 690 | 26,101 | ||||||||||||||||||||||
|
|
|
|
|
|
|
|
|
|
|
|
|
|
|
|
|
|||||||||||||||||
| Charge-offs for ASC 310-30 loans |
(8,742 | ) | (1,232 | ) | (8,273 | ) | — | (4,574 | ) | (310 | ) | (23,131 | ) | |||||||||||||||||||
| Charge-offs for non-ASC 310-30 loans |
(104 | ) | — | — | (23 | ) | (30 | ) | (1,991 | ) | (52 | ) | (2,200 | ) | ||||||||||||||||||
| Charge-offs for New loans |
— | — | — | (91 | ) | — | — | — | (91 | ) | ||||||||||||||||||||||
|
|
|
|
|
|
|
|
|
|
|
|
|
|
|
|
|
|||||||||||||||||
| Total charge-offs |
(8,846 | ) | — | (1,232 | ) | (8,387 | ) | (30 | ) | (6,565 | ) | (362 | ) | (25,422 | ) | |||||||||||||||||
|
|
|
|
|
|
|
|
|
|
|
|
|
|
|
|
|
|||||||||||||||||
| Recoveries for ASC 310-30 loans |
285 | — | — | 143 | — | — | — | 428 | ||||||||||||||||||||||||
| Recoveries for non-ASC 310-30 loans |
— | — | — | — | — | — | — | — | ||||||||||||||||||||||||
| Recoveries for New loans |
— | — | — | — | — | — | — | — | ||||||||||||||||||||||||
|
|
|
|
|
|
|
|
|
|
|
|
|
|
|
|
|
|||||||||||||||||
| Total recoveries |
285 | — | — | 143 | — | — | — | 428 | ||||||||||||||||||||||||
|
|
|
|
|
|
|
|
|
|
|
|
|
|
|
|
|
|||||||||||||||||
| Ending ALL balance |
||||||||||||||||||||||||||||||||
| ASC 310-30 loans |
2,489 | — | 2,405 | 4,068 | — | 4,022 | 369 | 13,353 | ||||||||||||||||||||||||
| Non-ASC 310-30 loans |
8 | 12 | 22 | 3 | 63 | 299 | 4 | 411 | ||||||||||||||||||||||||
| New loans |
1,237 | 361 | 622 | 1,168 | 4 | 1,733 | 60 | 5,185 | ||||||||||||||||||||||||
|
|
|
|
|
|
|
|
|
|
|
|
|
|
|
|
|
|||||||||||||||||
| Balance at December 31, 2012 |
$ | 3,734 | $ | 373 | $ | 3,049 | $ | 5,239 | $ | 67 | $ | 6,054 | $ | 433 | $ | 18,949 | ||||||||||||||||
|
|
|
|
|
|
|
|
|
|
|
|
|
|
|
|
|
|||||||||||||||||
As of December 31, 2014, all of our new loans are performing and have exhibited limited delinquency and credit loss history to establish an observable loss trend. Given this lack of sufficient loss history on the new loan portfolio, general loan loss factors are established based on the following: historical loss factors derived from the Federal Financial Institutions Examination Council’s quarterly Unified Performance Branch Report for Group 1 banks (assets greater than $3 billion) using an annualized weighted average eight quarter rolling basis segment by portfolio and asset categories within those portfolio segments. The historical loss factors are adjusted to reflect trends in delinquencies and nonaccruals by loan portfolio segment, current industry conditions, including real estate market trends; general economic conditions; credit concentrations by portfolio and asset categories; and portfolio quality, which encompasses an assessment of the quality and relevance of borrowers’ financial information and collateral valuations and average risk rating and migration trends within portfolios and asset categories. Other adjustments for qualitative factors may be made to the allowance after an assessment of internal and external influences on credit quality and loss severity that are not fully reflected in the historical loss or risk rating data. For these measurements, the Company uses assumptions and methodologies that are relevant to estimating the level of impairment and probable losses in the loan portfolio. To the extent that the data supporting such assumptions has limitations, management’s judgment and experience play a role in recording the allowance estimates. Qualitative adjustments are considered for: portfolio credit quality trends, including levels of delinquency, charge-offs, nonaccrual, restructuring and other factors; policy and credit standards, including quality and experience of lending and credit management; and general economic factors, including national, regional and local conditions and trends.
The ALL increased $8.1 million to $22.9 million at December 31, 2014 from $14.7 million at December 31, 2013, primarily due to the increase in new loans of $1.33 billion. The ALL as a percentage of nonperforming assets and ALL as a percentage of total gross loans was 24.36% and 0.58% as of December 31, 2014, compared to 21.40% and 0.65% at December 31, 2013. The ratio of ALL to total gross loans declined primarily due to the increase in the ratio of new loans to total loans which have a lower ALL compared to our acquired loan portfolio due to the higher credit quality of our new loan portfolio which have exhibited limited delinquency.
Net loan charge-offs for the year ended December 31, 2014 totaled $2.1 million, a decrease of 70.6% compared to $7.1 million for the same period of 2013. Net loan charge-offs for the year ended December 31, 2013 totaled $7.1 million, a decrease of 71.5% compared to $25.0 million for the same period of 2012. The ratio of net charge-offs to average new loans outstanding during the years ended December 31, 2014, 2013 and 2012 was 0.02%, 0.02% and 0.02%, respectively. The ratio of net charge-offs to average acquired loans outstanding during the years ended December 31, 2014, 2013 and 2012 was 0.20%, 1.27% and 3.43%, respectively. The ratio of net charge-offs to total average loans outstanding during the years ended December 31, 2014, 2013 and 2012 was 0.07%, 0.42% and 1.98%, respectively. The Company anticipates the new loan portfolio to perform as agreed with de minimis charge-offs over the next 12 months and expects the acquired loan portfolio to perform at current levels.
66
Table of Contents
Index to Financial Statements
The following table provides the allocation of the allowance for loan loss as of the periods presented:
|
|
December 31, |
|
||||||||||||||||||||||
| 2014 | 2013 | 2012 | ||||||||||||||||||||||
| Amount | % Loans in each category |
Amount | % Loans in each category |
Amount | % Loans in each category |
|||||||||||||||||||
| (Dollars in thousands) | ||||||||||||||||||||||||
| New Loans: |
||||||||||||||||||||||||
| Real estate loans: |
||||||||||||||||||||||||
| Commercial real estate |
$ | 4,456 | 21.7 | % | $ | 1,778 | 22.7 | % | $ | 1,237 | 15.6 | % | ||||||||||||
| Owner-occupied commercial real estate |
962 | 7.2 | % | 371 | 6.9 | % | 361 | 6.8 | % | |||||||||||||||
| 1-4 single family residential |
4,001 | 23.5 | % | 1,306 | 15.9 | % | 622 | 5.2 | % | |||||||||||||||
| Construction, land and development |
1,723 | 5.9 | % | 834 | 3.3 | % | 1,168 | 4.1 | % | |||||||||||||||
| Home equity loans and lines of credit |
70 | 0.3 | % | 126 | 0.9 | % | 4 | 0.0 | % | |||||||||||||||
|
|
|
|
|
|
|
|
|
|
|
|
|
|||||||||||||
| Total real estate loans |
11,212 | 58.6 | % | 4,415 | 49.7 | % | 3,392 | 31.7 | % | |||||||||||||||
|
|
|
|
|
|
|
|
|
|
|
|
|
|||||||||||||
| Other loans: |
||||||||||||||||||||||||
| Commercial and industrial |
4,738 | 20.2 | % | 3,853 | 28.6 | % | 1,733 | 21.7 | % | |||||||||||||||
| Consumer |
62 | 0.2 | % | 17 | 0.1 | % | 60 | 0.2 | % | |||||||||||||||
|
|
|
|
|
|
|
|
|
|
|
|
|
|||||||||||||
| Total other loans |
4,800 | 20.4 | % | 3,870 | 28.7 | % | 1,793 | 21.9 | % | |||||||||||||||
|
|
|
|
|
|
|
|
|
|
|
|
|
|||||||||||||
| Total new loans |
$ | 16,012 | 79.0 | % | $ | 8,285 | 78.4 | % | $ | 5,185 | 53.6 | % | ||||||||||||
|
|
|
|
|
|
|
|
|
|
|
|
|
|||||||||||||
| Acquired ASC 310-30 Loans: |
||||||||||||||||||||||||
| Real estate loans: |
||||||||||||||||||||||||
| Commercial real estate |
$ | 3,255 | 8.6 | % | $ | 2,675 | 12.1 | % | $ | 2,489 | 24.3 | % | ||||||||||||
| 1-4 single family residential |
325 | 2.2 | % | 85 | 2.5 | % | 2,405 | 5.0 | % | |||||||||||||||
| Construction, land and development |
658 | 1.7 | % | 985 | 2.5 | % | 4,068 | 7.3 | % | |||||||||||||||
| Home equity loans and lines of credit |
— | 0.0 | % | — | 0.0 | % | — | 0.0 | % | |||||||||||||||
|
|
|
|
|
|
|
|
|
|
|
|
|
|||||||||||||
| Total real estate loans |
4,238 | 12.5 | % | 3,745 | 17.1 | % | 8,962 | 36.6 | % | |||||||||||||||
|
|
|
|
|
|
|
|
|
|
|
|
|
|||||||||||||
| Other loans: |
||||||||||||||||||||||||
| Commercial and industrial |
958 | 1.7 | % | 2,339 | 2.5 | % | 4,022 | 5.4 | % | |||||||||||||||
| Consumer |
290 | 0.1 | % | 157 | 0.2 | % | 369 | 0.6 | % | |||||||||||||||
|
|
|
|
|
|
|
|
|
|
|
|
|
|||||||||||||
| Total other loans |
1,248 | 1.8 | % | 2,496 | 2.7 | % | 4,391 | 6.0 | % | |||||||||||||||
|
|
|
|
|
|
|
|
|
|
|
|
|
|||||||||||||
| Total Acquired ASC 310-30 Loans |
$ | 5,486 | 14.3 | % | $ | 6,241 | 19.8 | % | $ | 13,353 | 42.6 | % | ||||||||||||
|
|
|
|
|
|
|
|
|
|
|
|
|
|||||||||||||
| Acquired Non-ASC 310-30 Loans: |
||||||||||||||||||||||||
| Real estate loans: |
||||||||||||||||||||||||
| Commercial real estate |
$ | 495 | 1.8 | % | $ | 5 | 0.5 | % | $ | 8 | 0.8 | % | ||||||||||||
| Owner-occupied commercial real estate |
58 | 0.4 | % | 5 | 0.1 | % | 12 | 0.3 | % | |||||||||||||||
| 1-4 single family residential |
414 | 2.6 | % | 52 | 0.5 | % | 22 | 0.7 | % | |||||||||||||||
| Construction, land and development |
75 | 0.2 | % | — | 0.0 | % | 3 | 0.0 | % | |||||||||||||||
| Home equity loans and lines of credit |
285 | 1.4 | % | 139 | 0.5 | % | 63 | 1.4 | % | |||||||||||||||
|
|
|
|
|
|
|
|
|
|
|
|
|
|||||||||||||
| Total real estate loans |
1,327 | 6.4 | % | 201 | 1.6 | % | 108 | 3.2 | % | |||||||||||||||
|
|
|
|
|
|
|
|
|
|
|
|
|
|||||||||||||
| Other loans: |
||||||||||||||||||||||||
| Commercial and industrial |
49 | 0.3 | % | 6 | 0.2 | % | 299 | 0.6 | % | |||||||||||||||
| Consumer |
6 | 0.0 | % | — | 0.0 | % | 4 | 0.0 | % | |||||||||||||||
|
|
|
|
|
|
|
|
|
|
|
|
|
|||||||||||||
| Total other loans |
55 | 0.3 | % | 6 | 0.2 | % | 303 | 0.6 | % | |||||||||||||||
|
|
|
|
|
|
|
|
|
|
|
|
|
|||||||||||||
| Total Acquired Non-ASC 310-30 Loans |
$ | 1,382 | 6.7 | % | $ | 207 | 1.8 | % | $ | 411 | 3.8 | % | ||||||||||||
|
|
|
|
|
|
|
|
|
|
|
|
|
|||||||||||||
| Total Loans |
$ | 22,880 | 100.0 | % | $ | 14,733 | 100.0 | % | $ | 18,949 | 100.0 | % | ||||||||||||
|
|
|
|
|
|
|
|
|
|
|
|
|
|||||||||||||
67
Table of Contents
Index to Financial Statements
FDIC Loss Share Indemnification Asset
Pursuant to purchase and assumption agreements with the FDIC, the Bank has entered into loss share agreements in which the FDIC will reimburse the Company for certain amounts related to certain acquired loans and OREO should the Company experience a loss during the term of the agreement. Substantially all of the loan portfolios and OREO acquired from six of the nine acquisitions are covered under loss sharing arrangements with the FDIC.
The Company reviews and updates the cash flows expected to be collected on Covered Assets and the FDIC loss share indemnification asset on a quarterly basis as loss and recovery estimates related to Covered Assets may change. Decreases in the amount of cash flows expected to be collected on Covered Loans after acquisition result in a provision for loan losses, an increase in the ALL, and a proportional increase to the FDIC loss share indemnification asset and income for the estimated amount to be reimbursed. Increases in the amount of cash flow expected to be collected on Covered Loans after acquisition result in the reversal of any previously recorded provision for loan losses and related ALL and a decrease to the FDIC loss share indemnification asset, or prospective adjustment to the accretable discount if no provision for loan losses had been previously recorded. If no provision for loan losses had been previously recorded, improvements in the expected cash flows from the Covered Loans, which is reflected as an adjustment to yield and accreted into income over the remaining expected term of the loans, decreases the expected cash flows to be collected from the loss sharing agreement, with such decrease reducing the yield to be accreted on a prospective basis if the total expected cash flows from the loss sharing agreement exceeds its carrying amount; and, if the carrying amount of the FDIC loss share indemnification asset exceeds the total expected cash flows, the excess is amortized as a reduction of income over the shorter of (1) the remaining expected term of the respective loans or (2) the remaining term of the FDIC loss share agreement.
The following tables summarize the activity related to the FDIC loss share indemnification asset for the periods indicated.
| December 31, | ||||||||||||
| 2014 | 2013 | 2012 | ||||||||||
| (Dollars in thousands) | ||||||||||||
| Balance at beginning of period |
$ | 87,229 | $ | 125,949 | $ | 210,813 | ||||||
| Reimbursable expenses |
4,999 | 9,372 | 14,653 | |||||||||
| Amortization |
(24,653 | ) | (25,126 | ) | (33,897 | ) | ||||||
| Income resulting from impairment and charge-off of covered assets, net |
3,948 | 2,209 | 22,791 | |||||||||
| Expense resulting from recoupment and disposition of covered assets, net |
(3,627 | ) | (5,201 | ) | (6,488 | ) | ||||||
| FDIC claims submissions |
(4,728 | ) | (19,974 | ) | (81,923 | ) | ||||||
|
|
|
|
|
|
|
|||||||
| Balance at end of period |
$ | 63,168 | $ | 87,229 | $ | 125,949 | ||||||
|
|
|
|
|
|
|
|||||||
The loss sharing agreements between the Company and the FDIC for the Old Premier, Old FCB, Old Peninsula, Old Cortez, Old FNBCF and Old Coastal acquisitions include clawback provisions that obligate the Company to pay the FDIC a certain amount in the event that losses incurred by the Company with respect to the loss sharing agreements do not reach a threshold specified in the applicable loss sharing agreement upon expiration of the loss sharing agreement.
The provisions of the loss sharing agreements for the Old Premier and Old FCB acquisitions may require the Company to pay the FDIC, within 45 days of the loss sharing agreement expiration date, 50% of the excess of 20% of the stated threshold, less the sum of (a) 25% of the asset discount amount, (b) 25% of the cumulative shared loss payments and (c) the cumulative servicing amount. The provisions of the loss sharing agreements for the Old Peninsula, Old Cortez, Old FNBCF and Old Coastal acquisitions may require the Company to pay the FDIC, within 45 days of the loss sharing agreement expiration date, 50% of the excess of 20% of the intrinsic loss estimate, less the sum of (a) 20% of the net loss amount, (b) 25% of the asset discount bid and (c) 3.5% of the Covered Assets on the acquisition date.
68
Table of Contents
Index to Financial Statements
At the date of acquisition, the Company recognizes a clawback liability equal to the present value of the discounted future cash flows expected to be paid to the FDIC in connection with the clawback provisions of the loss sharing agreement. The discount rate utilized to estimate the FDIC clawback liability is based on an equivalent of an AA credit rated corporate debt securities that we believe appropriately reflects the Company’s credit risk profile. The clawback liability is re-measured quarterly based on the terms of the applicable loss sharing agreement, changes in projected losses on Covered Assets and the cumulative servicing amount, if applicable. The Company amortizes the discount on the clawback liability by recognizing an expense that is recorded in Loss share indemnification income (loss) in our consolidated financial statements.
The Company evaluates, on a periodic basis, whether the result of its collection efforts on assets covered under loss sharing agreements have had an impact on the expected balance, if any, to be paid to the FDIC.
The following table summarizes the changes in the clawback liability, included in Other Liabilities of the consolidated financial statements, for the periods presented:
| December 31, | ||||||||||||
| 2014 | 2013 | 2012 | ||||||||||
| (Dollars in thousands) | ||||||||||||
| Balance at beginning of period |
$ | 11,753 | $ | 11,966 | $ | 11,438 | ||||||
| Amortization impact |
748 | 744 | 702 | |||||||||
| Remeasurement impact |
1,345 | (957 | ) | (174 | ) | |||||||
|
|
|
|
|
|
|
|||||||
| Balance at end of period |
$ | 13,846 | $ | 11,753 | $ | 11,966 | ||||||
|
|
|
|
|
|
|
|||||||
See Note 20 “Subsequent Events” in the “Notes to Consolidated Financial Statements” for additional information regarding the FDIC indemnification asset and the FDIC clawback liability.
Other Real Estate Owned
The following table shows the composition of OREO as of the periods presented:
| December 31, | ||||||||
| 2014 | 2013 | |||||||
| (Dollars in thousands) | ||||||||
| Commercial real estate |
$ | 22,267 | $ | 16,410 | ||||
| 1-4 single family residential |
12,623 | 4,887 | ||||||
| Construction, land and development |
39,637 | 13,385 | ||||||
|
|
|
|
|
|||||
| Total |
$ | 74,527 | $ | 34,682 | ||||
|
|
|
|
|
|||||
The following table summarized the activity related to OREO for the periods presented:
| December 31, | ||||||||||||
| 2014 | 2013 | 2012 | ||||||||||
| (Dollars in thousands) | ||||||||||||
| Balance at beginning of period |
$ | 34,682 | $ | 57,767 | $ | 65,640 | ||||||
| Additions from acquisition |
55,085 | — | — | |||||||||
| Transfers from loan portfolio |
22,399 | 27,535 | 47,977 | |||||||||
| Impairments |
(2,690 | ) | (3,580 | ) | (10,320 | ) | ||||||
| Sales |
(34,949 | ) | (47,040 | ) | (45,530 | ) | ||||||
|
|
|
|
|
|
|
|||||||
| Balance at end of period |
$ | 74,527 | $ | 34,682 | $ | 57,767 | ||||||
|
|
|
|
|
|
|
|||||||
69
Table of Contents
Index to Financial Statements
Total OREO held by the Company was $74.5 million as of December 31, 2014, an increase of $39.8 million from December 31, 2013. The increase in OREO was due to $55.1 million of additions to OREO as a result of the GFB acquisition and $22.4 million of additions to OREO through loan foreclosures partially offset by OREO sales of $34.9 million.
We expect that OREO will generally continue to decrease in the future as there will be less transfers from the loan portfolio and reductions due to disposition activity. However, OREO may increase in future periods as a result of future business combinations or increased foreclosure activity.
Bank-owned Life Insurance
BOLI policies are held in order to insure the key officers and employees of the Bank. Per ASC 325-30, “Investments in Insurance Contracts,” this policy is recorded at the cash surrender value adjusted for other charges or other amounts due that are probable at settlement, if applicable.
The following table summarizes the changes in the cash surrender value of BOLI for the periods presented:
| December 31, | ||||||||||||
| 2014 | 2013 | 2012 | ||||||||||
| (Dollars in thousands) | ||||||||||||
| Balance at beginning of period |
$ | 75,257 | $ | — | $ | — | ||||||
| Additions from premium payments |
60,000 | 75,000 | — | |||||||||
| Net gain in cash surrender value |
4,175 | 257 | — | |||||||||
| Mortality proceeds receivable |
1,193 | — | — | |||||||||
| Mortality-related reduction in cash surrender value |
(796 | ) | — | — | ||||||||
|
|
|
|
|
|
|
|||||||
| Balance at end of period |
$ | 139,829 | $ | 75,257 | $ | — | ||||||
|
|
|
|
|
|
|
|||||||
As of December 31, 2014 and 2013, the BOLI cash surrender value was $139.8 million and $75.3 million, respectively. The Company recognized $4.2 million and $257 thousand of BOLI income for the years ended December 31, 2014 and 2013 resulting in a pre-tax yield of 3.31% and 3.60%, respectively. The Bank did not hold BOLI policies during the year ended December 31, 2012. The total death benefit of the BOLI policies at December 31, 2014 and 2013 totaled $437.0 million and $251.2 million, respectively.
Deposits
We expect deposits to be our primary funding source in the future as we continue to optimize our deposit mix and lower our cost of deposits by reducing rate sensitive time deposits. In the future, we expect commercial deposits to drive our core deposit growth.
The following table shows the deposit mix as of the periods presented:
| December 31, | ||||||||||||||||
| 2014 | 2013 | |||||||||||||||
| Amount | Percent of Total |
Amount | Percent of Total |
|||||||||||||
| (Dollars in thousands) | ||||||||||||||||
| Noninterest-bearing demand deposits |
$ | 593,025 | 14.9 | % | $ | 291,658 | 10.5 | % | ||||||||
| Interest-bearing demand deposits |
122,380 | 3.1 | % | — | 0.0 | % | ||||||||||
| Interest-bearing NOW accounts |
374,399 | 9.4 | % | 84,837 | 3.0 | % | ||||||||||
| Savings and money market accounts |
1,811,878 | 45.5 | % | 1,251,842 | 44.8 | % | ||||||||||
| Time deposits |
1,076,853 | 27.1 | % | 1,165,196 | 41.7 | % | ||||||||||
|
|
|
|
|
|
|
|
|
|||||||||
| Total deposits |
$ | 3,978,535 | 100.0 | % | $ | 2,793,533 | 100.0 | % | ||||||||
|
|
|
|
|
|
|
|
|
|||||||||
70
Table of Contents
Index to Financial Statements
Total deposits at December 31, 2014 totaled $3.98 billion, an increase of $1.19 billion, or 42.4%, from December 31, 2013. The increase in deposits consisted of a $1.27 billion increase in core deposits partially offset by a decrease of $88.3 million in time deposits. Core deposits include demand deposit, NOW accounts, savings and money market accounts and represents 72.9% of total deposits at December 31, 2014, an increase from 58.3% of total deposits at December 31, 2013.
The increase in total deposits was primarily due to the $864.0 million of deposits acquired in the GFB acquisition during the first quarter of 2014, an increase in brokered deposits of $338.2 million in addition to overall net deposit growth across all core deposit categories as a result of retail marketing efforts and commercial relationship growth.
The average rate paid on deposits for the year ended December 31, 2014 was 0.69%. This represents a decrease of 17 basis points compared to the average rate of 0.86% paid on deposits for the year ended December 31, 2013. Continued planned reductions of high cost acquired time deposits and a higher composition of noninterest-bearing deposits drove the decrease in the cost of deposits. The average rate paid on time deposits for the year ended December 31, 2014, was 0.91%. This represents a decrease of 34 basis points compared the average rate paid on time deposits for the year ended December 31, 2013 of 1.25%.
The following table shows the remaining maturity of time deposits of $100,000 and greater:
| December 31, 2014 | ||||
| (Dollars in thousands) | ||||
| Time deposits $100,000 or greater with remaining maturity of: |
||||
| Three months or less |
141,273 | |||
| After three months through six months |
93,608 | |||
| After six months through twelve months |
173,298 | |||
| After twelve months |
281,260 | |||
|
|
|
|||
| Total |
$ | 689,439 | ||
|
|
|
|||
Borrowings
In addition to deposits, we utilize advances from the FHLB and other borrowings, such as securities sold under repurchase agreements, as a supplementary funding source to finance our operations. FHLB advances are secured by stock, qualifying first residential mortgages, commercial real estate loans, home equity loans and investment securities.
Total borrowings consisted of the following as of the periods presented:
| December 31, | ||||||||
| 2014 | 2013 | |||||||
| (Dollars in thousands) | ||||||||
| FHLB advances |
$ | 983,686 | $ | 432,015 | ||||
| Securities sold under repurchase agreements |
72,500 | — | ||||||
| Retail repurchase agreements |
5,704 | 4,853 | ||||||
|
|
|
|
|
|||||
| Total contractual outstanding |
1,061,890 | 436,868 | ||||||
|
|
|
|
|
|||||
| Deferred prepayment penalty |
— | (1,187 | ) | |||||
| Fair value adjustment |
6,091 | 185 | ||||||
|
|
|
|
|
|||||
| Total borrowings |
$ | 1,067,981 | $ | 435,866 | ||||
|
|
|
|
|
|||||
At December 31, 2014, total borrowings were $1.07 billion, an increase of $632.1 million, or 145.0%, from $435.9 at December 31, 2013. The increase in total borrowings was primarily driven by the $551.7 million increase in FHLB advances to fund new loan growth. The Company also acquired FHLB advances and other borrowings with an acquisition date fair value of $92.7 million in connection with the GFB acquisition that primarily consisted of securities sold under repurchase agreements.
71
Table of Contents
Index to Financial Statements
Short-term borrowings consist of debt with maturities of one year or less and the current portion of long-term debt. The following table is a summary of short-term borrowings for the periods presented:
| As of/For the Years Ended December 31, | ||||||||||||
| 2014 | 2013 | 2012 | ||||||||||
| (Dollars in thousands) |
||||||||||||
| Short-Term FHLB advances: |
||||||||||||
| Maximum outstanding at any month-end during the period |
$ | 932,186 | $ | 526,751 | $ | 117,316 | ||||||
| Balance outstanding at end of period |
707,186 | 432,015 | 4,000 | |||||||||
| Average outstanding during the period |
658,328 | 115,151 | 64,017 | |||||||||
| Average interest rate during the period |
0.52 | % | 0.64 | % | 1.27 | % | ||||||
| Average interest rate at the end of the period |
0.27 | % | 0.72 | % | 3.85 | % | ||||||
Stockholders’ Equity
The following table summarizes the changes in our stockholders’ equity for the periods indicated:
| Years Ended December 31, | ||||||||||||
| 2014 | 2013 | 2012 | ||||||||||
| Balance at beginning of period |
$ | 716,114 | $ | 728,174 | $ | 706,402 | ||||||
| Net income (loss) |
22,372 | 17,171 | (4,828 | ) | ||||||||
| Shares issued in offering, net |
104,475 | — | — | |||||||||
| Settlement of RSU shares |
(5,688 | ) | — | — | ||||||||
| Deferred placement fee |
(10,000 | ) | — | — | ||||||||
| Other |
379 | — | — | |||||||||
| Stock-based compensation, RSU and warrant expense |
21,747 | 2,635 | 4,320 | |||||||||
| Treasury stock purchases |
— | (18,751 | ) | — | ||||||||
| Other comprehensive income (loss) |
2,254 | (13,115 | ) | 22,280 | ||||||||
|
|
|
|
|
|
|
|||||||
| Balance at end of period |
$ | 851,653 | $ | 716,114 | $ | 728,174 | ||||||
|
|
|
|
|
|
|
|||||||
Net income available to common stockholders’ totaled $22.4 million for the year ended December 31, 2014, an increase of $5.2 million, compared to $17.2 million for the year ended December 31, 2013. The Company’s results of operations for the year ended December 31, 2014 produced a return on average assets of 0.41% and a return on average common stockholders’ equity of 2.89% compared to prior year ratios of 0.49% and 2.35%, respectively.
Stockholders’ equity totaled $851.7 million as of December 31, 2014, an increase of $135.5 million from $716.1 million as of December 31, 2013. The increase was primarily driven by net proceeds from the Company’s IPO of approximately $104.5 million, an increase in other comprehensive income of $15.4 million, stock-based compensation, restricted stock units (“RSUs”) and EAA expenses of $20.1 million incurred in conjunction with the IPO, increased net income of $5.2 million and a reduction of treasury stock purchases of $18.8 million.
Capital Resources
The Company and the Bank are subject to regulatory capital adequacy requirements promulgated by federal regulatory agencies. Failure to meet minimum capital requirements can initiate certain mandatory and possibly additional discretionary actions by regulators that, if undertaken, could have a direct material effect on the Company’s financial statements.
72
Table of Contents
Index to Financial Statements
The Company and Bank’s regulatory capital ratios are as follows:
| Minimum Capital Requirement |
Minimun to be Well Capitalized |
December 31, 2014 |
December 31, 2013 |
|||||||||||||
| Capital Ratios (Company) |
||||||||||||||||
| Tier 1 leverage ratio |
4.0 | % | 5.0 | % | 12.8 | % | 18.0 | % | ||||||||
| Tier 1 risk-based capital ratio |
4.0 | % | 6.0 | % | 17.0 | % | 24.8 | % | ||||||||
| Total risk-based capital ratio |
8.0 | % | 10.0 | % | 17.6 | % | 25.3 | % | ||||||||
| Capital Ratios (Bank) |
||||||||||||||||
| Tier 1 leverage ratio |
4.0 | % | 5.0 | % | 10.4 | % | 12.0 | % | ||||||||
| Tier 1 risk-based capital ratio |
4.0 | % | 6.0 | % | 13.9 | % | 16.7 | % | ||||||||
| Total risk-based capital ratio |
8.0 | % | 10.0 | % | 14.5 | % | 17.3 | % | ||||||||
In addition, the OCC Agreement entered into by the Bank dated January 22, 2010 required the Bank to maintain prescribed minimum capital ratios in excess of current regulatory requirements as follows: Tier 1 leverage ratio of 10%, Tier 1 risk-based capital ratio of 11% and total risk-based capital ratio of 12%. These ratios were in lieu of the current capital regulatory requirements to be considered adequately and well capitalized as noted in the table above. On December 17, 2014, the OCC Agreement was terminated.
The Bank and, with respect to certain provisions, the Company, is also subject to an Order of the FDIC, dated January 22, 2010, issued in connection with the FDIC’s approval of the Bank’s application for federal deposit insurance. The Order requires, among other things, the Bank to maintain capital levels sufficient to be well capitalized under regulatory standards during the remaining period of ownership of the investors (as defined in the Order) subject to the SOP. As of December 31, 2014 and 2013, we believe the Company and Bank both had capital levels that exceeded the regulatory guidelines for a “well capitalized” institution.
As of December 31, 2014, the Company had a Tier 1 leverage ratio of 12.8%, which provided $458.4 million of excess capital relative to the minimum requirements to be considered well capitalized. As of December 31, 2014, the Bank had a Tier 1 leverage ratio of 10.4%, which provided $311.2 million of excess capital relative to the minimum requirements to be considered well capitalized.
Initial Public Offering
On August 6, 2014, the Company completed the initial public offering of 7,520,000 shares of Class A common stock for $22.00 per share. Of the 7,520,000 shares sold, 4,554,045 shares were sold by the Company and 2,965,955 shares were sold by certain selling stockholders. In addition, on September 3, 2014, the Company sold an additional 720,000 shares of Class A common stock to cover the exercise of the underwriters’ over-allotment option. The Company received net proceeds of approximately $104.5 million from the offering, after deducting the underwriting discounts and commissions of $8.1 million and estimated offering expenses of $3.4 million. The Company did not receive any proceeds from the sale of shares by the selling stockholders.
Direct expenses associated with the offering, consisting primarily of legal, accounting and printing fees, were approximately $3.4 million. The Company recognized the direct offering expenses and underwriters’ commissions as a reduction of the proceeds received.
73
Table of Contents
Index to Financial Statements
The following table presents the Class A Common Stock sold and expenses associated with the offering:
| Date of Issuance |
Price per Share |
Class A Common Stock |
Total | |||||||||||||
| (Dollars in thousands, except share and per share data) | ||||||||||||||||
| Offering |
8/6/2014 | $ | 22.00 | 4,554,045 | $ | 100,189 | ||||||||||
| Overallotment |
9/3/2014 | $ | 22.00 | 720,000 | 15,840 | |||||||||||
|
|
|
|
|
|||||||||||||
| Total |
5,274,045 | 116,029 | ||||||||||||||
| Direct offering expenses: |
||||||||||||||||
| Underwriters’ commissions |
(8,122 | ) | ||||||||||||||
| Direct expenses |
(3,432 | ) | ||||||||||||||
|
|
|
|||||||||||||||
| Total direct offering expenses |
(11,554 | ) | ||||||||||||||
|
|
|
|||||||||||||||
| Total proceeds, net |
$ | 104,475 | ||||||||||||||
|
|
|
|||||||||||||||
Off-Balance Sheet Arrangements
In the normal course of business, we enter into various transactions, which, in accordance with GAAP, are not included in our consolidated balance sheets. We enter into these transactions to meet the financing needs of our customers. These transactions include commitments to extend credit and standby letters of credit, which involve, to varying degrees, elements of credit risk and interest rate risk in excess of the amounts recognized on the Bank’s consolidated balance sheets. We have limited off-balance sheet arrangements that have not had or are not reasonably likely to have a current or future material effect on our financial condition, revenues, and expenses, results of operations, liquidity, capital expenditures or capital resources.
We enter into contractual loan commitments to extend credit, normally with fixed expiration dates or termination clauses, at specified rates and for specific purposes. Since a portion of the commitments are expected to expire without being drawn upon, the total commitment amounts do not necessarily represent future cash requirements. Substantially all of our commitments to extend credit are contingent upon customers maintaining specific credit standards until the time of loan funding. We decrease our exposure to loss under these commitments by subjecting them to credit approval and monitoring procedures. We assess the credit risk associated with certain commitments to extend credit and establish a liability for probable credit losses. As of December 31, 2014 and 2013, our reserve for unfunded commitments totaled $1.2 million and $593 thousand, respectively.
Standby letters of credit are written conditional commitments issued by us to guarantee the performance of a customer to a third party. In the event the customer does not perform in accordance with the terms of the agreement with the third party, we would be required to fund the commitment. The maximum potential amount of future payments we could be required to make is represented by the contractual amount of the commitment. If the commitment is funded, we would be entitled to seek recovery from the customer. Our policies generally require that standby letter of credit arrangements contain security and debt covenants similar to those contained in loan agreements.
The following table summarizes commitments as of the periods presented:
| December 31, | ||||||||
| 2014 | 2013 | |||||||
| (Dollars in thousands) | ||||||||
| Commitments to fund loans |
$ | 351,369 | $ | 96,359 | ||||
| Unused lines of credit |
199,880 | 168,408 | ||||||
| Commercial and standby letters of credit |
10,223 | 4,838 | ||||||
|
|
|
|
|
|||||
| Total |
$ | 561,472 | $ | 269,605 | ||||
|
|
|
|
|
|||||
74
Table of Contents
Index to Financial Statements
Contractual Obligations
The following table presents additional information regarding our outstanding contractual obligations as of the period presented:
| December 31, 2014 |
Total Amounts Committed |
One Year or Less |
Over One Year Through Three Years |
Over Three Years Through Five Years |
Over Five Years |
|||||||||||||||
| (Dollars in thousands) | ||||||||||||||||||||
| Contractual obligations: |
||||||||||||||||||||
| Time deposits |
$ | 1,076,468 | $ | 634,840 | $ | 270,440 | $ | 171,169 | $ | 19 | ||||||||||
| Operating lease obligations |
33,906 | 4,777 | 7,410 | 5,588 | 16,131 | |||||||||||||||
| FHLB advances |
983,686 | 707,186 | 276,500 | — | — | |||||||||||||||
| Securities sold under agreements to repurchase |
78,205 | 5,705 | 72,500 | — | — | |||||||||||||||
|
|
|
|
|
|
|
|
|
|
|
|||||||||||
| Total |
$ | 2,172,265 | $ | 1,352,508 | $ | 626,850 | $ | 176,757 | $ | 16,150 | ||||||||||
|
|
|
|
|
|
|
|
|
|
|
|||||||||||
Management believes that we have adequate liquidity to meet all known contractual obligations and unfunded commitments, including loan commitments over the next twelve months.
Critical Accounting Estimates
Our consolidated financial statements are prepared in accordance U.S. GAAP and follow general practices within the banking industry. Application of these principles requires management to make complex and subjective estimates and judgments that affect the amounts reported in the consolidated financial statements and accompanying notes. We base our estimates on historical experience and on various other assumptions that we believe to be reasonable and appropriate under current circumstances. These assumptions form the basis for our judgments about the carrying values of assets and liabilities that are not readily available from independent, objective sources. We evaluate our estimates on an ongoing basis. Use of alternative assumptions may have resulted in significantly different estimates. Actual results may differ from these estimates.
Accounting policies are an integral part of our financial statements. A thorough understanding of these accounting policies is essential when reviewing our reported results of operations and our financial position. We believe that the critical accounting policies and estimates discussed below involve a heightened level of management judgment due to the complexity, subjectivity and sensitivity involved in their application.
Fair Value Estimates
Some assets and liabilities are carried at fair value on the Company’s Consolidated Balance Sheet, with changes in fair value recorded either through earnings or in other comprehensive income (loss). Assets and liabilities carried at fair value include available-for-sale securities; derivatives; the clawback liability associated with FDIC loss share coverage for certain FDIC-assisted bank acquisitions; and the contingent consideration obligation issued to the FDIC for certain 2010 and 2011 FDIC-assisted bank acquisitions which have all been settled.
Fair value is generally defined as the price at which an asset or liability could be exchanged in a current, non-liquidation transaction between willing, unrelated third parties. Fair value is based on quoted market prices in an active market. However, when market prices are not available, fair value may be estimated using valuation techniques including matrix pricing or discounted expected cash flows which incorporate interest rates, discount rates, prepayment and credit loss assumptions. When market information is not available, the estimate becomes more subjective and involves management judgment.
The Company obtains fair values for available-for-sale securities from independent third-party sources which may use quoted market prices for the same or similar security, matrix pricing or a discounted cash flow analysis. Derivative positions are valued by an independent third-party, using valuation techniques that generally incorporate readily observable market inputs. The clawback liability associated with the loss share coverage provided by the
75
Table of Contents
Index to Financial Statements
FDIC is valued using a discounted cash flow model which requires projection of the cash flows related to the resolution of the loans covered under the clawback liability. The projection of cash flows is based on the trend of historical performance of the assets as well as an estimate of future performance. The estimate of future performance incorporates management judgment. The fair value of the contingent consideration liability obligation to the FDIC is determined based on an estimate of the future fair value of the Company’s stock, the determination of a range of potential payments and an assessment of the probability of payments within the range.
Allowance for Loan Losses and Unfunded Loan Commitments and Letters of Credit
We maintain an allowance for loan loss at a level that we believe is adequate to absorb estimated probable losses incurred in the Company’s loan portfolio as of the balance sheet date. However, determining incurred probable losses is inherently a subjective process as it requires material estimates, all of which may be susceptible to significant change.
The Company determines the allowance based on periodic evaluations of the loan portfolio and consideration of a number of factors. Such factors include:
| • | Probability of default (PD), |
| • | Loss given default (LGD), |
| • | Amounts and timing of expected cash flows, |
| • | Delinquency status, |
| • | Historical loss experience, |
| • | Value of collateral, and |
| • | Qualitative factors such as changes in current economic conditions, market conditions, geography, etc. |
Certain factors are based on the characteristics or experience of the Company’s loan portfolio. In other circumstances, the Company uses industry data. For example, at December 31, 2014, the Company has limited experience with credit losses on originated loans and uses recent industry historical loss data for similar loans in developing its allowance. The impact of qualitative factors on the allowance such as changes in economic conditions, etc. require management to determine its best estimate of how these qualitative factors have impacted probable incurred losses.
Acquired Loans and Related Indemnification Assets
All assets and liabilities obtained in purchase acquisitions and any related indemnification assets and clawback liabilities are initially recorded at fair value at date of purchase. Subsequent to the acquisition, the Company accounts for purchased loans and the related indemnification asset and clawback liability by following applicable authoritative accounting guidance for purchased non-impaired loans, purchased impaired loans and indemnification assets.
Our initial determination of fair value as well as subsequent accounting requires management to estimate how the acquired loans will perform in the future. Such estimates are determined using a discounted cash flow analysis. Factors that may significantly affect the discounted cash flow results include, among others, market data on interest rates, assumptions related to the probability and severity of credit losses, the estimated timing of credit losses including the foreclosure and liquidation of collateral, expected prepayment rates, expected loan modifications, and the specific terms of the indemnification and clawback agreements.
Goodwill and Other Intangibles
The Company initially records all assets and liabilities obtained in purchase acquisitions, including goodwill and other intangibles, at fair value. Subsequently, goodwill is not amortized but is subject, at a minimum, to annual tests for impairment. Other intangible assets, consisting of core deposit intangibles, are amortized over their estimated useful lives using a straight-line method. Other intangibles are subject to impairment if events or circumstances indicate a possible inability to realize the carrying amount.
76
Table of Contents
Index to Financial Statements
The initial recognition and subsequent accounting require management judgment concerning how the acquired assets and liabilities will perform in future periods and are estimated using valuation methods including discounted cash flow analysis. Estimated cash flows may extend for longer terms and, as a result, are difficult to determine for an extended period of time. Factors that may affect estimates of cash flows include customer behaviors, competitive environment, changes in growth and/or revenue trends, as well as specific industry or market conditions.
Income Taxes
The Company estimates income tax expense based on amounts expected to be owed to various tax jurisdictions. Estimated income tax expense is reported in the Consolidated Statement of Income. Accrued taxes, as reported in other assets or other liabilities in the Consolidated Balance Sheet, represent the net estimated amount due to or to be received from taxing jurisdictions either currently or in the future. Management judgment is involved in estimating accrued taxes, as it may be necessary to evaluate the risks and merits of the tax treatment of transactions, filing positions, and taxable income calculations after considering tax-related statutes, regulations, judicial precedent and other relevant factors. Because of the complexity of tax laws and interpretations, interpretation is subject to judgment. It is possible that others, given the same information may, at any point in time, reach different reasonable conclusions regarding the estimated amounts of accrued taxes.
Contingent Liabilities
See Note 1 to our consolidated financial statements for further discussion of our significant accounting policies.
Recently Issued Accounting Pronouncements
Recent authoritative guidance has been issued that the Company will be required to adopt in the future. The adoption of certain accounting pronouncements may result in revised disclosures in the Company’s financial statements but will not have an impact on the Company’s consolidated financial position, results of operations or cash flows. The adoption of other recently issued accounting pronouncements is currently being evaluated by the Company to determine the impact on its consolidated financial position, results of operations or cash flows. See Note 1 to our consolidated financial statements for a discussion of recent accounting pronouncements.
GAAP Reconciliation and Management Explanation of Non-GAAP Financial Measures
Some of the financial data included in our selected historical consolidated financial data are not measures of financial performance recognized by generally accepted accounting principles in the United States, or GAAP. These non-GAAP financial measures are “tangible assets,” “tangible stockholders’ equity,” “tangible book value per share,” “tangible average equity to tangible average assets,” and “tangible common equity ratio.” Our management uses these non-GAAP financial measures in its analysis of our performance.
| • | “Tangible assets” is defined as total assets reduced by goodwill and other intangible assets. As with other financial assets, we consider the FDIC loss share indemnification asset to be a tangible asset. |
| • | “Tangible stockholders’ equity” is defined as total stockholders’ equity reduced by goodwill and other intangible assets. As with other financial assets, we consider the FDIC loss share indemnification asset to be a tangible asset. |
| • | “Tangible book value per share” is defined as total stockholders’ equity reduced by goodwill and other intangible assets divided by total common shares outstanding. This measure is important to investors interested in changes from period-to-period in book value per share exclusive of changes in intangible assets. As with other financial assets, we consider the FDIC loss share indemnification asset to be a tangible asset. |
77
Table of Contents
Index to Financial Statements
| • | “Tangible average equity to tangible average assets” is defined as the ratio of average stockholders’ equity reduced by average goodwill and average other intangible assets, divided by average total assets reduced by average goodwill and average other intangible assets. This measure is important to investors interested in relative changes from period to period in equity and total assets, each exclusive of changes in intangible assets. As with other financial assets, we consider the FDIC loss share indemnification asset to be a tangible asset. |
| • | “Tangible common equity ratio” is defined as the ratio of total stockholders’ equity reduced by goodwill and other intangible assets, divided by total assets reduced by goodwill and average other intangible assets. This measure is important to investors interested in relative changes in the ratio of total stockholder equity to total assets, each exclusive of changes in intangible assets. As with other financial assets, we consider the FDIC loss share indemnification asset to be a tangible asset. |
We believe these non-GAAP financial measures provide useful information to management and investors that is supplementary to our financial condition, results of operations and cash flows computed in accordance with GAAP; however, we acknowledge that our non-GAAP financial measures have a number of limitations. As such, you should not view these disclosures as a substitute for results determined in accordance with GAAP, and they are not necessarily comparable to non-GAAP financial measures that other companies use. The following reconciliation table provides a more detailed analysis of these non-GAAP financial measures:
FCB FINANCIAL HOLDINGS, INC. AND SUBSIDIARIES
Reconciliation of Non-GAAP Measures - Tangible Book Value Per Share
| December 31, | ||||||||||||
| 2014 | 2013 | 2012 | ||||||||||
| (Dollars in thousands, except share and per share data) | ||||||||||||
| Total assets |
$ | 5,957,628 | $ | 3,973,370 | $ | 3,245,061 | ||||||
| Less: |
||||||||||||
| Goodwill and other intangible assets |
88,615 | 39,369 | 40,895 | |||||||||
|
|
|
|
|
|
|
|||||||
| Tangible assets |
$ | 5,869,013 | $ | 3,934,001 | $ | 3,204,166 | ||||||
|
|
|
|
|
|
|
|||||||
| Total stockholders’ equity |
$ | 851,653 | $ | 716,114 | $ | 728,174 | ||||||
| Less: |
||||||||||||
| Goodwill and other intangible assets |
88,615 | 39,369 | 40,895 | |||||||||
|
|
|
|
|
|
|
|||||||
| Tangible stockholders’ equity |
$ | 763,038 | $ | 676,745 | $ | 687,279 | ||||||
|
|
|
|
|
|
|
|||||||
| Weighted average shares outstanding |
38,054,158 | 36,947,192 | 37,011,598 | |||||||||
| Tangible book value per share |
$ | 20.05 | $ | 18.32 | $ | 18.57 | ||||||
| Average assets |
$ | 5,446,967 | $ | 3,502,311 | $ | 3,384,106 | ||||||
| Average equity |
774,987 | 732,114 | 717,590 | |||||||||
| Average goodwill and other intangible assets |
88,647 | 39,406 | 40,942 | |||||||||
| Tangible average equity to tangible average assets |
12.8 | % | 20.0 | % | 20.2 | % | ||||||
| Tangible common equity ratio |
13.0 | % | 17.2 | % | 21.4 | % | ||||||
ITEM 7A. Quantitative and Qualitative Disclosure about Market Risk
Interest Rate Risk
The principal component of our risk of loss arising from adverse changes in the fair value of financial instruments, or market risk, is interest rate risk. The primary objective of our asset/liability management activities is to maximize net interest income, while maintaining acceptable levels of interest rate risk. Our Asset Liability Committee, or ALCO, is responsible for establishing policies to limit exposure to interest rate risk, and to ensure procedures are established to monitor compliance with these policies. The guidelines established by ALCO are reviewed and approved by our Board of Directors.
78
Table of Contents
Index to Financial Statements
We evaluate and consider the impact of business factors in an income simulation analysis, which is designed to capture not only the potential of all assets and liabilities to mature or reprice, but also the probability that they will do so. Assets and liabilities with similar repricing characteristics may not reprice at the same time or to the same degree. Income simulation also attends to the relative interest rate sensitivities of these items, and projects their behavior over an extended period of time. Income simulation permits us to assess the probable effects on the consolidated financial statements for changes in interest rates and corresponding management strategy.
In addition, consistent with industry practices, we measure interest rate risk by utilizing the concept of Economic Value of Equity (“EVE”). EVE is the intrinsic value of assets, less the intrinsic value of liabilities. EVE analysis provides a fair value of the balance sheet in alternative interest rate scenarios. The EVE/duration discounting method used is the Hybrid Method Discounting, which uses current rates and yield curves to discount path dependent cash flows. This method is based on spot rates derived from the yield curve that applies to the EVE time point. The Hybrid method uses the cash flows for the full life of the instrument/account to compute EVE. The EVE does not take into account management intervention and assumes the new rate environment is constant and the change is instantaneous, except for deposit pricing in a rising interest rate scenario which lags three months. The model also assumes all maturing products are rolled back into the same products as the bank is currently offering at the current market rate. Prepayment speeds are derived from a subscription service from a third party vendor and are adjusted in the shock scenarios, and the expected principal cash flow from the instruments with embedded options are adjusted to reflect the expected principal cash flows from the instrument in the rate scenario. Noninterest income, loan loss provision, and noninterest expense are taken from the projected business plans and held flat over the forecasting period. Accretion Income on the Bank’s acquired loan portfolio is added to the contractual income from the model. Further, as this framework evaluates risks to the current balance sheet only, changes to the volumes and pricing of new business opportunities that can be expected in the different interest rate outcomes are not incorporated in this analytical framework.
Management continually reviews and refines its interest rate risk management process in response to the economic and interest rate environment. Currently, our model projects a minus 100, plus 100, plus 200, plus 300, plus 400 and plus 500 basis point change as well as modified scenarios to evaluate our interest rate sensitivity and to determine whether specific action is needed to improve the current asset/liability position, either through economic hedges, matching strategies or by utilizing derivative instruments.
Our ALCO policy has established specific limits for changes to net interest income and to capital. Our interest rate sensitivity for the periods presented are as follows:
| December 31, | ||||||||||||||||
| 2014 | 2013 | |||||||||||||||
| Following 12 Months |
Following 36 Months |
Following 12 Months |
Following 36 Months |
|||||||||||||
| +500 basis points |
17.0 | % | 18.7 | % | 39.1 | % | 33.4 | % | ||||||||
| +400 basis points |
16.3 | % | 18.3 | % | 34.5 | % | 30.7 | % | ||||||||
| +300 basis points |
14.4 | % | 16.4 | % | 28.3 | % | 26.1 | % | ||||||||
| +200 basis points |
11.3 | % | 13.0 | % | 20.5 | % | 19.5 | % | ||||||||
| +100 basis points |
6.5 | % | 7.7 | % | 11.1 | % | 10.9 | % | ||||||||
| -100 basis points |
-3.3 | % | -5.1 | % | -2.2 | % | -3.0 | % | ||||||||
79
Table of Contents
Index to Financial Statements
The table below presents the change in our EVE assuming immediate parallel shifts in interest rates as of the dates presented:
| December 31, | ||||||||
| 2014 | 2013 | |||||||
| +500 basis points |
-24.9 | % | -17.5 | % | ||||
| +400 basis points |
-18.8 | % | -13.2 | % | ||||
| +300 basis points |
-12.6 | % | -9.0 | % | ||||
| +200 basis points |
-6.3 | % | -5.0 | % | ||||
| +100 basis points |
-2.0 | % | -1.6 | % | ||||
| -100 basis points |
-0.6 | % | 3.8 | % | ||||
In the event the model indicates an unacceptable level of risk, based on current circumstances and events, we could undertake a number of actions that would reduce this risk, including the sale of a portion of our available for sale investment portfolio or the use of risk management strategies such as interest rate swaps and caps. As of December 31, 2014, we were in compliance with all of our net interest income and EVE limits.
Many assumptions were used by the Company to calculate the impact of changes in interest rates, including the change in rates. Actual results may not be similar to those derived from our model due to several factors including the timing and frequency of rate changes, market conditions and the shape of the yield curve. Actual results may also differ due to our actions, if any, in response to the changing rates and other changes in our business.
Liquidity Risk
Liquidity represents the Company’s ability to meet financial commitments through the maturity and sale of existing assets or availability of additional funds. Liquidity risk results from the mismatching of asset and liability cash flows. The Bank’s liquidity needs are primarily met by its cash and securities position, growth in deposits, cash flow from amortizing investment and loan portfolios, and borrowings from the FHLB. For additional information regarding our operating, investing, and financing cash flows, see “Consolidated Statements of Cash Flows.”
The Bank has access to additional borrowings through secured FHLB advances, unsecured borrowing lines from correspondent banks, and repurchase agreements (secured). In addition, the Bank has an established borrowing line at the FRB. Our asset/liability policy has established several measures of liquidity, including liquid assets (defined as cash and cash equivalents, and securities available to pledge) to total assets.
The following table summarizes our liquidity ratios:
| December 31, 2014 | ||||||||||||
| Policy Limit | Actual | |||||||||||
| Primary liquidity ratio |
10.0 | % | Min | 12.5 | % | |||||||
| Net short-term non-core funding deposits |
20.0 | % | Max | 4.3 | % | |||||||
| Net loans to total deposits |
115.0 | % | Max | 97.4 | % | |||||||
| Pledged securities to total investments |
50.0 | % | Max | 27.3 | % | |||||||
| Net loans to total assets |
80.0 | % | Max | 66.9 | % | |||||||
| Brokered deposits to total deposits |
10.0 | % | Max | 8.4 | % | |||||||
| Fed funds purchased to total assets |
10.0 | % | Max | 0.0 | % | |||||||
| Time deposits greater than $250,000 to total assets |
20.0 | % | Max | 3.9 | % | |||||||
| Short-term FHLB borrowings and repurchase agreements to assets |
30.0 | % | Max | 12.2 | % | |||||||
80
Table of Contents
Index to Financial Statements
At December 31, 2014, the Company had additional capacity to borrow from the FHLB of $397.6 million. Also, at December 31, 2014, the Company has unused credit lines with financial institutions of $30.0 million.
We believe the Bank’s cash and liquidity resources generated by operations and deposit growth will be sufficient to satisfy the Bank’s future capital requirements.
As a holding company, we are a corporation separate and apart from our subsidiary, the Bank, and therefore we provide for our own liquidity. Our main sources of funding include equity capital raised in our offerings of equity securities and dividends paid by the Bank, when applicable, and access to capital markets. We believe these sources will be sufficient to fund our capital needs for at least the next twelve months. There are regulatory limitations that affect the ability of the Bank to pay dividends to us. See “Supervision and Regulation—Regulatory Limits on Dividends and Distributions.” Management believes that such limitations will not impact our ability to meet our ongoing cash obligations.
On March 4, 2015, the Bank entered into an agreement with the FDIC to terminate all loss sharing agreements which were entered into in 2010 and 2011 in conjunction with the Bank’s acquisition of substantially all of the assets (“covered assets”) and assumption of substantially all of the liabilities of six failed banks in FDIC-assisted acquisitions. The Bank will pay the FDIC $14.8 million as consideration for the early termination to settle its obligation under the FDIC Clawback Liability. See Note 20 “Subsequent Events” in the “Notes to Consolidated Financial Statements” for additional information.
Operational Risk
Operational risk generally refers to the risk of loss resulting from the Company’s operations, including those operations performed for the Company by third parties. This would include but is not limited to the risk of fraud by employees or persons outside the Company, the execution of unauthorized transactions by employees or others, errors relating to transaction processing, breaches of the internal control system and compliance requirements, and unplanned interruptions in service. This risk of loss also includes the potential legal or regulatory actions that could arise as a result of an operational deficiency, or as a result of noncompliance with applicable regulatory standards.
The Company places reliance on the ability of its employees and systems to properly process a high number of transactions. In the event of a breakdown in the internal control systems, improper operation of systems or improper employee actions, the Company could suffer financial loss, face regulatory action and suffer damage to its reputation. In order to address this risk, management maintains a system of internal controls with the objective of providing proper transaction authorization and execution, safeguarding of assets from misuse or theft, and ensuring the reliability of financial and other data.
The Company maintains systems of controls that provide management with timely and accurate information about the Company’s operations. The Company has also established procedures that are designed to ensure that policies relating to conduct, ethics and business practices are followed on a uniform basis. While there can be no assurance that the Company will not suffer a potential loss from operational risks, management continually monitors and works to improve its internal controls, systems and corporate-wide processes and procedure to strengthen our system of internal controls.
Compliance Risk
Compliance risk represents the risk of regulatory sanctions, reputational impact or financial loss resulting from our failure to comply with rules and regulations issued by the various banking agencies and standards of good banking practice. Activities which may expose us to compliance risk include, but are not limited to, those dealing with the prevention of money laundering, privacy and data protection, community reinvestment initiatives, fair lending challenges resulting from the expansion of our banking center network and employment and tax matters.
81
Table of Contents
Index to Financial Statements
Strategic and/or Reputation Risk
Strategic and/or reputation risk represents the risk of loss due to impairment of reputation, failure to fully develop and execute business plans, failure to assess current and new opportunities in business, markets and products, and any other event not identified in the defined risk types mentioned previously. Mitigation of the various risk elements that represent strategic and/or reputation risk is achieved through initiatives to help us better understand and report on various risks, including those related to the development of new products and business initiatives.
82
Table of Contents
Index to Financial Statements
| Item 8. | Financial Statements and Supplementary Data |
FCB FINANCIAL HOLDINGS, INC.
CONSOLIDATED FINANCIAL STATEMENTS
F-1
Table of Contents
Index to Financial Statements
REPORT OF INDEPENDENT REGISTERED PUBLIC ACCOUNTING FIRM
Board of Directors and Stockholders
FCB Financial Holdings, Inc.
We have audited the accompanying consolidated balance sheets of FCB Financial Holdings, Inc. (a Delaware corporation) and subsidiaries (the “Company”) as of December 31, 2014 and 2013, and the related consolidated statements of income, comprehensive income (loss), changes in stockholders’ equity, and cash flows for each of the three years in the period ended December 31, 2014. These financial statements are the responsibility of the Company’s management. Our responsibility is to express an opinion on these financial statements based on our audits.
We conducted our audits in accordance with the standards of the Public Company Accounting Oversight Board (United States). Those standards require that we plan and perform the audit to obtain reasonable assurance about whether the financial statements are free of material misstatement. An audit includes examining, on a test basis, evidence supporting the amounts and disclosures in the financial statements. An audit also includes assessing the accounting principles used and significant estimates made by management, as well as evaluating the overall financial statement presentation. We believe that our audits provide a reasonable basis for our opinion.
In our opinion, the consolidated financial statements referred to above present fairly, in all material respects, the financial position of FCB Financial Holdings, Inc. and subsidiaries as of December 31, 2014 and 2013, and the results of their operations and their cash flows for each of the three years in the period ended December 31, 2014 in conformity with accounting principles generally accepted in the United States of America.
/s/ Grant Thornton LLP
Fort Lauderdale, Florida
March 16, 2015
F-2
Table of Contents
Index to Financial Statements
FCB FINANCIAL HOLDINGS, INC. AND SUBSIDIARIES
(Dollars in thousands, except share and per share data)
| December 31, | ||||||||
| 2014 | 2013 | |||||||
| Assets: |
||||||||
| Cash and due from banks |
$ | 25,397 | $ | 28,819 | ||||
| Interest-earning deposits in other banks |
81,688 | 210,398 | ||||||
| Investment securities: |
||||||||
| Held to maturity securities (fair value of $0 and $364, respectively) |
— | 365 | ||||||
| Available for sale securities, at fair value |
1,359,098 | 1,145,771 | ||||||
| Federal Home Loan Bank and other bank stock, at cost |
66,891 | 36,187 | ||||||
|
|
|
|
|
|||||
| Total investment securities |
1,425,989 | 1,182,323 | ||||||
|
|
|
|
|
|||||
| Loans held for sale |
707 | — | ||||||
| Loans: |
||||||||
| New loans |
3,103,417 | 1,770,711 | ||||||
| Acquired loans ($273,366 and $359,255 covered by FDIC loss share, respectively) |
826,173 | 488,073 | ||||||
| Allowance for loan losses |
(22,880 | ) | (14,733 | ) | ||||
|
|
|
|
|
|||||
| Loans, net |
3,906,710 | 2,244,051 | ||||||
|
|
|
|
|
|||||
| FDIC loss share indemnification asset |
63,168 | 87,229 | ||||||
| Due from FDIC |
1,735 | 3,659 | ||||||
| Premises and equipment, net |
38,962 | 40,992 | ||||||
| Other real estate owned ($25,130 and $27,299 of foreclosed property covered by FDIC loss share, respectively) |
74,527 | 34,682 | ||||||
| Goodwill and other intangible assets |
88,615 | 39,369 | ||||||
| Deferred tax assets, net (including valuation allowance of $9,151 and $0, respectively) |
47,441 | 5,828 | ||||||
| Bank-owned life insurance |
139,829 | 75,257 | ||||||
| Other assets |
62,860 | 20,763 | ||||||
|
|
|
|
|
|||||
| Total assets |
$ | 5,957,628 | $ | 3,973,370 | ||||
|
|
|
|
|
|||||
| Liabilities and Stockholders’ Equity |
||||||||
| Liabilities: |
||||||||
| Deposits: |
||||||||
| Transaction accounts: |
||||||||
| Noninterest-bearing |
$ | 593,025 | $ | 291,658 | ||||
| Interest-bearing |
2,308,657 | 1,336,679 | ||||||
|
|
|
|
|
|||||
| Total transaction accounts |
2,901,682 | 1,628,337 | ||||||
| Time deposits |
1,076,853 | 1,165,196 | ||||||
|
|
|
|
|
|||||
| Total deposits |
3,978,535 | 2,793,533 | ||||||
| Borrowings (including FHLB advances of $983,686 and $431,013, respectively) |
1,067,981 | 435,866 | ||||||
| Other liabilities |
59,459 | 27,857 | ||||||
|
|
|
|
|
|||||
| Total liabilities |
5,105,975 | 3,257,256 | ||||||
|
|
|
|
|
|||||
| Commitments and contingencies (Note 17) |
||||||||
| Stockholders’ Equity: |
||||||||
| Class A common stock, par value $0.001 per share; 100 million shares authorized; 35,396,962, 28,992,314 issued and 34,469,650, 28,065,002 outstanding |
36 | 29 | ||||||
| Class B common stock, par value $0.001 per share; 50 million shares authorized; 7,132,180, 8,019,284 issued and 6,940,048, 7,827,152 outstanding |
7 | 8 | ||||||
| Additional paid-in capital |
834,538 | 723,631 | ||||||
| Retained earnings |
35,144 | 12,772 | ||||||
| Accumulated other comprehensive income (loss) |
679 | (1,575 | ) | |||||
| Treasury stock, at cost; 927,312 Class A and 192,132 Class B common shares |
(18,751 | ) | (18,751 | ) | ||||
|
|
|
|
|
|||||
| Total stockholders’ equity |
851,653 | 716,114 | ||||||
|
|
|
|
|
|||||
| Total liabilities and stockholders’ equity |
$ | 5,957,628 | $ | 3,973,370 | ||||
|
|
|
|
|
|||||
The accompanying notes are an integral part of these consolidated financial statements
F-3
Table of Contents
Index to Financial Statements
FCB FINANCIAL HOLDINGS, INC. AND SUBSIDIARIES
CONSOLIDATED STATEMENTS OF INCOME
(Dollars in thousands, except share and per share data)
| Years Ended December 31, | ||||||||||||
| 2014 | 2013 | 2012 | ||||||||||
| Interest income: |
||||||||||||
| Interest and fees on loans |
$ | 158,670 | $ | 108,521 | $ | 112,716 | ||||||
| Interest and dividends on investment securities |
44,545 | 36,518 | 35,973 | |||||||||
| Other interest income |
211 | 224 | 145 | |||||||||
|
|
|
|
|
|
|
|||||||
| Total interest income |
203,426 | 145,263 | 148,834 | |||||||||
|
|
|
|
|
|
|
|||||||
| Interest expense: |
||||||||||||
| Interest on deposits |
22,758 | 18,537 | 22,700 | |||||||||
| Interest on borrowings |
5,496 | 4,403 | 4,806 | |||||||||
|
|
|
|
|
|
|
|||||||
| Total interest expense |
28,254 | 22,940 | 27,506 | |||||||||
|
|
|
|
|
|
|
|||||||
| Net interest income |
175,172 | 122,323 | 121,328 | |||||||||
| Provision for loan losses |
10,243 | 2,914 | 26,101 | |||||||||
|
|
|
|
|
|
|
|||||||
| Net interest income after provision for loan losses |
164,929 | 119,409 | 95,227 | |||||||||
|
|
|
|
|
|
|
|||||||
| Noninterest income: |
||||||||||||
| Service charges and fees |
2,963 | 2,374 | 2,082 | |||||||||
| Loan and other fees |
6,793 | 5,057 | 1,009 | |||||||||
| Bank-owned life insurance income |
4,175 | 257 | — | |||||||||
| FDIC loss share indemnification loss |
(21,425 | ) | (18,533 | ) | (3,470 | ) | ||||||
| Income from resolution of acquired assets |
4,899 | 8,475 | 9,593 | |||||||||
| Gain (loss) on sales of other real estate owned |
144 | 1,267 | 5,153 | |||||||||
| Gain (loss) on investment securities |
12,105 | 8,682 | 2,321 | |||||||||
| Other noninterest income |
7,378 | 3,363 | 2,607 | |||||||||
|
|
|
|
|
|
|
|||||||
| Total noninterest income |
17,032 | 10,942 | 19,295 | |||||||||
|
|
|
|
|
|
|
|||||||
| Noninterest expense: |
||||||||||||
| Salaries and employee benefits |
73,241 | 46,914 | 48,243 | |||||||||
| Occupancy and equipment expenses |
14,064 | 9,872 | 9,772 | |||||||||
| Loan and other real estate related expenses |
14,868 | 19,158 | 31,993 | |||||||||
| Professional services |
5,629 | 6,403 | 10,466 | |||||||||
| Data processing and network |
10,744 | 7,280 | 6,927 | |||||||||
| Regulatory assessments and insurance |
7,839 | 5,414 | 7,327 | |||||||||
| Amortization of intangibles |
1,710 | 1,526 | 1,806 | |||||||||
| Other operating expenses |
17,537 | 7,741 | 5,215 | |||||||||
|
|
|
|
|
|
|
|||||||
| Total noninterest expense |
145,632 | 104,308 | 121,749 | |||||||||
|
|
|
|
|
|
|
|||||||
| Income (loss) before income tax expense (benefit) |
36,329 | 26,043 | (7,227 | ) | ||||||||
| Income tax expense (benefit) |
13,957 | 8,872 | (2,399 | ) | ||||||||
|
|
|
|
|
|
|
|||||||
| Net income (loss) |
$ | 22,372 | $ | 17,171 | $ | (4,828 | ) | |||||
|
|
|
|
|
|
|
|||||||
| Earnings (loss) per share: |
||||||||||||
| Basic |
$ | 0.59 | $ | 0.46 | $ | (0.13 | ) | |||||
| Diluted |
$ | 0.58 | $ | 0.46 | $ | (0.13 | ) | |||||
| Weighted average shares outstanding: |
||||||||||||
| Basic |
38,054,158 | 36,947,192 | 37,011,598 | |||||||||
| Diluted |
38,258,316 | 36,949,129 | 37,011,598 | |||||||||
The accompanying notes are an integral part of these consolidated financial statements
F-4
Table of Contents
Index to Financial Statements
FCB FINANCIAL HOLDINGS, INC. AND SUBSIDIARIES
CONSOLIDATED STATEMENTS OF COMPREHENSIVE INCOME (LOSS)
(Dollars in thousands)
| Years Ended December 31, | ||||||||||||
| 2014 | 2013 | 2012 | ||||||||||
| Net income (loss) |
$ | 22,372 | $ | 17,171 | $ | (4,828 | ) | |||||
| Other comprehensive income (loss): |
||||||||||||
| Unrealized net holding gains (losses) on investment securities available for sale, net of taxes of $(4,430), $4,970 and $(15,029), respectively |
7,051 | (7,910 | ) | 23,931 | ||||||||
| Reclassification adjustment for (gains) losses on investment securities available for sale included in net income, net of taxes of $3,013, $3,268, and $1,037, respectively |
(4,797 | ) | (5,205 | ) | (1,651 | ) | ||||||
|
|
|
|
|
|
|
|||||||
| Total other comprehensive income (loss) |
2,254 | (13,115 | ) | 22,280 | ||||||||
|
|
|
|
|
|
|
|||||||
| Total comprehensive income (loss) |
$ | 24,626 | $ | 4,056 | $ | 17,452 | ||||||
|
|
|
|
|
|
|
|||||||
The accompanying notes are an integral part of these consolidated financial statements
F-5
Table of Contents
Index to Financial Statements
FCB FINANCIAL HOLDINGS, INC. AND SUBSIDIARIES
CONSOLIDATED STATEMENTS OF CHANGES IN STOCKHOLDERS’ EQUITY
(Dollars in thousands, except for share data)
| Common Stock Shares Outstanding |
Common Stock Issued |
Additional Paid in Capital |
Retained Earnings (Deficit) |
Treasury Stock |
Accumulated Other Comprehensive Income (Loss) |
Total Stockholders’ Equity |
||||||||||||||||||||||||||||||
| Class A | Class B | Class A | Class B | |||||||||||||||||||||||||||||||||
| Balance as of January 1, 2012 |
32,548,906 | 4,462,692 | $ | 33 | $ | 4 | $ | 716,676 | $ | 429 | $ | — | $ | (10,740 | ) | $ | 706,402 | |||||||||||||||||||
| Net income (loss) |
— | — | — | — | — | (4,828 | ) | — | — | (4,828 | ) | |||||||||||||||||||||||||
| Stock-based compensation |
— | — | — | — | 4,320 | — | — | — | 4,320 | |||||||||||||||||||||||||||
| Exchange of A shares to B shares |
(3,556,592 | ) | 3,556,592 | (4 | ) | 4 | — | — | — | — | — | |||||||||||||||||||||||||
| Other comprehensive income (loss) |
— | — | — | — | — | — | — | 22,280 | 22,280 | |||||||||||||||||||||||||||
|
|
|
|
|
|
|
|
|
|
|
|
|
|
|
|
|
|
|
|||||||||||||||||||
| Balance as of December 31, 2012 |
28,992,314 | 8,019,284 | $ | 29 | $ | 8 | $ | 720,996 | $ | (4,399 | ) | $ | — | $ | 11,540 | $ | 728,174 | |||||||||||||||||||
|
|
|
|
|
|
|
|
|
|
|
|
|
|
|
|
|
|
|
|||||||||||||||||||
| Net income (loss) |
— | — | — | — | — | 17,171 | — | — | 17,171 | |||||||||||||||||||||||||||
| Stock-based compensation |
— | — | — | — | 2,635 | — | — | — | 2,635 | |||||||||||||||||||||||||||
| Treasury stock purchases |
(927,312 | ) | (192,132 | ) | — | — | — | — | (18,751 | ) | — | (18,751 | ) | |||||||||||||||||||||||
| Other comprehensive income (loss) |
— | — | — | — | — | — | — | (13,115 | ) | (13,115 | ) | |||||||||||||||||||||||||
|
|
|
|
|
|
|
|
|
|
|
|
|
|
|
|
|
|
|
|||||||||||||||||||
| Balance as of December 31, 2013 |
28,065,002 | 7,827,152 | $ | 29 | $ | 8 | $ | 723,631 | $ | 12,772 | $ | (18,751 | ) | $ | (1,575 | ) | $ | 716,114 | ||||||||||||||||||
|
|
|
|
|
|
|
|
|
|
|
|
|
|
|
|
|
|
|
|||||||||||||||||||
| Net income (loss) |
— | — | — | — | — | 22,372 | — | — | 22,372 | |||||||||||||||||||||||||||
| Shares issued in offering, net |
5,274,045 | — | 6 | — | 104,469 | — | — | — | 104,475 | |||||||||||||||||||||||||||
| Settlement of RSU shares |
243,499 | — | — | — | (5,688 | ) | — | — | — | (5,688 | ) | |||||||||||||||||||||||||
| Deferred placement fee |
— | — | — | — | (10,000 | ) | — | — | — | (10,000 | ) | |||||||||||||||||||||||||
| Other |
— | — | — | — | 379 | — | — | — | 379 | |||||||||||||||||||||||||||
| Exchange of B shares to A shares |
887,104 | (887,104 | ) | 1 | (1 | ) | — | — | — | — | — | |||||||||||||||||||||||||
| Stock-based compensation, RSU and warrant expense |
— | — | — | — | 21,747 | — | — | — | 21,747 | |||||||||||||||||||||||||||
| Other comprehensive income (loss) |
— | — | — | — | — | — | — | 2,254 | 2,254 | |||||||||||||||||||||||||||
|
|
|
|
|
|
|
|
|
|
|
|
|
|
|
|
|
|
|
|||||||||||||||||||
| Balance as of December 31, 2014 |
34,469,650 | 6,940,048 | $ | 36 | $ | 7 | $ | 834,538 | $ | 35,144 | $ | (18,751 | ) | $ | 679 | $ | 851,653 | |||||||||||||||||||
|
|
|
|
|
|
|
|
|
|
|
|
|
|
|
|
|
|
|
|||||||||||||||||||
The accompanying notes are an integral part of these consolidated financial statements
F-6
Table of Contents
Index to Financial Statements
FCB FINANCIAL HOLDINGS, INC. AND SUBSIDIARIES
CONSOLIDATED STATEMENTS OF CASH FLOWS
(Dollars in thousands)
| Years ended December 31, | ||||||||||||
| 2014 | 2013 | 2012 | ||||||||||
| Cash Flows From Operating Activities: |
||||||||||||
| Net income (loss) |
$ | 22,372 | $ | 17,171 | $ | (4,828 | ) | |||||
| Adjustments to reconcile net income to net cash provided by operating activities: |
||||||||||||
| Provision for loan losses |
10,243 | 2,914 | 26,101 | |||||||||
| Amortization of intangible assets |
1,710 | 1,526 | 1,806 | |||||||||
| Depreciation and amortization of premises and equipment |
3,894 | 3,093 | 2,676 | |||||||||
| Amortization of discount on loans |
(4,701 | ) | (2,345 | ) | (3,001 | ) | ||||||
| Net amortization (accretion) of premium (discount) on investment securities |
2,384 | 2,160 | 2,309 | |||||||||
| Net amortization (accretion) of premium (discount) on time deposits |
(1,691 | ) | (250 | ) | (1,223 | ) | ||||||
| Net amortization (accretion) on FHLB advances and other borrowings |
(1,569 | ) | 1,356 | 1,122 | ||||||||
| Impairment of other real estate owned |
2,690 | 3,580 | 10,609 | |||||||||
| FDIC Loss share indemnification loss |
21,425 | 18,533 | 3,470 | |||||||||
| (Gain) loss on investment securities |
(12,105 | ) | (8,682 | ) | (2,321 | ) | ||||||
| (Gain) loss on sale of loans |
(538 | ) | (621 | ) | — | |||||||
| (Gain) loss on sale of other real estate owned |
(144 | ) | (1,267 | ) | (5,153 | ) | ||||||
| (Gain) loss on sale of premises and equipment |
(8 | ) | 21 | 32 | ||||||||
| Deferred tax expense |
(7,293 | ) | 1,026 | (4,323 | ) | |||||||
| Stock-based compensation and warrant expense |
21,747 | 2,635 | 4,320 | |||||||||
| Increase in cash surrender value of BOLI |
(4,175 | ) | (257 | ) | — | |||||||
| (Gain) on life insurance proceeds |
(1,594 | ) | — | — | ||||||||
| Net change in operating assets and liabilities: |
||||||||||||
| Net change in loans held for sale |
(707 | ) | — | — | ||||||||
| Collection from FDIC on loss share indemnification asset |
6,652 | 19,974 | 81,922 | |||||||||
| Net change in other assets |
(21,213 | ) | 4,510 | 12,555 | ||||||||
| Net change in other liabilities |
9,323 | 605 | (3,689 | ) | ||||||||
|
|
|
|
|
|
|
|||||||
| Net cash provided by (used in) operating activities |
46,702 | 65,682 | 122,384 | |||||||||
|
|
|
|
|
|
|
|||||||
| Cash Flows From Investing Activities: |
||||||||||||
| Purchase of investment securities available for sale |
(1,361,290 | ) | (1,048,844 | ) | (1,034,679 | ) | ||||||
| Sales of investment securities available for sale |
1,291,261 | 912,394 | 774,434 | |||||||||
| Paydown and maturities of investment securities held to maturity |
372 | 200 | — | |||||||||
| Paydown and maturities of investment securities available for sale |
147,726 | 429,020 | 538,956 | |||||||||
| Purchase of FHLB and other bank stock |
(103,179 | ) | (24,347 | ) | (2,190 | ) | ||||||
| Sales of FHLB and other bank stock |
72,475 | 18,309 | 12,340 | |||||||||
| Net cash paid in acquisition |
(14,073 | ) | — | — | ||||||||
| Net change in loans |
(921,906 | ) | (793,505 | ) | (261,415 | ) | ||||||
| Purchase of loans |
(243,544 | ) | (184,261 | ) | — | |||||||
| Proceeds from sale of loans |
23,517 | 48,597 | — | |||||||||
| Purchase of bank-owned life insurance |
(60,000 | ) | (75,000 | ) | — | |||||||
| Proceeds from sale of other real estate owned |
35,093 | 48,277 | 50,131 | |||||||||
| Purchase of premises and equipment |
(3,135 | ) | (1,077 | ) | (3,298 | ) | ||||||
| Proceeds from the sale of premises and equipment |
3,855 | 93 | 80 | |||||||||
| Proceeds from life insurance |
1,197 | — | — | |||||||||
|
|
|
|
|
|
|
|||||||
| Net cash provided by (used in) investing activities |
(1,131,631 | ) | (670,144 | ) | 74,359 | |||||||
|
|
|
|
|
|
|
|||||||
| Cash Flows From Financing Activities: |
||||||||||||
| Net change in deposits |
322,717 | 603,443 | (46,294 | ) | ||||||||
| Net change in FHLB advances and other borrowings |
544,046 | 158,015 | (117,316 | ) | ||||||||
| Net change in repurchase agreements |
(3,031 | ) | 4,853 | — | ||||||||
| Repurchase of stock |
— | (18,751 | ) | — | ||||||||
| Proceeds from capital raise |
104,475 | — | — | |||||||||
| Deferred placement fee |
(10,000 | ) | — | — | ||||||||
| Settlement of RSU shares |
(5,688 | ) | — | — | ||||||||
| Other financing costs |
278 | (101 | ) | (464 | ) | |||||||
|
|
|
|
|
|
|
|||||||
| Net cash provided by (used in) financing activities |
952,797 | 747,459 | (164,074 | ) | ||||||||
|
|
|
|
|
|
|
|||||||
| Net Change in Cash and Cash Equivalents |
(132,132 | ) | 142,997 | 32,669 | ||||||||
| Cash and Cash Equivalents at Beginning of Period |
239,217 | 96,220 | 63,551 | |||||||||
|
|
|
|
|
|
|
|||||||
| Cash and Cash Equivalents at End of Period |
$ | 107,085 | $ | 239,217 | $ | 96,220 | ||||||
|
|
|
|
|
|
|
|||||||
| Supplemental Disclosures of Cash Flow Information: |
||||||||||||
| Interest paid |
$ | 27,742 | $ | 23,098 | $ | 28,411 | ||||||
| Income taxes paid |
9,932 | 5,661 | 788 | |||||||||
| Supplemental disclosure of noncash investing and financing activities: |
||||||||||||
| Transfer of loans to other real estate owned |
$ | 22,399 | $ | 27,535 | $ | 47,977 | ||||||
| Fair value of assets acquired |
957,324 | — | — | |||||||||
| Goodwill recorded |
47,335 | — | — | |||||||||
| Liabilities assumed |
962,194 | — | — | |||||||||
The accompanying notes are an integral part of these consolidated financial statements
F-7
Table of Contents
Index to Financial Statements
FCB FINANCIAL HOLDINGS, INC.
NOTES TO CONSOLIDATED FINANCIAL STATEMENTS
NOTE 1. SUMMARY OF SIGNIFICANT ACCOUNTING POLICIES
Nature of Operations
FCB Financial Holdings, Inc. (the “Company”), formerly known as Bond Street Holdings, Inc., is a national bank holding company with one wholly-owned national bank subsidiary, Florida Community Bank, N.A. (“Florida Community Bank” or the “Bank”), headquartered in Weston, Florida, offering a comprehensive range of traditional banking products and services to individual and corporate customers through 52 banking centers located in Florida at December 31, 2014.
Principles of Consolidation
The consolidated financial statements include the accounts of the Company, its wholly-owned subsidiary, the Bank, and the Bank’s subsidiaries, which consist of a group of real estate holding companies. Intercompany transactions and balances have been eliminated in consolidation.
Use of Estimates
The Company’s financial reporting and accounting policies conform to U.S. GAAP. The preparation of financial statements in conformity with U.S. GAAP requires management to make estimates and assumptions that affect the reported amounts of assets and liabilities and disclosure of contingent assets and liabilities at the date of the consolidated financial statements and the reported amounts of revenues and expenses during the reporting period. Actual results could differ from those estimates.
Material estimates subject to significant change include the allowance for loan losses, valuation of and accounting for loans covered by loss sharing arrangements with the FDIC and the related loss share receivable, valuation of and accounting for acquired loans, the carrying value of OREO, determination of fair value of financial instruments, valuation of goodwill and other intangible assets, contingent consideration liabilities, acquisition-related fair value computations, stock-based compensation and deferred taxes.
Reclassifications
In certain instances, amounts reported in prior periods consolidated financial statements have been reclassified to conform to the current period presentation. Such reclassifications had no effect on previously reported net income or total stockholders’ equity.
For the 2013 Consolidated Statements of Cash Flows, the Company reclassified $29.5 million from operating to investing activities related to the settlement of an investment security.
Business combinations
The Company accounts for transactions that meet the definition of a purchase business combination by recording the assets acquired and liabilities assumed at their fair value upon acquisition. The operations of the Acquisitions are included in the consolidated financial statements from the date of acquisition. Intangible assets, indemnification contracts and contingent consideration are identified and recognized individually. If the fair value of the assets acquired exceeds the purchase price plus the fair value of the liabilities assumed, a bargain purchase gain is recognized. Conversely, if the purchase price plus the fair value of the liabilities assumed exceeds the fair value of the assets acquired, goodwill is recognized. The Company’s assumptions utilized to determine the fair value of assets acquired and liabilities assumed conform to market conditions at the date of acquisition. The provisional amounts recorded are updated if better information is obtained about the initial assumptions used to determine fair value or if new information is obtained regarding the facts and circumstances that existed at the date of acquisition. The provisional amounts may be adjusted through the completion of the measurement period, which does not exceed one year from the date of acquisition.
F-8
Table of Contents
Index to Financial Statements
Fair Value Measurement
The Company uses estimates of fair value in applying various accounting standards for its consolidated financial statements on either a recurring or non-recurring basis. Fair value is defined as the price to sell an asset or transfer a liability in an orderly transaction between willing and able market participants. The Company groups its assets and liabilities measured at fair value in three hierarchy levels, based on the observability and transparency of the inputs. These levels are as follows:
Level 1—Unadjusted quoted prices in active markets that are accessible at the measurement date for identical assets or liabilities;
Level 2—Observable inputs other than level 1 inputs, including quoted prices for similar assets and liabilities, quoted prices for identical assets and liabilities in less active markets and other inputs that can be corroborated by observable market data;
Level 3—Unobservable inputs supported by limited or no market activity or data and inputs requiring significant management judgment or estimation; valuation techniques utilizing level 3 inputs include option pricing models, discounted cash flow models and similar techniques.
It is the Company’s policy to maximize the use of observable inputs and minimize the use of unobservable inputs in estimating fair value. Unobservable inputs are utilized in determining fair value estimates only to the extent that observable inputs are not available. The need to use unobservable inputs generally results from a lack of market liquidity and trading volume. Transfers between levels of fair value hierarchy are recorded at the end of the reporting period.
Accounting Standards Codification (“ASC”) Topic 825, Financial Instruments, allows the Company an irrevocable option for measurement of eligible financial assets or financial liabilities at fair value on an instrument by instrument basis (the fair value option). Subsequent to the initial adoption of ASC Topic 825, the Company may elect to account for eligible financial assets and financial liabilities at fair value. Such an election may be made at the time an eligible financial asset, financial liability or firm commitment is recognized or when certain specified reconsideration events occur. The Company has not elected the fair value option for any eligible financial instrument as of December 31, 2014 and 2013.
Transfers of Financial Assets
Transfers of financial assets are accounted for as sales, when control over the assets has been surrendered. A gain or loss is recognized in earnings upon completion of the sale based on the difference between the sales proceeds and the carrying value of the assets. Control over the transferred assets is deemed to have been surrendered when the assets have been isolated from the Company, the transferee obtains the right (free of conditions that constrain it from taking advantage of that right) to pledge or exchange the transferred assets and the Company does not maintain effective control over the transferred assets through an agreement to repurchase them before their maturity.
Cash and Cash Equivalents
Cash and cash equivalents include cash and due from banks, interest-bearing deposits with banks, Federal funds sold and securities purchased under resale agreements or similar arrangements. Cash and cash equivalents have original maturities of three months or less. Accordingly, the carrying amount of such instruments is considered a reasonable estimate of fair value. The Company’s balances maintained may at times exceed federal depository insurance limits. The Bank is required to maintain reserve balances with the FRB. Such reserve requirements are based on a percentage of deposit liabilities and may be satisfied by cash on hand. The reserve balance requirement was $28.5 million as of December 31, 2014.
F-9
Table of Contents
Index to Financial Statements
Investment Securities
The Company determines the classification of investment securities at the time of purchase. If the Company has the intent and the ability at the time of purchase to hold debt securities until maturity, they are classified as held-to-maturity. Investment securities held-to-maturity are stated at amortized cost. Debt securities the Company does not intend to hold to maturity are classified as available for sale and carried at estimated fair value with unrealized gains or losses reported as a separate component of stockholders’ equity in accumulated other comprehensive income (loss), net of applicable income taxes. Available for sale securities are a part of the Company’s asset/liability management strategy and may be sold in response to changes in interest rates, prepayment risk or other market factors.
Interest income and dividends on securities are recognized in interest income on an accrual basis. Premiums and discounts on debt securities are amortized as an adjustment to interest income over the period to maturity of the related security using the effective interest method. Realized gains or losses on the sale of securities are determined using the specific identification method.
The Company reviews investment securities for impairment on a quarterly basis or more frequently if events and circumstances warrant. In order to determine if a decline in fair value below amortized cost represents OTTI, management considers several factors, including but not limited to, the length of time and extent to which the fair value has been less than the amortized cost basis, the financial condition and near-term prospects of the issuer (considering factors such as adverse conditions specific to the issuer and the security and ratings agency actions) and the Company’s intent and ability to retain the investment in order to allow for an anticipated recovery in fair value.
The Company recognizes OTTI of a debt security for which there has been a decline in fair value below amortized cost if (i) management intends to sell the security, (ii) it is more likely than not that the Company will be required to sell the security before recovery of its amortized cost basis, or (iii) the Company does not expect to recover the entire amortized cost basis of the security. The amount by which amortized cost exceeds the fair value of a debt security that is considered to have OTTI is separated into a component representing the credit loss, which is recognized in earnings, and a component related to all other factors, which is recognized in other comprehensive income (loss). The measurement of the credit loss component is equal to the difference between the debt security’s amortized cost basis and the present value of its expected future cash flows discounted at the security’s effective yield. If the Company intends to sell the security, or if it is more likely than not it will be required to sell the security before recovery, an OTTI write-down is recognized in earnings equal to the entire difference between the amortized cost basis and fair value of the security.
The Bank, as a member of the FHLB is required to maintain an investment in the stock of the FHLB. No market exists for this stock, and the Bank’s investment can be liquidated only through redemption by the FHLB, at the discretion of and subject to conditions imposed by the FHLB. Historically, FHLB stock redemptions have been at cost (par value), which equals the Company’s carrying value. The Company monitors its investment in FHLB stock for impairment through review of recent financial results of the FHLB including capital adequacy and liquidity position, dividend payment history, redemption history and information from credit agencies. The Company has not identified any indicators of impairment of FHLB stock.
Loans
The Company’s accounting methods for loans differ depending on whether the loans are new (“New” loans) or acquired (“Acquired” loans), and for acquired loans, whether the loans were acquired at a discount as a result of credit deterioration since the date of origination.
New Loans
The Company accounts for originated loans and purchased loans not acquired through business acquisitions as new loans. New loans that management has the intent and ability to hold for the foreseeable future are reported at their outstanding principal balances net of any allowance for loan losses, unamortized deferred fees and costs and unamortized premiums or discounts. The net amount of nonrefundable loan origination fees and certain direct costs associated with the lending process are deferred and amortized to interest income over the contractual lives of the new loans using methods which approximate the level yield method. Discounts and premiums are amortized or accreted to interest income over the estimated term of the new loans using methods that approximate the level yield method. Interest income on new loans is accrued based on the unpaid principal balance outstanding and the contractual terms of the loan agreements.
F-10
Table of Contents
Index to Financial Statements
Acquired Loans
Acquired loans are accounted for under ASC 310-30 unless the loan type is excluded from the scope of ASC 310-30 (i.e. loans where borrowers have revolving privileges at acquisition date, or “Non-ASC 310-30” loans). The Company has elected to account for loans acquired with deteriorated credit quality since origination under ASC 310-30 (“ASC 310-30” loans or pools) due to the following:
| • | There is evidence of credit quality deterioration since origination resulting in a “Day 1” discount attributable, at least in part, to credit quality; |
| • | The loans were acquired in a business combination or asset purchase; and |
| • | The loans are not to be subsequently accounted for at fair value. |
The Company has elected this policy for loans acquired through business combinations exhibiting credit deterioration since origination, except those loan types which have been scoped out of ASC 310-30. Substantially all loans acquired through the FDIC-assisted acquisitions had a fair value discount at acquisition date due at least in part to deterioration in credit quality since origination. However, there was a separate grouping of loans individually identified with substantial credit impairment that would be explicitly scoped into ASC 310-30 from those that were classified by analogy. The Company determined that a loan would be explicitly scoped into ASC 310-30 if there was evidence of credit deterioration at Day 1 and that it was probable that the Company would be unable to collect all contractual cash flows receivable. The loans that were classified by analogy were determined to have evidence of credit deterioration at Day 1 and that it was possible, not probable, that the Company would be unable to collect all contractual cash flows receivable.
For each acquisition, ASC 310-30 loans are aggregated into pools based on common risk characteristics, which includes similar credit risk of the loans based on whether loans were analogized or were explicitly scoped into ASC 310-30, internal risk ratings for commercial real estate, land and development and commercial loans; and performing status for consumer and single family residential loans. Pools of loans are further aggregated by collateral type (e.g. commercial real estate, single family residential, etc.). The Company did not elect to aggregate loans into pools that were acquired from separate Acquisitions completed in the same fiscal quarter.
Acquired loans are recorded at their fair value at the acquisition date. Fair value for acquired loans is based on a discounted cash flow methodology that considers factors including the type of loan and related collateral type, delinquency and credit classification status, fixed or variable interest rate, term of loan, whether or not the loan was amortizing, and current discount rates. Additional assumptions used include default rates, loss severity, loss curves and prepayment speeds. Discounts due to credit quality are included in the determination of fair value; therefore an allowance for loan losses is not recorded at the acquisition date. The discount rates used for the cash flow methodology are based on market rates for new originations of comparable loans at the time of acquisition and include adjustments for liquidity concerns. The fair value is determined from the discounted cash flows for each individual loan, and for ASC 310-30 loans are then aggregated at the unit of account, or pool level.
For acquired loans with deteriorated credit quality, the Company makes an estimate of the total cash flows it expects to collect from the loans in each pool, which includes undiscounted expected principal and interest as well as cash received through other forms of satisfaction (e.g. foreclosure). The excess of contractual amounts over the total cash flows expected to be collected from the loans is referred to as non-accretable difference, which is not accreted into income. The excess of the expected undiscounted cash flows over the carrying value of the loans is referred to as accretable discount. Accretable discount is recognized as interest income on a level-yield basis over the expected term of the loans in each pool.
The Company continues to estimate cash flows expected to be collected over the expected term of the ASC 310-30 loans on a quarterly basis. Subsequent increases in total cash flows expected to be collected are recognized as an adjustment to the accretable discount with the amount of periodic accretion adjusted over the remaining expected term of the loans. Subsequent decreases in cash flows expected to be collected over the expected term of the loans are recognized as impairment in the current period through a provision for loan losses.
F-11
Table of Contents
Index to Financial Statements
Each pool is accounted for as a single asset with a single composite interest rate and an aggregate expectation of cash flows. Resolutions of loans may include sales to third parties, receipt of payments in settlement with the borrower, or foreclosure of the collateral. Upon these resolutions, the Company’s policy is to remove an individual ASC 310-30 loan from a pool based on comparing the amount received from its resolution with its contractual amount. Any difference between these amounts is absorbed by the nonaccretable difference. This removal method assumes that the amount received from these resolutions approximates the pool performance expectations of cash flows. The accretable yield percentage is unaffected by the resolution. Any changes in the effective yield for the remaining loans in the pool are addressed by the quarterly cash flow evaluation process for each pool. For loans that are resolved by payment in full, there is no release of the nonaccretable difference for the pool because there is no difference between the amount received at resolution and the contractual amount of the loan.
Payments received in excess of expected cash flows may result in an ASC 310-30 pool becoming fully amortized and its carrying value reduced to zero even though outstanding contractual balances remain related to loans in the pool. Once the carrying value of an ASC 310-30 pool is reduced to zero, any future proceeds from the remaining loans are recognized as interest income upon receipt. There were six ASC 310-30 pools whose carrying value had been reduced to zero as of December 31, 2014 and 2013. These pools had an aggregate Unpaid Principal Balance (“UPB” or “UPBs”) of $795 thousand and $351 thousand as of December 31, 2014 and 2013, respectively.
Non-ASC 310-30 loans are recorded at their estimated fair value as of the acquisition date and subsequently accounted for under ASC Topic 310-20, Receivables—Nonrefundable Fees and Other Costs (“ASC 310-20”). The fair value discount is accreted using methods which approximate the level-yield method over the remaining term of the loans and is recognized as a component of interest income.
Loans Held for Sale
Certain residential fixed rate and adjustable rate mortgage loans originated by the Company with the intent to sell in the secondary market are carried at the lower of cost or fair value, as determined by outstanding commitments from investors. These loans are generally sold on a non-recourse basis with servicing released. Gains and losses on the sale of loans recognized in earnings are measured based on the difference between proceeds received and the carrying amount of the loans, inclusive of deferred origination fees and costs, if any.
Nonaccrual Loans
For new and Non-ASC 310-30 loans, the Company classifies loans as past due when the payment of principal or interest is greater than 30 days delinquent based on the contractual next payment due date. The Company’s policies related to when loans are placed on nonaccrual status conform to guidelines prescribed by regulatory authorities. Loans are placed on nonaccrual status when it is probable that principal or interest is not fully collectible, or generally when principal or interest becomes 90 days past due, whichever occurs first. Loans secured by one to four family residential properties may remain in accruing status until they are 180 days past due if management determines that it does not have concern over the collectability of principal and interest because the loan is adequately collateralized and in the process of collection. When loans are placed on nonaccrual status, interest receivable is reversed against interest income in the current period and amortization of any discount ceases. Interest payments received thereafter are applied as a reduction to the remaining principal balance unless management believes that the ultimate collection of the principal is likely, in which case payments are recognized in earnings on a cash basis. Loans are removed from nonaccrual status when they become current as to both principal and interest and the collectability of principal and interest is no longer doubtful.
Generally, a nonaccrual loan that is restructured remains on nonaccrual for a period of six months to demonstrate the borrower can meet the restructured terms. However, performance prior to the restructuring, or significant events that coincide with the restructuring, are considered in assessing whether the borrower can meet the new terms and may result in the loan being returned to accrual status after a shorter performance period. If the borrower’s ability to meet the revised payment schedule is not reasonably assured, the loan remains classified as a nonaccrual loan. Contractually delinquent ASC 310-30 loans are not classified as nonaccrual as long as the discount continues to be accreted on the corresponding ASC 310-30 pool.
F-12
Table of Contents
Index to Financial Statements
Troubled Debt Restructurings
In certain situations due to economic or legal reasons related to a borrower’s financial difficulties, the Company may grant a concession to the borrower for other than an insignificant period of time that it would not otherwise consider. At that time, except for ASC 310-30 loans, which are accounted for as pools, the related loan is classified as a troubled debt restructuring (“TDR”) and considered impaired. Modified ASC 310-30 loans accounted for in pools are not accounted for as TDRs, are not separated from the pools and are not classified as impaired loans. The concessions granted may include rate reductions, principal forgiveness, payment forbearance, extensions of maturity at rates of interest below those commensurate with the risk profile of the borrower, and other actions intended to minimize economic loss. A troubled debt restructured loan is generally placed on nonaccrual status at the time of the modification unless the borrower has no history of missed payments for six months prior to the restructuring. If the borrower performs pursuant to the modified loan terms for at least six months and the remaining loan balance is considered collectible, the loan is returned to accrual status.
Impaired Loans
An ASC 310-30 pool is considered to be impaired when it is probable that the Company will be unable to collect all the cash flows expected at acquisition, plus additional cash flows expected to be collected arising from changes in estimates after acquisition. All ASC 310-30 pools are evaluated individually for impairment based their expected total cash flows. The discount continues to be accreted on ASC 310-30 pools as long as there are expected future cash flows in excess of the current carrying amount of the pool.
Non-ASC 310-30 and new loans are considered impaired when, based on current information and events, it is probable that the Company will be unable to collect the scheduled payments of principal or interest when due, according to the contractual terms of the loan agreements.
All Non-ASC 310-30 and new loans of $250,000 or greater with an internal risk rating of substandard or below and on nonaccrual, as well as loans classified as TDRs are reviewed individually for impairment on a quarterly basis.
Allowance for Loan Losses
The Company’s ALL is established for both performing and nonperforming loans. The Company’s ALL is the amount considered adequate to absorb probable losses within the portfolio based on management’s evaluation of the size and current risk characteristics of the loan portfolio. Such evaluation considers numerous factors including, but not limited to, internal risk ratings, loss forecasts, collateral values, geographic location, borrower FICO scores, delinquency rates, nonperforming and restructured loans, origination channels, product mix, underwriting practices, industry conditions, economic trends and net charge-off trends. The ALL relates to new loans, estimated additional losses arising on Non-ASC 310-30 loans subsequent to the Acquisitions and additional impairment recognized as a result of decreases in expected cash flows on ASC 310-30 pools due to further credit deterioration or other factors since the Acquisitions. The ALL consists of both specific and general components.
For ASC 310-30 pools, a specific valuation allowance is established when it is probable that the Company will be unable to collect all of the cash flows expected at acquisition, plus the additional cash flows expected to be collected arising from changes in estimates after acquisition. Expected cash flows are estimated on an individual loan basis and then aggregated at the ASC 310-30 pool level. The analysis of expected pool cash flows incorporates updated pool level expected prepayment rate, default rate, delinquency level and loss severity given default assumptions. These analyses incorporate information about loan performance, collateral values, the financial condition of the borrower, internal risk ratings, the Company’s own and industry historical delinquency and default severity data. The carrying value for ASC 310-30 pools is reduced by the amount of the calculated impairment, which is also the basis in which future accretion income is calculated. A charge-off is taken for an individual ASC 310-30 loan when it is deemed probable that the loan will be resolved for an amount less than its carrying value. The charge-off is taken to the specific allowance or mark as applicable. Alternatively, an improvement in the expected cash flows related to ASC 310-30 pools results in a reduction or recoupment of any previously established specific allowance with a corresponding credit to the provision for loan losses. Any recoupment recorded is limited to the amount of the remaining specific allowance for that pool, with any excess of expected cash flow resulting in a reclassification from non-accretable to accretable yield and an increase in the prospective yield of the pool.
F-13
Table of Contents
Index to Financial Statements
The new and Non-ASC 310-30 loan portfolios have limited delinquency and credit loss history and have not yet exhibited an observable loss trend. The credit quality of loans in these loan portfolios are impacted by delinquency status and debt service coverage generated by the borrowers’ businesses and fluctuations in the value of real estate collateral. Management considers delinquency status to be the most meaningful indicator of the credit quality of one-to-four single family residential, home equity loans and lines of credit and other consumer loans. Delinquency statistics are updated at least monthly. Internal risk ratings are considered the most meaningful indicator of credit quality for Non ASC 310-30 and new commercial, construction and commercial real estate loans. Internal risk ratings are a key factor in identifying loans that are individually evaluated for impairment and impact management’s estimates of loss factors used in determining the amount of the ALL. Internal risk ratings are updated on a continuous basis. Relationships with balances in excess of $250,000 are re-evaluated at least annually and more frequently if circumstances indicate that a change in risk rating may be warranted.
New and Non-ASC 310-30 loans of $250,000 or greater with an internal risk rating of substandard or below and on nonaccrual, as well as loans classified as TDR are reviewed individually for impairment on a quarterly basis. The specific allowance established for these loans is based on a thorough analysis of the most probable source of repayment, including the present value of the loan’s expected future cash flows, the loan’s estimated market value or the estimated fair value of the underlying collateral less costs of disposition. General allowances are established for new and Non-ASC 310-30 loans that are not classified as impaired, which are evaluated by loan category based on common risk characteristics. In this process, general loan loss factors are established based on the following: historical loss factors derived from the Federal Financial Institutions Examination Council’s quarterly Unified Performance Branch Report for Group 1 banks (assets greater than $3 billion) using an annualized weighted average eight quarter rolling basis; trends in delinquencies and nonaccruals by loan portfolio segment and asset categories within those segments; portfolio segment and asset category production trends, including average risk ratings and loan-to value (“LTV”) ratios; current industry conditions, including real estate market trends; general economic conditions; credit concentrations by portfolio and asset categories; and portfolio quality, which encompasses an assessment of the quality and relevance of borrowers’ financial information and collateral valuations and average risk rating and migration trends within portfolios and asset categories.
Other adjustments for qualitative factors may be made to the allowance after an assessment of internal and external influences on credit quality and loss severity that are not fully reflected in the historical loss or risk rating data. For these measurements, the Company uses assumptions and methodologies that are relevant to estimating the level of impairment and probable losses in the loan portfolio. To the extent that the data supporting such assumptions has limitations, management’s judgment and experience play a key role in recording the allowance estimates. Qualitative adjustments are considered for: portfolio credit quality trends, including levels of delinquency, charge-offs, nonaccrual, restructuring and other factors; policy and credit standards, including quality and experience of lending and credit management; and general economic factors, including national, regional and local conditions and trends.
Additions to the ALL are made by provisions charged to earnings. The allowance is decreased by charge-offs of balances no longer deemed collectible. Charge-offs on new and Non-ASC 310-30 loans are recognized as follows: commercial loans are written-off when management determines them to be uncollectible; for unsecured consumer loans at 90 days past due; and for residential real estate loans and secured consumer loans when they become 120 to 180 days past due, depending on the collateral type. The Company reports recoveries on a cash basis at the time received. Recoveries on ASC 310-30 loans that were charged-off and Non-ASC 310-30 loans that were charged-off prior to the Acquisitions are recognized in earnings as income from resolution of acquired assets and do not affect the allowance for loan losses. All other recoveries are credited to the ALL.
F-14
Table of Contents
Index to Financial Statements
Loss Share Indemnification Asset and Clawback Liability
Assets subject to loss sharing agreements with the FDIC are labeled “Covered Assets” in the consolidated financial statements and include acquired loans (“Covered Loans”) and OREO.
The loss share indemnification asset is measured separately from the Covered Assets acquired as it is not contractually embedded in any of the Covered Assets. The initial fair value of the loss share indemnification asset represents the present value of the estimated cash payments expected to be received from the FDIC for future losses on Covered Assets, based on the credit adjustment estimated for each Covered Asset and the loss sharing percentages. The estimated cash flows are discounted using a risk-free yield curve plus a premium reflecting the uncertainty related to the timing and receipt of such cash flows. The amount ultimately collected for this asset is dependent upon the performance of the underlying Covered Assets, the passage of time and claims submitted to the FDIC.
The amounts covered by the loss sharing agreements are the pre-acquisition book value of the underlying assets, the contractual balance of unfunded commitments that were acquired, and certain future net direct costs applicable to the Covered Assets. As required by the respective loss sharing agreements, the Company submits a loss share certificate to the FDIC on a quarterly basis requesting reimbursement for losses on Covered Assets and covered expenses. Covered expenses are recorded in non-interest expense when incurred with an offsetting increase to the loss share indemnification asset and non-interest income for the amount expected to be reimbursed by the FDIC. Certain covered expenses are claimed upon resolution of the Covered Asset, resulting in the expense and the related reimbursements from the FDIC occurring in different periods.
The Company reviews and updates the cash flows expected to be collected on Covered Assets and the FDIC loss share indemnification asset on a quarterly basis as loss and recovery estimates related to Covered Assets change. Decreases in the amount of cash flows expected to be collected on Covered Loans after acquisition result in a provision for loan losses, an increase in the ALL, and a proportional increase to the FDIC loss share indemnification asset and income for the estimated amount to be reimbursed. Increases in the amount of cash flows expected to be collected on Covered Loans after acquisition result in the reversal of any previously-recorded provision for loan losses and related ALL and a decrease to the FDIC loss share indemnification asset, or prospective adjustment to the accretable discount if no provision for loan losses had been previously recorded. If no provision for loan losses had been previously recorded, improvements in the expected cash flows from the Covered Loans, which is reflected as an adjustment to yield and accreted into income over the remaining expected term of the loans, decreases the expected cash flows to be collected from the loss sharing agreement, with such decreases reducing the yield to be accreted on a prospective basis if the total expected cash flows from the loss sharing agreement exceeds its carrying amount; and, if the carrying amount of the FDIC loss share indemnification asset exceeds the total expected cash flows, the excess is amortized as a reduction of income over the shorter of (1) the remaining expected term of the respective loans or (2) the remaining term of the loss sharing agreement.
As a result, the value of the FDIC loss share indemnification asset will continue to fluctuate over time based upon the continued performance of the Covered Assets and as the Company receives payments from the FDIC under the loss sharing agreements.
The loss sharing agreements between the Company and the FDIC for certain of the Acquisitions include clawback provisions that obligate the Company to pay the FDIC a certain amount in the event that losses incurred by the Company do not reach a specified threshold upon expiration of the loss sharing agreement. The fair value of the clawback liability is initially estimated using the same discounted cash flow model used to determine the loss share indemnification asset, using a discount rate that takes into account the Company’s credit risk. The clawback liability is re-measured quarterly based on the terms of the applicable loss sharing agreement, changes in projected losses on Covered Assets and the cumulative servicing amount, if applicable.
The clawback liability is included in other liabilities in the accompanying consolidated balance sheets and the amortization and loss on re-measurement is included in loss share indemnification loss within noninterest income in the accompanying Consolidated Statements of Income.
F-15
Table of Contents
Index to Financial Statements
Premises and Equipment
Premises and equipment are stated at cost less accumulated depreciation or amortization. Depreciation and amortization are computed using the straight-line method over the estimated useful lives of the related assets, except for land which is stated at cost. The useful lives of premises and equipment are: 39 years for bank premises; 3 to 5 years for computer equipment and software; and 5 years for furniture and equipment.
Leasehold improvements are amortized on a straight-line basis over the lesser of the lease terms, including certain renewals that were deemed probable at lease inception, or the estimated useful lives of the improvements. Purchased software and external direct costs of computer software developed for internal use are capitalized provided certain criteria are met and amortized over the useful lives of the software. Rent expense and rental income on operating leases are recorded using the straight-line method over the appropriate lease terms.
OREO
Real estate properties acquired through, or in lieu of, foreclosure or in connection with the Acquisitions, are held for sale and are initially recorded at their fair value less disposition costs. When such assets are acquired, any shortfall between the loan carrying value and the estimated fair value of the underlying collateral less disposition costs is recorded as an adjustment to the allowance for loan losses while any excess is recognized in income. The Company periodically performs a valuation of the property held; any excess of carrying value over fair value less disposition costs is charged to earnings as impairment. Routine maintenance and real estate taxes are expensed as incurred.
BOLI
The Bank owns life insurance policies on certain directors and current and former employees. These policies are recorded at the amount that can be realized under the insurance contract at the balance sheet date, which is the cash surrender value adjusted for other charges or other amounts due that are probable at settlement, if applicable. Increases in the cash surrender value of these policies are included in noninterest income in the Consolidated Statements of Income. The Company’s BOLI policies are invested in general account and hybrid account products that have been underwritten by highly-rated third party insurance carriers.
Goodwill and Other Intangible Assets
Goodwill represents the excess of consideration transferred in business combinations over the fair value of net tangible and identifiable intangible assets acquired. Goodwill is not amortized, but is tested for impairment annually or more frequently if events or circumstances indicate that impairment may have occurred. The Company performs its annual goodwill impairment test in the fourth fiscal quarter. The Company has a single reporting unit. The impairment test compares the estimated fair value of the reporting unit to its carrying amount. If the fair value of the reporting unit exceeds its carrying amount, no impairment is indicated. If the fair value of the reporting unit is less than its carrying amount, impairment of goodwill is measured as the excess of the carrying amount of goodwill over its implied fair value. Prior to the issuance of publicly traded stock in August 2014, management used a third party financial institution valuation specialist to estimate the fair value of the reporting unit. This firm employs a market value approach based upon observable market values and price ratios of similar or comparable publicly owned bank holding companies and an investment value approach based upon the projected future value of the Company derived from its financial projections and discounted at an estimated market required cost of capital to estimate the fair value of the Company. Management evaluates and includes a change of control premium in the estimated fair value of the Company for purposes of evaluating goodwill for impairment. Unobservable inputs into the valuation models include the Company’s financial projections and observable inputs include the market values and price ratios of publicly owned bank holding companies and a discount rate based on the capital assets pricing model. Subsequent to August 2014, the Company uses the fair value of the Company’s publicly traded stock to estimate the fair value of the reporting unit. The estimated fair value of the reporting unit at the last impairment testing date exceeded its carrying amount; therefore, no impairment of goodwill was indicated.
Core deposit intangible (“CDI”) is a measure of the value of checking and savings deposit relationships acquired in a business combination. The fair value of the CDI stemming from any given business combination is based on the present value of the expected cost savings attributable to the core deposit funding relative to an alternative source of
F-16
Table of Contents
Index to Financial Statements
funding. CDI is amortized over the estimated useful lives of the existing deposit relationships acquired, but does not exceed 10 years. The Company evaluates such identifiable intangibles for impairment when events and circumstances indicate that its carrying amount may not be recoverable. If an impairment loss is determined to exist, the loss is reflected as an impairment charge in the Consolidated Statements of Income for the period in which such impairment is identified. No impairment charges were required to be recorded for the years ended December 31, 2014, 2013 or 2012.
Income Taxes
Income tax expense (benefit) is determined using the asset and liability method and consists of income taxes that are currently payable and deferred income taxes. Deferred income tax expense is determined by recognizing deferred tax assets and liabilities for future tax consequences attributable to temporary differences between the financial statement carrying amounts of existing assets and liabilities and their respective tax bases. Deferred tax assets and liabilities are measured using enacted tax rates that are expected to apply to taxable income in years in which those temporary differences are expected to be recovered or settled. Changes in tax rates on deferred tax assets and liabilities are recognized in income in the period that includes the enactment date. A valuation allowance is established for deferred tax assets when management determines that it is more likely than not that some portion or all of a deferred tax asset will not be realized. In making such determinations, the Company considers all available positive and negative evidence that may impact the realization of deferred tax assets. These considerations include the amount of taxable income generated in statutory carryback periods, future reversals of existing taxable temporary differences, projected future taxable income and available tax planning strategies.
The Company files a consolidated federal income tax return including the results of its wholly owned subsidiary, the Bank. The Company estimates income taxes payable based on the amount it expects to owe the various tax authorities (i.e., federal and state). Income taxes represent the net estimated amount due to, or to be received from, such tax authorities. In estimating income taxes, management assesses the relative merits and risks of the appropriate tax treatment of transactions, taking into account statutory, judicial, and regulatory guidance in the context of the Company’s tax position. Although the Company uses the best available information to record income taxes, underlying estimates and assumptions can change over time as a result of unanticipated events or circumstances such as changes in tax laws and judicial guidance influencing its overall tax position.
An uncertain tax position is recognized only if it is more-likely-than-not to be sustained upon examination, including resolution of any related appeals or litigation process, based on the technical merits of the position. The amount of tax benefit recognized in the financial statements is the largest amount of benefit that is more than fifty percent likely to be sustained upon ultimate settlement of the uncertain tax position. If the initial assessment fails to result in recognition of a tax benefit, the Company subsequently recognizes a tax benefit if there are changes in tax law or case law that raise the likelihood of prevailing on the technical merits of the position to more-likely-than-not, the statute of limitations expires, or there is a completion of an examination resulting in a settlement of that tax year or position with the appropriate agency. The Company recognizes interest related to unrecognized tax benefits in income tax expense (benefit) and penalties, if any, in other operating expenses.
Derivatives
The Company accounts for derivative instruments in accordance with FASB ASC Topic 815, “Derivatives and Hedging.” All derivatives are evaluated at inception as to whether or not they are hedging or non-hedging activities, and appropriate documentation is maintained to support the final determination. The Company recognizes all derivatives as either assets or liabilities on the Consolidated Balance Sheets and measures those instruments at fair value.
Certain derivative transactions with a particular counterparty, another financial institution, are subject to an enforceable master netting arrangement. The gross liabilities and gross assets to this counterparty are reported on a net basis.
Management periodically reviews contracts from various functional areas of the Company to identify potential derivatives embedded within selected contracts. As of December 31, 2014, the Company had interest derivative positions that are not designated as hedging instruments. See Note 8 “Derivatives” for a description of these instruments.
F-17
Table of Contents
Index to Financial Statements
Contingent Consideration Issued to the FDIC
In conjunction with certain Acquisitions, the Bank issued contingent consideration to the FDIC in the form of value appreciation instruments (“VAI”) and EAAs. Based on their settlement provisions, these instruments are classified as other liabilities in the accompanying Consolidated Balance Sheets and are adjusted to estimated fair value at each financial statement date, with changes in value reflected in other noninterest expenses in the accompanying Consolidated Statements of Income.
The fair value of the contingent consideration is based upon projections of the Company’s future estimate value by a third party financial institution valuation specialist. The valuation is based upon the Company’s financial projections and the valuation specialist’s assumptions about the future market valuation of the financial projections derived from historical market price ratios including price to tangible book value and price to earnings. These future projected prices are discounted at a market required equity return derived from the capital asset pricing model. In accordance with the terms of each of the agreements, a range of potential consideration is estimated and a probability is assigned based on management’s judgment to each estimated payment liability to determine a probability weighted expected value.
As of December 31, 2014, the Company had no remaining VAIs or EAAs, as the VAIs reached final settlement with the FDIC within the year ended December 31, 2013, and the EAAs reached final settlement with the FDIC on September 29, 2014.
Stock-based Compensation
The Company sponsors an incentive stock option plan established in 2009 (the “2009 Option Plan”) under which options may be granted periodically to key employees and directors of the Company or its affiliates at a specific exercise price to acquire shares of the Company’s Class A common stock. Compensation cost is measured based on the estimated fair value of the award at the grant date and is recognized in earnings on a straight-line basis over the requisite service period. The fair value of stock options is estimated at the date of grant using the Black-Scholes option pricing model. This model requires assumptions as to the expected stock volatility, dividends, terms and risk-free rates. The expected volatility is based on the volatility of comparable peer banks. The expected term represents the period of time that options are expected to be outstanding from the grant date. The risk-free interest rate is based on the US Treasury yield curve in effect at the time of grant for the appropriate life of each option. The expected dividend yield was determined by management based on the expected dividends to be declared over the expected term of the options.
In the fourth quarter of 2013, the Company established the 2013 Stock Incentive Plan (the “2013 Incentive Plan”) covering its executive management, directors, individual consultants and employees to receive stock awards for the Company’s common stock. The 2013 Incentive Plan provided that the awards were not exercisable until certain performance conditions were met, which included the completion of an IPO raising at least $100 million (a “Qualified IPO”) or a “Special Transaction”, generally defined as the consummation of a transaction representing a change of control of the Company. On August 6, 2014, the Company completed the initial public offering of 7,520,000 shares of Class A common stock for $22.00 per share. This public offering constituted a “Qualified IPO” with respect to the Company’s Option awards and 2013 Incentive Plan. See Note 14 “Stock-based Compensation and Other Benefit Plans” for further information regarding the 2009 Option Plan and the 2013 Incentive Plan.
Earnings per Share
Basic earnings (loss) per common share is calculated by dividing net income (loss) available to common stockholders by the weighted average number of common shares outstanding during the period. Diluted earnings per common share reflect the effect of common stock equivalents, including stock options and unvested shares, calculated using the treasury stock method. Common stock equivalents are excluded from the computation of diluted earnings (loss) per common share in periods in which the effect is anti-dilutive.
F-18
Table of Contents
Index to Financial Statements
Segment Reporting
The Company operates in one reportable segment of business, Community Banking, which includes the Bank, the Company’s sole banking subsidiary. Through the Bank, the Company provides a broad range of retail and commercial banking services. Management makes operating decisions and assesses performance based on an ongoing review of these banking operations, which constitute the Company’s only operating segment.
Recently Adopted Accounting Pronouncements
In November 2014, the FASB issued ASU No. 2014-17, “Pushdown Accounting – a consensus of the FASB Emerging Task Force (ASC 805, Business Combinations)”. This update allows an acquired entity to apply pushdown accounting in its separate financial statements on a change-in-control event. This election is applied for each change-in-control event during the period in which the change-in-control event occurs. The amendments in the update became effective prospectively beginning November 18, 2014. This pronouncement did not have material impact upon adoption.
Recent Issued Accounting Pronouncements
Section 107 of the JOBS Act provides that an emerging growth company can take advantage of the extended transition period provided in Section 7(a)(2)(B) of the Securities Act for complying with new or revised accounting standards affecting public companies. In other words, an emerging growth company can delay the adoption of certain accounting standards until those standards would otherwise apply to private companies. We have elected to use the extended transition period provided in Section 7(a)(2)(B) of the Securities Act until the earlier of the date we (i) are no longer an emerging growth company or (ii) affirmatively and irrevocably opt out of the extended transition period provided in Section 7(a)(2)(B).
In January 2014, the FASB issued ASU 2014-04, “Reclassification of Residential Real Estate Collateralized Consumer Mortgage Loans upon Foreclosure.” This update defines “in substance repossession or foreclosure” because the diversity in practice regarding when entities were reclassifying loans receivable to other real estate owned. A creditor is considered to have received physical possession (resulting from an in substance repossession or foreclosure) of residential real estate property collateralizing a consumer mortgage loan only upon the occurrence of either of the following:
| a) | The creditor obtains legal title to the residential real estate property upon completion of a foreclosure. A creditor may obtain legal title to the residential real estate property even if the borrower has redemption rights that provide the borrower with a legal right for a period of time after a foreclosure to reclaim the real estate property by paying certain amounts specified by law. |
| b) | The borrower conveys all interest in the residential real estate property to the creditor to satisfy the loan through completion of a deed in lieu of foreclosure or through a similar legal agreement. The deed in lieu of foreclosure or similar legal agreement is completed when agreed-upon terms and conditions have been satisfied by both the borrower and the creditor. |
Entities can elect either a prospective or modified retrospective approach to adoption. Under the modified retrospective approach, entities should recognize a cumulative-effect adjustment to residential consumer mortgage loans and foreclosed residential real estate properties existing as of the beginning of the period of adoption. The Company will use the prospective approach to adoption.
Public entities are required to adopt this update for annual periods and interim periods within those annual periods, beginning after December 15, 2014. All other entities, including emerging growth companies, are required to adopt this update for annual periods beginning after December 15, 2014, and interim periods within annual periods beginning after December 31, 2015. Early adoption is permitted. This update may result in revised disclosures in the Company’s financial statements but will not have an impact on the Company’s consolidated financial position, results of operations or cash flows.
F-19
Table of Contents
Index to Financial Statements
In April 2014, the FASB issued ASU No. 2014-08, Presentation of Financial Statements (Topic 205) and Property, Plant, and Equipment (Topic 360)—“Reporting Discontinued Operations and Disclosures of Disposals of Components of an Entity”. The amendments in this update change the definition of a discontinued operation and, thus, limit the circumstances under which a disposal may be reported as a discontinued operation. Under the amendments, a disposal of a component of an entity or a group of components of an entity is required to be reported in discontinued operations if the disposal represents a strategic shift that has, or will have, a major effect on an entity’s operations and financial results. This ASU is effective for public entities for all disposals (or classifications as held for sale) of components of an entity that occur within annual periods beginning on or after December 15, 2014, and interim periods within those years. All other entities, including emerging growth companies, are required to adopt this update effective for all occurrences within annual periods beginning on or after December 15, 2014, and interim periods within annual periods beginning on or after December 15, 2015. Early adoption is permitted, but only for disposals (or classifications as held for sale) that have not been reported in financial statements previously issued or made available for issuance. An entity cannot apply the amended guidance to a component or to a business or nonprofit activity that is classified as held for sale before the effective date, even if the component, business, or nonprofit activity is disposed of after the effective date. The adoption of this ASU is not expected to have a material impact on the Company’s consolidated financial position, results of operations or cash flows.
In May 2014, the FASB issued ASU No. 2014-09, “Revenue from Contracts with Customers (Topic 606)”, which will supersede the revenue recognition requirements in Topic 605, Revenue Recognition, and most industry-specific revenue recognition guidance throughout the Accounting Standards Codification. The amendments in this update affect any entity that either enters into contracts with customers to transfer goods or services or enters into contracts for the transfer of non-financial assets unless those contracts, including leases and insurance contracts, are within the scope of other standards. The amendments establish a core principle requiring the recognition of revenue to depict the transfer of promised goods or services to customers in an amount reflecting the consideration to which the entity expects to be entitled in exchange for such goods or services. The amendments also require expanded disclosures concerning the nature, amount, timing and uncertainty of revenues and cash flows arising from contracts with customers. For public entities, the amendments in this update are effective for annual reporting periods beginning after December 15, 2016, including interim periods within that reporting period. For all other entities, including emerging growth companies, this update is effective for annual reporting periods beginning after December 15, 2017 and interim periods within annual periods beginning after December 15, 2018. Early adoption is permitted in annual periods beginning after December 15, 2016 (the public company effective date). Retrospective or modified-retrospective application is required. The Company is currently evaluating this guidance to determine the impact on its consolidated financial position, results of operations or cash flows.
In June 2014, the FASB issued ASU No. 2014-11, “Transfers and Servicing (topic 860)—Repurchase-to- Maturity Transactions, Repurchase Financing, and Disclosures”. This update changes the accounting for repurchase-to-maturity transactions and linked repurchase financings to secured borrowing accounting, which is consistent with the accounting for other repurchase agreements. The amendments also require two new disclosures. The first disclosure requires an entity to disclose information on transfers accounted for as sales in transactions that are economically similar to repurchase agreements. The second disclosure provides increased transparency about the types of collateral pledged in repurchase agreements and similar transactions accounted for as secured borrowings. Entities must present changes in accounting for transactions outstanding on the effective date as a cumulative-effect adjustment to retained earnings as of the beginning of the period of adoption. The disclosures are not required to be presented for comparative periods before the effective date. For public entities, the accounting-related changes are effective for the first interim or annual period beginning after December 15, 2014. The disclosure for certain transactions accounted for as a sale is required to be presented for interim and annual periods beginning after December 15, 2014, and the disclosure for repurchase agreements, securities lending transactions, and repurchase-to maturity transactions accounted for as secured borrowings is required to be presented for annual periods beginning after December 15, 2014, and interim periods beginning after March 15, 2015. For all other entities, included emerging growth companies, the accounting-related changes are effective for annual periods beginning after December 15, 2014 and for interim periods beginning after December 15, 2015, with the option to adopt the requirements for interim periods beginning after December 15, 2014. All additional disclosures are required for annual periods beginning after December 15, 2014 and for interim periods beginning after December 15, 2015.Early adoption is prohibited with the exception that the requirements on accounting-related changes may be adopted for interim periods beginning after December 15, 2014. The adoption of this ASU is not expected to have a material impact on the Company’s consolidated financial position, results of operations or cash flows.
F-20
Table of Contents
Index to Financial Statements
In June 2014, the FASB issued ASU No. 2014-12, “Compensation- Stock Compensation (Topic 718) —Accounting for Share-Based Payments When the Terms of an Award Provide That a Performance Target Could be Achieved after the Requisite Service Period”. This update provides specific guidance on whether to treat a performance target that could be achieved after the requisite service period as a performance condition that affects vesting or as a non-vesting condition that affects the grant-date fair value of an award. Retrospective adoption beginning with the annual period the entity initially adopted the amendments or modified-retrospective application is required. This ASU is effective for annual periods and interim periods beginning after December 15, 2015. Early adoption is permitted as of the beginning of an annual period. The adoption of this ASU is not expected to have a material impact on the Company’s consolidated financial position, results of operations or cash flows.
In August 2014, the FASB issued ASU No. 2014-14, “Receivables – Troubled Debt Restructurings by Creditors (Subtopic 310-40)”. This update requires that government guaranteed mortgage loans be derecognized and that a separate other receivable be recognized upon foreclosure if certain conditions are met. For public entities, this ASU is effective for annual periods and interim periods within those annual periods beginning after December 15, 2014. Prospective or modified-retrospective application is required. For all other entities, including emerging growth companies, this ASU is effective for annual periods ending after December 15, 2015 and interim periods beginning after December 15, 2015. Early adoption is permitted for all entities if ASU 2014-04 has also been adopted. The Company is currently evaluating this guidance to determine the impact on its consolidated financial position, results of operations or cash flows.
In August 2014, the FASB issued ASU No. 2014-15, “Presentation of Financial Statements – Going Concern (Subtopic 205-40)”. This update requires management to evaluate whether there are conditions and events that raise substantial doubt about an entity’s ability to continue as a going concern. The guidance is intended to incorporate into GAAP a requirement that management perform a going concern evaluation similar to the auditor’s evaluation required by standards issued by the Public Company Accounting Oversight Board (“PCAOB”) and American Institute of Certified Public Accountants (“AICPA”). The guidance is effective for all entities for annual periods ending after December 15, 2016 and for annual and interim periods thereafter. Early application is permitted. The Company believes that this ASU will not have a material impact upon adoption.
In November 2014, the FASB issued ASU No. 2014-16, “Determining Whether the Host Contract in a Hybrid Financial Instrument Issued in the Form of a Share is More Akin to Debt or Equity – a consensus of the FASB Emerging Issues Task Force (ASC 815, Derivatives and Hedging)”. This update requires an entity to determine the nature of an instrument by evaluating all economic characteristics and risks of the entire hybrid instrument when determining whether the host is more akin to debit or equity. For public entities, this guidance is effective for annual periods and interim periods within those annual periods beginning after December 15, 2015. For all other entities, including emerging growth companies, this guidance is effective for annual periods beginning after December 15, 2015 and interim periods within fiscal years beginning after December 15, 2016. Early adoption is permitted. This pronouncement is not expected not have a material impact on our statement of financial position or shareholders equity.
In July 2013, the FASB issued ASU No. 2013-11, “Income Taxes (Topic 740): Presentation of an Unrecognized Tax Benefit When a Net Operating Loss Carryforward, a Similar Tax Loss, or a Tax Credit Carryforward Exists” to provide guidance on the financial statement presentation of an unrecognized tax benefit when a net operating loss carryforward, a similar tax loss, or a tax credit carryforward exists thereby reducing diversity in practice. For public companies, the amendments are effective for fiscal years, and interim periods within those years, beginning after December 15, 2013. For all other entities, including emerging growth companies, the amendments are effective for fiscal years, and interim periods within those years, beginning after December 15, 2014. Early adoption is permitted. The amendments are to be applied prospectively to all unrecognized tax benefits that exist at the effective date with retrospective application permitted. The Company does not expect the adoption of this ASU to have a material impact on its consolidated financial statements.
NOTE 2. BUSINESS ACQUISITIONS
On January 31, 2014, the Bank acquired all the outstanding common stock in GFB. GFB had total assets of $957.3 million and total liabilities of $962.2 million at fair value as of January 31, 2014. Holders of GFB common stock received $3.24 per share in cash for each common share owned resulting in total cash purchase price of $42.5 million. At the time of acquisition, GFB had 25 banking locations within Southeast Florida and the Miami metropolitan area. The Company contributed capital of $125 million to the Bank at the time of the GFB acquisition.
F-21
Table of Contents
Index to Financial Statements
The Company determined that the acquisition of Great Florida Bank constitutes a business combination as defined by the FASB ASC topic 805, “Business Combinations”. Accordingly, the assets acquired and liabilities assumed were recorded at their fair values on the date of acquisition. Fair values were determined in accordance with the guidance provided in FASB ASC Topic 820, “Fair Value Measurements”. In many cases the determination of the fair values required management to make estimates about discount rates, future expected cash flows, market conditions and other future events that are highly subjective in nature and subject to change. The Company utilized the assistance of third-party advisors in the determination of fair values for loans, other real estate owned and deferred tax assets acquired.
The following table presents a summary of the assets acquired and liabilities assumed in the Great Florida Bank acquisition recorded at fair value.
| (Dollars in thousands) | ||||
| Consideration paid: |
||||
| Cash |
$ | 42,485 | ||
| Fair value of assets acquired: |
||||
| Cash and cash equivalents |
28,412 | |||
| Investment securities |
277,639 | |||
| Loans |
548,129 | |||
| Other real estate owned |
55,085 | |||
| Core deposit intangible |
3,601 | |||
| Fixed assets |
2,576 | |||
| Deferred tax asset, net |
35,736 | |||
| Other assets |
6,146 | |||
|
|
|
|||
| Total identifiable assets acquired |
957,324 | |||
| Fair value of liabilities assumed: |
||||
| Deposits |
863,976 | |||
| FHLB advances and other borrowings |
92,669 | |||
| Other liabilities |
5,549 | |||
|
|
|
|||
| Total liabilities assumed |
962,194 | |||
|
|
|
|||
| Fair value of net assets acquired |
(4,870 | ) | ||
|
|
|
|||
| Goodwill resulting from acquisition |
$ | 47,355 | ||
|
|
|
|||
The following is a description of the methods used to determine the fair values of significant assets and liabilities presented above:
Cash and Cash Equivalents:
These assets are carried at amounts that approximate fair value due to their short-term nature and generally negligible credit risk.
Investment Securities:
Fair value measurement is based upon quoted market prices for similar securities in active or inactive markets (Level 2). FHLB and other bank stock are carried at par, which has historically represented the redemption price and is therefore considered to approximate fair value.
F-22
Table of Contents
Index to Financial Statements
Loans:
Acquired loans are recorded at their fair value at the date of acquisition. Fair value for acquired loans is based on a discounted cash flow methodology that considers factors including the type of loan and related collateral type, delinquency and credit classification status, fixed or variable interest rate, term of loan, whether or not the loan was amortizing, and current discount rates. Additional assumptions used include default rates, loss severity, loss curves and prepayment speeds. Discounts due to credit quality are included in the determination of fair value; therefore an allowance for loan losses is not recorded at the acquisition date. The discount rates used for the cash flow methodology are based on market rates for new originations of comparable loans at the time of acquisition and include adjustments for liquidity concerns. The fair value is determined from the discounted cash flows for each individual loan, and for ASC 310-30 loans are then aggregated at the unit of account, or pool level.
The following is a summary of the acquired loans accounted for under ASC 310-30 as well as those excluded from ASC 310-30, or Non-ASC 310-30 acquired loans, in connection with the acquisition of Great Florida Bank:
| (Dollars in thousands) | ||||
| Acquired loans accounted for under ASC 310-30: |
||||
| Contractual cash flows |
$ | 426,116 | ||
| Contractual cash flows not expected to be collected (non-accretable difference) |
102,581 | |||
|
|
|
|||
| Expected cash flows |
323,535 | |||
| Excess of the expected undiscounted cash flows over the carrying value (accretable discount) |
40,444 | |||
|
|
|
|||
| Fair value at acquisition |
$ | 283,091 | ||
| Acquired loans not accounted for under ASC 310-30 (Non-ASC 310-30 loans): |
||||
| Unpaid principal balance |
$ | 275,772 | ||
| Fair value discount |
(10,734 | ) | ||
|
|
|
|||
| Fair value at acquisition |
265,038 | |||
|
|
|
|||
| Total fair value at acquisition |
$ | 548,129 | ||
|
|
|
|||
The Company acquired loans with a fair value of $265.0 million that are classified as Non-ASC 310-30 loans as these specific loans did not exhibit deteriorated credit quality since origination or were loans to borrowers that had revolving privileges at acquisition date. The acquired Non-ASC 310-30 loans with revolving privileges had a total unpaid principal balance of $71.5 million and a fair value of $60.6 million at acquisition. The acquired Non-ASC 310-30 loans without revolving privileges had a total unpaid principal balance of $204.3 million and a fair value of $204.4 million at acquisition.
OREO:
The fair value of acquired OREO is based on the fair value of the property, less estimated cost to sell. Fair value of OREO is typically based on third party real estate appraisals which utilize market and income valuation techniques.
Deferred Tax Asset:
Deferred tax assets represent acquired loss and credit carryforwards and the net tax-affected differences between the book basis and tax basis of certain assets and liabilities, including investment securities, loans, OREO, fixed assets, core deposit intangible assets, time deposits, FHLB advances and other borrowings. The deferred tax assets are evaluated for certain carryover limitations at the acquisition date, such as Section 382 limitations, and whether it is more likely than not that the benefit from certain net operating loss carryforwards can be realized.
As part of the acquisition of Great Florida Bank, the Bank recorded $35.7 million in deferred tax assets, net of $9.2 million in valuation allowance, at acquisition. Upon acquisition, Great Florida Bank incurred a Section 382 ownership change. As such, the Company’s ability to benefit from the use of Great Florida Bank’s pre-ownership change net operating loss and tax credit carry forwards, as well as the potential deductibility of certain of its built-in losses, will be limited to approximately $1.5 million per year, putting at risk the utilization of associated deferred tax assets before they expire. The Company estimates that it is more likely than not that the benefit from certain net operating loss carryforwards will not be realized. In recognition of this risk, a valuation allowance of $9.2 million was established against the deferred tax assets associated with Great Florida Bank’s pre-ownership change net operating loss carryforwards.
F-23
Table of Contents
Index to Financial Statements
Deposits:
The fair value of demand deposits, savings accounts and money market deposits is the amount payable on demand at the acquisition date. The fair value of fixed-maturity certificates of deposit is estimated using discounted cash flow analysis and using the rates currently offered for deposits of similar remaining maturities.
Advances from the FHLB and Other Borrowings:
The fair value of advances from the FHLB and other borrowings are estimated by discounting the future cash flows using the current rate at which similar borrowings with similar remaining maturities could be obtained.
The Great Florida Bank acquisition resulted in goodwill of $47.4 million as the estimated fair value of liabilities assumed and consideration paid exceeded the estimated fair value of assets acquired. The goodwill is included within “Goodwill and other intangible assets” in the consolidated balance sheets. None of the goodwill resulting from the Great Florida Bank acquisition is deductible for tax purposes.
The core deposit intangible is being amortized on straight line basis over the estimated life, currently expected to be 10 years.
For the year ended December 31, 2014, the Company incurred $5.0 million of bank acquisition, legal fees, accounting advisory, data conversion, retention payments and severance expenses related to the acquisition of Great Florida Bank which is recorded in noninterest expenses in the consolidated statement of income.
The provisional amounts recorded for the Great Florida Bank acquisition may be updated if better information is obtained about the initial assumptions used to determine fair value amounts or if new information is obtained regarding the facts and circumstances that existed at the date of acquisition. The provisional amounts may be adjusted through the completion of the measurement period, which does not exceed one year from the date of acquisition.
NOTE 3. INVESTMENT SECURITIES
The amortized cost, gross unrealized gains and losses and approximate fair values of securities available for sale and held to maturity are as follows:
| Amortized | Unrealized | Fair | ||||||||||||||
| December 31, 2014 |
Cost | Gains | Losses | Value | ||||||||||||
| (Dollars in thousands) | ||||||||||||||||
| Held to maturity: |
||||||||||||||||
| Foreign bonds |
$ | — | $ | — | $ | — | $ | — | ||||||||
|
|
|
|
|
|
|
|
|
|||||||||
| Available for sale: |
||||||||||||||||
| U.S. Government agencies and sponsored enterprises obligations |
$ | 6,078 | $ | 18 | $ | — | $ | 6,096 | ||||||||
| U.S. Government agencies and sponsored enterprises mortgage-backed securities |
497,384 | 5,172 | 904 | 501,652 | ||||||||||||
| State and municipal obligations |
2,039 | 238 | — | 2,277 | ||||||||||||
| Asset-backed securities |
482,969 | 1,424 | 6,192 | 478,201 | ||||||||||||
| Corporate bonds and other debt securities |
256,155 | 3,024 | 496 | 258,683 | ||||||||||||
| Preferred stock and other equity securities |
113,367 | 261 | 1,439 | 112,189 | ||||||||||||
|
|
|
|
|
|
|
|
|
|||||||||
| Total available for sale |
$ | 1,357,992 | $ | 10,137 | $ | 9,031 | $ | 1,359,098 | ||||||||
|
|
|
|
|
|
|
|
|
|||||||||
F-24
Table of Contents
Index to Financial Statements
| Amortized | Unrealized | Fair | ||||||||||||||
| December 31, 2013 |
Cost | Gains | Losses | Value | ||||||||||||
| (Dollars in thousands) | ||||||||||||||||
| Held to maturity: |
||||||||||||||||
| Foreign bonds |
$ | 365 | $ | — | $ | 1 | $ | 364 | ||||||||
|
|
|
|
|
|
|
|
|
|||||||||
| Available for sale: |
||||||||||||||||
| U.S. Government agencies and sponsored enterprises obligations |
$ | 51,553 | $ | 58 | $ | 456 | $ | 51,155 | ||||||||
| U.S. Government agencies and sponsored enterprises mortgage-backed securities |
243,062 | 1,071 | 2,495 | 241,638 | ||||||||||||
| State and municipal obligations |
2,039 | 85 | — | 2,124 | ||||||||||||
| Asset-backed securities |
385,979 | 3,267 | 1,281 | 387,965 | ||||||||||||
| Corporate bonds and other debt securities |
375,373 | 4,453 | 601 | 379,225 | ||||||||||||
| Preferred stock and other equity securities |
90,330 | 205 | 6,871 | 83,664 | ||||||||||||
|
|
|
|
|
|
|
|
|
|||||||||
| Total available for sale |
$ | 1,148,336 | $ | 9,139 | $ | 11,704 | $ | 1,145,771 | ||||||||
|
|
|
|
|
|
|
|
|
|||||||||
As part of the Company’s liquidity management strategy, the Company pledges loans and securities to secure borrowings from the FHLB. The Company also pledges securities to collateralize public deposits. The carrying value of all pledged securities totaled $685.3 million and $437.4 million at December 31, 2014 and 2013, respectively
The amortized cost and estimated fair value of securities available for sale and held to maturity, by contractual maturity, are as follows:
| December 31, | ||||||||||||||||
| 2014 | 2013 | |||||||||||||||
| Amortized | Fair | Amortized | Fair | |||||||||||||
| Cost | Value | Cost | Value | |||||||||||||
| (Dollars in thousands) | ||||||||||||||||
| Held to maturity: |
||||||||||||||||
| Due in one year or less |
$ | — | $ | — | $ | 365 | $ | 364 | ||||||||
|
|
|
|
|
|
|
|
|
|||||||||
| Total held to maturity |
$ | — | $ | — | $ | 365 | $ | 364 | ||||||||
|
|
|
|
|
|
|
|
|
|||||||||
| Available for sale: |
||||||||||||||||
| Due in one year or less |
$ | 293 | $ | 296 | $ | 10,085 | $ | 10,212 | ||||||||
| Due after one year through five years |
84,373 | 84,449 | 305,317 | 309,064 | ||||||||||||
| Due after five years through ten years |
40,951 | 41,202 | 10,735 | 10,665 | ||||||||||||
| Due after ten years |
138,655 | 141,109 | 51,913 | 52,044 | ||||||||||||
| U.S. Government agencies and sponsored enterprises mortgage-backed securities and asset-backed securities |
980,353 | 979,853 | 679,956 | 680,122 | ||||||||||||
| Preferred stock and other equity securities |
113,367 | 112,189 | 90,330 | 83,664 | ||||||||||||
|
|
|
|
|
|
|
|
|
|||||||||
| Total available for sale |
$ | 1,357,992 | $ | 1,359,098 | $ | 1,148,336 | $ | 1,145,771 | ||||||||
|
|
|
|
|
|
|
|
|
|||||||||
For purposes of the maturity table, mortgage-backed securities and asset-backed securities, the principal of which are repaid periodically, are presented as a single amount. The expected lives of these securities will differ from contractual maturities because borrowers may have the right to prepay the underlying loans with or without prepayment penalties.
F-25
Table of Contents
Index to Financial Statements
The following tables present the estimated fair values and gross unrealized losses on investment securities available for sale, aggregated by investment category and length of time individual securities have been in a continuous unrealized loss position as of the periods presented:
| Less than 12 Months | 12 Months or More | Total | ||||||||||||||||||||||
| December 31, 2014 |
Fair Value |
Unrealized Loss |
Fair Value |
Unrealized Loss |
Fair Value |
Unrealized Loss |
||||||||||||||||||
| (Dollars in thousands) | ||||||||||||||||||||||||
| Available for sale: |
||||||||||||||||||||||||
| U.S. Government agencies and sponsored enterprises obligations |
$ | — | $ | — | $ | — | $ | — | $ | — | $ | — | ||||||||||||
| U.S. Government agencies and sponsored enterprises mortgage-backed securities |
71,539 | 330 | 43,090 | 574 | 114,629 | 904 | ||||||||||||||||||
| State and municipal obligations |
— | — | — | — | — | — | ||||||||||||||||||
| Asset-backed securities |
337,123 | 5,143 | 31,898 | 1,049 | 369,021 | 6,192 | ||||||||||||||||||
| Corporate bonds and other debt securities |
78,487 | 496 | — | — | 78,487 | 496 | ||||||||||||||||||
| Preferred stock and other equity securities |
53,064 | 737 | 10,606 | 702 | 63,670 | 1,439 | ||||||||||||||||||
|
|
|
|
|
|
|
|
|
|
|
|
|
|||||||||||||
| Total available for sale |
$ | 540,213 | $ | 6,706 | $ | 85,594 | $ | 2,325 | $ | 625,807 | $ | 9,031 | ||||||||||||
|
|
|
|
|
|
|
|
|
|
|
|
|
|||||||||||||
| Less than 12 Months | 12 Months or More | Total | ||||||||||||||||||||||
| December 31, 2013 |
Fair Value |
Unrealized Loss |
Fair Value |
Unrealized Loss |
Fair Value |
Unrealized Loss |
||||||||||||||||||
| (Dollars in thousands) | ||||||||||||||||||||||||
| Available for sale: |
||||||||||||||||||||||||
| U.S. Government agencies and sponsored enterprises obligations |
$ | 41,276 | $ | 456 | $ | — | $ | — | $ | 41,276 | $ | 456 | ||||||||||||
| U.S. Government agencies and sponsored enterprises mortgage-backed securities |
141,304 | 2,494 | 636 | 1 | 141,940 | 2,495 | ||||||||||||||||||
| State and municipal obligations |
— | — | — | — | — | — | ||||||||||||||||||
| Asset-backed securities |
161,879 | 1,233 | 11,949 | 48 | 173,828 | 1,281 | ||||||||||||||||||
| Corporate bonds and other debt securities |
58,596 | 601 | — | — | 58,596 | 601 | ||||||||||||||||||
| Preferred stock and other equity securities |
65,061 | 6,871 | — | — | 65,061 | 6,871 | ||||||||||||||||||
|
|
|
|
|
|
|
|
|
|
|
|
|
|||||||||||||
| Total available for sale |
$ | 468,116 | $ | 11,655 | $ | 12,585 | $ | 49 | $ | 480,701 | $ | 11,704 | ||||||||||||
|
|
|
|
|
|
|
|
|
|
|
|
|
|||||||||||||
At December 31, 2014, the Company’s security portfolio consisted of 276 securities, of which 114 securities were in an unrealized loss position. A total of 94 were in an unrealized loss position for less than 12 months. The unrealized losses for these securities resulted primarily from changes in interest rates. All securities available for sale at December 31, 2014 and 2013 were investment grade based on ratings from recognized rating agencies.
The Company monitors its investment securities for OTTI. Impairment is evaluated on an individual security basis considering numerous factors, and its relative significance varies depending on the situation. The Company has evaluated the nature of unrealized losses in the investment securities portfolio to determine if OTTI exists. The unrealized losses relate to changes in market interest rates and specific market conditions that do not represent credit-related impairments. Furthermore, the Company does not intend to sell nor is it more likely than not that it will be required to sell these investments before the recovery of their amortized cost basis. Management has completed an assessment of each security in an unrealized loss position for credit impairment, including securities with existing characteristics that are covered under the Volcker Rule, and has determined that no individual security was other-than-temporarily impaired at December 31, 2014 or 2013. The following describes the basis under which the Company has evaluated OTTI:
U.S. Government Agencies and Sponsored Enterprises Obligations and Mortgage-Backed Securities (“MBS”):
The unrealized losses associated with U.S. Government agencies and sponsored enterprises obligations and MBS are primarily driven by changes in interest rates. These securities have either an explicit or implicit U.S. government guarantee.
F-26
Table of Contents
Index to Financial Statements
Corporate Bonds and Asset Backed Securities:
Securities were generally underwritten in accordance with the Company’s own investment standards prior to the decision to purchase, without relying on a bond issuer’s guarantee in making the investment decision. These investments are investment grade and will continue to be monitored as part of the Company’s ongoing impairment analysis, but are expected to perform in accordance with their terms.
Preferred Stock and Other Equity Investments:
The unrealized losses associated with preferred stock and other equity investments in large U.S. financial institutions are primarily driven by changes in interest rates. These securities were generally underwritten in accordance with the Company’s own investment standards prior to the decision to purchase. These investments are investment grade and will continue to be monitored as part of the Company’s ongoing impairment analysis, but are expected to perform in accordance with their terms.
Gross realized gains and losses on the sale of securities available for sale are shown below. The cost of securities sold is based on the specific identification method.
| December 31, | ||||||||||||
| 2014 | 2013 | 2012 | ||||||||||
| (Dollars in thousands) | ||||||||||||
| Proceeds from sales |
$ | 1,321,896 | $ | 937,919 | $ | 788,917 | ||||||
| Gross realized gains |
$ | 14,328 | $ | 8,623 | $ | 2,493 | ||||||
| Gross realized losses |
(2,281 | ) | (980 | ) | (354 | ) | ||||||
|
|
|
|
|
|
|
|||||||
| Net realized gains (losses) |
$ | 12,047 | $ | 7,643 | $ | 2,139 | ||||||
|
|
|
|
|
|
|
|||||||
NOTE 4. LOANS, NET
The Company’s loan portfolio consists of new and acquired loans. The Company classifies originated loans and purchased loans not acquired through business combinations as new loans. The Company classifies loans acquired through business combinations as acquired loans. The acquired loan portfolio is segmented into “Covered Loans”, loans subject to loss sharing with the FDIC, and “Non-Covered Loans”, acquired loans without loss share reimbursement. Additionally, the new loan portfolio is classified as “Non-Covered Loans”. A portion of the acquired loan portfolio, both Covered and Non-Covered Loans, exhibited evidence of deterioration in credit quality since origination, and are accounted for under ASC 310-30. The remaining portfolio of acquired loans consists of loans that were not considered ASC 310-30 loans at acquisition and are classified as Non-ASC 310-30 loans. Approximately 7.0% and 15.9% of total portfolio loans are covered by loss sharing agreements with the FDIC as of December 31, 2014 and 2013, respectively.
F-27
Table of Contents
Index to Financial Statements
The following tables summarize the Company’s loans by portfolio segment as of the periods presented, net of deferred fees:
| Covered Loans | Non-Covered Loans | |||||||||||||||||||||||
| December 31, 2014 |
ASC 310-30 Loans |
Non-ASC 310-30 Loans |
ASC 310-30 Loans |
Non-ASC 310-30 Loans |
New Loans (1) |
Total | ||||||||||||||||||
| (Dollars in thousands) | ||||||||||||||||||||||||
| Real estate loans: |
||||||||||||||||||||||||
| Commercial real estate |
$ | 155,050 | $ | 6,202 | $ | 181,885 | $ | 63,944 | $ | 853,074 | $ | 1,260,155 | ||||||||||||
| Owner-occupied commercial real estate |
— | 2,411 | — | 12,431 | 281,703 | 296,545 | ||||||||||||||||||
| 1-4 single family residential |
34,297 | 7,286 | 52,011 | 94,993 | 922,657 | 1,111,244 | ||||||||||||||||||
| Construction, land and development |
19,903 | — | 46,797 | 9,729 | 232,601 | 309,030 | ||||||||||||||||||
| Home equity loans and lines of credit |
— | 10,785 | — | 43,919 | 11,826 | 66,530 | ||||||||||||||||||
|
|
|
|
|
|
|
|
|
|
|
|
|
|||||||||||||
| Total real estate loans |
$ | 209,250 | $ | 26,684 | $ | 280,693 | $ | 225,016 | $ | 2,301,861 | $ | 3,043,504 | ||||||||||||
|
|
|
|
|
|
|
|
|
|
|
|
|
|||||||||||||
| Other loans: |
||||||||||||||||||||||||
| Commercial and industrial |
$ | 32,531 | $ | 4,308 | $ | 34,967 | $ | 9,240 | $ | 795,000 | $ | 876,046 | ||||||||||||
| Consumer |
557 | 36 | 2,246 | 645 | 6,556 | 10,040 | ||||||||||||||||||
|
|
|
|
|
|
|
|
|
|
|
|
|
|||||||||||||
| Total other loans |
33,088 | 4,344 | 37,213 | 9,885 | 801,556 | 886,086 | ||||||||||||||||||
|
|
|
|
|
|
|
|
|
|
|
|
|
|||||||||||||
| Total loans held in portfolio |
$ | 242,338 | $ | 31,028 | $ | 317,906 | $ | 234,901 | $ | 3,103,417 | $ | 3,929,590 | ||||||||||||
|
|
|
|
|
|
|
|
|
|
|
|
|
|||||||||||||
| Allowance for loan losses |
(22,880 | ) | ||||||||||||||||||||||
|
|
|
|||||||||||||||||||||||
| Loans held in portfolio, net |
$ | 3,906,710 | ||||||||||||||||||||||
|
|
|
|||||||||||||||||||||||
| Covered Loans | Non-Covered Loans | |||||||||||||||||||||||
| December 31, 2013 |
ASC 310-30 Loans |
Non-ASC 310-30 Loans |
ASC 310-30 Loans |
Non-ASC 310-30 Loans |
New Loans (1) |
Total | ||||||||||||||||||
| (Dollars in thousands) | ||||||||||||||||||||||||
| Real estate loans: |
||||||||||||||||||||||||
| Commercial real estate |
$ | 195,672 | $ | 8,418 | $ | 78,475 | $ | 680 | $ | 514,612 | $ | 797,857 | ||||||||||||
| Owner-occupied commercial real estate |
— | 1,164 | — | 1,850 | 154,983 | 157,997 | ||||||||||||||||||
| 1-4 single family residential |
46,461 | 8,029 | 10,284 | 2,145 | 359,818 | 426,737 | ||||||||||||||||||
| Construction, land and development |
36,727 | — | 19,209 | — | 75,666 | 131,602 | ||||||||||||||||||
| Home equity loans and lines of credit |
— | 10,773 | — | 1,225 | 19,303 | 31,301 | ||||||||||||||||||
|
|
|
|
|
|
|
|
|
|
|
|
|
|||||||||||||
| Total real estate loans |
$ | 278,860 | $ | 28,384 | $ | 107,968 | $ | 5,900 | $ | 1,124,382 | $ | 1,545,494 | ||||||||||||
|
|
|
|
|
|
|
|
|
|
|
|
|
|||||||||||||
| Other loans: |
||||||||||||||||||||||||
| Commercial and industrial |
$ | 46,184 | $ | 4,879 | $ | 10,863 | $ | 754 | $ | 645,153 | $ | 707,833 | ||||||||||||
| Consumer |
902 | 46 | 3,090 | 243 | 1,176 | 5,457 | ||||||||||||||||||
|
|
|
|
|
|
|
|
|
|
|
|
|
|||||||||||||
| Total other loans |
47,086 | 4,925 | 13,953 | 997 | 646,329 | 713,290 | ||||||||||||||||||
|
|
|
|
|
|
|
|
|
|
|
|
|
|||||||||||||
| Total loans held in portfolio |
$ | 325,946 | $ | 33,309 | $ | 121,921 | $ | 6,897 | $ | 1,770,711 | $ | 2,258,784 | ||||||||||||
|
|
|
|
|
|
|
|
|
|
|
|
|
|||||||||||||
| Allowance for loan losses |
(14,733 | ) | ||||||||||||||||||||||
|
|
|
|||||||||||||||||||||||
| Loans held in portfolio, net |
$ | 2,244,051 | ||||||||||||||||||||||
|
|
|
|||||||||||||||||||||||
| (1) | Balance includes $3.6 million and $6.4 million of deferred fees as of December 31, 2014 and 2013, respectively. |
At December 31, 2014 and 2013, the UPB of ASC 310-30 loans were $725.9 million and $628.5 million, respectively. At December 31, 2014 and 2013, the Company had pledged loans as collateral for FHLB advances with a carrying amount of $1.63 billion and $741.9 million, respectively. The recorded investments of consumer mortgage loans secured by residential real estate properties for which formal foreclosure proceedings are in process as of December 31, 2014 totaled $13.4 million. The Company held $445.6 million and $481.0 million of syndicated national loans as of December 31, 2014 and 2013, respectively.
During the years ended December 31, 2014 and 2013, the Company purchased approximately $377.1 million and $187.4 million in loans from third parties. No loans were purchased during the year ended December 31, 2012.
During the years ended December 31, 2014, 2013 and 2012, the Company sold approximately $39.3 million, $47.3 million and $5.1 million, respectively in loans to a third party.
F-28
Table of Contents
Index to Financial Statements
The accretable discount on ASC 310-30 loans represents the amount by which the undiscounted expected cash flows on such loans exceed their carrying value. The increase in expected cash flow for certain ASC 310-30 loan pools resulted in the reclassification of $28.5 million, $34.8 million and $24.8 million in non-accretable difference to accretable discount during the years ended December 31, 2014, 2013 and 2012, respectively.
Changes in accretable discount for ASC 310-30 loans for the years ended December 31, 2014, 2013, and 2012 were as follows:
| December 31, | ||||||||||||
| 2014 | 2013 | 2012 | ||||||||||
| (Dollars in thousands) | ||||||||||||
| Balance at January 1, |
$ | 148,501 | $ | 175,873 | $ | 235,321 | ||||||
| Additions to accretable discount from GFB acquisition |
40,444 | — | — | |||||||||
| Accretion |
(61,281 | ) | (62,162 | ) | (84,222 | ) | ||||||
| Reclassifications from non-accretable difference |
28,533 | 34,790 | 24,774 | |||||||||
|
|
|
|
|
|
|
|||||||
| Balance at December 31, |
$ | 156,197 | $ | 148,501 | $ | 175,873 | ||||||
|
|
|
|
|
|
|
|||||||
NOTE 5. ALLOWANCE FOR LOAN LOSSES
The ALL reflects management’s estimate of probable credit losses inherent in the loan portfolio. The computation of the ALL includes elements of judgment and high levels of subjectivity. Substantially all of the Company’s loans that were acquired in failed bank acquisitions were acquired at a substantial discount to their original book value and are covered by loss sharing agreements with the FDIC.
The Company’s accounting method for loans and the corresponding ALL differs depending on whether the loans are new or acquired. The Company therefore assesses and monitors credit risk and portfolio performance using distinct methodologies for acquired loans, both ASC 310-30 Loans and Non-ASC 310-30 Loans, and New loans. Within each class the Company further disaggregates the portfolios into the following segments: Commercial real estate, Owner-occupied commercial real estate, 1-4 single family residential, Construction, land and development, Home equity loans and lines of credit, Commercial and industrial and Consumer.
Changes in the ALL by loan class and portfolio segment for the years ended December 31, 2014, 2013 and 2012 are as follows:
| Commercial Real Estate |
Owner- Occupied Commercial Real Estate |
1-4 Single Family Residential |
Construction, Land and Development |
Home Equity Loans and Lines of Credit |
Commercial and Industrial |
Consumer | Total | |||||||||||||||||||||||||
| (Dollars in thousands) | ||||||||||||||||||||||||||||||||
| Balance at January 1, 2014 |
$ | 4,458 | $ | 376 | $ | 1,443 | $ | 1,819 | $ | 265 | $ | 6,198 | $ | 174 | $ | 14,733 | ||||||||||||||||
|
|
|
|
|
|
|
|
|
|
|
|
|
|
|
|
|
|||||||||||||||||
| Provision (credit) for ASC 310-30 loans |
735 | — | 271 | 107 | — | (716 | ) | 245 | 642 | |||||||||||||||||||||||
| Provision (credit) for non-ASC 310-30 loans |
490 | 53 | 362 | 75 | 442 | 67 | 35 | 1,524 | ||||||||||||||||||||||||
| Provision (credit) for New loans |
2,678 | 591 | 2,695 | 895 | (56 | ) | 1,229 | 45 | 8,077 | |||||||||||||||||||||||
|
|
|
|
|
|
|
|
|
|
|
|
|
|
|
|
|
|||||||||||||||||
| Total provision |
3,903 | 644 | 3,328 | 1,077 | 386 | 580 | 325 | 10,243 | ||||||||||||||||||||||||
|
|
|
|
|
|
|
|
|
|
|
|
|
|
|
|
|
|||||||||||||||||
| Charge-offs for ASC 310-30 loans |
(270 | ) | — | (31 | ) | (1,244 | ) | — | (678 | ) | (113 | ) | (2,336 | ) | ||||||||||||||||||
| Charge-offs for non-ASC 310-30 loans |
— | — | — | — | (296 | ) | (24 | ) | (29 | ) | (349 | ) | ||||||||||||||||||||
| Charge-offs for New loans |
— | — | — | (6 | ) | — | (348 | ) | — | (354 | ) | |||||||||||||||||||||
|
|
|
|
|
|
|
|
|
|
|
|
|
|
|
|
|
|||||||||||||||||
| Total charge-offs |
(270 | ) | — | (31 | ) | (1,250 | ) | (296 | ) | (1,050 | ) | (142 | ) | (3,039 | ) | |||||||||||||||||
|
|
|
|
|
|
|
|
|
|
|
|
|
|
|
|
|
|||||||||||||||||
| Recoveries for ASC 310-30 loans |
115 | — | — | 810 | — | 13 | 1 | 939 | ||||||||||||||||||||||||
| Recoveries for non-ASC 310-30 loans |
— | — | — | — | — | — | — | — | ||||||||||||||||||||||||
| Recoveries for New loans |
— | — | — | — | — | 4 | — | 4 | ||||||||||||||||||||||||
|
|
|
|
|
|
|
|
|
|
|
|
|
|
|
|
|
|||||||||||||||||
| Total recoveries |
115 | — | — | 810 | — | 17 | 1 | 943 | ||||||||||||||||||||||||
|
|
|
|
|
|
|
|
|
|
|
|
|
|
|
|
|
|||||||||||||||||
| Ending ALL balance |
||||||||||||||||||||||||||||||||
| ASC 310-30 loans |
3,255 | — | 325 | 658 | — | 958 | 290 | 5,486 | ||||||||||||||||||||||||
| Non-ASC 310-30 loans |
495 | 58 | 414 | 75 | 285 | 49 | 6 | 1,382 | ||||||||||||||||||||||||
| New loans |
4,456 | 962 | 4,001 | 1,723 | 70 | 4,738 | 62 | 16,012 | ||||||||||||||||||||||||
|
|
|
|
|
|
|
|
|
|
|
|
|
|
|
|
|
|||||||||||||||||
| Balance at December 31, 2014 |
$ | 8,206 | $ | 1,020 | $ | 4,740 | $ | 2,456 | $ | 355 | $ | 5,745 | $ | 358 | $ | 22,880 | ||||||||||||||||
|
|
|
|
|
|
|
|
|
|
|
|
|
|
|
|
|
|||||||||||||||||
F-29
Table of Contents
Index to Financial Statements
| Commercial Real Estate |
Owner- Occupied Commercial Real Estate |
1-4 Single Family Residential |
Construction, Land and Development |
Home Equity Loans and Lines of Credit |
Commercial and Industrial |
Consumer | Total | |||||||||||||||||||||||||
| (Dollars in thousands) | ||||||||||||||||||||||||||||||||
| Balance at January 1, 2013 |
$ | 3,734 | $ | 373 | $ | 3,049 | $ | 5,239 | $ | 67 | $ | 6,054 | $ | 433 | $ | 18,949 | ||||||||||||||||
|
|
|
|
|
|
|
|
|
|
|
|
|
|
|
|
|
|||||||||||||||||
| Provision (credit) for ASC 310-30 loans |
1,263 | — | (1,558 | ) | 601 | — | (1,493 | ) | 510 | (677 | ) | |||||||||||||||||||||
| Provision (credit) for non-ASC 310-30 loans |
(3 | ) | (7 | ) | 30 | (3 | ) | 415 | (130 | ) | (4 | ) | 298 | |||||||||||||||||||
| Provision (credit) for New loans |
541 | 10 | 684 | (141 | ) | 122 | 2,120 | (43 | ) | 3,293 | ||||||||||||||||||||||
|
|
|
|
|
|
|
|
|
|
|
|
|
|
|
|
|
|||||||||||||||||
| Total provision |
1,801 | 3 | (844 | ) | 457 | 537 | 497 | 463 | 2,914 | |||||||||||||||||||||||
|
|
|
|
|
|
|
|
|
|
|
|
|
|
|
|
|
|||||||||||||||||
| Charge-offs for ASC 310-30 loans |
(1,387 | ) | — | (830 | ) | (4,052 | ) | — | (201 | ) | (723 | ) | (7,193 | ) | ||||||||||||||||||
| Charge-offs for non-ASC 310-30 loans |
— | — | — | — | (339 | ) | (163 | ) | — | (502 | ) | |||||||||||||||||||||
| Charge-offs for New loans |
— | — | — | (193 | ) | — | — | — | (193 | ) | ||||||||||||||||||||||
|
|
|
|
|
|
|
|
|
|
|
|
|
|
|
|
|
|||||||||||||||||
| Total charge-offs |
(1,387 | ) | — | (830 | ) | (4,245 | ) | (339 | ) | (364 | ) | (723 | ) | (7,888 | ) | |||||||||||||||||
|
|
|
|
|
|
|
|
|
|
|
|
|
|
|
|
|
|||||||||||||||||
| Recoveries for ASC 310-30 loans |
310 | — | 68 | 368 | — | 11 | 1 | 758 | ||||||||||||||||||||||||
| Recoveries for non-ASC 310-30 loans |
— | — | — | — | — | — | — | — | ||||||||||||||||||||||||
| Recoveries for New loans |
— | — | — | — | — | — | — | — | ||||||||||||||||||||||||
|
|
|
|
|
|
|
|
|
|
|
|
|
|
|
|
|
|||||||||||||||||
| Total recoveries |
310 | — | 68 | 368 | — | 11 | 1 | 758 | ||||||||||||||||||||||||
|
|
|
|
|
|
|
|
|
|
|
|
|
|
|
|
|
|||||||||||||||||
| Ending ALL balance |
||||||||||||||||||||||||||||||||
| ASC 310-30 loans |
2,675 | — | 85 | 985 | — | 2,339 | 157 | 6,241 | ||||||||||||||||||||||||
| Non-ASC 310-30 loans |
5 | 5 | 52 | — | 139 | 6 | — | 207 | ||||||||||||||||||||||||
| New loans |
1,778 | 371 | 1,306 | 834 | 126 | 3,853 | 17 | 8,285 | ||||||||||||||||||||||||
|
|
|
|
|
|
|
|
|
|
|
|
|
|
|
|
|
|||||||||||||||||
| Balance at December 31, 2013 |
$ | 4,458 | $ | 376 | $ | 1,443 | $ | 1,819 | $ | 265 | $ | 6,198 | $ | 174 | $ | 14,733 | ||||||||||||||||
|
|
|
|
|
|
|
|
|
|
|
|
|
|
|
|
|
|||||||||||||||||
| Commercial Real Estate |
Owner- Occupied Commercial Real Estate |
1-4 Single Family Residential |
Construction, Land and Development |
Home Equity Loans and Lines of Credit |
Commercial and Industrial |
Consumer | Total | |||||||||||||||||||||||||
| (Dollars in thousands) | ||||||||||||||||||||||||||||||||
| Balance at January 1, 2012 |
$ | 1,271 | $ | 446 | $ | 5,464 | $ | 1,844 | $ | 84 | $ | 8,628 | $ | 105 | $ | 17,842 | ||||||||||||||||
|
|
|
|
|
|
|
|
|
|
|
|
|
|
|
|
|
|||||||||||||||||
| Provision (credit) for ASC 310-30 loans |
10,255 | — | (1,667 | ) | 11,065 | — | 3,473 | 594 | 23,720 | |||||||||||||||||||||||
| Provision (credit) for non-ASC 310-30 loans |
96 | (39 | ) | 18 | (35 | ) | 9 | 718 | 49 | 816 | ||||||||||||||||||||||
| Provision (credit) for New loans |
673 | (34 | ) | 466 | 609 | 4 | (200 | ) | 47 | 1,565 | ||||||||||||||||||||||
|
|
|
|
|
|
|
|
|
|
|
|
|
|
|
|
|
|||||||||||||||||
| Total provision |
11,024 | (73 | ) | (1,183 | ) | 11,639 | 13 | 3,991 | 690 | 26,101 | ||||||||||||||||||||||
|
|
|
|
|
|
|
|
|
|
|
|
|
|
|
|
|
|||||||||||||||||
| Charge-offs for ASC 310-30 loans |
(8,742 | ) | (1,232 | ) | (8,273 | ) | — | (4,574 | ) | (310 | ) | (23,131 | ) | |||||||||||||||||||
| Charge-offs for non-ASC 310-30 loans |
(104 | ) | — | — | (23 | ) | (30 | ) | (1,991 | ) | (52 | ) | (2,200 | ) | ||||||||||||||||||
| Charge-offs for New loans |
— | — | — | (91 | ) | — | — | — | (91 | ) | ||||||||||||||||||||||
|
|
|
|
|
|
|
|
|
|
|
|
|
|
|
|
|
|||||||||||||||||
| Total charge-offs |
(8,846 | ) | — | (1,232 | ) | (8,387 | ) | (30 | ) | (6,565 | ) | (362 | ) | (25,422 | ) | |||||||||||||||||
|
|
|
|
|
|
|
|
|
|
|
|
|
|
|
|
|
|||||||||||||||||
| Recoveries for ASC 310-30 loans |
285 | — | — | 143 | — | — | — | 428 | ||||||||||||||||||||||||
| Recoveries for non-ASC 310-30 loans |
— | — | — | — | — | — | — | — | ||||||||||||||||||||||||
| Recoveries for New loans |
— | — | — | — | — | — | — | — | ||||||||||||||||||||||||
|
|
|
|
|
|
|
|
|
|
|
|
|
|
|
|
|
|||||||||||||||||
| Total recoveries |
285 | — | — | 143 | — | — | — | 428 | ||||||||||||||||||||||||
|
|
|
|
|
|
|
|
|
|
|
|
|
|
|
|
|
|||||||||||||||||
| Ending ALL balance |
||||||||||||||||||||||||||||||||
| ASC 310-30 loans |
2,489 | — | 2,405 | 4,068 | — | 4,022 | 369 | 13,353 | ||||||||||||||||||||||||
| Non-ASC 310-30 loans |
8 | 12 | 22 | 3 | 63 | 299 | 4 | 411 | ||||||||||||||||||||||||
| New loans |
1,237 | 361 | 622 | 1,168 | 4 | 1,733 | 60 | 5,185 | ||||||||||||||||||||||||
|
|
|
|
|
|
|
|
|
|
|
|
|
|
|
|
|
|||||||||||||||||
| Balance at December 31, 2012 |
$ | 3,734 | $ | 373 | $ | 3,049 | $ | 5,239 | $ | 67 | $ | 6,054 | $ | 433 | $ | 18,949 | ||||||||||||||||
|
|
|
|
|
|
|
|
|
|
|
|
|
|
|
|
|
|||||||||||||||||
Credit Quality Indicators
In evaluating credit risk, the Company looks at multiple factors including delinquencies. Management considers delinquency status to be the most meaningful indicator of the credit quality of 1-4 single family residential, home equity loans and lines of credit and consumer loans. Delinquency statistics are updated at least monthly.
F-30
Table of Contents
Index to Financial Statements
The following tables present an aging analysis of the recorded investment for delinquent loans by class and portfolio segment (excluding loans accounted for under ASC 310-30):
| Accruing | Total | |||||||||||||||||||
| December 31, 2014 |
30 to 59 Days Past Due |
60 to 89 Days Past Due |
90 Days or More Past Due |
Non-Accrual | ||||||||||||||||
| (Dollars in thousands) | ||||||||||||||||||||
| New Loans: |
||||||||||||||||||||
| Real estate loans: |
||||||||||||||||||||
| Commercial real estate |
$ | — | $ | — | $ | — | $ | — | $ | — | ||||||||||
| Owner-occupied commercial real estate |
— | — | — | — | — | |||||||||||||||
| 1-4 single family residential |
6,206 | 727 | — | 116 | 7,049 | |||||||||||||||
| Construction, land and development |
— | — | — | — | — | |||||||||||||||
| Home equity loans and lines of credit |
— | — | — | — | — | |||||||||||||||
|
|
|
|
|
|
|
|
|
|
|
|||||||||||
| Total real estate loans |
6,206 | 727 | — | 116 | 7,049 | |||||||||||||||
|
|
|
|
|
|
|
|
|
|
|
|||||||||||
| Other loans: |
||||||||||||||||||||
| Commercial and industrial |
— | — | — | — | — | |||||||||||||||
| Consumer |
— | — | — | — | — | |||||||||||||||
|
|
|
|
|
|
|
|
|
|
|
|||||||||||
| Total other loans |
— | — | — | — | — | |||||||||||||||
|
|
|
|
|
|
|
|
|
|
|
|||||||||||
| Total new loans |
$ | 6,206 | $ | 727 | $ | — | $ | 116 | $ | 7,049 | ||||||||||
|
|
|
|
|
|
|
|
|
|
|
|||||||||||
| Acquired Loans: |
||||||||||||||||||||
| Real estate loans: |
||||||||||||||||||||
| Commercial real estate |
$ | — | $ | — | $ | — | $ | 4,866 | $ | 4,866 | ||||||||||
| Owner-occupied commercial real estate |
— | — | — | 211 | 211 | |||||||||||||||
| 1-4 single family residential |
1,877 | 86 | — | 1,766 | 3,729 | |||||||||||||||
| Construction, land and development |
— | — | — | — | — | |||||||||||||||
| Home equity loans and lines of credit |
384 | 456 | — | 3,005 | 3,845 | |||||||||||||||
|
|
|
|
|
|
|
|
|
|
|
|||||||||||
| Total real estate loans |
2,261 | 542 | — | 9,848 | 12,651 | |||||||||||||||
|
|
|
|
|
|
|
|
|
|
|
|||||||||||
| Other loans: |
||||||||||||||||||||
| Commercial and industrial |
— | 192 | — | 1,222 | 1,414 | |||||||||||||||
| Consumer |
14 | — | — | — | 14 | |||||||||||||||
|
|
|
|
|
|
|
|
|
|
|
|||||||||||
| Total other loans |
14 | 192 | — | 1,222 | 1,428 | |||||||||||||||
|
|
|
|
|
|
|
|
|
|
|
|||||||||||
| Total acquired loans |
$ | 2,275 | $ | 734 | $ | — | $ | 11,070 | $ | 14,079 | ||||||||||
|
|
|
|
|
|
|
|
|
|
|
|||||||||||
F-31
Table of Contents
Index to Financial Statements
| Accruing | Total | |||||||||||||||||||
| December 31, 2013 |
30 to 59 Days Past Due |
60 to 89 Days Past Due |
90 Days or More Past Due |
Non-Accrual | ||||||||||||||||
| (Dollars in thousands) | ||||||||||||||||||||
| New Loans: |
||||||||||||||||||||
| Real estate loans: |
||||||||||||||||||||
| Commercial real estate |
$ | — | $ | — | $ | — | $ | — | $ | — | ||||||||||
| Owner-occupied commercial real estate |
— | — | — | — | — | |||||||||||||||
| 1-4 single family residential |
4,688 | 2,164 | — | 1,052 | 7,904 | |||||||||||||||
| Construction, land and development |
— | — | — | — | — | |||||||||||||||
| Home equity loans and lines of credit |
198 | — | — | — | 198 | |||||||||||||||
|
|
|
|
|
|
|
|
|
|
|
|||||||||||
| Total real estate loans |
4,886 | 2,164 | — | 1,052 | 8,102 | |||||||||||||||
|
|
|
|
|
|
|
|
|
|
|
|||||||||||
| Other loans: |
||||||||||||||||||||
| Commercial and industrial |
— | — | — | 24 | 24 | |||||||||||||||
| Consumer |
— | — | — | — | — | |||||||||||||||
|
|
|
|
|
|
|
|
|
|
|
|||||||||||
| Total other loans |
— | — | — | 24 | 24 | |||||||||||||||
|
|
|
|
|
|
|
|
|
|
|
|||||||||||
| Total new loans |
$ | 4,886 | $ | 2,164 | $ | — | $ | 1,076 | $ | 8,126 | ||||||||||
|
|
|
|
|
|
|
|
|
|
|
|||||||||||
| Acquired Loans: |
||||||||||||||||||||
| Real estate loans: |
||||||||||||||||||||
| Commercial real estate |
$ | — | $ | — | $ | — | $ | 5,400 | $ | 5,400 | ||||||||||
| Owner-occupied commercial real estate |
— | — | — | 562 | 562 | |||||||||||||||
| 1-4 single family residential |
923 | — | — | 144 | 1,067 | |||||||||||||||
| Construction, land and development |
— | — | — | — | — | |||||||||||||||
| Home equity loans and lines of credit |
96 | 218 | — | 1,996 | 2,310 | |||||||||||||||
|
|
|
|
|
|
|
|
|
|
|
|||||||||||
| Total real estate loans |
1,019 | 218 | — | 8,102 | 9,339 | |||||||||||||||
|
|
|
|
|
|
|
|
|
|
|
|||||||||||
| Other loans: |
||||||||||||||||||||
| Commercial and industrial |
184 | — | — | 275 | 459 | |||||||||||||||
| Consumer |
— | — | — | 29 | 29 | |||||||||||||||
|
|
|
|
|
|
|
|
|
|
|
|||||||||||
| Total other loans |
184 | — | — | 304 | 488 | |||||||||||||||
|
|
|
|
|
|
|
|
|
|
|
|||||||||||
| Total acquired loans |
$ | 1,203 | $ | 218 | $ | — | $ | 8,406 | $ | 9,827 | ||||||||||
|
|
|
|
|
|
|
|
|
|
|
|||||||||||
Internal risk ratings are considered the most meaningful indicator of credit quality for Non-ASC 310-30 and new commercial, construction, land and development and commercial real estate loans. Internal risk ratings are updated on a continuous basis. Loans exhibiting potential credit weaknesses that deserve management’s close attention and that if left uncorrected may result in deterioration of the repayment capacity of the borrower are categorized as special mention. Loans with well-defined credit weaknesses including payment defaults, declining collateral values, frequent overdrafts, operating losses, increasing balance sheet leverage, inadequate cash flow, project cost overruns, unreasonable construction delays, past due real estate taxes or exhausted interest reserves are assigned an internal risk rating of substandard. A loan with a weakness so severe that collection in full is highly questionable or improbable will be assigned an internal risk rating of doubtful.
F-32
Table of Contents
Index to Financial Statements
The following table summarizes the Company’s Non-ASC 310-30 and New loans by key indicators of credit quality. Loans accounted for under ASC 310-30 are excluded from the following analysis because their related allowance is determined by loan pool performance:
| December 31, 2014 |
Pass | Special Mention |
Substandard | Doubtful | ||||||||||||
| (Dollars in thousands) | ||||||||||||||||
| New loans: |
||||||||||||||||
| Commercial real estate |
$ | 853,044 | $ | — | $ | 30 | $ | — | ||||||||
| Owner-occupied commercial real estate |
281,703 | — | — | — | ||||||||||||
| Construction, land and development |
232,601 | — | — | — | ||||||||||||
| Commercial and industrial |
795,000 | — | — | — | ||||||||||||
|
|
|
|
|
|
|
|
|
|||||||||
| Total new loans |
$ | 2,162,348 | $ | — | $ | 30 | $ | — | ||||||||
|
|
|
|
|
|
|
|
|
|||||||||
| Acquired loans: |
||||||||||||||||
| Commercial real estate |
$ | 65,173 | $ | 107 | $ | 4,866 | $ | — | ||||||||
| Owner-occupied commercial real estate |
13,822 | 421 | 599 | — | ||||||||||||
| Construction, land and development |
9,729 | — | — | — | ||||||||||||
| Commercial and industrial |
9,184 | 2,147 | 2,217 | — | ||||||||||||
|
|
|
|
|
|
|
|
|
|||||||||
| Total aquired loans |
$ | 97,908 | $ | 2,675 | $ | 7,682 | $ | — | ||||||||
|
|
|
|
|
|
|
|
|
|||||||||
| December 31, 2013 |
Pass | Special Mention |
Substandard | Doubtful | ||||||||||||
| (Dollars in thousands) | ||||||||||||||||
| New loans: |
||||||||||||||||
| Commercial real estate |
$ | 514,447 | $ | 14 | $ | 151 | $ | — | ||||||||
| Owner-occupied commercial real estate |
154,983 | — | — | — | ||||||||||||
| Construction, land and development |
75,666 | — | — | — | ||||||||||||
| Commercial and industrial |
645,129 | — | 24 | — | ||||||||||||
|
|
|
|
|
|
|
|
|
|||||||||
| Total new loans |
$ | 1,390,225 | $ | 14 | $ | 175 | $ | — | ||||||||
|
|
|
|
|
|
|
|
|
|||||||||
| Acquired loans: |
||||||||||||||||
| Commercial real estate |
$ | 3,733 | $ | 115 | $ | 5,250 | $ | — | ||||||||
| Owner-occupied commercial real estate |
1,445 | 532 | 1,037 | — | ||||||||||||
| Construction, land and development |
— | — | — | — | ||||||||||||
| Commercial and industrial |
3,464 | 267 | 1,902 | — | ||||||||||||
|
|
|
|
|
|
|
|
|
|||||||||
| Total aquired loans |
$ | 8,642 | $ | 914 | $ | 8,189 | $ | — | ||||||||
|
|
|
|
|
|
|
|
|
|||||||||
Internal risk ratings are a key factor in identifying loans that are individually evaluated for impairment and impact management’s estimates of loss factors used in determining the amount of the ALL.
F-33
Table of Contents
Index to Financial Statements
The following table shows the Company’s investment in loans disaggregated based on the method of evaluating impairment:
| Loans - Recorded Investment | Allowance for Credit Loss | |||||||||||||||||||||||
| December 31, 2014 |
Individually Evaluated for Impairment |
Collectively Evaluated for Impairment |
ASC 310- 30 Loans |
Individually Evaluated for Impairment |
Collectively Evaluated for Impairment |
ASC 310- 30 Loans |
||||||||||||||||||
| (Dollars in thousands) | ||||||||||||||||||||||||
| New Loans: |
||||||||||||||||||||||||
| Real estate loans: |
||||||||||||||||||||||||
| Commercial real estate |
$ | — | $ | 853,074 | $ | — | $ | — | $ | 4,456 | $ | — | ||||||||||||
| Owner-occupied commercial real estate |
— | 281,703 | — | — | 962 | — | ||||||||||||||||||
| 1-4 single family residential |
— | 922,657 | — | — | 4,001 | — | ||||||||||||||||||
| Construction, land and development |
— | 232,601 | — | — | 1,723 | — | ||||||||||||||||||
| Home equity loans and lines of credit |
— | 11,826 | — | — | 70 | — | ||||||||||||||||||
|
|
|
|
|
|
|
|
|
|
|
|
|
|||||||||||||
| Total real estate loans |
$ | — | $ | 2,301,861 | $ | — | $ | — | $ | 11,212 | $ | — | ||||||||||||
|
|
|
|
|
|
|
|
|
|
|
|
|
|||||||||||||
| Other loans |
||||||||||||||||||||||||
| Commercial and industrial |
$ | — | $ | 795,000 | $ | — | $ | — | $ | 4,738 | $ | — | ||||||||||||
| Consumer |
— | 6,556 | — | — | 62 | — | ||||||||||||||||||
|
|
|
|
|
|
|
|
|
|
|
|
|
|||||||||||||
| Total other loans |
$ | — | $ | 801,556 | $ | — | $ | — | $ | 4,800 | $ | — | ||||||||||||
|
|
|
|
|
|
|
|
|
|
|
|
|
|||||||||||||
| Acquired Loans: |
||||||||||||||||||||||||
| Real estate loans: |
||||||||||||||||||||||||
| Commercial real estate |
$ | 4,754 | $ | 65,392 | $ | 336,935 | $ | 174 | $ | 321 | $ | 3,255 | ||||||||||||
| Owner-occupied commercial real estate |
— | 14,842 | — | — | 58 | — | ||||||||||||||||||
| 1-4 single family residential |
— | 102,279 | 86,308 | — | 414 | 325 | ||||||||||||||||||
| Construction, land and development |
— | 9,729 | 66,700 | — | 75 | 658 | ||||||||||||||||||
| Home equity loans and lines of credit |
— | 54,704 | — | — | 285 | — | ||||||||||||||||||
|
|
|
|
|
|
|
|
|
|
|
|
|
|||||||||||||
| Total real estate loans |
$ | 4,754 | $ | 246,946 | $ | 489,943 | $ | 174 | $ | 1,153 | $ | 4,238 | ||||||||||||
|
|
|
|
|
|
|
|
|
|
|
|
|
|||||||||||||
| Other loans |
||||||||||||||||||||||||
| Commercial and industrial |
$ | — | $ | 13,548 | $ | 67,498 | $ | — | $ | 49 | $ | 958 | ||||||||||||
| Consumer |
— | 681 | 2,803 | — | 6 | 290 | ||||||||||||||||||
|
|
|
|
|
|
|
|
|
|
|
|
|
|||||||||||||
| Total other loans |
$ | — | $ | 14,229 | $ | 70,301 | $ | — | $ | 55 | $ | 1,248 | ||||||||||||
|
|
|
|
|
|
|
|
|
|
|
|
|
|||||||||||||
F-34
Table of Contents
Index to Financial Statements
| Loans - Recorded Investment | Allowance for Credit Loss | |||||||||||||||||||||||
| December 31, 2013 |
Individually Evaluated for Impairment |
Collectively Evaluated for Impairment |
ASC 310- 30 Loans |
Individually Evaluated for Impairment |
Collectively Evaluated for Impairment |
ASC 310- 30 Loans |
||||||||||||||||||
| (Dollars in thousands) | ||||||||||||||||||||||||
| New Loans: |
||||||||||||||||||||||||
| Real estate loans: |
||||||||||||||||||||||||
| Commercial real estate |
$ | — | $ | 514,612 | $ | — | $ | — | $ | 1,778 | $ | — | ||||||||||||
| Owner-occupied commercial real estate |
— | 154,983 | — | — | 371 | — | ||||||||||||||||||
| 1-4 single family residential |
— | 359,818 | — | — | 1,306 | — | ||||||||||||||||||
| Construction, land and development |
— | 75,666 | — | — | 834 | — | ||||||||||||||||||
| Home equity loans and lines of credit |
— | 19,303 | — | — | 126 | — | ||||||||||||||||||
|
|
|
|
|
|
|
|
|
|
|
|
|
|||||||||||||
| Total real estate loans |
$ | — | $ | 1,124,382 | $ | — | $ | — | $ | 4,415 | $ | — | ||||||||||||
|
|
|
|
|
|
|
|
|
|
|
|
|
|||||||||||||
| Other loans |
||||||||||||||||||||||||
| Commercial and industrial |
$ | — | $ | 645,153 | $ | — | $ | — | $ | 3,853 | $ | — | ||||||||||||
| Consumer |
— | 1,176 | — | — | 17 | — | ||||||||||||||||||
|
|
|
|
|
|
|
|
|
|
|
|
|
|||||||||||||
| Total other loans |
$ | — | $ | 646,329 | $ | — | $ | — | $ | 3,870 | $ | — | ||||||||||||
|
|
|
|
|
|
|
|
|
|
|
|
|
|||||||||||||
| Acquired Loans: |
||||||||||||||||||||||||
| Real estate loans: |
||||||||||||||||||||||||
| Commercial real estate |
$ | 5,134 | $ | 3,964 | $ | 274,147 | $ | — | $ | 5 | $ | 2,675 | ||||||||||||
| Owner-occupied commercial real estate |
— | 3,014 | — | — | 5 | — | ||||||||||||||||||
| 1-4 single family residential |
189 | 9,985 | 56,745 | 44 | 8 | 85 | ||||||||||||||||||
| Construction, land and development |
— | — | 55,936 | — | — | 985 | ||||||||||||||||||
| Home equity loans and lines of credit |
386 | 11,612 | — | 105 | 34 | — | ||||||||||||||||||
|
|
|
|
|
|
|
|
|
|
|
|
|
|||||||||||||
| Total real estate loans |
$ | 5,709 | $ | 28,575 | $ | 386,828 | $ | 149 | $ | 52 | $ | 3,745 | ||||||||||||
|
|
|
|
|
|
|
|
|
|
|
|
|
|||||||||||||
| Other loans |
||||||||||||||||||||||||
| Commercial and industrial |
$ | — | $ | 5,633 | $ | 57,047 | $ | — | $ | 6 | $ | 2,339 | ||||||||||||
| Consumer |
— | 289 | 3,992 | — | — | 157 | ||||||||||||||||||
|
|
|
|
|
|
|
|
|
|
|
|
|
|||||||||||||
| Total other loans |
$ | — | $ | 5,922 | $ | 61,039 | $ | — | $ | 6 | $ | 2,496 | ||||||||||||
|
|
|
|
|
|
|
|
|
|
|
|
|
|||||||||||||
F-35
Table of Contents
Index to Financial Statements
The following tables set forth certain information regarding the Company’s impaired loans (excluding loans accounted for under ASC 310-30) that were evaluated for specific reserves:
| Impaired Loans - With Allowance | Impaired Loans - With no Allowance |
|||||||||||||||||||
| December 31, 2014 |
Recorded Investment |
Unpaid Principal Balance |
Related Allowance |
Recorded Investment |
Unpaid Principal Balance |
|||||||||||||||
| (Dollars in thousands) | ||||||||||||||||||||
| New Loans: |
||||||||||||||||||||
| Real estate loans: |
||||||||||||||||||||
| Commercial real estate |
$ | — | $ | — | $ | — | $ | — | $ | — | ||||||||||
| Owner-occupied commercial real estate |
— | — | — | — | — | |||||||||||||||
| 1-4 single family residential |
— | — | — | — | — | |||||||||||||||
| Construction, land and development |
— | — | — | — | — | |||||||||||||||
| Home equity loans and lines of credit |
— | — | — | — | — | |||||||||||||||
|
|
|
|
|
|
|
|
|
|
|
|||||||||||
| Total real estate loans |
$ | — | $ | — | $ | — | $ | — | $ | — | ||||||||||
|
|
|
|
|
|
|
|
|
|
|
|||||||||||
| Other loans |
||||||||||||||||||||
| Commercial and industrial |
$ | — | $ | — | $ | — | $ | — | $ | — | ||||||||||
| Consumer |
— | — | — | — | — | |||||||||||||||
|
|
|
|
|
|
|
|
|
|
|
|||||||||||
| Total other loans |
$ | — | $ | — | $ | — | $ | — | $ | — | ||||||||||
|
|
|
|
|
|
|
|
|
|
|
|||||||||||
| Acquired Loans: |
||||||||||||||||||||
| Real estate loans: |
||||||||||||||||||||
| Commercial real estate |
$ | 354 | $ | 354 | $ | 174 | $ | 4,400 | $ | 4,595 | ||||||||||
| Owner-occupied commercial real estate |
— | — | — | — | — | |||||||||||||||
| 1-4 single family residential |
— | — | — | — | — | |||||||||||||||
| Construction, land and development |
— | — | — | — | — | |||||||||||||||
| Home equity loans and lines of credit |
— | — | — | — | — | |||||||||||||||
|
|
|
|
|
|
|
|
|
|
|
|||||||||||
| Total real estate loans |
$ | 354 | $ | 354 | $ | 174 | $ | 4,400 | $ | 4,595 | ||||||||||
|
|
|
|
|
|
|
|
|
|
|
|||||||||||
| Other loans |
||||||||||||||||||||
| Commercial and industrial |
$ | — | $ | — | $ | — | $ | — | $ | — | ||||||||||
| Consumer |
— | — | — | — | — | |||||||||||||||
|
|
|
|
|
|
|
|
|
|
|
|||||||||||
| Total other loans |
$ | — | $ | — | $ | — | $ | — | $ | — | ||||||||||
|
|
|
|
|
|
|
|
|
|
|
|||||||||||
F-36
Table of Contents
Index to Financial Statements
| Impaired Loans - With Allowance | Impaired Loans - With no Allowance |
|||||||||||||||||||
| December 31, 2013 |
Recorded Investment |
Unpaid Principal Balance |
Related Allowance |
Recorded Investment |
Unpaid Principal Balance |
|||||||||||||||
| (Dollars in thousands) | ||||||||||||||||||||
| New Loans: |
||||||||||||||||||||
| Real estate loans: |
||||||||||||||||||||
| Commercial real estate |
$ | — | $ | — | $ | — | $ | — | $ | — | ||||||||||
| Owner-occupied commercial real estate |
— | — | — | — | — | |||||||||||||||
| 1-4 single family residential |
— | — | — | — | — | |||||||||||||||
| Construction, land and development |
— | — | — | — | — | |||||||||||||||
| Home equity loans and lines of credit |
— | — | — | — | — | |||||||||||||||
|
|
|
|
|
|
|
|
|
|
|
|||||||||||
| Total real estate loans |
$ | — | $ | — | $ | — | $ | — | $ | — | ||||||||||
|
|
|
|
|
|
|
|
|
|
|
|||||||||||
| Other loans |
||||||||||||||||||||
| Commercial and industrial |
$ | — | $ | — | $ | — | $ | — | $ | — | ||||||||||
| Consumer |
— | — | — | — | — | |||||||||||||||
|
|
|
|
|
|
|
|
|
|
|
|||||||||||
| Total other loans |
$ | — | $ | — | $ | — | $ | — | $ | — | ||||||||||
|
|
|
|
|
|
|
|
|
|
|
|||||||||||
| Acquired Loans: |
||||||||||||||||||||
| Real estate loans: |
||||||||||||||||||||
| Commercial real estate |
$ | — | $ | — | $ | — | $ | 5,134 | $ | 5,218 | ||||||||||
| Owner-occupied commercial real estate |
— | — | — | — | — | |||||||||||||||
| 1-4 single family residential |
189 | 277 | 44 | — | — | |||||||||||||||
| Construction, land and development |
— | — | — | — | — | |||||||||||||||
| Home equity loans and lines of credit |
386 | 500 | 105 | — | — | |||||||||||||||
|
|
|
|
|
|
|
|
|
|
|
|||||||||||
| Total real estate loans |
$ | 575 | $ | 777 | $ | 149 | $ | 5,134 | $ | 5,218 | ||||||||||
|
|
|
|
|
|
|
|
|
|
|
|||||||||||
| Other loans |
||||||||||||||||||||
| Commercial and industrial |
$ | — | $ | — | $ | — | $ | — | $ | — | ||||||||||
| Consumer |
— | — | — | — | — | |||||||||||||||
|
|
|
|
|
|
|
|
|
|
|
|||||||||||
| Total other loans |
$ | — | $ | — | $ | — | $ | — | $ | — | ||||||||||
|
|
|
|
|
|
|
|
|
|
|
|||||||||||
F-37
Table of Contents
Index to Financial Statements
| December 31, | ||||||||||||||||
| 2014 | 2013 | |||||||||||||||
| Average Recorded Investment |
Interest Income Recognized |
Average Recorded Investment |
Interest Income Recognized |
|||||||||||||
| (Dollars in thousands) | ||||||||||||||||
| Impaired loans with no related allowance: |
||||||||||||||||
| Real estate loans: |
||||||||||||||||
| Commercial real estate |
$ | 4,636 | $ | — | $ | 5,192 | $ | — | ||||||||
| Owner-occupied commercial real estate |
— | — | — | — | ||||||||||||
| 1-4 single family residential |
— | — | — | — | ||||||||||||
| Construction, land and development |
— | — | — | — | ||||||||||||
| Home equity loans and lines of credit |
— | — | — | — | ||||||||||||
|
|
|
|
|
|
|
|
|
|||||||||
| Total real estate loans |
$ | 4,636 | $ | — | $ | 5,192 | $ | — | ||||||||
|
|
|
|
|
|
|
|
|
|||||||||
| Other loans: |
||||||||||||||||
| Commercial and industrial |
$ | — | $ | — | $ | — | $ | — | ||||||||
| Consumer |
— | — | — | — | ||||||||||||
|
|
|
|
|
|
|
|
|
|||||||||
| Total other loans |
$ | — | $ | — | $ | — | $ | — | ||||||||
|
|
|
|
|
|
|
|
|
|||||||||
| Impaired loans with an allowance: |
||||||||||||||||
| Real estate loans: |
||||||||||||||||
| Commercial real estate |
$ | 355 | $ | — | $ | — | $ | — | ||||||||
| Owner-occupied commercial real estate |
— | — | — | — | ||||||||||||
| 1-4 single family residential |
— | — | 188 | — | ||||||||||||
| Construction, land and development |
— | — | — | — | ||||||||||||
| Home equity loans and lines of credit |
— | — | 384 | — | ||||||||||||
|
|
|
|
|
|
|
|
|
|||||||||
| Total real estate loans |
$ | 355 | $ | — | $ | 572 | $ | — | ||||||||
|
|
|
|
|
|
|
|
|
|||||||||
| Other loans: |
||||||||||||||||
| Commercial and industrial |
$ | — | $ | — | $ | — | $ | — | ||||||||
| Consumer |
— | — | — | — | ||||||||||||
|
|
|
|
|
|
|
|
|
|||||||||
| Total other loans |
$ | — | $ | — | $ | — | $ | — | ||||||||
|
|
|
|
|
|
|
|
|
|||||||||
NOTE 6. PREMISES AND EQUIPMENT
The major components of premises and equipment are as follows:
| December 31, | ||||||||
| 2014 | 2013 | |||||||
| (Dollars in thousands) | ||||||||
| Land |
$ | 8,256 | $ | 9,212 | ||||
| Building and improvements |
25,337 | 28,191 | ||||||
| Furniture, fixtures and equipment |
10,875 | 8,939 | ||||||
| Leasehold improvements |
2,636 | 974 | ||||||
| Construction in Process |
591 | 51 | ||||||
| Software |
2,387 | 1,417 | ||||||
| Total |
50,082 | 48,784 | ||||||
|
|
|
|
|
|||||
| Less: Accumulated depreciation |
(11,120 | ) | (7,792 | ) | ||||
|
|
|
|
|
|||||
| Total premises and equipment, net |
$ | 38,962 | $ | 40,992 | ||||
|
|
|
|
|
|||||
F-38
Table of Contents
Index to Financial Statements
Total depreciation expense for the years ended December 31, 2014, 2013 and 2012 totaled $3.9 million, $3.1 million and $2.7 million, respectively.
NOTE 7. GOODWILL AND INTANGIBLES
Goodwill and other intangible assets, which consist of core deposit intangibles are summarized as follows:
| December 31, | ||||||||
| 2014 | 2013 | |||||||
| (Dollars in thousands) | ||||||||
| Goodwill |
$ | 81,104 | $ | 33,749 | ||||
| Core deposit intangible |
14,370 | 10,768 | ||||||
|
|
|
|
|
|||||
| Total |
95,474 | 44,517 | ||||||
| Less: Accumulated amortization |
(6,859 | ) | (5,148 | ) | ||||
|
|
|
|
|
|||||
| Total, net |
$ | 88,615 | $ | 39,369 | ||||
|
|
|
|
|
|||||
Amortization expense for core deposit intangibles for the years ended December 31, 2014, 2013 and 2012 totaled $1.7 million, $1.5 million and $1.7 million, respectively.
The estimated amount of amortization expense for core deposit intangible assets to be recognized over the next five fiscal years is as follows:
| Type of intangibles | 2015 | 2016 | 2017 | 2018 | 2019 | |||||||||||||||
| (Dollars in thousands) | ||||||||||||||||||||
| Core deposit intangible |
$ | 1,630 | $ | 1,189 | $ | 1,023 | $ | 1,023 | $ | 1,023 | ||||||||||
NOTE 8. DERIVATIVES
The Company is a party to interest rate derivatives that are not designated as hedging instruments. These derivatives relate to interest rate swaps that the Company enters into with customers to allow customers to convert variable rate loans to a fixed rate. The Company pays interest to the customer at a floating rate on the notional amount and receives interest from the customer at a fixed rate for the same notional amount. At the same time the interest rate swap is entered into with the customer, an offsetting interest rate swap is entered into with another financial institution. The Company pays the other financial institution interest at the same fixed rate on the same notional amount as the swap entered into with the customer, and receives interest from the financial institution for the same floating rate on the same notional amount. The changes in the fair value of the swaps offset each other, except for any credit risk of the counterparties, which is determined by taking into consideration the risk rating, probability of default and loss of given default for all counterparties. The Company recorded $4.5 million, $3.3 million and $0.0 million of customer swap fees in noninterest income in the accompanying consolidated statement of income for the years ended December 31, 2014, 2013 and 2012, respectively.
All derivative positions held by the Company as of December 31, 2014 were not designated as hedging instruments under ASC 815-10. As of December 31, 2014, the Company has not recorded any credit adjustments related to the credit risk of the counterparties. There was no change in the fair value of derivative assets and derivative liabilities attributable to credit risk included in “Noninterest Expense” on the statements of income for the years ended December 31, 2014, 2013 or 2012.
F-39
Table of Contents
Index to Financial Statements
The following tables summarize the Company’s derivatives outstanding included in “Other Assets” and “Other Liabilities” in the accompanying consolidated balance sheets:
| December 31, 2014 |
Derivative Assets | Derivative Liabilities | ||||||||||||||
| Notional | Fair Value | Notional | Fair Value | |||||||||||||
| (Dollars in thousands) | ||||||||||||||||
| Derivative not designated as hedging instruments under ASC 815-10 |
||||||||||||||||
| Interest rate contracts - pay floating, receive fixed |
$ | 464,890 | $ | 14,328 | $ | 8,298 | $ | 39 | ||||||||
| Interest rate contracts - pay fixed, receive floating |
— | — | 473,188 | 14,289 | ||||||||||||
|
|
|
|
|
|
|
|
|
|||||||||
| Total derivatives |
$ | 464,890 | $ | 14,328 | $ | 481,487 | $ | 14,328 | ||||||||
|
|
|
|
|
|
|
|
|
|||||||||
| December 31, 2013 |
Derivative Assets | Derivative Liabilities | ||||||||||||||
| Notional | Fair Value | Notional | Fair Value | |||||||||||||
| (Dollars in thousands) | ||||||||||||||||
| Derivative not designated as hedging instruments under ASC 815-10 |
||||||||||||||||
| Interest rate contracts - pay floating, receive fixed |
$ | 126,011 | $ | 2,660 | $ | 43,539 | $ | 1,488 | ||||||||
| Interest rate contracts - pay fixed, receive floating |
— | — | 169,551 | 1,172 | ||||||||||||
|
|
|
|
|
|
|
|
|
|||||||||
| Total derivatives |
$ | 126,011 | $ | 2,660 | $ | 213,090 | $ | 2,660 | ||||||||
|
|
|
|
|
|
|
|
|
|||||||||
The Company has entered into transactions subject to an enforceable master netting arrangement with a financial institution. The following table summarizes the gross and net fair values of the Company’s derivatives outstanding with this counterparty included in “Other Liabilities” in the accompanying consolidated balance:
| December 31, 2014 |
Gross amounts of recognized liabilities |
Gross amounts offset in the consolidated balance sheets |
Net amounts in the consolidated balance sheets |
|||||||||
| (Dollars in thousands) | ||||||||||||
| Offsetting derivative liabilities |
||||||||||||
| Counterparty A - Interest rate contracts |
$ | 14,328 | $ | (39 | ) | $ | 14,289 | |||||
|
|
|
|
|
|
|
|||||||
| Total |
$ | 14,328 | $ | (39 | ) | $ | 14,289 | |||||
|
|
|
|
|
|
|
|||||||
| December 31, 2013 |
Gross amounts of recognized liabilities |
Gross amounts offset in the consolidated balance sheets |
Net amounts in the consolidated balance sheets |
|||||||||
| (Dollars in thousands) | ||||||||||||
| Offsetting derivative liabilities |
||||||||||||
| Counterparty A - Interest rate contracts |
$ | 2,660 | $ | (1,488 | ) | $ | 1,172 | |||||
|
|
|
|
|
|
|
|||||||
| Total |
$ | 2,660 | $ | (1,488 | ) | $ | 1,172 | |||||
|
|
|
|
|
|
|
|||||||
At December 31, 2014, the Company has pledged investment securities available for sale with a carrying amount of $16.3 million as collateral for these interest rate swaps in a liability position. The amount of collateral required to be posted by the Company varies based on the settlement value of outstanding swaps.
As of December 31, 2014 and 2013, substantially all of the floating rate terms within the interest rate contracts held by the Company were indexed to 1-month LIBOR.
F-40
Table of Contents
Index to Financial Statements
The fair value of the derivative assets and liabilities are included in a table in Note 19 “Fair Value Measurements,” in the line items “Derivative assets” and “Derivative liabilities.”
NOTE 9. DEPOSITS
The following table sets forth the Company’s deposits by category:
| December 31, | ||||||||
| 2014 | 2013 | |||||||
| (Dollars in thousands) | ||||||||
| Noninterest-bearing demand deposits |
$ | 593,025 | $ | 291,658 | ||||
| Interest-bearing demand deposits |
122,380 | — | ||||||
| Interest-bearing NOW accounts |
374,399 | 84,837 | ||||||
| Savings and money market accounts |
1,811,878 | 1,251,842 | ||||||
| Time deposits |
1,076,853 | 1,165,196 | ||||||
|
|
|
|
|
|||||
| Total deposits |
$ | 3,978,535 | $ | 2,793,533 | ||||
|
|
|
|
|
|||||
| Time deposits $100,000 and greater |
$ | 689,439 | $ | 674,236 | ||||
| Time deposits greater than $250,000 |
226,895 | 208,329 | ||||||
The aggregate amount of overdraft demand deposits that have been reclassified to loans was $377 thousand at December 31, 2014. The aggregate amount of maturities for time deposits for each of the five years following the latest balance sheet date totaled $634.2 million, $208.6 million, $62.5 million, $162.2 million and $9.0 million, respectively. The Company had brokered deposits of $338.2 million and $0.0 million at December 31, 2014 and 2013, respectively.
NOTE 10. FHLB AND OTHER BORROWINGS
Advances from the FHLB and other borrowings outstanding for the periods presented are as follows:
| December 31, 2014 |
Range of Contractual Interest Rates |
December 31, 2013 |
Range of Contractual Interest Rates | |||||||||
| Repayable during the years ending December 31, |
||||||||||||
| 2014 |
$ | — | $ | 432,015 | 0.20% - 3.77% | |||||||
| 2015 |
707,185 | 0.21% - 0.36% | — | |||||||||
| 2016 |
276,500 | 0.48% - 0.75% | — | |||||||||
| 2017 |
72,500 | 4.05% - 4.35% | — | |||||||||
|
|
|
|
|
|||||||||
| Total contractual outstanding |
1,056,185 | 432,015 | ||||||||||
| Deferred prepayment penalty |
— | (1,187 | ) | |||||||||
| Fair value adjustment |
6,091 | 185 | ||||||||||
|
|
|
|
|
|||||||||
| Total FHLB advances and securities sold under repurchase agreements |
1,062,276 | 431,013 | ||||||||||
|
|
|
|
|
|||||||||
| Retail repurchase agreements |
5,705 | 4,853 | ||||||||||
|
|
|
|
|
|||||||||
| Total borrowings |
$ | 1,067,981 | $ | 435,866 | ||||||||
|
|
|
|
|
|||||||||
F-41
Table of Contents
Index to Financial Statements
For the years ended December 31, 2014 and 2013, the Company maintained advances with the FHLB averaging $792.4 million and $313.0 million, respectively, with an average cost of approximately 0.63% and 1.33%, respectively. Substantially all FHLB advances outstanding at December 31, 2014 and 2013 had fixed interest rates. Interest expense on FHLB advances of $5.0 million, $4.3 million and $4.8 million for the years ended December 31, 2014, 2013 and 2012 included a reduction for amortization of the fair value adjustment on FHLB advances of $380 thousand, $272 thousand and $436 thousand, respectively. The fair value adjustment is being amortized as a reduction to interest expense over the remaining term of the advances using the effective yield method.
The Company pledges loans and securities as collateral for FHLB advances. See Notes 3 and 4 to these consolidated financial statements for further information. At December 31, 2014, the Company had additional capacity to borrow from the FHLB of $397.6 million. Also, at December 31, 2014, the Company has unused credit lines with financial institutions of $30.0 million.
NOTE 11. REGULATORY CAPITAL
The Company and the Bank are subject to regulatory capital adequacy requirements promulgated by federal regulatory agencies. The FRB establishes capital requirements, including well capitalized standards, for the Company, and the OCC has similar requirements for the Bank. Failure to meet minimum capital requirements can initiate certain mandatory and possibly additional discretionary actions by regulators that, if undertaken, could have a direct material effect on the Company’s financial statements. The capital amounts and classification are also subject to qualitative judgments by the regulators about components, risk weightings and other factors.
Banking regulations identify five capital categories for insured depository institutions: well capitalized, adequately capitalized, undercapitalized, significantly undercapitalized and critically undercapitalized. As of December 31, 2014 and 2013, all capital ratios of the Company and the Bank exceeded the well capitalized levels under the applicable regulatory capital adequacy guidelines.
The ability of the Company and the Bank to pay dividends is subject to statutory and regulatory restrictions on the payment of cash dividends, including the requirement under the Florida banking laws that cash dividends be paid only out of undivided profits and only if the Company or the Bank have surplus of a specified level. In addition, the Company’s agreement with the OCC (the “OCC Agreement”), which was entered into by the Company and the OCC on January 22, 2010 in connection with the acquisition of PAB, imposes other restrictions on the Bank’s ability to pay dividends to the Company, including requiring prior approval from the OCC, before any dividends are paid.
Quantitative measures established by regulation to ensure capital adequacy require the Company and Bank to maintain minimum amounts and ratios (set forth in the following table) of total and Tier I capital (as defined) to average assets (as defined). Management believes, at December 31, 2014 and 2013, that the Company and Bank met all capital adequacy requirements to which they are subject.
F-42
Table of Contents
Index to Financial Statements
The Bank’s and Company’s regulatory capital levels are as follows:
| Actual | Minimum Capital Requirement |
Minimum To Be Well Capitalized |
||||||||||||||||||||||
| Amount | Ratio | Amount | Ratio | Amount | Ratio | |||||||||||||||||||
| (Dollars in thousands) |
||||||||||||||||||||||||
| December 31, 2014 |
||||||||||||||||||||||||
| Tier 1 leverage ratio |
||||||||||||||||||||||||
| Company |
$ | 752,174 | 12.8 | % | $ | 234,991 | 4.0 | % | $ | 293,739 | 5.0 | % | ||||||||||||
| Bank |
598,517 | 10.4 | % | 229,828 | 4.0 | % | 287,285 | 5.0 | % | |||||||||||||||
| Tier 1 risk-based capital ratio |
||||||||||||||||||||||||
| Company |
752,174 | 17.0 | % | 176,798 | 4.0 | % | 265,197 | 6.0 | % | |||||||||||||||
| Bank |
598,517 | 13.9 | % | 172,315 | 4.0 | % | 258,473 | 6.0 | % | |||||||||||||||
| Total risk-based capital ratio |
||||||||||||||||||||||||
| Company |
776,289 | 17.6 | % | 353,596 | 8.0 | % | 441,995 | 10.0 | % | |||||||||||||||
| Bank |
622,632 | 14.5 | % | 344,631 | 8.0 | % | 430,788 | 10.0 | % | |||||||||||||||
| December 31, 2013 |
||||||||||||||||||||||||
| Tier 1 leverage ratio |
||||||||||||||||||||||||
| Company |
$ | 674,225 | 18.0 | % | $ | 149,575 | 4.0 | % | $ | 186,969 | 5.0 | % | ||||||||||||
| Bank |
437,952 | 12.0 | % | 145,686 | 4.0 | % | 182,107 | 5.0 | % | |||||||||||||||
| Tier 1 risk-based capital ratio |
||||||||||||||||||||||||
| Company |
674,225 | 24.8 | % | 108,829 | 4.0 | % | 163,244 | 6.0 | % | |||||||||||||||
| Bank |
437,952 | 16.7 | % | 104,901 | 4.0 | % | 157,352 | 6.0 | % | |||||||||||||||
| Total risk-based capital ratio |
||||||||||||||||||||||||
| Company |
689,551 | 25.3 | % | 217,659 | 8.0 | % | 272,074 | 10.0 | % | |||||||||||||||
| Bank |
453,279 | 17.3 | % | 209,803 | 8.0 | % | 262,254 | 10.0 | % | |||||||||||||||
In connection with the OCC Agreement, the Bank agreed to maintain minimum capital ratios in excess of current regulatory requirements as follows: Tier 1 leverage ratio of 10%, Tier 1 risk-based capital ratio of 11% and total risk-based capital ratio of 12%. These ratios are in lieu of the current capital regulatory requirements to be considered well and adequately capitalized outlined in the table above.
The FDIC Order that the Bank entered into upon the acquisition of Old Premier requires the institution to maintain a ratio of Tier 1 common equity to total assets of at least 10% for a period of three years following its first FDIC-assisted transaction, and thereafter maintain a capital level sufficient to be well capitalized under regulatory standards during the remaining period of ownership of the investors subject to the FDIC Order. The Bank is currently subject to the well capitalized requirement but is no longer subject to the 10% Tier 1 common equity ratio requirement.
On December 17, 2014, the OCC Agreement was terminated eliminating the minimum capital ratio requirements and dividend restrictions noted above.
The Bank is subject to regulations of certain federal and state agencies and can be periodically examined by those authorities. As a consequence, the Bank’s business is susceptible to the impacts of federal legislation and regulations issued by, but not limited to, the FRB, OCC and FDIC.
F-43
Table of Contents
Index to Financial Statements
NOTE 12. ACCUMULATED OTHER COMPREHENSIVE INCOME
Changes in AOCI for the periods indicated are summarized as follows:
| December 31, 2014 | ||||||||||||
| Before Tax |
Tax Effect |
Net of Tax |
||||||||||
| (Dollars in thousands) | ||||||||||||
| Balance at beginning of period |
$ | (2,565 | ) | $ | 990 | $ | (1,575 | ) | ||||
| Unrealized gain (loss) on investment securities available for sale: |
||||||||||||
| Net unrealized holdings gain (loss) arising during the period |
11,481 | (4,430 | ) | 7,051 | ||||||||
| Amounts reclassified to (gain) loss on investment securities |
(7,810 | ) | 3,013 | (4,797 | ) | |||||||
|
|
|
|
|
|
|
|||||||
| Balance at end of period |
$ | 1,106 | $ | (427 | ) | $ | 679 | |||||
|
|
|
|
|
|
|
|||||||
| December 31, 2013 | ||||||||||||
| Before Tax |
Tax Effect |
Net of Tax |
||||||||||
| (Dollars in thousands) | ||||||||||||
| Balance at beginning of period |
$ | 18,788 | $ | (7,248 | ) | $ | 11,540 | |||||
| Unrealized gain (loss) on investment securities available for sale: |
||||||||||||
| Net unrealized holdings gain (loss) arising during the period |
(12,880 | ) | 4,970 | (7,910 | ) | |||||||
| Amounts reclassified to (gain) loss on investment securities |
(8,473 | ) | 3,268 | (5,205 | ) | |||||||
|
|
|
|
|
|
|
|||||||
| Balance at end of period |
$ | (2,565 | ) | $ | 990 | $ | (1,575 | ) | ||||
|
|
|
|
|
|
|
|||||||
| December 31, 2012 | ||||||||||||
| Before Tax |
Tax Effect |
Net of Tax |
||||||||||
| (Dollars in thousands) | ||||||||||||
| Balance at beginning of period |
$ | (17,484 | ) | $ | 6,744 | $ | (10,740 | ) | ||||
| Unrealized gain (loss) on investment securities available for sale: |
||||||||||||
| Net unrealized holdings gain (loss) arising during the period |
38,960 | (15,029 | ) | 23,931 | ||||||||
| Amounts reclassified to (gain) loss on investment securities |
(2,688 | ) | 1,037 | (1,651 | ) | |||||||
|
|
|
|
|
|
|
|||||||
| Balance at end of period |
$ | 18,788 | $ | (7,248 | ) | $ | 11,540 | |||||
|
|
|
|
|
|
|
|||||||
NOTE 13. STOCKHOLDERS’ EQUITY
Public Offering
On July 31, 2014, the Securities and Exchange Commission declared effective the Company’s registration statement on Form S-1 registering the shares of the Company’s Class A common stock. The Class A common stock was authorized for trading on the New York Stock Exchange (“NYSE”) under the symbol “FCB.” On August 6, 2014, the Company completed the initial public offering of 7,520,000 shares of Class A common stock for $22.00 per share. Of the 7,520,000 shares sold, 4,554,045 shares were sold by the Company and 2,965,955 shares were sold by certain selling shareholders. In addition, on September 3, 2014, the Company sold an additional 720,000 shares of Class A common stock to cover the exercise of the underwriters’ over-allotment option. The Company received net proceeds of approximately $104.5 million from the offering, after deducting the underwriting discounts and commissions and estimated offering expenses. The Company did not receive any proceeds from the sale of shares by the selling shareholders. This public offering constituted a “Qualified IPO” with respect to the Company’s outstanding 2009 Warrants, outstanding 2013 Stock Incentive Plan Restricted Stock Units (“2013 RSUs”) and Option (“2013 Plan Options”) awards and contingent placement fees from the 2009 and 2010 Offerings.
F-44
Table of Contents
Index to Financial Statements
2009 and 2010 Contingent Placement Fees
In 2009 and 2010, the Company paid Deutsche Bank Securities, Inc. (the “Placement Agent”) a placement fee of $16.8 million and $12.0 million, respectively, as part of the Company’s 2009 and 2010 private placement offerings (the “2009 and 2010 Offerings”). In addition to the initial private placement fees of the 2010 and 2009 Offerings, the Company was obligated to pay an additional placement fee to the Placement Agent of $10 million, related to the 2009 and 2010 private placement offerings in the event of a Qualified IPO. On August 6, 2014, the Company transferred the contingent fee of $10 million to the Placement Agent. The Company recorded the payment as a reduction of additional paid-in capital as the contingent fee was related to capital raising efforts.
Class A and Class B Common Stock
The shares of common stock of the Company are divided into two classes: Class A common stock and Class B common stock. The Class A common stock possesses all of the voting power for all matters requiring action by holders of the Company’s common stock, with certain limited exceptions. Each share of Class B common stock is convertible into one share of Class A common stock, subject to certain restrictions. The Class A common stock is not convertible. Other than with respect to voting rights and the restrictions on transfer and conversion relating to the Class B common stock, the Class A common stock and the Class B common stock are treated equally and identically, including with respect to distributions.
In 2014, the Company converted 887,104 Class B common shares to Class A common shares in a voluntary exchange with certain shareholders. This exchange was made on 1:1 ratio and no consideration was paid or received by the Company. Total Class B common shares issued and outstanding decreased by 887,104 while Class A common shares issued and outstanding increased by 887,104 for the year ended December 31, 2014. This is recorded as “Exchange of B shares to A shares” in the consolidated statements of changes in stockholders’ equity.
Preferred Stock
There are 10 million preferred shares authorized and none issued and outstanding at December 31, 2014. Preferred stock has a par value of $.001.
Treasury Stock
In December 2013, the Company completed a cash tender purchase of outstanding Class A and Class B common stock from shareholders. The Company purchased 927,312 and 192,132 Class A and Class B common shares, respectively, at a price of $16.75 per share and an aggregate amount of $18.8 million. The Company accounted for the transaction under the cost method and holds 1,119,444 common shares with a cost of $18.8 million in Treasury Stock as of December 31, 2014. This transaction is recorded as “Treasury stock purchases” in the accompanying consolidated statements of changes in stockholders’ equity.
Warrants
During 2009, the Company issued, as a distribution in respect of its existing equity, warrants to purchase an aggregate of 3,310,428 shares of Class A common stock (the “2009 Warrants”). The 2009 Warrants provide the recipient a right to purchase one share of Class A common stock for an exercise price ranging between $24.24 and $28.28 per warrant. The recipients can only exercise the warrants on the sixth, eighteenth, and thirtieth month anniversaries of the occurrence of a Qualified IPO. Prior to December 31, 2013, the Company had not recorded any expense in the accompanying consolidated financial statements associated with the Original 2009 Warrants as it was a distribution in respect of its then existing equity.
On November 19, 2013, the Company amended the 2009 Warrants (the “Amended 2009 Warrants”) whereby the exercise period and expiration date was extended to November 12, 2019. The Amended 2009 Warrants also provide clarification for certain matters relating to the definition of a “Special Transaction”.
The incremental change in fair value of the Amended 2009 Warrants was determined utilizing the Black-Scholes pricing model methodology as of November 19, 2013, the date of amendment, compared to the fair value of the Original 2009 Warrants immediately prior to the modification. The amount related to the change in fair value resulting from the modification at grant date was $4.0 million.
F-45
Table of Contents
Index to Financial Statements
The assumptions used to calculate the fair values of the Original 2009 Warrants and Amended 2009 Warrants are summarized below:
| Original 2009 Warrants Immediately Prior to Modification |
Amended 2009 Warrants Immediately After Modification |
|||||||
| Expected volatility |
30.0 | % | 30.0 | % | ||||
| Expected dividend yield |
2.5 | % | 2.5 | % | ||||
| Expected term (years) |
3.0 | 6.0 | ||||||
| Risk-free interest rate |
0.58 | % | 1.70 | % | ||||
| Weighted average fair value (per warrant) |
$ | 1.28 | $ | 2.49 | ||||
| Total fair value (in thousands) |
$ | 4,226 | $ | 8,254 | ||||
Since the Company’s common stock did not trade on any exchange at the time of the modification, the expected volatility is based on the volatility of comparable peer banks. The expected term represents the period of time that the 2009 warrants are expected to be outstanding from the amendment date. The risk-free interest rate is based on the US Treasury yields for the expected term of the instrument.
The Company’s public offering constituted a Qualified IPO with respect to the Company’s Amended 2009 Warrants. The recipients can exercise the warrants with respect to one-third on February 6, 2015, February 6, 2016 and February 6, 2017. During the year ended December 31, 2014, the Company recognized $4.0 million in expense resulting from the 2009 Warrants modification as a Qualified IPO transaction was completed. The Company did not recognize any income tax benefit associated with the Amended 2009 Warrants.
The following table presents the activity during the year ended December 31, 2014 related to the Amended 2009 Warrants:
| Amended 2009 Warrants | ||||||||||||||||
| Warrants | Weighted Average Exercise Price |
Aggregate Intrinsic Value |
Weighted Average Remaining Contractual Life (Years) |
|||||||||||||
| (Dollars in thousands, except per share data) | ||||||||||||||||
| Outstanding at January 1, 2014 |
3,310,428 | $ | 26.23 | |||||||||||||
| Granted |
— | — | ||||||||||||||
| Exercised |
— | — | ||||||||||||||
| Forfeited |
— | — | ||||||||||||||
| Expired |
— | — | ||||||||||||||
|
|
|
|||||||||||||||
| Outstanding at December 31, 2014 |
3,310,428 | 26.23 | $ | 441 | 4.87 | |||||||||||
|
|
|
|||||||||||||||
| Exercisable at December 31, 2014 |
— | — | — | — | ||||||||||||
|
|
|
|||||||||||||||
| Vested at December 31, 2014 |
3,310,428 | 26.23 | 441 | 4.87 | ||||||||||||
|
|
|
|||||||||||||||
| Vested and expected to vest at December 31, 2014 |
3,310,428 | 26.23 | 441 | 4.87 | ||||||||||||
|
|
|
|||||||||||||||
As of December 31, 2014, there were 3,310,428 outstanding 2009 Warrants with an expiration date of November 12, 2019. There is no remaining expense to be recognized from the Amended 2009 Warrants.
F-46
Table of Contents
Index to Financial Statements
During 2010, the Company issued warrants to directors and employees to purchase an aggregate of 2,142,000 shares of Class A common stock (the “2010 Warrants”). The 2010 Warrants provided the recipient a right to purchase one share of Class A common stock for an exercise price at December 31, 2012 ranging between $26 and $32 per warrant. All 2010 Warrants were relinquished by the recipients and cancelled (the “Cancellation”) by the Company in 2013. The Company has not recorded any expense in the accompanying consolidated financial statements associated with the 2010 Warrants or the Cancellation of the 2010 Warrants as a Qualified IPO did not occur on or prior to the Cancellation. The holders of the 2010 Warrants received replacement awards in the form of stock options and restricted stock units (the “2013 RSUs”) from the 2013 Incentive Plan. The Company has accounted for this as a modification. Refer to Note 14 “Stock-based Compensation and Other Benefit Plans” for more information and calculation of the fair value modification.
NOTE 14. STOCK-BASED COMPENSATION AND OTHER BENEFIT PLANS
2009 Equity Incentive Plan
In 2009, the Company approved the 2009 Equity Incentive Plan (the “2009 Option Plan”) covering its directors, employees and affiliates. The 2009 Option Plan provided for the grant of options to acquire shares of common stock up to an aggregate of the lesser of 10% of issued common stock or 4.375 million shares of common stock. When the options are exercised, the shares issued upon such exercise will be newly issued shares.
On January 10, 2011, the Company granted 785,402 options to Company directors with immediate vesting and 560,500 options to Company employees that vest at a rate of 33 1/3% on the first, second and third year anniversaries of the grant date (“Three Year Vesting Period”). All the options granted in 2011 have an exercise price of $21.00, the estimated fair value of the Company’s stock on the date of grant, expire on January 10, 2021.
On two different dates in 2012, the Company granted an aggregate of 275,000 options to employees with a Three Year Vesting Period and a weighted average exercise price of $20.44. The options granted to employees can be exercised within 10 years from grant date starting March 8, 2013. Also in 2012, the Company granted 400,000 stock options to directors without vesting requirements and a weighted average exercise price of $20.62. The options granted to directors can be exercised within 10 years from grant date.
On four different dates in 2013, the Company granted an aggregate of 370,499 options to employees with a Three Year Vesting Period and a weighted average exercise price of $19.63. The options granted to employees expire 10 years from grant date. Also in 2013, the Company granted 70,000 stock options to directors without vesting requirements and a weighted average exercise price of $19.25. The options granted to directors can be exercised within 10 years from grant date.
On three different dates in 2014, the Company granted an aggregate of 605,250 options with a Three Year Vesting Period from the 2009 Option Plan to employees with a weighted average exercise price of $21.99, the estimated fair value of the Company’s stock on the date of grant, and an aggregate fair value of $4.5 million. The options granted to employees expire 10 years from grant date.
Also in 2014, the Company granted 90,000 options from the 2009 Option Plan to directors that vest at a rate of 25% per calendar quarter in 2014. The options have an exercise price of $19.75, the estimated fair value of the Company’s stock on the date of grant and an aggregate fair value of $0.5 million. The options granted to directors expire 10 years from grant date.
In November 2014, the 2009 Option Plan expired on the fifth anniversary of plan’s adoption date. As of December 31, 2014, there are no remaining awards available from the 2009 Option Plan.
F-47
Table of Contents
Index to Financial Statements
The following tables present the activity during the year ended December 31, 2014 related to the 2009 Option Plan:
| 2009 Option Plan | ||||||||||||||||
| Options | Weighted Average Exercise Price |
Aggregate Intrinsic Value |
Weighted Average Remaining Contractual Life (Years) |
|||||||||||||
| (Dollars in thousands, exept per share data) | ||||||||||||||||
| Outstanding at January 1, 2014 |
3,688,500 | (1) | $ | 20.45 | ||||||||||||
| Granted |
695,250 | 21.70 | ||||||||||||||
| Exercised |
— | — | ||||||||||||||
| Forfeited |
(19,332 | ) | 19.58 | |||||||||||||
| Expired |
(229,168 | ) | 20.48 | |||||||||||||
|
|
|
|||||||||||||||
| Outstanding at December 31, 2014 |
4,135,250 | 20.67 | $ | 16,432 | 6.88 | |||||||||||
|
|
|
|||||||||||||||
| Exercisable at December 31, 2014 |
3,179,210 | 20.50 | 13,149 | 6.20 | ||||||||||||
|
|
|
|||||||||||||||
| Vested at December 31, 2014 |
3,179,210 | 20.50 | 13,149 | 6.20 | ||||||||||||
|
|
|
|||||||||||||||
| Vested and expected to vest at December 31, 2014 |
4,133,355 | 20.67 | 16,422 | 6.88 | ||||||||||||
|
|
|
|||||||||||||||
| (1) | The balance as of January 1, 2014 includes 10,000 options that were granted during 2013 and not included in the prior year presentation. |
The fair values of the stock options granted for the years ended December 31, 2014, 2013 and 2012 were determined utilizing the Black-Scholes pricing model methodology. A summary of assumptions used to calculate the fair values of the 2009 Option Plan awards is presented below:
| 2009 Option Plan | ||||||||||||
| Year Ended December 31, | ||||||||||||
| 2014 | 2013 | 2012 | ||||||||||
| Expected volatility |
33.6 - 36.7 | % | 33.6 - 36.4 | % | 35.9 | % | ||||||
| Expected dividend yield |
1.3 - 2.5 | % | 2.5 | % | 2.5 | % | ||||||
| Expected term (years) |
5.5 - 6.5 | 5.0 - 6.5 | 6.0 | |||||||||
| Risk-free interest rate |
2.32 - 2.70 | % | 1.89 - 2.69 | % | 0.89 - 1.41 | % | ||||||
| Weighted average grant date fair value |
$ | 7.14 | $ | 5.44 | $ | 5.22 | ||||||
The expected volatility is based on the volatility of comparable peer banks. The expected term represents the period of time that the 2009 Option Plan awards are expected to be outstanding from the date of grant. The risk-free interest rate is based on the US Treasury yields for the expected term of the instrument.
A summary of selected data related to stock-based compensation expense follows:
| 2009 Option Plan | ||||||||||||
| Year Ended December 31, | ||||||||||||
| 2014 | 2013 | 2012 | ||||||||||
| (Dollars in thousands) | ||||||||||||
| Stock-based compensation expense |
$ | 2,125 | $ | 2,635 | $ | 4,320 | ||||||
| Income tax benefit from stock-based compensation expense |
320 | 822 | 1,403 | |||||||||
| Grant date fair value of stock-based awards that vested during the year |
2,319 | 2,924 | 3,971 | |||||||||
F-48
Table of Contents
Index to Financial Statements
| 2009 Option Plan | ||||||||||||
| December 31, | ||||||||||||
| 2014 | 2013 | 2012 | ||||||||||
| (Dollars in thousands) | ||||||||||||
| Unrecognized compensation expense related to stock-based compensation |
$ | 4,949 | $ | 2,396 | $ | 2,666 | ||||||
| Weighted-average life over which expense is expected to be recognized (years) |
2.54 | 2.27 | 1.46 | |||||||||
2013 Stock Incentive Plan
In 2013, the Company approved the 2013 Stock Incentive Plan (the “2013 Incentive Plan”) covering its executive management, directors, individual consultants and employees. The 2013 Incentive Plan provides that awards may be granted under the plan with respect to an aggregate of 3,000,000 shares of common stock of the Company. Awards may be made under the 2013 Incentive Plan in the form of (a) incentive stock options, (b) options that do not qualify as incentive stock options, (c) stock appreciation rights, (d) restricted stock, (e) restricted stock units and (f) unrestricted stock; provided, that the number of shares of restricted stock, restricted stock units, and shares of unrestricted stock awarded under the Plan shall not exceed 500,000, in the aggregate. When the options are exercised, the shares issued upon such exercise will be newly issued shares.
On August 6, 2014, the Company completed the initial public offering of 7,520,000 shares of Class A common stock for $22.00 per share. This public offering constituted a “Qualified IPO” with respect to the Company’s Option awards (“2013 Plan Options”) and 2013 Stock Incentive Plan Restricted Stock Units (“2013 RSUs”). During the year ended December 31, 2014, the Company recognized $5.5 million in expense resulting from the Plan Options as a “Qualified IPO” transaction was completed. The total unrecognized compensation cost of $1.9 million for the 2013 Option Plan share awards outstanding at December 31, 2014 will be recognized over a weighted average remaining period of 1.98 years
During 2013, all 2010 Warrants were relinquished by the recipients and cancelled by the Company. The holders of the 2010 Warrants received replacement awards in the form of 2013 Plan Options and 2013 RSUs. The Company has accounted for this as a modification and recognized the fair value of the cancelled 2010 Warrants as a reduction to 2013 Incentive Plan expense. The amount related to the change in fair value resulting from the 2010 Warrants at the cancellation date was $1.5 million and was recorded in the consolidated financial statements at the completion of the Qualified IPO. A summary of assumptions used to calculate the fair values of the cancelled 2010 Warrants is presented below:
| Original 2010 Warrants Immediately Prior to Cancellation |
Original 2010 Warrants Immediately After Cancellation |
|||||||
| Expected volatility |
30.0 | % | 30.0 | % | ||||
| Expected dividend yield |
2.5 | % | 2.5 | % | ||||
| Expected term (years) |
3.6 | — | ||||||
| Risk-free interest rate |
1.06 | % | 1.06 | % | ||||
| Weighted average fair value (per warrant) |
$ | 0.70 | $ | — | ||||
| Total fair value (in thousands) |
$ | 1,499 | $ | — | ||||
F-49
Table of Contents
Index to Financial Statements
2013 Incentive Plan – Stock Options
On December 23, 2013, the Company granted 1,500,000 options with immediate vesting and 673,000 options that vest in equal installments over a period of three years. The 2013 Incentive Plan options (the “2013 Plan Options”) granted in 2013 have an exercise price of $19.75, the estimated fair value of the Company’s stock on the date of grant, and expire on December 23, 2023. The vested 2013 Plan Options are exercisable with respect to one-third each on February 6, 2015, February 6, 2016 and February 6, 2017.
For the year ended December 31, 2014, no awards were granted by the Company from the 2013 Stock Incentive Plan.
At December 31, 2014, based on the amount of 2013 Plan Options outstanding, there were 329,500 shares remaining available for option awards from the 2013 Incentive Plan. At December 31, 2014, there were 1,500,000 outstanding vested 2013 Plan Options and 670,500 outstanding 2013 Plan Options with a three year vesting period. The outstanding 2013 Plan Options have an expiration date of December 23, 2023.
The following tables present the activity during the year ended December 31, 2014 related to the 2013 Plan Options:
| 2013 Option Plan | ||||||||||||||||
Options |
Weighted Average Exercise Price |
Aggregate Intrinsic Value |
Weighted Average Remaining Contractual Life (Years) |
|||||||||||||
| (Dollars in thousands, except per share data) | ||||||||||||||||
| Outstanding at January 1, 2014 |
2,173,000 | $ | 19.75 | |||||||||||||
| Granted |
— | — | ||||||||||||||
| Exercised |
— | — | ||||||||||||||
| Forfeited |
(2,500 | ) | 19.75 | |||||||||||||
| Expired |
— | — | ||||||||||||||
|
|
|
|||||||||||||||
| Outstanding at December 31, 2014 |
2,170,500 | 19.75 | $ | 10,614 | 8.98 | |||||||||||
|
|
|
|||||||||||||||
| Exercisable at December 31, 2014 |
— | — | — | — | ||||||||||||
|
|
|
|||||||||||||||
| Vested at December 31, 2014 |
1,723,482 | 19.75 | 8,428 | 8.98 | ||||||||||||
|
|
|
|||||||||||||||
| Vested and expected to vest at December 31, 2014 |
2,170,500 | 19.75 | 10,614 | 8.98 | ||||||||||||
|
|
|
|||||||||||||||
The fair value of the 2013 Plan Options granted for the year ended December 31, 2013 were determined utilizing the Black-Scholes pricing model methodology which resulted in a total fair value of $8.9 million on the date of grant. A summary of assumptions used to calculate the fair values of the 2013 Plan Options is presented below:
| 2013 Option Plan | ||||
| December 31, | ||||
| 2013 | ||||
| Expected volatility |
30.0 | % | ||
| Expected dividend yield |
2.5 | % | ||
| Expected term (years) |
6.0 - 6.5 | |||
| Risk-free interest rate |
2.03 - 2.20 | % | ||
| Weighted average grant date fair value |
$ | 4.09 | ||
Since the Company’s common stock did not trade on any exchange at the time the 2013 Plan Options were granted, the expected volatility was based on the volatility of comparable peer banks. The Company has no exercise history related to stock option awards, therefore, the Company uses the binomial tree method to calculate the expected stock option term. The risk-free interest rate is based on the US Treasury yields for the expected term of the instrument.
F-50
Table of Contents
Index to Financial Statements
During the year ended December 31, 2014, the Company recognized $5.5 in expense resulting from the 2013 Plan Options as a Qualified IPO transaction was completed. The total unrecognized compensation cost of $1.9 million for 2013 Option Plan share awards outstanding at December 31, 2014 will be recognized over a weighted average remaining period of 1.98 years. No options have been exercised and the Company has recognized $1.0 million in related income tax benefit for the year ended December 31, 2014.
2013 Incentive Plan – Restricted Stock Units
On December 23, 2013, the Company granted 500,000 2013 RSUs (the “2013 RSUs”) to certain executives of the Company with immediate vesting under the 2013 Incentive Plan. The 2013 RSUs constitute the right to receive from the Company an equal number of shares of Class A Common Stock of the Company (the “RSU Shares”) or, in the sole discretion of the 2013 Incentive Plan administrator, a cash payment equal to the value of the RSU Shares on the date that the RSUs are exercised or settled.
During September 2014, the Company recognized $9.9 million in expense attributable to the grant date fair value of the 2013 RSUs as a Qualified IPO transaction was completed. The 2013 RSU shares were delivered to the recipients on September 5, 2014 and may not be transferred or sold by the recipients until February 6, 2015. The recipients received 243,499 RSU shares at settlement, which 256,501 shares were withheld to satisfy required income tax withholdings.
As of December 31, 2014, there are no remaining shares of restricted stock, restricted stock units, and shares of unrestricted stock awards available for issuance under the 2013 Incentive Plan. The Company has recognized $3.8 million in income tax benefit for the year ended December 31, 2014 related to the 2013 RSUs.
Florida Community Bank, N.A. 401(k) Plan
The Company sponsors the Florida Community Bank, N.A. 401(k) Plan, a tax-qualified, deferred compensation plan (the “401(k) Plan”). Under the terms of the 401(k) Plan eligible employees may contribute a portion of compensation not exceeding the limits set by law. Employees are eligible to participate in the plan after the first month following 90 days of service. Effective January 1, 2012, the 401(k) Plan allowed a matching employer contribution equal to 100% of elective deferrals that do not exceed 2% of compensation. Matching contributions are fully vested after three years of service. Total 401(k) matching employer contribution expense amounted to $404 thousand, $329 thousand and $419 thousand for the years ended December 31, 2014, 2013 and 2012, respectively.
Effective January 1, 2015, the 401(k) Plan allows a matching employer contribution equal to 100% of elective deferrals that do not exceed 3% of compensation.
NOTE 15. BASIC AND DILUTED EARNINGS PER SHARE
Basic EPS is calculated by dividing net income available to common stockholders by the weighted average number of common shares outstanding during the period. Diluted EPS reflect the effect of common stock equivalents, including stock options and unvested shares, calculated using the treasury stock method. Common stock equivalents are excluded from the computation of diluted EPS in periods in which the effect is anti-dilutive.
F-51
Table of Contents
Index to Financial Statements
The following table presents the computation of basic and diluted EPS:
| December 31, | ||||||||||||
| 2014 | 2013 | 2012 | ||||||||||
| (Dollars in thousands, except share and per share data) | ||||||||||||
| Net income (loss) available to common stockholders |
$ | 22,372 | $ | 17,171 | $ | (4,828 | ) | |||||
|
|
|
|
|
|
|
|||||||
| Weighted average number of common shares—basic |
38,054,158 | 36,947,192 | 37,011,598 | |||||||||
| Effect of dilutive securities: |
||||||||||||
| Employee stock-based compensation awards |
204,158 | 1,937 | — | |||||||||
|
|
|
|
|
|
|
|||||||
| Weighted average number of common shares—diluted |
38,258,316 | 36,949,129 | 37,011,598 | |||||||||
|
|
|
|
|
|
|
|||||||
| Basic earnings (loss) per share |
$ | 0.59 | $ | 0.46 | $ | (0.13 | ) | |||||
|
|
|
|
|
|
|
|||||||
| Diluted earnings (loss) per share |
$ | 0.58 | $ | 0.46 | $ | (0.13 | ) | |||||
|
|
|
|
|
|
|
|||||||
| Anti-dilutive warrants, stock options and RSUs |
7,822,029 | 8,565,139 | 8,557,943 | |||||||||
NOTE 16. INCOME TAXES
The components of the expense and benefit for income taxes for the periods presented are as follows:
| December 31, | ||||||||||||
| 2014 | 2013 | 2012 | ||||||||||
| (Dollars in thousands) | ||||||||||||
| Current income tax expense: |
||||||||||||
| Federal |
$ | 18,329 | $ | 6,452 | $ | 1,770 | ||||||
| State |
2,921 | 1,394 | 154 | |||||||||
|
|
|
|
|
|
|
|||||||
| Total current income tax expense |
21,250 | 7,846 | 1,924 | |||||||||
| Deferred income tax expense (benefit): |
||||||||||||
| Federal |
(6,332 | ) | 1,119 | (3,813 | ) | |||||||
| State |
(961 | ) | (93 | ) | (510 | ) | ||||||
|
|
|
|
|
|
|
|||||||
| Total deferred income tax expense (benefit) |
(7,293 | ) | 1,026 | (4,323 | ) | |||||||
|
|
|
|
|
|
|
|||||||
| Total income tax expense (benefit) |
$ | 13,957 | $ | 8,872 | $ | (2,399 | ) | |||||
|
|
|
|
|
|
|
|||||||
A reconciliation of the expected income tax expense or benefit at the statutory federal income tax rate of 35% to the Company’s actual income tax expense or benefit and effective tax rate for the periods presented is as follows:
| December 31, | ||||||||||||||||||||||||
| 2014 | 2013 | 2012 | ||||||||||||||||||||||
| Amount | % | Amount | % | Amount | % | |||||||||||||||||||
| (Dollars in thousands) | ||||||||||||||||||||||||
| Tax expense (benefit) at federal income tax rate |
$ | 12,747 | 35.00 | % | $ | 9,115 | 35.00 | % | $ | (2,529 | ) | -35.00 | % | |||||||||||
| Increase (decrease) resulting from: |
||||||||||||||||||||||||
| Bank owned life insurance |
(2,019 | ) | -5.56 | % | — | 0.00 | % | — | 0.00 | % | ||||||||||||||
| Stock compensation |
2,870 | 7.90 | % | — | 0.00 | % | — | 0.00 | % | |||||||||||||||
| Dividends received deduction |
(1,168 | ) | -3.21 | % | (1,023 | ) | -3.93 | % | — | 0.00 | % | |||||||||||||
| State tax, net of federal benefit |
1,238 | 3.41 | % | 845 | 3.25 | % | (231 | ) | -3.20 | % | ||||||||||||||
| Other |
289 | 0.79 | % | (65 | ) | -0.25 | % | 361 | 5.01 | % | ||||||||||||||
|
|
|
|
|
|
|
|
|
|
|
|
|
|||||||||||||
| Total |
$ | 13,957 | 38.33 | % | $ | 8,872 | 34.07 | % | $ | (2,399 | ) | -33.19 | % | |||||||||||
|
|
|
|
|
|
|
|
|
|
|
|
|
|||||||||||||
F-52
Table of Contents
Index to Financial Statements
Deferred income tax assets and liabilities reflect the tax effect of estimated temporary differences between the carrying amount of assets and liabilities for financial reporting purposes and the amounts used for the same items for income tax reporting purposes.
The significant components of the net deferred tax assets and liabilities for the periods presented are as follows:
| December 31, | ||||||||
| 2014 | 2013 | |||||||
| (Dollars in thousands) | ||||||||
| Deferred tax assets: |
||||||||
| Excess tax basis over carrying value of assets: |
||||||||
| Other real estate owned |
$ | 17,508 | $ | 11,156 | ||||
|
|
|
|
|
|||||
| Total |
17,508 | 11,156 | ||||||
|
|
|
|
|
|||||
| Excess carrying value over tax basis of liabilities: |
||||||||
| Deposits |
147 | 25 | ||||||
| FHLB advances |
— | 71 | ||||||
| Repo Loans |
2,344 | — | ||||||
| Clawback liability |
5,326 | 4,533 | ||||||
|
|
|
|
|
|||||
| Total |
7,817 | 4,629 | ||||||
|
|
|
|
|
|||||
| Net operating loss carry forward: |
||||||||
| Federal |
10,378 | — | ||||||
| State |
1,029 | — | ||||||
|
|
|
|
|
|||||
| Total |
11,407 | — | ||||||
|
|
|
|
|
|||||
| Amortization |
23,569 | 27,858 | ||||||
| Depreciation |
2,119 | — | ||||||
| Unrealized losses on securities available for sale |
— | 989 | ||||||
| Allowance for loan losses |
33,100 | 28,991 | ||||||
| Non-qualified stock options |
6,955 | 5,557 | ||||||
| Other |
3,259 | 1,717 | ||||||
|
|
|
|
|
|||||
| Gross deferred tax assets |
105,734 | 80,897 | ||||||
|
|
|
|
|
|||||
| Valuation allowance |
(9,151 | ) | — | |||||
|
|
|
|
|
|||||
| Gross deferred tax assets, net of valuation allowance |
96,583 | 80,897 | ||||||
|
|
|
|
|
|||||
| Deferred tax liabilities: |
||||||||
| Loans |
(19,072 | ) | (32,693 | ) | ||||
| Restricted securities |
(2,274 | ) | (2,280 | ) | ||||
| Loss-share indemnification |
(24,210 | ) | (34,600 | ) | ||||
| Deferred tax gain |
(2,741 | ) | (5,496 | ) | ||||
| Unrealized gains on securities available for sale |
(410 | ) | — | |||||
| Other |
(435 | ) | — | |||||
|
|
|
|
|
|||||
| Gross deferred tax liabilities |
(49,142 | ) | (75,069 | ) | ||||
|
|
|
|
|
|||||
| Deferred tax assets (liabilities), net |
$ | 47,441 | $ | 5,828 | ||||
|
|
|
|
|
|||||
At December 31, 2014, the Company had deferred tax assets for federal and state net operating losses of $10.4 million and $1.0 million, respectively. The federal and state net operating loss carryforwards are attributable to the acquisition of Great Florida Bank and are subject to an annual limitation. These deferred tax assets for net operating losses will expire in years 2028 through 2034.
The Company records a valuation allowance to reduce its deferred tax assets if, based on the weight of available evidence, both positive and negative, for each respective tax jurisdictions, it is more likely than not that some portion or all of such deferred tax assets will not be realized. The Company’s management believes that it is more likely than not that the benefit from certain federal and state net operating loss carryforwards will not be realized. In recognition of this risk, a valuation allowance of $9.2 million has been provided on the deferred tax assets for federal and state net operating loss carryforwards. If or when recognized, the tax benefits related to any reversal of valuation allowance on deferred tax assets will be recognized as a reduction of income tax expense.
F-53
Table of Contents
Index to Financial Statements
The Company is subject to U.S. federal income tax as well as state income tax of Florida and New York. The Company’s federal income tax returns for 2011 through the current period remain subject to examination and the relevant state statutes vary. The Florida Department of Revenue has notified the Company of its intent to examine income tax returns for the years 2011 through 2013. The Company does not expect an assessment of any significant additional tax.
The Company had no uncertain tax positions at December 31, 2014, 2013 or 2012. The Company’s policy is to classify interest and penalties associated with income taxes within other expenses. The Company did not incur interest and penalties associated with income taxes at December 31, 2014, 2013 or 2012.
NOTE 17. COMMITMENTS AND CONTINGENCIES
The Company issues off-balance sheet financial instruments in connection with its lending activities and to meet the financing needs of its customers. These financial instruments include commitments to fund loans, lines of credit and commercial and standby letters of credit. These commitments expose the Company to varying degrees of credit and market risk which are essentially the same as those involved in extending loans to customers and are subject to the Company’s credit policies. The Company follows the same credit policies in making commitments as it does for instruments recorded on the Company’s consolidated balance sheet. Collateral is obtained based on management’s assessment of the customer’s credit risk. The Company’s exposure to credit loss is represented by the contractual amount of these commitments. As of December 31, 2014 and 2013, the Company’s reserve for unfunded commitments totaled $1.2 million and $593 thousand, respectively. Fees collected on off-balance sheet financial instruments represent the fair value of those commitments and are deferred and amortized over their term, which is typically one year or less. Amounts funded under non-cancelable commitments in effect at the date of acquisition are Covered Assets under the loss-sharing agreements, if applicable, if certain conditions are met.
Financial Instruments Commitments
Unfunded credit extension commitments are as follows:
| December 31, | ||||||||
| 2014 | 2013 | |||||||
| (Dollars in thousands) | ||||||||
| Commitments to fund loans |
$ | 351,369 | $ | 96,359 | ||||
| Unused lines of credit |
199,880 | 168,408 | ||||||
| Commercial and standby letters of credit |
10,223 | 4,838 | ||||||
|
|
|
|
|
|||||
| Total |
$ | 561,472 | $ | 269,605 | ||||
|
|
|
|
|
|||||
Commitments to fund loans:
Commitments to fund loans are agreements to lend funds to customers as long as there is no violation of any condition established in the contract. To accommodate the financial needs of customers, the Company makes commitments under various terms to lend funds to consumers and businesses. Commitments to fund loans generally have fixed expiration dates or other termination clauses and may require payment of a fee. Many of these commitments are expected to expire without being funded and, therefore, the total commitment amounts do not necessarily represent future liquidity requirements.
The Company evaluates each customer’s creditworthiness on a case-by-case basis. The amount of collateral required in connection with an extension of credit is based on management’s credit evaluation of the counterparty.
F-54
Table of Contents
Index to Financial Statements
Unused lines of credit:
Unfunded commitments under lines of credit include commercial, commercial real estate, home equity and consumer lines of credit to existing customers. Some of these commitments may mature without being fully funded.
Commercial and standby letters of credit:
Letters of credit are conditional commitments issued by the Company to guarantee the performance of a customer to a third party. Those letters of credit are primarily issued to support trade transactions or guarantee arrangements. The credit risk involved in issuing letters of credit is essentially the same as that involved in extending loan facilities to customers. The Company generally holds collateral supporting those commitments if deemed necessary.
Other Commitments and Contingencies
Legal Proceedings
The Company, from time to time, is involved as plaintiff or defendant in various legal actions arising in the normal course of business. While the ultimate outcome of any such proceedings cannot be predicted with certainty, it is the opinion of management, based upon advice of legal counsel, that no proceedings exist, either individually or in the aggregate, which, if determined adversely to the Company, would have a material effect on the Company’s consolidated balance sheet, results of operations or cash flows.
A bank-owned asset in Miami-Dade County was foreclosed in 2012, and later discovered to have been illegally infilled over protected wetlands by the prior owner. The bank has been working with Miami-Dade County environmental agencies to address the situation, along with bank environmental attorneys specializing in this area. We are currently evaluating various alternatives for the remediation which we anticipate will be within the reserves that were allocated to this asset.
The SEC is investigating the valuation and accounting treatment by GFB, prior to the Great Florida Acquisition by us, of an office building acquired by GFB in 2009 and the use of appraisals with respect to such valuation. The Bank is cooperating with the investigation. On the date of acquisition by the Bank, based on the Company’s plans and intended use of the acquired office building, the asset was classified as OREO and recorded at fair value, less estimated selling costs. The fair value of the office building was based on a third party real estate appraisal at the date of acquisition. The Company does not believe that the results of the SEC investigation relating to GFB are likely to have a material adverse effect on the financial condition or results of operations of the Company.
F-55
Table of Contents
Index to Financial Statements
NOTE 18. PARENT COMPANY FINANCIAL STATEMENTS
Condensed Balance Sheets of FCB Financial Holdings, Inc. (Parent company only) for the periods presented are as follows:
PARENT COMPANY
CONDENSED BALANCE SHEETS
| December 31, | ||||||||
| 2014 | 2013 | |||||||
| (Dollars in thousands) | ||||||||
| Assets: |
||||||||
| Cash and due from banks |
$ | 30,560 | $ | 138,258 | ||||
| Available for sale securities |
110,169 | 83,664 | ||||||
| Investment in bank subsidiary |
691,489 | 479,841 | ||||||
| Other assets |
21,224 | 14,751 | ||||||
|
|
|
|
|
|||||
| Total assets |
$ | 853,442 | $ | 716,514 | ||||
|
|
|
|
|
|||||
| Liabilities and stockholders’ equity |
||||||||
| Total liabilities |
$ | 2,265 | $ | 400 | ||||
| Stockholders’ equity |
851,177 | 716,114 | ||||||
|
|
|
|
|
|||||
| Total liabilities and stockholders’ equity |
$ | 853,442 | $ | 716,514 | ||||
|
|
|
|
|
|||||
F-56
Table of Contents
Index to Financial Statements
Condensed Statements of Income of FCB Financial Holdings, Inc. (Parent company only) for the periods presented are as follows:
PARENT COMPANY
CONDENSED STATEMENTS OF INCOME
| December 31, | ||||||||||||
| 2014 | 2013 | 2012 | ||||||||||
| (Dollars in thousands) | ||||||||||||
| Income: |
||||||||||||
| Interest and dividends on investment securities |
$ | 4,838 | $ | 4,499 | $ | — | ||||||
| Gain (loss) on investment securities |
(197 | ) | 11 | — | ||||||||
| Other noninterest income |
— | — | 1 | |||||||||
|
|
|
|
|
|
|
|||||||
| Total income |
4,641 | 4,510 | 1 | |||||||||
|
|
|
|
|
|
|
|||||||
| Expense: |
||||||||||||
| Stock-based compensation expense |
13,205 | 362 | 2,081 | |||||||||
| Professional services |
1,243 | 2,211 | 838 | |||||||||
| Directors fees |
3,700 | 2,300 | — | |||||||||
| Warrant expense |
4,122 | — | — | |||||||||
| Insurance expense |
1,451 | 1,252 | 1,381 | |||||||||
| Other noninterest expense |
3,715 | 1,980 | 472 | |||||||||
|
|
|
|
|
|
|
|||||||
| Total expense |
27,436 | 8,105 | 4,772 | |||||||||
|
|
|
|
|
|
|
|||||||
| Income (loss) before income taxes and equity in undistributed income of subsidiaries |
(22,795 | ) | (3,595 | ) | (4,771 | ) | ||||||
| Income tax expense (benefit) |
(8,836 | ) | (2,635 | ) | (1,765 | ) | ||||||
|
|
|
|
|
|
|
|||||||
| Income (loss) before equity in undistributed income of subsidiaries |
(13,959 | ) | (960 | ) | (3,006 | ) | ||||||
| Equity in income of subsidiary |
36,331 | 18,131 | (1,822 | ) | ||||||||
|
|
|
|
|
|
|
|||||||
| Net income (loss) |
$ | 22,372 | $ | 17,171 | $ | (4,828 | ) | |||||
|
|
|
|
|
|
|
|||||||
F-57
Table of Contents
Index to Financial Statements
Condensed Statements of Comprehensive Income of FCB Financial Holdings, Inc. (Parent company only) for periods presented are as follows:
PARENT COMPANY
CONDENSED STATEMENTS OF COMPREHENSIVE INCOME (LOSS)
| December 31, | ||||||||||||
| 2014 | 2013 | 2012 | ||||||||||
| (Dollars in thousands) | ||||||||||||
| Net income (loss) |
$ | 22,372 | $ | 17,171 | $ | (4,828 | ) | |||||
| Other comprehensive income (loss): |
||||||||||||
| Unrealized net holding gains (losses) on investment securities available for sale, net of taxes of $(1,666), $2,942 and $0, respectively |
2,653 | (4,687 | ) | — | ||||||||
| Reclassification adjustment for (gains) losses on investment securities available for sale included in net income, net of taxes of $(443), $(371) and $0, respectively |
705 | 592 | — | |||||||||
|
|
|
|
|
|
|
|||||||
| Total other comprehensive income (loss) |
3,358 | (4,095 | ) | — | ||||||||
|
|
|
|
|
|
|
|||||||
| Total comprehensive income (loss) |
$ | 25,730 | $ | 13,076 | $ | (4,828 | ) | |||||
|
|
|
|
|
|
|
|||||||
F-58
Table of Contents
Index to Financial Statements
Condensed Statements of Cash Flows of FCB Financial Holdings, Inc. (Parent company only) for periods presented are as follows:
PARENT COMPANY
CONDENSED STATEMENTS OF CASH FLOWS
| December 31, | ||||||||||||
| 2014 | 2013 | 2012 | ||||||||||
| (Dollars in thousands) | ||||||||||||
| Cash flows from operating activities: |
||||||||||||
| Net income (loss) |
$ | 22,372 | $ | 17,171 | $ | (4,828 | ) | |||||
| Adjustments to reconcile net income to net cash used in operating activities: |
||||||||||||
| Equity in earnings of subsidiaries |
(36,331 | ) | (18,131 | ) | 1,822 | |||||||
| (Gain) loss on investment securities |
197 | (11 | ) | — | ||||||||
| Stock-based compensation and warrant expense |
17,326 | 362 | 2,081 | |||||||||
| Depreciation of premises and equipment |
2 | 2 | 2 | |||||||||
| Deferred tax expense |
— | (102 | ) | (725 | ) | |||||||
| Net change in operating assets and liabilities: |
||||||||||||
| (Increase)/decrease in due from subsidiaries |
(8,026 | ) | (4,845 | ) | — | |||||||
| Increase/(decrease) in due to subsidiaries |
1,895 | — | — | |||||||||
| Net change in other assets |
(558 | ) | 1,925 | (1,265 | ) | |||||||
| Net change in other liabilities |
(30 | ) | 129 | (308 | ) | |||||||
|
|
|
|
|
|
|
|||||||
| Net cash provided by (used in) operating activities |
(3,153 | ) | (3,500 | ) | (3,221 | ) | ||||||
|
|
|
|
|
|
|
|||||||
| Cash flows from investing activities: |
||||||||||||
| Purchases of investment securities available for sale |
(149,794 | ) | (189,729 | ) | — | |||||||
| Sales of investment securities available for sale |
128,559 | 99,410 | — | |||||||||
| Capital contribution |
(172,000 | ) | (20,000 | ) | — | |||||||
|
|
|
|
|
|
|
|||||||
| Net cash provided by (used in) investing activities |
(193,235 | ) | (110,319 | ) | — | |||||||
|
|
|
|
|
|
|
|||||||
| Cash flows from financing activities: |
||||||||||||
| Proceeds from capital raise, net |
104,475 | — | — | |||||||||
| Deferred costs from capital raise |
(97 | ) | (101 | ) | (464 | ) | ||||||
| Deferred placement fee |
(10,000 | ) | — | — | ||||||||
| Settlement of RSU shares |
(5,688 | ) | — | — | ||||||||
| Repurchase common stock |
— | (18,751 | ) | — | ||||||||
|
|
|
|
|
|
|
|||||||
| Net cash provided by (used in) financing activities |
88,690 | (18,852 | ) | (464 | ) | |||||||
|
|
|
|
|
|
|
|||||||
| Net Change in Cash |
(107,698 | ) | (132,671 | ) | (3,685 | ) | ||||||
| Cash at Beginning of Period |
138,258 | 270,929 | 274,614 | |||||||||
|
|
|
|
|
|
|
|||||||
| Cash at End of Period |
$ | 30,560 | $ | 138,258 | $ | 270,929 | ||||||
|
|
|
|
|
|
|
|||||||
NOTE 19. FAIR VALUE MEASUREMENTS
When determining the fair value measurements for assets and liabilities and the related fair value hierarchy, the Company considers the principal or most advantageous market in which it would transact and considers assumptions that market participants would use when pricing the asset or liability (observable inputs). When possible, the Company looks to active and observable markets to price identical assets or liabilities and when identical assets and liabilities are not traded in active markets, the Company looks to market observable data for similar assets and liabilities. It is the Company’s policy to maximize the use of observable inputs and minimize the use of unobservable inputs. Unobservable inputs are only used to measure fair value to the extent that observable inputs are not available. The need to use unobservable inputs generally results from the lack of market liquidity, resulting in diminished observability of both actual trades and assumptions that would otherwise be available to value these instruments, or the value of the underlying collateral is not market observable. Although third party price indications may be available for a security, limited trading activity would make it difficult to support the observability of these quotations.
Financial Instruments Carried at Fair Value on a Recurring Basis
The following is a description of the valuation methodologies used for financial instruments measured at fair value on a recurring basis, as well as the general classification of each instrument under the valuation hierarchy.
F-59
Table of Contents
Index to Financial Statements
Investment securities available for sale are carried at fair value on a recurring basis. When available, fair value is based on quoted prices for the identical security in an active market and as such, would be classified as Level 1. If quoted market prices are not available, fair values are estimated using quoted prices of securities with similar characteristics, discounted cash flows or matrix pricing models. Investment securities available for sale for which Level 1 valuations are not available are classified as Level 2, and include U.S. Government agencies and sponsored enterprises debt obligations and mortgage-backed securities; state and municipal obligations; asset- backed securities; and corporate debt and other securities. Pricing of these securities is generally spread driven.
Observable inputs that may impact the valuation of these securities include benchmark yield curves, credit spreads, reported trades, dealer quotes, bids, issuer spreads, current rating, historical constant prepayment rates, historical voluntary prepayment rates, structural and waterfall features of individual securities, published collateral data, and for certain securities, historical constant default rates and default severities.
Interest rate derivatives are reported at estimated fair value utilizing Level 2 inputs and are included in other assets and other liabilities and consist of interest rate swaps where there is no significant deterioration in the counterparties (loan customers) credit risk since origination of the interest rate swap. The Company values its interest rate swap positions using market prices provided by a third party which uses primarily observable market inputs. Interest rate derivatives are further described in Note 8 “Derivatives.”
For purposes of potential valuation adjustments to our derivative positions, the Company evaluates the credit risk of its counterparties as well as our own credit risk. Accordingly, the Company has considered factors such as the likelihood of default, expected loss given default, net exposures and remaining contractual life, among other things, in determining if any estimated fair value adjustments related to credit risk are required. The Company reviews counterparty exposure quarterly, and when necessary, appropriate adjustments are made to reflect the exposure.
For the years ended December 31, 2014, 2013 or 2012, the Company has not realized any losses due to a counterparty’s inability to pay any net uncollateralized position. As of December 31, 2014, there were no interest rate derivatives classified as Level 3.
Contingent consideration issued to the FDIC—In conjunction with the 2010 and 2011 acquisitions, the Bank issued contingent consideration to the FDIC in the form of VAIs and EAAs. The estimated fair value of VAIs and EAAs are derived from an estimation of the future fair value of the Company’s stock and a range of potential payment liabilities is determined in accordance with the terms of each agreement. Management assigns a probability to each potential payment liability based on its judgment about the likelihood of the event occurring. This expected value is the basis for estimating the fair value of the contingent consideration. As of December 31, 2014, the Company had no remaining VAIs or EAAs, as the VAIs reached final settlement with the FDIC within the year ended December 31, 2013, and the EAAs reached final settlement with the FDIC on September 29, 2014.
Clawback liability—The fair value of the clawback liability is estimated using a discounted cash flow technique based on projected cash flows related to the resolution of Covered Assets and a discount rate using a risk free rate, plus a premium that takes into account the Company’s credit risk, resulting in Level 3 classification.
F-60
Table of Contents
Index to Financial Statements
The following table presents the assets and liabilities measured at fair value on a recurring basis:
| December 31, 2014 | ||||||||||||||||
| Level 1 | Level 2 | Level 3 | Total | |||||||||||||
| (Dollars in thousands) | ||||||||||||||||
| Assets: |
||||||||||||||||
| U.S. Government agencies and sponsored enterprises obligations |
$ | — | $ | 6,096 | $ | — | $ | 6,096 | ||||||||
| U.S. Government agencies and sponsored enterprises mortgage-backed securities |
— | 501,652 | — | 501,652 | ||||||||||||
| State and municipal obligations |
— | 2,277 | — | 2,277 | ||||||||||||
| Asset-backed securities |
— | 478,201 | — | 478,201 | ||||||||||||
| Corporate bonds and other debt securities |
— | 258,683 | — | 258,683 | ||||||||||||
| Preferred stocks and other equity securities |
23,594 | 88,595 | — | 112,189 | ||||||||||||
| Derivative assets—Interest rate contracts |
— | 14,328 | — | 14,328 | ||||||||||||
|
|
|
|
|
|
|
|
|
|||||||||
| Total |
$ | 23,594 | $ | 1,349,832 | $ | — | $ | 1,373,426 | ||||||||
|
|
|
|
|
|
|
|
|
|||||||||
| Liabilities: |
||||||||||||||||
| Derivative liabilities—Interest rate contracts |
$ | — | $ | 14,328 | $ | — | $ | 14,328 | ||||||||
| Clawback liability |
— | — | 13,846 | 13,846 | ||||||||||||
| EAAs |
— | — | — | — | ||||||||||||
|
|
|
|
|
|
|
|
|
|||||||||
| Total |
$ | — | $ | 14,328 | $ | 13,846 | $ | 28,174 | ||||||||
|
|
|
|
|
|
|
|
|
|||||||||
| December 31, 2013 | ||||||||||||||||
| Level 1 | Level 2 | Level 3 | Total | |||||||||||||
| (Dollars in thousands) | ||||||||||||||||
| Assets: |
||||||||||||||||
| U.S. Government agencies and sponsored enterprises obligations |
$ | — | $ | 51,155 | $ | — | $ | 51,155 | ||||||||
| U.S. Government agencies and sponsored enterprises mortgage-backed securities |
— | 241,638 | — | 241,638 | ||||||||||||
| State and municipal obligations |
— | 2,124 | — | 2,124 | ||||||||||||
| Asset-backed securities |
— | 387,965 | — | 387,965 | ||||||||||||
| Corporate bonds and other debt securities |
— | 379,225 | — | 379,225 | ||||||||||||
| Preferred stocks and other equity securities |
47,113 | 36,551 | — | 83,664 | ||||||||||||
| Derivative assets—Interest rate contracts |
— | 2,660 | — | 2,660 | ||||||||||||
|
|
|
|
|
|
|
|
|
|||||||||
| Total |
$ | 47,113 | $ | 1,101,318 | $ | — | $ | 1,148,431 | ||||||||
|
|
|
|
|
|
|
|
|
|||||||||
| Liabilities: |
||||||||||||||||
| Derivative liabilities—Interest rate contracts |
$ | — | $ | 2,660 | $ | — | $ | 2,660 | ||||||||
| Clawback liability |
— | — | 11,753 | 11,753 | ||||||||||||
| EAAs |
— | — | 1,114 | 1,114 | ||||||||||||
|
|
|
|
|
|
|
|
|
|||||||||
| Total |
$ | — | $ | 2,660 | $ | 12,867 | $ | 15,527 | ||||||||
|
|
|
|
|
|
|
|
|
|||||||||
There were no transfers of financial assets between levels of the fair value hierarchy during the year ended December 31, 2014 or 2013.
F-61
Table of Contents
Index to Financial Statements
The following tables reconcile changes in the fair value of liabilities measured at fair value on a recurring basis and classified in level 3 of the fair value hierarchy for the periods presented:
| December 31, | ||||||||||||||||||||||||
| 2014 | 2013 | 2012 | ||||||||||||||||||||||
| Clawback Liability |
EAAs | Clawback Liability |
VAIs and EAAs |
Clawback Liability |
VAIs and EAAs |
|||||||||||||||||||
| (Dollars in thousands) | ||||||||||||||||||||||||
| Balance at beginnning of period |
$ | 11,753 | $ | 1,114 | $ | 11,966 | $ | 1,235 | $ | 11,439 | $ | 1,054 | ||||||||||||
| Losses (gains) included in other noninterest expenses |
2,093 | 1,466 | (213 | ) | 482 | 527 | 321 | |||||||||||||||||
| Final VAI settlement on PB |
— | — | — | — | — | (140 | ) | |||||||||||||||||
| Final VAI settlement on SSCB |
— | — | — | (52 | ) | — | — | |||||||||||||||||
| Final VAI settlement on FNBCF |
— | — | — | (281 | ) | — | — | |||||||||||||||||
| Final VAI settlement on FPB |
— | — | — | (270 | ) | — | — | |||||||||||||||||
| Final EAA settlement on FCB |
— | (1,458 | ) | — | — | — | — | |||||||||||||||||
| Final EAA settlement on PAB |
— | (1,122 | ) | — | — | — | — | |||||||||||||||||
|
|
|
|
|
|
|
|
|
|
|
|
|
|||||||||||||
| Balance at end of period |
$ | 13,846 | $ | — | $ | 11,753 | $ | 1,114 | $ | 11,966 | $ | 1,235 | ||||||||||||
|
|
|
|
|
|
|
|
|
|
|
|
|
|||||||||||||
The inputs used to determine estimated fair value of loans include market conditions, loan term, underlying collateral characteristics and discount rates. The inputs used to determine fair value of OREO include market conditions, estimated marketing period or holding period, underlying collateral characteristics and discount rates. The inputs used to determine fair value of the FDIC clawback liability include servicing cost and discount rates.
For the years ended December 31, 2014 and 2013, there was not a change in the methods and significant assumptions used to estimate fair value.
The following table shows significant unobservable inputs used in the fair value measurement of level 3 assets and liabilities:
| Level 3 Asset |
Fair value | Valuation Technique |
Unobservable Inputs |
Range | ||||||
| (Dollars in Thousands) | ||||||||||
| Nonrecurring: |
||||||||||
| Loans |
$ | 3,959,771 | Third party appraisals and discounted cash flows | Collateral discounts and discount rates | 0% - 100% | |||||
| Other real estate owned |
74,527 | Third party appraisals | Collateral discounts and estimated cost to sell | 10% | ||||||
| Recurring: |
||||||||||
| FDIC clawback liability |
$ | 13,846 | Discounted cash flows | Servicing cost and discount rates | 4.50% - 6.41% | |||||
Financial Instruments Measured at Fair Value on a Non-Recurring Basis
Following is a description of the methodologies used to estimate the fair values of assets and liabilities measured at fair value on a non-recurring basis, and the level within the fair value hierarchy in which those measurements are typically classified.
Impaired loans and OREO:
The carrying amount of collateral dependent impaired loans is typically based on the fair value of the underlying collateral, which may be real estate or other business assets, less estimated costs to sell. The carrying value of OREO is initially measured based on the fair value, less estimated cost to sell, of the real estate acquired in foreclosure and subsequently adjusted to the lower of cost or estimated fair value, less estimated cost to sell. Fair values of real estate collateral are typically based on real estate appraisals which utilize market and income valuation techniques incorporating both observable and unobservable inputs. When current appraisals are not available, the Company may use brokers’ price opinions, home price indices, or other available information about changes in real estate market conditions to adjust the latest appraised value available. These adjustments to appraised values may be subjective and involve significant management judgment. The fair value of collateral consisting of other business assets is generally based on appraisals that use market approaches to valuation, incorporating primarily unobservable inputs. Fair value measurements related to collateral dependent impaired loans and OREO are classified within level 3 of the fair value hierarchy.
F-62
Table of Contents
Index to Financial Statements
The following tables provide information about certain assets measured at fair value on a non-recurring basis:
| December 31, | ||||||||
| 2014 | 2013 | |||||||
| (Dollars in thousands) | ||||||||
| Assets that are still held (Level 3): |
||||||||
| Impaired loans |
$ | 4,754 | $ | 5,709 | ||||
| Foreclosed real estate |
74,527 | 34,682 | ||||||
| December 31, | ||||||||||||
| 2014 | 2013 | 2012 | ||||||||||
| (Dollars in thousands) | ||||||||||||
| Negative valuation adjustments: |
||||||||||||
| Impaired loans |
$ | 174 | $ | 149 | $ | 538 | ||||||
| Foreclosed real estate |
1,829 | 2,047 | 5,238 | |||||||||
Impairment charges resulting from the non-recurring changes in fair value of underlying collateral of impaired loans are included in the provision for loan losses in the accompanying statement of income. Impairment charges resulting from the non-recurring changes in fair value of OREO are included in other real estate and acquired assets resolution expenses in the accompanying statement of income.
The carrying amounts and estimated fair values, as well as the level within the fair value hierarchy, of the Company’s financial instruments are as follows:
| December 31, 2014 |
Carrying Value |
Fair Value |
Level 1 | Level 2 | Level 3 | |||||||||||||||
| (Dollars in thousands) | ||||||||||||||||||||
| Financial Assets: |
||||||||||||||||||||
| Cash and cash equivalents |
$ | 107,085 | $ | 107,085 | $ | 107,085 | $ | — | $ | — | ||||||||||
| Held to maturity securities |
— | — | — | — | — | |||||||||||||||
| Available for sale securities |
1,359,098 | 1,359,098 | 23,594 | 1,335,504 | — | |||||||||||||||
| FHLB and other bank stock |
66,891 | 66,891 | — | 66,891 | — | |||||||||||||||
| Loans, net |
3,906,710 | 3,959,771 | — | — | 3,959,771 | |||||||||||||||
| Loans held for sale |
707 | 707 | — | 707 | — | |||||||||||||||
| Loss share indemnification asset |
63,168 | 27,976 | — | — | 27,976 | |||||||||||||||
| Due from FDIC |
1,735 | 1,735 | — | 1,735 | — | |||||||||||||||
| Bank-owned life insurance |
139,829 | 139,829 | — | 139,829 | — | |||||||||||||||
| Derivative assets—Interest rate contracts |
14,328 | 14,328 | — | 14,328 | — | |||||||||||||||
| Financial Liabilities: |
||||||||||||||||||||
| Deposits |
$ | 3,978,535 | $ | 3,977,629 | $ | — | $ | 3,977,629 | $ | — | ||||||||||
| Advances from the FHLB and other borrowings |
1,067,981 | 1,066,764 | — | 1,066,764 | — | |||||||||||||||
| Derivative liabilities—Interest rate contracts |
14,328 | 14,328 | — | 14,328 | — | |||||||||||||||
| Clawback liability |
13,846 | 13,846 | — | — | 13,846 | |||||||||||||||
| EAAs |
— | — | — | — | — | |||||||||||||||
F-63
Table of Contents
Index to Financial Statements
| December 31, 2013 |
Carrying Value |
Fair Value |
Level 1 | Level 2 | Level 3 | |||||||||||||||
| (Dollars in thousands) | ||||||||||||||||||||
| Financial Assets: |
||||||||||||||||||||
| Cash and cash equivalents |
$ | 239,217 | $ | 239,217 | $ | 239,217 | $ | — | $ | — | ||||||||||
| Held to maturity securities |
365 | 365 | — | 365 | — | |||||||||||||||
| Available for sale securities |
1,145,771 | 1,145,771 | 47,113 | 1,098,658 | — | |||||||||||||||
| FHLB and other bank stock |
36,187 | 36,187 | — | 36,187 | — | |||||||||||||||
| Loans, net |
2,244,051 | 2,290,564 | — | — | 2,290,564 | |||||||||||||||
| Loss share indemnification asset |
87,229 | 53,157 | — | — | 53,157 | |||||||||||||||
| Due from FDIC |
3,659 | 3,659 | — | 3,659 | — | |||||||||||||||
| Bank-owned life insurance |
75,257 | 75,257 | — | 75,257 | — | |||||||||||||||
| Derivative assets—Interest rate contracts |
2,660 | 2,660 | — | 2,660 | — | |||||||||||||||
| Financial Liabilities: |
||||||||||||||||||||
| Deposits |
$ | 2,793,533 | $ | 2,797,081 | $ | — | $ | 2,797,081 | $ | — | ||||||||||
| Advances from the FHLB and other borrowings |
435,866 | 438,493 | — | 438,493 | — | |||||||||||||||
| Derivative liabilities—Interest rate contracts |
2,660 | 2,660 | — | 2,660 | — | |||||||||||||||
| Clawback liability |
11,753 | 11,753 | — | — | 11,753 | |||||||||||||||
| EAAs |
1,114 | 1,114 | — | — | 1,114 | |||||||||||||||
The following methods and assumptions were used to estimate the fair value of each class of financial instruments.
Certain financial instruments are carried at amounts that approximate fair value due to their short-term nature and generally negligible credit risk. Financial instruments for which fair value approximates the carrying amount at December 31, 2014 and December 31, 2013, include cash and cash equivalents and due from FDIC.
FHLB and other bank stock:
FHLB and other bank stock can be liquidated only by redemption by the issuer, as there is no market for these securities. These securities are carried at par, which has historically represented the redemption price and is therefore considered to approximate fair value.
Loans:
Fair values for loans are based on a discounted cash flow methodology that considered various factors, including the type of loan and related collateral, classification status, fixed or variable interest rate, term of loan and whether or not the loan was amortizing and current discount rates. Loans were grouped together according to similar characteristics and were treated in the aggregate when applying various valuation techniques. The discount rates used for loans are based on current market rates for new originations of comparable credit risk and include adjustments for liquidity concerns. The ALL is considered a reasonable estimate of the required adjustment to fair value to reflect the impact of credit risk. This estimate may not represent an exit value as defined in ASC 820.
Loans Held for Sale:
Fair values of mortgage loans held for sale are based on commitments on hand from investors or prevailing market prices.
Loss Share Indemnification Asset:
The fair values of the loss share indemnification asset is estimated using a discounted cash flow technique based on projected cash flows related to the resolution of Covered Assets and a discount rate using a risk free rate, plus a premium to take into account the Company’s credit risk, that incorporates the uncertainty related to the amounts and timing of the cash flows and other liquidity concerns as well as the counterparties credit risk.
F-64
Table of Contents
Index to Financial Statements
Due from FDIC:
The due from FDIC represents claims submitted to the Federal Deposit Insurance Corporation for reimbursement for which the Company expects to receive payment within 90 days. Due to their short term nature, the carrying amount of these instruments approximates the estimated fair value.
Bank-owned life insurance:
The Company holds life insurance policies on certain officers. The carrying value of these policies approximates fair value as it is based on the cash surrender value adjusted for other charges or amounts due that are probable at settlement.
Deposits:
The fair value of demand deposits, savings accounts and money market deposits is the amount payable on demand at the reporting date. The fair value of fixed-maturity certificates of deposit is estimated using discounted cash flow analysis and using the rates currently offered for deposits of similar remaining maturities.
Advances from the FHLB and Other Borrowings:
The fair value of advances from the FHLB and other borrowings are estimated by discounting the future cash flows using the current rate at which similar borrowings with similar remaining maturities could be obtained.
VAIs and EAAs:
The estimated fair value of EAAs are derived from an estimation of the future fair value of the Company’s stock and a range of potential payment liability is determined in accordance with the terms of each agreement. As of December 31, 2014, the Company had no remaining VAIs or EAAs, as the VAIs reached final settlement with the FDIC within the year ended December 31, 2013, and the EAAs reached final settlement with the FDIC on September 29, 2014.
NOTE 20. SUBSEQUENT EVENTS
On March 4, 2015, the Bank entered into an agreement with the FDIC to terminate all loss sharing agreements which were entered into in 2010 and 2011 in conjunction with the Bank’s acquisition of substantially all of the assets (“covered assets”) and assumption of substantially all of the liabilities of six failed banks in FDIC-assisted acquisitions. Under the early termination, all rights and obligations of the Bank and the FDIC under the loss share agreements, including the clawback provisions, have been eliminated.
The Bank paid the FDIC $14.8 million as consideration for the early termination to settle its obligation under the FDIC Clawback Liability. The early termination will be recorded in the Bank’s financial statements by removing the FDIC Indemnification Asset Receivable, the FDIC Clawback liability and recording an estimated one-time charge of $40 million after-tax ($66 million pre-tax).
NOTE 21. QUARTERLY FINANCIAL DATA (UNAUDITED)
The summary quarterly financial information set forth below for each of the last eight quarters has been derived from our unaudited interim consolidated financial statements and other financial information. The summary historical quarterly financial information includes all adjustments consisting of normal recurring accruals that we consider necessary for a fair presentation of the financial position and the results of operations for these periods.
We consummated the acquisition of GFB on January 31, 2014. Accordingly, our operating results for certain of the historical periods presented below are not comparable and may not be predictive of future results.
F-65
Table of Contents
Index to Financial Statements
The information below is only a summary and should be read in conjunction with “Management’s Discussion and Analysis of Financial Condition and Results of Operations” and the consolidated historical financial statements and the related notes thereto included in this Form 10-K filing.
| Quarters Ended December 31, 2014 | ||||||||||||||||
| Q4 | Q3 | Q2 | Q1 | |||||||||||||
| (Dollars in thousands, except per share data) | ||||||||||||||||
| Selected Income Statement data: |
||||||||||||||||
| Interest income |
$ | 56,404 | $ | 53,652 | $ | 48,452 | $ | 44,918 | ||||||||
| Interest expense |
6,625 | 7,757 | 7,299 | 6,573 | ||||||||||||
|
|
|
|
|
|
|
|
|
|||||||||
| Net interest income |
49,779 | 45,895 | 41,153 | 38,345 | ||||||||||||
| Provision for loan losses |
3,112 | 2,805 | 3,236 | 1,090 | ||||||||||||
|
|
|
|
|
|
|
|
|
|||||||||
| Net interest income after provision for loan losses |
46,667 | 43,090 | 37,917 | 37,255 | ||||||||||||
| Noninterest income |
5,444 | 2,350 | 6,690 | 2,548 | ||||||||||||
| Noninterest expense |
31,463 | 48,959 | 30,744 | 34,466 | ||||||||||||
|
|
|
|
|
|
|
|
|
|||||||||
| Income (loss) before income tax expense (benefit) |
20,648 | (3,519 | ) | 13,863 | 5,337 | |||||||||||
| Income tax expense (benefit) |
7,548 | (97 | ) | 4,697 | 1,809 | |||||||||||
|
|
|
|
|
|
|
|
|
|||||||||
| Net income (loss) |
$ | 13,100 | $ | (3,422 | ) | $ | 9,166 | $ | 3,528 | |||||||
|
|
|
|
|
|
|
|
|
|||||||||
| Earnings (loss) per share: |
||||||||||||||||
| Basic |
$ | 0.32 | $ | (0.09 | ) | $ | 0.26 | $ | 0.10 | |||||||
| Diluted |
$ | 0.31 | $ | (0.09 | ) | $ | 0.26 | $ | 0.10 | |||||||
| Quarters Ended December 31, 2013 | ||||||||||||||||
| Q4 | Q3 | Q2 | Q1 | |||||||||||||
| (Dollars in thousands, except per share data) | ||||||||||||||||
| Selected Income Statement data: |
||||||||||||||||
| Interest income |
$ | 39,132 | $ | 35,520 | $ | 36,154 | $ | 34,457 | ||||||||
| Interest expense |
5,951 | 5,937 | 5,682 | 5,370 | ||||||||||||
|
|
|
|
|
|
|
|
|
|||||||||
| Net interest income |
33,181 | 29,583 | 30,472 | 29,087 | ||||||||||||
| Provision for loan losses |
1,976 | (631 | ) | 473 | 1,096 | |||||||||||
|
|
|
|
|
|
|
|
|
|||||||||
| Net interest income after provision for loan losses |
31,205 | 30,214 | 29,999 | 27,991 | ||||||||||||
| Noninterest income |
3,595 | 1,003 | 3,660 | 2,684 | ||||||||||||
| Noninterest expense |
26,066 | 24,260 | 27,455 | 26,527 | ||||||||||||
|
|
|
|
|
|
|
|
|
|||||||||
| Income (loss) before income tax expense (benefit) |
8,734 | 6,957 | 6,204 | 4,148 | ||||||||||||
| Income tax expense (benefit) |
2,809 | 2,486 | 1,927 | 1,650 | ||||||||||||
|
|
|
|
|
|
|
|
|
|||||||||
| Net income (loss) |
$ | 5,925 | $ | 4,471 | $ | 4,277 | $ | 2,498 | ||||||||
|
|
|
|
|
|
|
|
|
|||||||||
| Earnings (loss) per share: |
||||||||||||||||
| Basic |
$ | 0.16 | $ | 0.12 | $ | 0.12 | $ | 0.07 | ||||||||
| Diluted |
$ | 0.16 | $ | 0.12 | $ | 0.12 | $ | 0.07 | ||||||||
F-66
Table of Contents
Index to Financial Statements
| Item 9. | Changes in and Disagreements with Accountants on Accounting and Financial Disclosure |
None.
| Item 9A. | Controls and Procedures |
Evaluation of Disclosure Controls and Procedures
Internal control over financial reporting is defined in Rule 13a-5(f) promulgated under the Securities Exchange Act of 1934 as a process designed by, or under the supervision of, the Company’s principal executive and principal financial officer. Under the supervision of the Company’s Chief Executive Officer and Chief Financial Officer, the Company has evaluated the effectiveness of the design and operation of controls and procedures and based upon this evaluation, the Chief Executive Officer and Chief Financial Officer have concluded that, as of the end of the period covered by this report, the Company’s disclosure controls and procedures were effective.
Because of inherent limitations, internal control over financial reporting may not prevent or detect misstatements. Projections of effectiveness to future periods are subject to the risk that controls may become inadequate because of changes in conditions, or that the degree of compliance with policies and procedures may deteriorate. During the most recent fiscal quarter, there was no change made in the Company’s internal controls over financial reporting that has materially affected, or is reasonably likely to materially affect, the Company’s internal control over financial reporting.
| Item 9B. | Other Information |
None.
| Item 10. | Directors, Executive Officers and Corporate Governance |
The information required by Item 401 of Regulation S-K regarding directors is incorporated herein by this reference to our Proxy Statement to be filed with the Securities and Exchange Commission within 120 days after our fiscal year end.
The information required by Item 405, Item 407(c)(3), Item 407(d)(4) and Item 407(d)(5) of Regulation S-K is incorporated herein by this reference to our Proxy Statement to be filed with the Securities and Exchange Commission within 120 days after our fiscal year end.
In accordance with Item 406 of Regulation S-K, we have adopted a code of ethics that applies to certain Company executives. The code of ethics is posted on our website at www.floridacommunitybank.com under “Investor Relations.”
| Item 11. | Executive Compensation |
The information required by Item 402, Item 407(e)(4) and Item 407(e)(5) of Regulation S-K is incorporated herein by this reference to our Proxy Statement to be filed with the Securities and Exchange Commission within 120 days after our fiscal year end.
| Item 12. | Security Ownership of Certain Beneficial Owners and Management and Related Stockholder Matters |
The information required by Item 201(d) and Item 403 of Regulation S-K is incorporated herein by this reference to our Proxy Statement to be filed with the Securities and Exchange Commission within 120 days after our fiscal year end.
83
Table of Contents
Index to Financial Statements
| Item 13. | Certain Relationships and Related Transactions and Director Independence |
The information required by Item 404 and Item 407(a) of Regulation S-K is incorporated herein by this reference to our Proxy Statement to be filed with the Securities and Exchange Commission within 120 days after our fiscal year end.
| Item 14. | Principal Accountant Fees and Services |
The information required by Item 9(e) of Schedule 14A regarding audit fees, audit committee pre-approval policies and related information is incorporated herein by this reference to our Proxy Statement to be filed with the Securities and Exchange Commission within 120 days after our fiscal year end.
| Item 15. | Exhibits and Financial Statement Schedule |
| (a) 1. | Financial Statements |
The consolidated financial statements, notes thereto and independent auditors’ report thereon, filed as part hereof, are listed in Item 8.
| 2. | Financial Statement Schedules |
Financial Statement schedules have been omitted as the required information is not applicable or the required information has been incorporated in the consolidated financial statements and related notes incorporated by reference herein.
| (b) | Exhibits |
See Index of Exhibits on page 87.
84
Table of Contents
Index to Financial Statements
Pursuant to the requirements of Section 13 or 15(d) of the Securities Exchange Act of 1934, the registrant has caused this report to be signed on its behalf by the undersigned, duly authorized.
| FCB FINANCIAL HOLDINGS, INC. | ||||||
| Date: March 16, 2015 | /s/ Kent S. Ellert | |||||
| Kent S. Ellert | ||||||
| President and Chief Executive Officer | ||||||
| (Principal Executive Officer) | ||||||
| Date: March 16, 2015 | /s/ Paul D. Burner | |||||
| Paul D. Burner | ||||||
| Executive Vice President and Chief Financial Officer | ||||||
| (Principal Financial Officer and | ||||||
| Principal Accounting Officer) | ||||||
85
Table of Contents
Index to Financial Statements
Pursuant to the requirements of the Securities Exchange Act of 1934, this report has been signed by the following persons on behalf of the registrant and in the capacities and on the dates indicated:
| Name |
Title |
Date | ||
| /s/ Kent S. Ellert Kent S. Ellert |
President and Chief Executive Officer (Principal Executive Officer) |
March 16, 2015 | ||
| /s/ Paul D. Burner Paul D. Burner |
Executive Vice President and Chief Financial Officer (Principal Financial Officer and Principal Accounting Officer) |
March 16, 2015 | ||
| /s/ Vincent S. Tese Vincent S. Tese |
Director | March 16, 2015 | ||
| /s/ Leslie J. Lieberman Leslie J. Lieberman |
Director | March 16, 2015 | ||
| /s/ Stuart I. Oran Stuart I. Oran |
Director | March 16, 2015 | ||
| /s/ Alan Bernikow Alan Bernikow |
Director | March 16, 2015 | ||
| /s/ Thomas E. Constance Thomas E. Constance |
Director | March 16, 2015 | ||
| /s/ Howard R. Curd Howard R. Curd |
Director | March 16, 2015 | ||
| /s/ Daniel M. Healy Daniel M. Healy |
Director | March 16, 2015 | ||
| /s/ Gerald Luterman Gerald Luterman |
Director | March 16, 2015 | ||
| /s/ William L. Mack William L. Mack |
Director | March 16, 2015 | ||
| /s/ Paul Anthony Novelly Paul Anthony Novelly |
Director | March 16, 2015 | ||
| /s/ Frederic Salerno Frederic Salerno |
Director | March 16, 2015 | ||
86
Table of Contents
Index to Financial Statements
EXHIBIT INDEX
| 2.1 | Agreement and Plan of Merger by and between Florida Community Bank, N.A. and Great Florida Bank, dated as of July 16, 2013 (incorporated by reference to Exhibit 2.1 of the Form S-1 Registration Statement of the Company filed with the SEC on June 20, 2014 (Registration No. 333-196935)). | |
| 3.1 | Restated Certificate of Incorporation (incorporated by reference to Exhibit 3.1 of the Form S-1/A Registration Statement of the Company filed with the SEC on July 14, 2014 (Registration No. 333-196935)). | |
| 3.3 | Bylaws, as amended (incorporated by reference to Exhibit 3.3 of the Form S-1 Registration Statement of the Company filed with the SEC on June 20, 2014 (Registration No. 333-196935)). | |
| 4.1 | Form of Class A Common Stock Certificate (incorporated by reference to Exhibit 4.1 of the Form S-1/A Registration Statement of the Company filed with the SEC on July 14, 2014 (Registration No. 333-196935)). | |
| 4.2 | Registration Rights Agreement, dated November 12, 2009, by and among Bond Street Holdings LLC, Bond Street Investors LLC and Deutsche Bank Securities Inc. (incorporated by reference to Exhibit 4.3 of the Form S-1 Registration Statement of the Company filed with the SEC on June 20, 2014 (Registration No. 333-196935)). | |
| 4.3 | Form of Registration Rights Agreement, dated as of August 13, 2010, by and among Bond Street Holdings LLC and the other signatories thereto (incorporated by reference to Exhibit 4.4 of the Form S-1 Registration Statement of the Company filed with the SEC on June 20, 2014 (Registration No. 333-196935)). | |
| 4.4 | Amendment to Registration Rights Agreement, dated July 16, 2014, by and among FCB Financial Holdings, Inc., Bond Street Investors LLC and Deutsche Bank Securities Inc. (incorporated by reference to Exhibit 4.4 of the Form S-1/A Registration Statement of the Company filed with the SEC on July 22, 2014 (Registration No. 333-196935)). | |
| 4.5 | Form of Amendment to Registration Rights Agreement, dated as of July 16, 2014 by and among FCB Financial Holdings, Inc. and the other signatories thereto (incorporated by reference to Exhibit 4.5 of the Form S-1/A Registration Statement of the Company filed with the SEC on July 22, 2014 (Registration No. 333-196935)). | |
| 10.1 | 2009 Stock Option Plan (incorporated by reference to Exhibit 10.1 of the Form S-1 Registration Statement of the Company filed with the SEC on June 20, 2014 (Registration No. 333-196935)). | |
| 10.2 | 2013 Stock Incentive Plan (incorporated by reference to Exhibit 10.2 of the Form S-1 Registration Statement of the Company filed with the SEC on June 20, 2014 (Registration No. 333-196935)). | |
| 10.3 | Agreement and Plan of Merger by and between Florida Community Bank, N.A. and Great Florida Bank, dated as of July 16, 2013 (incorporated by reference to Exhibit 2.1 of the Form S-1 Registration Statement of the Company filed with the SEC on June 20, 2014 (Registration No. 333-196935)). | |
| 10.4 | Form of 2009 Warrant Agreement, as amended (incorporated by reference to Exhibit 10.4 of the Form S-1/A Registration Statement of the Company filed with the SEC on July 22, 2014 (Registration No. 333-196935)). | |
| 10.5 | Form of RSU Agreement (incorporated by reference to Exhibit 10.5 of the Form S-1/A Registration Statement of the Company filed with the SEC on July 22, 2014 (Registration No. 333-196935)). | |
| 10.6 | Form of Director and Officer Indemnification Agreement (incorporated by reference to Exhibit 10.19 of the Form S-1/A Registration Statement of the Company filed with the SEC on July 22, 2014 (Registration No. 333-196935)). | |
| 10.7 | Amended and Restated Employment Agreement, dated as of January 10, 2011, between the Bank and Kent Ellert (incorporated by reference to Exhibit 10.4 of the Form S-1 Registration Statement of the Company filed with the SEC on June 20, 2014 (Registration No. 333-196935)). | |
| 10.8 | First Amendment to Amended and Restated Employment Agreement, dated January 25, 2013, between the Bank and Kent Ellert (incorporated by reference to Exhibit 10.5 of the Form S-1 Registration Statement of the Company filed with the SEC on June 20, 2014 (Registration No. 333-196935)). | |
| 10.9 | Second Amendment to Amended and Restated Employment Agreement, dated October 11, 2013, between the Bank and Kent Ellert (incorporated by reference to Exhibit 10.6 of the Form S-1 Registration Statement of the Company filed with the SEC on June 20, 2014 (Registration No. 333-196935)). | |
87
Table of Contents
Index to Financial Statements
| 10.10 | Employment Agreement, dated July 18, 2014, between the Bank and Kent Ellert (incorporated by reference to Exhibit 10.9 of the Form S-1/A Registration Statement of the Company filed with the SEC on July 22, 2014 (Registration No. 333-196935)). | |
| 10.11 | Employment Agreement, dated July 18, 2014, between the Bank and Vincent Tese (incorporated by reference to Exhibit 10.10 of the Form S-1/A Registration Statement of the Company filed with the SEC on July 22, 2014 (Registration No. 333-196935)). | |
| 10.12 | Employment Agreement, dated July 18, 2014, between the Bank and Les Lieberman (incorporated by reference to Exhibit 10.11 of the Form S-1/A Registration Statement of the Company filed with the SEC on July 22, 2014 (Registration No. 333-196935)). | |
| 10.13 | Purchase and Assumption Agreement, dated as of January 22, 2010, among FDIC, Receiver of Premier American Bank, Miami, Florida, FDIC and the Bank (incorporated by reference to Exhibit 10.7 of the Form S-1 Registration Statement of the Company filed with the SEC on June 20, 2014 (Registration No. 333-196935)). | |
| 10.14 | Purchase and Assumption Agreement, dated as of January 29, 2010, among FDIC, Receiver of Florida Community Bank, Immokalee, Florida, FDIC and the Bank (incorporated by reference to Exhibit 10.8 of the Form S-1 Registration Statement of the Company filed with the SEC on June 20, 2014 (Registration No. 333-196935)). | |
| 10.15 | Purchase and Assumption Agreement, dated as of June 25, 2010, among FDIC, Receiver of Peninsula Bank, Englewood, Florida, FDIC and the Bank (incorporated by reference to Exhibit 10.9 of the Form S-1 Registration Statement of the Company filed with the SEC on June 20, 2014 (Registration No. 333-196935)). | |
| 10.16 | Purchase and Assumption Agreement, dated as of February 11, 2011, among FDIC, Receiver of Sunshine State Community Bank, Port Orange, Florida, FDIC and the Bank (incorporated by reference to Exhibit 10.10 of the Form S-1 Registration Statement of the Company filed with the SEC on June 20, 2014 (Registration No. 333-196935)). | |
| 10.17 | Purchase and Assumption Agreement, dated as of April 29, 2011, among FDIC, Receiver of First National Bank of Central Florida, Winter Park, Florida, FDIC and the Bank (incorporated by reference to Exhibit 10.11 of the Form S-1 Registration Statement of the Company filed with the SEC on June 20, 2014 (Registration No. 333-196935)). | |
| 10.18 | Purchase and Assumption Agreement, dated as of April 29, 2011, among FDIC, Receiver of Cortez Community Bank, Brooksville, Florida, FDIC and the Bank (incorporated by reference to Exhibit 10.12 of the Form S-1 Registration Statement of the Company filed with the SEC on June 20, 2014 (Registration No. 333-196935)). | |
| 10.19 | Purchase and Assumption Agreement, dated as of May 6, 2011, among FDIC, Receiver of Coastal Bank, Cocoa Beach, Florida, FDIC and the Bank (incorporated by reference to Exhibit 10.13 of the Form S-1 Registration Statement of the Company filed with the SEC on June 20, 2014 (Registration No. 333-196935)). | |
| 10.20 | Purchase and Assumption Agreement, dated as of July 15, 2011, among FDIC, Receiver of First Peoples Bank, Port St. Lucie, Florida, FDIC and the Bank (incorporated by reference to Exhibit 10.18 of the Form S-1 Registration Statement of the Company filed with the SEC on June 20, 2014 (Registration No. 333-196935)). | |
| 10.21 | Equity Appreciation Agreement, dated as of January 22, 2010, between the Company and FDIC, Receiver of Premier American Bank, Miami, Florida (incorporated by reference to Exhibit 10.15 of the Form S-1 Registration Statement of the Company filed with the SEC on June 20, 2014 (Registration No. 333-196935)). | |
| 10.22 | Equity Appreciation Agreement, dated as of January 29, 2010, between the Company and FDIC, Receiver of Florida Community Bank, Immokalee, Florida (incorporated by reference to Exhibit 10.16 of the Form S-1 Registration Statement of the Company filed with the SEC on June 20, 2014 (Registration No. 333-196935)). | |
| 10.23 | FDIC Order, dated as of January 22, 2010 (incorporated by reference to Exhibit 10.17 of the Form S-1 Registration Statement of the Company filed with the SEC on June 20, 2014 (Registration No. 333-196935)). | |
| 10.24 | Termination Agreement among Federal Deposit Insurance Corporation, as Receiver of Premier American Bank, Miami, Florida; Receiver of Florida Community Bank, Immokalee, Florida; Receiver of Peninsula Bank, Englewood, Florida; Receiver of Cortez Community Bank, Brooksville, Florida; Receiver of First National Bank of Central Florida, Winter Park, Florida; and Receiver of Coastal Bank, Cocoa Beach, Florida, Federal Deposit Insurance Corporation and Florida Community Bank, N.A. (incorporated by reference to Exhibit 10.24 of the Form 8-K filed with the SEC on March 4, 2015. | |
| 11 | Statemement re computation of earnings per share (Filed herewith as Note 15 to the consolidated financial statements) | |
88
Table of Contents
Index to Financial Statements
| 21 | Subsidiaries of the Registrant (Filed herewith) | |
| 23.1 | Consent of Grant Thornton LLP. (Filed herewith) | |
| 31.1 | Rule 13a-14(a) Certification of Chief Executive Officer of the Company in accordance with Section 302 of the Sarbanes-Oxley Act of 2002 (Filed herewith) | |
| 31.2 | Rule 13a-14(a) Certification of Chief Financial Officer of the Company in accordance with Section 302 of the Sarbanes-Oxley Act of 2002 (Filed herewith) | |
| 32.1 | Section 1350 Certification of Chief Executive Officer of the Company in accordance with Section 906 of the Sarbanes-Oxley Act of 2002 (Filed herewith) | |
| 32.2 | Section 1350 Certification of Chief Financial Officer of the Company in accordance with Section 906 of the Sarbanes-Oxley Act of 2002 (Filed herewith) | |
| 101.INS | XBRL Instance Document | |
| 101.SCH | XBRL Taxonomy Extension Schema | |
| 101.CAL | XBRL Taxonomy Extension Calculation Linkbase | |
| 101.LAB | XBRL Taxonomy Extension Label Linkbase | |
| 101.PRE | XBRL Taxonomy Extension Presentation Linkbase | |
89