Attached files
| file | filename |
|---|---|
| 8-K - 8-K - VWR Corp | d888412d8k.htm |
 Barclays 2015
Global Healthcare Conference
March 11, 2015
VWR Corporation
Exhibit 99.1 |
 Forward-Looking Statement
Non-GAAP Measures and Other Definitions
Safe Harbor
2
To evaluate our performance, we monitor a number of key indicators at the consolidated level
and, in certain cases, at the segment level. As appropriate, we supplement our results
of operations determined in accordance with GAAP with certain non-GAAP financial measurements that we believe are useful to
investors, creditors and others in assessing our performance. These measurements should not be
considered in isolation or as a substitute for reported GAAP results because they may
include or exclude certain items as compared to similar GAAP-based measurements, and such measurements may not be
comparable to similarly-titled measurements reported by other companies. Rather, these
measurements should be considered as an additional way of viewing aspects of our
operations that provide a more complete understanding of our business. We strongly encourage readers to review our consolidated
financial statements included elsewhere herein and in publicly filed reports in their entirety
and not rely solely on any one, single financial measurement. See “Non-GAAP
Measures” in our publicly filed reports. This presentation contains statements about future events and expectations that constitute
forward-looking statements. Forward-looking statements are based on our
beliefs, assumptions and expectations of our future financial and operating performance and growth plans, taking into account the information
currently available to us. These statements are not statements of historical fact.
Forward-looking statements involve risks and uncertainties that may cause our
actual results to differ materially from the expectations of future results we express or imply in any forward-looking statements and you should not place
undue reliance on such statements. Factors that could contribute to these differences
include, but are not limited to, the factors described in "Risk Factors" in
VWR’s Annual Report on Form 10-K. Words such as “anticipates”,
“believes”, “continues”, “estimates”, “expects”, “goal”, “objectives”, “intends”, “may”,
“opportunity”, “plans”, “potential”, “near-term”,
“long-term”, “projections”, “assumptions”, “projects”, “guidance”, “forecasts”, “outlook”, “target”, “trends”,
“should”, “could”, “would”, “will” and similar
expressions are intended to identify such forward-looking statements. We qualify any forward-looking
statements entirely by these cautionary factors. We assume no obligation to update or
revise any forward-looking statements for any reason, or to update the reasons
actual results could differ materially from those anticipated in these forward-looking statements, even if new information becomes available in the
future. Comparisons of results for current and any prior periods are not intended to
express any future trends or indications of future performance, unless expressed as
such, and should only be viewed as historical data. |
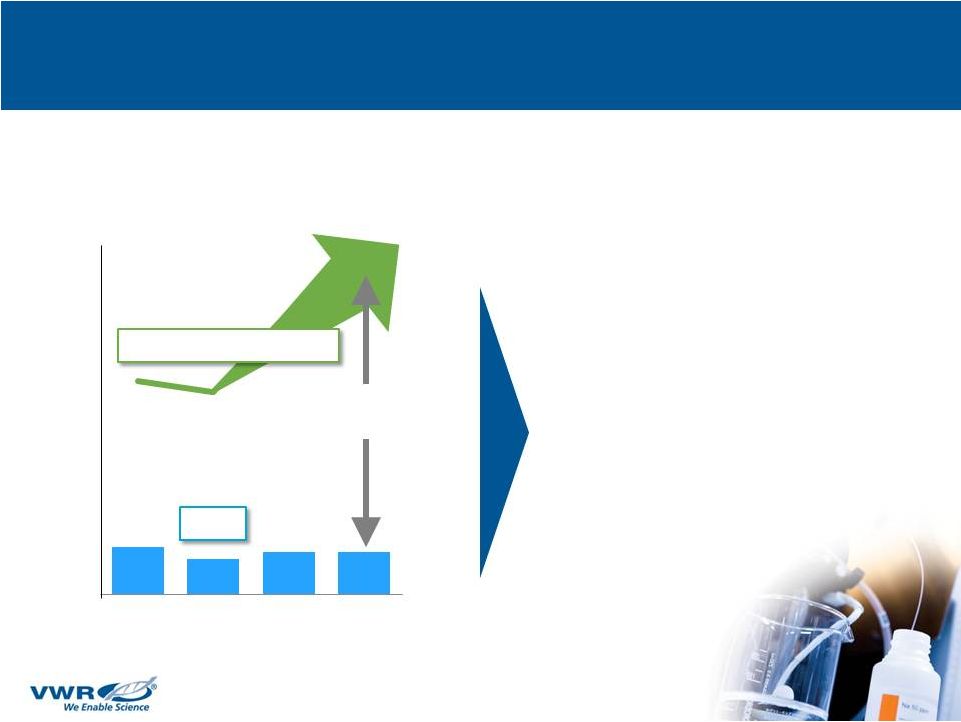
 VWR:
Outperforming the Industry Positioned in
large, growing
global market
Independent
solutions
provider
Revenue
growth vs.
industry
Annual Adjusted
EPS growth
next
3-5 years
$49B
#1
EMEA-APAC
#2 The
Americas
Targeting
~2X
faster
Targeting
Double-
digit
3 |
 AGENDA
VWR:
Outperforming the Industry
Global player with solid performance record
Positioned in attractive markets
Unique value proposition
Resilient business model
1
2
3
4
Targeting
Adjusted
EPS growth
next 3-5 years:
Double-digit
Targeting
Adjusted
EPS growth
next 3-5 years:
Double-digit
Powerful growth drivers
5
4 |
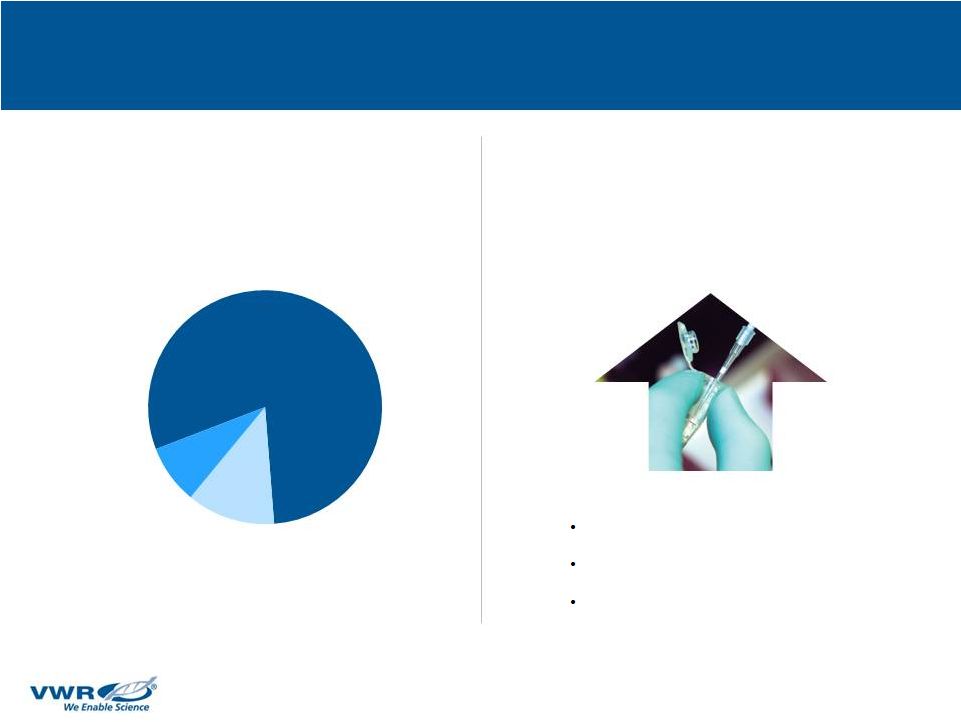
 VWR AT A
GLANCE Leading Global Provider of Laboratory
Products and Services
Americas
EMEA-APAC
44%
56%
2014 Segment
Revenue Breakdown
2014 Revenues
Market cap
IPO
Acquisitions since 2007
Employees worldwide
$4.4B
$3.3B
Oct. 2014
37
8,500+
5 |
 VWR:
A Profile
of Leadership
6
Global Scale
Market Leader
•
~9% share of
$49B global market
•
#1 in Europe
•
#2 in The Americas
Broad
Product Range
•
Over 1M SKUs
•
~4,500 laboratory
suppliers
•
17,000 orders per day
•
Over 160 facilities
•
34 countries
•
~120,000 customers
9% |
 Consistent Record
of Growth and Margin Expansion 7
Revenues
Adjusted EBITDA
Adjusted EBITDA
Margin
$3.3B
$4.4B
2006
2014
4%
CAGR
8%
CAGR
$235M
$449M
2006
2014
7.2%
10.3%
2006
2014
+310
bps |
 EMEA-APAC
Segment: A Key Growth Driver 8
Leading market position
Integrated IT platform and
distribution network
Record of seamless
tuck-in acquisitions
Long-standing customer
relationships
Strengths
Performance Highlights
2006 to 2014
Revenue growth
Adj. EBITDA growth
Adj. EBITDA margin
in 2014
Adj. EBITDA margin
expansion since 2006
7%
CAGR
14%
CAGR
11.8%
460 bps |
 Americas
Segment: Replicating Success of EMEA-APAC, Driving Improved Results
9
Clear Evidence Performance
is Improving
Upgraded IT infrastructure
Shifted go-to-market
strategy
New state of the art
distribution facility
Upgraded e-commerce
Strengthened
management team
Initiatives/
Investments
Q/Q Organic Revenue Growth
-2.8%
-2.8%
-2.7%
+0.6%
+3.4%
+7.2%
3Q13
4Q13
1Q14
2Q14
3Q14
4Q14 |
 AGENDA
VWR: Outperforming the Industry
10
Global player with solid performance record
Positioned in attractive markets
Unique value proposition
Resilient business model
1
2
3
4
Powerful growth drivers
5
Targeting
Adjusted
EPS growth
next 3-5 years:
Double-digit |
 Positioned in
Large, Growing Market 11
$49B VWR
Addressable Market*
Steadily
Growing
$39B
Lab services
Bioprocess
chemicals and
consumables
~2% annually
$4B
$6B
Lab products
*Source: Frost & Sullivan’s 2014 Annual Report: Forecast and Analysis of the
Global Market for Laboratory Products (published October 2014), Market Size
of Global and U.S. Laboratory Services Market and Laboratory Chemicals Market Clarification
(commissioned July 2014) and US and Global Validation of the Bioprocess Chemicals and
Consumables Market (commissioned August 2014) Increased R&D
Growing regulations
Globalization of customers |
 Competitive
Landscape: VWR is Uniquely Positioned in Highly Fragmented Lab Products Market
12
Fragmented market with
many smaller niche companies
Regional
Global
Footprint
Narrow
Broad
Product
Range |
 Successful
Acquisition Record – 37 Since 2007
13
Focus of Acquisitions
to Date
Product growth
(Self-Manufacturing
Capacity)
Tuck-ins
Geographic
expansion
32%
22%
46%
•
Disciplined approach
–
hurdle rate of 15%
•
Invested $550M on
acquisitions since 2007
•
Adds >1% to revenue
growth per annum |
 AGENDA
VWR: Outperforming the Industry
14
Targeting
Adjusted
EPS growth
next 3-5 years:
Double-digit
1
Global player with solid performance record
2
Positioned in attractive markets
3
Unique value proposition
4
Resilient business model
5
Powerful growth drivers |
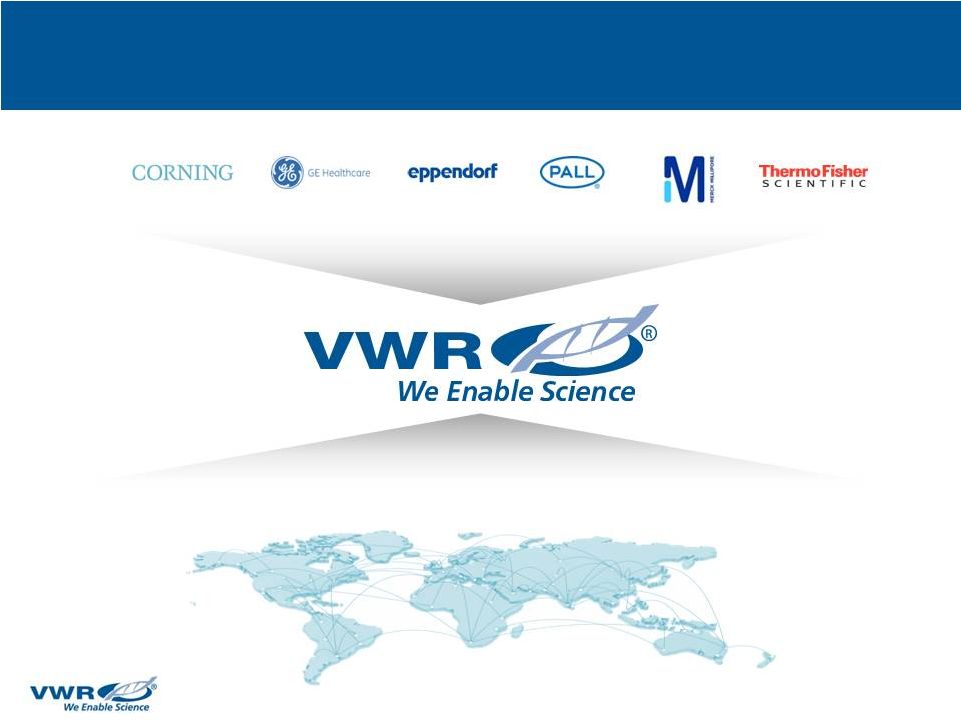 15
Leading Independent Global Provider of Laboratory Products,
Services and Solutions to the Lab Market
~4,500
lab suppliers
Branded and private label products and services
~120,000
customers
Highly diversified -
No single customer >4% of sales |
 Our Unique Value
Proposition 16
Superior Product
Choice
Operational
Excellence
Differentiated
Services
•
Unbiased
•
Broadest range
•
Logistical expertise
•
Supply chain partner
•
Customized solutions
•
People and technology |
 Customized and
Differentiated Strategy 17
Examples |
 Key Offerings
that Further Differentiate VWR 18
Offering
Customer Advantages
Impact on VWR
Private
Label Products
~15%
of revenues
•
Greater choice at lower
price points
•
Complement branded
suppliers
•
8-10% Revenue growth
•
Attractive margin profile
Chemical
Manufacturing
~5%
of revenues
•
Customized product
solutions
–
biochemicals
–
buffers
–
reagents
•
Strong revenue and
margin profile
•
Mostly direct –
avoid
channel conflict
•
$6B bioprocess chemical
and consumable market
growing DD |
 VWR
Lab Services
Key Offerings that Further Differentiate VWR
19
Offering
Customer Advantages
Impact on VWR
3%
of revenues, but affects
customers representing
~25% of revenues
•
Allows labs to outsource
services such as
–
facility and inventory
management
–
lab maintenance processes
•
An "Onsite CRO" concept
•
Lower costs, improved
productivity
•
Deepens relationships
-
~900 onsite associates
-
~240 customer sites
•
Powerful differentiator
•
More value-add for our
customers
CATALYST |
 VWR:
Outperforming the Industry 20
Global player with solid performance record
Positioned in attractive markets
Unique value proposition
Resilient business model
1
2
3
4
Powerful growth drivers
5
Targeting
Adjusted
EPS growth
next 3-5 years:
Double-digit |
 Resilient and
Attractive Business Model 21
High recurring, stable
revenues ~80%
Expanding Adjusted
EBITDA margins
Growing cash flow
Double-digit Adjusted
EPS growth
1
2
4
3
–
for deleveraging
and acquisitions |
 Powerful Cash
Flow Engine 22
Growing Free
Cash Flow…
Fueling Growth
in Earnings
CapEx
•
Deleveraging balance sheet
–
Debt to Adjusted EBITDA
down from 6.4x a year ago
to 4.4x at year end 2014
•
Accelerating growth with
acquisitions
–
$50-$75M annually
Cash flow from operations
Growing
free cash flow
2013
2014
2015
2016 |
 A
G
E
N
D
A
VWR:
The Industry Growth Leader
23
Global player with solid performance record
Positioned in attractive markets
Unique value proposition
Resilient business model
1
2
3
4
Powerful growth drivers
5
Targeting
Adjusted
EPS growth
next 3-5 years:
Double-digit |
 Multiple Factors
Driving Sustained Growth 24
Market
Growth
~2%
Double-digit
Adjusted EPS
Growth
VWR Earnings
Growth
Faster
organic growth
Acquisitions
OI Margin
expansion
Deleveraging
•
Private label
•
Custom manuf.
•
VWR
•
Average
$50M-$75M
annually
•
Lower
interest costs
•
Globalize
Best
Practices
CATALYST |
 Double-
digit
growth
Naturally
delevering
~2X
faster
Long Term Financial Targets
25
Revenue
Growth vs.
Industry
Operating
Income
Margin
Adjusted EPS
Growth
Growing Free
Cash Flow
~40+ bps
Per year
expansion
next
2-3 years |
 Deleveraging
Continues…. Net Debt / Adjusted EBITDA
26
9.3x
8.4x
7.7x
7.1x
6.4x
6.9x
6.4x
4.4x
Dec-07
Dec-08
Dec-09
Dec-10
Dec-11
Dec-12
Dec-13
Dec-14 |
 Full Year 2014
– Performance Highlights
EMEA-APAC continues to outperform the market
Americas: Turnaround confirmed and organic earnings growth established
Expanded Adjusted EBITDA Margin 30 bps to 10.3%
Delevered & executed on our acquisition strategy
Adjusted EPS of $1.21 increased 29% YoY
A successful IPO
27 |
 4Q14
– Performance Highlights
•
Organic revenue growth of 5.9%
•
Americas organic growth 7.2% and
EMEA-APAC organic growth 4.4%
•
Solid cash flow quarter, operating
cash flow of $104M
•
Adjusted EBITDA $119.5M, up 1% YoY
28
Revenue ($M)
Adjusted EPS
+4%
+16%
$1,059
$1,102
4Q13
4Q14
$0.37
$0.43
4Q13
4Q14 |
 FY15
Guidance 29
2014
Actual
SBC
Adj.
2014
Adj.
2015 Guidance Range
Low High
Revenue
$4,375
$4,375
$4,244
$4,310
Adjusted EBITDA
$449
–
$449
$456
$463
Adjusted EPS
$1.21
$(0.01)
$1.20
$1.42
$1.50
Note:
2015 Adj. EPS guidance includes share-based compensation estimated at $5 to $6 million
(pretax). 2015 Adj. EBITDA guidance excludes share-based compensation.
($ millions, except EPS) |
 VWR:
The Industry Growth Leader
30
Global player with solid performance record
Positioned in attractive markets
Unique value proposition
Resilient business model
1
2
3
4
Powerful growth drivers
5
Targeting
Adjusted
EPS growth
next 3-5 years:
Double-digit |