Attached files
| file | filename |
|---|---|
| EX-12.1 - EXHIBIT 12.1 - TerraVia Holdings, Inc. | solazyme10kex121.htm |
| EX-23.1 - EXHIBIT 23.1 - TerraVia Holdings, Inc. | solazyme10kex231.htm |
| EX-21.1 - EXHIBIT 21.1 - TerraVia Holdings, Inc. | solazyme10kex211.htm |
| EX-32.1 - EXHIBIT 32.1 - TerraVia Holdings, Inc. | solazyme10kex321.htm |
| EX-31.2 - EXHIBIT 31.2 - TerraVia Holdings, Inc. | solazyme10kex312.htm |
| EX-10.36 - EXHIBIT 10.36 - TerraVia Holdings, Inc. | ex1036131210coleemployment.htm |
| EX-10.37 - EXHIBIT 10.37 - TerraVia Holdings, Inc. | ex1037141008coleprofession.htm |
| EXCEL - IDEA: XBRL DOCUMENT - TerraVia Holdings, Inc. | Financial_Report.xls |
| EX-31.1 - EXHIBIT 31.1 - TerraVia Holdings, Inc. | solazyme10kex311.htm |
UNITED STATES
SECURITIES AND EXCHANGE COMMISSION
Washington, D.C. 20549
FORM 10-K
(Mark One)
x | ANNUAL REPORT PURSUANT TO SECTION 13 OR 15(d) OF THE SECURITIES EXCHANGE ACT OF 1934 |
For the fiscal year ended December 31, 2014
OR
¨ | TRANSITION REPORT PURSUANT TO SECTION 13 OR 15(d) OF THE SECURITIES EXCHANGE ACT OF 1934 |
For the Transition Period from to
Commission File Number: 001-35189
Solazyme, Inc.
(Exact name of Registrant as specified in its charter)
Delaware | 33-1077078 | |
(State or Other Jurisdiction of Incorporation or Organization) | (I.R.S. Employer Identification Number) | |
Solazyme, Inc.
225 Gateway Boulevard
South San Francisco, CA 94080
(650) 780-4777
(Address and telephone number principal executive offices)
Securities Registered Pursuant to Section 12(b) of the Exchange Act:
Title of Each Class: | Name of Each Exchange on which Registered: | |
Common Stock, par value $0.001 per share | The NASDAQ Global Select Market | |
Securities Registered Pursuant to Section 12(g) of the Exchange Act: None.
Indicate by check mark if the registrant is a well-known seasoned issuer, as defined in Rule 405 of the Securities Act. Yes ¨ No x
Indicate by check mark if the registrant is not required to file reports pursuant to Section 13 or Section 15(d) of the Exchange Act. Yes ¨ No x
Indicate by check mark whether the registrant (1) has filed all reports required to be filed by Section 13 or 15(d) of the Exchange Act during the preceding 12 months (or for such shorter period that the registrant was required to file such reports), and (2) has been subject to such filing requirements for the past 90 days. Yes x No ¨
Indicate by check mark whether the registrant has submitted electronically and posted on its corporate Web site, if any, every Interactive Data File required to be submitted and posted pursuant to Rule 405 of Regulation S-T (§232.405 of this chapter) during the preceding 12 months (or for such shorter period that the registrant was required to submit and post such files). Yes x No ¨
Indicate by check mark if disclosure of delinquent filers pursuant to Item 405 of Regulation S-K is not contained herein, and will not be contained, to the best of registrant’s knowledge, in definitive proxy or information statements incorporated by reference in Part III of this Form 10-K or any amendment to this Form 10-K. x
Indicate by check mark whether the registrant is a large accelerated filer, an accelerated filer, a non-accelerated filer or a smaller reporting company. See definitions of “large accelerated filer,” “accelerated filer” and “smaller reporting company” in Rule 12b-2 of the Exchange Act. (Check one.
Large accelerated filer | x | Accelerated filer | ¨ | |||
Non-accelerated filer | ¨ (Do not check if a smaller reporting company) | Smaller reporting company | ¨ | |||
Indicate by check mark whether the registrant is a shell company (as defined in Rule 12b-2 of the Exchange Act.): Yes ¨ No x
The aggregate market value of the registrant’s common stock, $0.001 par value, held by non-affiliates of the registrant as of June 30, 2014, the last business day of our second fiscal quarter, was approximately $852.2 million based on the closing sale price as reported on the Nasdaq Global Select Market.
As of February 20, 2015, there were 79,598,087 shares of the registrant’s common stock, par value $0.001 per share, outstanding.
Documents Incorporated by Reference
Portions of the registrant’s definitive proxy statement for its 2015 Annual Meeting of Stockholders are incorporated by reference into Part III hereof.
Solazyme, Inc.
Annual Report on Form 10-K
For The Year Ended December 31, 2014
INDEX
PART I | ||||
Item 1 | — | |||
Item 1A | — | |||
Item 1B | — | |||
Item 2 | — | |||
Item 3 | — | |||
Item 4 | — | |||
PART II | ||||
Item 5 | — | |||
Item 6 | — | |||
Item 7 | — | |||
Item 7A | — | |||
Item 8 | — | |||
Item 9 | — | |||
Item 9A | — | |||
Item 9B | — | |||
PART III | ||||
Item 10 | — | |||
Item 11 | — | |||
Item 12 | — | |||
Item 13 | — | |||
Item 14 | — | |||
PART IV | ||||
Item 15 | — | |||
Our registered trademarks include Solazyme®, Soladiesel®, Soladiesel®BD, Soladiesel®RD, Solajet®, Algenist® and Alguronic Acid®. This Annual Report on Form 10-K also contains trademarks, service marks and trade names owned by us as well as others.
2
The following discussion and analysis should be read together with our audited consolidated financial statements and the related notes and other financial information appearing elsewhere in this Annual Report on Form 10-K. This Annual Report on Form 10-K contains forward-looking statements reflecting our current expectations and involves risks and uncertainties. In some cases, you can identify forward-looking statements by terminology such as “may,” “will,” “should,” “expect,” “plan,” “anticipate,” “believe,” “estimate,” “predict,” “intend,” “potential” or “continue” or the negative of these terms or other comparable terminology. For example, statements regarding our expectations as to future financial performance, expense levels, future manufacturing capacity, addressable market size, target average selling prices and liquidity sources are forward-looking statements. Our actual results and the timing of events may differ materially from those discussed in our forward-looking statements as a result of various factors, including those discussed below and those discussed in the section entitled “Risk Factors” included in this Annual Report on Form 10-K and in our other filings with the Securities and Exchange Commission (SEC).
PART I
Item 1. Business
Our Company
Starting with microalgae, we create new, sustainable, high-performance products. Our proprietary technology uses highly optimized microalgae in an industrial fermentation process to transform a range of abundant plant-based sugars into high-value triglyceride oils and other bioproducts. These include renewable oils and ingredients that serve as the foundation for healthier foods; better home, personal care and industrial products; and more sustainable fuels and chemicals.
Our main commercial focus is to sell high-value oils, encapsulated oils and whole algal powdered products to companies that use them as intermediates and ingredients. We have also built a consumer-focused personal care business that commercializes branded products formulated with our various proprietary ingredients.
Our renewable products can replace or enhance products derived from the world’s three existing sources of oils: petroleum, plants, and animal fats. We tailor the composition of our oils and other bioproducts to address specific customer requirements, offering superior performance characteristics and value via a renewable pathway. For example, our renewable products can replace or improve intermediates and ingredients in major markets served by conventional oils as well as specialty markets. As another example, one of our first powdered food ingredient can replace dairy fats, oils and eggs in food products providing food and beverage customers with an improved nutrition profile, a reduction in allergens, and improved taste and texture.
Our high-value renewable oils can enable our customers to improve product performance, reduce processing costs and/or improve their products’ sustainability profile. In addition, our encapsulated oils can provide a unique delivery mechanism for targeted lubrication, increasing performance, reducing overall costs and improving the environmental footprint. Many of our products are drop-in replacements and can be used in the existing production, refining, finishing and distribution infrastructure in our target markets. Because our products deliver superior value to end customers by addressing real market needs in a novel and relevant way, we anticipate the average selling prices (ASPs) of our products will capture the enhanced value that results from heightened performance.
Market Need
Growing global demand for both triglyceride and petroleum oils coupled with a number of substantive issues are driving the need to find alternative oil sources. Specifically, petroleum is a finite, non-renewable resource that is becoming increasingly difficult to extract, raising local and geopolitical energy security and environmental concerns. Meanwhile, plant-based oils present other challenges, including production and cost variances related to unpredictable weather, and forest and habitat destruction resulting from expanded planting.
Higher industrial output, urbanization, improved living standards, and changing diets are driving increased demand for food, transportation, personal care items, plastics and other oil-based products. The ability to convert carbohydrate-rich plant materials into unique high-value oils and materials offers a potential solution to the growing global demand for oil and oil-based products.
As a result of these market drivers, companies are aggressively seeking new sources of oils that have greater price stability than petroleum and other conventional oils, and are also looking for new sources of oils with improved characteristics versus
3
conventional oils. Finally, initiatives focused on fulfillment of corporate sustainability objectives and government mandates support an increased use of renewable oils.
Despite the growing need to find replacement oils for petroleum based products, market demand for petroleum oils continues to grow. Further, with the advent of horizontal drilling and improved recovery technologies, companies are looking for novel drilling fluids that improve the speed of drilling and reduce downtime from operational issues (e.g. non-productive time from equipment damage) to help facilitate the development of challenging basins economically. As easily accessible resources have become less prevalent, drilling engineers are requiring technology to improve horizontal drilling techniques to efficiently develop unconventional sources of hydrocarbons. Our encapsulated oils provide a solution that can increase the performance, lower costs and reduce the environmental impact in this area.
As more countries adopt a western-style diet, the problems of the obesity epidemic continue to impact the health of many global populations. Faced with increasing pressure to improve the nutritional profile of their products from consumers, governments and activist groups, food and beverage manufacturers are looking for new food ingredient solutions that will better enable reductions in saturated fat, calories, and cholesterol without sacrificing performance, taste, or cost metrics.
The continuous improvement of living standards globally also drives a critical trend toward increased consumption of proteins. Many Western consumers consider protein consumption to be an effective strategy for weight and energy management. The environmental impact of addressing the increased demand for protein is important. Animal-derived proteins have a significant impact on land use, deforestation and greenhouse gas emissions. To address this demand for protein, food and beverage manufacturers are looking for new efficiently-produced, vegan sources of protein.
Our Strategy
We intend to be a global market leader in the design and production of renewable oils and related bioproducts from microalgae. Our products supplement, replace or enhance conventional products derived from petroleum, plant or animal sources. The principal elements of our strategy are:
• | Prioritize market entry based on unit economics and capital requirements. We have been working for years to bring large-scale manufacturing of our products online. In advance of this, we initiated commercialization efforts several years ago by launching low-volume, high-margin personal care products and nutritional ingredients that could be produced on an economically attractive basis via tolled manufacturing. In January 2014, we commenced commercial operations at both Archer Daniels Midland Company's (ADM) Clinton, Iowa facility (Clinton Facility), and the downstream companion facility operated by American Natural Processors, Inc. (ANP) in Galva, Iowa (Clinton/Galva Facilities). In May 2014, our joint venture with Bunge Global Innovation, LLC (together with its affiliates, Bunge) (Solazyme Bunge JV) produced its first run of products at the Solazyme Bunge Renewable Oils plant in Brazil (the Solazyme Bunge JV Plant). We are now expanding commercial production and sales of intermediate and ingredient products across the (1) Industrial Products (2) Food Products, and (3) Personal Care Products markets. We intend to focus first on higher-value specialty products that generate attractive margins in our target markets while we scale operations. |
• | Execute on our customer-driven approach to technology and product development. We focus our innovation efforts on creating a broad suite of high performance products that meet defined market needs. We intend to continue to work closely with our partners and customers to understand their requirements and design products to specifically address their needs. It is our intent to provide both branded and unbranded products to our three primary target markets: (1) Industrial applications including specialty chemicals, fuels, personal care products and branded oilfield drilling lubricant, Encapso™; (2) Food applications including branded protein and lipid powders, AlgaVia™, and food oils; and (3) Consumer Product applications including our branded personal care line, Algenist®, and other products to be developed. |
• | Enter into sales agreements and additional partnership agreements to advance commercialization efforts. We are currently engaged in development activities with multiple partners. In addition to funding development work and performing application testing, we expect that our partners will enter into long-term commercial supply agreements with us. |
• | Execute on our capital-efficient strategy to access feedstock and manufacturing capacity. We expect to scale production in a capital-efficient manner by entering agreements whereby our partners will invest capital and operational resources in building manufacturing capacity, while providing us access to feedstock. By |
4
working with us, we expect that partners can improve the return they realize on their feedstock and diversify their business beyond their current product portfolios, enabling potentially higher margins and reducing price volatility. In addition to our work with existing partners, we are actively evaluating a range of possible new partners and feedstock sources.
Our Technology
We create renewable oils and bioproducts that mirror or enhance the chemical composition of conventional oils used in the marketplace today. Until now, the physical and chemical characteristics of conventional oils have been dictated by oil compositions found in nature. Our platform technology enables us to design and produce a variety of novel Tailored™ oils that cannot be achieved through blending of existing oils alone. Additionally, with our screening and fermentation capabilities, we are able to identify native microalgae strains and produce them efficiently at scale. Through our ability to tailor the composition of our products or expand the production of native microalgae strains, we can create first of kind products that exhibit unique benefits not available in the marketplace today.
Our technology platform combines a highly efficient and productive oil-producing organism, microalgae, for the creation of oils with scalable and cost-effective standard industrial fermentation processes in order to deliver high value, cost effective, Tailored™ oils and materials.
Our ability to tailor the composition and properties of oil is based on our unique and proprietary technology and instructed by a deep understanding of triglyceride chemistry. The functionality of oils that are formulated into everyday products is derived from differences in the chemistry of triglycerides.
Triglyceride molecules are comprised of three fatty acids attached to a glycerol backbone.
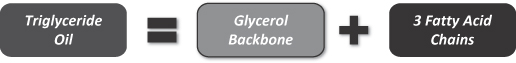
We have pioneered an industrial biotechnology platform that allows us to optimize oil profiles by tailoring the structures of the oil molecules. First, we can specify the carbon chain lengths of the fatty acid chains. Second, we can alter the saturation level of a fatty acid chain, which refers to the existence, or lack thereof, and number of double bonds between carbon molecules within the chain. Third, we can determine the position of specific fatty acid chains on the glycerol backbone. In addition, we can add specific functional groups, such as hydroxyl groups, to the fatty acid chains, which further alters the performance characteristics of the triglyceride oils.
5
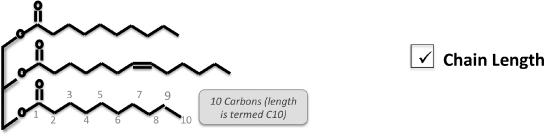
In this diagram, the three fatty acid chains are shown extending from the glycerol backbone of a triglyceride molecule. Our proprietary technology allows us to alter the number of carbons in each fatty acid chain.
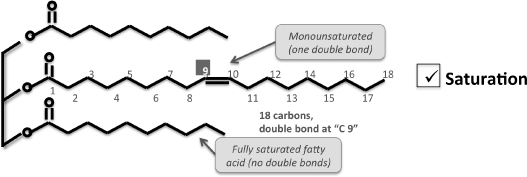
This diagram demonstrates the use of our technology to alter the saturation levels within the fatty acid chains. Saturation is a critical determinant of many of the physical properties of oils.
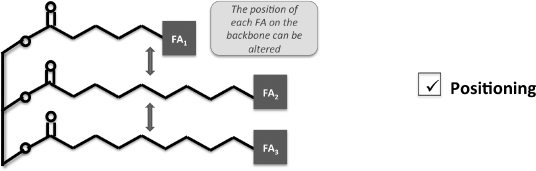
This diagram demonstrates the use of our technology to change the position of the fatty acids on the glycerol backbone, which also affects the physical characteristics of the oil.
Microalgae have long been recognized as organisms capable of rapid and efficient oil production under certain conditions. Oleaginous microalgae evolved over billions of years, synthesizing large amounts of oil rapidly when exposed to the right environment. Our proprietary microalgae are heterotrophic. They grow without the need for sunlight by consuming sugars derived from plants that have already harnessed the sun’s energy. Our process is therefore a form of “indirect photosynthesis.” When grown in the absence of light, our microalgae are highly efficient at converting the sun’s energy embedded within the plant sugars (feedstocks) into valuable end products.
Our proprietary, highly productive microalgae produce and accumulate oil that routinely constitutes over 80% of the dry cell weight. Typical wild microalgae, in contrast, usually have only 5-20% oil content. We produce three main product types: products where the oil is retained within the polysaccharide cell walls (our Encapso™ and AlgaVia™ product lines exhibit these characteristics); oils that are extracted from the microalgae cell to produce oils; and residual materials remaining after oil is extracted from the microalgae cells. These residual materials, Algal Meal Products (AMPs), are being commercialized in a range of product applications that use the protein, fiber and other compounds found in the cell wall and algal bodies of the microalgae.
6
We rely on multiple microalgae strains including: 1) natural, 2) classically improved, and 3) targeted recombinant strains. The key components of our industrial biotechnology platform are strain screening, classical strain improvement, strain optimization through targeted gene recombination, fermentation process development, and downstream process development. Our selection process is iterative; as strains progress through classical strain improvement and targeted recombinant strain optimization they feed back into the strain screening program, re-emerging for additional rounds of strain improvement, strain optimization, and process development.
Our Biotechnology Platform
Our process begins by selecting one of our microalgae strains to produce a specific oil or whole algal product. Then, through industrial fermentation, the microalgae convert sugars into the desired end product. Fermentation helps accelerate microalgae’s natural biological process, allowing us to produce large amounts of a desired product in a matter of days. After fermentation, the microalgae go through a few final steps depending on the product, such as drying or standard mechanical oil extraction, before being shipped to customer in a variety of end markets. Our biotechnology platform enables us to produce a broad array of products and oil profiles with the same infrastructure.
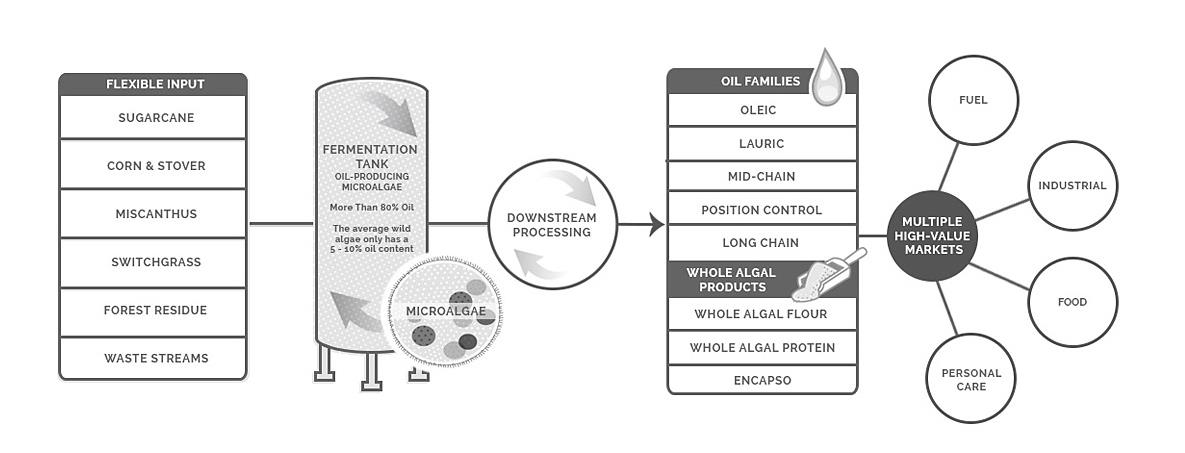
Our platform is feedstock flexible and can utilize a variety of renewable plant-based sugars. We currently use sugarcane-based sucrose and corn-based dextrose as our two primary feedstock sources. Our technology can also support sugar from other sustainable biomass sources including cellulosics, which we believe will represent an important alternative feedstock in the future.
The controlled environment of the standard industrial fermentation tanks minimizes contamination and allows us to tightly regulate acidity, temperature and other key parameters. Our core competencies include (1) identifying, isolating and further optimizing strains of microalgae to achieve high cell densities, high yields converting sugar to product and high time-based productivity rates compared to other alternatives, and (2) tailoring the oil outputs to meet specific market needs.
Some of our oils and all of our AlgaViaTM whole algal products, AlgaViaTM Lipid Powder and AlgaViaTM Protein, are currently made from native microalgae strains as well as our current Encapso™ products. These native strains are selected through a rigorous screening process in which we look at thousands of microalgae, seeking properties that translate into product benefits for our customers.
Sometimes our customers request specific oils that cannot be efficiently produced by native algae strains. In this case, we seek to optimize a strain to provide significant product performance benefits - for example, oil with a higher flash point to improve the safety of lubricants or a more sustainable and healthier alternative to palm oil.
When we use traditional genetic engineering techniques, we begin with a native strain or one selected through classical strain improvement. To make the desired oil profile, we introduce one or sometimes a few genes from a plant with desired properties, or make only modest changes to the microalgae’s existing genes, for example, shutting off production of an undesired oil component. Those products made using traditional genetic engineering techniques include: high stability high oleic and lauric oils.
7
We believe that the following advantages of our platform allow us to offer a new source of high-value Tailored™ oils, encapsulated oils, and powdered products to address the major markets served by conventional oils:
• | Large and diverse market opportunities. Because we make oils, we can access the vast markets currently served by petroleum, plant oils and animal fats. In addition, we leverage our proprietary biotechnology platform to tailor oils that address specific customer requirements by offering superior performance and sustainability compared to conventional oils. |
• | Cost-competitive at commercial scale. We harness the innate oil-producing characteristics of microalgae through a proven industrial fermentation process in a controlled environment that is able to produce large volumes of oils in a cost-effective, scalable and predictable manner. |
• | Compatible with existing equipment and infrastructure. We use standard industrial fermentation and downstream processing equipment that needs little or no modification. Our oils are compatible with existing production, refining, finishing and distribution infrastructure, logistics channels, and technical specifications, which enables them to be a drop-in replacement for conventional oils. |
• | Rapid time to market. Our tailored-to-specification oils can improve upon triglyceride oils currently used in commerce and can be integrated quickly into our customers’ platforms because they are chemically similar to existing conventional oils. Additionally, if a customer desires a novel oil profile, our development timelines for new profiles can be on a scale of several months to several years as opposed to timelines demonstrated with plant-based oils, which are on the scale of 10-15 years. |
In summary, our innovative industrial biotechnology platform exploits the prolific oil production capabilities of microalgae as a biocatalyst while leveraging standard fermentation processes and existing industrial equipment to transform plant-based sugars and other types of renewable biomass into Tailored™ oils.
Our Products
Our primary products are the targeted outputs from our processes and include Tailored™ and encapsulated oils, powdered products and other bioproducts.
We are commercializing our primary products as either Intermediates/Ingredients that include branded products such as Encapso™, AlgaViaTM Flour and AlgaViaTM Protein, or as Personal Care Products that include branded products such as our Algenist® skin and personal care products.
Our Intermediate/Ingredient products include Tailored™ oils, powdered oils, and other closely related products targeted at customers in the (1) Industrial Products, (2) Food Products and (3) Personal Care Products market. Our technology allows us to devise tailored solutions for our customers ranging from drop-in equivalents for replacement of conventionally-sourced products to novel offerings providing a broad array of value-added benefits.
Within Personal Care Products, we are currently selling our Algenist® skin and personal care line.
Intermediates/Ingredients
We are commercializing two main classes of products: Tailored™ oils and powdered oils. The inherent flexibility of our technology platform and the broad usage of triglyceride oils across multiple industries, allows us to approach a wide range of customers across myriad end markets.
High-value oils include: the Oleic Family that offers high levels of oleic acid and low levels of polyunsaturates and/or saturates, providing benefits such as high lubricity, stability and low volatile organic compound; the Lauric Family that offers innovative compositions of fatty acid chain lengths that are differentiated from palm kernel and coconut oils by specific targeted fatty acids between C10 and C14; the Mid-Chain Family that target optimized levels of C8 (caprylic acid) and C10 (capric acid); Structured Fats that has enabled the production of an algal butter with a structure similar to cocoa butter; and Long Chain Family that includes the current development of highly unique oils with high levels of erucic acid (C22:1) with the benefit of not having to segregate high erucic rapeseed oil from the food supply.
Whole algal products include: AlgaVia Whole Algal Flour that is a lipid rich ingredient that can replace or reduce dairy fat, egg yolks and oil in recipes that reduces fat, cholesterol and calories with the added benefits of texture enhancement, water binding and flavor delivery; AlgaVia Whole Algal Protein that is a vegan protein source that is non-allergenic, gluten-free and
8
a sustainable source of high quality protein; and Encapsulated Oils that is a family of product that offers targeted friction inhibitors, delivering lubrication on demand while providing biodegradability and other environmental benefits.
Industrial Products: Powders and Oils
Powders
Our powdered oils products are an alternative application for our proprietary microalgae, in that the oil is not extracted but retained within the cell wall. We believe our encapsulated lubricants provide a novel application for delivery of oil for use in multiple industrial and commercial markets.
Encapsulated Oils
In 2014, we began selling our intermediate and ingredient products more broadly to customers in the oil field drilling fluids market with the launch of Encapso™. Our initial industrial use for our encapsulated oil technology is as a biodegradable lubricant additive for drilling fluids. In the oil field services market, Encapso™ competes with incumbent drilling lubricants and other specialty lubricants. We believe our product offers superior performance to conventional drilling alternatives available in the marketplace. Laboratory testing has demonstrated equal or improved performance relative to incumbent technologies. These results have been confirmed in field trials, where our Encapso™ product has been associated with operational improvements such as reductions in torque and drag, increases in rates of penetration and drilling speed, and reduction in non-productive time during use in over 37 commercial wells. Encapsulation also uniquely protects the lubricant from negatively affecting fluid dynamics while circulating in the drilling fluid, or “mud” system. And, with environmental concerns regarding the use and disposal of drilling fluids, our Encapso™ product provides a bio-degradable and non-hazardous solution.
Thus far, our Encapso™ product has been used in basins across the United States and Canada, demonstrating benefits, for example, in the Williston Basin, the Western Canadian Sedimentary Basin, the Anadarko/Woodford Basin, and the Permian Basin. We intend to expand sales beyond North America in 2015, including sales to regions and to companies with compelling drilling economics in an environment of lower oil prices. The product has been primarily used in water-based mud systems, which represent approximately 55% of the drilling fluids market, but we are also testing oil-based mud system applications and other applications of the product, as well as testing the use of our encapsulated oil platform in other markets and for other industrial uses.
Oils
Our Tailored™ oils are triglyceride oils that feature prominently in multiple industrial markets. We have several oils in various stages of development that can address one or more end markets. For example, our oleic oils (including high oleic and high stability high oleic) provide sustainable solutions within the food, lubricant, functional fluid and oleochemical markets, offering advantages such as better nutrition, higher lubricity, longer life, and lower levels of volatile organic compounds. Similarly, we are commercializing our renewable, sustainable lauric oils within the home and personal care markets for surfactant and oleochemical use.
We tailor our products to meet industry specifications and unique customer demands, and we believe we will be able to charge premium pricing as a result of the higher performance, higher value products we can deliver. Products derived from our oils also offer drop-in replacements and higher value blendstocks for marine, motor vehicle and jet fuels, as well as replacements for petrochemicals, oleochemicals and functional fluids.
Specialty Chemicals & Personal Care
We believe our renewable oils will become the basis for a next generation of high performance bio-based industrial fluids. Our Tailored™ oils platform enables replacement and enhancement of petroleum, plant, or animal derived oils that are used as raw materials for the chemicals industry. In many cases, we expect to create novel oils and high-performing end products that do not exist in nature or are prohibitively expensive to synthesize. In the industrial fluids markets, we have already developed first-of-a-kind oils and have begun to sell those oils to industrial chemical companies that can either use the oils directly as functional fluids (often including an additive package) or as intermediates to convert into replacements and enhancements for their existing petrochemical and oleochemical products.
For example, within functional fluids, our high stability high oleic oils can replace synthetic petroleum-based lubricants used in machinery and hydraulics, enhancing both performance and reducing environmental impact. In oleochemical applications, our ability to modify oil profiles allows us to make oil that is high in myristic acid, a common ingredient used as
9
an emollient within the home and personal care markets. We are focusing our initial Tailored™ oils for the industrial markets in two distinct target areas:
• | Oleochemicals are chemicals that are derived from natural oils, typically from plant or animal fats. Oleochemicals appear in the industrial, home and personal care industries in applications such as surfactants, detergents, soaps, cosmetics, lubricants and many others. Triglyceride oils derived from plants and animals are processed through a variety of oleochemical manufacturing steps including fatty acid splitting, fatty alcohol production, and esterification. We plan to sell our oils to industry partners that will either incorporate our oils directly, or use them as intermediates/ingredients to replace and/or enhance existing products. |
• | Functional Fluids span a wide range of non-fuel industrial applications such as lubricants, heat transfer fluids, antifreeze, dielectric fluids, defoamers, solvents, and drying agents. Physical properties (e.g., viscosity and pour point), chemical properties (e.g., oxidation and reactivity) and environmental impact (e.g., biodegradability) of the oils tend to be the principal drivers of value in the functional fluid segment. |
We have identified many novel applications for our tailored products that have been validated with our customer and partner relationships. As we ramp up commercial production, we expect to sell our oils into the sample applications listed in the table below, as well as a wide array of other opportunities. We have produced oils suitable for all of these applications, and expect to build on our initial library of oils in the future.
Market Segment | Sample Application | Value Proposition |
Oleochemicals | Surfactants | • Novel surfactants from natural sources • Improved margins to fatty alcohol producers • More valuable fatty acid mix from splitting • Logistically advantaged • Reduced processing steps • Sustainable source of renewable oil |
Bar and Liquid Soaps | • Enhanced bar soap performance (reduced skin sensitivity, enhanced foaming, etc.) • Sustainable source of renewable oil | |
Functional Fluids | Lubricants | • Enhanced lubricity • Enhanced stability • Reduced processing • Meets food-grade standards with performance of mineral oil equivalents • Biodegradable • Sustainable source of renewable oil |
Fuels
Within the fuels market, our renewable oils can be sold as replacements for materials that are traditionally derived from petroleum or other conventional oils, or refined and sold as drop-in replacements for marine, motor vehicle and jet fuels. We can either manufacture the end product by contracting with refiners to produce fuels of targeted specifications, or sell our unrefined oils to refiners. Near term, our focus in fuels is providing oils that will be used as high-value fuel additives and blendstocks, an area which allows us to target attractive selling prices while offering enhanced performance and sustainability to customers. Fuels and additives derived from our oils are compatible with the existing refining and distribution infrastructure, meet industry specifications, and can be used with factory-standard engines without modifications. Our fuels products range from drop-in replacement fuels, such as Soladiesel®BD and Soladiesel®RD for on-road applications and for ultra-low sulfur diesel; and Solajet® for aviation use, to high-value fuel additives and blendstocks.
Food Products - Powdered Ingredients and Food Oils
We believe that some of the largest opportunities and most valuable uses for our oils and powdered ingredients are in food. We have developed and commercialized microalgae-based food ingredients that enhance the nutritional profile and functionality of a wide range of foods and beverages.
10
In 2014, we launched our food ingredients products under the AlgaVia™ brand name. AlgaVia™ Microalgae Food Ingredients are new, healthful and sustainable sources of food with benefits that we believe enhance nutrition, performance and taste. We currently have three commercial food ingredient product lines: lipid powders and proteins (which are powdered ingredients), and high oleic oils (which are food oils). AlgaVia™ Microalgae Food Ingredients are sold to food and beverage manufacturers and foodservice providers through a combination of direct sales, distributors and strategic partnerships.
Powdered Ingredients
We have developed novel methods of preparing powdered forms of triglyceride oils and vegan proteins, and our powdered ingredients are composed of unmodified whole algal cells. AlgaVia™ Lipid Powder (commonly known as whole algal flour) and AlgaVia™ Protein (commonly known as whole algal protein) are whole algae ingredients that improve the nutritional profile of foods and beverages. AlgaVia™ Lipid Powder is a new fat source that allows for the reduction or replacement of dairy fats, oils, and eggs. AlgaVia™ Protein is a new vegan source of protein that is free of gluten and known allergens. Because the protein resides within the algal cell wall, it uniquely enables protein fortification into applications such as low pH beverages where protein fortification is typically difficult. Both AlgaVia™ Lipid Powder and Protein can be used across a range of applications such as beverages (ready-to-drink and powdered), bakery, snacks, bars, dressings, sauces and frozen desserts. We have received an FDA GRAS “No Questions” letter for these ingredients. They may also be sold in other regions/countries including Europe, Mexico, Australia, and New Zealand.
Food Oils
We have developed and continue to market opportunities for a range of food oils that have the potential to improve upon conventionally utilized specialty fats and oils and have received an FDA GRAS "No Questions" letter for high oleic algae oil.
Our first high performance food oil captured the 2014 IFT Food Expo Innovation Award. Our High Stability High Oleic algae oil is extremely stable, with zero trans fats and high levels of healthy Omega-9 (monounsaturated) fatty acids. With very low levels of polyunsaturates, this oil provides exceptional stability in a wide range of applications such as frying, baking, spreads, coatings, sauces, and dressings. Higher stability means lower systems costs overall and greater simplicity. It can enable longer shelf life with fresher tasting products, longer fry life, and less polymerization in frying and baking. High Stability algae oil can also reduce saturated fat and eliminate trans fats in foods, which is a major industry need.
In preparation for a continued expansion of our suite of algae oils in 2015, we successfully conducted pilot trials and produced our Low Saturate High Oleic algae oil at scale. This oil has an extremely low level of saturated fats, which will enable the reduction of saturated fats in food products such as bakery, spreads, sauces, dressings, and meal replacement beverages. We also made significant progress toward developing sustainable alternatives to tropical fats and oils that are currently grown in regions that are under environmental stress from deforestation.
Ingredient Type | Sample Ingredient | Sample End Customer Product |
Food Powders | Lipid Powder | • Bakery • Ice Cream • Sauces/Dressings • Snack Bars • Beverages |
Protein | • Snack Bars • Beverages | |
Food Oils | High Stability High Oleic | • Frying Oils • Bakery • Margarines and Spreads • Spray Coatings • Sauces/Dressings • Retail bottles of oil |
Personal Care Products
We have also developed branded personal care products. This is driven by our view that in certain instances, branded consumer products will drive the highest returns from our unique, high performance intermediates/ingredients. Specifically, there are certain markets in which ingredient adoption timelines and value accrual to brands rather than performance ingredients create a strong incentive to sell branded consumer products.
11
Skin and Personal Care
We have developed a portfolio of innovative and branded microalgae-based products. During our algal strain screening process, we discovered and isolated key compounds that microalgae synthesize to protect themselves against environmental hazards, such as UV exposure, changes in extremes of temperature, and dehydration. Our first major ingredient is Alguronic Acid®, which we have formulated into a full range of skin care products with significant anti-aging benefits. For example, since 2011, we have commercialized our Algenist® anti-aging skin care line, which is available at Sephora S.A. and its affiliates (Sephora), QVC, Inc., SpaceNK Limited, select Nordstrom stores and ULTA Beauty. We have seen success in expanding our international distribution of Algenist® products and are currently selling in 21 countries including member countries of the EU, Mexico, Canada and China. In 2013, we further leveraged our innovative ingredient research and expertise by broadening the Algenist® line to include products that use Microalgae Oil as a replacement for the essential oils currently used in skin care products. Some of our key Algenist® products are outlined in the table below.
Representative Algenist® Products | ||
Product | Description | |
 | Concentrated Reconstructing Serum | An anti-aging serum formulated with high concentrations of Alguronic Acid®. |
 | Complete Eye Renewal Balm | An eye cream formulated with Alguronic Acid®, vitamin C, and caffeine, as well as cucumber, aloe and green tea extracts. |
 | Firming & Lifting Cream | An anti-aging moisturizing cream formulated with Alguronic Acid®. |
 | Advanced Anti-Aging Repairing Oil | A face oil formulation containing Microalgae Oil. |
 | Genius Cream | This moisturizer cream combines Alguronic Acid® and Microalgae Oil, as well as a plant-based collagen. |
Our Competitive Strengths
We harness the power of microalgae to yield substantial volumes of renewable oils and other bioproducts. Our key competitive advantages are:
• | Proprietary and innovative technology. Our technology platform creates a new paradigm that enables us to produce novel Tailored™ oils that cannot be achieved through blending of existing conventional oils alone. We have made significant investments to protect the intellectual property and know-how related to our technology platform, including screening, classical strain development, targeted recombinant strain optimization, product and applications development and manufacturing capabilities. |
• | Premium pricing for tailored products. While our cost structure allows us to access existing markets at prevailing prices, we also believe that the enhanced value of our Tailored™ oils as compared to conventional oils should garner premium pricing. In industrial applications, our oils provide unique performance properties including enhanced lubricity, viscosity, pour point, and oxidative stability. Examples in food applications include oils with low levels of polyunsaturates for improved shelf and frying life and structuring fats, like algae-based butter, providing specific melting profiles. |
12
• | Technology proven at scale. We have been operating our large-scale fermentations at multiple partner facilities since 2008 in 75,000-liter vessels and in our integrated biorefinery in Peoria, Illinois since 2012 in 125,000-liter vessels. In 2012, we completed our first fermentations at the Clinton Facility in approximately 500,000-liter vessels. We have exhibited linear scalability of our process from laboratory scale and in January 2014 we announced that we had commenced commercial-scale production at the Clinton Facility. We perform some of the downstream processing of products from the Clinton Facility at the facility of ANP in Galva, Iowa. Oils from the Clinton/Galva Facilities are now being sold domestically and internationally and are being shipped to Brazil for market development activity. |
• | Capital efficient access to manufacturing capacity. In structuring our capacity and feedstock partnerships, we have deployed a capital efficient strategy to source low-cost financing with our partners. For example, for our joint venture with Bunge Global Innovation, LLC in Brazil, over $100 million of capital expenditure related to investments for the Solazyme Bunge JV Plant was approved for financing through an 8-year loan from the Brazilian Development Bank (BNDES) at an average interest rate of approximately 4% per annum. For the Clinton/Galva Facilities, we partnered with ADM and ANP to retrofit part of their respective existing manufacturing facilities, avoiding significant capital outlay associated with purchasing and installing commercial scale fermentation and downstream processing equipment. |
• | Commercial products today. We have launched our Algenist® brand within the Personal Care Products market. The Algenist® product line has grown to 34 SKUs with a number of additional product launches planned for 2015. The Algenist® product line has consistently shown strong growth since launch with 2014 sales up 23% year over year. We commenced commercial scale production of our renewable, tailored products manufactured at the Clinton/Galva Facilities in January 2014 and at the Solazyme Bunge JV Plant in May 2014. |
• | Feedstock and target market flexibility. Our technology platform provides us with the flexibility to choose from among multiple feedstocks on the input side and multiple specific products (and markets) on the output side, while using the same standard industrial fermentation equipment. A manufacturing facility utilizing a given plant-based sugar feedstock can produce oils with many different oil compositions. Conversely, we can produce the same oil compositions by processing a variety of plant-based sugar feedstock. This flexibility enables us to choose the optimal feedstock for any particular geography, while also enabling us to produce a variety of oils from the same manufacturing facility. |
Manufacturing Operations
Our process is compatible with commercial-scale, widely-available fermentation and oil recovery equipment. We operate our lab and pilot fermentation and recovery equipment as scaled-down versions of our large commercial engineering designs, such as those used to perform development work under certain agreements with strategic partners and to fulfill commercial supply agreements with certain partners. This allows us to more easily scale up to larger fermentation vessels. We have scaled up our technology platform and have successfully operated at lab (5-15 liter), pilot (600-1,000 liter), demonstration (120,000 liter) and commercial (approximately 500,000 liter and above) fermenter scale. The fermentation equipment used to achieve commercial scale at the Clinton Facility is comparable to the fermentation equipment at the Solazyme Bunge JV Plant in Brazil. Our existing manufacturing operations are as follows:
• | Our pilot plant in South San Francisco, California, with recovery operations capable of handling material from both 600 and 1,000 liter fermenters, enables us to produce samples of our algal oils for testing and optimization by our partners, as well as to test new process conditions at an intermediate scale. |
• | In 2012, we announced successful commissioning of our first fully integrated biorefinery (IBR) at our Peoria, Illinois facility (Peoria Facility), to produce algal oil. The IBR was partially funded with a federal grant that we received from the U.S. Department of Energy (DOE) in December 2009 to demonstrate integrated commercial-scale production of renewable algae-derived fuels. The Peoria Facility has a nameplate capacity of two million liters of oil annually and provides an important platform for continued work on feedstock flexibility and scaling of new algal oils into the marketplace. We have also modified our Peoria Facility to produce food ingredients in conjunction with market development activity. In January 2014, we commenced commercial operations at the Clinton/Galva Facilities in Iowa. The Clinton Facility uses corn sugars as a feedstock and currently has an initial target nameplate capacity of 20,000 MT per year of algal triglyceride oil products, which we are targeting to attain as we refocus the Clinton Facility on higher margin products such as Encapso™ and otherwise balance production with operating expenses. We have the |
13
option to expand the capacity to 40,000 MT per year with the potential to further expand production to 100,000 MT per year.
• | In May 2014, the Solazyme Bunge JV Plant produced its first products on full-scale production lines, including 625,000 liter fermenter tanks. The Solazyme Bunge JV Plant leverages our technology and Bunge’s sugarcane milling and natural oil processing capabilities to produce microalgae-based products. In addition, the Solazyme Bunge JV Plant has been designed to be expanded for further production in line with market demand. The facility was constructed as part of our Joint Venture with Bunge, and was financed with equal equity contributions by both Bunge and us and over $100 million in project financing from BNDES. |
• | We utilize contract manufacturing to assist in the production and sale of our Algenist® products, and we closely monitor and advise these contract manufacturers to maintain stringent quality standards for our products. We also produce some active ingredients for Solazyme Personal Care Products at our Peoria Facility. |
Intellectual Property
Our success depends in part upon our ability to obtain and maintain intellectual property protection for our products and technologies, and to operate without infringing the proprietary rights of others. With respect to the former, our policy is to protect our proprietary position through filing for patent applications on inventions, filing for trademark protection on our product names and related materials and methods, and through trade secret protection when and where appropriate. We seek to avoid infringing the proprietary rights of others by: (1) monitoring patents and publications in our product areas; (2) monitoring the technological developments of others; and (3) evaluating and taking appropriate courses of action whenever we identify such developments.
As of December 31, 2014, we own 37 issued U.S. patents, 33 issued foreign patents and over 225 pending patent applications filed in the United States and in various foreign jurisdictions. The expiration dates of the patents are between 2023 and 2029. Patents that issue, if any, from our currently pending patent applications will expire between 2026 and 2032, twenty years from the date of filing. Our patents and patent applications claim and are directed to compositions such as custom oils, fuel products, chemicals, food products, cosmetics, strains of microbes, and gene sequences; methods of manufacturing finished goods and raw materials; and methods of using our raw materials and products. We also protect our proprietary information by requiring our employees, consultants, contractors and other advisors to execute nondisclosure and assignment of invention agreements upon commencement of their respective employments or engagements. Agreements with our employees also prohibit them from bringing the proprietary rights of third parties to us. In addition, we protect our proprietary information through creating written obligations of confidentiality with outside parties who are exposed to confidential information. Where appropriate we also employ material transfer agreements governing the use, intellectual property rights, and transfer of materials such as custom oils when sending them to third parties for purposes such as conversion into fuels, chemicals and personal care products.
We believe that the creation, when possible and appropriate, of multiple, overlapping mechanisms and forms of protection will offer the possibility of broadest and longest proprietary positions for our products and technologies. It is possible that our current and future patents may be successfully challenged or invalidated in whole or in part. It is also possible that we may not obtain issued patents from our filed applications, and may not be able to obtain patents covering other inventions we seek to protect. Due to uncertainties inherent in prosecuting patent applications, some patent applications may be rejected and we may subsequently abandon them. We may also abandon applications when we determine that a product or method is no longer of interest. It is also possible that we may develop products or technologies that will not be patentable or that the patents of others will limit or preclude our ability to do business. In addition, any patent issued to us may provide us with little or no competitive advantage, in which case we may abandon such patent or license it to another entity.
Government Regulation
Our development and production processes involve the use, generation, handling, storage, transportation and disposal of hazardous chemicals and radioactive and biological materials. We are subject to a variety of environmental, health and safety, federal, state, local and international laws, regulations and permit requirements governing, among other matters, the use, generation, manufacture, transportation, storage, handling and disposal of these materials, in the US, Brazil and other countries where we intend to operate or may operate or sell our products in the future. These laws, regulations and permits can cause delays, require expensive fees, pollution control equipment, capital expenditures or operational changes to limit actual or potential impact of our operations on the environment.
14
We are also subject to regulation by the Occupational Safety and Health Administration (OSHA), the California and federal Environmental Protection Agency (EPA), and to regulation under the Toxic Substance Control Act (TSCA). OSHA, the California or federal EPA or other government agencies may adopt regulations that affect our research and development programs. In particular, our renewable chemical products may be subject to regulation by government agencies in our target markets. The EPA administers the requirements of the TSCA, which regulates the commercial use of chemicals. Before an entity can manufacture a chemical, it needs to determine whether that chemical is listed in the TSCA inventory. If the substance is listed, then manufacture can commence immediately. If not, then a pre-manufacture notice (PMN) must be filed with the EPA, which has 90 days to review it. Some of the products we produce or plan to produce are on the TSCA inventory, after successful PMN submissions and Notice of Commencements (NOC) filed. Others are not yet listed. A similar program exists under the European Chemicals Agency (ECHA) called REACH. Under REACH, we are required to register some of our products with the ECHA, and this process could cause delays or involve significant costs.
The use of recombinant microbes like many of our microbial strains is subject to laws and regulations in many countries. In the US, the EPA regulates the commercial use of recombinant microbes as well as potential products from recombinant microbes. When used in an industrial process, our microalgae strains designed using recombinant technology may be considered new chemicals under TSCA, administered by the EPA. We will be required to comply with the EPA’s Microbial Commercial Activity Notice (MCAN) process and have filed MCANs for strains of recombinant microalgae that we use for our chemicals and fuels businesses, which have been dropped from review. We have subsequently filed NOCs for dropped MCANs allowing commercial use. In Brazil, engineered microbes are regulated by CTNBio. We have filed an application, and in the future may file additional applications, for approval from CTNBio to import and use engineered microbes in our Brazilian facilities for research and development purposes. In addition, we received commercial approval from CTNBio for one of our current microbial strains in October 2013. We expect to encounter regulations concerning engineered microbes in most if not all of the countries in which we may seek to make our fuel and chemical products, however, the scope and nature of these regulations will likely be different from country to country. In February 2014, CTNBio granted a CQB (Certificate of Quality in Biosafety) to the Solazyme Bunge JV Plant for activities including industrial production, import and export, disposal and storage of our key production organisms, allowing the Solazyme Bunge JV Plant to run strains without prior commercial approval, under controlled conditions.
Our fuel products are subject to regulation by various government agencies, including the EPA and the California Air Resources Board in the US and Agencia Nacional do Petroleo in Brazil. We have registered fuels with the EPA and are preparing to secure approval for use of our diesel in Brazil. In addition, we may decide to register our fuel with the California Air Resources Board and the European Commission. Registration with each of these bodies is required for the sale and use of our fuels within their respective jurisdictions. Our jet fuels meet the standards set by ASTM D7566 and may therefore be used in commercial aviation.
The manufacture, sale and use of our foods products are regulated as food ingredients in the United States by the U.S Food and Drug Administration (FDA) under the federal Food, Drug, and Cosmetic Act. Food ingredients are broadly defined as any substance that may become a component, or otherwise affect the characteristics, of food. Food ingredients are regulated as food additives and must be approved through a formal Food Additive Petition (FAP) process or affirmed as substances generally recognized as safe, or GRAS. A substance can be listed or affirmed as GRAS by the FDA or self-affirmed by its manufacturer upon determination by independent qualified experts who generally agree that the substance is GRAS for a particular use. Although the FDA does not officially affirm the GRAS status of ingredients, it does review, at the notifier’s request, the notifier’s determination of ingredients’ GRAS status. FDA endeavors to respond to GRAS notices by issuing a letter that either does not question the basis of the notifier’s determination of GRAS status or concludes that the notice does not provide a sufficient basis for a GRAS determination. Self-affirmation of GRAS status without FDA notification allows the marketing and sale of the ingredient, but reliance on self-affirmation alone may limit its marketability, as many food manufacturers require that the FDA issue a letter confirming that it does not question the notifier’s determination of GRAS status before such manufacturers will purchase food ingredients from third parties. We submitted a GRAS Notice to the FDA for our first algal oil in June 2011, and received a “No Questions” letter from the FDA in June 2012. A panel of qualified experts in the field of food toxicology has determined that an additional oleic algal oil, our second algal oil, is GRAS. We submitted a GRAS Notice for the oleic algal oil in July 2014, and received a “No Questions” letter from the FDA in February 2015. We submitted a GRAS Notice for whole algal flour in the third quarter of 2012 and received a “No Questions” letter from the FDA in June 2013. We also submitted a GRAS Notice for whole algal protein in June 2014 and received a “No Questions” letter from the FDA in December 2014.
Food ingredients that are not suitable for the GRAS affirmation process are regulated as food additives and require the submission of a FAP to the FDA and the FDA’s approval prior to commercialization. The food additive petition process is generally expensive and time consuming, with approval, if secured, taking years. The petition must establish with reasonable
15
certainty that the food additive is safe for its intended use at the level specified in the petition. If a food additive petition is submitted, the FDA may choose to reject the petition or deny any desired labeling claims. Furthermore, the FDA may require the establishment of regulations that necessitate costly and time-consuming compliance procedures. All products may also fall under the jurisdiction of the U.S. Department of Agriculture if the intended applications are for meat, dairy, organic or other specialty food areas.
The sale of ingredients for use in animal feed is regulated by agencies including the FDA Center for Veterinary Medicine, or CVM. CVM requirements for suitability must be met by providing data form studies.
Countries other than the U.S. also regulate the manufacture and sale of food ingredients. Regulations vary substantially from country to country, and we will be required to comply with applicable regulations in each country in which we choose to market our food ingredients. In February 2014, the Sao Paulo State Environmental Department granted a license to operate the Solazyme Bunge JV Plant, which was necessary to begin commercial production. We submitted a dossier for oleic algal oil to the Brazilian food safety agency ANVISA in the first quarter of 2014, and anticipate approval for use in foods by the second quarter of 2015.
Our skin and personal care products are also subject to regulation by various government agencies in the countries in which our products are sold. We completed several rounds of testing in connection with launching the Algenist® product line, including Human Repeat Insult Patch Testing. We will continue to evaluate regulatory requirements as we launch new skin and personal care products.
Employees
As of December 31, 2014, we had 266 full-time employees, excluding the employees of our joint venture. Our employees’ roles include research, process development, manufacturing, regulatory affairs, program management, finance, human resources, administration, sales and marketing and business development. None of our employees are covered by collective bargaining agreements and we consider relations with our employees to be good.
Investor Information
Our Annual Report on Form 10-K, Quarterly Reports on Form 10-Q, current reports on Form 8-K and any amendments to those reports are available free of charge on the Investor Relations section of our website at http://investors.solazyme.com/sec.cfm as soon as reasonably practicable after they are electronically filed with or furnished to the Securities and Exchange Commission (SEC). The public may read and copy any materials filed us with the SEC at the SEC’s Public Reference Room at 100 F Street, NE, Room 1580, Washington, DC 20549. The public may obtain information on the operation of the Public Reference Room by calling the SEC at 1-800-SEC-0330. The SEC maintains an Internet site that contains reports, proxy and information statements and other information regarding issuers that file electronically with the SEC at http://www.sec.gov. Except as expressly set forth in this Annual Report on Form 10-K, the contents of these websites are not incorporated into, or otherwise to be regarded as part of this report.
Item 1A. | Risk Factors. |
You should carefully consider the risks and uncertainties described below before investing in our publicly-traded securities. Additional risks and uncertainties not presently known to us or that our management currently deems immaterial also may impair our business operations. If any of the risks described below were to occur, our business, financial condition, operating results, and cash flows could be materially adversely affected. In such an event, the trading price of our common stock could decline and you could lose all or part of your investment. In assessing these risks and uncertainties, you should also refer to the other information contained in this Report, including our consolidated financial statements and related notes. The risks and uncertainties discussed below also include forward-looking statements, and our actual results may differ substantially from those discussed in these forward-looking statements. See Management’s Discussion and Analysis of Financial Condition and Results of Operations-Forward-Looking Statements.
Risks Related to Our Business and Industry
We have a limited operating history and have incurred significant losses to date, anticipate continuing to incur losses and may never achieve or sustain profitability.
We are an early stage company with a limited operating history. We only recently began commercializing our products. To date, a substantial portion of our revenues has consisted of funding from third party collaborative research agreements and government grants. We have generated only limited revenues from commercial sales, which have been principally derived from
16
sales of our personal care products. Although we expect a significant portion of our future revenues to come from commercial sales in the food ingredients, fuels and chemicals and oil field services markets, only a small portion of our revenues to date has been generated from those markets.
We have incurred substantial net losses since our inception, including a net loss of $162.1 million during the year ended December 31, 2014. We expect these losses may continue as we ramp up our manufacturing capacity and build out our product pipeline. As of December 31, 2014, we had an accumulated deficit of $468.5 million. We expect to incur additional costs and expenses related to the continued development and expansion of our business, including research and development, the operation of our Peoria Facility, the ramp up and operation of the Solazyme Bunge JV production facility (described below), the ramp up and operation of the Clinton/Galva Facilities (as described below) and other commercial facilities. As a result, our annual and quarterly operating losses may continue.
We, along with our development and commercialization partners, will need to develop products successfully, cost effectively produce them in large quantities, and market and sell them profitably. If we fail to become profitable, or if we are unable to fund our continuing losses, we may be unable to continue our business operations. There can be no assurance that we will ever achieve or sustain profitability.
We have generated limited revenues from the sale of our products, and our business may fail if we are not able to successfully commercialize these products.
We have had only limited product sales to date. If we are not successful in further advancing our existing commercial arrangements with strategic partners, developing new arrangements, ramping up or otherwise increasing our manufacturing capacity and securing reliable access to sufficient volumes of low-cost feedstock, we will be unable to generate meaningful revenues from our products. We are subject to the substantial risk of failure facing businesses seeking to develop products based on a new technology.
Certain factors that could, alone or in combination, prevent us from successfully commercializing our products include:
• | our ability to secure reliable access to sufficient volumes of low-cost feedstock; |
• | our ability to achieve commercial-scale production of our products on a cost-effective basis and in a timely manner; |
• | technical or operational challenges with our manufacturing processes or with development of new products that we are not able to overcome; |
• | our ability to consistently manufacture our products within specifications; |
• | our ability to establish and maintain successful relationships with development, feedstock, manufacturing and commercialization partners; |
• | our ability to gain market acceptance of our products with customers and maintain customer relationships; |
• | our ability to sell our products at an acceptable price; |
• | our ability to manage our growth; |
• | our ability to meet applicable regulatory requirements for the production, distribution and sale of our products and to comply with applicable laws and regulations; |
• | actions of direct and indirect competitors that may seek to enter the markets in which we expect to compete or that may seek to impose barriers to one or more markets that we intend to target; and |
• | public concerns about the ethical, legal, environmental and social ramifications of the use of targeted recombinant technology, land use and the potential diversion of resources from food production. |
The production of our microalgae-based products requires fermentable feedstock. The inability to obtain feedstock in sufficient quantities or in a timely and cost-effective manner may limit our ability to produce our products.
A critical component of the production of our microalgae-based products is access to feedstock in sufficient quantities and at an acceptable price to enable commercial production and sale. Other than as described below, we currently purchase feedstock, such as sugarcane-based sucrose and corn-based dextrose, for the production of our products at prevailing market prices. We are currently in discussions with additional potential feedstock partners.
17
We do not have any long-term supply agreements or other guaranteed access to feedstock other than (i) for the supply of feedstock to Solazyme Bunge Produtos Renováveis Ltda. (“Solazyme Bunge Renewable Oils” or the “Solazyme Bunge JV”) by our partner, Bunge Global Innovation, LLC and certain of its affiliates (“Bunge”), pursuant to our joint venture arrangement that includes a feedstock supply agreement, and (ii) pursuant to our strategic collaboration with Archer-Daniels-Midland Company (“ADM”) (“Solazyme/ADM Collaboration”) at the ADM facility in Clinton, Iowa (“Clinton Facility”). As we scale our production, we anticipate that the production of our microalgae-based products will require large volumes of feedstock, and we may not be able to contract with feedstock producers to secure sufficient quantities of feedstock at reasonable costs or at all. For example, corn-based dextrose feedstock for the Clinton Facility is being provided from ADM’s adjacent wet mill and sugarcane-based sucrose for the Solazyme Bunge JV facility in Moema, Brazil is being provided by Bunge. Corn and sugar are traded as commodities and are subject to price volatility. While we may seek to manage our exposure to fluctuations in the price of sugar and corn-based dextrose by entering into hedging transactions directly or through our joint venture or collaboration arrangements, we may not be successful in doing so. If we cannot access feedstock in the quantities we need at acceptable prices, we may not be able to successfully commercialize our food ingredients, fuels, chemicals, encapsulated lubricant and other products, and our business will suffer. We are currently in discussions with additional potential feedstock partners, but we cannot be sure that we will successfully execute additional long-term feedstock contracts on terms favorable to us, or at all. If we do not succeed in entering into long-term supply contracts or successfully hedge against our exposure to fluctuations in the price of feedstock, our costs and profit margins may fluctuate from period to period as we will remain subject to prevailing market prices.
Although our plan is to enter into partnerships, such as the Solazyme Bunge JV and the Solazyme/ADM Collaboration, with feedstock providers to supply the feedstock necessary to produce our products, we cannot predict the future availability or price of such feedstock or be sure that our feedstock partners will be able to supply such feedstock in sufficient quantities or in a timely manner. The prices of feedstock depend on numerous factors outside of our or our partners’ control, including weather conditions, government programs and regulations, changes in global demand, rising or falling commodities and equities markets, and availability of credit to producers. Crop yields and sugar content depend on weather conditions such as rainfall and temperature. Variable weather conditions have historically caused volatility in feedstock crop prices due to crop failures or reduced harvests. For example, excessive rainfall can adversely affect the supply of feedstock available for the production of our products by reducing the sucrose content of feedstock and limiting growers’ ability to harvest. Crop disease and pestilence can also occur from time to time and can adversely affect feedstock crop growth, potentially rendering useless or unusable all or a substantial portion of affected harvests. The limited amount of time during which feedstock crops keep their sugar content after harvest poses a risk of spoilage. Also, the fact that many feedstock crops are not themselves traded commodities limits our ability to substitute supply in the event of such an occurrence. If our ability to obtain feedstock crops is adversely affected by these or other conditions, our ability to produce our products will be impaired, and our business will be adversely affected. In the near term we believe Brazilian sugarcane-based sucrose will be an important feedstock for us. Along with the risks described above, Brazilian sugarcane prices may also increase due to, among other things, changes in the criteria set by the Conselho dos Produtores de Cana, Açúcar e Álcool (Council of Sugarcane, Sugar and Ethanol Producers), known as Consecana. Consecana is an industry association of producers of sugarcane, sugar and ethanol that sets market terms and prices for general supply, lease and partnership agreements and may change such prices and terms from time to time. Moreover, Brazil has a developed industry for producing ethanol from sugarcane, and if we have manufacturing operations in Brazil that do not have a partner providing the sugarcane feedstock, such as Bunge as part of the Solazyme Bunge JV, we will need to compete for sugarcane feedstock with ethanol producers. Such changes and competition could result in higher sugarcane prices and/or a significant decrease in the volume of sugarcane available for the production of our products, which could adversely affect our business and results of operations.
We have entered into, and plan to enter into other, arrangements with feedstock producers to co-locate production at their existing mills, and if we are not able to complete and execute on these arrangements in a timely manner and on terms favorable to us, our business will be adversely affected.
In April 2012, we entered into a Joint Venture Agreement with Bunge, forming the Solazyme Bunge JV, which is doing business as Solazyme Bunge Renewable Oils. The Joint Venture Agreement was amended in October 2013 to expand the field and product portfolio. The Solazyme Bunge JV produces microalgae-based products in Brazil using our proprietary technology and sugarcane feedstock provided by Bunge. The Solazyme Bunge JV’s production facility is located adjacent to a sugarcane processing mill in Brazil that is owned by Bunge. The acquisition of the facility site by the Solazyme Bunge JV from Bunge is in process, is complex, is subject to multiple approvals from governmental authorities and will take time to complete. The construction of the Solazyme Bunge JV’s production facility began in June 2012, and the first commercial product from the Solazyme Bunge JV production facility was produced in the second quarter of 2014. Manufacturing operations and processes continue to be optimized as the facility is ramped up. In addition, in May 2011, we entered a joint development agreement with Bunge that, among other things, advanced our work on Brazilian sugarcane feedstocks and extended through September 2014.
18
In May 2011, we entered into a Warrant Agreement, amended in August 2011, with Bunge Limited a portion of which vested upon the successful completion of milestones that targeted the completion of construction of the Solazyme Bunge JV facility with a targeted nameplate capacity of 100,000 metric tons (“MT”) of output oil. We intend to continue to expand our manufacturing capacity by entering into additional agreements with feedstock producers that require them to invest some or all of the capital needed to build new production facilities to produce our products. In return, we expect to share in profits anticipated to be realized from the sale of these products. We are currently in discussions with additional potential feedstock and manufacturing partners.
In November 2012, we and ADM entered into a Strategic Collaboration Agreement (“Collaboration Agreement”), establishing the Solazyme/ADM Collaboration for the production of microalgae-based products at the Clinton Facility. The Clinton Facility utilizes our proprietary microbe-based catalysis technology. Feedstock for the facility is provided from ADM’s adjacent wet mill. Under the terms of the Collaboration Agreement, we agreed to pay ADM annual fees for use and operation of a portion of the Clinton Facility, a portion of which may be paid in common stock. In addition, we have granted to ADM a warrant covering 500,000 shares of our common stock, which vests in equal monthly installments over five years, commencing in November 2013. The initial target nameplate capacity of the facility is 20,000 MT per year of triglyceride oil, which we are targeting as we refocus the Clinton Facility on higher margin products such as Encapso™ and otherwise balance production volumes with operating expenses. We have an option to expand the capacity to 40,000 MT per year, with the potential to further expand production to 100,000 MT per year. Since the third quarter of 2013, downstream processing of products manufactured at the Clinton Facility has been performed at a finishing facility in Galva, Iowa (“Galva Facility”), which is operated by our long-term partner, a wholly owned subsidiary of American Natural Processors, Inc. (“Clinton/Galva Facilities”). There can be no assurance that we will be able to meet our capacity target of 20,000 MT per year as the Clinton Facility is ramped up or that the capacity of the facility will be expanded. We and ADM are also working together to develop markets for the products produced at the Clinton Facility.
There can be no assurance that a sufficient number of other sugar or other feedstock mill owners will accept the opportunity to partner with us for the production of our microalgae-based products. Reluctance on the part of mill owners may be caused, for example, by their failure to understand our technology or product opportunities or their belief that greater economic benefits can be achieved from partnering with others. Mill owners may also be reluctant or unable to obtain needed capital; alternatively, if mill owners are able to obtain debt financing, we may be required to provide a guarantee. Limitations in the credit markets, such as those experienced in the recent economic downturn or historically in developing nations as a result of government monetary policies designed in response to very high rates of inflation, would impede or prevent this kind of financing and could adversely affect our ability to develop the production capacity needed to allow us to grow our business. Mill owners may also be limited by existing contractual obligations with other third parties, liability, health and safety concerns and additional maintenance, training, operating and other ongoing expenses.
Even if additional feedstock partners are willing to co-locate our production at their mills, they may do so only on economic terms that place more of the cost, or confer less of the economic return, on us than we currently anticipate. If we are not successful in negotiations with mill owners, our cost of securing additional manufacturing capacity may be higher than anticipated in terms of up-front costs, capital expenditure or lost future returns, and we may not gain the manufacturing capacity that we need to grow our business.
Our pursuit of new product opportunities may not be technologically feasible or cost effective, which would limit our ability to expand our product line and sources of revenues.
We have committed, and intend to continue to commit, substantial resources, alone or with collaboration partners, to the development and analysis of new Tailored™ oils and other microalgae-based products by applying recombinant technology to our microalgae strains. There is no guarantee that we will be successful in creating new Tailored™ oil profiles, or other microalgae-based products, that we, our partners or their customers desire. There are significant technological hurdles in successfully applying recombinant technology to microalgae, and if we are unsuccessful at engineering microalgae strains that produce desirable Tailored™ oils and other microalgae-based products, the number and size of the markets we will be able to address will be limited, our expected profit margins could be reduced and the potential profitability of our business could be compromised.
The successful development of our business depends on our ability to efficiently and cost-effectively produce microalgae-based products at large commercial scale.
Two of the significant drivers of our production costs are the level of productivity and conversion yield of our microalgae strains. For example, with respect to oil, productivity is principally a function of the amount of oil that can be obtained from a given volume over a particular time period. Conversion yield refers to the amount of the desired oil that can be
19
produced from a fixed amount of feedstock. We may not be able to meet our currently expected production cost profile as we ramp up our large commercial manufacturing facilities. If we cannot do so, our business could be materially and adversely affected.
Production of both current and future oils and other microalgae-based products will require that our technology and processes be scalable from laboratory, pilot and demonstration projects to large commercial-scale production. We have limited experience constructing, ramping up or managing large, commercial-scale manufacturing facilities. We may not have identified all of the factors that could affect our manufacturing processes. Our technology may not perform as expected when applied at large commercial scale, or we may encounter operational challenges for which we are unable to identify a workable solution. For example, contamination in the production process, equipment failure or accidents, problems with consistent and reliable plant utilities, human error, issues arising from process modifications to reduce costs and adjust product specifications, and other similar challenges could decrease process efficiency, create delays and increase our costs. To date we have employed our technology using fermenters with a capacity of up to approximately 625,000 liters. However, we still need to demonstrate that we can reach our target cost structure, including the achievement of target yields and productivities at approximately 500,000 liter scale in Iowa and approximately 625,000 liter scale in Brazil. We may not be able to scale up our production in a timely manner, on commercially reasonable terms, or at all. If we are unable to manufacture products at a large commercial scale, our ability to commercialize our technology will be adversely affected, and, with respect to any products that we do bring to market, we may not be able to achieve and maintain an acceptable production cost profile, which would adversely affect our ability to reach, maintain and increase the profitability of our business.
We rely in part on third parties for the production and processing of our products. If these parties do not produce and process our products at a satisfactory quality, in a timely manner, in sufficient quantities and at an acceptable cost, our development and commercialization efforts could be delayed or otherwise negatively impacted.
Other than our Peoria Facility, we do not wholly own facilities that can produce and process our products other than at small scale. As such, we rely, and we expect to continue to rely, at least partially, on third parties (including partners and contract manufacturers) for the production and processing of our products. Currently, we have two manufacturing arrangements for industrial fermentation: an agreement for the manufacture of certain products by the Solazyme Bunge JV pursuant to a joint venture arrangement and the manufacture of products at the Clinton Facility. We also have manufacturing agreements relating to other aspects of our production process. Our current and anticipated future dependence upon our partners and contract manufacturers for the production and processing of our products may adversely affect our ability to develop products on a timely and competitive basis. The failure of any of our counterparties to provide acceptable products could delay the development and commercialization of our products. We or our partners will need to enter into additional agreements for the commercial development, manufacturing and sale of our products. There can be no assurance that we or our partners can do so on favorable terms, if at all. Even if we reach agreements with manufacturing partners to produce and process our products, initially the partners will be unfamiliar with our technology and production processes. We cannot be sure that the partners will have or develop the operational expertise needed to run the equipment and processes required to manufacture our products. Further, we may have limited control over the amount or timing of resources that any partner is able or willing to devote to production and processing of our products.
To date, our products have been produced and processed in quantities sufficient for our development work and initial commercial sales. Even if there is demand for our products at a commercial scale, we or our partners may not be able to successfully increase the production capacity for any of our products in a timely or economic manner or at all. In addition, to the extent we are relying on contract manufacturers to produce and process our products, we cannot be sure that such contract manufacturers will have capacity available when we need their services, that they will be willing to dedicate a portion of their production and/or processing capacity to our products or that we will be able to reach acceptable price and other terms with them for the provision of their production and/or processing services. If we, our partners or our contract manufacturers are unable to increase the production capacity for a product when and as needed, the commercial launch of that product may be delayed, or there may be a shortage of supply, which could limit sales, cause us to lose customers and sales opportunities and impair the growth of our business.
In addition, if a facility or the equipment in a facility that produces and/or processes our products is significantly damaged, destroyed or otherwise becomes unavailable, we or our partners may be unable to replace the manufacturing capacity quickly or cost effectively. The inability to enter into manufacturing agreements, the damage or destruction of a facility upon which we or our partners rely for manufacturing or any other delays in obtaining supply would delay or prevent us and/or our partners from further developing and commercializing our products.
20
We may experience significant delays and/or cost overruns in financing, designing, constructing and ramping up large commercial manufacturing facilities, which could result in harm to our business and prospects.
Our business plan contemplates bringing significant commercial manufacturing capacity online over the next several years. In order to meet our capital requirements for those facilities, we may have to raise additional funds and may be unable to do so in a timely manner, in sufficient amounts and on terms that are favorable to us, if at all. If we fail to raise sufficient funds, our ability to finance and construct additional manufacturing facilities could be significantly limited. If this happens, we may be forced to delay the commercialization of our products and we will not be able to successfully execute our business plan, which would harm our business.
Manufacturing operations have begun at the Solazyme Bunge JV production facility adjacent to Bunge’s Moema sugarcane mill in Brazil. The first products from the Solazyme Bunge JV production facility were produced in the second quarter of 2014, and manufacturing operations at the facility are in the process of being optimized and ramped up. The production facility is targeted to have a name plate capacity of 100,000 MT of oil per year; however, we do not expect the facility to reach full name plate capacity in the near term as the Solazyme Bunge JV continues to optimize manufacturing operations and focuses production on high margin products, and additional capital expenditures may be required to reach nameplate capacity depending on the product mix produced at the Solazyme Bunge JV production facility. Under the joint venture agreements, Bunge has agreed to provide feedstock as well as utility services to the Solazyme Bunge JV production facility. The production facility has experienced, and may continue to experience, intermittent supply of power and steam supply from Bunge. While Bunge is making changes to its utility services designed to provide consistent and reliable utilities to the Solazyme Bunge JV production facility, if the changes are not successful, or if it takes longer than expected for Bunge to provide consistent and reliable supply of power and steam to the production facility, production yields will be lower, the ramp up and optimization of the Solazyme Bunge JV production facility will be delayed, our costs will increase and our business and results of operations will be adversely affected.
In February 2013, the Solazyme Bunge JV entered into a loan agreement with the Brazilian Development Bank (“BNDES”) for project financing. Funds borrowed under the loan agreement have supported the production facility in Brazil, including a portion of the construction costs of the facility. We have used a portion of our $35.0 million revolving and term loan credit facility (the “HSBC facility”) with HSBC Bank, USA, National Association (“HSBC”) to support a bank guarantee of the BNDES loan. As a condition of the Solazyme Bunge JV drawing funds under the loan in excess of amounts supported by bank guarantees, we may be required to provide a corporate guarantee of a portion of the loan (in an amount that, when added to the amount supported by our bank guarantee, does not exceed our ownership percentage in the Solazyme Bunge JV).
Negotiating the terms of the corporate guarantee documentation may take longer than anticipated and may contain terms that are not favorable to us. If we are unable to negotiate our corporate guarantee documentation on acceptable terms, the Solazyme Bunge JV may be unable to draw down the maximum amount available under the BNDES loan, it may have to seek additional financing and may not be able to raise sufficient additional funds on favorable terms, if at all. If the Solazyme Bunge JV is unable to secure additional financing, we will be required to fund our portion of the Solazyme Bunge JV’s capital requirements either from existing sources or seek additional financing. The acquisition of the facility site by the Solazyme Bunge JV from Bunge is in process, is complex, is subject to multiple approvals of governmental authorities and will take time to complete. If the Solazyme Bunge JV is unable to acquire the facility site on reasonable terms, or at all, it may not be able to operate the production facility and may lose all or part of its investment in such facility.
We will need to construct, or otherwise secure access to, and fund, additional capacity significantly greater than what we are in the process of building as we continue to commercialize our products. Some of our customers may ultimately require that we acquire access to multiple production facilities in order to diversify our manufacturing base. We expect to bring online additional facilities in the future. Although we intend to enter into arrangements with third parties to meet our capacity targets, it is possible that we will need to construct our own facility or facilities to meet a portion or all of these targets. We have limited experience in the construction of commercial production facilities and, if we decide to construct our own facility, we will need to secure necessary funding, complete design and other plans needed for the construction of such facility and secure the requisite permits, licenses and other governmental approvals, and we may not be successful in doing so. The construction of any such facility would have to be completed on a timely basis and within an acceptable budget. In addition, there may be delays related to the acquisition of facility sites, which could delay the development and commercialization of our products, as well as delays in deliveries of materials for the construction of such manufacturing facilities in more remote locations. Any facility, whether owned by a third party or by us, must perform as designed once it is operational. If we encounter significant delays, cost overruns, engineering or utility problems, equipment damage, accidents, equipment supply constraints or other serious challenges in bringing any of these facilities online, we may be unable to meet our production goals in the time frame we have planned. In addition, we have limited experience in the management of manufacturing operations at large scale. We
21
may not be successful in producing the amount and quality of oil or other microalgae-based products we anticipate in the facilities and our results of operations may suffer as a result. We have limited experience producing our products at commercial scale, and we will not succeed if we cannot maintain or decrease our production costs and effectively scale our technology and manufacturing processes.
We face financial risk associated with ramping up production to reduce our per-unit production costs. To reduce per-unit production costs, we must increase production to achieve economies of scale. However, if we do not sell production output in a timely manner or in sufficient volumes at sufficient prices, our investment in production will harm our cash position and generate losses. Due to recent decreases in the prices of petroleum and certain plant oils, on which products competitive with our own depend, we have determined not to manufacture certain of our products because the production and sale of such products at a loss would adversely affect our business. Therefore, we expect the time required to ramp up the Clinton and Solazyme Bunge JV production facilities and to achieve positive cash flows at such facilities will be more than we previously anticipated. Further delays would materially adversely affect our business.
If we fail to maintain and successfully manage our existing, or enter into new, strategic collaborations, we may not be able to develop and commercialize many of our products and achieve or sustain profitability.
Our ability to enter into, maintain and manage collaborations in our target markets is fundamental to the success of our business. We currently have joint venture, collaboration, research and development, supply and/or distribution agreements with various strategic partners. We currently rely on our partners, in part, for manufacturing and sales or marketing services and intend to continue to do so for the foreseeable future, and we intend to enter into other strategic collaborations to produce, market and sell other products we develop. However, we may not be successful in entering into collaborative arrangements with third parties for the production and sale and marketing of other products. Any failure to enter into collaborative arrangements on favorable terms could delay or hinder our ability to develop and commercialize our products and could increase our costs of development and commercialization.
In the fuels and chemicals markets, we have entered into a joint venture arrangement with Bunge that is focused on the manufacture of products in Brazil and development agreements with various other partners. In addition, we have entered into a strategic collaboration with ADM for the manufacture of microalgae-based products, and have entered into a commercial supply agreement with Unilever. In the skin and personal care market, we have entered into arrangements with Sephora S.A. and its affiliates (“Sephora”), QVC, Inc. and others. There can be no guarantee that we can successfully manage these strategic collaborations. Under our agreement with Sephora, we bear a significant portion of the costs and risk of marketing the products, but do not exercise sole control of marketing strategy. In some cases, we will need to meet certain milestones to continue our activities with these partners. Moreover, the exclusivity provisions of certain strategic arrangements limit our ability to otherwise commercialize our products.
Pursuant to the agreements listed above and similar arrangements that we may enter into in the future, we may have limited or no control over the amount or timing of resources that any partner is able or willing to devote to our products or collaborative efforts. Any of our partners may fail to perform their obligations as expected. These partners may breach or terminate their agreements with us or otherwise fail to conduct their collaborative activities successfully and in a timely manner. Further, our partners may not develop products arising out of our arrangements or devote sufficient resources to the development, manufacture, marketing, or sale of our products. Dependence on collaborative arrangements will also subject us to other risks, including:
• | we may be required to relinquish important rights, including intellectual property, marketing and distribution rights; |
• | we may disagree with our partners as to rights to intellectual property we develop, or their research programs or commercialization activities; |
• | we may have lower revenues than if we were to market and distribute such products ourselves; |
• | a partner could separately develop and market a competing product either independently or in collaboration with others, including our competitors; |
• | a partner could divest assets that are critical to our or our joint venture’s operations to a third party that is less willing to cooperate with us or is less incentivized or able to manage such assets in a way that helps us achieve our operational and financial goals; |
22
• | our partners could become unable or less willing to expend their resources on research and development, commercialization efforts or the maintenance or supply of production services due to general market conditions, their financial condition or other circumstances beyond our control; |
• | we may be unable to manage multiple simultaneous partnerships or collaborations; and |
• | our partners may operate in countries where their operations could be adversely affected by changes in the local regulatory environment or by political unrest. |
Moreover, disagreements with a partner or former partner could develop, and any conflict with a partner or former partner could reduce our ability to enter into future collaboration agreements and negatively impact our relationships with one or more existing partners. If any of these events occurs, or if we fail to maintain our agreements with our partners, we may not be able to commercialize our existing and potential products, grow our business or generate sufficient revenues to support our operations. In addition, disagreements with a partner or former partner could result in disputes or litigation. Formal dispute resolution and litigation can require substantial time and resources, and the resolution of disputes and litigation may result in settlements or judgments that have a materially adverse impact on our results of operations or our financial condition. We are currently engaged in dispute resolution proceedings with our former partner Roquette Frères, S.A and in September 2014 we agreed to settle a legal proceeding with our former partner Therabotanics, LLC. For additional information regarding the Roquette and Therabotanics proceedings, see “Part I, Item 3. Legal Proceedings” and the risk factor titled, “Our joint venture with Roquette has been dissolved. We are currently in litigation with Roquette and we may have other disputes with Roquette related to the joint venture's business,” of “Part I, Item 1A. Risk Factors”.
Additionally, our business could be negatively impacted if any of our partners undergoes a change of control or were to otherwise assign the rights or obligations under any of our agreements to a competitor of ours or to a third party who is not willing to work with us on the same terms or commit the same resources as the current partner.
Our relationship with our strategic partner ADM may not prove successful.
We have entered into the Solazyme/ADM Collaboration, which is focused on producing products at the Clinton Facility using our proprietary technology. Feedstock for the facility is being provided from ADM’s adjacent wet mill. Under the terms of the Collaboration Agreement, we pay ADM annual fees for use and operation of a portion of the Clinton Facility, a portion of which may be paid in our common stock.
Our ability to generate value from the Solazyme/ADM Collaboration depends, among other things, on our ability to work cooperatively with ADM for the production of our products at the Clinton Facility. We may not be able to do so. For example, under the Solazyme/ADM Collaboration, ADM has agreed to provide feedstock and utility services to the Clinton Facility as well as operating services. ADM does not have previous experience working with our technology, and we cannot be sure that ADM will be successful in producing our products in the amounts we may require, at a satisfactory quality and/or in a cost-effective manner. Subject to limited exceptions and adjustments, we are responsible for annual fees regardless of ADM’s success in producing our products in acceptable quantities, at satisfactory quality and at acceptable costs. If production capacity is expanded at the Clinton Facility, there may be delays or cost overruns related to the retrofitting and permitting of the Clinton Facility, which would delay the increased production and commercialization of our products and could increase our costs. Furthermore, the agreements governing our Solazyme/ADM Collaboration are complex and cover a range of future activities, and disputes may arise between us and ADM that could delay the production and commercialization of our products or cause the termination of the Solazyme/ADM Collaboration. Additionally, downstream processing of products produced at the Clinton Facility is being performed at the facilities of third-party manufacturing partners. Any business or operations interruption at the facilities of such third parties could delay the production and commercialization of our products and could increase our costs.
Our relationship with our strategic partner Bunge may not prove successful.
We have entered into a joint venture with Bunge that is focused on the production of certain microalgae-based products in Brazil. In connection with the establishment of the Solazyme Bunge JV, we entered into a development agreement and other agreements with Bunge and the Solazyme Bunge JV.
Our ability to generate value from the Solazyme Bunge JV depends on, among other things, our ability to work cooperatively with Bunge and the Solazyme Bunge JV for the commercialization of the Solazyme Bunge JV’s products. We may not be able to do so. For example, under the joint venture agreements, Bunge has agreed to provide feedstock as well as utility services to the Solazyme Bunge JV production facility.
23
In addition, Bunge has announced that it is actively pursuing strategic alternatives for its Brazilian sugarcane business, which could involve the divestment, in whole or in part, of the assets of such business. While a new controlling entity would remain subject to the terms of the feedstock and utility supply agreements, that entity may be less willing to cooperate with us or the Solazyme Bunge JV, which may adversely affect the development and commercialization of the Solazyme Bunge JV’s products.
We and Bunge each provide various administrative services to the Solazyme Bunge JV, and Bunge also provides working capital to the Solazyme Bunge JV through a revolving loan facility. Bunge does not have previous experience working with our technology, and we cannot be sure that the Solazyme Bunge JV will be successful in commercializing its products. In addition, there may be delays related to the acquisition of the facility site from Bunge and delays or cost overruns in connection with the ramp up and optimization of the Solazyme Bunge JV production facility. There may also be delays in our negotiation of the corporate loan guarantee to be entered into as a condition of the Solazyme Bunge JV drawing down amounts in excess of amounts supported by bank guarantees under the loan agreement with BNDES. In addition, we will be required to maintain the required license, granted by the Sao Paulo State Environmental Department, to operate the production facility. Any negative event with respect to these issues would delay the development and commercialization of the Solazyme Bunge JV products. Furthermore, the agreements governing our partnership are complex and cover a range of future activities, and disputes may arise between us and Bunge that could delay completion of the Solazyme Bunge JV facility and/or the expansion of the Solazyme Bunge JV’s capacity and the development and commercialization of the Solazyme Bunge JV’s products or cause the dissolution of the Solazyme Bunge JV.
Our joint venture with Roquette has been dissolved. We are currently in litigation with Roquette and we may have other disputes with Roquette related to the joint venture's business.
In 2010, we entered into a 50/50 joint venture with Roquette Frères, S.A. (“Roquette”). As part of this relationship, we and Roquette formed Solazyme Roquette Nutritionals, LLC (“SRN”) through which both we and Roquette agreed to pursue certain opportunities in microalgae-based products for the food, nutraceuticals and animal feed markets. On June 21, 2013, we and Roquette agreed to dissolve SRN. On July 18, 2013, SRN was dissolved. As a result of the dissolution, the joint venture and operating agreement between us and Roquette, and the license agreement, whereby we licensed to SRN certain of our intellectual property, automatically terminated.
We and Roquette engaged in an arbitration proceeding concerning the proper assignment of the intellectual property of SRN. In February 2015 the arbitration panel awarded all such intellectual property to us. In addition, Roquette commenced two separate actions in the U.S. District Court for the District of Delaware for declarations that, among other things, the arbitrators exceeded their authority by failing to render a timely arbitration award and as a result any orders or awards issued by the arbitrators are void. We do not believe that Roquette’s Delaware actions have merit and have counterclaimed for (i) confirmation of the arbitration award, (ii) an order compelling Roquette to comply with the arbitration award and (iii) damages for misappropriation of trade secrets, misuse of confidential information and breach of contract. We cannot be sure that other disputes will not arise between us and Roquette related to the joint venture's business. Such disagreements and disputes are costly, time-consuming to resolve and distracting to our management.
Disputes regarding our intellectual property rights, and the rights of others (including Roquette) to manufacture and sell the products included in the SRN joint venture could delay or negatively impact our commercialization of products in the markets SRN was targeting. Any such disputes could be costly, time-consuming to resolve and distracting to our management. In addition, if our commercialization in these markets is delayed or unsuccessful, our financial results could be negatively impacted.
We cannot be sure that our products will meet necessary standards or be approved or accepted by customers in our target markets.
If we are unable to convince our potential customers or end users of our products that we are a reliable supplier, that our products are comparable or superior to the products that they currently use, or that the use of our products is otherwise beneficial to them, we will not be successful in entering our target markets and our business will be adversely affected.
In the chemicals market, the potential customers for our or the Solazyme Bunge JV’s products are generally companies that have well-developed manufacturing processes and arrangements with suppliers for the chemical components of their products and may resist changing these processes and components. These potential customers frequently impose lengthy and complex product qualification procedures on their suppliers, influenced by consumer preference, manufacturing considerations, supplier operating history, regulatory issues, product liability and other factors, many of which are unknown to, or not well understood by, us. Satisfying these processes may take many months or years.
24
Although we produce products for the fuels market that comply with industry specifications, potential fuels customers may be reluctant to adopt new products. In addition, our fuels may need to satisfy product certification requirements of equipment manufacturers. For example, diesel engine manufacturers may need to certify that the use of diesel fuels produced from our oils in their equipment will not invalidate product warranties.
In the nutrition market, our food ingredients will compete with oils and other food ingredients currently in use. Potential customers may not perceive a benefit to microalgae-based ingredients as compared to existing ingredients or may be otherwise unwilling to adopt their use. If consumer packaged goods (“CPG”) companies do not accept our food ingredients as ingredients for their widely distributed finished products, or if end customers are unwilling to purchase finished products made using our products, we will not be successful in competing in the nutrition market and our business will be adversely affected.
In the oil field services market, Encapso™ will compete with incumbent drilling lubricants and other specialty lubricants. Potential customers may be reluctant to adopt an algae-based product because of their unfamiliarity with our technology. Encapso™ has been subjected only to a limited number of on-site drilling trials, and certain customers may require further data and operating history prior to committing to purchase.
In the skin and personal care market, our branded products are marketed directly to potential consumers, but we cannot be sure that consumers will continue to be attracted to our brands, be attracted to our new brands or products, or purchase our products on an ongoing basis. As a result, our branded products may not be successful, distribution partners may decide to discontinue marketing our products and our business will be adversely affected.
We have entered into a limited number of binding, definitive commercial supply agreements that contain minimum volume commitments. We also periodically enter contingent offtake agreements and non-binding letters of intent with third parties regarding purchase of our products, but these agreements do not unconditionally obligate the other party to purchase any quantities of any products at this time. There can be no assurance that contingent offtake agreements and non-binding letters of intent will lead to unconditional definitive agreements to purchase our products.
We have limited experience in structuring arrangements with customers for the purchase of our microalgae-based products, and we may not be successful in this essential aspect of our business.
We expect that our customers will include large companies that sell personal care products, food products and chemical products, as well as large users of oils for fuels and lubricants for oil field operations and other applications. Because we began commercializing our personal care products in the last few years, have only recently begun to commercialize food ingredient products on our own, and are still in the process of developing our products for the nutrition, fuels and chemicals, oil field services and other markets, we have limited experience operating in our customers’ industries and interacting with the customers that we intend to target. Developing the necessary expertise may take longer than we expect and will require that we expand and improve our sales and marketing capability, which could be costly. These activities could delay our ability to capitalize on the opportunities that we believe our technology and products present, and may prevent us from successfully commercializing our products. Further, we ultimately aim to sell large amounts of our products, and this will require that we effectively negotiate and manage contracts for these purchase and sale relationships. The companies with which we aim to have arrangements are generally much larger than we are and have substantially longer operating histories and more experience in their industries than we have. As a result, we may not succeed in establishing relationships with these companies and, if we do, we may not be effective in negotiating or managing the terms of such relationships, which could adversely affect our future results of operations.
We may be subject to product liability claims and other claims of our customers and partners.
The design, development, production and sale of our products involve an inherent risk of product liability claims and the associated adverse publicity. Because some of our ultimate products in each of our target markets are used by consumers, and because use of those ultimate products may cause injury to those consumers and damage to property, we are subject to a risk of claims for such injuries and damages. In addition, we may be named directly in product liability suits relating to our products or third-party products integrating our products, even for defects resulting from errors of our partners, contract manufacturers or other third parties working with our products. These claims could be brought by various parties, including customers who are purchasing products directly from us or other users who purchase products from our customers or partners. We could also be named as co-parties in product liability suits that are brought against manufacturing partners that produce our products.
In addition, our customers and partners may bring suits against us alleging damages for the failure of our products to meet stated claims, specifications or other requirements. Any such suits, even if not successful, could be costly, disrupt the attention of our management and damage our negotiations with other partners and/or customers. Although we often seek to
25
limit our product liability in our contracts, such limits may not be enforceable or may be subject to exceptions. Our current product liability and umbrella insurance for our business may be inadequate to cover all potential liability claims. Insurance coverage is expensive and may be difficult to obtain. Also, insurance coverage may not be available in the future on acceptable terms and may not be sufficient to cover potential claims. We cannot be sure that our contract manufacturers or manufacturing partners who produce our ultimate products will have adequate insurance coverage to cover against potential claims. If we experience a large insured loss, it may exceed our coverage limits, or our insurance carrier may decline to further cover us or may raise our insurance rates to unacceptable levels, any of which could impair our financial position and potentially cause us to go out of business.
We will face risks associated with our international business in developing countries and elsewhere.
For the foreseeable future, our business plan will likely subject us to risks associated with essential manufacturing, sales and operations in developing countries. We have limited experience to date manufacturing and selling internationally and such expansion will require us to make significant expenditures, including the hiring of local employees and establishing facilities, in advance of generating any revenue. The economies of many of the countries in which we or our joint ventures operate or will operate have been characterized by frequent and occasionally extensive government intervention and unstable economic cycles.
In addition, in Brazil, where the Solazyme Bunge JV is located, there are restrictions on the foreign ownership of land. As a result, the process for the acquisition by the Solazyme Bunge JV of the facility site from Bunge may be long, complicated and is subject to government approvals.
International business operations are subject to local legal, political, regulatory and social requirements and economic conditions and our business, financial performance and prospects may be adversely affected by, among others, the following factors:
• | political, economic, diplomatic or social instability; |
• | land reform movements; |
• | tariffs, export or import restrictions, restrictions on remittances abroad or repatriation of profits, duties or taxes that limit our ability to move our products out of these countries or interfere with the import of essential materials into these countries; |
• | inflation, changing interest rates and exchange controls; |
• | tax burden and policies; |
• | delays or failures in securing licenses, permits or other governmental approvals necessary to build and operate facilities and use our microalgae strains to produce products; |
• | the imposition of limitations on products or processes and the production or sale of those products or processes; |
• | uncertainties relating to foreign laws, including labor laws, regulations and restrictions, and legal proceedings; |
• | foreign ownership rules and changes in regard thereto; |
• | an inability, or reduced ability, to protect our intellectual property, including any effect of compulsory licensing imposed by government action; |
• | successful compliance with U.S. and foreign laws that regulate the conduct of business abroad, including the Foreign Corrupt Practices Act; |
• | insufficient investment in developing countries in public infrastructure, including transportation infrastructure, and disruption of transportation and logistics services; and |
• | difficulties and costs of staffing and managing foreign operations. |
These and other factors could have a material adverse impact on our results of operations and financial condition.
26
Our international operations may expose us to the risk of fluctuation in currency exchange rates and rates of foreign inflation, which could adversely affect our results of operations.
We currently incur some costs and expenses in Euros and Brazilian Reals and expect in the future to incur additional expenses in these and other foreign currencies, and also derive a portion of our revenues in the local currencies of customers throughout the world. As a result, our revenues and results of operations are subject to foreign exchange fluctuations, which we may not be able to manage successfully. During the past few decades, the Brazilian currency in particular has faced frequent and substantial exchange rate fluctuations in relation to the U.S. dollar and other foreign currencies. There can be no assurance that the Real or the Euro will not significantly appreciate or depreciate against the U.S. dollar in the future. We bear the risk that the rate of inflation in the foreign countries where we incur costs and expenses or the decline in value of the U.S. dollar compared to those foreign currencies will increase our costs as expressed in U.S. dollars. Future measures by foreign governments to control inflation, including interest rate adjustments, intervention in the foreign exchange market and changes to the fixed value of their currencies, may trigger increases in inflation. We may not be able to adjust the prices of our products to offset the effects of inflation on our cost structure, which could increase our costs and reduce our net operating margins. If we do not successfully manage these risks through hedging or other mechanisms, our revenues and results of operations could be adversely affected.
We may encounter difficulties managing our growth, and we will need to properly prioritize our efforts in four distinct target markets as our business grows. If we are unable to do so, our business, financial condition and results of operations may be adversely affected.
Our business has grown rapidly. Continued growth may place a strain on our human and capital resources. If we grow too rapidly or if our headcount or other aspects of our operating structure become misaligned with our strategy, we may need to reduce headcount or other operating costs. For example, in December 2014, as part of an adjustment to our operating and expense strategy related to the ramping up of the Solazyme Bunge JV production facility, we announced the intention to decrease operating expenses through a reduction in workforce and other cost-cutting measures. See the risk factor titled “We may experience significant delays and/or cost overruns in financing, designing, constructing and ramping up large commercial manufacturing facilities, which could result in harm to our business and prospects” above for more information. Such reductions in workforce can have an adverse effect on our business.
Furthermore, we intend to conduct our business internationally and anticipate business operations in the United States, Europe, Latin America and elsewhere. These diversified, global operations place increased demands on our limited resources and may require us to substantially expand the capabilities of our administrative and operational resources and will require us to attract, train, manage and retain qualified management, technicians, scientists and other personnel. As our operations expand domestically and internationally, we will need to continue to manage multiple locations and additional relationships with various customers, partners, suppliers and other third parties across several product categories and markets.
Our growth is taking place across four distinct target markets: fuels and chemicals, nutrition, oil field services and skin and personal care. We will be required to prioritize our limited financial and managerial resources as we pursue particular development and commercialization efforts in each target market. Any resources we expend on one or more of these efforts could be at the expense of other potentially profitable opportunities. If we focus our efforts and resources on one or more of these markets and they do not lead to commercially viable products, our revenues, financial condition and results of operations could be adversely affected. Furthermore, as our operations continue to grow, the simultaneous management of development, production and commercialization across all four target markets will become increasingly complex and may result in less than optimal allocation of management and other administrative resources, increase our operating expenses and harm our operating results.
Our ability to effectively manage our operations, growth and various projects across our target markets will require us to make additional investments in our infrastructure to continue to improve our operational, financial and management controls and our reporting systems and procedures and to attract and retain sufficient numbers of talented employees, which we may be unable to do effectively. We may be unable to successfully manage our expenses in the future, which may negatively impact our gross margins or operating margins in any particular quarter.
In addition, we may not be able to improve our management information and control systems, including our internal control over financial reporting, to a level necessary to manage our growth and we may discover deficiencies in existing systems and controls that we may not be able to remediate in an efficient or timely manner.
27
Our success depends in part on recruiting and retaining key personnel and, if we fail to do so, it may be more difficult for us to execute our business strategy. We are currently a small organization and will need to hire additional personnel to execute our business strategy successfully.
Our success depends on our continued ability to attract, retain and motivate highly qualified management, business development, manufacturing and scientific personnel and directors, and on our ability to develop and maintain important relationships with leading academic institutions and scientists. We are highly dependent upon a number of key members of our senior management, including manufacturing, business development and scientific personnel, and on our directors. If any of such persons left, our business could be harmed. All of our employees and directors are at-will and may resign at any time. The loss of the services of one or more of our key employees, or directors could delay or have an impact on the successful commercialization of our products. We do not maintain any key man insurance. Competition for qualified personnel in the biotechnology field is intense, particularly in the San Francisco Bay Area. We may not be able to attract and retain qualified personnel on acceptable terms given the competition for such personnel. In addition, the restructuring that we implemented in December 2014 could have an adverse impact on our ability to retain and recruit qualified personnel. If we are unsuccessful in our recruitment efforts, we may be unable to execute our strategy.
We may not be able to meet applicable regulatory requirements for the sale of our microalgae-based products and the operation of production facilities, and, even if requirements are met, complying on an ongoing basis with the numerous regulatory requirements applicable to our various product categories and facilities will be time-consuming and costly.
Our chemical products may be subject to government regulation in our target markets. In the United States, the EPA administers the Toxic Substances Control Act (“TSCA”), which regulates the commercial registration, distribution, and use of chemicals. TSCA will require us to comply with the Microbial Commercial Activity Notice (“MCAN”) process to manufacture and distribute products made from our recombinant microalgae strains. An MCAN is not required for non-recombinant strains. To date, we have filed MCANs for certain of our recombinant microalgae strains, all of which have been dropped from review. Our subsequent filing of Notices of Commencement (NOC) relating to previously filed MCANs allows us to commercially use these strains. We expect to file additional MCANs in the future.
Before we can manufacture or distribute significant volumes of a chemical, we need to determine whether that chemical is listed in the TSCA inventory. If the substance is listed, then manufacture or distribution can commence immediately. If not, then a pre-manufacture notice (“PMN”) must be filed with the EPA for a review period of up to 90 days excluding extensions. We have filed PMNs for certain of our products and expect to file additional PMNs in the future. Some of the products we produce or plan to produce are already on the TSCA inventory due to our successful PMN submissions and filed NOCs. Others are not yet listed. We may not be able to expediently receive approval from the EPA to list the chemicals we would like to make on the TSCA registry, resulting in delays or significant increases in testing requirements. A similar program exists in the European Union, called REACH (Registration, Evaluation, Authorization, and Restriction of Chemical Substances). We are required to register some of our products with the European Commission, and this process could cause delays or significant costs. We have determined that some of our algal oils are exempt from REACH registration requirements. To the extent that other geographies, such as Brazil, may rely on the TSCA or REACH for chemical registration in their geographies, delays with the U.S. or European authorities may subsequently delay entry into these markets as well. Furthermore, other geographies may have their own chemical inventory requirements, which may delay entry into these markets, irrespective of U.S. or European approval.
Our nutrition products are subject to regulation by various government agencies, including the U.S. Food and Drug Administration (“FDA”), state and local agencies and similar agencies outside the United States. Food ingredients are regulated either as food additives or as substances generally recognized as safe, or GRAS. A substance can be self-affirmed by its manufacturer upon determination that independent qualified experts would generally agree that the substance is GRAS for its intended conditions of use. A GRAS Notice for one algal oil was submitted to the FDA in June 2011, and a “no questions” letter was received from the FDA in June 2012. A GRAS Notice for each of whole algal flour and whole algal protein was submitted to the FDA, and a “no questions” letter was received for each from the FDA in 2013 for whole algal flour and 2014 for whole algal protein. A panel of qualified experts in the field of food toxicology has determined that an additional oleic algal oil, our second, is GRAS. This determination meets the FDA criteria of self-affirmed GRAS. We submitted a GRAS Notice for this second algal oil in July 2014 and received a “no questions” letter in February 2015. If the FDA were to disagree with the conclusions in future GRAS Notices of Determination, they could ask that the products be voluntarily withdrawn from the market or could initiate legal action to halt their sale. Such actions by the FDA could have an adverse effect on our business, financial condition, and results of our operations. Food ingredients that are not GRAS are regulated as food additives and require FDA approval prior to commercialization. The food additive petition process is generally expensive and time consuming, with approval, if secured, taking years.
28
The sale and/or use of diesel and jet fuels produced from our oils are subject to regulation by various government agencies, including the Environmental Protection Agency (“EPA”) and the California Air Resources Board in the United States. To date, we have registered only our Soladiesel®RD fuel in the United States. We or our refining or commercialization partners or customers may be required to register our fuel in the United States, with the European Commission and elsewhere before selling our products.
The sale of ingredients for use in animal feed is regulated by agencies including the FDA Center for Veterinary Medicine (“CVM”). Regulatory requirements for suitability must be met by providing data from studies, which may cause delays and the incursion of additional costs.
Our personal care products are subject to regulation by various government agencies both within and outside the United States. Such regulations principally relate to the ingredients, labeling, packaging and marketing of our personal care products.
Changes in regulatory requirements, laws and policies, or evolving interpretations of existing regulatory requirements, laws and policies, may result in increased compliance costs, delays, capital expenditures and other financial obligations that could adversely affect our business or financial results.
We expect to encounter regulations in most if not all of the countries in which we may seek to sell our products, and we cannot be sure that we will be able to obtain necessary approvals in a timely manner or at all. If our products do not meet applicable regulatory requirements in a particular country or at all, then we may not be able to commercialize them and our business will be adversely affected. The various regulatory schemes applicable to our products will continue to apply following initial approval for sale. Monitoring regulatory changes and ensuring our ongoing compliance with applicable requirements will be time-consuming and may affect our results of operations. If we fail to comply with such requirements on an ongoing basis, we may be subject to fines or other penalties, or may be prevented from selling our products, and our business may be harmed.
The construction and operation of our, our partners’ or our joint ventures’ production facilities are likely to require government approvals. If we are not able to obtain or maintain the necessary approvals in a timely manner or at all, our business will be adversely affected. In February 2014, the Sao Paulo State Environmental Department granted a license to operate the Solazyme Bunge JV facility, which was necessary to begin commercial production.
We may incur significant costs complying with environmental, health and safety laws and regulations, and failure to comply with these laws and regulations could expose us to significant liabilities.
We use hazardous chemicals and radioactive and biological materials in our business and are subject to a variety of federal, state, local and international laws and regulations governing, among other matters, the use, generation, manufacture, transportation, storage, handling, disposal of, and human exposure to, these materials both in the U.S. and outside the U.S., including regulation by governmental regulatory agencies, such as the Occupational Safety and Health Administration and the EPA. We have incurred, and will continue to incur, capital and operating expenditures and other costs in the ordinary course of our business in complying with these laws and regulations.
Although we have implemented safety procedures for handling and disposing of these materials and waste products in an effort to comply with these laws and regulations, we cannot be sure that our safety measures will be compliant or capable of eliminating the risk of injury or contamination from the generation, manufacturing, use, storage, transportation, handling, disposal of, and human exposure to, hazardous materials. Failure to comply with environmental, health and safety laws could subject us to liability and resulting damages. There can be no assurance that violations of environmental, health and safety laws will not occur as a result of human error, accident, equipment failure or other causes. Compliance with applicable environmental laws and regulations may be expensive, and the failure to comply with past, present, or future laws could result in the imposition of fines, regulatory oversight costs, third party property damage, product liability and personal injury claims, investigation and remediation costs, the suspension of production, or a cessation of operations, and our liability may exceed our total assets. Liability under environmental laws, such as the Comprehensive Environmental Response Compensation and Liability Act in the United States, can impose liability for the full amount of damages, without regard to comparative fault for the investigation and cleanup of contamination and impacts to human health and for damages to natural resources. Contamination at properties we own and operate, and at properties to which we send hazardous materials, may result in liability for us under environmental laws and regulations.
Our business and operations will be affected by other new environmental, health and safety laws and regulations, which may affect our research and development and manufacturing programs, and environmental laws could become more stringent over time, requiring us to change our operations, or resulting in greater compliance costs and increasing risks and penalties associated with violations, which could impair our research, development or production efforts and harm our business. The
29
costs of complying with environmental, health and safety laws and regulations, and any claims concerning noncompliance, or liability with respect to contamination in the future could have a material adverse effect on our financial condition or operating results.
Changes in government regulations, including subsidies and economic incentives, could have a material adverse effect on demand for our products, business or results of operations.
The market for renewable fuels is heavily influenced by foreign, federal, state and local government regulations and policies. Changes to existing, or adoption of new, domestic or foreign federal, state or local legislative initiatives that impact the production, distribution, sale or import and export of renewable fuels may harm our business. For example, in 2007, the Energy Independence and Security Act (“EISA”) of 2007 set targets for alternative sourced liquid transportation fuels (approximately 14 billion gallons in 2011, increasing to 36 billion gallons by 2022). Of the 2022 target amount, a minimum of 21 billion gallons must be advanced biofuels. In the U.S. and in a number of other countries, these regulations and policies have been modified in the past and may be modified again in the future. For example, in 2013, the U.S. Environmental Protection Agency (EPA) proposed a reduction in the volume of total alternative fuel from the 2014 statutory target of 18.15 billion gallons to 15.21 billion gallons. In addition, the EPA issued a notification of delay in issuing the 2014 standards for the renewable fuel standard program. In light of this delay, the compliance demonstration deadline for the 2013 renewable fuel standards will take place in 2015. The elimination of, or any additional reduction in, mandated requirements for fuel alternatives and additives to gasoline may cause demand for biofuels to decline and deter investment in the research, development or commercial adoption of renewable fuels.
In addition, the U.S. Congress has passed legislation that extends tax credits to blenders of certain renewable fuel products. However, there is no assurance that this or any other favorable legislation will remain in place. For example, the biodiesel tax credit expired in December 2009 and its extension was not approved until March 2010. The most recent biodiesel tax credit expired in December 2013 and its extension has thus far not been approved. Any reduction in, phasing out or elimination of existing tax credits, subsidies and other incentives in the U.S. and foreign markets for renewable fuels, or any inability of our customers to access such credits, subsidies and incentives, may adversely affect demand for our fuel products and increase the overall cost of commercialization of our renewable fuels, which would adversely affect our business.
In addition, market uncertainty regarding future policies may also affect our ability to develop new renewable products, license our technologies to third parties and sell products to end customers. Any inability to address these requirements and any regulatory or policy changes could have a material adverse effect on our business, financial condition and results of operations.
Conversely, government programs could increase investment and competition in the markets for our products. For example, various governments have announced a number of spending programs focused on the development of clean technology, including alternatives to petroleum-based fuels and the reduction of greenhouse gas (“GHG”) emissions, which could lead to increased funding for us or our competitors, or the rapid increase in the number of competitors within our markets.
Concerns associated with renewable fuels, including land usage, national security interests and food crop usage, are receiving legislative, industry and public attention. This could result in future legislation, regulation and/or administrative action that could adversely affect our business. When and how these requirements and any regulatory or policy changes are addressed could have a material adverse effect on our business, financial condition and results of operations.
Future government policies may adversely affect the supply of sugarcane, corn or cellulosic sugars, restricting our ability to use these feedstocks to produce our products, and negatively impact our revenues and results of operations.
We may face risks relating to the use of our targeted recombinant microalgae strains, and if we are not able to meet applicable regulatory requirements for the use of these strains or if we face material ethical, legal and social concerns about our use of targeted recombinant technology, our business could be adversely affected.
The use of microorganisms designed using targeted recombinant technology, such as some of our microalgae strains, is subject to laws and regulations in many states and countries, some of which are new and still evolving and interpreted by fact specific application. In the United States, the EPA regulates the commercial use of microorganisms designed using targeted recombinant technology as well as potential products derived from them.
We expect to encounter regulations of microorganisms designed using targeted recombinant technology in most if not all of the countries in which we may seek to establish manufacturing operations, and the scope and nature of these regulations will likely be different from country to country. For example, in the U.S., when used in an industrial process, our microalgae strains designed using targeted recombinant technology may be considered new chemicals under the TSCA, administered by the EPA. We will be required to comply with the EPA’s process. In Brazil, microorganisms designed using targeted recombinant
30
technology are regulated by the National Biosafety Technical Commission, or CTNBio. In March 2013, we submitted an application for approval from CTNBio to use a specific microalgae strain designed using targeted recombinant technology in a contained environment in order to use these microalgae for research and development and commercial production purposes in any facilities we establish in Brazil. We obtained approval for this application from CTNBio in October 2013. In February 2014, CTNBio granted a CQB (Certificate of Quality in Biosafety) to the Solazyme Bunge JV facility for activities including industrial production, import and export, disposal and storage of our key production organisms. If we cannot meet the applicable requirements in countries in which we intend to produce microalgae-based products, or if it takes longer than anticipated to obtain such approvals, our business could be adversely affected.
The subject of organisms designed using targeted recombinant technology has received negative publicity, which has aroused public debate. Public attitudes about the safety and environmental hazards of, and ethical concerns over, genetic research and microorganisms designed using targeted recombinant technology could influence public acceptance of our technology and products. In addition, shifting public attitudes regarding, and potential changes to laws governing, ownership of genetic material could harm our intellectual property rights with respect to our genetic material and discourage collaborators from supporting, developing, or commercializing our products, processes and technologies. Governmental reaction to negative publicity concerning organisms designed using targeted recombinant technology could result in greater government regulation of or trade restrictions on imports of genetic research and derivative products. If we and/or our collaborators are not able to overcome the ethical, legal, and social concerns relating to the use of targeted recombinant technology, our products and processes may not be accepted or we could face increased expenses, delays or other impediments to their commercialization.
We expect to face competition for our products in the fuels and chemicals markets from providers of products based on petroleum, plant oils and animal fats and from other companies seeking to provide alternatives to these products, many of whom have greater resources and experience than we do. If we cannot compete effectively against these companies or products, we may not be successful in bringing our products to market or further growing our business.
In the chemical market, we will compete with the established providers of oils currently used in chemical products. Producers of these incumbent products include global oil companies, including those selling agricultural products such as palm oil, palm kernel oil, castor bean oil and sunflower oil, large international chemical companies and other companies specializing in specific products or essential oils. We may also compete in one or more of these markets with manufacturers of other products such as highly refined petrochemicals, synthetic polymers and other petroleum-based fluids and lubricants as well as new market entrants offering renewable products.
In the transportation fuels market, we expect to compete with independent and integrated oil refiners, large oil and gas companies and, in certain fuels markets, with other companies producing advanced biofuels. The refiners compete with us by selling conventional fuel products, and some are also pursuing hydrocarbon fuel production using non-renewable feedstocks, such as natural gas and coal, as well as production using renewable feedstocks, such as vegetable oil and biomass. We also expect to compete with companies that are developing the capacity to produce diesel and other transportation fuels from renewable resources in other ways. These include advanced biofuels companies using specific engineered enzymes that they have developed to convert cellulosic biomass, which is non-food plant material such as wood chips, corn stalks and sugarcane bagasse, into fermentable sugars and ultimately, renewable diesel and other fuels. Biodiesel companies convert vegetable oils and animal oils into diesel fuel and some are seeking to produce diesel and other transportation fuels using thermochemical methods to convert biomass into renewable fuels.
We believe the primary competitive factors in both the fuels and chemicals markets are product price, product performance, sustainability, availability of supply and compatibility of products with existing infrastructure.
The oil companies, large chemical companies and well-established agricultural products companies with whom we expect to compete are much larger than we are, have, in most cases, well-developed distribution systems and networks for their products, have valuable historical relationships with the potential customers we are seeking to serve and have much more extensive sales and marketing programs in place to promote their products. Some of our competitors may use their influence to impede the development and acceptance of our products. Our limited resources relative to many of our competitors may cause us to fail to anticipate or respond adequately to new developments and other competitive pressures. In the nascent markets for renewable fuels and chemicals, it is difficult to predict which, if any, market entrants will be successful, and we may lose market share to competitors producing new or existing renewable products.
We expect to face competition for our nutrition and skin and personal care products from other companies in these fields, many of whom have greater resources and experience than we do. If we cannot compete effectively against these companies or their products, we may not be successful in selling our products or further growing our business.
31
We expect that our nutrition products will compete with providers in both the specialty and mass food ingredient markets. Many of these companies, such as Cargill, Incorporated, Monsanto Company, Syngenta AG and Roquette Frères, S.A., are larger than we are, have well-developed distribution systems and networks for their products and have valuable historical relationships with the potential customers and distributors we hope to serve. We may also compete with companies seeking to produce nutrition products based on renewable oils, including DSM Food Specialties and DuPont Nutrition & Health. Our success in the development of nutrition products will depend on our ability to effectively compete with established companies and successfully commercialize our products.
In the skin and personal care market, we expect to compete with established companies and brands with loyal customer followings. The market for skin and personal care products is characterized by strong established brands, loyal brand following and heavy brand marketing. We will compete with companies with well-known brands such as Kinerase®, Perricone MD®, and StriVectin®. These companies have greater sales and marketing resources than us. We will also compete in the mass consumer market. Some of our competitors in this market have well-known brands such as Meaningful Beauty® and Principal Secret® and have substantially greater sales and marketing resources than us. We have limited experience in the skin and personal care market. We will need to continue to devote substantial resources to the marketing of our products and there can be no assurance that we will be successful.
We expect to face competition in the oil field services market.
We expect that Encapso™ will compete with incumbent drilling lubricant products that are marketed by larger companies with significantly greater resources and experience. Such competitors compete vigorously on fluids performance and price. These companies have broad product and service offerings in addition to their drilling fluids. These larger companies may attempt to compete by offering discounts to customers to use multiple products and services, some of which we do not offer. We may also compete with regional companies that compete on price, performance and local relationships. Our success in this target market will depend on our ability to effectively compete with these established companies, and we may not be able to do so effectively.
A decline in the price of petroleum and petroleum-based products, plant oils or other commodities may reduce demand for our products and may otherwise adversely affect our business.
We anticipate that most of our oils, and in particular those used to produce fuels, will be marketed as alternatives to corresponding products based on petroleum and plant oils. When the price of any of these oils falls, as they have recently, we may be unable to produce algal oils or other products that are cost-effective alternatives to their petroleum or plant oil-based counterparts. Declining oil prices, or the perception of a future decline in oil prices, may adversely affect the prices we can obtain from our potential customers or prevent potential customers from entering into agreements with us to buy our products. During sustained periods of lower oil prices we may be unable to sell our products, which could materially and adversely affect our operating results. For example, in part as a result of the recent drop in the prices of petroleum and certain plant oils, the ramp up of the Solazyme Bunge JV’s production facility in Brazil will be slower than, and the mix of products manufactured in that facility and in the Clinton facility will be different from, what we previously anticipated as production will be focused primarily on higher margin products.
Petroleum prices have been extremely volatile, and this volatility is expected to persist. Lower petroleum prices over extended periods of time may change the perceptions in government and the private sector that cheaper, more readily available energy alternatives should be developed and produced. If petroleum prices remain at present levels or decline to lower levels for extended periods of time, the demand for renewable fuels could be reduced, and our business and revenue may be harmed.
Prices of plant oils have also experienced significant volatility. If prices for oils such as palm kernel were to materially decrease in the future, there may be less demand for oil alternatives, which could reduce demand for our products and harm our business. The prices of commodities that serve as food ingredients have also been volatile. To the extent that the prices of these commodities decline and remain at lower levels for extended periods of time, the demand for our nutrition products may be reduced, and our ability to successfully compete in this market may be harmed.
Our information technology systems, processes and sites may suffer a significant breach or disruption that may adversely affect our ability to conduct our business.
Our information technology systems, some of which are dependent on services provided by third parties, provide critical data and services for internal and external users, including procurement and inventory management, transaction processing, financial, commercial and operational data, human resources management, legal and tax compliance information and other information and processes necessary to operate and manage our business. Our information technology and infrastructure may
32
experience attacks by hackers, breaches or other failures or disruptions that could compromise our systems and the information stored there. While we have implemented security measures and disaster recovery plans designed to protect the security and continuity of our networks and critical systems, these measures may not adequately prevent adverse events such as breaches or failures from occurring or mitigate their severity if they do occur. If our information technology systems are breached, damaged or fail to function properly due to any number of causes, such as security breaches or cyber-based attacks, systems implementation difficulties, catastrophic events or power outages, and our security, contingency or disaster recovery plans do not effectively mitigate these occurrences on a timely basis, we may experience a material disruption in our ability to manage our business operations. We may also be subject to legal claims or proceedings, liability under laws that protect the privacy of personal information, potential regulatory penalties and damage to our reputation. The occurrence of any of these events may adversely impact our business, results of operations and financial condition, as well as our competitive position.
Our facilities in California are located near an earthquake fault, and an earthquake or other natural disaster or resource shortage could disrupt our operations.
Important documents and records, such as hard copies of our laboratory books and records for our products and some of our manufacturing operations, are located in our corporate headquarters in South San Francisco, California, near active earthquake zones. In the event of a natural disaster, such as an earthquake, drought or flood, or localized extended outages of critical utilities or transportation systems, we do not have a formal business continuity or disaster recovery plan, and could therefore experience a significant business interruption. In addition, California from time to time has experienced shortages of water, electric power and natural gas. Future shortages and conservation measures could disrupt our operations and could result in additional expense. Although we maintain business interruption insurance coverage, we do not maintain earthquake or flood coverage.
Risks Related to Our Intellectual Property
Our competitive position depends on our ability to effectively obtain and enforce patents related to our products, manufacturing components and manufacturing processes. If we or our licensors fail to adequately protect this intellectual property, our ability and/or our partners’ ability to commercialize products could suffer.
Our success depends in part on our ability to obtain and maintain patent protection sufficient to prevent others from utilizing our manufacturing components, manufacturing processes or marketing our products, as well as to successfully defend and enforce our patents against infringement by others. In order to protect our products, manufacturing components and manufacturing processes from unauthorized use by third parties, we must hold patent rights that cover our products, manufacturing components and manufacturing processes.
The patent position of biotechnology and bio-industrial companies can be highly uncertain because obtaining and determining the scope of patent rights involves complex legal and factual questions. The standards applied by the U.S. Patent and Trademark Office and foreign patent offices in granting patents are not always applied uniformly or predictably. There is no uniform worldwide policy regarding patentable subject matter, the scope of claims allowable in biotechnology and bio-industrial patents, or the formal requirements to obtain such patents. Consequently, patents may not issue from our pending patent applications. Furthermore, in the process of seeking patent protection or even after a patent is granted, we could become subject to expensive and protracted proceedings, including patent interference, opposition, post-grant review and re-examination proceedings, which could invalidate or narrow the scope of our patent rights. As such, we do not know nor can we predict the scope and/or breadth of patent protection that we might obtain on our products and technology.
Changes either in patent laws or in interpretations of patent laws in the United States and other countries may diminish the value of our intellectual property rights. In the U.S., depending on the decisions and actions taken by the U.S. Congress, the federal courts, and the U.S. Patent and Trademark Office, the laws and regulations governing patents could change in unpredictable ways that would weaken our ability to obtain new patents or to enforce our existing patents and patents that we might obtain in the future. In foreign jurisdictions, depending on the decisions and actions taken by the foreign government, the judicial system of the jurisdiction, and its patent office, the laws and regulations governing patents could change in unpredictable ways that could weaken our ability to obtain new patents or to enforce our existing patents or patents that we might obtain in the future.
The America Invents Act (“AIA”), which was signed into law on September 16, 2011, brought a number of changes to the U.S. patent system and affects the way patents are prosecuted, challenged and litigated. Among the changes that went into effect September 16, 2012, one of the most significant involves the implementation of a reformed post-grant review system. Other changes, which went into effect on March 16, 2013, include the transition from a “first-to-invent” to “first-to-file” system that attempts to harmonize the U.S. with most of the world. Lack of precedential interpretation of the new provisions of the AIA
33
through specific cases or through guidelines promulgated by the U.S. Patent and Trademark Office and the lack of binding precedent from the courts increase the uncertainty of the impact of the AIA. Together, these changes may increase the costs of prosecution and enforcement of U.S. patents. While it is currently unclear what impact these changes will have on the operation of our business, they may favor companies able to dedicate more resources to patent filings and challenges.
Risks associated with enforcing our intellectual property rights in the United States.
If we were to initiate legal proceedings against a third party to enforce a patent claiming one of our technologies, the defendant could counterclaim that our patent is invalid and/or unenforceable or assert that the patent does not cover its manufacturing processes, manufacturing components or products. Proving patent infringement may be difficult, especially where it is possible to manufacture a product by multiple processes or when a patented process is performed by multiple parties. Patent litigation is also costly, time-consuming and distracting to our management. Furthermore, in patent litigation in the United States or elsewhere, defendant counterclaims alleging both invalidity and unenforceability are commonplace. Although we believe that we have conducted our patent prosecution in accordance with the duty of candor and in good faith, the outcome following legal assertions of invalidity and unenforceability during patent litigation is unpredictable. With respect to the validity of our patent rights, we cannot be certain, for example, that there is no invalidating prior art, of which we and the patent examiner were unaware during prosecution. If a defendant were to prevail on a legal assertion of invalidity and/or unenforceability, we would not be able to exclude others from practicing the inventions claimed therein. Such a loss of patent protection could have a material adverse effect on our business. Defendant counterclaims of antitrust or other anti-competitive conduct are also commonplace.
Even if our patent rights are found to be valid and enforceable, patent claims that survive litigation may not cover commercially viable products or prevent competitors from importing or marketing products similar to our own, or using manufacturing processes or manufacturing components similar to our own.
Although we believe we have obtained valid assignments of patent rights from all inventors, if an inventor did not adequately assign their patent rights to us, a third party could obtain a license to the patent from such inventor. This could preclude us from enforcing the patent against such third party.
We may not be able to enforce our intellectual property rights throughout the world.
The laws of some foreign countries where we intend to produce and use our proprietary strains in collaboration with sugar mills or other feedstock suppliers do not protect intellectual property rights to the same extent as the laws of the United States. Many companies have encountered significant problems in protecting and defending intellectual property rights in certain foreign jurisdictions. The legal systems of certain countries, including Brazil,, do not favor the enforcement of patents and other intellectual property protection, particularly those relating to biotechnology and/or bio-industrial technologies. This could make it difficult for us to stop the infringement of our patents or misappropriation of our intellectual property rights in these countries. Proceedings to enforce our patent rights in certain foreign jurisdictions are unpredictable and could result in substantial costs and divert our efforts and attention from other aspects of our business. Accordingly, our efforts to protect our intellectual property rights in such countries may be inadequate.
Third parties may misappropriate our proprietary strains, information, or trade secrets despite a contractual obligation not to do so.
Third parties (including joint venture, collaboration, development and feedstock partners and former partners, contract manufacturers, and other contractors and shipping agents) often have custody or control of our proprietary microbe strains. If our proprietary microbe strains were stolen, misappropriated or reverse engineered, they could be used by other parties who may be able to use our strains or reverse-engineered strains for their own commercial gain. It is difficult to prevent misappropriation or subsequent reverse engineering. In the event that our proprietary microbe strains are misappropriated, it could be difficult for us to challenge the misappropriation or prevent reverse engineering, especially in countries with limited legal and intellectual property protection.
Confidentiality agreements with employees and third parties may not prevent unauthorized disclosure of proprietary information and trade secrets.
In addition to patents, we rely on confidentiality agreements to protect our technical know-how and other proprietary information. Confidentiality agreements are used, for example, when we talk to potential strategic partners. In addition, each of our employees signed a confidentiality agreement upon joining our company. Nevertheless, there can be no guarantee that an employee or an outside party will not make an unauthorized disclosure or use of our proprietary confidential information. This might happen intentionally or inadvertently. It is possible that a competitor will make use of such information, and that our
34
competitive position will be compromised, in spite of any legal action we might take against persons making such unauthorized disclosures.
We also keep as trade secrets certain technical and proprietary information where we do not believe patent protection is appropriate, desirable or obtainable. However, trade secrets are difficult to protect. Although we use reasonable efforts to protect our trade secrets, our employees, consultants, contractors, outside scientific collaborators, partners, former partners and other advisors may unintentionally or willfully disclose our trade secrets to competitors or otherwise use misappropriated trade secrets to compete with us. It can be expensive and time consuming to enforce a claim that a third party illegally obtained and is using our trade secrets. Furthermore, the outcome of such claims is unpredictable. In addition, courts outside the United States may be less willing to or may not protect trade secrets. Moreover, our competitors may independently design around our intellectual property or develop equivalent knowledge, methods and know-how without misappropriating or otherwise violating our trade secret rights. Where a third party independently designs around our intellectual property or develops equivalent knowledge, methods and know-how without misappropriating or otherwise violating our trade secret rights, they may be able to seek patent protection for such equivalent knowledge, methods and know-how. This could prohibit us from practicing our trade secrets.
Claims by patent holders that our products or manufacturing processes infringe their patent rights could result in costly litigation or could require substantial time and money to resolve, whether or not we are successful, and an unfavorable outcome in these proceedings could have a material adverse effect on our business.
Our ability to commercialize our technology depends on our ability to develop, manufacture, market and sell our products without infringing the proprietary rights of patent holders or their authorized agents. An issued patent does not guarantee us the right to practice or utilize the patented inventions or commercialize the patented product. Third parties may have blocking patents that may prevent us from commercializing our patented products and utilizing our patented manufacturing components and manufacturing processes. In the event that we are made aware of blocking third party patents, we cannot be sure that licenses to the blocking third-party patents would be available or obtainable on terms favorable to us or at all.
Numerous U.S. and foreign issued patents and pending patent applications, which are owned by third parties, relate to (1) the production of bio-industrial products, including edible ingredients, oils, chemicals, drilling fluids and biofuels, and (2) the use of microalgae strains, such as microalgae strains containing genes to alter oil composition. As such, there could be existing valid patents that our manufacturing processes, manufacturing components, or products may inadvertently infringe. There could also be existing invalid or unenforceable patents that could nevertheless be asserted against us and would require expenditure of resources to defend. In addition, there are pending patent applications that are currently unpublished and therefore unknown to us that may later result in issued patents that are infringed by our products, manufacturing processes or other aspects of our business.
We may be exposed to future litigation based on claims that our products, manufacturing processes or manufacturing components infringe the intellectual property rights of others. There is inevitable uncertainty in any litigation, including patent litigation. Defending against claims of patent infringement is costly and time consuming, regardless of the outcome. Thus, even if we were to ultimately prevail, or to settle at an early stage of litigation, such litigation could burden us with substantial unanticipated costs. Some of our competitors are larger than we are and have substantially greater resources. These competitors are, therefore, likely to be able to sustain the costs of complex patent litigation longer than we could. In addition, the costs and uncertainty associated with patent litigation could have a material adverse effect on our ability to continue our internal research and development programs, in-license needed technology, or enter into strategic partnerships that would help us commercialize our technologies. In addition, litigation or threatened litigation could result in significant demands on the time and attention of our management team, distracting them from the pursuit of other company business.
If a party successfully asserts a patent or other intellectual property rights against us, we might be barred from using certain of our manufacturing processes or manufacturing components, or from developing and commercializing related products. Injunctions against using specified processes or components, or prohibitions against commercializing specified products, could be imposed by a court or by a settlement agreement between us and a third party. In addition, we may be required to pay substantial damage awards to the third party, including treble or enhanced damages if we are found to have willfully infringed the third party’s intellectual property rights. We may also be required to obtain a license from the third party in order to continue manufacturing and/or marketing the products that were found to infringe. It is possible that the necessary license will not be available to us on commercially acceptable terms, or at all. This could limit our ability to competitively commercialize some or all of our products.
35
During the course of any patent litigation, there could be public announcements of the results of hearings, rulings on motions, and other interim proceedings in the litigation. If securities analysts or investors regard these announcements as negative, the perceived value of our products, technology or intellectual property could be diminished. Accordingly, the market price of our common stock may decline.
We have received government funding in connection with the development of certain of our proprietary technologies, which could negatively affect our intellectual property rights in such technologies.
Some of our proprietary technology was developed with U.S. federal government funding. When new technologies are developed with U.S. government funding, the government obtains certain rights in any resulting patents, including a nonexclusive license authorizing the government to use the invention for non-commercial purposes. These rights may permit the government to disclose our confidential information to third parties and to exercise “march-in” rights to use or allow third parties to use our patented technology. The government can exercise its march-in rights if it determines that action is necessary because we fail to achieve practical application of the U.S. government-funded technology, because action is necessary to alleviate health or safety needs, to meet requirements of federal regulations, or to give preference to U.S. industry. In addition, U.S. government-funded inventions must be reported to the government and U.S. government funding must be disclosed in any resulting patent applications. In addition, our rights in such inventions are subject to government license rights and foreign manufacturing restrictions. Any exercise by the government of such rights could harm our competitive position or impact our operating results.
In addition, some of our technology was funded by a grant from the State of California. Inventions funded by this grant may be subject to forfeiture if we do not seek to patent or practically apply them. Any such forfeiture could have a materially adverse effect on our business. For proprietary technology developed with funding from the State of California, certain confidential information may be disclosed to third parties by the State of California. Our rights in such inventions are subject to State of California license and march-in rights. Any exercise by the State of California of such rights could harm our competitive position or impact our operating results.
Risks Related to Our Finances and Capital Requirements
Our financial results could vary significantly from quarter to quarter and are difficult to predict.
Our revenues and results of operations could vary significantly from quarter to quarter because of a variety of factors, many of which are outside of our control. As a result, comparing our results of operations on a period-to-period basis may not be meaningful. Factors that could cause our quarterly results of operations to fluctuate include:
• | achievement, or failure to achieve, technology or product development milestones needed to allow us to enter target markets on a cost effective basis; |
• | delays or greater than anticipated expenses or time associated with the completion of new manufacturing facilities and the ramp up to nameplate capacity and optimization of production following completion of a new manufacturing facility; |
• | delays or greater than anticipated expenses associated with the provision of key support and/or operational services to manufacturing facilities; |
• | our capital requirements or capital requirements of our joint ventures; |
• | our ability to effectively manage larger working capital positions as we increase commercial production and distribution of our products; |
• | disruptions in the production process at any facility where we produce our products, including due to equipment failure or accidents; |
• | the timing, size and mix of sales to customers for our products; |
• | increases in price or decreases in availability of feedstocks; |
• | fluctuations in the price of, and demand for, products based on petroleum or other oils for which our products are alternatives; |
• | the unavailability of contract manufacturing capacity altogether or at anticipated cost; |
36
• | fluctuations in foreign currency exchange rates; |
• | seasonal production and sale of our products; |
• | the effects of competitive pricing pressures, including decreases in average selling prices of our products; |
• | unanticipated expenses associated with changes in governmental regulations and environmental, health and safety requirements; |
• | reductions or changes to existing regulations and policies that impact the fuel, chemical, nutrition, oil field services or skin and personal care markets; |
• | departure of key employees; |
• | business interruptions, such as earthquakes and other natural disasters; |
• | our ability to integrate businesses that we may acquire; |
• | risks associated with the international aspects of our business; and |
• | changes in general economic, industry and market conditions, both domestically and in foreign markets in which we operate. |
Due to these factors and others the results of any quarterly or annual period may not meet our expectations or the expectations of our investors and may not be meaningful indications of our future performance.
We may require additional financing in the future and may not be able to obtain such financing on favorable terms, if at all, which could force us to delay, reduce or eliminate our research and development or commercialization activities.
To date, we have financed our operations primarily through our initial public offering, completed in June 2011, public and private placements of our equity and convertible debt securities, credit facilities, government grants and funding from strategic partners. In January 2013 we issued $125.0 million aggregate principal amount of convertible senior subordinated notes due 2018 (the “2018 Notes”). The 2018 Notes bear interest at a rate of 6.00% per year, payable in cash semi-annually. As of March 31, 2014, approximately $61.3 million aggregate principal amount of the 2018 Notes was outstanding. In April 2014 we issued 5,750,000 shares of our common stock and $149.5 million aggregate principal amount of convertible senior subordinated notes due 2019 (the “2019 Notes”). The 2019 Notes bear interest at a rate of 5.00% per year, payable in cash semi-annually. We have also entered into the HSBC facility that provides for a $35.0 million revolving facility for working capital and letters of credit. While we plan to enter into relationships with partners or collaborators for them to provide some portion or all of the capital needed to build production facilities, we may determine that it is more advantageous for us to provide some portion or all of the financing for new production facilities. Some of our previous funding has come from government grants; however, our future ability to obtain government grants is uncertain due to the competitive bid process and other factors.
In addition, we may have to raise additional funds through public or private debt or equity financings to meet our capital requirements, including our portion of joint venture funding requirements. For example, although the Solazyme Bunge JV entered a loan agreement with BNDES for project financing funding to support the joint venture’s production facility in Brazil, including a portion of the construction costs of the facility, and has drawn on the funds, if we are unable to finalize the corporate guarantee documentation on acceptable terms, the Solazyme Bunge JV will be unable to draw down amounts under the loan in excess of amounts supported by bank guarantees and may have to seek additional financing. If the Solazyme Bunge JV is unable to secure additional financing, we will be required to fund our portion of the Solazyme Bunge JV’s capital requirements from existing sources or seek additional financing. In addition, our working capital requirements and the working capital requirements of the Solazyme Bunge JV are likely to increase as we and the Solazyme Bunge JV each increase production due to an increase in inventory and the manufacture of out-of-specification product during the ramp-up of commercial production. We may not be able to raise sufficient additional funds on terms that are favorable to us, if at all. If we fail to raise sufficient funds and continue to incur losses, our ability to fund our operations, take advantage of strategic opportunities, develop and commercialize products or technologies, or otherwise respond to competitive pressures could be significantly limited. If this happens, we may be forced to delay or terminate research and development programs or the commercialization of products resulting from our technologies, curtail or cease operations or obtain funds through collaborative and licensing arrangements that may require us to relinquish commercial rights, or grant licenses on terms that are not favorable to us. If adequate funds are not available, we will not be able to successfully execute our business plan or continue our business.
37
Servicing our debt will require a significant amount of cash, and we may not have sufficient cash flow from our business to pay amounts due under our indebtedness.
As of December 31, 2014, our total consolidated indebtedness was $211.1 million. Of our $211.1 million of indebtedness, $6,000 is currently secured. In the event the Solazyme Bunge JV draws funds under the BNDES loan in excess of the amount supported by bank guarantees, we may be required to provide a corporate guarantee with respect to such excess amount.
Our ability to make scheduled payments of the principal of, to pay interest on or to refinance our indebtedness, including the 2018 Notes and the 2019 Notes, depends on our future performance, which is subject to economic, financial, competitive and other factors beyond our control. Our business may not continue to generate cash flow from operations in the future sufficient to service our debt and make necessary capital expenditures. If we are unable to generate such cash flow, we may be required to adopt one or more alternatives, such as selling assets, restructuring debt or obtaining additional equity capital on terms that may be onerous or highly dilutive. Our ability to refinance our indebtedness will depend on the capital markets and our financial condition at such time. We may not be able to engage in any of these activities or engage in these activities on desirable terms, which could result in a default on our debt obligations.
Despite our current debt levels, we may still incur substantially more debt or take other actions which would intensify the risks discussed above.
Despite our current consolidated debt levels, we and our subsidiaries may be able to incur substantial additional debt in the future, subject to the restrictions contained in our debt instruments, some of which may be secured debt. We are not restricted under the terms of the indentures governing the 2018 Notes and 2019 Notes from incurring additional debt, securing existing or future debt, recapitalizing our debt or taking a number of other actions that are not limited by the terms of the indentures governing the 2018 Notes and the 2019 Notes that could have the effect of diminishing our ability to make payments on the notes when due. Our existing HSBC facility restricts our ability to incur additional indebtedness, including secured indebtedness, but if the facility matures or is repaid, we may not be subject to such restrictions under the terms of any subsequent indebtedness.
We have received government grant funding and entered contracts with government agencies, and may pursue government grant funding or contracts in the future. Our receipt of government funds through grants and contracts subjects us to additional regulatory oversight.
We have received government grants and have entered contracts with government agencies in the past. Activities funded by a government grant or pursuant to government contracts are subject to audits by government agencies. As part of an audit, these agencies may review our performance, cost structures and compliance with applicable laws, regulations and standards. Grant funds must be applied by us toward the research and development programs specified by the granting agency, rather than for all of our programs generally. If any of our grant-funded costs are found to be allocated improperly, the costs may not be reimbursed and any costs already reimbursed may have to be refunded. Accordingly, an audit could result in an adjustment to our revenues and results of operations. We are also subject to additional regulations based on our receipt of government grant funding and entry into government contracts. If we fail to comply with the requirements under our grants or contracts, we may face penalties or other negative consequences, and in such event we may not be awarded government funding or contracts in the future.
If we engage in any acquisitions, we will incur a variety of costs and may potentially face numerous risks that could adversely affect our business and operations.
If appropriate opportunities become available, we may seek to acquire additional businesses, assets, technologies or products to enhance our business. In connection with any acquisitions, we could issue additional equity or equity-linked securities such as the 2018 Notes or 2019 Notes, which would dilute our stockholders, incur substantial debt to fund the acquisitions, or assume significant liabilities.
Acquisitions involve numerous risks, including problems integrating the purchased operations, technologies or products, unanticipated costs and other liabilities, diversion of management’s attention from our core businesses, adverse effects on existing business relationships with current and/or prospective collaborators, customers and/or suppliers, risks associated with entering markets in which we have no or limited prior experience and potential loss of key employees. Acquisitions may also require us to record goodwill and non-amortizable intangible assets that will be subject to impairment testing on a regular basis and potential periodic impairment charges, incur amortization expenses related to certain intangible assets, and incur write offs and restructuring and other related expenses, any of which could harm our operating results and financial condition. If we fail in
38
our integration efforts with respect to any of our acquisitions and are unable to efficiently operate as a combined organization, our business and financial condition may be adversely affected.
Raising additional funds may cause dilution to our stockholders or require us to relinquish valuable rights.
If we elect to raise additional funds through equity offerings or offerings of equity-linked securities, our stockholders would likely experience dilution. Debt financing, if available, may subject us to restrictive covenants that could limit our flexibility in conducting future business activities. For example, the HSBC facility contains financial covenants that, if breached, would require us to secure our obligations thereunder. To the extent that we raise additional funds through collaboration and licensing arrangements, it may be necessary for us to share a portion of the margin from the sale of our products. We may also be required to relinquish or license on unfavorable terms our rights to technologies or products that we otherwise would seek to develop or commercialize ourselves.
If we fail to maintain an effective system of internal controls, we might not be able to report our financial results accurately or prevent fraud; in that case, our stockholders could lose confidence in our financial reporting, which would harm our business and could negatively impact the price of our stock.
Effective internal controls are necessary for us to provide reliable financial reports and prevent fraud. In addition, Section 404 of the Sarbanes-Oxley Act of 2002 requires us and our independent registered public accounting firm to evaluate and report on our internal control over financial reporting, and have our chief executive officer and chief financial officer certify as to the accuracy and completeness of our financial reports. The process of implementing our internal controls and complying with Section 404 is expensive and time consuming, and requires significant attention from management. We cannot be certain that these measures will ensure that we implement and maintain adequate controls over our financial processes and reporting in the future.
Our management has concluded that there are no material weaknesses in our internal controls over financial reporting as of December 31, 2014. However, there can be no assurance that our controls over financial processes and reporting will be effective in the future or that material weaknesses or significant deficiencies in our internal controls will not be discovered in the future. Because of its inherent limitations, internal control over financial reporting may not prevent or detect fraud or misstatements. Failure to implement required new or improved controls, or difficulties encountered in their implementation, could harm our results of operations or cause us to fail to meet our reporting obligations. If we or our independent registered public accounting firm discover a material weakness, the disclosure of that fact, even if quickly remedied, could reduce the market’s confidence in our financial statements and harm our stock price.
Risks Relating to Securities Markets and Investment in Our Stock
The price of our common stock may be volatile.
Stock markets have experienced extreme volatility that has often been unrelated to the operating performance of particular companies. These broad market fluctuations may adversely affect the trading price of our common stock. In addition, the average daily trading volume of the securities of small companies, particularly small technology companies, can be very low. Limited trading volume of our stock may contribute to its volatility. Price declines in our common stock could result from general market and economic conditions and a variety of other factors, including any of the risk factors described in this report.
These broad market and industry factors may seriously harm the market price of our common stock, regardless of our operating performance. The market price of our common stock could also be affected by possible sales of our common stock by investors who view our convertible notes as a more attractive means of equity participation in us and by hedging or arbitrage trading activity that we expect involving our common stock.
The sale or issuance by us of substantial amounts of our common stock could adversely impact the trading price of our common stock.
A substantial number of shares of our common stock may be issued in connection with the exercise of options outstanding under our equity incentive plans, the vesting of restricted stock awards and restricted stock units, the exercise of outstanding warrants, the conversion of or exchange for outstanding 2018 Notes and 2019 Notes. See Note 2 in the accompanying notes to our audited consolidated financial statements for additional information regarding the number of outstanding shares of potentially dilutive securities. Also see Note 11 in the accompanying notes for information regarding the possible conversion of the 2018 Notes and 2019 Notes into shares of our common stock. Further, under our Collaboration Agreement with ADM, we have the right to deliver our common stock for a portion of the annual amounts due under the agreement for use and operation of the Clinton Facility. In addition, we expect to issue additional shares under our equity
39
incentive plans and employee stock purchase plan in the future. In the future, we may issue additional shares of common stock or other equity-linked securities to raise additional capital.
Any future sale or issuance of common stock could adversely impact the trading price of our common stock.
Our certificate of incorporation, our bylaws and Delaware law contain provisions that could discourage another company from acquiring us and may prevent attempts by our stockholders to replace or remove our current management.
Provisions of Delaware law (where we are incorporated), our certificate of incorporation and bylaws may discourage, delay or prevent a merger or acquisition that stockholders may consider favorable, including transactions in which you might otherwise receive a premium for your shares. In addition, these provisions may frustrate or prevent any attempts by our stockholders to replace or remove our current management by making it more difficult for stockholders to replace or remove our board of directors. These provisions include:
• | authorizing the issuance of “blank check” preferred stock without any need for action by stockholders; |
• | requiring supermajority stockholder voting to effect certain amendments to our certificate of incorporation and bylaws; |
• | eliminating the ability of stockholders to call special meetings of stockholders; |
• | prohibiting stockholder action by written consent; |
• | establishing advance notice requirements for nominations for election to the board of directors or for proposing matters that can be acted on by stockholders at stockholder meetings; and |
• | dividing our board of directors into three classes so that only one third of our directors will be up for election in any given year. |
In addition, we are subject to Section 203 of the Delaware General Corporation Law, which, under certain circumstances, may make it more difficult for a person who would be an “interested stockholder,” as defined in Section 203, to effect various business combinations with us for a three-year period. Our certificate of incorporation and bylaws do not exclude us from the restrictions imposed under Section 203. These provisions could impede a merger, takeover or other business combination involving us or discourage a potential acquirer from making a tender offer for our common stock, which, under certain circumstances, could reduce the market price of our common stock.
We incur significant expenses as a result of being a public company.
As a public company, we incur significant additional legal, accounting and other expenses. For example, as a public company, we have adopted internal and disclosure controls and procedures and bear all of the internal and external costs of preparing and distributing periodic public reports in compliance with our obligations under applicable securities laws.
In addition, changing laws, regulations and standards relating to corporate governance and public disclosure, including the Sarbanes-Oxley Act of 2002 and related regulations implemented by the SEC and the NASDAQ-GS, create uncertainty for public companies, increasing legal and financial compliance costs and making some activities more time consuming. We evaluate and monitor developments with respect to new and proposed rules and cannot predict or estimate the amount of additional costs we may incur or the timing of such costs. These laws, regulations and standards are subject to varying interpretations, in many cases due to their lack of specificity, and, as a result, their application in practice may evolve over time as new guidance is provided by regulatory and governing bodies. This could result in continuing uncertainty regarding compliance matters and higher costs necessitated by ongoing revisions to disclosure and governance practices. We intend to invest resources to comply with evolving laws, regulations and standards, and this investment may result in increased general and administrative expenses and a diversion of management’s time and attention from revenue-generating activities to compliance activities. If our efforts to comply with new laws, regulations and standards differ from the activities intended by regulatory or governing bodies due to ambiguities related to practice, regulatory authorities may initiate legal proceedings against us and our business may be harmed. These factors could also make it more difficult for us to attract and retain qualified members of our board of directors, particularly to serve on our audit committee and compensation committee, and attract and retain qualified executive officers. If these requirements divert our management’s attention from other business concerns, they could have a material adverse effect on our business, financial condition and results of operations.
40
If securities or industry analysts do not continue to publish research or publish inaccurate or unfavorable research about our business, our stock price and trading volume could decline.
The trading market for our common stock depends in part on the research and reports that securities or industry analysts publish about us or our business. If securities or industry analysts do not continue coverage of our company, the trading price for our common stock would be negatively impacted. If one or more of the analysts who cover us downgrade our common stock or publish inaccurate or unfavorable research about our business, the price of our common stock would likely decline. If one or more of these analysts cease coverage of our company or fail to publish reports on us regularly, demand for our common stock could decrease, which might cause the price of our common stock and its trading volume to decline.
We do not anticipate paying cash dividends, and accordingly, stockholders must rely on stock appreciation for any return on their investment.
We do not anticipate paying cash dividends in the foreseeable future. As a result, only appreciation of the price of our common stock, which may never occur, would provide a return to stockholders. Our HSBC facility restricts our ability to pay cash dividends, and we may be subject to additional dividend restrictions under the terms of future indebtedness. Investors seeking cash dividends should not invest in our common stock.
41
Item 1B.Unresolved Staff Comments.
None.
Item 2. Properties.
We currently lease an aggregate of approximately 106,000 square feet of office and laboratory facilities, including a pilot plant, in South San Francisco, California. The South San Francisco location is comprised of two buildings and is covered by a lease agreement that expires in January 2018.
In September 2014, we entered into a lease agreement for approximately 5,000 square feet of office space located in Glendale, California. The term of the Glendale lease commenced in November 2014 and ends in October 2017.
In May 2011, we purchased the Peoria Facility in Peoria, Illinois. Our wholly-owned subsidiary, Solazyme Brazil Renewable Oils and Bioproducts Limitada (Solazyme Brazil), leases approximately 14,100 square feet of space in Campinas, Brazil that is used as general office and lab space pursuant to a lease that expires in April 2016. This lease will be terminated in 2015, as part of the Company's 2014 Restructuring Plan (See Note 3 - Restructuring of the notes to the consolidated financial statements of this Annual Report on Form 10-K).
We believe that our current facilities are suitable and adequate to meet our current needs. As our needs change and as our business grows, we intend to build, lease or acquire additional manufacturing capacity on our own and with partners. We believe that additional space and facilities will be available.
Item 3. Legal Proceedings.
On November 28, 2014 Roquette filed an action against the Company in U.S. District Court for the District of Delaware for declaratory judgment related to the Roquette Arbitration (see below). Roquette seeks a declaration that (i) the arbitrators in the Roquette Arbitration exceeded their authority by failing to render a timely arbitration award, (ii) any award issued by the arbitrators is void and (iii) all intangible assets of SRN should be assigned jointly to Roquette and the Company. The Company filed an Answer to the Complaint in January 2015, denying substantially all of Roquette’s claims and all of its prayers for relief. On February 3, 2015 Roquette filed a second action against the Company in U.S. District Court for the District of Delaware for declaratory judgment related to the Roquette Arbitration. Roquette seeks a declaration that (A) the order of the arbitrators in the Roquette Arbitration for more discovery and new hearings is unenforceable and (B) in the alternative, the proposed new discovery and hearings concerns an issue that is outside the scope of the arbitration. On February 12, 2015 the two Delaware actions were consolidated . The Company filed its Answer to the second Complaint on February 26, 2015, denying all claims made in the Complaint and all related prayers for relief. In addition, the Company cross-claimed for (x) confirmation of the arbitration award, (y) an order compelling Roquette to comply with the arbitration award and (z) damages for misappropriation of the Company’s trade secrets, misuse of the Company’s confidential information and breach of contract.
In September 2013, an arbitration was initiated with Roquette (the “Roquette Arbitration”) in connection with the dissolution of SRN. The Company sought a declaration that, in accordance with the terms of the joint venture agreement between the parties, the Company should be assigned all improvements made by or on behalf of SRN to the Company’s intellectual property. On February 19, 2015 the arbitration panel released its decision, ordering, inter alia, the assignment to the Company of (i) all SRN patent applications, (ii) all SRN know-how related to high lipid algal flour and high protein algal powder and (iii) all Roquette patent applications filed since November 2010 relating to algal food and food ingredients, as well as methods for making and using them. In addition, the arbitration panel ordered Roquette to pay to the Company, $2.3 million in legal costs and fees.
In July 2012, a Complaint was filed in the Los Angeles Superior Court by Therabotanics, LLC and Solabotanics, LLC against the Company, Sephora USA, Inc. and the Company's Senior Vice President Frederic Stoeckel alleging various causes of action in connection with the Company’s joint venture with Therabotanics. The Plaintiffs alleged that the Company misappropriated assets of the joint venture and failed to produce an infomercial with the joint venture. The Plaintiffs claimed unspecified damages and injunctive relief. In June 2013, the Company filed an Answer in which it denied each and every allegation made by the Plaintiffs in their Complaint and filed a Cross-Complaint against Therabotanics and certain named individuals. In January 2014, the Plaintiffs filed a Third Amended Complaint in which the Company's Chief Executive Officer, Jonathan Wolfson, and Sephora, S.A. were added as additional defendants. In September 2014 the parties agreed to settle the litigation in exchange for a settlement payment from the Company to Therabotanics of $4.8 million, which was paid in October 2014. As part of the settlement the Company denied all claims made by the Plaintiffs.
42
The Company may be involved, from time to time, in additional legal proceedings and claims arising in the ordinary course of its business. Such matters are subject to many uncertainties and outcomes are not predictable with assurance. While there can be no assurances as to the ultimate outcome of any legal proceeding or other loss contingencies involving the Company, management does not believe any pending matters individually and in the aggregate will be resolved in a manner that would have a material effect on the Company’s consolidated financial position, results of operations or cash flows.
Item 4. Mine Safety Disclosures.
Not applicable.
43
PART II
Item 5. Market for Registrant’s Common Equity, Related Stockholder Matters and Issuer Purchases of Equity Securities
Recent Sales of Unregistered Securities
1.On October 24, 2013, pursuant to a Research and Development Agreement with Warner Babcock Institute for Green Chemistry LLC (WBI), we issued 39,578 shares of our common stock to WBI. As of December 31, 2014, all of these shares had fully vested. Pursuant to the Research and Development Agreement, WBI is providing research and development services to us.
2.On November 4, 2013, we issued 423,278 shares of our common stock to Archer-Daniels-Midland Company (ADM) upon the exercise by ADM of a warrant to receive $4,500,000, payable at our election in cash, stock or a combination thereof, for use and operation of a portion of ADM’s facility in Clinton, Iowa under the Strategic Collaboration Agreement between us and ADM.
The issuances of securities described above were deemed to be exempt from registration under the Securities Act in reliance on Section 4(2) of the Securities Act and Regulation D promulgated thereunder as transactions by an issuer not involving a public offering. The recipients of securities in each such transaction represented their intention to acquire the securities for investment only and not with a view to or for sale in connection with any distribution thereof and appropriate legends were affixed to the electronic records representing such securities in such transactions. All recipients received adequate information about us.
Use of Proceeds from Public Offering of Common Stock
On June 2, 2011, we closed our initial public offering. We sold 12,621,250 shares of common stock at a price to the public of $18.00 per share, which included 600,000 shares offered by selling stockholders and 1,646,250 shares that the underwriters had the option to purchase to cover over-allotments. This offer and sale of our common stock in the initial public offering were registered under the Securities Act pursuant to a registration statement on Form S-1 (File No. 333-172790), which was declared effective by the SEC on May 26, 2011. The principal underwriters of the initial public offering were Morgan Stanley and Co. Incorporated, Goldman, Sachs & Co., Jefferies, Pacific Crest Securities and Lazard Capital Markets. We raised approximately $201.2 million in net proceeds after deducting underwriting discounts and commissions of $15.1 million and other offering costs of $4.3 million. No offering costs were paid directly or indirectly to any of our directors or officers (or their associates) or persons owning ten percent or more of any class of our equity securities or to any other affiliates, other than payments in the ordinary course of business to officers for salaries and to non-employee directors as compensation for board or board committee service. As of December 31, 2014, all proceeds from our initial public offering had been used as described in our final prospectus filed with the SEC pursuant to Rule 424(b).
Market Information
Our common stock is traded on The NASDAQ Global Select Market, or NASDAQ, under the symbol “SZYM.” The following table sets forth the high and low sales prices per share of the common stock as reported on NASDAQ. Such prices represent inter dealer prices without retail markup, markdown or commission and may not necessarily represent actual transactions.
Fiscal 2013 | High | Low | |||||
First Quarter | $ | 9.49 | $ | 6.81 | |||
Second Quarter | 12.89 | 7.15 | |||||
Third Quarter | 13.09 | 10.20 | |||||
Fourth Quarter | 12.10 | 8.00 | |||||
Fiscal 2014 | High | Low | |||||
First Quarter | $ | 15.00 | $ | 9.32 | |||
Second Quarter | 12.44 | 8.90 | |||||
Third Quarter | 12.08 | 7.31 | |||||
Fourth Quarter | 8.00 | 2.15 | |||||
44
As of February 20, 2015 there were 82 stockholders of record of our common stock. A substantially greater number of stockholders may be beneficial holders, whose shares are held of record by banks, brokers and other financial institutions in “street name.”
Dividend Policy
We have never declared or paid any dividends on our common stock or any other securities. We currently intend to retain our future earnings, if any, for use in the expansion and operation of our business and therefore do not anticipate paying cash dividends on our common stock in the foreseeable future. Any future determination relating to our dividend policy will be made at the discretion of our board of directors, based upon our financial condition, results of operations, contractual restrictions, capital requirements, business prospects and other factors our board of directors may deem relevant. In addition, the terms of our loan facility require that we obtain consent from the lender prior to any payment of dividends.
Stock Performance Graph
The following graph compares our total common stock return with the total return for (i) the S&P SmallCap 600 Index and (ii) the NASDAQ Clean Edge Green Energy Index for the period from May 27, 2011 (the date our common stock commenced trading on the NASDAQ) through December 31, 2014. The figures represented below assume an investment of $100 in our common stock at the closing price of $20.71 on May 27, 2011 and in the S&P SmallCap Index and the NASDAQ Clean Edge Green Energy Index on May 27, 2011 and the reinvestment of dividends into shares of common stock. The comparisons in the table are required by the SEC and are not intended to forecast or be indicative of possible future performance of our common stock. This graph shall not be deemed “soliciting material” or to be “filed” for purposes of Section 18 of the Exchange Act or otherwise subject to the liabilities under that Section, and shall not be deemed to be incorporated by reference into any of our filings under the Securities Act or the Exchange Act.
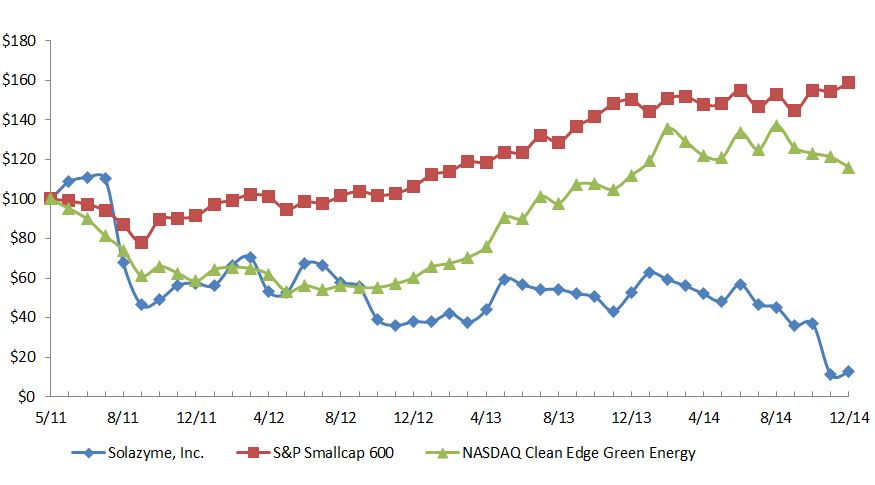
45
Item 6. Selected Financial Data
In the tables below, we provide our selected historical financial data. We derived the selected statement of operations data for the years ended December 31, 2014, 2013, and 2012 and the selected balance sheet data as of December 31, 2014 and 2013 from our audited consolidated financial statements and related notes included in Item 8 of this Annual Report on Form 10-K. We derived the selected statement of operations data for the years ended December 31, 2011 and 2010 and the selected balance sheet data as of December 31, 2012, 2011 and 2010 from our audited consolidated financial statements and related notes not included in this Annual Report on Form 10-K. You should read this data together with our consolidated financial statements and related notes in Item 8 of this Annual Report on Form 10-K and “Management’s Discussion and Analysis of Financial Condition and Results of Operations” included elsewhere in this Annual Report on Form 10-K. Our historical results are not necessarily indicative of the results that may be expected in the future.
Year Ended December 31, | |||||||||||||||||||
2014 | 2013 | 2011 | 2011 | 2010 | |||||||||||||||
(In thousands, except share and per share data) | |||||||||||||||||||
Statement of Operations Data: | |||||||||||||||||||
Total revenues | $ | 60,391 | $ | 39,750 | $ | 44,108 | $ | 38,966 | $ | 37,970 | |||||||||
Cost of product revenue | 20,612 | 6,385 | 5,311 | 2,420 | — | ||||||||||||||
Research and development | 81,680 | 66,572 | 66,384 | 45,613 | 34,227 | ||||||||||||||
Sales, general and administrative | 90,266 | 62,933 | 57,516 | 41,426 | 17,422 | ||||||||||||||
Restructuring charges | 3,514 | — | — | — | — | ||||||||||||||
Total costs and operating expenses(1) | 196,072 | 135,890 | 129,211 | 89,459 | 51,649 | ||||||||||||||
Loss from operations | (135,681 | ) | (96,140 | ) | (85,103 | ) | (50,493 | ) | (13,679 | ) | |||||||||
Total other income (expense), net | (26,460 | ) | (20,249 | ) | 1,971 | (3,408 | ) | (2,601 | ) | ||||||||||
Net loss | (162,141 | ) | (116,389 | ) | (83,132 | ) | (53,901 | ) | (16,280 | ) | |||||||||
Accretion of redeemable convertible preferred stock | — | — | — | (60 | ) | (140 | ) | ||||||||||||
Net loss attributable to Solazyme, Inc. common stockholders | $ | (162,141 | ) | $ | (116,389 | ) | $ | (83,132 | ) | $ | (53,961 | ) | $ | (16,420 | ) | ||||
Basic and diluted net loss per share attributable to Solazyme, Inc. common stockholders(2) | $ | (2.14 | ) | $ | (1.81 | ) | $ | (1.37 | ) | $ | (1.35 | ) | $ | (1.42 | ) | ||||
Shares used in computation of basic and diluted net loss per share(2) | 75,879,208 | 64,211,958 | 60,509,048 | 39,934,013 | 11,540,494 | ||||||||||||||
(1) | Includes stock-based compensation expense of $25.5 million, $18.7 million, $15.4 million, $10.9 million and $2.0 million for the years ended December 31, 2014, 2013, 2012, 2011 and 2010, respectively. |
(2) | See notes to our consolidated financial statements for an explanation of the method used to calculate basic and diluted net loss per share of common stock and the weighted-average number of shares used in computation of the per share amounts. |
As of December 31, | |||||||||||||||||||
2014 | 2013 | 2012 | 2011 | 2010 | |||||||||||||||
(In thousands) | |||||||||||||||||||
Balance Sheet Data: | |||||||||||||||||||
Cash and cash equivalents | $ | 42,689 | $ | 54,977 | $ | 30,818 | $ | 28,780 | $ | 32,497 | |||||||||
Marketable securities | 164,619 | 112,544 | 118,187 | 214,944 | 49,533 | ||||||||||||||
Working capital | 210,473 | 166,523 | 140,341 | 229,681 | 73,152 | ||||||||||||||
Total assets | 312,589 | 258,705 | 217,024 | 285,224 | 93,984 | ||||||||||||||
Indebtedness, net of unamortized discounts and loan fees | 200,097 | 93,522 | 14,968 | 20,252 | 229 | ||||||||||||||
Redeemable convertible preferred stock | — | — | — | — | 128,313 | ||||||||||||||
Accumulated deficit | (468,458 | ) | (306,317 | ) | (189,928 | ) | (106,796 | ) | (52,835 | ) | |||||||||
Total stockholders’ equity (deficit) | 86,376 | 138,948 | 183,311 | 240,558 | (50,067 | ) | |||||||||||||
46
Item 7. Management’s Discussion and Analysis of Financial Condition and Results of Operations.
Forward-Looking Statements
The following discussion and analysis should be read together with our audited consolidated financial statements and the other financial information appearing elsewhere in this Annual Report on Form 10-K. This discussion contains forward-looking statements reflecting our current expectations and involves risks and uncertainties. In some cases, you can identify forward-looking statements by terminology such as “may,” “will,” “should,” “expect,” “plan,” “anticipate,” “believe,” “estimate,” “predict,” “intend,” “potential” or “continue” or the negative of these terms or other comparable terminology. For example, statements regarding our expectations as to future financial and operating performance, future selling prices and margins for our products, attributes and performance of our products, manufacturing capacity, expense levels and liquidity sources are forward-looking statements. Our actual results and the timing of events may differ materially from those discussed in our forward-looking statements as a result of various factors, including those discussed below and those discussed in the section entitled “Risk Factors” included in this Annual Report on Form 10-K and in our other filings with the Securities and Exchange Commission (SEC).
Overview
Starting with microalgae, we create new, sustainable, high-performance products. Our proprietary technology uses highly optimized microalgae in an industrial fermentation process to transform a range of abundant plant-based sugars into high-value triglyceride oils and other bioproducts.
We tailor the composition of our oils and bioproducts to address specific customer requirements, via a renewable pathway, by replacing or improving intermediates and ingredients in major markets currently served by conventional oils and specialty markets. We are commercializing our primary products as either Intermediates/Ingredients that include branded products such as Encapso™, AlgaVia™Lipid Powder and AlgaVia™ Protein, or as Personal Care Products that include branded products such as Algenist® skin and personal care products, targeted at customers in the: (1) Industrial Products, (2) Food Products, and (3) Personal Care Products markets. Algenist® skin and personal care line is formulated with our proprietary ingredients, Alguronic Acid® and Microalgal Oil, which is incorporated into a full-range of branded skin and personal care products.
In the first quarter of 2011, we began selling our consumer-focused Algenist® skin and personal care line in the Personal Care Products market. In the first quarter of 2014, we began manufacturing at commercial production scale, and we began selling intermediate and ingredient products. We expect to sell these intermediate and ingredients products broadly to customers in the Industrial Products and Food Products markets. We expect the average margins on these intermediate and ingredient products will be lower than those of our consumer-focused personal care products; however, we believe the sales volumes for the intermediate and ingredient products will be higher as we expand our large scale production. We have entered into sales and partnership agreements to advance commercialization efforts of our intermediate and ingredient products. In addition to development agreements to fund development work and new product application testing, we expect that our partners will enter into long-term purchase agreements with us. We are currently engaged in development activities with multiple partners.
The inherent flexibility of our technology platform and the broad usage of triglyceride oils across multiple industries allow us to approach a wide range of customers across myriad end markets. We have many oils in various stages of development that can address multiple end industrial markets.
We are also developing food oils and powdered ingredients targeted at the Food Products market. Our food oils are formulated to offer a variety of functional benefits such as enhanced structuring capabilities and stability while providing robust formulation and process flexibility. In addition, we have developed novel methods of preparing powdered forms of triglyceride oils and vegan proteins, and our powdered ingredients are composed of unmodified whole algal cells. AlgaVia™ Lipid Powder (commonly known as whole algal flour) and AlgaVia™ Protein (commonly known as whole algal protein) are whole algae ingredients that can improve the nutritional profile of foods and beverages. AlgaVia™ Lipid Powder is a new fat source that allows for the reduction or replacement of dairy fats, oils, and eggs. AlgaVia™ Protein is a new vegan source of protein that is free of known allergens and gluten. Both AlgaVia™ Lipid Powder and Protein can be used across a range of applications such as beverages (ready-to-drink and powdered), bakery, snacks, bars, dressings, sauces and frozen desserts.
Our process is compatible with commercial-scale, widely-available fermentation and oil recovery equipment. We operate our lab and pilot fermentation and recovery equipment as scaled-down versions of our large commercial engineering designs, such as those used to perform development work under certain agreements with strategic partners and to fulfill commercial supply agreements with certain partners. This allows us to more easily scale up to larger fermentation vessels. We have scaled
47
up our technology platform and have successfully operated at lab (5-15 liter), pilot (600-1,000 liter), demonstration (120,000 liter) and commercial (approximately 500,000 liter and above) fermenter scale. The fermentation equipment used to achieve commercial scale at ADM’s Clinton Facility is comparable to the fermentation equipment at the Solazyme Bunge JV Plant in Brazil. Our existing manufacturing operations are as follows:
• | Our pilot plant in South San Francisco, California, with recovery operations capable of handling material from both 600 and 1,000 liter fermenters, enables us to produce samples of our algal oils for testing and optimization by our partners, as well as to test new process conditions at an intermediate scale. |
• | In 2012, we successfully commissioned our first fully integrated biorefinery (IBR) at our Peoria, Illinois facility (the Peoria Facility), to produce algal oil. The IBR was partially funded with a federal grant that we received from the U.S. Department of Energy (DOE) in December 2009 to demonstrate integrated commercial-scale production of renewable algae-derived fuels. The Peoria Facility has a nameplate capacity of two million liters of oil annually and provides an important platform for continued work on feedstock flexibility and scaling of new algal oils into the marketplace. We have also modified our Peoria Facility to produce food ingredients in conjunction with market development activity. |
• | In April 2012, we executed a joint venture agreement with Bunge Global Innovation, LLC and certain of its affiliates (collectively, Bunge) (Joint Venture Agreement), one of the largest sugarcane processing companies in Brazil, establishing a joint venture (Solazyme Bunge JV) to construct and operate a purpose-built production facility (the Solazyme Bunge JV Plant) adjacent to Bunge’s sugarcane mill in Moema, Brazil. In May 2014, the Solazyme Bunge JV Plant produced its first products on full-scale production lines, including 625,000 liter fermenter tanks. The Solazyme Bunge JV Plant leverages our technology and Bunge’s sugarcane milling and natural oil processing capabilities to produce microalgae-based products. In addition, the Solazyme Bunge JV Plant has been designed to be expanded for further production in line with market demand. Additional capital expenditures may be required to reach nameplate capacity depending on the product mix produced at the plant. See “Significant Partner Agreements.” |
• | In November 2012, we executed a strategic collaboration agreement with ADM to produce algal triglyceride oil products at ADM’s facility in Clinton, Iowa (Clinton Facility). In January 2014, we commenced commercial operations at both the Clinton Facility and the downstream companion facility operated by American Natural Processors, Inc. (ANP). We, along with ADM and ANP, have manufactured four distinct products at the facilities, and products are being sold and distributed. The Clinton Facility utilizes fermentation vessels that are approximately 500,000-liters and corn sugars as a feedstock to produce algal triglyceride oil products. The current focus for the Clinton Facility is to produce higher margin products such as our Encapso™ product and to balance production with operating expenses. We have the option to expand the capacity. See “Significant Partner Agreements.” |
• | We utilize contract manufacturing to assist in the production and sales of our Algenist® products, and we closely monitor and advise these contract manufacturers to maintain stringent quality standards for our products. We also produce some active ingredients for Solazyme Personal Care Products at our Peoria Facility. |
Through fiscal year 2013, our revenues were generated from research and development programs and commercial sale of our personal care products, and starting in the first quarter of 2014, our product revenues expanded to include intermediate and ingredient products. Our research and development programs have been conducted primarily under key agreements with government agencies and strategic partners to fund development work and perform application testing. We focus our innovation efforts on creating a broad suite of algal products that meet defined market needs. We intend to continue to work closely with our partners and customers to understand their requirements and design products to specifically address their needs. Our main commercial focus is to sell high-value oils, encapsulated oils and whole algal powdered products to companies that use them as intermediates and ingredients.
Within the Personal Care Products market, we have developed a portfolio of innovative and branded microalgae-based consumer products. Our first major ingredient was Alguronic Acid®, which was formulated into a full range of skin care products. Since its launch in 2011, we have commercialized our Algenist® anti-aging skin care line, marketed to date primarily through Sephora S.A. and its affiliates (Sephora) and QVC. In April 2014, our Algenist® line launched at Nordstrom, our first high-end department store retail channel. In July 2014, our Algenist® line launched at ULTA Beauty retail stores throughout the United States. We have also expanded our international distribution and are currently selling in over 2,500 retail stores in 21 countries including member countries of the EU, Mexico, Canada and China. Beginning in 2013, we further leveraged our
48
innovative ingredient research and expertise by broadening the Algenist® line to include products that use microalgae oil as a replacement for the essential oils currently used in skin care products.
In the first quarter of 2014, we began selling our intermediate and ingredient products more broadly to customers in the Industrial Products market with the launch of Encapso™. Our initial commercial use for our Encapso™ product is as a biodegradable lubricant mud additive in oil and gas drilling.
Significant Partner Agreements
We currently have joint venture, joint development, supply and distribution arrangements with various strategic partners. We expect to enter into additional partnerships in each of our target markets to advance commercialization of our products and to expand our upstream and downstream capabilities. Upstream, we expect partners to provide research and development funding, capital for commercial manufacturing capacity and/or secure access to feedstock. Downstream, we expect partners to provide expanded distribution channels, product application testing, marketing expertise and/or long-term purchase commitments. Our current principal partnership and strategic arrangements include:
Bunge. In May 2011, we entered into a Joint Development Agreement (JDA) with Bunge that was extended through September 2014. Pursuant to the JDA, we and Bunge jointly developed microbe-derived oils and explored the production of such oils from Brazilian sugarcane feedstock.
In anticipation of the Solazyme Bunge JV’s formation, in May 2011, we granted Bunge Limited a warrant (the Bunge Warrant) to purchase 1,000,000 shares of our common stock at an exercise price of $13.50 per share. The Bunge Warrant vested based on a number of milestones connected with the construction and initial operation of the Solazyme Bunge JV Plant. As of June 30, 2014, the Bunge Warrant was vested as to 75% of the shares underlying the Bunge Warrant and the remaining 25% of the shares underlying the Bunge Warrant could no longer vest. The Warrant expires in May 2021.
In April 2012, we and Bunge formed the Solazyme Bunge JV to build, own and operate a commercial-scale renewable algal oil production facility (the Solazyme Bunge JV Plant) adjacent to Bunge’s Moema sugarcane mill in Brazil. The Solazyme Bunge JV Plant leverages our technology and Bunge’s sugarcane milling and natural oil processing capabilities to produce microalgae-based products. In addition, the Solazyme Bunge JV Plant has been designed to be expanded for further production in line with market demand. This production facility has a target annual nameplate production capacity of 100,000 MT of oil. Construction of the Solazyme Bunge JV Plant commenced in the second quarter of 2012 and was financed with equal equity contributions by both Bunge and Solazyme and over $100 million of project financing from the Brazilian Development Bank. In May 2014, the Solazyme Bunge JV Plant produced its first products on full-scale production lines, including 625,000 liter fermentation tanks. Both oil and Encapso™ products have been manufactured; production is continuing and is expected to ramp toward targeted nameplate capacity as we work to increase efficiency in unit operations, and balance production volumes with operating costs as we focus on higher value products. Additional capital expenditures may be required to reach nameplate capacity depending on the product mix produced at the plant. As a condition of the Solazyme Bunge JV drawing funds under the loan in excess of amounts supported by bank guarantees, we may be required to provide a corporate guarantee of a portion of the loan in an amount that, when added to the amount supported by our bank guarantee, does not exceed our ownership percentage in the Solazyme Bunge JV.
In addition to forming the Solazyme Bunge JV in April 2012, we entered into a Development Agreement with the Solazyme Bunge JV to continue research and development activities that are intended to benefit the Solazyme Bunge JV, including activities in the areas of strain development, molecular biology and process development. The Development Agreement provides that the Solazyme Bunge JV will pay us a technology maintenance fee in recognition of our ongoing research investment in technology that would benefit the Solazyme Bunge JV. We also entered into a Technology Service Agreement with the Solazyme Bunge JV under which the Solazyme Bunge JV pays us for technical services related to the operations of the plant, including, but not limited to, engineering support for plant operations, operation procedure consultation, product analysis and microbe performance monitoring and assessment. In the third quarter of 2013, the Solazyme Bunge JV also agreed to pay us to support its commercial activities, including, but not limited to, facilitating supply agreements on behalf of the Solazyme Bunge JV and providing regulatory support.
In November 2012, we entered into a joint venture expansion framework agreement with Bunge. This framework agreement sets forth the intent of the partners to expand joint venture-owned oil production capacity from the current 100,000 MT target nameplate capacity under construction in Brazil to 300,000 MT by 2016 at select Bunge owned and operated processing facilities worldwide. In addition, we and Bunge amended the Joint Venture Agreement in October 2013 to expand the field and product portfolio of the Solazyme Bunge JV. We and Bunge intend to work together through joint market development to bring new, healthy, edible oils to the Brazilian market.
49
Refer to Note 8 and Note 10 in the accompanying notes to our consolidated financial statements for further discussion of the Bunge JDA, Joint Venture Agreement and Warrant.
ADM. In November 2012, we entered into a strategic collaboration agreement with ADM, establishing a collaboration for the production of algal triglyceride oil products at the Clinton Facility. The Clinton Facility is producing algal triglyceride oil products using our proprietary microbe-based catalysis technology. Feedstock for the facility is provided by ADM’s adjacent wet mill. Under the terms of the strategic collaboration agreement, we pay ADM annual fees for use and operation of a portion of the Clinton Facility, a portion of which may be paid in our common stock. In addition, in January 2013 we granted to ADM a warrant to purchase 500,000 shares of our common stock, which vests in equal monthly installments over five years, commencing in November 2013. In addition, in March 2013 we issued a series of warrants to ADM for payment in stock, in lieu of cash, at our election, of future annual fees for use and operation of a portion of the Clinton Facility. This facility uses corn sugars as a feedstock and currently has an initial target nameplate capacity of 20,000 MT per year of algal triglyceride oil products, which we are targeting to attain as we refocus the Clinton Facility on higher margin products such as Encapso™ and otherwise balance production with operating expenses. We have an option to expand the nameplate capacity to 40,000 MT per year with the potential to further expand production to 100,000 MT per year. We are also working together with ADM to develop markets for the products produced at the Clinton Facility. Since the third quarter of 2013, downstream processing has been performed at a finishing facility in Galva, Iowa (Galva Facility), which is operated by our long-term partner, a wholly owned subsidiary of American Natural Processors, Inc.. In January 2014, we began commercial scale production of our oils at the Clinton/Galva Facilities.
Mitsui. In February 2013, we entered into a multi-year agreement with Mitsui & Co., Ltd. (Mitsui) to jointly develop triglyceride oils for use primarily in the oleochemical industry. The agreement includes further development of our myristic oil, a valuable raw material in the oleochemical industry, and additional oils that we are developing for the oleochemical and industrial sectors. End use applications may include renewable, high-performance polymer additives for plastic applications, lubricants and toiletry and household products.
Chevron. We have entered into multiple research and development agreements with Chevron to conduct research related to algal technology in the fields of diesel fuel, lubricants and additives and blendstocks. Under the terms of the most recent agreement, we successfully completed all defined deliverables against the active Chevron research program which was funded through June 30, 2012.
U.S. Navy. In September 2010, we entered into a firm fixed price research and development contract with the Department of Defense (DoD), through the Defense Logistics Agency, Fort Belvoir, VA (DLA), to provide marine diesel fuel. We agreed to produce up to 567,812 liters of HRF-76 marine diesel for the U.S. Navy’s testing and certification program. This contract was the third contract that we have entered into with the DoD and the largest of the three. We completed two earlier contracts to research, develop and demonstrate commercial-scale production of microalgae-based advanced biofuels to establish appropriate status for future commercial procurements. We completed the first phase of our 567,812 liter contract in July 2011, with the delivery of 283,906 liters of HRF-76 marine diesel to the U.S. Navy for its testing and certification program. In August 2011, the DoD exercised its option to pursue the second phase of the DoD contract, which called for the delivery of the remainder of the 283,906 liters of HRF-76 marine diesel for the U.S. Navy’s testing and certification program. We completed the second phase of the contract in June 2012, with the delivery of 283,906 liters of HRF-76 marine diesel to the U.S. Navy.
In November 2011, Dynamic Fuels, LLC (Dynamic) was awarded a contract to supply the U.S. Navy with 450,000 gallons (1,703,000 liters) of renewable fuels. The contract involved supplying the U.S. Navy with 100,000 gallons (379,000 liters) of jet fuel (Hydro-treated Renewable JP-5 or HRJ-5) and 350,000 gallons (1,325,000 liters) of marine distillate fuel (Hydro-Treated Renewable F-76 or HRD-76). We were named a subcontractor and we entered into a subcontractor agreement with Dynamic effective January 2012 to supply Dynamic with algal oil to help fulfill Dynamic’s contract with the U.S. Navy to deliver fuel by May 2012. We delivered our commitment of algal oil pursuant to this subcontract in February 2012. The fuel was used as part of the U.S. Navy’s Green Strike Group demonstration at the 2012 Rim of the Pacific Exercise, the world’s largest international maritime warfare exercise. The Great Green Fleet was powered by a 50/50 blend of biofuel and conventional petroleum-based fuel.
Roquette. In November 2010, we entered into a joint venture agreement with Roquette, forming Solazyme Roquette Nutritionals, LLC (SRN). The purpose of SRN was to pursue certain opportunities in microalgae-based products for the food, nutraceuticals and animal feed markets. In June 2013, we and Roquette agreed to dissolve SRN, and on July 18, 2013, SRN was dissolved.
Algenist® Distribution Partners. In 2010, we entered into a distribution contract with Sephora EMEA to distribute our Algenist® product line in Sephora EMEA stores in certain countries in Europe and select countries in the Middle East and Asia.
50
In early 2011, we also made arrangements with Sephora Americas to sell our Algenist® product line in Sephora Americas stores (which currently includes locations in the United States and Canada). During 2011, we launched our Algenist® product line at Sephora inside JCPenney stores in the United States and we entered into an agreement with QVC, Inc. (QVC) and launched the sale of our Algenist® product line through QVC’s multimedia platform. In July 2014, we entered into an agreement with ULTA Beauty to sell our Algenist® line in over 700 of its retail stores throughout the United States.
Unilever. In October 2011, we entered into a joint development agreement with Unilever (our fourth agreement altogether) which expanded our current research and development efforts. In September 2014, we and Unilever extended this joint development agreement through September 30, 2015. In September 2013, we and Unilever entered into a commercial supply agreement for at least 10,000 MT of our algal oil. In May 2014, Unilever announced the initial introduction of our sustainable algal oil into one of its biggest soap brands, Lux.
AkzoNobel. In May 2013 we entered into a joint development agreement with AkzoNobel, a leading global paints and coatings company and a major producer of specialty chemicals, targeting the development and commercial sales of triglyceride oils for use by AkzoNobel in its surface chemistry and decorative paints businesses. Product development efforts began in the second half of 2013, and in July 2014 we entered into a research and development plan with AkzoNobel which extends through June 2017.
Financial Operations Overview
Our total revenues were $60.4 million, $39.8 million, and $44.1 million in 2014, 2013, and 2012, respectively. Our total revenues are generated from (1) sales of our products and (2) funding from our research and development (R&D) agreements with strategic partners, including the Solazyme Bunge JV. Since the commercialization of our Algenist® skin care line in the first quarter of 2011, our product revenues have increased each year partially offsetting the reduction in government R&D program revenues as we completed work on the DOE and DoD programs between 2012 and 2013. In addition, beginning in the first quarter of 2014 we commenced manufacturing at commercial production scale, and we began selling intermediate and ingredient products. R&D program revenue from our development agreements fluctuate depending on timing of the development work performed and achievement of contract milestones defined in these agreements. In general, we expect that the mix of our R&D program revenues will be lower as a percentage of total revenues as we continue to commercialize our products. We will continue to work with our strategic partners and the Solazyme Bunge JV under our existing and new R&D agreements to enable us to be a global market leader in the design and production of renewable oils and specialty bioproducts. We expect a larger percentage of our total revenues to be generated from product sales as we ramp up our manufacturing production volume to nameplate capacity.
We incurred net losses of $162.1 million, $116.4 million and $83.1 million in 2014, 2013, and 2012, respectively. In the near term, we anticipate that we will continue to incur net losses as we manage the production of commercial products and optimization of manufacturing operations and investments to align with our focus on development and commercialization of high value products and support commercialization activities for our intermediate and ingredient products that address the (1) Industrial Products, (2) Food Products, and (3) Personal Care Products markets, as well as continue our development activities to further build on our library of tailored oils and powders. In addition, as we continue to scale our capacity in current facilities or by entering into new manufacturing capacity and joint venture agreements, we may incur additional net losses associated with the build-out, ramp up, optimization and initial operations of those new production facilities.
Revenues
We are commercializing our products as intermediate and ingredient products and personal care products. Intermediate and ingredient products encompass a portfolio of ingredient products targeted at customers in the Industrial Products and Food Products markets. We are currently selling our consumer-focused Algenist® branded skin and personal care line in the Personal Care Product market. Prior to commercialization of our Algenist® products in 2011, our revenues were primarily from collaborative research and government grants. Through the end of 2013, our product revenues were entirely from the sale of consumer-focused branded products into the Personal Care Products market, providing us with the highest gross margin within our target markets. In the first quarter of 2014, we began to sell intermediate and ingredient products more broadly into the Industrial Products markets as we began to commercially produce and distribute products from our Clinton/Galva Facilities. In 2014, three of our largest partners, the Solazyme Bunge JV, Sephora and QVC, each accounted for more than 10% of our total revenues, and collectively accounted for 57% of our total revenues in 2014. These are three of our largest partners for which the loss of such partners would have a material adverse effect on us.
51
•Product Revenues
Product revenues consist of revenues from products sold commercially into each of our target markets.
We began our commercialization from sale of consumer-focused branded skin and personal care products in the Personal Care Products market. Starting in 2011, we recognized revenues from the sale of our first consumer-focused commercial product line, Algenist®, which we distributed to the skin and personal care end market through arrangements with Sephora S.A. and its affiliates (Sephora), QVC and ULTA Beauty in 21 countries including the U.S., member countries of the EU, Mexico, Canada and China, as well as direct-to-consumer sales via the Internet. In the first quarter of 2014, we began selling our intermediate and ingredient products commercially into the Industrial Products market. We launched our Encapso™ product, a biodegradable lubricant for drilling fluids, Tailored™ oil products to customers that use our intermediate products, as well as fuel blend sales as part of our effort to build our fuels marketing and commercial development programs; preliminary program efforts include the sale and transfer of blended fuels to private (non-government) customers. We expect our product revenues to increase as the demand for our consumer-focused product lines grow and as we continue to commercialize our portfolio of intermediate and ingredient products including Tailored™ oils and powders, our advanced biofuel blends, and our Encapso™ product targeted at customers in the Industrial Products market, as well as our food intermediates/ingredients products targeted at customers in the Food Products market.
Product revenues represented 62%, 50%, and 37% of our total revenues for 2014, 2013, and 2012, respectively.
•Research and Development Program Revenues
Revenues from R&D programs are recognized in the period during which the related costs are incurred, provided that the conditions under which the government grants and other R&D program agreements were provided have been met and only perfunctory obligations are outstanding. We currently have active R&D programs with commercial partners and recently completed R&D programs with governmental agencies. These R&D programs are entered into pursuant to agreements and grants that generally provide payment for certain types of expenditures in return for research and development activities over a contractually defined period. Revenues related to R&D programs include reimbursable expenses and payments received for full-time equivalent employee services recognized over the related performance periods for each of the contracts. We are required to perform research and development activities as specified in each respective agreement based on the terms and performance periods set forth in the agreements as outlined above. R&D program revenues represented 38%, 50%, and 63% of our total revenues for 2014, 2013, and 2012, respectively. Revenues from government grants and agreements represented less than 1%, 1%, and 52% of total R&D revenues in 2014, 2013, and 2012, respectively. Revenues from commercial and strategic partner development agreements represented 100%, 99%, and 48% of total R&D revenues in 2014, 2013, and 2012, respectively.
Costs and Operating Expenses
Costs and operating expenses consist of cost of product revenue, research and development expenses, sales, general and administrative expenses and restructuring charges. Personnel-related expenses, including non-cash stock-based compensation, costs associated with our strategic collaboration agreements as well as other third-party contractors and contract manufacturers, reimbursable equipment and costs associated with government contracts, consultants and facility costs, comprise the significant components of these expenses.
•Cost of Product Revenue
Through the end of 2013, cost of product revenue consisted primarily of third-party contractor costs associated with packaging, distribution and production of Algenist® products, including internal labor, shipping, supplies and other overhead costs associated with production of Alguronic Acid®, a microalgae-based active ingredient, and Microalgae Oil used in our Algenist® product line. Beginning in the first quarter of 2014, cost of product revenue also includes manufacturing, distribution and related third party contract costs associated with the production of our intermediate/ingredient products, such as our Encapso™ product, Tailored™ oils and fuels. Prior to our products' meeting any applicable regulatory requirements, all manufacturing and related production costs are recorded as research and development expenses. Starting in 2014, our Encapso™ product and three of our Tailored™ oils met applicable regulatory requirements and we began capitalizing certain production costs to inventory. From time to time, certain process development costs related to the manufacturing scale up to nameplate capacity may also be expensed to research and development expense. We expect our total cost of product revenue to increase in correlation with
52
increased product sales as the demand for our consumer product lines grows and as we commercialize our portfolio of intermediate/ingredient products targeted at customers in the Industrial Products and Food Products markets.
•Research and Development
Research and development expenses consist of costs incurred for internal projects as well as partner-funded collaborative research and development activities with commercial and strategic partners and governmental and JV entities (partners). Research and development expenses consist primarily of personnel and related costs including non-cash stock-based compensation, third party contract manufacturers, reimbursable equipment and other costs associated with our work on development programs associated with our collaboration agreements. Reimbursable equipment and costs associated with government contracts are a main component of research and development expenses prior to 2014. In addition, research and development expenses include certain costs associated with contract manufacturers' facilities, feedstock and supplies, depreciation and amortization of property and equipment used in the development of our algal oil products as well as manufacturing process as we scale up our manufacturing facilities to commercial scale production.
We expense our research and development costs as they are incurred. Our research and development programs are undertaken to advance our overall industrial biotechnology platform that enables us to produce high-value algal oils. Although our partners fund certain development activities, they benefit from advances in our technology platform as a whole, including costs funded by other development programs. Therefore, costs for such activities have not been separated as these costs have all been determined to be part of our total research and development related activity.
Our research and development efforts are directed at (1) identifying, isolating and further optimizing strains of microalgae to achieve high cell densities, high yield converting sugar to product and high productivity rates compared to other alternatives; (2) tailoring the oil outputs to meet specific market needs; (3) product and process development projects aimed at reducing the cost of oil production; and (4) scale-up of commercial scale production as well as product and process development activities at our production facilities. Our research and development projects also include activities as specified in our government grants and contracts and development agreements with commercial and strategic partners. We expect to continue to use our Peoria Facility for joint development activities, to provide samples for market development as well as for commercial production for products such as our AlgaVia™ brand of whole algal powders and flours.
•Sales, General and Administrative
Sales, general and administrative expenses consist primarily of personnel and related costs including non-cash stock-based compensation related to our executive management, corporate administration, sales, marketing and business development functions, professional services, marketing programs and samples, facility and administrative overhead expenses and unabsorbed production costs associated with excess capacity. Professional services consist primarily of consulting, external accounting, legal and investor relations fees associated with operating as a publicly-traded company.
•Restructuring Charges
In December 2014 we took steps to decrease operating expenses through a reduction in workforce and other cost-cutting measures (2014 Restructuring Plan). Restructuring charges consist primarily of one-time employee severance costs and related asset impairment charges.
Other Income (Expense), Net
•Interest and Other Income
Interest and other income consist primarily of interest income earned on marketable securities and cash balances. Our interest income will vary for each reporting period depending on our average investment balances during the period and market interest rates.
•Interest Expense
Interest expense consists primarily of interest expense related to our debt and debt conversion expense incurred to induce 2018 Note holders to exchange their 2018 Notes. As of December 31, 2014 and 2013, our outstanding debt, net of debt discounts, was approximately $200.1 million and $93.5 million, respectively.
53
•Gain (Loss) from Change in Fair Value of Warrant Liability
Gain (loss) from change in fair value of warrant liability consisted primarily of the change in the fair value of a common stock warrant issued to Bunge Limited. The warrant liability was remeasured to fair value at each balance sheet date and/or upon vesting, and the change in the then-current aggregate fair value of the warrants was recorded as a gain or loss from the change in the fair value in our consolidated statement of operations. The warrant liability was reclassified to additional paid-in capital upon conversion of redeemable preferred stock, or vesting of common warrant shares. In April 2012, the first and second tranches of the common stock warrant issued to Bunge Limited had vested, and the related warrant liability of $4.6 million was reclassified to additional paid-in capital and was no longer adjusted to fair value. In the first quarter of 2014, the warrant liability associated with the third tranche of the common stock warrant issued to Bunge Limited was adjusted to $0, as the third tranche could no longer vest.
•Gain (Loss) from Change in Fair Value of Derivative Liabilities
Gain (loss) from change in fair value of derivative liabilities consists of the changes in the fair value of the embedded derivatives related to the early conversion payment features of the 6.00% Convertible Senior Subordinated Notes due 2018 (the 2018 Notes) and the 2019 Notes (collectively with the 2018 Notes, the Notes) issued in January 2013 and April 2014, respectively.
•Income (Loss) from Equity Method Investments
Income (loss) from our equity method investment in the Solazyme Bunge JV is recorded in our income statement as “Income (Loss) from Equity Method Investments”. In the year ended December 31, 2013, we recorded a loss of $1.4 million to Income (loss) from equity method investments, net related to the dissolution of SRN.
•Income Taxes
Since inception, we have incurred net losses and have not recorded any U.S. federal, state or non-U.S. income tax provisions. We have recorded a full valuation allowance against deferred tax assets as it is more likely than not that they will not be realized.
Critical Accounting Policies and Estimates
Our discussion and analysis of our financial condition and results of operations is based upon our consolidated financial statements, which have been prepared in accordance with accounting principles generally accepted in the United States. The preparation of our consolidated financial statements requires us to make estimates, assumptions and judgments that affect the reported amounts of assets, liabilities, revenues, expenses and related disclosures. The results of our analysis form the basis for making assumptions about the carrying values of assets and liabilities that are not readily apparent from other sources. Our actual results may differ from these estimates under different assumptions or conditions. We evaluate our estimates, assumptions and judgments on an ongoing basis.
We believe the following critical accounting policies involve significant areas of management’s judgments and estimates in the preparation of our consolidated financial statements.
Revenue Recognition
We currently recognize revenues from commercial sales of our products, and from R&D programs that consist of collaborative research and development agreements with commercial and strategic partners and related parties and government programs. Revenues are recognized when all of the following criteria are met: persuasive evidence of an arrangement exists, risk of loss and title has transferred to the customer or services have been rendered, the fee is fixed or determinable and collectability is reasonably assured.
If collaborative research and development or sales agreements contain multiple elements, we evaluate whether the components of each arrangement represent separate units of accounting. We have determined that all of our revenue arrangements should be accounted for as a single unit of accounting. Application of revenue recognition standards requires subjective determination and requires management to make judgments about the fair values of each individual element and whether it is separable from other aspects of the contractual relationship.
For each source of revenue, we apply the above revenue recognition criteria in the following manner:
54
Product Revenue
Product revenue is recognized from the sale of our personal care products, which currently includes our Algenist® skin care line, and from the sale of intermediate/ingredient products including our Tailored™ oil products and fuel blend sales, the latter of which is part of our effort to build fuels marketing and commercial development programs.
Product revenue is recognized when all of the following criteria are satisfied: persuasive evidence of an arrangement exists; risk of loss and title transfers to the customer; the price is fixed or determinable; and collectability is reasonably assured. Products are sold with a right of return for expired, discontinued, damaged or non-compliant products. Algenist® products have an approximate three year shelf life from their manufacture date. We give credit for returns by issuing a credit memo at the time of product return or, in certain cases, by allowing a customer to decrease the amount of subsequent payments to us for the amount of the return. We reserve for estimated returns of products at the time revenues are recognized. To estimate our return reserve, we analyze our own actual product return data, data from our customers regarding their inventory levels and historical return rates of our products, and other known factors, such as our customers’ return policies to their end consumers, which is typically 30 to 90 days. We monitor our actual performance by comparing our actual return rates against estimated rates, and adjust our estimated return rates as necessary. In addition, we estimate a reserve for products that do not meet internal quality standards. Actual returns of Algenist® products may differ from estimates that we used to calculate such reserves.
We continually evaluate collectability of our accounts receivable related to product sales, and to date our customers have remitted full payments in a timely manner. Accordingly, we expect full collection of our accounts receivable balance related to product sales and therefore have not established any reserves for uncollectible accounts receivable.
Collaborative Research and Development Revenues
Revenues from collaborative research and development are recognized as the services are performed consistent with the performance requirements of the agreement. In cases where the planned levels of research and development fluctuate over the research term, we recognize revenues using the proportionate performance method based upon actual efforts to date relative to the amount of expected effort to be incurred by us. When up-front payments are received and the planned levels of research and development do not fluctuate over the research term, revenues are recorded on a ratable basis over the arrangement term, up to the amount of cash received. When up-front payments are received and the planned levels of research and development fluctuate over the research term, revenues are recorded using the proportionate performance method, up to the amount of cash received. Where arrangements include milestones that are determined to be substantive and at risk at the inception of the arrangement, revenues are recognized upon achievement of the milestone and are limited to those amounts for which collectability is reasonably assured. If these conditions are not met, we defer the milestone payment and recognize it as revenue over the estimated period of performance under the contract as we complete our performance obligations.
Government Program Revenues
Revenues from government programs are recognized in the period during which the related costs are incurred, provided that the conditions under which the government program activities were provided have been met and only perfunctory obligations are outstanding.
Convertible Preferred Stock Warrants
Prior to our initial public offering, the freestanding warrants to purchase shares of our convertible preferred stock were classified as liabilities on our consolidated balance sheets at fair value because the warrants could conditionally obligate us to redeem the underlying convertible preferred stock at some point in the future. The warrants were subject to remeasurement at each balance sheet date, and any change in fair value was recognized as a component of Other Income (Expense), in the consolidated statement of operations. We estimated the fair value of these warrants at the respective balance sheet dates utilizing an option-based model to allocate an estimated business enterprise value to the various classes of our equity stock and related warrants. Prior to our initial public offering, the assumptions used to estimate the business enterprise value and allocation of value to the classes of equity stock and related warrants were highly judgmental. We used our initial public offering price for the final measurement of these freestanding warrants.
In 2012 we recorded a gain of $2.3 million in Other Income (Expense) to reflect the change in the fair value of these freestanding warrants.
55
Convertible Debt and Embedded Derivative
In January 2013, we issued $125.0 million aggregate principal amount of 2018 Notes, and in April 2014, we issued $149.5 million aggregate principal amount of 2019 Notes (collectively the Notes). Each of the 2018 Notes and the 2019 Notes contain an early conversion payment feature pursuant to which a holder may convert its Notes into shares of our common stock. With respect to any conversion of 2018 Notes prior to November 1, 2016 or any conversion of 2019 Notes prior to January 1, 2018 (other than conversions in connection with certain fundamental changes), in addition to the shares deliverable upon conversion, holders are entitled to receive an early conversion payment equal to $83.33 per $1,000 principal amount of Notes surrendered for conversion that may be settled, at our election, in cash or, subject to satisfaction of certain conditions, in shares of our common stock. These early conversion payment features have been identified as embedded derivatives and are separated from the host contracts, the Notes, and carried at fair value when: (a) the embedded derivative possesses economic characteristics that are not clearly and closely related to the economic characteristics of the host contract; and (b) a separate, stand-alone instrument with the same terms would qualify as a derivative instrument. We have concluded that the embedded derivatives related to the early conversion payment features of the Notes meet these criteria and, as such, must be valued separate and apart from the Notes and recorded at their fair values at each reporting period. At each reporting period, we record these embedded derivatives at their fair values, which are included as a component of Convertible Debt on our consolidated balance sheets. The fair values of the embedded derivatives are trued up on a recurring basis as Note holders early convert their Notes and receive the early conversion payment.
We use a Monte Carlo simulation model to estimate the fair values of the embedded derivatives related to the early conversion payment features of the Notes. Historically, using the Monte Carlo model, the value of the embedded derivative was based on the assumption that the Notes will be converted early if the conversion value is greater than the holding value. Beginning in the second quarter of 2014, using the Monte Carlo model, we value these embedded derivatives using a “with-and-without method,” where the value of the Notes including the embedded derivatives, is defined as the “with”, and the value of the Notes excluding the embedded derivatives, is defined as the “without.” This method estimates the value of the embedded derivatives by observing the difference between the value of the Notes with the embedded derivatives and the value of the Notes without the embedded derivatives. We believe the "with-and-without method" results in a measurement that is more representative of the fair value of the embedded derivatives.
Stock-Based Compensation
We recognize compensation expense related to stock-based compensation, including the awarding of employee stock options and restricted stock units, based on the grant date estimated fair value. We amortize the fair value of the employee stock options on a straight-line basis over the requisite service period of the award, which is generally the vesting period.
We estimate the fair value of stock-based compensation awards using the Black-Scholes option pricing model, which requires the following inputs: expected life, expected volatility, risk-free interest rate, expected dividend yield rate, exercise price and closing price of our common stock on the date of grant. Due to our limited history of grant activity, we calculate our expected term utilizing the “simplified method” permitted by the SEC, which is the average of the total contractual term of the option and its vesting period.
We account for stock options issued to non-employees based on their estimated fair value determined using the Black-Scholes option-pricing model. We account for restricted stock units and restricted stock awards issued to nonemployees based on the estimated fair value of our common stock. The measurement of stock-based compensation for nonemployees is subject to periodic adjustments as the underlying equity instruments vest, and the resulting change in value, if any, is recognized in our consolidated statements of operations during the period the related services are rendered.
Our stock-based compensation expense is expected to increase in the future as we recognize expense related to unvested stock-based awards and we issue additional stock-based awards to attract and retain employees and nonemployee consultants.
Income Taxes
We are subject to income taxes in both the U.S. and a foreign jurisdiction, and we use estimates in determining our provisions for income taxes. We use the asset and liability method of accounting for income taxes, whereby deferred tax asset or liability account balances are calculated at the balance sheet date using current tax laws and rates in effect for the year in which the differences are expected to affect taxable income.
Recognition of deferred tax assets is appropriate when realization of such assets is more likely than not. We record a valuation allowance against our net deferred tax assets if it is more likely than not that some portion of the deferred tax assets
56
will not be fully realizable. This assessment requires judgment as to the likelihood and amounts of future taxable income by tax jurisdiction. At December 31, 2014 and 2013, we had a full valuation allowance against all of our net deferred tax assets.
Effective January 1, 2007, we adopted Financial Accounting Standards Board (FASB) Accounting Standards Codification (ASC) ASC 740-10, Income Taxes, to account for uncertain tax positions. As of December 31, 2014 and 2013, we had no significant uncertain tax positions requiring recognition in our consolidated financial statements. We do not expect the total amount of unrecognized income tax benefits will change significantly in the next 12 months.
We assess all material positions taken in any income tax return, including all significant uncertain positions, in all tax years that are still subject to assessment or challenge by relevant taxing authorities. Assessing an uncertain tax position begins with the initial determination of the position’s sustainability and is measured at the largest amount of benefit that is greater than 50 percent likely of being realized upon ultimate settlement. As of each balance sheet date, unresolved uncertain tax positions must be reassessed, and we will determine whether (1) the factors underlying the sustainability assertion have changed and (2) the amount of the recognized tax benefit is still appropriate. The recognition and measurement of tax benefits requires significant judgment. Judgments concerning the recognition and measurement of a tax benefit might change as new information becomes available.
Results of Operations
Comparison of Years Ended December 31, 2014 and 2013
Revenues
Year ended December 31, | |||||||||||
2014 | 2013 | $ Change | |||||||||
(In thousands) | |||||||||||
Revenues: | |||||||||||
Product revenues | $ | 37,346 | $ | 19,962 | $ | 17,384 | |||||
Research and development programs | 23,045 | 19,788 | 3,257 | ||||||||
Total revenues | $ | 60,391 | $ | 39,750 | $ | 20,641 | |||||
Our total revenues increased by $20.6 million in 2014 compared to 2013, due to $17.4 million of increased product sales and $3.3 million of increased R&D program revenues in 2014 compared to 2013. The increase in product revenues was due to Intermediate/Ingredient product sales of $12.7 million, including $2.9 million of product revenue from the Solazyme Bunge JV in 2014 and a $4.7 million increase in skin care product sales primarily due to new retail customers, new product offerings and increased consumer demand. We began to sell Intermediate/Ingredient products more broadly starting in the first quarter of 2014 into Industrial Products markets. These sales included our commercial launch of our Encapso™ product and Tailored™ oils as well as fuel blend sales as part of our effort to build fuels marketing and commercial development programs, which preliminarily includes the sale and transfer of blended fuels to private (non-government) customers.
We expect Intermediate/Ingredient product revenues to increase as a percentage of total net product revenues as we continue our large-scale production.
R&D program revenues increased by $3.3 million, due primarily to an increase in revenues from development agreements with the Solazyme Bunge JV, offset by a decrease in revenues from development agreements with strategic partners, due to the timing of milestone achievement, which included milestone achievement recognized from a strategic partner of $1.5 million during 2014 as compared to a $4.0 million milestone achievement recognized during 2013.
Our revenues from development agreements with strategic partners and the Solazyme Bunge JV fluctuate due to timing of the development work performed and achievement of contract milestones defined in these agreements. We are currently engaged in development activities with multiple strategic partners and the Solazyme Bunge JV and expect that our R&D program revenues will continue, as we continue this work and add new strategic partners. In the near term, we don’t expect government program revenues to increase. As we enter into new agreements with strategic partners or government programs, we expect that quarterly trends may fluctuate based on the timing of program activities with strategic partners.
The inherent flexibility of our technology platform and the broad usage of triglyceride oils across multiple industries allow us to approach a wide range of customers across myriad end markets. We expect our product revenues to increase as we commercialize our Intermediate/Ingredient products encompassing a portfolio of product revenues to total revenues as we continue our focus on higher value Industrial Products and Food Products.
57
Cost of Product Revenues
Year ended December 31, | |||||||||||
2014 | 2013 | Change | |||||||||
(In thousands) | |||||||||||
Cost of revenue: | |||||||||||
Product | $ | 20,612 | $ | 6,385 | $ | 14,227 | |||||
Gross profit: | |||||||||||
Product | $ | 16,734 | $ | 13,577 | $ | 3,157 | |||||
Gross margin: | |||||||||||
Product | 45 | % | 68 | % | (23 | )% | |||||
Beginning in early 2014, cost of product revenue includes 2014 production costs associated with our Encapso™ product and Tailored™ oils, as well as renewable fuels purchased in connection with our fuels marketing and commercial development programs, when we began to sell our Intermediate/Ingredient products more broadly to customers in the Industrial Products markets. Prior to meeting applicable regulatory requirements for these products and during scale-up of the manufacturing process, certain Encapso™ and Tailored™ oil manufacturing and related production costs were charged to research and development expenses. Certain inventories manufactured prior to regulatory approval are charged to research and development expense in periods prior to when those inventories are sold.
Cost of product revenue increased $14.2 million in 2014 compared to 2013 due to sales of Tailored™ oil and blended fuel sales that began in early 2014 and increased Algenist® product sales. Gross margins decreased from 68% during 2013 to 45% in 2014 due primarily due to the higher mix of lower gross margin intermediate and ingredient product sales of fuels, our Encapso™ product and Tailored™ oils. Gross margin percentage on Algenist® product sales remained constant at 68% in 2014 and 2013. The gross margin for Intermediate/Ingredient product sales was 11% in 2014 impacted favorably by the sale of inventories that were expensed previously to research and development expense in 2013. In addition, the gross margin on Intermediate/Ingredient product sales excludes certain production costs related to the scale-up of plant operations which are recorded to research and development expense. The gross margins for our intermediate and ingredient products are expected to be lower than our historical margins, which were based on our branded skin and personal care products. We will continue to sell our highest gross margin branded skin and personal care products and we expect to focus on production and sales of intermediate and ingredient products with higher margins. We expect our overall gross margin to decline as our product mix shifts more to Intermediate/Ingredient product sales.
We expect our total cost of production for products manufactured at the Clinton/Galva Facilities will increase as we continue to sell Intermediates/Ingredients in the Industrial Products and Food Products markets and as we focus the Clinton Facility on higher margin products such as our Encapso™ product and otherwise balance production volumes with operating expenses. We also expect that our cost of production as a percentage of revenue may be higher in the early stages of production, depending on mix of products and as production volumes fluctuate. As production volume increases our cost per MT produced is expected to decrease.
Operating Expenses
Year ended December 31, | |||||||||||
2014 | 2013 | $ Change | |||||||||
(In thousands) | |||||||||||
Operating expenses: | |||||||||||
Research and development | $ | 81,680 | $ | 66,572 | $ | 15,108 | |||||
Sales, general and administrative | 90,266 | 62,933 | 27,333 | ||||||||
Restructuring charges | 3,514 | — | 3,514 | ||||||||
Total operating expenses | $ | 175,460 | $ | 129,505 | $ | 45,955 | |||||
Research and Development Expenses
Our research and development expenses increased by $15.1 million in 2014 compared to 2013, due primarily to $7.3 million of costs related to development of new algal oils and the scale up of commercial production at the Clinton/ Galva
58
Facilities, increased personnel-related and facilities-related costs of $5.0 million and $1.6 million, respectively and increased research program expenses of $1.8 million due primarily to timing of such programs.
Personnel-related and facilities-related costs increased as a result of headcount growth to support the Clinton, Galva and Solazyme Bunge JV activities as well as Peoria manufacturing and collaborative research activities. Personnel-related costs include non-cash stock-based compensation expense of $7.4 million in 2014 compared to $5.9 million in 2013.
We expect overall research and development costs to decrease in 2015, compared to 2014, in particular personnel-related costs, as a result of the reduction in workforce and other cost-cutting measures we implemented starting in December 2014. We plan to continue to make investments in research and development for the foreseeable future, but at a lower rate, as we continue (1) to identify, isolate and further optimize strains of microalgae to achieve high cell densities, high yield converting sugar to product and high productivity rates compared to other alternatives; (2) to tailor the oil outputs to meet specific market needs; (3) to engage in product and process development projects aimed at reducing the cost of oil production; and (4) to scale-up new products as well as process and product development activities at the Clinton/Galva Facilities to commercial scale.
Sales, General and Administrative Expenses
Our sales, general and administrative expenses increased by $27.3 million in 2014 compared to 2013, primarily due to increased personnel-related and facilities-related costs of $12.5 million and $0.7 million, respectively, net litigation settlement costs of $4.5 million, increased marketing and promotional costs of $4.6 million and increased external legal costs and outside services of $3.3 million. During 2014, we and Therabotanics, LLC agreed to settle our litigation for $4.8 million, net of insurance reimbursements of $0.3 million.
Personnel-related and facilities-related costs increased due to headcount growth primarily related to commercialization of our products. Personnel-related costs include non-cash stock-based compensation of $18.1 million in 2014 compared to $12.7 million in 2013. Stock-based compensation in 2014 includes $2.3 million of costs related to the modification of a former executive's equity awards. Marketing and promotional costs increased mainly due to Algenist® product and intermediates/ingredients product launches during 2014 compared to 2013. We plan to continue to invest in commercialization of our high value Intermediate/Ingredient products in the Industrial Products and Food Products markets which may increase our overall selling, general and administrative expenses, but expect personnel-related expenses to decrease in 2015 compared to 2014, as a result of a reduction in workforce and other cost-cutting measures we implemented starting in December 2014.
Restructuring Charges
In December 2014 we took steps to decrease operating expenses through a reduction in workforce and other cost-cutting measures (2014 Restructuring Plan). Restructuring charges consist primarily of one-time employee severance costs of $2.0 million and asset impairment charges of $1.5 million. As a result of the 2014 Restructuring Plan, we anticipate a reduction in annualized cash operating expenses of at least $18.0 million in 2015.
Other Income (Expense), Net
Year ended December 31, | |||||||||||
2014 | 2013 | $ Change | |||||||||
(In thousands) | |||||||||||
Other income (expense): | |||||||||||
Interest and other income, net | $ | 1,310 | $ | 1,369 | $ | (59 | ) | ||||
Interest expense | (13,477 | ) | (7,136 | ) | 6,341 | ||||||
Loss from equity method investments | (23,037 | ) | (8,237 | ) | 14,800 | ||||||
Gain from change in fair value of warrant liability | 688 | 147 | 541 | ||||||||
Gain (loss) from change in fair value of derivative liability | 8,056 | (6,392 | ) | (14,448 | ) | ||||||
Total other income (expense), net | $ | (26,460 | ) | $ | (20,249 | ) | $ | 6,211 | |||
Interest expense
Interest expense increased by $6.3 million in 2014 compared to 2013, primarily due to $6.8 million of increased interest expense as a result of the 2019 Notes and $1.8 million of debt conversion expense incurred in 2014, partially offset by $2.6 million of reduced interest expense resulting from early conversions of the 2018 Notes and $10.4 million paydown of our credit facility with HSBC. In June 2014, we entered into note exchange agreements with certain holders of our 2018 Notes
59
pursuant to which such holders agreed to exchange approximately $17.5 million in aggregate principal amount of 2018 Notes, together with accrued interest thereon through the settlement date of the Exchange, with us for a total 2.4 million shares of our common stock. Debt conversion expense represents the fair value of all common stock transferred in the Exchange in excess of the fair value of common stock issuable pursuant to the original conversion terms. The fair value of the common stock was measured as of the date the Exchange offer was accepted by the holders. We expect interest expense to increase primarily as a result of issuing the 2019 Notes, and to fluctuate with changes in our debt obligations.
Loss from Equity Method Investment
Loss from equity method investments increased by $14.8 million in 2014 compared to 2013, primarily due to a $16.2 million increase in our proportionate share of the net loss from the Solazyme Bunge JV, partially offset by a $1.4 million loss recognized in 2013 related to the dissolution of SRN. We expect the loss from our equity method investment to increase as the Solazyme Bunge JV continues the ramp up and optimization of the Solazyme Bunge JV Plant and increases commercial-scale production in Brazil.
Gain from Change in Fair Value of Warrant Liability
There was a $0.7 million gain from the change in fair value of warrant liability in 2014 compared to a $0.1 million gain in 2013. The change in fair value of warrant liability is related to the fair value of the unvested warrant issued to Bunge Limited. The warrant vests in three separate tranches, each contingent upon the achievement of specific performance-based milestones related to the formation and operations of the Solazyme Bunge JV. The unvested warrant shares were recorded as a liability on our consolidated balance sheet beginning in the second quarter of 2012, and the unvested portion of the warrant continued to be remeasured to fair value at each balance sheet date and reclassified to additional paid-in capital upon vesting. In the second quarter of 2012, 750,000 warrant shares (first and second tranche) vested and were reclassified to additional paid-in capital. Beginning in the first quarter of 2014, the warrant liability associated with the third tranche of the common stock warrant issued to Bunge Limited was adjusted to $0, as the third tranche could no longer vest.
(Gain) Loss from Change in Fair Value of Derivative Liability
Gain from change in fair value of derivative liabilities of $8.1 million in 2014 was due primarily to the change in the fair value of the embedded derivatives related to the early conversion payment features of the 2018 Notes and 2019 Notes (Notes) issued in January 2013 and April 2014, compared to a $6.4 million loss in 2013. We expect that gain/loss from change in fair value of derivative liabilities will fluctuate each reporting period as we remeasure these embedded derivatives at fair value, which is included as a component of convertible debt on our consolidated balance sheets.
Results of Operations
Comparison of Years Ended December 31, 2013 and 2012
Revenues
Year ended December 31, | |||||||||||
2013 | 2012 | $ Change | |||||||||
(In thousands) | |||||||||||
Revenues: | |||||||||||
Research and development programs | $ | 19,788 | $ | 27,649 | $ | (7,861 | ) | ||||
Net product revenue | 19,962 | 16,459 | 3,503 | ||||||||
Total revenues | $ | 39,750 | $ | 44,108 | $ | (4,358 | ) | ||||
R&D program revenue decreased by $7.9 million in 2013 compared to 2013, due to a $14.1 million decrease in government program revenues, partially offset by a $6.3 million increase in revenues primarily from development agreements with the Solazyme Bunge JV and strategic partners.
Our government program revenues decreased in 2013 compared to the same period in 2012, primarily due to the completion of the integrated biorefinery build out at our Peoria Facility in mid-2012 under the DOE grant, delivery of our commitment of algal oil under the Dynamic Fuels subcontract in the first half of 2012 and completion of the second phase of our 2011 DoD fuels testing and certification contract in June 2012. The grant awarded by the DOE has funded $21.8 million of the build-out, equipment costs and certain research and development costs associated with our integrated biorefinery program at our Peoria Facility.
60
Our revenues from development agreements with strategic partners and the Solazyme Bunge JV increased due to timing of the development work performed and achievement of contract milestones defined in these agreements.
Net product revenue increased primarily due to new Algenist® product offerings and increased consumer demand.
Cost of Product Revenues
Year ended December 31, | |||||||||||
2013 | 2012 | $ Change | |||||||||
(In thousands) | |||||||||||
Cost of revenue: | |||||||||||
Product | $ | 6,385 | $ | 5,311 | $ | 1,074 | |||||
Gross profit: | |||||||||||
Product | $ | 13,577 | $ | 11,148 | $ | 2,429 | |||||
Cost of product revenue increased by $1.1 million in 2013 compared to 2012 primarily due almost exclusively to increased sales of Algenist® products. Gross margin percentage on product sales remained constant at 68% in 2013 and 2012.
Operating Expenses
Year ended December 31, | |||||||||||
2013 | 2012 | $ Change | |||||||||
(In thousands) | |||||||||||
Operating expenses: | |||||||||||
Research and development | $ | 66,572 | $ | 66,384 | $ | 188 | |||||
Sales, general and administrative | 62,933 | 57,516 | 5,417 | ||||||||
Total operating expenses | $ | 129,505 | $ | 123,900 | $ | 5,605 | |||||
Research and Development Expenses
Our research and development expenses increased by $0.2 million in 2013 compared to 2012, due primarily to $10.6 million of increased costs incurred to scale up the Clinton/ Galva Facilities as well as increased personnel-related and facilities-related costs of $5.1 million and $1.6 million, respectively, offset by decreased DOE and DoD R&D program costs and outside contract manufacturing costs of $15.1 million and $2.1 million, respectively.
Personnel-related and facilities-related costs increased as a result of headcount growth to support the Clinton, Galva and Solazyme Bunge JV activities as well as Peoria manufacturing and collaborative research activities. Personnel-related costs include non-cash stock-based compensation expense of $5.9 million in 2013 compared to $3.9 million in 2012.
R&D program and third-party contractor costs decreased in 2013 compared to 2012 primarily due to decreased costs as a result of the completion of both the construction of the integrated biorefinery program and the second phase of our 2011 DoD fuels testing and certification contract in 2012.
Sales, General and Administrative Expenses
Our sales, general and administrative expenses increased by $5.4 million in 2013 compared to 2012, primarily due to increased personnel-related and facilities-related costs of $5.6 million and $0.5 million, respectively, increased marketing and promotional costs of $0.2 million, partially offset by decreased outside service costs of $0.8 million. Personnel-related and facilities-related costs increased due to headcount growth primarily related to commercialization of our products. Personnel-related costs include non-cash stock-based compensation of $12.7 million in 2013 compared to $11.5 million in 2012.
61
Other Income (Expense), Net
Year ended December 31, | |||||||||||
2013 | 2012 | $ Change | |||||||||
(In thousands) | |||||||||||
Other income (expense): | |||||||||||
Interest and other income, net | $ | 1,369 | $ | 2,072 | $ | (703 | ) | ||||
Interest expense | (7,136 | ) | (561 | ) | 6,575 | ||||||
Loss from equity method investments | (8,237 | ) | (1,824 | ) | 6,413 | ||||||
Gain from change in fair value of warrant liability | 147 | 2,284 | (2,137 | ) | |||||||
Loss from change in fair value of derivative liability | (6,392 | ) | — | 6,392 | |||||||
Total other income (expense), net | $ | (20,249 | ) | $ | 1,971 | $ | (22,220 | ) | |||
Interest and Other Income, net
Interest and other income, net decreased by $0.7 million in 2013 compared to 2012, primarily due to decreased investment yields on investment balances.
Interest expense
Interest expense increased by $6.6 million in 2013 compared to 2012, due to $7.7 million of increased interest expense resulting primarily from the issuance of the 2018 Notes in January 2013, partially offset by $1.1 million of interest expense capitalized to our investment in the Solazyme Bunge JV.
Loss from Equity Method Investment
Loss from equity method investment increased by $6.4 million in 2013 compared to 2012, primarily due to the increase in our proportionate share of the net loss from the Solazyme Bunge JV of $5.0 million and a $1.4 million loss related to the dissolution of SRN.
Gain from Change in Fair Value of Warrant Liability
There was a $0.1 million gain from the change in fair value of warrant liability in 2013 compared to a $2.3 million gain from the change in fair value of warrant liability in 2012. In the second quarter of 2012, 750,000 warrant shares vested and were reclassified to additional paid-in capital.
Loss from Change in Fair Value of Derivative Liability
Loss from change in fair value of derivative liability of $6.4 million in 2013 was due to the change in the fair value of the embedded derivative related to the early conversion feature of the 2018 Notes issued in January 2013 of $4.4 million and fair value adjustments related to early conversions made in 2013 of $2.0 million.
Liquidity and Capital Resources
December 31, 2014 | December 31, 2013 | ||||||
(In thousands) | |||||||
Cash and cash equivalents | $ | 42,689 | $ | 54,977 | |||
Marketable securities | 164,619 | 112,544 | |||||
Cash, cash equivalents and marketable securities increased by $39.8 million in 2014, primarily due to $202.6 million of proceeds received from our 2019 Notes issuance and equity offering in April 2014, net of underwriting discounts and offering costs and $8.9 million of proceeds received from common stock issuances pursuant to our equity plans, partially offset by cash used in operating activities of $118.1 million, $32.6 million of capital contributed to the Solazyme Bunge JV, $10.4 million of repayments under loan agreements, $7.2 million of property and equipment purchases, a $0.7 million letter of credit obtained for a lease agreement and $0.6 million of capitalized interest related to the Solazyme Bunge JV.
62
The following table shows a summary of our cash flows for the periods indicated:
Year ended December 31, | |||||||||||
2014 | 2013 | 2012 | |||||||||
(In thousands) | |||||||||||
Net cash used in operating activities | $ | (118,113 | ) | $ | (74,790 | ) | $ | (67,571 | ) | ||
Net cash (used in) provided by investing activities | (95,091 | ) | (20,341 | ) | 72,234 | ||||||
Net cash provided by (used in) financing activities | 201,082 | 119,379 | (2,570 | ) | |||||||
Sources and Uses of Capital
Since our inception, we have incurred significant net losses, and, as of December 31, 2014, we had an accumulated deficit of $468.5 million. We anticipate that we will continue to incur net losses as we continue the scale-up of our manufacturing activities, support commercialization activities for our products and continue to support our research and development activities. In addition, we may acquire additional manufacturing facilities, expand or build out our current manufacturing facilities and/or build additional manufacturing facilities. We are unable to predict the extent of any future losses or when we will become profitable, if at all. We expect to continue making investments in research and development and manufacturing, and expect selling, general and administrative expenses to increase as we begin and ramp up commercialization. As a result, we will need to generate significant revenues from product sales, collaborative research and joint development activities, licensing fees and other revenue arrangements to achieve profitability. To date, our sources for capital are as follows:
Strategic Partners and Government
In January 2010, we obtained a grant from the DOE to receive up to $21.8 million for reimbursement of expenses incurred towards building, operating, and optimizing a pilot-scale integrated biorefinery, which has allowed us to develop integrated U.S.-based production capabilities at the Peoria Facility to make oil for algae-derived biofuel. Under the terms of the grant, we were responsible for funding an additional $8.4 million. We submitted our final report to the DOE and completed all the other outstanding requirements under the award in December 2014 and are currently working with the DOE to close out the program.
We purchased the Peoria Facility in May 2011. We began fermentation operations in the fourth quarter of 2011 and commissioned our integrated biorefinery in June 2012, funded in part by the DOE grant described above. In connection with the closing of the Peoria Facility acquisition, we entered into a promissory note, mortgage and security agreement with the seller in the initial amount of $5.5 million. In March 2013, we paid in full the outstanding principal on this promissory note.
In April 2012, we entered into the Solazyme Bunge JV, which is jointly capitalized by us and Bunge, which operates an oil production facility in Brazil that utilizes our proprietary technology to produce oil products from sugar feedstock provided by Bunge. Through December 31, 2014 we contributed $70.1 million in capital to the Solazyme Bunge JV, and we may need to contribute additional capital to this project. In February 2013, the Solazyme Bunge JV entered a loan agreement with the Brazilian Development Bank (BNDES) under which it may borrow up to R$245.7 million (approximately USD $91.4 million based on the exchange rate as of December 31, 2014). As a condition of the Solazyme Bunge JV drawing funds under the loan in excess of amounts supported by bank guarantees, we may be required to provide a corporate guarantee for a portion of the loan (in an amount that when added to the amount supported by our bank guarantee does not to exceed our ownership percentage in the Solazyme Bunge JV). The BNDES funding has supported the Solazyme Bunge JV’s first commercial-scale production facility in Brazil, which has reduced the capital requirements funded directly by us and Bunge. We expect to scale up additional manufacturing capacity in a capital-efficient manner by signing additional agreements whereby our partners will invest capital and operational resources in building manufacturing capacity, while also providing access to feedstock. We expect to evaluate the optimal amount of capital expenditures that we agree to fund on a case-by-case basis. These events may require us to access additional capital through equity or debt offerings. If we are unable to access additional capital, our growth may be limited due to the inability to build out additional manufacturing capacity.
In November 2012, we entered into a strategic collaboration agreement with ADM, whereby we agreed to pay ADM annual fees for the use and operation of a portion of its commercial scale facility in Clinton, Iowa, a portion of which may be paid in our common stock. In addition, in March 2013 we issued a series of warrants to ADM for payment in stock or cash, at our election, of future annual fees for use and operation of a portion of the Clinton Facility. During 2013, we made payments to ADM in both common stock and cash.
63
Commercial Banks
On May 11, 2011, we entered into a loan and security agreement with Silicon Valley Bank that provided for a $20.0 million credit facility (the SVB facility) consisting of (i) a $15.0 million term loan (the term loan) and (ii) a $5.0 million revolving facility (the SVB revolving facility). In the first quarter of 2013, the SVB facility was terminated when we paid in full the outstanding principal and interest on the term loan using proceeds from the revolving facility with HSBC Bank, USA, National Association (HSBC) we entered into in March 2013 as described below.
On March 26, 2013, we entered into a credit facility with HSBC (the HSBC facility), which provides for a $30.0 million revolving facility for working capital, letters of credit denominated in U.S. dollars or a foreign currency and other general corporate purposes, in May 2013 we entered into an amendment to increase the HSBC facility to $35.0 million, and in March 2014 we amended the HSBC facility to extend the maturity date to May 31, 2016. Also on March 26, 2013, we drew down approximately $10.4 million under the HSBC facility to repay the outstanding term loan plus accrued interest under the SVB facility. On June 27, 2014, we paid in full the outstanding principal and interest due under the HSBC facility. The HSBC facility is unsecured unless (i) we take action that could cause or permit obligations under the HSBC facility not to constitute senior debt (as defined in the indentures related to the 2018 Notes and the 2019 Notes by and between us and Wells Fargo Bank, National Association, as trustee), (ii) we breach financial covenants that require us and our subsidiaries to maintain cash and unrestricted cash equivalents at all times of not less than $35.0 million plus one hundred ten percent of the aggregate dollar equivalent amount of outstanding advances and letters of credit under the HSBC facility, or (iii) there is a payment default under the HSBC facility or bankruptcy or insolvency events relating to us. A portion of the HSBC facility supports the bank guarantee issued to BNDES in May 2013. Therefore, approximately $21.9 million of the HSBC facility remained available as of December 31, 2014, and we were in compliance with the financial covenants of the HSBC facility.
Private and Public Offerings
In January 2013, we issued $125.0 million aggregate principal amount of 2018 Notes in a private offering to qualified institutional buyers pursuant to Rule 144A under the Securities Act of 1933, as amended. The 2018 Notes bear interest at a fixed rate of 6.00% per year, payable semiannually in arrears on August 1 and February 1 of each year, beginning on August 1, 2013. The 2018 Notes are convertible into our common stock and will mature on February 1, 2018, unless earlier repurchased or converted. We may not redeem the 2018 Notes prior to maturity. The initial conversion price is approximately $8.26 per share of common stock and, under certain circumstances, the 2018 Note holders will be entitled to additional payments upon conversion. The 2018 Notes are convertible at the option of the holders at any time prior to February 1, 2018 into shares of our common stock at the then-applicable conversion rate. The conversion rate is initially 121.1240 shares of common stock per $1,000 principal amount of 2018 Notes. In the event the 2018 Notes are converted prior to November 1, 2016 (other than conversions in connection with certain fundamental changes described below), in addition to the shares deliverable upon conversion, the holders are entitled to receive an early conversion payment of $83.33 per $1,000 principal amount of 2018 Notes surrendered for conversion that may be settled, at our election, in cash or, subject to satisfaction of certain conditions, in shares of our common stock. If we undergo a fundamental change (as defined in the indenture entered into with the trustee), 2018 Note holders may require that we repurchase for cash all or part of their 2018 Notes at a purchase price equal to 100% of the principal amount of the 2018 Notes to be repurchased, plus accrued and unpaid interest to, but excluding, the fundamental change repurchase date. In addition, if fundamental changes occur, we may be required in certain circumstances to increase the conversion rate for any 2018 Notes converted in connection with such fundamental changes by a specified number of shares of our common stock.
On June 19, 2014, we entered into note exchange agreements (the Exchange Agreements) with certain holders of the 2018 Notes pursuant to which such holders agreed to exchange approximately $17.5 million in aggregate principal amount of their 2018 Notes, together with accrued interest thereon through the settlement date of the Exchange Agreements, with us for 2,409,964 shares of our common stock. The Exchange Agreements settled on June 30, 2014. As of December 31, 2014, we had issued approximately 8.3 million shares of our common stock to settle both the 2018 Note conversions and early conversion payments, including the settlements under the Exchange Agreements. We had $61.6 million aggregate principal amount of 2018 Notes outstanding as of December 31, 2014.
On April 1, 2014, we issued $149.5 million aggregate principal amount of 2019 Notes in a public offering pursuant to an effective shelf registration statement. The 2019 Notes bear interest at a fixed rate of 5.00% per year, payable semiannually in arrears on April 1 and October 1 of each year, beginning on October 1, 2014. The 2019 Notes are convertible into our common stock and will mature on October 1, 2019, unless earlier repurchased or converted. We may not redeem the 2019 Notes prior to maturity. The initial conversion price of the 2019 Notes is approximately $13.20 per share of common stock) and, under certain circumstances, the 2019 Note holders will be entitled to additional payments upon conversion. The 2019 Notes are convertible at the option of the holders at any time prior to January 1, 2018 into shares of our common stock at the then-applicable
64
conversion rate. The conversion rate is initially 75.7576 shares of common stock per $1,000 principal amount of 2019 Notes. In the event the 2019 Notes are converted prior to January 1, 2018 (other than conversions in connection with certain fundamental changes described below), in addition to the shares deliverable upon conversion, the holders are entitled to receive an early conversion payment of $83.33 per $1,000 principal amount of 2019 Notes surrendered for conversion that may be settled, at our election, in cash, or subject to satisfaction of certain conditions, in shares of our common stock. If we undergo a fundamental change (as defined in the indenture entered into with the trustee), 2019 Note holders may require that we repurchase for cash all or part of their Notes at a purchase price equal to 100% of the principal amount of the Notes to be repurchased, plus accrued and unpaid interest to, but excluding, the fundamental change repurchase date. In addition, if fundamental changes occur, we may be required in certain circumstances to increase the conversion rate for any 2019 Notes converted in connection with such fundamental changes by a specified number of shares of our common stock. We had $149.5 million aggregate principal amount of 2019 Notes outstanding as of December 31, 2014.
On April 1, 2014, the Company also issued 5,750,000 shares of its common stock, par value $0.001 per share, at $11.00 per share (the "Common Stock Offering") in a public offering pursuant to an effective shelf registration statement. The net proceeds from the Common Stock Offering were $59.2 million, after deducting underwriter discounts and commissions and offering expenses payable by the Company.
We believe that our current cash, cash equivalents, marketable securities and revenue from product sales will be sufficient to fund our current operations for at least the next 12 months. However, our liquidity assumptions may prove to be wrong, and we could utilize our available financial resources sooner than we currently expect. We may elect to raise additional funds within this period of time through public or private debt or equity financings and/or additional collaborations.
Our future capital requirements and the adequacy of available funds will depend on many factors, including those set forth under “Risk Factors” elsewhere in this Annual Report on Form 10-K. We may not be able to secure additional financing to meet our funding requirements on acceptable terms, if at all. If we raise additional funds by issuing equity securities, dilution to our existing stockholders may result. If we are unable to obtain additional funds, we will have to reduce our operating costs and delay our manufacturing and research and development programs.
Cash Flows from Operating Activities
Cash used in operating activities of $118.1 million in 2014 primarily reflects a loss of $162.1 million, aggregate non-cash charges of $55.5 million and a net change of $11.5 million in our net operating assets and liabilities. Non-cash charges included stock-based compensation, loss from equity method investments, revaluations of our warrant liability and derivative liabilities, depreciation and amortization, net amortization of premiums on marketable securities, restructuring charges, debt conversion expense and debt discount and loan fee amortization. We expect stock-based compensation and revaluation of our derivative liability to fluctuate with the change in our stock price and other factors. We expect loss from equity method investments and depreciation expense to increase as production of commercial products and optimization of manufacturing operations at the Solazyme Bunge JV Plant and the Clinton/Galva Facilities is ramped up.
The net change in our operating assets and liabilities in 2014 was primarily a result of decreased accounts payable and accrued liabilities of $1.5 million, decreased other assets of $3.6 million, decreased accounts receivable and unbilled revenue of $11.3 million, partially offset by increased inventories of $5.5 million. Accounts payable and accrued liabilities decreased due to decreased scale-up activities at the Clinton/Galva Facilities and decreased bonus accrual, partially offset by additional interest expense accrued as a result of the issuance of 2019 Notes in April 2014 and restructuring charges accrued as a result of the 2014 Restructuring Plan. Other assets decreased due to amortization of a deferred rent asset. Accounts receivables and unbilled revenues decreased due primarily to the timing of payments received under our R&D programs. Inventories increased due primarily to commercial launch of intermediate/ingredient products, including Encapso™, TailoredTM oils and fuels.
Cash used in operating activities of $74.8 million in 2013 reflects a loss of $116.4 million, and a net change of $0.4 million in our net operating assets and liabilities, partially offset by aggregate non-cash charges of $42.0 million. Non-cash charges included stock-based compensation, loss from equity method investments, revaluation of our derivative liability, depreciation and amortization, net amortization of premiums on marketable securities and debt discount and loan fee amortization. The net change in our operating assets and liabilities was primarily a result of increased accounts receivable and unbilled revenue of $5.2 million, increased deferred revenues of $2.0 million, increased inventories of $2.9 million, increased accounts payable and accrued liabilities of $3.4 million and decreased other assets of $3.3 million. Accounts receivable and unbilled revenue increased primarily due to billing related to research and development agreements entered into in 2013 and timing of payments received on accounts receivables from strategic partners. Deferred revenues increased due primarily to the timing of payments received under our R&D programs. Inventories increased due to the expansion of and increased demand in
65
our skin care line. The net increase in accounts payable and accrued liabilities was due primarily to increased scale-up activities at the Clinton Facility and interest accrued on the Notes.
Cash used in operating activities of $67.6 million in 2012 reflect a loss of $83.1 million, and a net change of $5.5 million in our net operating assets and liabilities, partially offset by aggregate non-cash charges of $21.1 million. Non-cash charges primarily included $15.4 million of stock-based compensation, $3.5 million of depreciation and amortization, $2.5 million of net amortization of premiums on marketable securities, $2.3 million gain on revaluation of warrant liability and $1.8 million of loss from an equity method investment. The net change in our operating assets and liabilities was primarily a result of increases in inventories of $3.8 million, decreased deferred revenue of $2.7 million, a net decrease in accounts payable and accrued liabilities of $1.4 million, decrease in accounts receivable of $0.7 million, decrease in unbilled revenue of $0.7 million and a $0.6 million decrease in prepaid expenses and other current assets. Inventories increased due to increased production of Algenist® product to meet higher customer demand. Deferred revenue decreased primarily due to timing of payments received on R&D programs. Accounts payable and accrued liabilities decreased primarily due to payments made to third-party contract manufacturers that we no longer use as a result of the operations at our Peoria Facility. Accounts receivable and unbilled revenues decreased due primarily to the execution of work under government programs during 2012. Prepaid expenses decreased primarily due to payments received from SRN to settle other receivables due to us.
Cash Flows from Investing Activities
In 2014, cash used in investing activities was $95.1 million, primarily as a result of $54.0 million of net marketable securities purchases, $32.6 million of capital contributed to the Solazyme Bunge JV, $7.2 million of capital expenditures related primarily to equipment installed at the Peoria and Clinton/Galva Facilities, a $0.7 million letter of credit obtained for a lease agreement and $0.6 million of interest capitalized related to the Solazyme Bunge JV.
In 2013, cash used in investing activities was $20.3 million, primarily as a result of $3.4 million of net marketable securities maturities, offset by $12.4 million of capital contributed to the Solazyme Bunge JV and the Solazyme Roquette JV, $10.2 million of capital expenditures related primarily to equipment installed at the Clinton Facility, and $1.1 million of capitalized interest related to the Solazyme Bunge JV.
In 2012, cash provided by investing activities was $72.2 million, primarily as a result of $94.8 million of net marketable securities maturities, partially offset by $12.6 million of capital expenditures related primarily to the construction of our Peoria Facility and $10.0 million of capital contributed to the Solazyme Bunge JV.
Cash Flows from Financing Activities
In 2014, cash provided by financing activities was $201.1 million, primarily due to $202.6 million of proceeds received from the issuance of the 2019 Notes and Common Stock Offering, net of underwriting discounts and offering issue costs and $8.9 million of proceeds received from common stock issuances pursuant to our equity plans, partially offset by $10.4 million of principal debt payments.
In 2013, cash provided by financing activities was $119.4 million, primarily due to $119.2 million of proceeds received from the issuance of the 2018 Notes, net of debt discounts and debt issue costs, $10.4 million of loan proceeds received from HSBC and $4.8 million received from common stock issuances pursuant to our equity plans, partially offset by $14.9 million of principal debt payments.
In 2012, cash used in financing activities was $2.6 million, primarily due to $5.4 million of repayments under loan agreements, partially offset by proceeds of $2.9 million received from common stock issuances pursuant to our equity plans.
66
Contractual Obligations and Commitments
The following is a summary of our contractual obligations and commitments as of December 31, 2014 (in thousands):
Total | 2015 | 2016 | 2017 | 2018 | 2019 | 2020 and beyond | |||||||||||||||||||||
Principal payments on long-term debt | $ | 211,138 | $ | 6 | $ | — | $ | — | $ | 61,632 | $ | 149,500 | $ | — | |||||||||||||
Interest payments on long-term debt, fixed rate | 50,318 | 11,173 | 11,173 | 11,173 | 9,324 | 7,475 | — | ||||||||||||||||||||
Non-cancelable operating leases | 20,004 | 10,738 | 4,388 | 4,512 | 366 | — | — | ||||||||||||||||||||
Purchase obligations | 780 | 360 | 360 | 60 | — | — | — | ||||||||||||||||||||
Total | $ | 282,240 | $ | 22,277 | $ | 15,921 | $ | 15,745 | $ | 71,322 | $ | 156,975 | $ | — | |||||||||||||
This table does not reflect (1) a lease agreement entered into in May 2011 for facility space in Brazil; the lease term is five years, commencing on April 1, 2011 and expiring on April 1, 2016; the rent is 35,300 Brazilian Real (approximately $13,000 based on the exchange rate at December 31, 2014) per month which will be canceled in 2015 as part of the 2014 Restructuring Plan and (2) fees expected to be incurred related to the bank guarantee issued to BNDES in May 2013.
We currently lease approximately 106,000 square feet of office and laboratory space in South San Francisco, California pursuant to a lease agreement which ends in January 2018. In September 2014, we entered into a new lease agreement for approximately 5,000 square feet of office space located in Glendale, California. The term of the Glendale lease commences in November 2014 and ends in October 2017.
Operating leases also include annual fees to use and operate a portion of the Clinton/ Galva Facilities, a portion of which may be paid in our common stock.
Off-Balance Sheet Arrangements
For information on variable interest entities and guarantees, refer to Note 8 and Note 12, respectively, in the accompanying notes to our consolidated financial statements.
Recent Accounting Pronouncements
Refer to Note 2 in the accompanying notes to our consolidated financial statements for a discussion of recent accounting pronouncements.
67
Item 7A. Quantitative and Qualitative Disclosures about Market Risk.
We are exposed to financial market risks, primarily changes in interest rates, currency exchange rates and commodity prices. All of the potential changes noted below are based on sensitivity analyses performed on our financial positions as of December 31, 2014. Actual results may differ materially.
Interest Rate Risk
Our exposure to market risk for changes in interest rates relates primarily to our investment portfolio and our outstanding debt obligations. We generally invest our cash in investments with short maturities or with frequent interest reset terms. Accordingly, our interest income fluctuates with short-term market conditions. As of December 31, 2014, our investment portfolio consisted primarily of corporate debt obligations, U.S. government agency securities, asset-backed and mortgaged-backed securities, municipal bonds and money market funds, which are held for working capital purposes. We believe we do not have material exposure to changes in fair value as a result of changes in interest rates. Our marketable securities were comprised primarily of fixed-term securities as of December 31, 2014. Due to the short-term nature of these instruments, we do not believe that there would be a significant negative impact to our consolidated financial position or results of operations as a result of interest rate fluctuations in the financial markets. On March 26, 2013 we entered into the HSBC revolving facility, which bears a variable interest rate based on LIBOR during the two-year funding period; however, we had no balances outstanding under the HSBC revolving facility as of December 31, 2014. Our other outstanding debt as of December 31, 2014 consists of fixed-rate debt, and therefore, is not subject to fluctuations in market interest rates.
Foreign Currency Risk
Our operations include manufacturing and sales activities primarily in the United States, as well as research activities primarily in the United States. We are active outside the United States, in particular in Brazil through our Solazyme Bunge JV and our Brazil subsidiary. We also sell our Algenist® products in Europe. As a result, our results of operations and cash flows are subject to fluctuations due to changes in foreign currency exchange rates. For example, our operations in Brazil or increasing Euro denominated product sales to European distributors, will result in our use of currencies other than the U.S. dollar. In addition, the local currency is the functional currency of our Brazil subsidiary and the Solazyme Bunge JV (an unconsolidated joint venture). The assets and liabilities of the Brazil subsidiary are translated from its functional currency to U.S. dollars at the exchange rate in effect at the balance sheet date, with resulting foreign currency translation adjustments recorded in accumulated other comprehensive income (loss) in the consolidated statements of comprehensive loss. The assets and liabilities of the Solazyme Bunge JV are also translated to U.S. dollars similar to our Brazil subsidiary, and we adjust our investment in the Solazyme Bunge JV and cumulative translation adjustment in equity for our ownership portion of the cumulative translation gain or loss recognized on the Solazyme Bunge JV's financial statements. As a result, our comprehensive income (loss), cash flows and expenses are subject to fluctuations due to changes in foreign currency exchange rates. In periods when the U.S. dollar declines in value as compared to the foreign currencies in which we incur expenses, our foreign-currency based expenses increase when translated into U.S. dollars. We have not hedged our foreign currency since the exposure has not been material to our historical operating results. Although substantially all of our sales are currently denominated in U.S. dollars, future fluctuations in the value of the U.S. dollar may affect the price competitiveness of our products outside the United States. We may consider hedging our foreign currency risk in the future.
Commodity Price Risk
Our exposure to market risk for changes in commodity prices currently relates primarily to our purchases of plant sugar feedstock. We have not historically hedged the price volatility of plant sugar feedstock. In the future, we may manage our exposure to this risk by hedging the price volatility of feedstock, principally through futures contracts, and entering into joint venture agreements that would enable us to obtain secure access to feedstock.
68
Item 8. Financial Statements and Supplementary Data.
CONSOLIDATED FINANCIAL STATEMENTS
Solazyme, Inc.
Index
69
REPORT OF INDEPENDENT REGISTERED PUBLIC ACCOUNTING FIRM
To the Board of Directors and Stockholders of
Solazyme, Inc.
South San Francisco, California
We have audited the accompanying consolidated balance sheets of Solazyme, Inc. and subsidiaries (the “Company”) as of December 31, 2014 and 2013, and the related consolidated statements of operations, comprehensive loss, stockholders’ equity, and cash flows for each of the three years in the period ended December 31, 2014. These consolidated financial statements are the responsibility of the Company’s management. Our responsibility is to express an opinion on the consolidated financial statements based on our audits.
We conducted our audits in accordance with the standards of the Public Company Accounting Oversight Board (United States). Those standards require that we plan and perform the audit to obtain reasonable assurance about whether the financial statements are free of material misstatement. An audit includes examining, on a test basis, evidence supporting the amounts and disclosures in the financial statements. An audit also includes assessing the accounting principles used and significant estimates made by management, as well as evaluating the overall financial statement presentation. We believe that our audits provide a reasonable basis for our opinion.
In our opinion, such consolidated financial statements present fairly, in all material respects, the consolidated financial position of Solazyme, Inc. and subsidiaries as of December 31, 2014 and 2013, and the results of its operations and its cash flows for each of the three years in the period ended December 31, 2014, in conformity with accounting principles generally accepted in the United States of America.
We have also audited, in accordance with the standards of the Public Company Accounting Oversight Board (United States), the Company’s internal control over financial reporting as of December 31, 2014, based on the criteria established in Internal Control-Integrated Framework (1992) issued by the Committee of Sponsoring Organizations of the Treadway Commission and our report dated March 6, 2015, expressed an unqualified opinion on the Company’s internal control over financial reporting.
/s/ Deloitte & Touche LLP
San Francisco, California
March 6, 2015
70
REPORT OF INDEPENDENT REGISTERED PUBLIC ACCOUNTING FIRM
To the Board of Directors and Stockholders of
Solazyme, Inc.
South San Francisco, California
We have audited the internal control over financial reporting of Solazyme, Inc. and subsidiaries (the “Company”) as of December 31, 2014, based on criteria established in Internal Control—Integrated Framework (1992) issued by the Committee of Sponsoring Organizations of the Treadway Commission. The Company’s management is responsible for maintaining effective internal control over financial reporting and for its assessment of the effectiveness of internal control over financial reporting, included in the accompanying Management’s Report on Internal Control Over Financial Reporting. Our responsibility is to express an opinion on the Company’s internal control over financial reporting based on our audit.
We conducted our audit in accordance with the standards of the Public Company Accounting Oversight Board (United States). Those standards require that we plan and perform the audit to obtain reasonable assurance about whether effective internal control over financial reporting was maintained, in all material respects. Our audit included obtaining an understanding of internal control over financial reporting, assessing the risk that a material weakness exists, testing and evaluating the design and operating effectiveness of internal control based on the assessed risk, and performing such other procedures as we considered necessary in the circumstances. We believe that our audit provides a reasonable basis for our opinion.
A company’s internal control over financial reporting is a process designed by, or under the supervision of, the company’s principal executive and principal financial officers, or persons performing similar functions, and effected by the company’s board of directors, management, and other personnel to provide reasonable assurance regarding the reliability of financial reporting and the preparation of financial statements for external purposes in accordance with generally accepted accounting principles. A company’s internal control over financial reporting includes those policies and procedures that (1) pertain to the maintenance of records that, in reasonable detail, accurately and fairly reflect the transactions and dispositions of the assets of the company; (2) provide reasonable assurance that transactions are recorded as necessary to permit preparation of financial statements in accordance with generally accepted accounting principles, and that receipts and expenditures of the company are being made only in accordance with authorizations of management and directors of the company; and (3) provide reasonable assurance regarding prevention or timely detection of unauthorized acquisition, use, or disposition of the company’s assets that could have a material effect on the financial statements.
Because of the inherent limitations of internal control over financial reporting, including the possibility of collusion or improper management override of controls, material misstatements due to error or fraud may not be prevented or detected on a timely basis. Also, projections of any evaluation of the effectiveness of the internal control over financial reporting to future periods are subject to the risk that the controls may become inadequate because of changes in conditions, or that the degree of compliance with the policies or procedures may deteriorate.
In our opinion, the Company maintained, in all material respects, effective internal control over financial reporting as of December 31, 2014, based on the criteria established in Internal Control—Integrated Framework (1992) issued by the Committee of Sponsoring Organizations of the Treadway Commission.
We have also audited, in accordance with the standards of the Public Company Accounting Oversight Board (United States), the consolidated financial statements as of and for the year ended December 31, 2014, of the Company and our report dated March 6, 2015, expressed an unqualified opinion on those consolidated financial statements.
/s/ Deloitte & Touche LLP
San Francisco, California
March 6, 2015
71
SOLAZYME, INC.
CONSOLIDATED BALANCE SHEETS
In thousands, except share and per share amounts
December 31, 2014 | December 31, 2013 | ||||||
ASSETS | |||||||
Current assets: | |||||||
Cash and cash equivalents | $ | 42,689 | $ | 54,977 | |||
Marketable securities | 164,619 | 112,544 | |||||
Accounts receivable, net—includes related party receivables of $0.4 million and $6.9 million as of December 31, 2014 and 2013, respectively | 4,598 | 10,452 | |||||
Unbilled revenues | 3,002 | 1,101 | |||||
Inventories | 15,334 | 9,836 | |||||
Prepaid expenses and other current assets | 3,685 | 2,907 | |||||
Total current assets | 233,927 | 191,817 | |||||
Property, plant and equipment, net | 36,080 | 40,089 | |||||
Investments in unconsolidated joint ventures | 40,934 | 22,532 | |||||
Other assets | 1,648 | 4,267 | |||||
Total assets | $ | 312,589 | $ | 258,705 | |||
LIABILITIES AND STOCKHOLDERS’ EQUITY | |||||||
Current liabilities: | |||||||
Accounts payable | $ | 8,319 | $ | 7,949 | |||
Accrued liabilities | 14,079 | 15,005 | |||||
Current portion of long-term debt | 6 | 65 | |||||
Deferred revenue | 1,050 | 2,275 | |||||
Total current liabilities | 23,454 | 25,294 | |||||
Deferred revenue | 150 | — | |||||
Warrant liability | — | 688 | |||||
Long-term debt | — | 10,374 | |||||
Convertible debt, inclusive of derivative liabilities of $83 and $5,914 at December 31, 2014 and 2013, respectively; and net of unamortized debt discounts of $11,124 and $4,610 as of December 31, 2014 and 2013, respectively. | 200,091 | 83,083 | |||||
Other liabilities | 2,518 | 318 | |||||
Total liabilities | 226,213 | 119,757 | |||||
Commitments and contingencies (Note 12) | |||||||
Stockholders’ equity: | |||||||
Preferred stock, par value $0.001—5,000,000 shares authorized at December 31, 2014 and 2013; 0 shares issued and outstanding at December 31, 2014 and 2013 | — | — | |||||
Common stock, par value $0.001—150,000,000 shares authorized at December 31, 2014 and 2013; 79,388,069 and 68,744,534 shares issued and outstanding at December 31, 2014 and 2013, respectively | 79 | 69 | |||||
Additional paid-in capital | 565,769 | 448,990 | |||||
Accumulated other comprehensive loss | (11,014 | ) | (3,794 | ) | |||
Accumulated deficit | (468,458 | ) | (306,317 | ) | |||
Total stockholders’ equity | 86,376 | 138,948 | |||||
Total liabilities and stockholders’ equity | $ | 312,589 | $ | 258,705 | |||
See accompanying notes to the consolidated financial statements.
72
SOLAZYME, INC.
CONSOLIDATED STATEMENTS OF OPERATIONS
In thousands, except share and per share amounts
Year Ended December 31, | |||||||||||
2014 | 2013 | 2012 | |||||||||
Revenues: | |||||||||||
Product revenues | $ | 37,346 | $ | 19,962 | $ | 16,459 | |||||
Research and development programs | 23,045 | 19,788 | 27,649 | ||||||||
Total revenues | 60,391 | 39,750 | 44,108 | ||||||||
Costs and operating expenses: | |||||||||||
Cost of product revenue | 20,612 | 6,385 | 5,311 | ||||||||
Research and development | 81,680 | 66,572 | 66,384 | ||||||||
Sales, general and administrative | 90,266 | 62,933 | 57,516 | ||||||||
Restructuring charges | 3,514 | — | — | ||||||||
Total costs and operating expenses | 196,072 | 135,890 | 129,211 | ||||||||
Loss from operations | (135,681 | ) | (96,140 | ) | (85,103 | ) | |||||
Other income (expense): | |||||||||||
Interest and other income, net | 1,310 | 1,369 | 2,072 | ||||||||
Interest expense | (13,477 | ) | (7,136 | ) | (561 | ) | |||||
Loss from equity method investments | (23,037 | ) | (8,237 | ) | (1,824 | ) | |||||
Gain from change in fair value of warrant liability | 688 | 147 | 2,284 | ||||||||
Gain (loss) from change in fair value of derivative liability | 8,056 | (6,392 | ) | — | |||||||
Total other income (expense) | (26,460 | ) | (20,249 | ) | 1,971 | ||||||
Net loss | $ | (162,141 | ) | $ | (116,389 | ) | $ | (83,132 | ) | ||
Net loss per share, basic and diluted | (2.14 | ) | (1.81 | ) | (1.37 | ) | |||||
Weighted average number of common shares used in loss per share computation, basic and diluted | 75,879,208 | 64,211,958 | 60,509,048 | ||||||||
See accompanying notes to the consolidated financial statements.
73
SOLAZYME, INC.
CONSOLIDATED STATEMENTS OF COMPREHENSIVE LOSS
In thousands
Year Ended December 31, | |||||||||||
2014 | 2013 | 2012 | |||||||||
Net loss | $ | (162,141 | ) | $ | (116,389 | ) | $ | (83,132 | ) | ||
Other comprehensive income (loss), net: | |||||||||||
Change in unrealized gain/loss on available-for-sale securities | (312 | ) | (240 | ) | 642 | ||||||
Foreign currency translation adjustment | (6,908 | ) | (3,155 | ) | (252 | ) | |||||
Other comprehensive income (loss) | (7,220 | ) | (3,395 | ) | 390 | ||||||
Total comprehensive loss | $ | (169,361 | ) | $ | (119,784 | ) | $ | (82,742 | ) | ||
See accompanying notes to the consolidated financial statements.
74
SOLAZYME, INC.
CONSOLIDATED STATEMENTS OF STOCKHOLDERS’ EQUITY
In thousands, except share and per share amounts
Common Stock | Additional Paid-In Capital | Accumulated Other Comprehensive Loss | Accumulated Deficit | Total Stockholders’ Equity | ||||||||||||||||||
Shares | Amount | |||||||||||||||||||||
December 31, 2011 | 59,908,138 | $ | 60 | $ | 348,083 | $ | (789 | ) | $ | (106,796 | ) | $ | 240,558 | |||||||||
Issuance of common stock to nonemployee for services rendered | 20,000 | 221 | 221 | |||||||||||||||||||
Issuance of common stock upon exercise of stock options | 846,608 | 1 | 1,736 | 1,737 | ||||||||||||||||||
Issuance of common stock pursuant to ESPP | 115,980 | 1,161 | 1,161 | |||||||||||||||||||
Common stock issued pursuant to vesting of restricted stock units | 64,998 | 1,561 | 1,561 | |||||||||||||||||||
Common stock issued pursuant to vesting of performance stock units | 45,000 | — | ||||||||||||||||||||
Stock-based compensation expense related to employees | 11,629 | 11,629 | ||||||||||||||||||||
Stock-based compensation expense related to nonemployees | 1,944 | 1,944 | ||||||||||||||||||||
Vesting of warrant shares issued for investment in unconsolidated joint venture | 2,656 | 2,656 | ||||||||||||||||||||
Reclassification of warrant liability to additional paid-in capital upon vesting of warrant shares issued for investment in unconsolidated joint venture | 4,586 | 4,586 | ||||||||||||||||||||
Change in unrealized loss on available-for-sale securities | 642 | 642 | ||||||||||||||||||||
Foreign currency translation adjustment | (252 | ) | (252 | ) | ||||||||||||||||||
Net loss | (83,132 | ) | (83,132 | ) | ||||||||||||||||||
December 31, 2012 | 61,000,724 | $ | 61 | $ | 373,577 | $ | (399 | ) | $ | (189,928 | ) | $ | 183,311 | |||||||||
See accompanying notes to the consolidated financial statements.
75
SOLAZYME, INC.
CONSOLIDATED STATEMENTS OF STOCKHOLDERS’ EQUITY—(Continued)
In thousands, except share and per share amounts
Common Stock | Additional Paid-In Capital | Accumulated Other Comprehensive Loss | Accumulated Deficit | Total Stockholders’ Equity | ||||||||||||||||||
Shares | Amount | |||||||||||||||||||||
December 31, 2012 | 61,000,724 | $ | 61 | $ | 373,577 | $ | (399 | ) | $ | (189,928 | ) | $ | 183,311 | |||||||||
Issuance of common stock to nonemployee for services rendered | 23,167 | 260 | 260 | |||||||||||||||||||
Issuance of common stock to consultant for services rendered | 39,578 | 452 | 452 | |||||||||||||||||||
Issuance of common stock upon exercise of stock options | 1,135,207 | 1 | 3,713 | 3,714 | ||||||||||||||||||
Issuance of common stock pursuant to ESPP | 134,497 | 1,039 | 1,039 | |||||||||||||||||||
Common stock issued pursuant to vesting of restricted stock and restricted stock units | 68,835 | 5,209 | 5,209 | |||||||||||||||||||
Common stock issued pursuant to vesting of performance stock units | 15,000 | — | ||||||||||||||||||||
Common stock issued in lieu of cash bonus | 15,168 | 121 | 121 | |||||||||||||||||||
Stock-based compensation expense related to employees | 12,087 | 12,087 | ||||||||||||||||||||
Stock-based compensation expense related to nonemployees | 1,097 | 1,097 | ||||||||||||||||||||
Common stock issued upon early conversion of Senior Convertible Notes | 5,541,597 | 6 | 44,212 | 44,218 | ||||||||||||||||||
Common stock issued in connection with use and operation of the Clinton Facility | 770,761 | 1 | 7,125 | 7,126 | ||||||||||||||||||
Vesting of warrant shares issued in connection with use and operation of the Clinton Facility | 98 | 98 | ||||||||||||||||||||
Change in unrealized loss on available-for-sale securities | (240 | ) | (240 | ) | ||||||||||||||||||
Foreign currency translation adjustment | (3,155 | ) | (3,155 | ) | ||||||||||||||||||
Net loss | (116,389 | ) | (116,389 | ) | ||||||||||||||||||
December 31, 2013 | 68,744,534 | $ | 69 | $ | 448,990 | $ | (3,794 | ) | $ | (306,317 | ) | $ | 138,948 | |||||||||
See accompanying notes to the consolidated financial statements.
76
SOLAZYME, INC.
CONSOLIDATED STATEMENTS OF STOCKHOLDERS’ EQUITY—(Continued)
In thousands, except share and per share amounts
Common Stock | Additional Paid-In Capital | Accumulated Other Comprehensive Loss | Accumulated Deficit | Total Stockholders’ Equity | ||||||||||||||||||
Shares | Amount | |||||||||||||||||||||
December 31, 2013 | 68,744,534 | $ | 69 | $ | 448,990 | $ | (3,794 | ) | $ | (306,317 | ) | $ | 138,948 | |||||||||
Issuance of common stock to nonemployee for services rendered | 33,541 | 344 | 344 | |||||||||||||||||||
Issuance of common stock upon exercise of stock options | 1,149,346 | 1 | 7,507 | 7,508 | ||||||||||||||||||
Issuance of common stock pursuant to ESPP | 184,188 | 1,441 | 1,441 | |||||||||||||||||||
Issuance of common stock pursuant to secondary offering | 5,750,000 | 6 | 59,203 | 59,209 | ||||||||||||||||||
Common stock issued pursuant to vesting of restricted stock and restricted stock units | 782,985 | 1 | 8,585 | 8,586 | ||||||||||||||||||
Restricted stock units withheld for taxes | (68 | ) | (68 | ) | ||||||||||||||||||
Stock-based compensation expense related to employees | 15,295 | 15,295 | ||||||||||||||||||||
Stock-based compensation expense related to nonemployees | 1,324 | 1,324 | ||||||||||||||||||||
Common stock issued upon early conversion of Senior Convertible Notes (see Note 11) | 2,743,475 | 2 | 22,592 | 22,594 | ||||||||||||||||||
Vesting of warrant shares issued in connection with use and operation of the Clinton Facility (see Note 10) | 556 | 556 | ||||||||||||||||||||
Change in unrealized loss on available-for-sale securities | (312 | ) | (312 | ) | ||||||||||||||||||
Foreign currency translation adjustment | (6,908 | ) | (6,908 | ) | ||||||||||||||||||
Net loss | (162,141 | ) | (162,141 | ) | ||||||||||||||||||
December 31, 2014 | 79,388,069 | $ | 79 | $ | 565,769 | $ | (11,014 | ) | $ | (468,458 | ) | $ | 86,376 | |||||||||
See accompanying notes to the consolidated financial statements.
77
SOLAZYME, INC.
CONSOLIDATED STATEMENTS OF CASH FLOWS
In thousands
Year Ended December 31, | |||||||||||
2014 | 2013 | 2012 | |||||||||
Operating activities: | |||||||||||
Net loss | $ | (162,141 | ) | $ | (116,389 | ) | $ | (83,132 | ) | ||
Adjustments to reconcile net loss to net cash used in operating activities: | |||||||||||
Depreciation and amortization | 6,283 | 5,108 | 3,519 | ||||||||
Gain on sale of available for sale securities | (7 | ) | — | — | |||||||
Net amortization of premiums on marketable securities | 1,588 | 1,685 | 2,494 | ||||||||
Amortization of debt discount | 1,973 | 1,179 | 144 | ||||||||
Amortization of loan fees | 233 | 350 | — | ||||||||
Issuance of common stock in connection with professional services rendered | — | 452 | — | ||||||||
Warrant expense related to vesting of ADM Warrant (see Note 10) | 556 | 98 | — | ||||||||
Debt conversion expense | 1,766 | — | — | ||||||||
Restructuring charges | 2,900 | — | — | ||||||||
Stock-based compensation expense | 25,549 | 18,653 | 15,356 | ||||||||
Loss from equity method investments | 23,432 | 8,237 | 1,824 | ||||||||
Revaluation of warrant liability | (688 | ) | (147 | ) | (2,284 | ) | |||||
Revaluation of derivative liabilities | (8,056 | ) | 6,392 | — | |||||||
Changes in operating assets and liabilities: | |||||||||||
Accounts receivable | (9,441 | ) | (7,268 | ) | 749 | ||||||
Unbilled revenue | (1,901 | ) | 2,045 | 739 | |||||||
Inventories | (5,497 | ) | (2,946 | ) | (3,762 | ) | |||||
Prepaid expenses and other current assets | (842 | ) | (764 | ) | 611 | ||||||
Other assets | 3,582 | 3,262 | 2 | ||||||||
Accounts payable | 3,575 | (2,563 | ) | (1,396 | ) | ||||||
Accrued liabilities | (2,107 | ) | 5,955 | 9 | |||||||
Deferred revenue | (1,075 | ) | 1,983 | (2,722 | ) | ||||||
Other current and long-term liabilities | 2,205 | (112 | ) | 278 | |||||||
Net cash used in operating activities | (118,113 | ) | (74,790 | ) | (67,571 | ) | |||||
Investing activities: | |||||||||||
Purchases of property, plant and equipment | (7,208 | ) | (10,217 | ) | (12,554 | ) | |||||
Purchases of marketable securities | (195,987 | ) | (133,601 | ) | (64,908 | ) | |||||
Maturities of marketable securities | 135,464 | 126,073 | 130,682 | ||||||||
Proceeds from sales of marketable securities | 6,541 | 10,890 | 29,014 | ||||||||
Capital contributions in unconsolidated joint ventures | (32,550 | ) | (12,431 | ) | (10,000 | ) | |||||
Capitalized interest related to unconsolidated joint venture | (620 | ) | (1,055 | ) | — | ||||||
Restricted certificates of deposit | (731 | ) | — | — | |||||||
Net cash (used in) provided by investing activities | (95,091 | ) | (20,341 | ) | 72,234 | ||||||
Financing activities: | |||||||||||
Repayments under loan agreements | (10,433 | ) | (14,917 | ) | (5,408 | ) | |||||
Proceeds from the issuance of senior subordinated convertible notes, net of discount | 143,894 | 119,750 | — | ||||||||
Proceeds from the issuance of common stock, net of repurchases | 7,508 | 3,714 | 1,737 | ||||||||
Proceeds from issuance of common stock, pursuant to ESPP | 1,441 | 1,039 | 1,161 | ||||||||
Early exercise of stock options subject to repurchase | (4 | ) | (35 | ) | (60 | ) | |||||
Proceeds from borrowings under loan agreements | — | 10,369 | — | ||||||||
Payment for loan costs and fees | (465 | ) | (541 | ) | — | ||||||
Proceeds from issuance of common stock in a public offering, net of underwriting discounts and commission | 59,209 | — | — | ||||||||
Cash settlement of vested restricted stock units | (68 | ) | — | — | |||||||
Net cash provided by (used in) financing activities | 201,082 | 119,379 | (2,570 | ) | |||||||
Effect of exchange rate changes on cash and cash equivalents | (166 | ) | (89 | ) | (55 | ) | |||||
Net (decrease) increase of cash and cash equivalents | (12,288 | ) | 24,159 | 2,038 | |||||||
Cash and cash equivalents—beginning of period | 54,977 | 30,818 | 28,780 | ||||||||
Cash and cash equivalents—end of period | $ | 42,689 | $ | 54,977 | $ | 30,818 | |||||
Supplemental disclosures of cash flow information: | |||||||||||
Interest paid in cash, net of capitalized interest | $ | 7,558 | $ | 3,499 | $ | 409 | |||||
Income taxes paid in cash | $ | — | $ | — | $ | — | |||||
Supplemental disclosure of noncash investing and financing activities: | |||||||||||
Capital assets in accounts payable and accrued liabilities | $ | 154 | $ | 3,413 | $ | 421 | |||||
Debt issue costs in accounts payable and accrued liabilities | $ | — | $ | — | $ | 148 | |||||
Change in unrealized gain (loss) on marketable securities | $ | (312 | ) | $ | (240 | ) | $ | 642 | |||
Foreign currency translation adjustment related to unconsolidated joint venture | $ | (6,635 | ) | $ | (2,478 | ) | $ | — | |||
Reclassification of warrant liability to additional paid-in capital | $ | — | $ | — | $ | 4,586 | |||||
Warrant issued for investment in unconsolidated joint venture | $ | — | $ | — | $ | 10,361 | |||||
Capital contribution to unconsolidated joint venture settled with reduction of receivable from unconsolidated joint venture | $ | 15,300 | $ | — | $ | 511 | |||||
Common stock issued in lieu of cash bonus | $ | — | $ | 121 | $ | — | |||||
Common stock issued in connection with use and operation of the Clinton Facility (see Note 10) | $ | — | $ | 7,125 | $ | — | |||||
Conversion of Senior Convertible Notes to common stock | $ | 2,461 | $ | 40,616 | $ | — | |||||
Early conversion payment on Senior Convertible Notes settled in common stock | $ | 217 | $ | 3,602 | $ | — | |||||
Conversion of Senior Convertible Notes pursuant to inducement settled in common stock | $ | 18,125 | $ | — | $ | — | |||||
See accompanying notes to the consolidated financial statements.
78
NOTES TO THE CONSOLIDATED FINANCIAL STATEMENTS
1. THE COMPANY
Solazyme, Inc. (the “Company”) was incorporated in the State of Delaware on March 31, 2003. The Company’s proprietary technology uses highly optimized microalgae in an industrial fermentation process to transform a range of abundant plant-based sugars into high-value triglyceride oils and other bioproducts. The Company’s renewable products can replace or enhance products derived from the world’s three existing oil sources: petroleum, plants, and animal fats. The Company has the ability to tailor the composition of its oils and other bioproducts to address specific customer requirements, offering superior performance characteristics and value via a renewable pathway. The Company has pioneered an industrial biotechnology platform that harnesses the oil-producing characteristics of microalgae. The Company uses standard industrial fermentation equipment to convert sugars into the desired end product. Fermentation helps accelerate microalgae’s natural biological process, allowing the Company to produce large amounts of a desired product in a matter of days. By feeding plant-based sugars to the Company’s proprietary oil-producing microalgae in enclosed fermentation tanks, the Company is in effect utilizing “indirect photosynthesis.” The Company’s technology platform is feedstock flexible and can utilize a wide variety of renewable plant-based sugars. The Company currently uses sugarcane-based sucrose and corn-based dextrose as its two primary feedstock sources. The Company's technology can also support sugar from other sustainable biomass sources including cellulosics, which the Company believes will represent an important alternative feedstock in the future. Beyond triglyceride oils and other bioproducts, the Company’s technology platform allows it to also produce and sell specialty algal meal products for a range of product applications that utilize the protein, fiber and other compounds found in the cell wall and algal body of the microalgae. In January 2014, the Company commenced commercial operations at both Archer Daniels Midland Company's ("ADM") Clinton, Iowa facility, and the downstream companion facility operated by American Natural Processors, Inc. ("ANP") in Galva, Iowa ("Clinton/Galva Facilities"). In May 2014, the Company's joint venture with Bunge Global Innovation, LLC (together with its affiliates, "Bunge") produced its first products at the Solazyme Bunge Renewable Oils plant in Brazil ("Solazyme Bunge JV Plant"), and manufacturing operations and processes continue to be optimized as the Solazyme Bunge JV Plant is ramped up.
The industry in which the Company is involved is highly competitive and is characterized by the risks of changing technologies, market conditions, and regulatory requirements. Penetration into markets requires investment of considerable resources and continuous development efforts. The Company’s future success depends upon several factors, including the technological quality, price, and performance of its products and services relative to those of its competitors, scaling up of production for commercial sale, ability to secure adequate project financing at appropriate terms, and the nature of regulation in its target markets.
2. SUMMARY OF SIGNIFICANT ACCOUNTING POLICIES AND RECENT ACCOUNTING PRONOUNCEMENTS
Basis of Presentation—The accompanying consolidated financial statements have been prepared in accordance with accounting principles generally accepted in the United States of America (“GAAP”) and include all adjustments necessary for the fair presentation of the Company’s consolidated financial position, results of operations and cash flows for the periods presented. The consolidated financial statements include the accounts of the Company and its wholly-owned subsidiaries, Solazyme Brazil Renewable Oils and Bioproducts Limitada (“Solazyme Brazil”), the operations of which began in the first quarter of 2011, and Solazyme Manufacturing 1, L.L.C, which was formed in the second quarter of 2011 to own the commercial production facility assets located in Peoria, Illinois ("Peoria Facility") assets and related promissory note in the second quarter of 2011. All intercompany accounts and transactions have been eliminated in consolidation.
The Company has an interest in an active joint venture entity that is a variable interest entity (“VIE”). Determining whether to consolidate a VIE in accordance with Financial Accounting Standards Board (“FASB”) Accounting Standards Codification (“ASC”) 810, Consolidation, requires judgment in assessing (i) whether an entity is a VIE entity and (ii) if the Company is the entity’s primary beneficiary and thus required to consolidate the entity. To determine if the Company is the primary beneficiary of a VIE, the Company evaluates whether it has (i) the power to direct the activities that most significantly impact the VIE’s economic performance and (ii) the obligation to absorb losses or the right to receive benefits of the VIE that could potentially be significant to the VIE.
On November 3, 2010, the Company entered into a joint venture with Roquette Frères, S.A. (“Roquette”), and formed Solazyme Roquette Nutritionals, LLC (“SRN”), which was 50% owned by the Company and 50% owned by Roquette. The Company determined that this joint venture was a VIE and the Company was not required to consolidate its 50% ownership in this joint venture. Therefore, this joint venture was accounted for under the equity method of accounting. In June 2013, the Company and Roquette agreed to dissolve SRN and on July 18, 2013, SRN was dissolved (see Note 8).
79
On April 2, 2012, the Company entered into a joint venture agreement ("Joint Venture Agreement") with Bunge. In connection with the Company’s joint venture with Bunge (“Solazyme Bunge JV”), Solazyme Bunge Produtos Renováveis Ltda. was formed, which is a VIE and is 50.1% owned by the Company and 49.9% owned by Bunge. The Company determined that it was not required to consolidate the 50.1% ownership in this joint venture and, therefore, accounts for this joint venture under the equity method of accounting (see Note 8).
Use of Estimates—Financial statements prepared in conformity with GAAP require management to make estimates and assumptions that affect the reported amounts of assets and liabilities, the disclosure of contingent assets and liabilities as of the date of the financial statements and the reported amounts of revenues and expenses during the reporting period. Actual results could differ materially from those estimates.
Significant Risks and Uncertainties—The Company’s failure to generate sufficient revenues, achieve planned gross margins, control operating costs or raise sufficient additional funds may require it to modify, delay or abandon the Company’s planned operations, which could have a material adverse effect on the business, operating results, financial condition and ability to achieve intended business objectives. The Company may be required to seek additional funds through collaborations, public or private debt or equity financings or government programs, and may also seek to reduce expenses related to the Company’s operations. There can be no assurance that any financing will be available or on terms acceptable to management.
Foreign Currency Translation—The assets and liabilities of the Company’s foreign subsidiary, Solazyme Brazil, and the Solazyme Bunge JV, where the local currency is the functional currency, are translated from their respective functional currency into U.S. dollars at the exchange rate in effect at the balance sheet date, with resulting foreign currency translation adjustments recorded in accumulated other comprehensive income (loss) in the consolidated statements of comprehensive loss. The Company also adjusts its investment in the Solazyme Bunge JV and cumulative translation adjustment in equity for its ownership portion of the cumulative translation gain or loss recognized on the Solazyme Bunge JV's financial statements. Revenues and expense amounts are translated at average rates during the period.
Cash Equivalents—All highly liquid investments with original or remaining maturities of three months or less at the time of purchase are classified as cash equivalents. Cash equivalents primarily consist of money market funds, commercial paper and U.S. treasury notes.
Marketable Securities—Investments with original maturities greater than three months at the time of purchase and maturing less than one year from the consolidated balance sheet date are classified as marketable securities. The Company classifies marketable securities as short-term based upon whether such assets are reasonably expected to be used in current operations. The Company invests its excess cash balances primarily in corporate bonds, United States Government and Agency securities, asset-backed securities, mortgage-backed securities, commercial paper, municipal bonds, certificates of deposit and floating rate notes. The Company classifies its marketable securities as available-for-sale, and records them at estimated fair value in the consolidated balance sheets, with unrealized gains and losses, if any, reported as a component of accumulated other comprehensive income (loss) in the consolidated statements of comprehensive loss. Marketable securities classified as available-for-sale are adjusted for amortization of premiums and accretion of discounts and such amortization and accretion are reported as components of interest and other income. Realized gains and losses and declines in value that are considered to be other-than-temporary are recognized in interest and other income. The cost of all securities sold is based on the specific identification method.
Restricted Certificates of Deposit—The Company maintained certificates of deposits classified in other long-term assets of $1.0 million and $0.3 million as of December 31, 2014 and 2013, respectively. These certificates of deposits were required to be pledged as collateral related to the Company’s facility lease in South San Francisco.
Deferred Financing Costs—To the extent that the Company is required to pay issuance fees or direct costs relating to its credit facilities, such fees are deferred and amortized to interest expense over the contractual or expected term of the related debt using the effective interest method. The Company classifies deferred financing costs in other long-term assets, consistent with the long-term classification of the related debt outstanding at the end of the reporting period.
Debt Discounts—Debt discounts incurred with the issuance of the Company’s debt are recorded in the consolidated balance sheets as a reduction to associated debt balances. The Company amortizes debt discount to interest expense over the contractual or expected term of the debt using the effective interest method.
Accounts Receivable—Accounts receivable represents amounts owed to the Company under its government programs, collaborative research and development agreements, agreements with related parties, and for product revenues. The Company had no amounts reserved for doubtful accounts as of December 31, 2014 and 2013, as the Company expected full collection of
80
its accounts receivable balances. The Company’s customer payment terms related to sales to distributors of Algenist® products are thirty to ninety days from invoice date or thirty or forty-five days from the end of the month in which a customer is invoiced. Certain customer invoices are denominated in Euros and British Pounds. Online sales of Algenist® to consumers are generally due at the time of purchase. The Company reserves for estimated product returns as reductions of accounts receivable and product revenues. As of December 31, 2014 and 2013, the reserve for product returns was $1.6 million and $1.1 million, respectively. The Company monitors actual return history and reassesses its return reserve as return experience develops.
Unbilled Revenues—Unbilled revenues represent fees earned but not yet billed under certain research and development programs including agreements with related parties.
Fair Value of Financial Instruments—The Company measures certain financial assets and liabilities at fair value based on the exchange price that would be received for an asset or paid to transfer a liability (an exit price) in the principal or most advantageous market for the asset or liability in an orderly transaction between market participants. Where available, fair value is based on, or derived from, observable market prices or other observable inputs. Where observable prices or inputs are not available, valuation models are applied. These valuation techniques involve some level of management estimation and judgment, the degree of which is dependent on the price transparency for the instruments or market and the instruments’ complexity. While the Company believes that its valuation methods are appropriate and consistent with other market participants, it recognizes that the use of different methodologies or assumptions to determine the fair value of certain financial instruments could result in a different estimate of fair value at the reporting date.
The carrying amount of certain of the Company’s financial instruments, including cash and cash equivalents, restricted certificates of deposit, accounts receivable, unbilled revenues, prepaid expenses, accounts payable and accrued liabilities, approximates fair value due to their relatively short maturities. The fair value of the Company’s debt obligations, warrant liability and derivative financial instruments were determined using unobservable inputs (Level 3 inputs), as defined in FASB ASC 820, Fair Value Measurement (see Note 5).
Derivative Financial Instruments—FASB ASC 815, Derivatives and Hedging ("ASC 815"), establishes accounting and reporting standards for derivative instruments. The accounting standards require companies to bifurcate conversion options from their host instruments and account for them as free standing derivative financial instruments according to certain criteria. The fair value of the derivative is remeasured to fair value at each balance sheet date, with a resulting non-cash gain or loss related to the change in the fair value of the derivative being charged to earnings (loss). The Company has determined that it must bifurcate and account for the early conversion payment features in its 6.00% convertible senior subordinated notes due 2018 (“2018 Notes”) and its 5.00% convertible senior subordinated notes due 2019 ("2019 Notes" and, collectively with the 2018 Notes, the "Notes") as embedded derivatives in accordance with ASC 815 (see Note 5 and Note 11). The Company recorded these embedded derivative liabilities as non-current liabilities on its consolidated balance sheets with a corresponding debt discount at the date of issuance that is netted against the principal amount of the Notes. The Company estimates the fair value of these liabilities using a Monte Carlo simulation model.
Concentration of Credit Risk—Financial instruments that potentially subject the Company to a concentration of credit risk consist of cash and cash equivalents, marketable securities, accounts receivables and restricted certificates of deposit. The Company places its cash equivalents and investments with high credit quality financial institutions and, by policy, limits the amounts invested with any one financial institution or issuer. Deposits held with banks may exceed the amount of insurance provided on such deposits. The Company has not experienced any losses on its deposits of cash and cash equivalents.
Credit risk with respect to accounts receivable exists to the full extent of amounts presented in the consolidated financial statements. The Company estimates an allowance for doubtful accounts, if any, through specific identification of potentially uncollectible accounts receivable based on an analysis of its accounts receivable aging. Uncollectible accounts receivable are written off against the allowance for doubtful accounts when all efforts to collect them have been exhausted. Recoveries are recognized when they are received. Actual collection losses may differ from the Company’s estimates and could be material to the consolidated balance sheet, statements of operations and cash flows. The Company had 12 customers accounting for 95% of the receivable balance as of December 31, 2014. The Company had 8 customers accounting for 93% of the receivable balance as of December 31, 2013. The Company does not believe the accounts receivable from these customers represent a significant credit risk based on past collection experiences and the general creditworthiness of these customers. As of December 31, 2014, approximately $3.2 million of the Company’s gross accounts receivable balance related to product sales, $0.4 million related to services provided to the Solazyme Bunge JV (see Note 8) and approximately $1.0 million related to research and development arrangements. In 2014, three partners accounted for 27%, 16% and 13% of total net revenues. In 2013, four partners accounted for 22%, 21%, 20% and 15% of total net revenues. In 2012, four partners accounted for 21%, 18%, 16% and 11% of total net revenues.
81
Inventories—Inventories are stated at the lower of cost or market. Cost is determined using the first-in, first-out basis. Inventory cost consists of third-party contractor costs associated with packaging, distribution and production of products, supplies, shipping costs and other overhead costs associated with manufacturing. If inventory costs exceed expected market value due to obsolescence or lack of demand, inventory write-downs may be recorded as deemed necessary by management for the difference between the cost and the market value in the period that impairment is first recognized. Beginning in 2014, inventories also include manufacturing and third-party contract costs associated with the production of the Company's intermediate/ingredient products that met applicable regulatory requirements. Prior to products' meeting any applicable regulatory requirements, and during scale-up of the manufacturing process to nameplate capacity, a portion of the manufacturing and associated production costs are charged to research and development expenses.
Property, Plant and Equipment—Property, plant and equipment are recorded at cost, less accumulated depreciation. Depreciation is calculated on a straight-line basis over the following estimated ranges of useful lives:
Asset classification | Estimated useful life | |
Plant equipment | 5 – 20 years | |
Lab equipment | 3 – 7 years | |
Leasehold improvements | Shorter of useful life or life of lease | |
Building and improvements | 7 – 20 years | |
Computer equipment and software | 3 – 7 years | |
Furniture and fixtures | 5 – 7 years | |
Automobiles | 5 years | |
Long-Lived Assets—The Company periodically reviews long-lived assets, including property, plant and equipment, for impairment whenever events or changes in business circumstances indicate that the carrying amount of an asset is impaired or the estimated useful lives are no longer appropriate. If indicators of impairment exist and the undiscounted projected cash flows associated with such assets are less than the carrying amount of the asset, an impairment loss is recorded to write the asset down to its estimated fair value. Fair value is estimated based on discounted future cash flows. See Note 3 for information on impairment charge recognized in 2014. There were no asset impairment charges incurred for the years ended December 31, 2013 and 2012.
Warrant Liability—In May 2011, the Company granted to Bunge Limited a warrant to purchase 1,000,000 shares of its common stock at an exercise price of $13.50 per share (see Note 8). The warrant vests in three separate tranches, based upon Bunge Limited achieving three specific performance milestones. The first tranche of shares vested on the measurement date, April 2, 2012, and was recorded as an investment in the unconsolidated joint venture and additional paid-in capital, based on the fair value of the first tranche of warrants that vested upon the measurement date. The remaining unvested second and third tranches of the warrant (on the measurement date) were classified as a liability on the consolidated balance sheet at fair value on the measurement date, due to performance-based vesting terms. The initial liability for the second vesting tranche was adjusted for changes in fair value until the performance-based milestones were met and the tranche vested on June 20, 2012, at which time the fair value of the second vested tranche was reclassified to additional paid-in-capital. As of December 31, 2014, the Company had no warrant liability associated with the warrant, as the third tranche could no longer vest.
Segment Reporting—Operating segments are defined in FASB ASC 280, Segment Reporting, are components of an enterprise that engage in business activities from which it may earn revenues and incur expenses for which separate financial information is available that is evaluated regularly by the chief operating decision maker in deciding how to allocate resources and in assessing performance. The chief operating decision maker is the Chief Executive Officer of the Company.
The Company derives revenue from two principal activities: commercial product sales and collaborative research and development programs with strategic and government entities. The Company’s commercial product sales are focused on high-value oils, encapsulated oils and whole algal powdered products to companies that use them as intermediates and ingredients. The Company launched its first commercial product in the first quarter of 2011 with sales of a consumer-focused branded personal skin care line of products, Algenist®, formulated with the Company’s proprietary ingredients, Alguronic Acid® and Microalgae Oil. Product revenues through the end of 2013 were primarily from sale of the Company’s consumer-focused branded personal skin care line of products, Algenist®, sold into the Personal Care market. The Company began commercializing intermediates/ingredients products more broadly into the Industrial and Food Products markets in the first quarter of 2014. The intermediates/ingredients products include our Encapso™ product and TailoredTM oils.
82
The Company has two operating segments for financial statement reporting purposes: Algenist® and Intermediates/Ingredients & Other. In the fourth quarter of 2014 the Company implemented certain restructuring activities (see Note 4) which re-aligned its focus and changed the information reviewed by the chief operating decision maker. The change in operating segments for financial reporting purposes that occurred in the fourth quarter of 2014 has been retrospectively applied to the prior year disclosures below. The Company’s chief operating decision maker reviews and monitors gross margin by segment, however, the Company does not allocate its operating expenses between its different segments and its collaborative research and development programs, and therefore the chief operating decision maker does not evaluate financial performance beyond product gross margin.
The following table shows gross margin for the Company's operating segments for the years ended December 31, 2014, 2013 and 2012, reconciled to the Company’s total product revenue and cost of product revenue as shown in its consolidated statements of income (in thousands):
Year ended December 31, 2014 | Algenist® | Intermediates/ Ingredients & Other | Total | ||||||||
Product revenue | $ | 24,429 | $ | 12,917 | $ | 37,346 | |||||
Cost of product revenue | 7,746 | 12,866 | 20,612 | ||||||||
Segment gross margin | $ | 16,683 | $ | 51 | $ | 16,734 | |||||
Year ended December 31, 2013 | |||||||||||
Product revenue | $ | 19,856 | $ | 106 | $ | 19,962 | |||||
Cost of product revenue | 6,338 | 47 | 6,385 | ||||||||
Segment gross margin | $ | 13,518 | $ | 59 | $ | 13,577 | |||||
Year ended December 31, 2012 | |||||||||||
Product revenue | $ | 16,459 | $ | — | $ | 16,459 | |||||
Cost of product revenue | 5,311 | — | 5,311 | ||||||||
Segment gross margin | $ | 11,148 | $ | — | $ | 11,148 | |||||
A reconciliation of total segment gross margin to operating loss is as follows:
Year ended December 31, | |||||||||||
2014 | 2013 | 2012 | |||||||||
Gross margin | $ | 16,734 | $ | 13,577 | $ | 11,148 | |||||
Research and development programs revenue | 23,045 | 19,788 | 27,649 | ||||||||
Research and development expense | 81,680 | 66,572 | 66,384 | ||||||||
Sales, general and administrative expense | 90,266 | 62,933 | 57,516 | ||||||||
Restructuring charges | 3,514 | — | — | ||||||||
Loss from operations | $ | (135,681 | ) | $ | (96,140 | ) | $ | (85,103 | ) | ||
The Company does not allocate its assets to its operating segments.
Geographic Data
Geographic revenues are identified by the location in which the research and development program revenue and product sales were originated. Total revenues of $56.3 million, $38.1 million, and $44.1 million for the years ended December 31, 2014, 2013 and 2012, respectively, originated in the United States. Total revenues of $4.1 million, $1.7 million and $0 for the years ended December 31, 2014, 2013 and 2012, respectively, originated in Brazil. Long-lived assets, net of accumulated depreciation, located in the United States were $35.3 million and $38.6 million as of December 31, 2014 and 2013, respectively. Long-lived assets, net of accumulated depreciation, located in Brazil were $0.8 million and $1.5 million as of December 31, 2014 and 2013, respectively.
Revenue Recognition—Revenues are recognized when the following criteria are met: (1) persuasive evidence of an arrangement exists; (2)transfer of title has been completed or services have been rendered; (3)the fee is fixed or determinable; and (4) collectability is reasonably assured. The Company’s primary sources of revenues are revenues from research and development programs and product sales. If sales arrangements contain multiple elements, the Company evaluates whether the
83
components of each arrangement represent separate units of accounting. To date, the Company has determined that all revenue arrangements should be accounted for as a single unit of accounting.
Research and development programs consist of the following:
• | Government Programs—Revenues from research and development programs with governmental entities generally provide cost reimbursement for certain types of expenditures in return for research and development activities over a contractually defined period. Revenues from government programs are recognized in the period during which the related costs are incurred, provided that the conditions under which the government program activities were provided have been met and only perfunctory obligations are outstanding. |
• | Collaborative Research and Development—Collaborative research and development programs with commercial and strategic partners typically provide the Company with multiple revenue streams, which may include up-front non-refundable fees for licensing and reimbursement for research and development activities; cost reimbursement fees may include reimbursement for full-time employee equivalents (“FTE”), contingent milestone payments upon achievement of contractual criteria, licensing fees and commercialization royalty fees. Such revenues are recognized as the services are performed over a performance period, as specified in the respective agreements with the non-governmental entities. To date, payments received are not refundable. The research and development period is estimated at the inception of each agreement and is periodically evaluated. Reevaluation of the research and development period may shorten or lengthen the period during which the deferred revenue is recognized. To date, upfront payments received upon execution of such agreements, including license fees, have been recorded as deferred revenue upon receipt and have not been considered a separate unit of accounting. When up-front payments are combined with funded research services in a single unit of accounting, the Company recognizes the up-front payments using the proportional performance method of revenue recognition based upon the actual amount of research and development labor hours and research expenses incurred relative to the amount of the total expected labor hours and research expenses estimated to be incurred, but not greater than the amount of the research and development program fee as specified under such agreements. The Company is required to make estimates of total labor hours and research and development expenses required to perform the Company’s obligations under each research and development program; the Company evaluates the appropriate period based on research progress attained and reevaluates the period when significant changes occur. Where arrangements include milestones that are determined to be substantive and at risk at the inception of the arrangement, revenues are recognized upon achievement of the milestone and are limited to those amounts for which collectability is reasonably assured. If these conditions are not met, the milestone payments are deferred and recognized as revenue over the estimated period of performance under the contract as completion of performance obligations occur. |
Product Revenue—Product revenue is recognized from the sale of the Company's personal care products, which currently includes its Algenist® skin care line, and, beginning in 2014, from the sale of the Company's intermediate/ingredient products including its Tailored™ oil products and blended fuel sales, the latter of which is part of the Company's fuels marketing and development programs. Algenist® products are sold with a right of return for expired, discontinued, damaged or non-compliant products. Algenist® products have an approximate three-year shelf life from their manufacture date. The Company gives credit for returns, either by issuing a credit memo at the time of product return or, in certain cases, by allowing a customer to decrease the amount of subsequent payments for the amount of the return. The Company reserves for estimated returns of products at the time revenues are recognized. To estimate the return reserve, the Company analyzes its own actual product return data, and also uses other known factors, such as its customers’ return policies to their end consumers, which is typically thirty to ninety days. The Company monitors its actual performance to estimated rates, and adjusts the estimated return rates as necessary. In addition, the Company estimates a reserve for products that do not meet internal quality standards. As of December 31, 2014 and 2013, the Company had a product revenue returns reserve of $1.6 million and $1.1 million, respectively. Actual returns of products may differ from these estimates that the Company used to calculate such reserves. Product revenue is recorded net of taxes collected from customers that are remitted to governmental authorities, with the collected taxes recorded as current liabilities until remitted to the relevant government authority.
Research and Development—Research and development costs associated with research performed pursuant to research and development programs with government entities and commercial and strategic partners (“partners”) and the Company’s internal projects are expensed as incurred, and include, but are not limited to, personnel and related expenses, facility costs and overhead, depreciation and amortization of plant, property and equipment used in development, laboratory supplies, and scale-
84
up research manufacturing and consulting costs. The Company’s research and development programs are undertaken to advance its overall industrial biotechnology platform that enables the Company to produce tailored high-value oils. Although the Company’s partners fund certain development activities, the partners benefit from advances in the Company’s technology platform as a whole, including costs funded by other development programs. Therefore, costs for such activities have not been separated as these costs have all been determined to be part of the Company’s total research and development related activities.
Restructuring Charges—The Company accounts for restructuring activities in accordance with FASB ASC 420, Exit or Disposal Cost Obligations. Under the guidance, for the cost of restructuring activities that do not constitute a discontinued operation, the liability for the current fair value of expected future costs associated with such restructuring activity are recognized in the period in which the liability is incurred.
Advertising Costs—Advertising costs are expensed as incurred. Advertising expense was $2.4 million, $3.1 million, and $2.6 million for 2014, 2013 and 2012, respectively.
Patent Costs—All costs related to filing and pursuing patent applications are expensed as incurred as recoverability of such expenditures is uncertain and the underlying technologies are under development. Patent-related legal costs incurred are recorded in selling, general and administrative expenses.
Income Taxes—The Company accounts for income taxes under the asset and liability method, which requires, among other things, that deferred income taxes be provided for temporary differences between the tax basis of the Company’s assets and liabilities and the financial statement reported amounts. A valuation allowance is provided against deferred tax assets when it is more likely than not that they will not be realized.
The Company provides for reserves necessary for uncertain tax positions taken or expected to be taken on tax filings. First, the Company determines if the weight of available evidence indicates that a tax position is more likely than not to be sustained upon audit. Second, based on the largest amount of benefit that is more likely than not to be realized on ultimate settlement, the Company recognizes any such differences as a liability. Because the Company’s unrecognized tax benefits offset deferred tax assets for which the Company has not realized benefit in the financial statements, none of the unrecognized tax benefits through December 31, 2014, if recognized, would affect the Company’s effective tax rate.
Stock-Based Compensation—The Company recognizes stock-based compensation for awards to employees based on the estimated fair value of the awards granted. The fair value method requires the Company to estimate the fair value of stock-based awards on the date of grant using an option pricing model. The Company uses the Black-Scholes option-pricing model to estimate the fair value of awards granted to employees, and the requisite fair value is recognized as expense on a straight-line basis over the service period of the award.
The Company estimates the fair value of stock-based compensation awards using the Black-Scholes option pricing model, which requires the following inputs: expected life, expected volatility, risk-free interest rate, expected dividend yield rate, exercise price and closing price of the Company’s common stock on the date of grant. Due to the Company’s limited history of grant activity, the Company calculates its expected term utilizing the “simplified method” permitted by the Securities and Exchange Commission (“SEC”), which is the average of the total contractual term of the option and its vesting period. The Company believes historical volatility data of the Company's share price provides the best estimate for the expected volatility of the underlying share price that marketplace participants would most likely use in determining an exchange price for an option. As such, beginning in the second quarter of 2014 the Company began weighting the historical volatility data of its share price in proportion to the number of years of information it has available to the total expected term of stock options. The remaining volatility weight is allocated evenly among selected comparable public companies within its industry. The Company will continue to analyze the historical stock price volatility assumption as more historical data for its common stock becomes available. The risk-free interest rate is based on the U.S. Treasury yield curve in effect at the time of grant for zero coupon U.S. Treasury notes with maturities similar to the option’s expected term. The expected dividend yield was assumed to be zero, as the Company has not paid, nor does it anticipate paying, cash dividends on shares of its common stock. The Company estimates its forfeiture rate based on an analysis of its actual forfeitures and will continue to evaluate the appropriateness of the forfeiture rate based on actual forfeiture experience, analysis of employee turnover and other factors.
The Company accounts for restricted stock units and restricted stock awards issued to employees based on the quoted market price of the Company’s common stock on the date of grant that are expensed on a straight-line basis over the service period.
The Company uses the Black-Scholes option-pricing model to estimate the fair value of awards granted to nonemployees. The Company accounts for restricted stock units and restricted stock awards issued to nonemployees based on the estimated fair
85
value of the Company’s common stock on the date of grant. The measurement of stock-based compensation for nonemployees is subject to periodic adjustments as the underlying equity instruments vest, and the resulting change in value, if any, is recognized in the Company’s consolidated statements of operations during the period the related services are rendered.
Accumulated Other Comprehensive Loss—The components of accumulated other comprehensive income loss consisted of the following:
Foreign Currency Translation Adjustments | Change in unrealized gain/loss on available-for-sale securities | Total Accumulated Other Comprehensive Loss | |||||||||
Balance at December 31, 2011 | $ | (473 | ) | $ | (316 | ) | $ | (789 | ) | ||
Current period other comprehensive loss | (252 | ) | 642 | 390 | |||||||
Balance at December 31, 2012 | (725 | ) | 326 | (399 | ) | ||||||
Current period other comprehensive loss | (3,155 | ) | (240 | ) | (3,395 | ) | |||||
Balance at December 31, 2013 | (3,880 | ) | 86 | (3,794 | ) | ||||||
Current period other comprehensive loss | (6,908 | ) | (312 | ) | (7,220 | ) | |||||
Balance at December 31, 2014 | $ | (10,788 | ) | $ | (226 | ) | $ | (11,014 | ) | ||
Net Loss per Share—Basic net loss per share is computed by dividing the Company’s net loss by the weighted-average number of common shares outstanding during the period. Diluted net loss per share is computed by giving effect to all potentially dilutive securities, including stock options, common stock issuable pursuant to the 2011 Employee Stock Purchase Plan, restricted stock, restricted stock units and common stock warrants. Basic and diluted net loss per share was the same for all periods presented as the inclusion of all potentially dilutive securities outstanding was anti-dilutive.
The following table summarizes the Company’s calculation of basic and diluted net loss per share (in thousands, except share and per share amounts):
Year ended December 31, | |||||||||||
2014 | 2013 | 2012 | |||||||||
Numerator | |||||||||||
Net loss | $ | (162,141 | ) | $ | (116,389 | ) | $ | (83,132 | ) | ||
Denominator | |||||||||||
Weighted-average number of common shares used in net loss per share calculation | 75,879,721 | 64,228,387 | 60,570,891 | ||||||||
Less: Weighted-average shares subject to repurchase | (513 | ) | (16,429 | ) | (61,843 | ) | |||||
Denominator: basic and diluted | 75,879,208 | 64,211,958 | 60,509,048 | ||||||||
Net loss per share, basic and diluted | $ | (2.14 | ) | $ | (1.81 | ) | $ | (1.37 | ) | ||
The following outstanding shares of potentially dilutive securities were excluded from the calculation of diluted net loss per share for the periods presented as the effect was anti-dilutive:
Year ended December 31, | ||||||||
2014 | 2013 | 2012 | ||||||
Options to purchase common stock | 13,740,204 | 9,957,367 | 9,521,970 | |||||
Common stock subject to repurchase | — | 2,942 | 34,832 | |||||
Restricted stock units | 1,812,332 | 1,871,907 | 252,167 | |||||
Warrants to purchase common stock | 1,250,000 | 1,385,000 | 1,000,000 | |||||
Shares of common stock to be issued upon conversion of the Notes | 18,790,996 | 9,905,521 | — | |||||
Total | 35,593,532 | 23,122,737 | 10,808,969 | |||||
This table does not reflect (1) the series of warrants issued to ADM in March 2013 for payment in stock or cash, at the Company’s election, of future annual fees for use and operation of a portion of the ADM fermentation facility in Clinton, Iowa (the “Clinton Facility”) under the Strategic Collaboration Agreement (the "Collaboration Agreement") (See Note 10) and (2)
86
early conversion payment features of the Notes (see Notes 5 and 11) that may be settled, at the Company’s election, in cash or, subject to satisfaction of certain conditions, in shares of the Company’s common stock.
Recent Accounting Pronouncements—In May 2014, the FASB issued Accounting Standards Update ("ASU") 2014-09, Revenue from Contracts with Customers (Topic 606) (“ASU 2014-09”), which supersedes the revenue recognition requirements in FASB ASC 605, Revenue Recognition. ASU 2014-09 is based on the principle that revenue is recognized to depict the transfer of goods or services to customers in an amount that reflects the consideration to which the entity expects to be entitled in exchange for those goods or services. ASU 2014-09 also requires additional disclosure about the nature, amount, timing and uncertainty of revenue and cash flows arising from customer contracts, including significant judgments and changes in judgments and assets recognized from costs incurred to obtain or fulfill a contract. This new guidance is effective for annual reporting periods beginning after December 15, 2016, including interim periods within that reporting period. Early adoption is not permitted. Although the Company is still evaluating the effect that ASU 2014-09 may have on its consolidated financial statements and related disclosures, it does not anticipate that the implementation of this new standard will have a material effect.
3. RESTRUCTURING CHARGES
On December 18, 2014 the Company took steps to decrease operating expenses through a reduction in workforce and other cost-cutting measures (“2014 Restructuring Plan”). These targeted reductions are designed to enable the Company to achieve sustainable cash flow in the future. Components of the 2014 Restructuring Plan include:
• | Reduction in workforce across the organization by eliminating positions. Affected employees are eligible to receive severance payments, COBRA premium payments and outplacement assistance. The Company expects that the charges relating to these involuntary employee terminations, totaling approximately $2.0 million, net of a $0.5 million reversal of stock based compensation, will be substantially recognized and paid out in cash by the end of the first quarter of 2015. |
• | Implementation of an initiative to wind down two Solazyme Brazil leases. One lease is for approximately 14,000 square feet of space in Campinas, Brazil that is used as general office and lab space pursuant to a lease that expires in April 2016. The second lease is for approximately 2,200 square feet of space in Sao Paulo, Brazil that is used as general office space pursuant to a lease that expires in November 2018. The Company expects that charges to complete the wind down of these leases totaling approximately $20,000 will be substantially recognized by the end of the second quarter of 2015. As a result of these lease terminations, $0.2 million of assets were impaired as of December 31, 2014. |
• | Implementation of an initiative to de-emphasize production of certain oils at Company’s Peoria Facility. As a result, $1.2 million of assets were impaired as of December 31, 2014. |
A summary of the costs, which were recorded to Restructuring Charges in the consolidated statements of operations during the year ended December 31, 2014, and remaining costs associated with the 2014 Restructuring Plan are as follows (in thousands):
Total 2014 Restructuring Plan | Recognized as of December 31, 2014 | Remaining Costs to be Recognized | |||||||||
Employee termination costs | $ | 2,034 | $ | 1,962 | $ | 72 | |||||
Facility closure costs | 20 | — | 20 | ||||||||
Asset impairment | 1,552 | 1,552 | — | ||||||||
Total | $ | 3,606 | $ | 3,514 | $ | 92 | |||||
87
Costs associated with exit or disposal activities are recorded when the liability is incurred. Below is a roll forward of the liabilities recognized on the consolidated balance sheet as of December 31, 2014, related to the 2014 Restructuring Plan (in thousands):
Balance at December 31, 2013 | Additions | Payments | Balance at December 31, 2014 | ||||||||||||
Employee termination costs | $ | — | $ | 1,962 | $ | (614 | ) | $ | 1,348 | ||||||
Total(1) | $ | — | $ | 1,962 | $ | (614 | ) | $ | 1,348 | ||||||
(1) The remaining accrued costs as of December 31, 2014 are recorded in the current portion of the consolidated balance sheets under “Accrued liabilities,” as they are expected to be paid out by the end of the first quarter of 2015.
4. MARKETABLE SECURITIES
Marketable securities classified as available-for-sale consisted of the following (in thousands):
December 31, 2014 | |||||||||||||||
Amortized Cost | Gross Unrealized Gain | Gross Unrealized Loss | Fair Value | ||||||||||||
Corporate bonds | $ | 62,208 | $ | 16 | $ | (134 | ) | $ | 62,090 | ||||||
Asset-backed securities | 49,343 | 5 | (38 | ) | 49,310 | ||||||||||
Mortgage-backed securities | 19,280 | 25 | (114 | ) | 19,191 | ||||||||||
Commercial paper | 18,698 | 2 | — | 18,700 | |||||||||||
Government and agency securities | 11,868 | 14 | (4 | ) | 11,878 | ||||||||||
Municipal bonds | 3,448 | 3 | (1 | ) | 3,450 | ||||||||||
Total | $ | 164,845 | $ | 65 | $ | (291 | ) | $ | 164,619 | ||||||
December 31, 2013 | |||||||||||||||
Amortized Cost | Gross Unrealized Gain | Gross Unrealized Loss | Fair Value | ||||||||||||
Corporate bonds | $ | 45,414 | $ | 75 | $ | (7 | ) | $ | 45,482 | ||||||
Asset-backed securities | 21,222 | 12 | (8 | ) | 21,226 | ||||||||||
Mortgage-backed securities | 15,110 | 33 | (26 | ) | 15,117 | ||||||||||
Commercial paper | 13,890 | 2 | — | 13,892 | |||||||||||
Government and agency securities | 12,255 | 9 | — | 12,264 | |||||||||||
Municipal bonds | 3,817 | — | (4 | ) | 3,813 | ||||||||||
Certificates of deposit | 750 | — | — | 750 | |||||||||||
Total | $ | 112,458 | $ | 131 | $ | (45 | ) | $ | 112,544 | ||||||
88
The following table summarizes the amortized cost and fair value of the Company’s marketable securities, classified by maturity as of December 31, 2014 and 2013 (in thousands):
December 31, 2014 | December 31, 2013 | ||||||||||||||
Amortized Cost | Fair Value | Amortized Cost | Fair Value | ||||||||||||
Marketable securities | |||||||||||||||
Due in 1 year or less | $ | 46,759 | $ | 46,754 | $ | 59,384 | $ | 59,448 | |||||||
Due in 1-2 years | 53,698 | 53,639 | 21,628 | 21,641 | |||||||||||
Due in 2-3 years | 30,558 | 30,505 | 10,063 | 10,060 | |||||||||||
Due in 3-4 years | 11,277 | 11,275 | — | — | |||||||||||
Due in 4-9 years | 7,280 | 7,275 | 7,587 | 7,610 | |||||||||||
Due in 9-20 years | 1,257 | 1,266 | 1,629 | 1,639 | |||||||||||
Due in 20-35 years | 14,016 | 13,905 | 12,167 | 12,146 | |||||||||||
$ | 164,845 | $ | 164,619 | $ | 112,458 | $ | 112,544 | ||||||||
Marketable securities classified as available-for-sale are carried at fair value as of December 31, 2014 and 2013. Realized gains and losses from sales and maturities of marketable securities were not significant in the periods presented.
The aggregate fair value of available-for-sale securities with unrealized losses was $106.7 million as of December 31, 2014. Gross unrealized losses on available-for-sale securities were $0.3 million as of December 31, 2014, and the Company believes the gross unrealized losses are temporary. In determining that the decline in fair value of these securities was temporary, the Company considered the length of time each security was in an unrealized loss position and the extent to which the fair value was less than cost. The aggregate fair value and unrealized loss of available-for-sale securities which had been in a continuous loss position for more than 12 months was $2.5 million and $28,000 as of December 31, 2014, respectively. In addition, the Company does not intend to sell these securities and it is more likely than not that the Company will not be required to sell these securities before the recovery of their amortized cost basis.
5. FAIR VALUE OF FINANCIAL INSTRUMENTS
Assets and liabilities recorded at fair value in the consolidated financial statements are categorized based upon the level of judgment associated with the inputs used to measure their fair value. Hierarchical levels that are directly related to the amount of subjectivity associated with the inputs to the valuation of these assets or liabilities are as follows:
• | Level 1—Observable inputs, such as quoted prices in active markets for identical assets or liabilities. |
• | Level 2—Observable inputs other than Level 1 prices, such as quoted prices for similar assets or liabilities, quoted prices in markets that are not active, or other inputs that are observable or can be corroborated by observable market data for substantially the full term of the assets or liabilities. |
• | Level 3—Unobservable inputs that are supported by little or no market activity and that are significant to the fair value of the assets or liabilities. Level 3 assets and liabilities include those whose fair value measurements are determined using pricing models, discounted cash flow methodologies or similar valuation techniques and significant management judgment or estimation. |
The following tables present the Company’s financial instruments that were measured at fair value on a recurring basis as of December 31, 2014 and 2013 by level within the fair value hierarchy (in thousands):
December 31, 2014 | |||||||||||||||
Level 1 | Level 2 | Level 3 | Total | ||||||||||||
Financial Assets | |||||||||||||||
Cash equivalents | $ | 1,880 | $ | 7,828 | $ | — | $ | 9,708 | |||||||
Marketable securities | 4,897 | 159,722 | — | 164,619 | |||||||||||
Total | $ | 6,777 | $ | 167,550 | $ | — | $ | 174,327 | |||||||
Financial Liabilities | |||||||||||||||
Derivative liabilities | $ | — | $ | — | $ | 83 | $ | 83 | |||||||
89
December 31, 2013 | |||||||||||||||
Level 1 | Level 2 | Level 3 | Total | ||||||||||||
Financial Assets | |||||||||||||||
Cash equivalents | $ | 15,683 | $ | 5,869 | $ | — | $ | 21,552 | |||||||
Marketable securities | — | 112,544 | — | 112,544 | |||||||||||
Total | $ | 15,683 | $ | 118,413 | $ | — | $ | 134,096 | |||||||
Financial Liabilities | |||||||||||||||
Derivative liability | $ | — | $ | — | $ | 5,914 | $ | 5,914 | |||||||
Warrant liability | — | — | 688 | 688 | |||||||||||
Total | $ | 6,602 | $ | 6,602 | |||||||||||
Other than assets impaired as a result of the 2014 Restructuring Plan (see Note 3), the Company had no transactions measured at fair value on a nonrecurring basis as of December 31, 2014 and 2013.
Cash Equivalents and Marketable Securities - Cash equivalents and marketable securities classified within Level 2 of the fair value hierarchy are valued based on other observable inputs, including broker or dealer quotations or alternative pricing sources. When quoted prices in active markets for identical assets or liabilities are not available, the Company relies on non-binding quotes, which are based on proprietary valuation models of independent pricing services. These models generally use inputs such as observable market data, quoted market prices for similar instruments, historical pricing trends of a security as relative to its peers and internal assumptions of the independent pricing services. The Company corroborates the reasonableness of non-binding quotes received from the independent pricing services by comparing them to quotes of identical or similar instruments from other pricing sources. During the years ended December 31, 2014, 2013 and 2012, the Company did not record impairment charges related to its cash equivalents and marketable securities, and the Company did not have any transfers between Level 1, Level 2 and Level 3 of the fair value hierarchy.
Derivative Liabilities - In January 2013, the Company issued the 2018 Notes and, in April 2014, the Company issued the 2019 Notes. Each of the 2018 Notes and the 2019 Notes contains an early conversion payment feature pursuant to which a holder may convert its Notes into shares of the Company's common stock. With respect to any conversion of 2018 Notes prior to November 1, 2016 or any conversion of 2019 Notes prior to January 1, 2018 (other than conversions in connection with certain fundamental changes), in addition to the shares deliverable upon conversion, holders are entitled to receive an early conversion payment equal to $83.33 per $1,000 principal amount of Notes surrendered for conversion that may be settled, at the Company’s election, in cash or, subject to satisfaction of certain conditions, in shares of the Company’s common stock. These early conversion payment features have been identified as embedded derivatives and are separated from the host contracts, the Notes, and carried at fair value when: (a) the embedded derivative possesses economic characteristics that are not clearly and closely related to the economic characteristics of the host contract; and (b) a separate, stand-alone instrument with the same terms would qualify as a derivative instrument. The Company has concluded that the embedded derivatives related to the early conversion payment features of the Notes meet these criteria and, as such, must be valued separate and apart from the Notes and recorded at their fair values at each reporting period. At each reporting period, the Company records these embedded derivatives at their fair values, which are included as a component of Convertible Debt on its consolidated balance sheets. The fair values of the embedded derivatives are trued up on a recurring basis as Note holders early convert their Notes and receive the early conversion payment.
The Company used a Monte Carlo simulation model to estimate the fair values of the embedded derivatives related to the early conversion payment features of the Notes. Historically, using the Monte Carlo model, the value of the embedded derivative was based on the assumption that the Notes will be converted early if the conversion value is greater than the holding value. Beginning in the second quarter of 2014, using the Monte Carlo model, the Company values these embedded derivatives using a “with-and-without method,” where the value of the Notes including the embedded derivatives, is defined as the “with”, and the value of the Notes excluding the embedded derivatives, is defined as the “without.” This method estimates the value of the embedded derivatives by observing the difference between the value of the Notes with the embedded derivatives and the value of the Notes without the embedded derivatives. The Company believes the "with-and-without method" results in a measurement that is more representative of the fair value of the embedded derivatives.
The model requires the following inputs: (i) price of the Company’s common stock; (ii) conversion rate of shares of common stock per $1,000 in principal amount of Notes, subject to adjustment; (iii) conversion price per share of common
90
stock, subject to adjustment; (iv) maturity date of the Notes and early payment feature; (v) estimated credit spread (historically the risk-free interest rate); and (vi) estimated stock volatility.
The following tables set forth the Level 3 inputs to the Monte Carlo simulation models that were used to determine the fair values of the embedded derivatives for the Notes:
Constant Inputs | 2018 Notes | 2019 Notes | |||||
Conversion rate | 121.1240 | 75.7576 | |||||
Conversion price | $ | 8.26 | $ | 13.20 | |||
Maturity date of the Notes | February 1, 2018 | October 1, 2019 | |||||
Maturity date of early payment feature | November 1, 2016 | January 1, 2018 | |||||
Variable Inputs | December 31, 2014 | December 31, 2014 | December 31, 2013 | ||||||||
2018 Notes | 2019 Notes | 2018 Notes | |||||||||
Stock price | $ | 2.58 | $ | 2.58 | $ | 10.89 | |||||
Risk-free interest rate | N/A | N/A | 1.31 | % | |||||||
Estimated credit spread | 2,450 basis points | 2,900 basis points | N/A | ||||||||
Estimated stock volatility | 55 | % | 55 | % | 50 | % | |||||
Changes in certain inputs into the model can have a significant impact on changes in the estimated fair values of the embedded derivatives. The following table sets forth the estimated fair values of the embedded derivatives (in thousands):
December 31, 2014 | April 1, 2014 | December 31, 2013 | January 24, 2013 | ||||||||||||
2018 Notes | $ | 35 | N/A | $ | 5,914 | $ | 3,124 | ||||||||
2019 Notes | $ | 48 | $ | 3,903 | N/A | N/A | |||||||||
The $5.9 million decrease in the estimated fair value of the embedded derivative for the 2018 Notes between December 31, 2013 and December 31, 2014 represents an unrealized gain of $4.9 million that has been recorded as gain from change in fair value of derivative liabilities in the consolidated statements of operations for the year ended December 31, 2014, and fair value adjustments related to conversions made in the twelve months ended December 31, 2014 of $1.0 million. The $3.9 million decrease in the estimated fair value of the embedded derivative for the 2019 Notes between the issuance date of April 1, 2014 and December 31, 2014 represents an unrealized gain that has been recorded as a gain from change in fair value of derivative liabilities in the consolidated statements of operations for the twelve months ended December 31, 2014.
Warrant Liability - The valuation of the warrant liability above is discussed in Note 8.
The following table presents the change in fair values of the Company’s Level 3 financial instruments that were measured on a recurring basis using significant unobservable inputs as of December 31, 2014 (in thousands):
Fair value at December 31, 2013 | $ | 6,602 | |
Fair value of derivative liability for 2019 Notes recorded on measurement date | 3,903 | ||
Change in fair value of derivative liabilities of the Notes recorded as a gain | (8,731 | ) | |
Adjustment to fair value of derivative liability related to early conversion of the 2018 Notes | (1,003 | ) | |
Change in fair value of warrant liability recorded as a gain | (688 | ) | |
Fair value at December 31, 2014 | $ | 83 | |
The Company has estimated the fair value of its secured and unsecured debt obligations based upon discounted cash flows with Level 3 inputs, such as the terms that management believes would currently be available to the Company for similar issues of debt, taking into account the current credit risk of the Company and other factors. As of December 31, 2014 and 2013, the carrying values of the Company’s accounts receivables and secured and unsecured debt obligations, excluding the Notes, approximated their fair values. The Company has estimated the fair value of the Notes to be $127.1 million at December 31,
91
2014 based upon Level 2 inputs using the market price of the Notes derived from actual trades quoted from Bloomberg, and the fair value of the 2018 Notes to be $117.7 million at December 31, 2013 using a midmarket pricing convention (the midpoint price between bid and ask prices) quoted from Bloomberg.
6. INVENTORIES
Inventories consisted of the following (in thousands):
December 31, 2014 | December 31, 2013 | ||||||
Raw materials | $ | 1,555 | $ | 1,318 | |||
Work in process | 8,544 | 6,191 | |||||
Finished goods | 5,235 | 2,327 | |||||
Total inventories | $ | 15,334 | $ | 9,836 | |||
7. PROPERTY, PLANT AND EQUIPMENT—NET
Property, plant and equipment—net consisted of the following (in thousands):
December 31, 2014 | December 31, 2013 | ||||||
Plant equipment | $ | 30,213 | $ | 25,918 | |||
Building and improvements | 5,807 | 5,514 | |||||
Lab equipment | 7,904 | 6,445 | |||||
Leasehold improvements | 1,935 | 2,659 | |||||
Computer equipment and software | 3,936 | 3,387 | |||||
Furniture and fixtures | 638 | 603 | |||||
Land | 430 | 430 | |||||
Automobiles | 194 | 49 | |||||
Construction in progress | 1,926 | 6,378 | |||||
Total | 52,983 | 51,383 | |||||
Less: accumulated depreciation and amortization | (16,903 | ) | (11,294 | ) | |||
Property, plant and equipment—net | $ | 36,080 | $ | 40,089 | |||
Construction in progress as of December 31, 2014 related primarily to the Clinton and Galva Facilities and other plant equipment not yet placed in service as of that date, and construction in progress as of December 31, 2013 related primarily to the Peoria, Clinton and Galva Facilities and other plant equipment not yet placed in service as of that date.
The Company capitalized $0.3 million of interest costs associated with plant equipment at its Peoria Facility for the year ended December 31, 2012. There were no interest costs associated with plant equipment that were capitalized for the years ended December 31, 2013 and 2014.
Depreciation and amortization expense was $6.3 million, $5.1 million and $3.5 million for the years ended December 31, 2014, 2013 and 2012, respectively.
8. INVESTMENTS IN JOINT VENTURES AND RELATED PARTY TRANSACTIONS
Solazyme Bunge Joint Venture
In April 2012, the Company and Bunge formed the Solazyme Bunge JV to build, own and operate the Solazyme Bunge JV Plant, a commercial-scale renewable algal oils production facility adjacent to Bunge’s Moema sugarcane mill in Brazil. Construction of the Solazyme Bunge JV Plant commenced in the second quarter of 2012. In May 2014, the Solazyme Bunge JV Plant produced its first products on full-scale production lines, including 625,000 liter fermentation tanks, and manufacturing operations at the facility are in the process of being optimized and ramped up. Both oil and Encapso™ products have been
92
manufactured; production is continuing and is expected to ramp toward targeted nameplate capacity as the Company works to increase efficiency in unit operations, and balances production volumes with operating costs as it focuses on higher value products. Additional capital expenditures may be required to reach nameplate capacity depending on the product mix produced at the plant. The Solazyme Bunge JV Plant leverages the Company’s technology and Bunge’s sugarcane milling and natural oil processing capabilities to produce microalgae-based products. The Solazyme Bunge JV is 50.1% owned by the Company and 49.9% by Bunge and is governed by a six member board of directors, three from each investor. The capital contributions for this venture are being provided jointly by Solazyme and Bunge, and the agreement includes a value sharing mechanism that provides additional compensation to the Company for its technology contributions. The Company committed to make an initial capital contribution of up to $36.3 million in fiscal 2012 and, additional capital contributions of up to an additional $36.3 million beginning after December 31, 2012, primarily to fund the construction of the Solazyme Bunge JV Plant. The Company and Bunge each contributed capital in the amount of $70.1 million through December 31, 2014, comprised of $47.9 million, $12.3 million and $10.0 million during the years ended December 31, 2014, 2013 and 2012, respectively, to the Solazyme Bunge JV. During the year ended December 31, 2014, the Company contributed $15.3 million to the Solazyme Bunge JV through a reduction in the Company’s receivables due from the Solazyme Bunge JV of $15.3 million. The Company’s capital contributions paid in cash were recorded as an increase to investment in unconsolidated joint venture and a corresponding decrease to cash and cash equivalents.
The Company has determined that the Solazyme Bunge JV is a VIE based on the insufficiency of each party’s equity investment at risk to absorb losses and the Company’s share of the respective expected losses of the Solazyme Bunge JV. Currently, the optimization and ramping up of the Solazyme Bunge JV Plant is the activity of the Solazyme Bunge JV that most significantly impacts its economic performance. Although the Company has the obligation to absorb losses and the right to receive benefits of the Solazyme Bunge JV that could potentially be significant to the Solazyme Bunge JV, each of the Company and Bunge has equally shared decision–making powers over certain significant activities of the Solazyme Bunge JV, including those related to the construction, optimization and ramping up of the Solazyme Bunge JV Plant. Therefore, the Company does not consider itself to be the Solazyme Bunge JV’s primary beneficiary at this time, and as such has not consolidated the financial results of the Solazyme Bunge JV since the inception of this joint venture. The Company accounts for its interests in the Solazyme Bunge JV under the equity method of accounting. This consolidation status could change in the future due to changes in events and circumstances impacting the power to direct the activities that most significantly affect the Solazyme Bunge JV’s economic performance. The Company will continue to reassess its potential designation as the primary beneficiary of the Solazyme Bunge JV. During the years ended December 31, 2014, 2013 and 2012, the Company recognized $23.0 million, $6.8 million and $1.8 million of losses, respectively, related to its equity method investment in the Solazyme Bunge JV.
In anticipation of the Solazyme Bunge JV’s formation, in May 2011, the Company granted Bunge a warrant (the “Bunge Warrant”) to purchase 1,000,000 shares of its common stock at an exercise price of $13.50 per share. The Bunge Warrant was to vest (i) 25% on the date that Solazyme and Bunge entered into a joint venture agreement to construct and operate a commercial-scale renewable oil production facility ("first tranche"); (ii) 50% upon the commencement of construction of the Solazyme Bunge JV Plant ("second tranche"); and (iii) 25% on the date upon which the aggregate output of triglyceride oil at the Solazyme Bunge JV Plant reached 1,000MT ("third tranche"). The number of warrant shares issuable was subject to adjustment for failure to achieve the performance milestones on a timely basis, as well as certain changes to the capital structure of the Solazyme Bunge JV and corporate transactions. The Bunge Warrant expires in May 2021.
The Company accounts for the Bunge Warrant pursuant to FASB ASC 505-50, Equity-Based Payments to Non-Employees, which establishes that share-based payment transactions with nonemployees shall be measured at the fair value of the consideration received or the fair value of the equity instruments issued (whichever is more reliably measurable), and the measurement date of such instruments shall be the earlier of the date at which a commitment for performance by the counterparty is reached or the date at which the counterparty’s performance is complete. A performance commitment is a commitment under which performance by the counterparty to earn the equity instruments is probable because of sufficiently large disincentives for nonperformance. The measurement date of the Bunge Warrant was April 2, 2012, the formation date of the Solazyme Bunge JV, as it was determined that the future performance to earn the Bunge Warrant shares was probable.
On April 2, 2012, the Company recorded an investment in the Solazyme Bunge JV of $10.4 million, equal to the fair value of the Bunge Warrant, and recorded a corresponding $2.7 million of additional paid-in capital for the vested first tranche of the Bunge Warrant shares and $7.7 million of warrant liability for the unvested Bunge Warrant shares as of that date. The fair value of the Bunge Warrant was determined using the Black-Scholes option pricing model. The warrant liability is remeasured to fair value at each balance sheet date and/or upon vesting, and the warrant liability is reclassified to additional paid-in capital upon vesting. On June 20, 2012, the second tranche of the Bunge Warrant shares vested, resulting in a reclassification of $4.6 million, which represented the fair value as of that date, to additional paid-in capital. The Company had a $0.7 million warrant
93
liability associated with the unvested third tranche of the Bunge Warrant shares as of December 31, 2013. As of December 31, 2014, the Company had no warrant liability associated with the Bunge Warrant shares as the third tranche could no longer vest. The fair value of the warrant liability was determined using the Black-Scholes option pricing model based upon the following assumptions as of December 31, 2013 and 2012:
December 31, 2013 | December 31, 2012 | ||||||
Stock price | $ | 10.89 | $ | 7.75 | |||
Exercise price | $ | 13.50 | $ | 13.50 | |||
Expected life in years | 7.3 | 8.3 | |||||
Risk-free interest rate | 2.45 | % | 1.48 | % | |||
Estimated stock volatility | 50 | % | 55 | % | |||
The Company recorded a net unrealized gain related to the change in the fair value of the warrant liability of $0.7 million, $0.1 million and $2.3 million during the years ended December 31, 2014, 2013 and 2012, respectively. As of December 31, 2014, 750,000 of the Bunge Warrant shares had vested, and the remaining 250,000 shares under the third tranche could no longer vest.
In addition to forming the Solazyme Bunge JV in April 2012, the Company entered into a Development Agreement with the Solazyme Bunge JV to continue to conduct research and development activities that are intended to benefit the Solazyme Bunge JV, including activities in the areas of strain development, molecular biology and process development. The Development Agreement provides that the Solazyme Bunge JV will pay the Company a technology maintenance fee in recognition of the Company’s ongoing research investment in technology that would benefit the Solazyme Bunge JV. The Company also entered into a Technology Service Agreement with the Solazyme Bunge JV under which the Solazyme Bunge JV pays the Company for technical services related to the operations of the production facility. In the third quarter of 2013, the Solazyme Bunge JV also agreed to pay the Company to support the Solazyme Bunge JV’s commercial activities, including, but not limited to, facilitating supply agreements on behalf of the Solazyme Bunge JV and providing regulatory support.
In November 2012, the Company entered into a joint venture expansion framework agreement with Bunge. This framework agreement sets forth the intent of the partners to expand joint venture-owned oil production capacity from the current Solazyme Bunge JV Plant with a target nameplate capacity of 100,000MT in Brazil to 300,000MT by 2016 at select Bunge owned and operated processing facilities worldwide. In addition, the Company and Bunge amended the Joint Venture Agreement in October 2013 to expand the field and product portfolio of the Solazyme Bunge JV. The Company and Bunge intend to work together through joint market development to bring new, healthy and nutritious edible oils to the Brazilian market. In February 2013, the Solazyme Bunge JV entered into a loan agreement with the Brazilian Development Bank (“BNDES” or “BNDES Loan”) under which it may borrow up to R$245.7 million (approximately USD $91.4 million based on the exchange rate as of December 31, 2014). As a condition of the Solazyme Bunge JV drawing funds under the loan, the Company may be required to provide a bank guarantee equal to 14.39% of the total amount available under the BNDES Loan and a corporate guarantee equal to 35.71% of the total amount available under the BNDES Loan (an amount not to exceed the Company’s ownership percentage in the Solazyme Bunge JV). The BNDES funding has supported the construction of the Solazyme Bunge JV’s first commercial-scale production facility in Brazil, reducing the capital requirements funded directly by the Company and Bunge. The term of the BNDES Loan is eight years and the loan has an average interest rate of approximately 4.0% per annum. As of December 31, 2014, the Company’s bank guarantee was in place and the corporate guarantee was not in place. The fees incurred on the cancelable bank guarantee were not material during the year ended December 31, 2014.
The following table summarizes the carrying amounts of the assets and the fair value of the liabilities included in the Company’s consolidated balance sheet and the maximum loss exposure related to the Company’s interest in its unconsolidated VIE (the Solazyme Bunge JV) as of December 31, 2014 (in thousands):
Assets | Liabilities | |||||||||||||||||
VIE | Accounts Receivable | Unbilled Revenues | Investments in Unconsolidated Joint Ventures | Loan Guarantee | Maximum Exposure to Loss(1) | |||||||||||||
Solazyme Bunge JV | $ | 446 | $ | 2,435 | $ | 40,934 | $ | — | $ | 57,618 | ||||||||
(1) | Includes maximum exposure to loss attributable to the Company’s bank guarantee required to be provided for the Solazyme Bunge JV of R$35.4 million (approximately $13.2 million based on the exchange rate at December 31, 2014) |
94
and non-cancelable purchase obligations of R$1.7 million (approximately $0.6 million based on the exchange rate at December 31, 2014).
The Company may be required to contribute additional capital to the VIE (for which the Company does not consider itself to be the primary beneficiary) in the future which would increase the Company’s maximum exposure to loss. These future contribution amounts cannot be quantified at this time.
Summarized information on the Solazyme Bunge JV’s balance sheets and income statements as of December 31, 2014, 2013 and 2012 and for the years ended December 31, 2014, 2013 and for the period from April 2, 2012 (date of inception) to December 31, 2012, respectively, was as follows (in thousands):
As of and for the year ended December 31, 2014 | As of and for the year ended December 31, 2013 | As of and for the year ended December 31, 2012 | |||||||||
Current assets | $ | 4,339 | $ | 9,872 | $ | 7,773 | |||||
Noncurrent assets | 161,751 | 127,346 | 12,765 | ||||||||
Total assets | $ | 166,090 | $ | 137,218 | $ | 20,538 | |||||
Current liabilities | 24,881 | 20,798 | 3,466 | ||||||||
Noncurrent liabilities | 78,666 | 90,933 | — | ||||||||
JV’s partners’ capital, net | 62,543 | 25,487 | 17,072 | ||||||||
Total liabilities and partners’ capital, net | $ | 166,090 | $ | 137,218 | $ | 20,538 | |||||
Net sales | 805 | — | — | ||||||||
Net losses | (46,165 | ) | (16,280 | ) | (2,733 | ) | |||||
Solazyme Roquette Joint Venture
In November 2010, the Company entered into a joint venture agreement with Roquette. The purpose of the joint venture, Solazyme Roquette Nutritionals, LLC (“SRN”), was to pursue certain opportunities in microalgae-based products for the food, nutraceuticals and animal feed markets. In June 2013, the Company and Roquette agreed to dissolve SRN and on July 18, 2013, SRN was dissolved. After assessing the recoverability of the SRN amounts capitalized on the Company’s balance sheet, the Company recorded charges to Loss From Equity Method Investments in its consolidated statement of operations of $0.7 million for unrecoverable receivables due from SRN, and $0.7 million for unrecoverable capital contributions made to SRN during the year ended December 31, 2013.
The Company had determined that SRN was a VIE based on the insufficiency of each party’s equity investment at risk to absorb losses and the Company’s share of the respective expected losses of SRN. Prior to SRN’s dissolution, the Phase 1 plant operations and market development activities were the activities of SRN that most significantly impacted its economic performance. The Company did not have the obligation to absorb the losses of SRN that could potentially be significant to SRN, and the Company and Roquette had equally shared decision-making powers over certain significant activities of SRN. Therefore, the Company did not consider itself to be SRN’s primary beneficiary since inception of this joint venture and as such had never consolidated the financial results of SRN. The Company accounted for its interests in SRN under the equity method of accounting.
Related Party Transactions
The Company recognized revenues related to its research and development arrangements with the Solazyme Bunge JV of $13.6 million, $8.1 million and $2.2 million, during the years ended December 31, 2014, 2013 and 2012, respectively. The Company also recognized product revenues from sales to the Solazyme Bunge JV of $2.9 million during the year ended December 31, 2014, and $0 during the years ended December 31, 2013 and 2012. At December 31, 2014 and 2013, the Company had receivables of $0.4 million and $6.9 million, respectively, due from the Solazyme Bunge JV. At December 31, 2014 and 2013, the Company had unbilled revenues of $2.4 million and $1.1 million, respectively, related to the Solazyme Bunge JV.
95
9. ACCRUED LIABILITIES
Accrued liabilities consisted of the following (in thousands):
December 31, 2014 | December 31, 2013 | ||||||
Accrued compensation and related liabilities | $ | 6,956 | $ | 7,959 | |||
Accrued interest | 3,495 | 2,166 | |||||
Accrued professional fees | 417 | 350 | |||||
Accrued restructuring costs | 1,348 | — | |||||
Accrued costs under the Collaboration Agreement | 476 | 2,629 | |||||
Other accrued liabilities | 1,387 | 1,901 | |||||
Total accrued liabilities | $ | 14,079 | $ | 15,005 | |||
10. COLLABORATIVE RESEARCH AND DEVELOPMENT AGREEMENTS, GOVERNMENT PROGRAMS AND LICENSES
Chevron—The Company entered into multiple research and development agreements with Chevron over the research funding period of January 2009 through June 2012 to conduct research, develop, manufacture and sell licensed products related to algal technology in the fields of diesel fuel, lubes and additives and coproducts.
These agreements with Chevron contained multiple element arrangements. The Company concluded that there were two deliverables, research and development activities and licenses, which are considered one unit of accounting. Revenues related to these services are recognized as research services and are performed over the related performance period. The payments received are not refundable and are based on a contractual reimbursement of costs incurred.
Unilever—Effective November 2009, the Company entered into a collaborative research and development agreement with Conopco, Inc. (doing business as Unilever) to develop oil for use in soap and other products. The Company completed the research and development under this agreement in the year ended December 31, 2010. In the first quarter of 2011, the Company and Unilever agreed to extend their research and development agreement through June 30, 2011.
In October 2011, the Company entered into a joint development agreement with Unilever (the Company’s fourth agreement with Unilever), which expanded its current research and development efforts. In September 2013, the Company and Unilever entered into a commercial supply agreement for at least 10,000 MT of the Company’s algal oil, and in September 2014, the Company and Unilever agreed to extend the joint development agreement through September 30, 2015.
Department of Defense—In September 2010, the Company entered into an agreement with the U.S. Department of Defense (“DoD”) for research and development services to provide marine diesel fuel. This was a firm fixed price contract divided into two phases, with Phase 1 and Phase 2 fees of $5.6 million and $4.6 million, respectively. Phase 1 of the contract was completed in September 2011 when 75,000 gallons (283,906 liters) of fuel were delivered. In August 2011, the DoD exercised its option to pursue Phase 2 of the agreement, which called for the additional delivery of 75,000 gallons (283,906 liters) of marine diesel fuel.
The Company evaluated the multiple elements of both DoD agreements (Phase 1 and Phase 2) and concluded that the two deliverables (research and development activities and fuel) were one unit of accounting. Revenues related to these services are recognized as research services that are performed over the related performance period for each phase of the contract. The payments received as installments are not refundable and are based on a contractual reimbursement of costs incurred.
With respect to Phase 2 of the September 2010 DoD contract, the Company recognized no revenues in the years ended December 31, 2014 and 2013, and $0.7 million of revenues in the year ended December 31, 2012. The Company had no unbilled revenue and deferred revenue balances related to Phase 2 of the agreement as of December 31, 2014 and 2013.
Department of Energy—In December 2009, the U.S. Department of Energy (“DOE”) awarded the Company approximately $21.8 million to partially fund the construction, operation, and optimization of an integrated biorefinery. The project commenced in 2010 and the Company submitted its final report to the DOE and completed all other outstanding requirements under the award in December 2014. The payments received are not refundable and are based on a contractual reimbursement of costs incurred.
96
During the years ended December 31, 2014 and 2013 the Company recognized no revenues related to this award, and during the year ended December 31, 2012 recognized $9.2 million of revenues related to this award. The Company had no deferred revenue balance and no unbilled revenues related to this award as of December 31, 2014 and 2013, respectively.
Dynamic Fuels—In November 2011, Dynamic Fuels, LLC (“Dynamic”) was awarded a contract to supply the U.S. Navy with 450,000 gallons (1,703,000 liters) of renewable fuels. The contract involved supplying the U.S. Navy with 100,000 gallons (379,000 liters) of jet fuel (Hydro-treated Renewable JP-5 and HRJ-5) and 350,000 gallons (1,325,000 liters) of marine distillate fuel (Hydro-treated Renewable F-76 and HRD-76). The Company was named a subcontractor and entered into a subcontractor agreement effective as of January 2012 to supply Dynamic with algal oil to help fulfill Dynamic’s contract with the U.S. Navy to deliver fuel by May 2012. The Company delivered its commitment of algal oil pursuant to this subcontract in February 2012. The fuel was used by the U.S. Navy in July 2012, as part of its efforts to demonstrate a Green Strike Group composed of vessels and ships powered by biofuels.
Algenist ® Distribution Partners—The Company entered into a distribution contract with Sephora S.A. (Sephora EMEA) in December 2010 to distribute the Algenist® product line in Sephora stores in certain countries in Europe and select countries in the Middle East and Asia. In January 2011, the Company also entered into a distribution arrangement with Sephora USA, Inc. (Sephora Americas) to sell the Algenist® product line in the Sephora Americas stores (which currently includes locations in the United States and Canada). Under both arrangements, the Company pays the majority of the costs associated with marketing the products, although both Sephora EMEA and Sephora Americas contribute in the areas of public relations, training and marketing to support the brand. Sephora EMEA creates the marketing material, but the Company has an approval right over the materials and ultimately the Company has control over the marketing budget. With Sephora Americas, the Company is responsible for creating certain marketing and training materials. The Company is obligated to fund minimum marketing expenditures under the agreement with Sephora EMEA. The Company has also granted a license to Sephora Americas and Sephora EMEA to use the Algenist® trademarks and logos to advertise and promote the product line. In March 2011, the Company entered into an agreement with QVC, Inc. (“QVC”) and launched the sale of its Algenist® product line through QVC’s multimedia platform. In July 2014, the Company entered into an agreement with ULTA Beauty to sell the Algenist® line in its retail stores throughout the United States.
Bunge—In May 2011, the Company entered into a joint development agreement (“JDA”) with Bunge, a global agribusiness and food company, that extended through May 2013. In September 2013, the Company and Bunge agreed to extend the JDA, effective from May 2013 through September 2014. Pursuant to the JDA, the Company and Bunge jointly developed microbe-derived oils and explored the production of such oils from Brazilian sugarcane feedstock. The JDA also provided for Bunge to provide research funding to the Company through September 2014, payable quarterly in advance throughout the research term. The Company accounted for the JDA as an obligation to perform research and development services for others in accordance with FASB ASC 730-20, Research and Development Arrangements, and recorded the payments for the performance of these services as revenue in its consolidated statement of operations. The Company recognized revenue on the JDA based on proportionate performance of actual efforts to date relative to the amount of expected effort incurred. The cumulative amount of revenue recognized under the JDA was limited by the amounts the Company was contractually obligated to receive as cash reimbursements.
In April 2012, the Company and Bunge entered into a Joint Venture Agreement forming a joint venture to build, own and operate a commercial-scale renewable algal oils production facility adjacent to Bunge’s Moema sugarcane mill in Brazil (see Note 8).
ADM—In November 2012, the Company and ADM entered into the Collaboration Agreement, establishing a collaboration for the production of algal triglyceride oil products at the Clinton Facility. In January 2014, the Company began commercial scale production of its products at the Clinton Facility using the Company’s proprietary microbe-based catalysis technology. Feedstock for the facility is provided by ADM’s adjacent wet mill. Under the terms of the Collaboration Agreement, the Company pays ADM annual fees for use and operation of a portion of the Clinton Facility, a portion of which may be paid in Company common stock. In March 2013, the Company issued a series of warrants to ADM for payment in stock, in lieu of cash, at its election, of future annual fees for use and operation of a portion of the Clinton Facility. Downstream processing of products produced at the Clinton Facility is being done at a facility in Galva, Iowa ("Galva Facility") operated by a wholly owned subsidiary of ANP. The initial target nameplate capacity of the Clinton Facility is expected to be 20,000 MT per year of algal triglyceride oil products. Solazyme has an option to expand the capacity to 40,000 MT per year with the potential to further expand production to 100,000 MT per year. The parties are also working together to develop markets for the products produced at the Clinton Facility.
In January 2013, the Company granted to ADM a warrant (“ADM Warrant”) to purchase 500,000 shares of the Company’s common stock, which vests in equal monthly installments over five years, commencing in November 2013. In
97
addition, the Company shall grant to ADM a warrant (“ADM Extension Warrant”) covering an additional 500,000 shares of the Company’s common stock upon the extension of the Collaboration Agreement for each further five year term, which shall vest in equal monthly installments over the applicable five year extension term. The measurement date of the ADM Warrant was established in July 2013 when the Company agreed that vesting of the ADM Warrant would commence in November 2013; therefore, it was determined that the future performance to earn the ADM Warrant shares was probable. The Company recognizes on a straight-line basis, the fair value of the ADM Warrant to rent expense beginning on the measurement date and over the lease term.
During the years ended December 31, 2014 and 2013, the Company recorded rent expense related to the ADM Warrant of $0.6 million and $0.1 million, respectively, equal to the estimated fair value of the ADM Warrant shares that had vested over the lease term since the measurement date. The estimated fair value of the ADM Warrant shares that had vested was determined using the Black-Scholes option pricing model based upon the following assumptions during the years ended December 31, 2013 and 2014:
Year ended December 31, | |||||
2014 | 2013 | ||||
Average volatility | 59 | % | 61 | % | |
Average risk-free interest rate | 1.6 | % | 1.4 | % | |
Exercise price | $7.17 | $7.17 | |||
Average stock price | $9.68 | $9.76 | |||
Average expected remaining life | 4.6 | 5.2 | |||
As of December 31, 2014, 116,666 of the ADM Warrant shares had vested.
Mitsui—In February 2013, the Company entered into a $20.0 million multi-year agreement with Mitsui & Co., Ltd. (“Mitsui”) to jointly develop a suite of triglyceride oils for use primarily in the oleochemical industry. Product development is expected to span a multi-year period, with periodic product introductions throughout the term of the joint development alliance. End use application may include renewable, high-performance polymer additives for plastic applications, aviation lubricants and toiletry and household products. Milestones within the Mitsui joint development agreement that are determined to be substantive and at risk at the inception of the arrangement are recognized as revenue upon achievement of the milestone, and are limited to those amounts for which collectability is reasonably assured. If these conditions are not met, the milestone payments are deferred and recognized as revenue over the estimated period of performance under the contract as completion of performance obligations occur. The Company recognized $1.5 million and $4.0 million of revenue related to substantive milestones achieved under the Mitsui joint development agreement during the years ended December 31, 2014 and 2013, respectively.
11. DEBT
A summary of the Company’s debt as of December 31, 2014 and 2013 is as follows (in thousands):
December 31, 2014 | December 31, 2013 | ||||||
Secured and unsecured debt | |||||||
Equipment note | $ | 6 | $ | 70 | |||
HSBC facility | — | 10,369 | |||||
Total secured and unsecured debt | 6 | 10,439 | |||||
Convertible senior subordinated notes | 211,132 | 81,779 | |||||
Total debt | 211,138 | 92,218 | |||||
Add: | |||||||
Fair value of embedded derivative | 83 | 5,914 | |||||
Less: | |||||||
Unamortized debt discount | (11,124 | ) | (4,610 | ) | |||
Current portion of debt | (6 | ) | (65 | ) | |||
Long-term portion of debt | $ | 200,091 | $ | 93,457 | |||
98
Total interest costs incurred related to the Company’s total debt was $10.0 million, $6.3 million and $0.8 million for the years ended December 31, 2014, 2013 and 2012, respectively. Total interest costs capitalized during the year ended December 31, 2014 and 2013 was $0.6 million and $1.1 million, respectively, related to the Company’s investment in the Solazyme Bunge JV, accounted for under the equity method, which had activities in progress necessary to commence its planned principal operations through May 2014. The Company was in compliance with all debt covenants as of December 31, 2014 and 2013.
Equipment Note—In June 2010, the Company entered into a secured promissory note agreement with the lessor of its headquarters under which $265,000 was borrowed to purchase equipment owned by the lessor. The loan was payable in monthly installments of principal and interest with final payment made in January 2015. Interest accrues at 9.0% and the promissory note is collateralized by the purchased equipment.
Silicon Valley Bank Term Loan—On May 11, 2011, the Company entered into a loan and security agreement with Silicon Valley Bank (“SVB”) that provided for a $20.0 million credit facility (the “SVB facility”) consisting of (i) a $15.0 million term loan that was eligible to be borrowed in one or more increments prior to November 30, 2011 and (ii) a $5.0 million revolving facility (the “SVB revolving facility”). As of December 31, 2012, $11.2 million was outstanding under the SVB facility. On March 26, 2013, the SVB facility was terminated when the Company paid in full the outstanding principal and interest on this term loan using proceeds from the revolving facility with HSBC, USA, National Association, described in “HSBC Facility” below.
Peoria Facility Note—In March 2011, the Company entered into an agreement to purchase a development and commercial production facility located in Peoria, Illinois ("Peoria Facility") for $11.5 million. This transaction closed in May 2011, and the Company paid for the aggregate purchase price with available cash and borrowed $5.5 million under a promissory note, mortgage and security agreement from the seller. The principal was paid in two lump sum payments in March 2012 and February 2013. The note was interest-free and secured by the real and personal property acquired from the seller. The assets acquired and the related note payable were recorded based upon the present value of the future payments assuming an imputed interest rate of 3.25%, resulting in a discount of $0.3 million. The $0.3 million loan discount was recognized as interest expense over the loan term utilizing the effective interest method.
HSBC Facility—In March 2013, the Company entered into a loan and security agreement with HSBC Bank, USA, National Association (“HSBC”) that provides for a $30.0 million revolving facility (the “HSBC facility”) for working capital, letters of credit denominated in U.S. dollars or a foreign currency and other general corporate purposes, and in May 2013 the Company entered into an amendment to the HSBC facility, increasing the HSBC facility amount to $35.0 million. On March 26, 2013, the Company drew down approximately $10.4 million under the HSBC facility to repay all outstanding loans plus accrued interest under the SVB facility (as defined above). The Company incurred debt issuance costs of approximately $0.2 million related to this draw down, that was recorded in other long-term assets and is being amortized to interest expense using the effective interest method over the contractual term of the loan. On June 27, 2014, the remaining outstanding balance of the HSBC facility was paid in full. A portion of the HSBC facility also supports the bank guarantee issued to BNDES in May 2013 (see Note 8). Therefore, approximately $21.9 million of the HSBC facility remained available as of December 31, 2014.
The HSBC facility is unsecured unless (i) the Company takes action that could cause or permit obligations under the HSBC facility not to constitute Senior Debt (as defined in the indenture), (ii) the Company breaches financial covenants that require the Company and its subsidiaries to maintain cash and unrestricted cash equivalents at all times of not less than $35.0 million plus 110% of the aggregate dollar equivalent amount of outstanding advances and letters of credit under the HSBC facility, or (iii) there is a payment default under the facility or bankruptcy or insolvency events relating to the Company.
Advances under the HSBC facility will bear interest at a variable interest rate based on, at the Company’s option at the time an advance is requested, either (i) the Base Rate (as defined in the HSBC facility) plus the applicable Base Rate Margin (as defined in the HSBC facility), or (ii) the Eurodollar Rate (as defined in the HSBC facility) plus the applicable Eurodollar Rate Margin (as defined in the HSBC facility). The Company pays HSBC a fee of two and one-half percent (2.50%) per annum with respect to letters of credit issued. Upon an event of default, outstanding obligations under the HSBC facility will bear interest at a rate of two percent (2.00%) per annum above the rates described in (i) and (ii) above. The original maturity date of the facility was March 26, 2015, which was extended to May 31, 2016 effective in March 2014. If on the maturity date (or earlier termination date of the HSBC facility), there are any outstanding letters of credit, the Company will be required to provide HSBC with cash collateral in the amount of (i) for letters of credit denominated in U.S. dollars, up to one hundred five percent (105%), and (ii) for letters of credit denominated in a foreign currency, up to one hundred ten percent (110%), of the dollar equivalent of the face amount of all such letters of credit plus all interest, fees and costs.
99
In addition to the financial covenants and covenants related to the indenture referenced above, the Company is subject to customary affirmative and negative covenants and events of default under the HSBC facility including certain restrictions on borrowing. If an event of default occurs and continues, HSBC may declare all outstanding obligations under the HSBC facility immediately due and payable, with all obligations being immediately due and payable without any action by HSBC upon the occurrence of certain events of default or if the Company becomes insolvent.
Convertible Senior Subordinated Notes—On January 24, 2013 the Company issued $125.0 million aggregate principal amount of 2018 Notes, which amount includes the exercise in full of the over-allotment option granted to the initial purchaser of the 2018 Notes, in a private offering to qualified institutional buyers pursuant to Rule 144A under the Securities Act of 1933, as amended. The 2018 Notes bear interest at a fixed rate of 6.00% per year, payable semiannually in arrears on August 1 and February 1 of each year, beginning on August 1, 2013. The 2018 Notes are convertible into the Company’s common stock and may be settled as described below. The 2018 Notes will mature on February 1, 2018, unless earlier repurchased or converted. The Company may not redeem the 2018 Notes prior to maturity.
The 2018 Notes are convertible at the option of the holders at any time prior to the close of business on the scheduled trading day immediately preceding February 1, 2018 into shares of the Company’s common stock at the then-applicable conversion rate. The conversion rate is initially 121.1240 shares of common stock per $1,000 principal amount of 2018 Notes (equivalent to an initial conversion price of approximately $8.26 per share of common stock). With respect to any conversion prior to November 1, 2016 (other than conversions in connection with certain fundamental changes where the Company may be required to increase the conversion rate as described below), in addition to the shares deliverable upon conversion, holders are entitled to receive an early conversion payment equal to $83.33 per $1,000 principal amount of 2018 Notes surrendered for conversion that may be settled, at the Company’s election, in cash or, subject to satisfaction of certain conditions, in shares of the Company’s common stock.
On June 19, 2014, the Company entered into note exchange agreements (the “Exchange Agreements”) with certain holders of the 2018 Notes pursuant to which such holders agreed to exchange approximately $17.5 million in aggregate principal amount of their 2018 Notes, together with accrued interest thereon through the settlement date of the Exchange Agreements, with the Company for 2,409,964 shares of the Company's common stock. The Exchange Agreements settled on June 30, 2014. As the Exchange Agreements were considered induced conversions under the applicable accounting guidance, the Company recognized $1.8 million of debt conversion expense reflected in interest expense in 2014, representing the fair value of the securities transferred in excess of the fair value of the securities issuable upon the original conversion terms of the 2018 Notes. During the years ended December 31, 2014 and 2013, $20.2 million and $43.2 million, respectively, of the 2018 Notes were converted into the Company’s common stock and were reclassified from long-term debt to stockholders’ equity in the consolidated balance sheets. During the years ended December 31, 2014 and 2013, the Company issued 2,743,475 and 5,541,597 shares of its common stock, respectively, to settle both the 2018 Note conversions and early conversion payments, including the settlements under the Exchange Agreements. The Company had $61.6 million aggregate principal amount of 2018 Notes outstanding as of December 31, 2014.
On April 1, 2014, the Company issued $149.5 million aggregate principal amount of 5.00% Convertible Senior Subordinated 2019 Notes, which amount includes the exercise in full of the over-allotment option granted to the underwriters, in a public offering pursuant to an effective shelf registration statement. The 2019 Notes bear interest at a fixed rate of 5.00% per year, payable semiannually in arrears on April 1 and October 1 of each year, beginning on October 1, 2014. The 2019 Notes are convertible into the Company's common stock and may be settled early as described below. The 2019 Notes will mature on October 1, 2019, unless earlier repurchased or converted. The Company may not redeem the 2019 Notes prior to maturity.
The 2019 Notes are convertible at the option of the holders on any day prior to and including the scheduled trading day prior to October 1, 2019. The 2019 Notes will initially be convertible at a conversion rate of 75.7576 shares of Common Stock per $1,000 principal amount of 2019 Notes (equivalent to an initial conversion price of $13.20 per share of Common Stock), subject to adjustment upon the occurrence of certain events. With respect to any conversion prior to January 1, 2018 (other than conversions in connection with certain fundamental changes where the Company may be required to increase the conversion rate as described below), in addition to the shares deliverable upon conversion, holders are entitled to receive an early conversion payment equal to $83.33 per $1,000 principal amount of 2019 Notes surrendered for conversion that may be settled, at the Company’s election, in cash or shares of Common Stock. The Company had $149.5 million aggregate principal amount of 2019 Notes outstanding as of December 31, 2014.
The net proceeds from both Note offerings were approximately $262.6 million, after deducting discounts to the initial purchaser of $10.9 million and debt issue costs of $1.0 million. Debt discounts incurred with the issuance of the Notes were recorded on the consolidated balance sheets as a reduction to the associated Note balances. The Company amortizes the debt discounts to interest expense over the contractual or expected term of the Notes using the effective interest method. Debt
100
issuance costs were recorded in other long-term assets and are being amortized to interest expense over the contractual or expected term of the Notes using the effective interest method.
The Company issued the Notes pursuant to indenture agreements by and between the Company and Wells Fargo Bank, National Association, as trustee. The indentures provide for customary events of default, including cross acceleration to certain other indebtedness of the Company and its significant subsidiaries.
If the Company undergoes a fundamental change, holders may require the Company to repurchase for cash all or part of their Notes at a purchase price equal to 100% of the principal amount of the Notes to be repurchased, plus accrued and unpaid interest to, but excluding, the fundamental change repurchase date. In addition, if certain fundamental changes occur, the Company may be required in certain circumstances to increase the conversion rate for any Notes converted in connection with such fundamental changes by a specified number of shares of its common stock.
The Company evaluated the embedded derivatives resulting from the early conversion payment features within the indenture for bifurcation from the Notes. The early conversion payment features were not deemed clearly and closely related to the Notes and were bifurcated as embedded derivatives. The Company recorded these embedded derivatives (derivative liabilities) at fair value, which are included as a component of Convertible Debt on its consolidated balance sheets with corresponding debt discounts that are netted against the principal amount of the Notes. The derivative liabilities are remeasured to fair value at each balance sheet date, with a resulting non-cash gain or loss related to the change in the fair value of the derivative liabilities being recorded in other income and expense. The Company determined the fair value of the embedded derivatives using a Monte Carlo simulation model. See Note 5.
The Notes are the general unsecured obligations of the Company and will be subordinated in right of payment to any senior debt outstanding. The Notes will be equal or senior in right of payment to any of the Company’s indebtedness other than senior debt. The Notes will effectively rank junior in right of payment to any of the Company’s secured indebtedness to the extent of the value of the assets securing such indebtedness and be structurally junior to all indebtedness and other liabilities of the Company’s subsidiaries, including trade payables.
The weighted average interest rate for total debt outstanding was 5.3% and 5.6% as of December 31, 2014 and 2013, respectively.
A summary of debt maturity follows (in thousands):
December 31, 2014 | |||
Principal due in 2015 | $ | 6 | |
Principal due in 2016 | — | ||
Principal due in 2017 | — | ||
Principal due in 2018 | 61,632 | ||
Principal due in 2019 | 149,500 | ||
Principal due in 2020 and thereafter | — | ||
Total | $ | 211,138 | |
12. COMMITMENTS AND CONTINGENCIES
Operating Lease Agreements
The Company records rent expense under its lease agreements on a straight-line basis. Differences between actual lease payments and rent expense recognized under these leases results in a deferred rent asset or a deferred rent liability at each reporting period. The Company had a deferred rent liability of $2.5 million as of December 31, 2014 and a deferred rent asset of $3.6 million and a deferred rent liability of $0.3 million as of December 31, 2013.
The Company currently leases 106,000 square feet of office and laboratory space located in two buildings on adjacent properties in South San Francisco (“SSF”), California. The term of the current lease will end in January 2018. This lease agreement includes scheduled rent increases over the lease term, and the Company was required to provide the landlord with letters of credit amounting to $0.7 million, which was recorded to restricted certificates of deposit in the consolidated balance sheets as of December 31, 2014. In addition, the landlord will reimburse the Company up to $1.6 million of improvements to the leased property, subject to certain requirements. This reimbursement is considered a lease incentive and shall be recognized
101
as a deferred lease incentive liability and recognized as a reduction of rent expense by the Company on a straight-line basis over the term of the lease.
In September 2014, the Company entered into a new lease agreement for approximately 5,000 square feet of office space located in Glendale, California. The term of the Glendale lease commenced in December 2014 and ends in December 2017.
The Company also leases office and laboratory space in Brazil. The term of the lease is five years, and the lease commenced on April 1, 2011 and expires on April 1, 2016. The rent is currently 35,300 Brazilian Real (approximately $13,000 based on the exchange rate at December 31, 2014) per month and is subject to an annual inflation adjustment. The Company pays its proportionate share of operating expenses. The Company may cancel this lease agreement at any time, but would be subject to paying the lessor the maximum of a three month rent penalty. This lease will be terminated in 2015, as part of the 2014 Restructuring Plan (See Note 3).
The Company entered into several auto lease agreements during the years ended December 31, 2013 and 2014. These lease agreements contain early cancellation penalties ranging from 50% -80% of their remaining lease values. The remaining value of the leases as of December 31, 2014 was 0.2 million Brazilian Real (approximately $0.1 million based on the exchange rate at December 31, 2014). Certain of these auto lease agreements will be terminated in 2015, as part of the 2014 Restructuring Plan (See Note 3).
The Company entered into a Strategic Collaboration Agreement with ADM in November 2012 (See Note 10). The Company pays ADM annual fees for the use and operation of a portion of the Clinton Facility, a portion which may be paid in the Company’s common stock. During the year ended December 31, 2013, the Company made two payments to ADM in both cash and by issuing 770,761 shares of its common stock, which was recorded to deferred rent asset and equity. The common stock and cash payments made under the Strategic Collaboration Agreement are accounted for as an operating lease. In January 2013, the Company granted the ADM Warrant to purchase 500,000 shares of the Company’s common stock, which vests in equal monthly installments over five years, commencing in November 2013. In addition, the Company shall grant to ADM the ADM Extension Warrant covering an additional 500,000 shares of the Company’s common stock upon the extension of the Collaboration Agreement for each further five year term, which shall vest in equal monthly installments over the applicable five year extension term. The exercise price of the ADM Warrant is $7.17 per share and expires in January 2019. In July 2013, the measurement date for the ADM Warrant was established (See Note 10).
Downstream processing of products produced at the Clinton Facility is performed at the Galva Facility. The Company entered into a Manufacturing Services and Facility Licensing Agreement (“Manufacturing and Facility Agreement”) in June 2013 with a wholly owned subsidiary of ANP for the use and operation of the Galva Facility, a portion of which may be paid in the Company’s common stock. As of December 31, 2014 no payments under the Manufacturing and Facility Agreement had been made in common stock. The cash payments under the Manufacturing and Facility Agreement are accounted for as an operating lease.
Future minimum lease payments under non-cancellable operating leases are as follows as of December 31, 2014 (in thousands):
Year ending December 31, | |||
2015 | $ | 10,738 | |
2016 | 4,388 | ||
2017 | 4,512 | ||
2018 | 366 | ||
2019 | — | ||
2020 and thereafter | — | ||
Total minimum lease payments | $ | 20,004 | |
Rent expense was $10.5 million, $7.1 million and 2.8 million for the years ended December 31, 2014, 2013 and 2012, respectively.
Contractual Obligations—As of December 31, 2014 the Company had non-cancelable purchase obligations of $0.8 million.
102
The Company has various manufacturing, research, and other contracts with vendors in the conduct of the normal course of its business. All contracts are terminable with varying provisions regarding termination. If a contract with a specific vendor were to be terminated, the Company would only be obligated for the products or services that the Company had received at the time the termination became effective.
Guarantees and Indemnifications—The Company makes certain indemnities, commitments, and guarantees under which it may be required to make payments in relation to certain transactions. The Company, as permitted under Delaware law and in accordance with its amended and restated certificate of incorporation and amended and restated bylaws, indemnifies its officers and directors for certain events or occurrences, subject to certain limits, while the officer or director is or was serving at the Company’s request in such capacity. The duration of these indemnifications, commitments, and guarantees varies and, in certain cases, is indefinite. The maximum amount of potential future indemnification is unlimited; however, the Company has a director and officer insurance policy that may enable it to recover all or a portion of any future amounts paid. The Company believes the fair value of these indemnification agreements is minimal. The Company has not recorded any liability for these indemnities in the accompanying consolidated balance sheets. However, the Company accrues for losses for any known contingent liability, including those that may arise from indemnification provisions, when future payment is probable. No such losses have been recorded to date.
In February 2013, the Solazyme Bunge JV entered into a loan agreement with BNDES under which it may borrow up to R$245.7 million (approximately USD $91.4 million based on the exchange rate as of December 31, 2014) which has supported the production facility in Brazil, including a portion of the construction costs of the facility. As a condition of the Solazyme Bunge JV drawing funds under the BNDES Loan, the Company may be required to provide a bank guarantee and a corporate guarantee for a portion of the BNDES Loan (in an amount not to exceed its ownership percentage in the Solazyme Bunge JV). As of December 31, 2014 the bank guarantee was in place and the corporate guarantee was not. See also Note 8.
On December 17, 2013, the Solazyme Bunge JV entered into a Loan Facility Agreement with Bunge Alimentos S.A. (the “Loan Facility”). The Company agreed to guarantee repayment of 50% of the portion of the Loan Facility to be utilized for operational expenses, up to maximum aggregate advances of $5.0 million. As of March 31, 2014, a total of $10.0 million (of which the Company is the guarantor of $5.0 million) had been drawn down under the Loan Facility. As of December 31, 2013, the Company had no outstanding obligation recorded related to this corporate guarantee because the fair value of the obligation is immaterial. Outstanding advances guaranteed by the Company were paid off in full by the Solazyme Bunge JV on April 8, 2014.
Legal Matters—The Company may be involved, from time to time, in legal proceedings and claims arising in the ordinary course of its business. Such matters are subject to many uncertainties and outcomes are not predictable with assurance. The Company accrues amounts, to the extent they can be reasonably estimated, that it believes are adequate to address any liabilities related to legal proceedings and other loss contingencies that the Company believes will result in a probable loss that is reasonably estimable.
On November 28, 2014 Roquette filed an action against the Company in U.S. District Court for the District of Delaware for declaratory judgment related to the Roquette Arbitration (see below). Roquette seeks a declaration that (i) the arbitrators in the Roquette Arbitration exceeded their authority by failing to render a timely arbitration award, (ii) any award issued by the arbitrators is void and (iii) all intangible assets of SRN should be assigned jointly to Roquette and the Company. Other than seeking its attorney fees and costs in the action, Roquette did not make any monetary claims against the Company. The Company filed an Answer to the Complaint in January 2015, denying substantially all of Roquette’s claims and all of its prayers for relief.
In September 2013, an arbitration was initiated with Roquette (the “Roquette Arbitration”) in connection with the dissolution of SRN. The Company sought a declaration that, in accordance with the terms of the joint venture agreement between the parties, the Company should be assigned all improvements made by or on behalf of SRN to the Company’s intellectual property, including all patent applications filed by SRN. The initial phase of the arbitration hearing was held from September 25, 2014 through October 2, 2014 after which the hearing continued with additional briefs, discovery and motions. The arbitration panel issued its decision on February 19, 2015. Refer to update on this matter in Note 18.
In July 2012, a complaint was filed in the Los Angeles Superior Court by Therabotanics, LLC and Solabotanics, LLC against the Company, Sephora USA, Inc. and the Company's Senior Vice President Frederic Stoeckel alleging various causes of action in connection with the Company’s joint venture with Therabotanics. The Plaintiffs alleged that the Company misappropriated assets of the joint venture and failed to produce an infomercial with the joint venture. The Plaintiffs claimed unspecified damages and injunctive relief. In June 2013, the Company filed an Answer in which it denied each and every allegation made by the Plaintiffs in their Complaint and filed a Cross-Complaint against Therabotanics and certain named
103
individuals. In January 2014, the Plaintiffs filed a Third Amended Complaint in which the Company's Chief Executive Officer, Jonathan Wolfson, and Sephora, S.A. were added as additional defendants. In September 2014 the parties agreed to settle the litigation in exchange for a settlement payment from the Company to Therabotanics of $4.8 million, which was paid in October 2014. During the year ended December 31, 2014, the Company recorded $4.8 million of litigation expense to sales, general and administrative expenses in its consolidated statements of operations. As part of the settlement the Company denied all claims made by the Plaintiffs and all parties granted releases to all other parties. The Company maintains corporate insurance and the insurer reimbursed a portion of both the litigation settlement and external legal fees in the amount of $0.4 million ($0.3 million for portion of the litigation settlement and $0.1 million for external legal fees) during the year ended December 31, 2014.
The Company may be involved, from time to time, in additional legal proceedings and claims arising in the ordinary course of its business. Such matters are subject to many uncertainties and outcomes are not predictable with assurance. While there can be no assurances as to the ultimate outcome of any legal proceeding or other loss contingencies involving the Company, management does not believe any pending matters individually and in the aggregate will be resolved in a manner that would have a material effect on the Company’s consolidated financial position, results of operations or cash flows.
13. COMMON STOCK
Initial Public Offering—On June 2, 2011, the Company completed its initial public offering issuing 12,021,250 shares of common stock at an offering price of $18.00 per share, resulting in net proceeds to the Company of $201.2 million.
Shelf Registration—In February 2014, the Company filed a shelf registration statement whereby securities may be offered by the Company or by selling security holders in amounts, at prices and on terms determined at the time of the offering.
Common Stock—As of December 31, 2010, under the Company’s Certificate of Incorporation, as amended, the Company was authorized to issue 60 million shares of common stock with a par value of $0.001 per share. In connection with the closing of the initial public offering, on June 2, 2011, the Company amended and restated its certificate of incorporation to increase its authorized number of shares of common stock to 150 million and authorize the issuance of 5 million shares of preferred stock. The holder of each share of common stock is entitled to one vote. The board of directors has the authority, without action by its stockholders, to designate and issue shares of preferred stock in one or more series and to fix the rights, preferences, privileges and restrictions thereof. The Company’s amended and restated certificate of incorporation provides that the Company’s board of directors will be divided into three classes, with staggered three-year terms and provides that all stockholder actions must be effected at a duly called meeting of the stockholders and not by consent in writing. The amended and restated certificate of incorporation also provides that only the board of directors may call a special meeting of the stockholders and requires a 66.67% stockholder vote for the adoption, amendment or repeal of any provision of the Company’s amended and restated bylaws and for the amendment or repeal of certain provisions of the Company’s amended and restated certificate of incorporation.
In January 2013 and November 2013, the Company issued 347,483 shares and 423,278 shares, respectively, of its common stock to ADM pursuant to the Company’s Collaboration Agreement with ADM (see Note 10). The common stock issued to ADM in January 2013 was registered pursuant to the Company’s registration statement on Form S-3, which was declared effective on January 23, 2013.
On April 1, 2014, the Company issued 5,750,000 shares of its common stock, par value $0.001 per share, at $11.00 per share (the "Common Stock Offering"). The net proceeds from the Common Stock Offering were approximately $59.2 million, after deducting underwriter discounts and commissions and estimated offering expenses payable by the Company.
During the years ended December 31, 2014 and 2013, $20.2 million and $43.2 million, respectively, of the 2018 Notes were been converted into the Company’s common stock and were reclassified from long-term debt to stockholders’ equity in the consolidated balance sheets. The Company settled the early conversion payments in shares of the Company’s common stock. The Company issued 2,743,475 and 5,541,597 shares of its common stock to settle both the 2018 Note conversions and early conversion payments, including the settlements under the Exchange Agreements, during the years ended December 31, 2014 and 2013, respectively (see Note 11).
Common Stock Warrants— In May 2011, the Company granted Bunge a warrant to purchase 1,000,000 shares of the Company’s common stock at an exercise price of $13.50 per share. As of December 31, 2014, 750,000 of the warrant shares had vested and the remaining 250,000 warrant shares could no longer vest. Refer to Note 8 for a description of the vesting terms and a discussion of the accounting for the Bunge Warrant.
104
In January 2013, the Company granted ADM a warrant to purchase 500,000 shares of the Company’s common stock at an exercise price of $7.17 per share. The warrant vests in equal monthly installments over five years, commencing in November 2013 and the warrant expires in January 1, 2019. As of December 31, 2014, 116,666 of the warrant shares had vested. See Note 10.
14. STOCK-BASED COMPENSATION
Second Amended and Restated 2004 Equity Incentive Plan—The Company’s Second Amended and Restated Equity Incentive Plan (the “2004 EIP”) was adopted by the Board of Directors in February 2008 (termination date of January 4, 2014). Pursuant to the 2004 EIP, the Company may grant options, restricted stock and stock purchase rights to employees, directors, or consultants of the Company. Options granted may be either incentive stock options or nonstatutory stock options. Incentive stock options may be granted to employees (including offices and directors, who are also employees). Nonstatutory stock options may be granted to employees, directors or consultants. In March 2011, the Company’s Board of Directors approved a 2,000,000 increase in the options reserved for issuance under the Company’s 2004 EIP. On May 25, 2011, in conjunction with the Company’s initial public offering, the 2004 EIP terminated so that no further awards may be granted under the 2004 EIP. Although the 2004 EIP terminated, all outstanding awards will continue to be governed by their existing terms.
2011 Equity Incentive Plan—On May 26, 2011, the Company’s 2011 Equity Incentive Plan (the “2011 EIP”, and together with the 2004 EIP (the “Plans”)) became effective. The Company initially reserved 7,000,000 shares of common stock for issuance under the 2011 EIP. Starting on May 26, 2011, any shares subject to outstanding awards granted under the 2004 EIP that expire or terminate for any reason prior to the issuance of shares shall become available for issuance under the 2011 EIP. The 2011 EIP also provides for automatic annual increases in the number of shares reserved for future issuance, and during the year ended December 31, 2014 an additional 3,437,373 shares were reserved under the 2011 EIP as a result of this provision. As of December 31, 2014 there were 3,358,555 shares available for issuance under the 2011 EIP.
Options under the Plans may be granted for periods up to ten years. All options issued to date have had up to a ten year life. The exercise price of incentive and nonstatutory stock options shall not be less than 100% of the fair market value of the shares on the date of grant. The Board of Directors determines the vesting period of stock-based awards. The Company’s stock options generally vest over four years. Restricted stock awards are subject to forfeiture if certain vesting requirements are not met. The Company issues new common stock from authorized shares upon the exercise of stock options.
2011 Employee Stock Purchase Plan—On May 26, 2011, the Company’s 2011 Employee Stock Purchase Plan (the “2011 ESPP”) became effective. The Company initially reserved 750,000 shares of common stock for issuance under the 2011 ESPP. The purchase price of the common stock under the Employee Stock Purchase Plan is 85% of the lower of the fair market value of a share of common stock on the first day of the offering period or the last day of the purchase period. The 2011 ESPP also provides for automatic annual increases in the number of shares reserved for future issuance, and during the year ended December 31, 2014 an additional 687,474 shares were reserved under the 2011 ESPP as a result of this provision. As of December 31, 2014 there were 2,213,236 shares available for issuance under the 2011 ESPP.
The Company recognized stock-based compensation expense related to its 2011 ESPP of $0.7 million, $0.6 million and $0.3 million for the years ended December 31, 2014, 2013 and 2012, respectively.
105
Stock Options
A summary of the Company’s stock option activity under the Plans and related information is as follows:
Number of Options | Weighted Average Exercise Price | Weighted Average Remaining Contractual Term (in years) | Aggregate Intrinsic Value(1) | |||||||||
(in thousands) | ||||||||||||
Balance at December 31, 2013 | 9,957,367 | $ | 8.72 | 7.7 | 28,262 | |||||||
Granted | 6,660,014 | 7.09 | ||||||||||
Exercised | (1,147,572 | ) | 6.54 | |||||||||
Forfeited, canceled or expired | (1,729,605 | ) | 11.03 | |||||||||
Balance at December 31, 2014 | 13,740,204 | $ | 7.82 | 7.7 | $ | 1,680 | ||||||
Options vested and exercisable at December 31, 2014 | 6,973,203 | $ | 8.85 | 6.7 | $ | 1,299 | ||||||
Options vested and expected to vest as of December 31, 2014 | 12,572,909 | $ | 7.92 | $ | 1,615 | |||||||
(1) | The aggregate intrinsic value represents the value by which the Company’s closing stock price on the last trading day of the year ended December 31, 2014 exceeds the exercise price of the stock multiplied by the number of options outstanding or exercisable, excluding any that have a negative intrinsic value. |
The weighted-average grant date fair value of options granted was $3.98, $5.07 and $6.46 for the years ended December 31, 2014, 2013 and 2012, respectively. The total intrinsic value of options exercised was $5.8 million, $7.5 million and $7.4 million for the years ended December 31, 2014, 2013 and 2012, respectively.
The total fair value of options vested was $14.7 million, $12.9 million and $11.1 million for the years ended December 31, 2014, 2013 and 2012, respectively.
The following table presents the composition of options outstanding and vested and exercisable as of December 31, 2014:
Options Outstanding | Options Vested and Exercisable | ||||||||||||||||
Range of Exercise Prices | Number of Options | Weighted Average Exercise Price | Weighted Average Remaining Contractual Term (in years) | Number of Vested and Exercisable Options | Weighted Average Exercise Price | Weighted Average Remaining Contractual Term (in years) | |||||||||||
$0.001-1.01 | 563,040 | $ | 0.58 | 3.5 | 563,040 | $ | 0.58 | 3.7 | |||||||||
$2.35-2.47 | 3,934,599 | 2.44 | 9.1 | 753,523 | 2.35 | 5.6 | |||||||||||
$6.79-8.92 | 3,457,139 | 7.95 | 7.0 | 2,405,843 | 7.93 | 6.7 | |||||||||||
$9.03-11.59 | 3,725,713 | 10.77 | 7.8 | 2,060,506 | 10.92 | 7.7 | |||||||||||
$11.61-27.03 | 2,059,713 | 14.53 | 7.2 | 1,190,291 | 15.17 | 7.4 | |||||||||||
Totals | 13,740,204 | 7.82 | 7.7 | 6,973,203 | 8.85 | 6.7 | |||||||||||
Stock-based compensation expense related to stock-based awards granted to employees and nonemployees were allocated to research and development and sales, general and administrative expense as follows (in thousands):
Year ended December 31, | |||||||||||
2014 | 2013 | 2012 | |||||||||
Research and development | 7,407 | 5,917 | 3,924 | ||||||||
Sales, general and administrative | 18,142 | 12,736 | 11,478 | ||||||||
Total | $ | 25,549 | $ | 18,653 | $ | 15,402 | |||||
No income tax benefits have been recognized related to stock-based compensation expense for the years ended December 31, 2014, 2013 and 2012.
106
Employee Stock-Based Compensation—Stock-based compensation expense was $23.9 million, $17.3 million and $13.2 million for the years ended December 31, 2014, 2013 and 2012, respectively, for stock-based awards granted to employees. There was unrecognized stock-based compensation cost of $18.4 million related to nonvested stock options granted to employees as of December 31, 2014, and the Company expects to recognize this cost over a weighted-average period of 1.8 years as of December 31, 2014. The grant date fair value of employee stock-based awards was estimated using the following weighted-average assumptions:
Year ended December 31, | |||||
2014 | 2013 | 2012 | |||
Expected term (in years) | 5.3-6.0 | 5.1-6.0 | 5.3-6.0 | ||
Volatility | 51.4%-68.2% | 60.1%-61.5% | 62.8%-68.0% | ||
Risk-free interest rate | 1.58%-2.0% | 0.8%-2.1% | 0.6%-1.3% | ||
Dividend yield | —% | —% | —% | ||
Nonemployee Stock-Based Compensation—Stock-based compensation expense was $1.7 million, $1.4 million and $2.2 million for the years ended December 31, 2014, 2013 and 2012, respectively, for stock-based awards granted to nonemployees. There was unrecognized stock-based compensation cost of approximately $1.1 million related to nonvested stock options granted to nonemployees as of December 31, 2014, and the Company expects to recognize this cost over a weighted-average period of 1.1 years as of December 31, 2014. The fair value of non-employee stock-based awards was estimated using the following weighted-average assumptions:
Year ended December 31, | |||||
2014 | 2013 | 2012 | |||
Expected term (in years) | 8.3-8.6 | 7.8-8.9 | 8.5-8.9 | ||
Volatility | 53.2%-64.1% | 60.4%-60.9% | 60.3%-64.8% | ||
Risk-free interest rate | 2.0%-2.5% | 1.6%-2.8% | 1.3%-1.9% | ||
Dividend yield | —% | —% | —% | ||
Restricted Stock Awards—A summary of the Company’s restricted stock award activity is as follows:
Number of Shares | Weighted Average Grant Date Fair Value | |||||
Unvested at December 31, 2013 | 1,168 | 23.47 | ||||
Granted | — | — | ||||
Vested | (1,168 | ) | 23.47 | |||
Forfeited or canceled | — | — | ||||
Unvested at December 31, 2014 | 0 | $ | — | |||
There was no unrecognized stock-based compensation costs related to nonvested restricted stock awards as of December 31, 2014.
Restricted Stock Units—A summary of the Company's restricted stock unit activity is as follows:
107
Number of Shares | Weighted Average Grant Date Fair Value | |||||
Unvested at December 31, 2013 | 1,771,907 | 9.56 | ||||
Granted | 1,357,694 | 11.86 | ||||
Vested | (821,422 | ) | 9.38 | |||
Canceled | (495,847 | ) | 11.24 | |||
Unvested at December 31, 2014 | 1,812,332 | $ | 10.91 | |||
Stock-based compensation expense related to RSUs was $8.6 million, $5.5 million and $1.5 million for the years ended December 31, 2014, 2013 and 2012, respectively.
Performance-Based Restricted Stock Units—As of December 31, 2013, 100,000 shares of performance-based restricted stock units (“PSUs”) were unvested. During the year ended December 31, 2014, 100,000 shares of unvested PSUs were canceled, and there were no shares of unvested PSUs as of December 31, 2014. No additional PSUs were granted during the year ended December 31, 2014, and there was no stock-based compensation expense related to PSUs recorded during the year-ended December 31, 2014.
Stock Option Modification—In October 2014, the Company modified an employee’s stock options which resulted in the Company recording $2.3 million of additional stock-based compensation expense in the year ended December 31, 2014.
15. INCOME TAXES
The Company has incurred net operating losses for the years ended December 31, 2014, 2013 and 2012, and therefore has no provision for income taxes recorded for such years. The Company had federal, state and foreign net operating loss carryforwards of $386.4 million, $301.6 million and $12.2 million, respectively, as of December 31, 2014. Federal net operating loss carryforwards expire beginning in 2024 and state net operating loss carryforwards expire beginning in 2015, if not utilized. The Company had federal and state research and development tax credit carryforwards of $5.3 million and $3.2 million, respectively, as of December 31, 2014. The federal research and development tax credit carryforwards will expire starting in 2028 if not utilized. The state research and development tax credit carryforwards can be carried forward indefinitely.
Utilization of the net operating loss and research and development credit carryforwards may be subject to an annual limitation due to the ownership percentage change limitations provided by Section 382 of the Internal Revenue Code and similar state provisions. The annual limitation may result in the expiration of the net operating losses and research and development credit carryforwards before utilization.
108
The components of loss before income taxes are as follows for the years ended December 31, 2014, 2013 and 2012 (in thousands):
Years Ending December 31, | |||||||||||
2014 | 2013 | 2012 | |||||||||
United States | $ | (159,370 | ) | $ | (111,791 | ) | $ | (76,755 | ) | ||
Foreign | (2,771 | ) | (4,598 | ) | (6,377 | ) | |||||
Loss before income taxes | $ | (162,141 | ) | $ | (116,389 | ) | $ | (83,132 | ) | ||
The tax effects of temporary differences and carry forwards that give rise to significant portions of the deferred tax assets are as follows (in thousands):
December 31, | |||||||
2014 | 2013 | ||||||
Net operating loss carry forwards | $ | 140,185 | $ | 89,491 | |||
Capitalized start-up costs | 8,051 | 9,406 | |||||
Research and development credits | 5,603 | 3,896 | |||||
Stock compensation | 10,630 | 9,390 | |||||
Other | 6,634 | 4,787 | |||||
Total deferred tax assets | 171,103 | 116,970 | |||||
Valuation allowance | (166,180 | ) | (114,337 | ) | |||
Deferred tax liability—fixed assets | (3,346 | ) | (2,633 | ) | |||
Deferred tax liability—derivative liability | (1,577 | ) | — | ||||
Net deferred tax assets, after valuation allowance | $ | — | $ | — | |||
The Company is tracking the portion of its deferred tax assets attributable to excess stock option benefits in accordance with FASB ASC 718-740-45, Other Presentation Matters, and therefore, these amounts are not included in the Company’s deferred tax assets. The deferred tax assets attributable to excess stock option benefits total $6.6 million at December 31, 2014, and the benefit related thereto will only be recognized when it reduces cash taxes payable.
The Company’s deferred tax assets represent an unrecognized future tax benefit. The Company has provided a full valuation allowance on its deferred tax assets as of December 31, 2014, as management believes it is more likely than not that the related deferred tax asset will not be realized. The net valuation allowance increased by $51.8 million and $44.8 million during the years ended December 31, 2014 and 2013, respectively. At such time as it is determined that it is more likely than not that the deferred tax assets are realizable, the valuation allowance will be reduced. The reported amount of income tax expense differs from the amount that would result from applying the domestic federal statutory tax rate to pretax losses primarily because of changes in the valuation allowance.
109
Reconciling items from income tax computed at the statutory federal rate for the years ended December 31, 2014, 2013 and 2012, were as follows:
Years Ending December 31, | ||||||||
2014 | 2013 | 2012 | ||||||
Federal income tax statutory rate | 34.0 | % | 34.0 | % | 34.0 | % | ||
State income taxes, net of federal benefits | 1.6 | 4.1 | 4.5 | |||||
Revalued common and preferred stock warrants | 0.1 | — | 0.9 | |||||
Revalued derivative liability | 0.6 | (1.8 | ) | — | ||||
Incentive stock option compensation | (1.3 | ) | (1.6 | ) | (1.9 | ) | ||
Research tax credits | 0.8 | 1.6 | — | |||||
Other | 0.2 | 1.9 | (0.1 | ) | ||||
Valuation allowance | (36.0 | )% | (38.2 | )% | (37.4 | )% | ||
Effective income tax rate | — | % | — | % | — | % | ||
Uncertain Tax Positions
A reconciliation of the beginning and ending amount of unrecognized tax benefits is as follows (in thousands):
Balance as of December 31, 2011 | $ | 435 | |
Addition based on tax positions related to current year | 89 | ||
Additions based on tax positions related to prior year | 95 | ||
Balance as of December 31, 2012 | 619 | ||
Addition based on tax positions related to current year | 441 | ||
Additions based on tax positions related to prior year | 428 | ||
Balance as of December 31, 2013 | 1,488 | ||
Addition based on tax positions related to current year | 6,411 | ||
Additions based on tax positions related to prior year | 4,042 | ||
Balance as of December 31, 2014 | $ | 11,941 | |
The Company’s policy is to include interest and penalties related to unrecognized tax benefits within the provision for income taxes. Management has determined that no accrual for interest and penalties was required as of December 31, 2014. The Company does not anticipate the total amounts of unrecognized tax benefits will significantly increase or decrease in the next twelve months.
The Company is subject to taxation in the U.S., various states and a foreign jurisdiction. As of December 31, 2014, the Company’s tax years 2004 and thereafter remain subject to examination by the tax authorities.
16. EMPLOYEE BENEFIT PLAN
In January 2007, the Company adopted a 401(k) plan for its employees whereby eligible employees may contribute up to 90% of their compensation, on a pretax basis, subject to the maximum amount permitted by the Internal Revenue Code. The Company has not contributed to, nor is it required to contribute to, the 401(k) plan since its inception.
110
17. SELECTED QUARTERLY FINANCIAL DATA (Unaudited)
The following table provides the selected quarterly financial data for 2014 and 2013 (in thousands, except per share amounts):
SOLAZYME, INC.
CONDENSED CONSOLIDATED STATEMENTS OF OPERATIONS
(Unaudited)
Quarter Ended | |||||||||||||||||||||||||||||||
December 31, 2014 | September 30, 2014 | June 30, 2014 | March 31, 2014 | December 31, 2013 | September 30, 2013 | June 30, 2013 | March 31, 2013 | ||||||||||||||||||||||||
Revenues: | |||||||||||||||||||||||||||||||
Product revenue | $ | 9,353 | $ | 11,623 | $ | 9,022 | $ | 7,348 | $ | 6,250 | $ | 4,797 | $ | 4,915 | $ | 4,000 | |||||||||||||||
Research and development programs | 5,149 | 5,936 | 6,917 | 5,043 | 5,024 | 5,824 | 6,260 | 2,680 | |||||||||||||||||||||||
Total revenues | 14,502 | 17,559 | 15,939 | 12,391 | 11,274 | 10,621 | 11,175 | 6,680 | |||||||||||||||||||||||
Costs and operating expenses: | |||||||||||||||||||||||||||||||
Cost of product revenue | 6,154 | 6,598 | 4,470 | 3,390 | 1,985 | 1,450 | 1,496 | 1,454 | |||||||||||||||||||||||
Research and development | 18,210 | 20,571 | 22,064 | 20,835 | 20,381 | 17,556 | 14,915 | 13,720 | |||||||||||||||||||||||
Sales, general and administrative | 22,139 | 25,883 | 21,637 | 20,607 | 16,923 | 15,708 | 15,436 | 14,866 | |||||||||||||||||||||||
Restructuring charges | 3,514 | — | — | — | — | — | — | — | |||||||||||||||||||||||
Total costs and operating expenses | 50,017 | 53,052 | 48,171 | 44,832 | 39,289 | 34,714 | 31,847 | 30,040 | |||||||||||||||||||||||
Loss from operations | (35,515 | ) | (35,493 | ) | (32,232 | ) | (32,441 | ) | (28,015 | ) | (24,093 | ) | (20,672 | ) | (23,360 | ) | |||||||||||||||
Other income (expense): | |||||||||||||||||||||||||||||||
Interest and other (expense) income net | (3,205 | ) | (3,188 | ) | (4,662 | ) | (1,112 | ) | (1,191 | ) | (1,614 | ) | (1,439 | ) | (1,523 | ) | |||||||||||||||
Loss from equity method investment | (7,724 | ) | (7,201 | ) | (4,278 | ) | (3,834 | ) | (2,696 | ) | (2,360 | ) | (2,222 | ) | (959 | ) | |||||||||||||||
Gain (loss) from change in fair value of warrant liability | — | — | — | 688 | 572 | 200 | (679 | ) | 54 | ||||||||||||||||||||||
Gain (loss) from change in fair value of derivative liability | 1,578 | 6,205 | (1,745 | ) | 2,018 | (2,006 | ) | (2,836 | ) | (813 | ) | (737 | ) | ||||||||||||||||||
Total other income (expense) | (9,351 | ) | (4,184 | ) | (10,685 | ) | (2,240 | ) | (5,321 | ) | (6,610 | ) | (5,153 | ) | (3,165 | ) | |||||||||||||||
Net loss | $ | (44,866 | ) | $ | (39,677 | ) | $ | (42,917 | ) | $ | (34,681 | ) | $ | (33,336 | ) | $ | (30,703 | ) | $ | (25,825 | ) | $ | (26,525 | ) | |||||||
Net loss per share: | |||||||||||||||||||||||||||||||
Basic and diluted | $ | (0.57 | ) | $ | (0.50 | ) | $ | (0.56 | ) | $ | (0.50 | ) | $ | (0.49 | ) | $ | (0.47 | ) | $ | (0.42 | ) | $ | (0.43 | ) | |||||||
Weighted-average number of shares used in loss per share computation: | |||||||||||||||||||||||||||||||
Basic and diluted | 79,330 | 78,867 | 75,963 | 69,213 | 68,453 | 64,812 | 61,958 | 61,543 | |||||||||||||||||||||||
111
18. SUBSEQUENT EVENT
Employee Stock Option Exchange Program—In January 2015, the Company commenced an exchange offer to allow employees the opportunity to exchange, on a grant-by-grant basis, their outstanding eligible options that have an exercise price per share that is equal to or greater than $6.79 for new stock options on a two-for-one basis that the Company granted under its 2011 EIP. Generally, all employees with options were eligible to participate in the program, which expired at 9:00 p.m. Pacific Time on February 18, 2015. Non-employee members of Solazyme’s Board of Directors were not eligible to participate. Each new stock option has an exercise price of $2.58, the last reported sale price per share of Solazyme common stock on the NASDAQ Global Select Market on the new stock option grant date, which was February 19, 2015.
Each new stock option has a maximum term that is equal to the remaining term of the corresponding eligible option. Each new stock option has the same final vesting date as the corresponding eligible option. Each new stock option has the same rate of vesting, from the same vesting commencement date, as the corresponding eligible option, provided that any vesting that would have occurred prior to January 1, 2016 will cumulate and cliff vest on January 1, 2016. This is the case even if the eligible options were fully vested on the date of the exchange. The optionee must be employed by the Company on January 1, 2016 to benefit from this new option cliff vest.
On February 19, 2015, the Company granted new options to eligible options holders to purchase 2,745,279 shares of common stock in exchange for the cancellation of the tendered options. The Company expects to record a charge of approximately $0.5 million associated with the stock option modification over the vesting periods of the new options which range from ten months to four years. This modification charge will be recorded as additional stock-based compensation expense beginning in the first quarter of 2015. This modification charge is estimated assuming an exchange price of $2.58.
Roquette Arbitration Decision—On February 3, 2015, Roquette filed a second action against the Company in U.S. District Court for the District of Delaware for declaratory judgment related to the Roquette Arbitration. Roquette seeks a declaration that (A) the order of the arbitrators in the Roquette Arbitration for more discovery and new hearings is unenforceable and (B) in the alternative, the proposed new discovery and hearings concerns an issue that is outside the scope of the arbitration. Other than seeking its attorney fees and costs in the action, Roquette did not make any monetary claims against the Company. On February 12, 2015 the two Delaware actions were consolidated. The Company filed its Answer to the second Complaint on February 26, 2015, denying all claims made in the Complaint and all related prayers for relief. In addition, the Company cross-claimed for (x) confirmation of the arbitration award, (y) an order compelling Roquette to comply with the arbitration award and (z) damages for misappropriation of the Company’s trade secrets, misuse of the Company’s confidential information and breach of contract.
In September 2013, an arbitration was initiated with Roquette (the “Roquette Arbitration”) in connection with the dissolution of SRN. The Company sought a declaration that, in accordance with the terms of the joint venture agreement between the parties, the Company should be assigned all improvements made by or on behalf of SRN to the Company’s intellectual property. On February 19, 2015 the arbitration panel released its decision, ordering, inter alia, the assignment to the Company of (i) all SRN patent applications, (ii) all SRN know-how related to high lipid algal flour and high protein algal powder and (iii) all Roquette patent applications filed since November 2010 relating to algal food and food ingredients, as well as methods for making and using them. In addition the arbitration panel ordered Roquette to pay to the Company, $2.3 million in legal costs and fees. This award for payment of legal costs and fees is considered a gain contingency and will be recognized when such payment is received.
112
Item 9. Changes in and Disagreements with Accountants on Accounting and Financial Disclosures.
None.
Item 9A. Controls and Procedures.
Our management, including our Chief Executive Officer and Chief Financial Officer, evaluated the effectiveness of our disclosure controls and procedures as of December 31, 2014. The term “disclosure controls and procedures,” as defined in Rules 13a-15(e) and 15d-15(e) under the Exchange Act, means controls and other procedures of a company that are designed to ensure that information required to be disclosed by us in the reports that we file or submit under the Exchange Act is recorded, processed, summarized and reported within the time periods specified in the SEC’s rules and forms. Disclosure controls and procedures include, without limitation, controls and procedures designed to ensure that information required to be disclosed by us in the reports that we file or submit under the Exchange Act is accumulated and communicated to our management, including our Chief Executive Officer and Chief Financial Officer, as appropriate, to allow timely decisions regarding required disclosure. In designing and evaluating the disclosure controls and procedures, management recognizes that any controls and procedures, no matter how well designed and operated, can provide only reasonable, and not absolute, assurance of achieving the desired objectives. In reaching a reasonable level of assurance, management necessarily applies its judgment in evaluating the cost-benefit relationship of possible controls and procedures. Based on this evaluation, our Chief Executive Officer and Chief Financial Officer concluded that our disclosure controls and procedures were effective as of December 31, 2014 at the reasonable assurance level.
Management’s Report on Internal Control over Financial Reporting
Our management is responsible for establishing and maintaining adequate internal control over financial reporting, as such term is defined in Exchange Act Rules 13a-15(f) and 15d-15(f). Under the supervision and with the participation of our management, including our Chief Executive Officer and Chief Financial Officer, we conducted an evaluation of the effectiveness of our internal control over financial reporting as of December 31, 2014 based on the guidelines established in Internal Control—Integrated Framework (1992) issued by the Committee of Sponsoring Organizations of the Treadway Commission (COSO). Our internal control over financial reporting includes policies and procedures that provide reasonable assurance regarding the reliability of financial reporting and the preparation of financial statements for external reporting purposes in accordance with U.S. generally accepted accounting principles.
Based on the results of our evaluation, our management concluded that our internal control over financial reporting was effective as of December 31, 2014. We reviewed the results of management’s assessment with our Audit Committee. The effectiveness of our internal control over financial reporting as of December 31, 2014 has been audited by Deloitte & Touche LLP, an independent registered public accounting firm, as stated in their report which is included in this Annual Report on Form 10-K.
Changes in Internal Control Over Financial Reporting
There was no change in our internal control over financial reporting (as defined in Rules 13a-15(f) and 15d-15(f) under the Exchange Act) that occurred during the quarterly period ended December 31, 2014 that has materially affected, or is reasonably likely to materially affect, our internal control over financial reporting.
Inherent Limitations on Effectiveness of Controls
Our management, including our Chief Executive Officer and Chief Financial Officer, believes that our disclosure controls and procedures and internal control over financial reporting are designed to provide reasonable assurance of achieving their objectives and are effective at the reasonable assurance level. However, our management does not expect that our disclosure controls and procedures or our internal control over financial reporting will prevent all errors and all fraud. A control system, no matter how well conceived and operated, can provide only reasonable, not absolute, assurance that the objectives of the control system are met. Further, the design of a control system must reflect the fact that there are resource constraints, and the benefits of controls must be considered relative to their costs. Because of the inherent limitations in all control systems, no evaluation of controls can provide absolute assurance that all control issues and instances of fraud, if any, have been detected. These inherent limitations include the realities that judgments in decision making can be faulty, and that breakdowns can occur because of a simple error or mistake. Additionally, controls can be circumvented by the individual acts of some persons, by collusion of two or more people or by management override of the controls. The design of any system of controls also is based in part upon certain assumptions about the likelihood of future events, and there can be no assurance that any design will succeed in achieving its stated goals under all potential future conditions; over time, controls may become inadequate because of changes
113
in conditions, or the degree of compliance with policies or procedures may deteriorate. Because of the inherent limitations in a cost effective control system, misstatements due to error or fraud may occur and not be detected.
Item 9B. Other Information.
None.
114
PART III
Item 10. Directors, Executive Officers and Corporate Governance.
The information required by this item concerning our directors, executive officers, compliance with Section 16 of the Exchange Act, our Code of Business Conduct and Ethics and other governance matters is incorporated by reference from the information set forth in the sections under the headings “Directors, Executive Officers and Corporate Governance” and “Section 16(a) Beneficial Ownership Reporting Compliance” in our Definitive Proxy Statement to be filed with the Securities and Exchange Commission pursuant to Regulation 14A within 120 days after our fiscal year end of December 31, 2014 in connection with the Annual Meeting of Stockholders to be held in 2015 (the “2015 Proxy Statement”).
Item 11. Executive Compensation.
The information required by this item is incorporated by reference from the information in the 2015 Proxy Statement under the headings “Executive Compensation,” “Directors, Executive Officers and Corporate Governance—Non-Employee Director Compensation” and “Directors, Executive Officers and Corporate Governance—Compensation Committee Interlocks and Insider Participation.”
Item 12. Security Ownership of Certain Beneficial Owners and Management and Related Stockholder Matters.
The information required by this item concerning securities authorized for issuance under equity compensation plans and security ownership of certain beneficial owners and management is incorporated by reference from the information in the 2015 Proxy Statement under the headings “Equity Compensation Plan Information” and “Security Ownership of Certain Beneficial Owners and Officers and Directors.”
Item 13. Certain Relationships and Related Transactions, and Director Independence.
The information required by this item concerning transactions with related persons and director independence is incorporated by reference from the information in the 2015 Proxy Statement under the headings “Certain Relationships and Related Party Transactions” and “Directors, Executive Officers and Corporate Governance.”
Item 14. Principal Accounting Fees and Services.
The information required by this item is incorporated by reference from the information in the 2015 Proxy Statement under the heading “Ratification of Appointment of Independent Registered Public Accounting Firm—Fees Paid to Auditors.”
115
PART IV
Item 15. Exhibits and Financial Statement Schedules.
1. Our consolidated financial statements are filed as part of this Annual Report on Form 10-K in Item 8. Financial Statements and Supplementary Data, and a list of the consolidated financial statements are found on page 69 of this report.
2. Exhibits: The exhibits listed in the accompanying index to exhibits are filed or incorporated by reference as part of this Annual Report on Form 10-K.
116
SIGNATURES
Pursuant to the requirements of Section 13 or 15(d) of the Securities Exchange Act of 1934, the registrant has duly caused this report to be signed on its behalf by the undersigned, thereunto duly authorized.
SOLAZYME, INC. | |
By:/S/ JONATHAN S. WOLFSON | |
Name: Jonathan S. Wolfson | |
Title: Chief Executive Officer | |
Date: March 6, 2015 | |
POWER OF ATTORNEY
Each person whose individual signature appears below hereby authorizes and appoints Jonathan S. Wolfson and Tyler W. Painter, and each of them, with full power of substitution and resubstitution and full power to act without the other, as his or her true and lawful attorney-in-fact and agent to act in his or her name, place and stead and to execute in the name and on behalf of each person, individually and in each capacity stated below, and to file any and all amendments to this annual report on Form 10-K and to file the same, with all exhibits thereto, and other documents in connection therewith, with the Securities and Exchange Commission, granting unto said attorneys-in-fact and agents, and each of them, full power and authority to do and perform each and every act and thing, ratifying and confirming all that said attorneys-in-fact and agents or any of them or their or his substitute or substitutes may lawfully do or cause to be done by virtue thereof.
Pursuant to the requirements of the Securities Exchange Act of 1934, this report has been signed by the following persons on behalf of the registrant in the capacities and on the dates indicated.
Signature | Title | Date | ||
/s/ Jonathan S. Wolfson | Chief Executive Officer and Director (Principal Executive Officer) | March 6, 2015 | ||
Jonathan S. Wolfson | ||||
/s/ Tyler W. Painter | Chief Financial Officer and Chief Operating Officer (Principal Financial and Accounting Officer) | March 6, 2015 | ||
Tyler W. Painter | ||||
/s/ Michael V. Arbige | Director | March 6, 2015 | ||
Michael V. Arbige | ||||
/s/ Ian T. Clark | Director | March 6, 2015 | ||
Ian T. Clark | ||||
/s/ James R. Craigie | Director | March 6, 2015 | ||
James R. Craigie | ||||
/s/ Jerry Fiddler | Chairman of the Board | March 6, 2015 | ||
Jerry Fiddler | ||||
/s/ Peter Kovacs | Director | March 6, 2015 | ||
Peter Kovacs | ||||
/s/ Gary Pfeiffer | Director | March 6, 2015 | ||
Gary Pfeiffer | ||||
117
EXHIBIT INDEX
Exhibit Number | Description | Incorporated by Reference | Filed Herewith with this 10-K | ||||||||||
Form | File No. | Filing Date | Exhibit | ||||||||||
3.1 | Amended and Restated Certificate of Incorporation | 10-K/A | 001-35189 | April 27, 2012 | 3.1 | ||||||||
3.2 | Amended and Restated Bylaws | 10-K/A | 001-35189 | April 27, 2012 | 3.2 | ||||||||
4.1 | Indenture dated as of January 24, 2013 between Wells Fargo Bank, National Association, as Trustee, and Solazyme, Inc. | 8-K | 001-35189 | January 24, 2013 | 4.1 | ||||||||
4.2 | Indenture dated as of April 1, 2014 between Wells Fargo Bank, National Association, as Trustee, and Solazyme, Inc. | 8-K | 001-35189 | April 1, 2014 | 4.1 | ||||||||
10.1§ | Form of Director/Officer Indemnification Agreement entered into by and between Solazyme, Inc. and each of its directors and executive officers | S-1 | 333-172790 | May 4, 2011 | 10.1 | ||||||||
10.2§ | Second Amended and Restated 2004 Equity Incentive Plan and forms of notice of stock option grant, stock option agreement and restricted stock agreement | S-1 | 333-172790 | March 11, 2011 | 10.2 | ||||||||
10.3§ | 2011 Equity Incentive Plan | S-1 | 333-172790 | May 4, 2011 | 10.3 | ||||||||
10.4§ | 2011 Employee Stock Purchase Plan | S-1 | 333-172790 | May 4, 2011 | 10.4 | ||||||||
10.5 | Sublease effective as of December 31, 2009, by and between FibroGen, Inc. and Solazyme, Inc. | S-1 | 333-172790 | March 11, 2011 | 10.6 | ||||||||
10.6 | First Amendment to Sublease effective as of January 29, 2010, by and between FibroGen, Inc. and Solazyme, Inc. | S-1 | 333-172790 | March 11, 2011 | 10.7 | ||||||||
10.7 | Second Amendment to Sublease effective as of June 1, 2010, by and between FibroGen, Inc. and Solazyme, Inc. | S-1 | 333-172790 | March 11, 2011 | 10.8 | ||||||||
10.8 | Third Amendment to Sublease effective as of July 12, 2011 by and between FibroGen, Inc. and Solazyme, Inc. | 10-Q | 001-35189 | November 8, 2011 | 10.3 | ||||||||
10.9† | Joint Venture and Operating Agreement of Solazyme Roquette Nutritionals, LLC dated November 3, 2010, by and between Roquette Frères, S.A. and Solazyme, Inc. | S-1 | 333-172790 | April 12, 2011 | 10.10 | ||||||||
10.10† | Amendment No. 1 to Joint Venture and Operating Agreement of Solazyme Roquette Nutritionals, LLC dated November 3, 2010, by and between Roquette Frères, S.A and Solazyme, Inc. | 10-K | 001-35189 | March 15, 2012 | 10.29 | ||||||||
10.11† | Solazyme License Agreement dated December 16, 2010, by and between Solazyme Roquette Nutritionals, LLC and Solazyme, Inc. | S-1 | 333-172790 | May 12, 2011 | 10.10 | ||||||||
10.12§ | Executive Severance and Change of Control Plan | S-1 | 333-172790 | May 23, 2011 | 10.17 | ||||||||
10.13§ | Amended and Restated Employment Agreement dated May 19, 2011, by and between Solazyme, Inc. and Jonathan S. Wolfson | S-1 | 333-172790 | May 23, 2011 | 10.18 | ||||||||
10.14§ | Amended and Restated Employment Agreement dated May 19, 2011, by and between Solazyme, Inc. and Tyler W. Painter | S-1 | 333-172790 | May 23, 2011 | 10.20 | ||||||||
10.15§ | Amended and Restated Employment Agreement dated May 19, 2011, by and between Solazyme, Inc. and Peter J. Licari | S-1 | 333-172790 | May 23, 2011 | 10.21 | ||||||||
118
Exhibit Number | Description | Incorporated by Reference | Filed Herewith with this 10-K | ||||||||||
Form | File No. | Filing Date | Exhibit | ||||||||||
10.16§ | Amended and Restated Employment Agreement dated May 19, 2011, by and between Solazyme, Inc. and Paul T. Quinlan | S-1 | 333-172790 | May 23, 2011 | 10.22 | ||||||||
10.17 | Warrant for the Purchase of Shares of Common Stock of Solazyme, Inc. by Bunge Limited | S-1 | 333-172790 | May 4, 2011 | 10.24 | ||||||||
10.18 | Amendment No. 1 to Warrant for the Purchase of Shares of Common Stock of Solazyme, Inc. dated August 5, 2011 by and between Solazyme, Inc. and Bunge Limited | 10-Q | 001-35189 | November 8, 2011 | 10.20 | ||||||||
10.19§ | Form of 2011 Equity Incentive Plan Stock Option Agreement | 10-K | 001-35189 | March 15, 2012 | 10.30 | ||||||||
10.20§ | Form of 2011 Equity Incentive Plan Restricted Stock Agreement | 10-K | 001-35189 | March 15, 2012 | 10.31 | ||||||||
10.21§ | Form of 2011 Equity Incentive Plan Restricted Stock Unit Agreement | 10-K | 001-35189 | March 13, 2013 | 10.23 | ||||||||
10.22† | Joint Venture Agreement entered into as of March 30, 2012 by and among Bunge Global Innovation, LLC, Solazyme, Inc. and certain other parties | 10-Q | 001-35189 | August 9, 2012 | 10.10 | ||||||||
10.23† | Solazyme Development Agreement entered into as of March 30, 2012 by and among Solazyme Bunge Renováveis Ltda., Solazyme, Inc. and certain other parties | 10-Q | 001-35189 | August 9, 2012 | 10.20 | ||||||||
10.24† | Strategic Collaboration Agreement dated as of November 13, 2012 by and between Solazyme, Inc. and Archer-Daniels-Midland Company | 10-K | 001-35189 | March 13, 2013 | 10.26 | ||||||||
10.25 | Warrant for the Purchase of Shares of Common Stock of Solazyme, Inc., dated as of January 18, 2013, between Archer-Daniels-Midland Company and Solazyme, Inc. | 10-Q | 001-35189 | May 8, 2013 | 10.10 | ||||||||
10.26 | Form of Warrant for the Purchase of Shares of Common Stock of Solazyme, Inc. between Archer-Daniels-Midland Company and Solazyme, Inc. | 10-Q | 001-35189 | May 8, 2013 | 10.20 | ||||||||
10.27 | Loan and Security Agreement dated as of March 26, 2013 between HSBC National Bank, USA, National Association and Solazyme, Inc. | 10-Q | 001-35189 | May 8, 2013 | 10.30 | ||||||||
10.28 | Credit Facility Agreement No. 12.2.1149.1, Executed Between Banco Nacional de Desenvolvimento Economico e Social—BNDES and Solazyme Bunge Produtos Renovaveis Ltda., dated February 14, 2013 | 10-Q | 001-35189 | August 7, 2013 | 10.10 | ||||||||
10.29 | First Amendment to Loan and Security Agreement by and between HSBC Bank USA, National Association and Solazyme, Inc., dated May 9, 2013 | 10-Q | 001-35189 | August 7, 2013 | 10.20 | ||||||||
10.30† | Letter Agreement and Amendment No. 1 to the JV Agreements dated as of October 31, 2013, by and among, Bunge Global Innovation, LLC, Solazyme, Inc. and certain other parties | 10-K | 001-35189 | March 14, 2014 | 10.35 | ||||||||
10.31§ | Employment Agreement dated October 11, 2012, by and between Solazyme, Inc. and Jean-Marc Rotsaert | 10-K | 001-35189 | March 14, 2014 | 10.36 | ||||||||
10.32§ | Separation and Release Agreement dated January 6, 2014 | 10-Q | 001-35189 | May 8, 2014 | 10.1 | ||||||||
119
Exhibit Number | Description | Incorporated by Reference | Filed Herewith with this 10-K | ||||||||||
Form | File No. | Filing Date | Exhibit | ||||||||||
10.33 | 1st Amendment to Credit Facility Agreement No., 12.2.1149.1, Executed Between Banco Nacional de Desenvolvimento Economico e Social-BNDES and Solazyme Bunge Produtos Renovaveis Ltda., dated January 16, 2014 | 10-Q | 001-35189 | May 8, 2014 | 10.2 | ||||||||
10.34 | Second Amendment to Loan and Security Agreement by and between HSBC Bank USA, National Association and Solazyme, Inc., dated March 31, 2014 | 10-Q | 001-35189 | May 8, 2014 | 10.3 | ||||||||
10.35 | Lease, dated as of July 22, 2014, by and between Britannia Gateway II Limited Partnership and Solazyme, Inc. | 10-Q | 001-35189 | November 6, 2014 | 10.1 | ||||||||
10.36§ | Employment Agreement dated December 10, 2013, by and between Solazyme, Inc. and David Cole | X | |||||||||||
10.37§ | Professional Services Agreement, dated October 8, 2014, by and between David Cole and Solazyme, Inc. | X | |||||||||||
12.1 | Computation of Ratio of Earnings to Fixed Charges | X | |||||||||||
21.1 | List of subsidiaries of the Registrant | X | |||||||||||
23.1 | Consent of Deloitte & Touche LLP, Independent Registered Public Accounting Firm | X | |||||||||||
24.1 | Power of Attorney (found on Signature Page) | X | |||||||||||
31.1 | Certification of Chief Executive Officer, as required by Section 302 of the Sarbanes-Oxley Act of 2002 | X | |||||||||||
31.2 | Certification of Chief Financial Officer, as required by Section 302 of the Sarbanes-Oxley Act of 2002 | X | |||||||||||
32.1 | Certification of the Chief Executive Officer and Chief Financial Officer, as required by Section 906 of the Sarbanes-Oxley Act of 2002 | X | |||||||||||
101 | The following financial statements, formatted in XBRL: (i) Consolidated Balance Sheets at December 31, 2014 and December 31, 2013, (ii) Consolidated Statements of Operations for each of the three years in the period ended December 31, 2014, (iii) Consolidated Statements of Comprehensive Loss for each of the three years in the period ended December 31, 2014, (iv) Consolidated Statements of Stockholders’ Equity for each of the three years in the period ended December 31, 2014, (v) Consolidated Statements of Cash Flows for each of the three years in the period ended December 31, 2014; and (vi) Notes to the Consolidated Financial Statements | X | |||||||||||
† | Confidential treatment has been granted, or requested, with respect to portions of the exhibit. A complete copy of the agreement, including the redacted terms, has been separately filed with the SEC. |
§ | Management contract or compensatory plan or arrangement. |
120