Attached files
| file | filename |
|---|---|
| 8-K - 8-K - ESSA Bancorp, Inc. | d884001d8k.htm |
| Exhibit 99.1
|

ESSA Bancorp, Inc.
2015 Annual Meeting
|
|
Forward Looking Statements
Certain statements contained herein are “forward-looking statements” within the meaning of Section 27A of the Securities Act of 1933 and Section 21E of the Securities Exchange Act of 1934. Such forward-looking statements may be identified by reference to a future period or periods, or by the use of forward-looking terminology, such as “may”, “will”, “believe”, “expect”, “estimate”, “anticipate”, “continue”, or similar terms or variations on those terms, or the negative of those terms. Forward-looking statements are subject to numerous risks and uncertainties, including, but not limited to, those related to the economic environment, particularly in the market areas in which ESSA Bancorp, Inc. (the “Company”) operates, competitive products and pricing, fiscal and monetary policies of the U.S. Government, changes in government regulations affecting financial institutions, including regulatory fees and capital requirements, changes in prevailing interest rates, acquisitions and the integration of acquired businesses, credit risk management, asset-liability management, the financial and securities markets and the availability of and costs associated with sources of liquidity. The Company wishes to caution readers not to place undue reliance on any such forward-looking statements, which speak only as of the date made. The Company wishes to advise readers that the factors listed above could affect the company’s financial performance and could cause the Company’s actual results for future periods to differ materially from any opinions or statements expressed with respect to future periods in any current statements. The Company does not undertake and specifically declines any obligation to publicly release the result of any revisions which may be made to any forward-looking statements to reflect events or circumstances after the date of such statements or to reflect the occurrence of anticipated or unanticipated event.
|
|
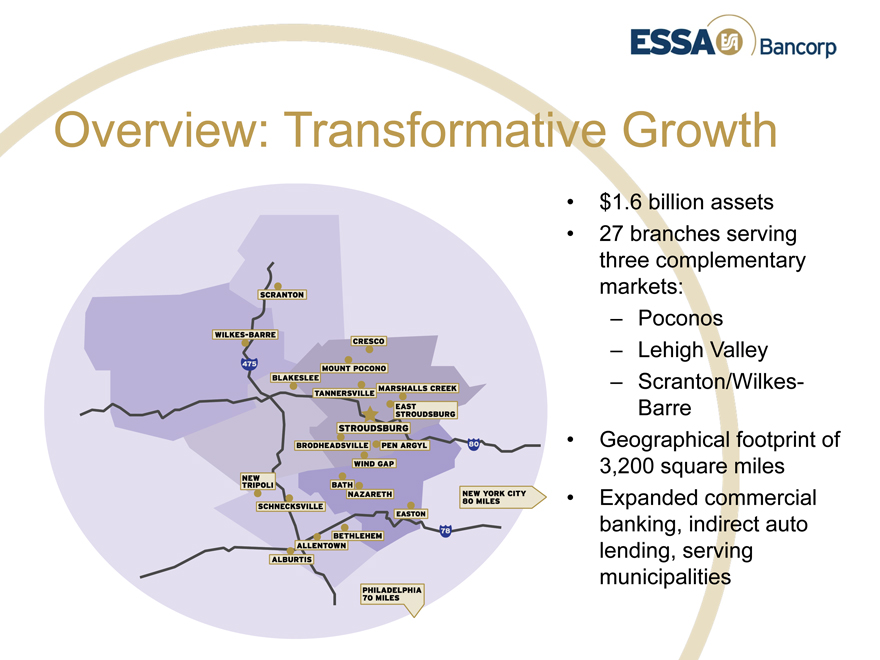
Overview: Transformative Growth
$1.6 billion assets
27 branches serving three complementary markets:
– Poconos
– Lehigh Valley
– Scranton/Wilkes-Barre
Geographical footprint of 3,200 square miles
Expanded commercial banking, indirect auto lending, serving municipalities
|
|
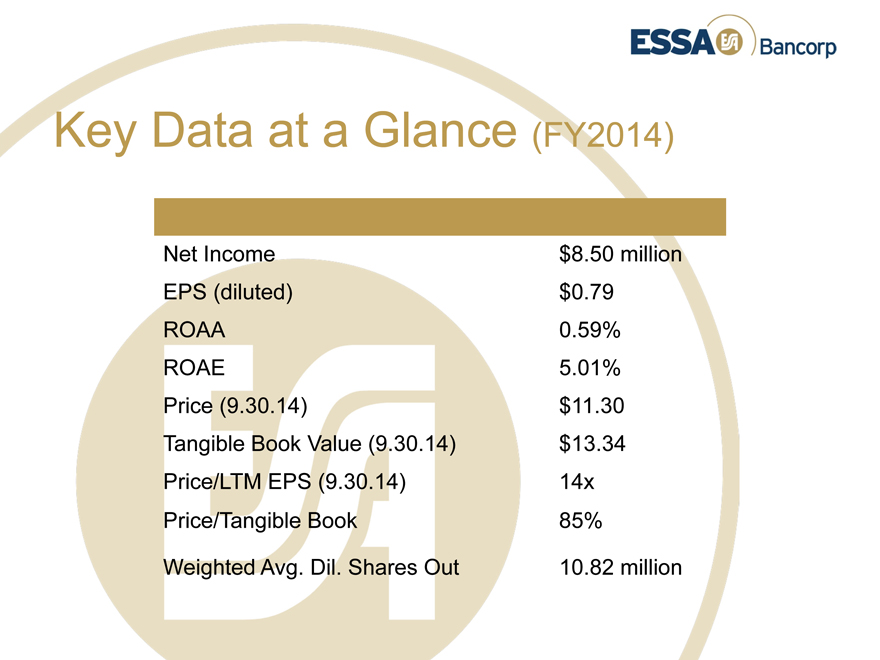
Key Data at a Glance (FY2014)
Net Income $8.50 million EPS (diluted) $0.79 ROAA 0.59% ROAE 5.01% Price (9.30.14) $11.30 Tangible Book Value (9.30.14) $13.34 Price/LTM EPS (9.30.14) 14x Price/Tangible Book 85%
Weighted Avg. Dil. Shares Out 10.82 million
|
|
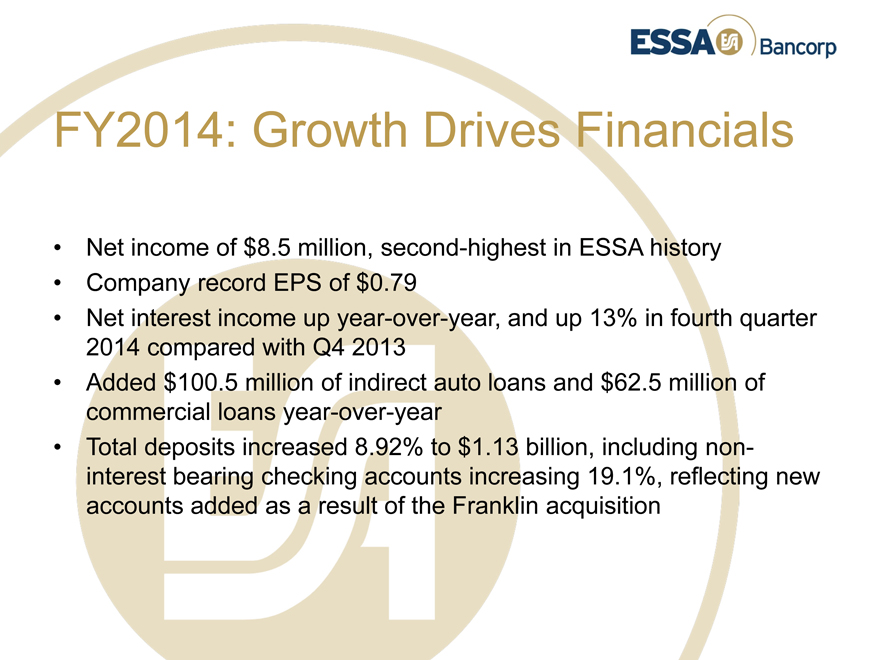
FY2014: Growth Drives Financials
Net income of $8.5 million, second-highest in ESSA history
Company record EPS of $0.79
Net interest income up year-over-year, and up 13% in fourth quarter 2014 compared with Q4 2013
Added $100.5 million of indirect auto loans and $62.5 million of commercial loans year-over-year
Total deposits increased 8.92% to $1.13 billion, including non-interest bearing checking accounts increasing 19.1%, reflecting new accounts added as a result of the Franklin acquisition
|
|
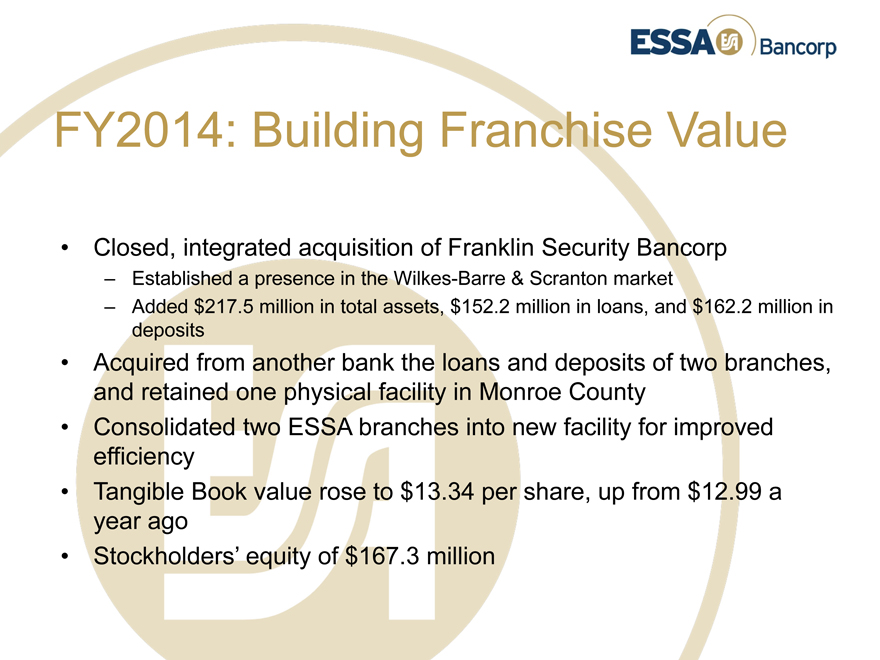
FY2014: Building Franchise Value
Closed, integrated acquisition of Franklin Security Bancorp
– Established a presence in the Wilkes-Barre & Scranton market
– Added $217.5 million in total assets, $152.2 million in loans, and $162.2 million in deposits
Acquired from another bank the loans and deposits of two branches, and retained one physical facility in Monroe County
Consolidated two ESSA branches into new facility for improved efficiency
Tangible Book value rose to $13.34 per share, up from $12.99 a year ago
Stockholders’ equity of $167.3 million
|
|
Growing ESSA Bancorp
|
|
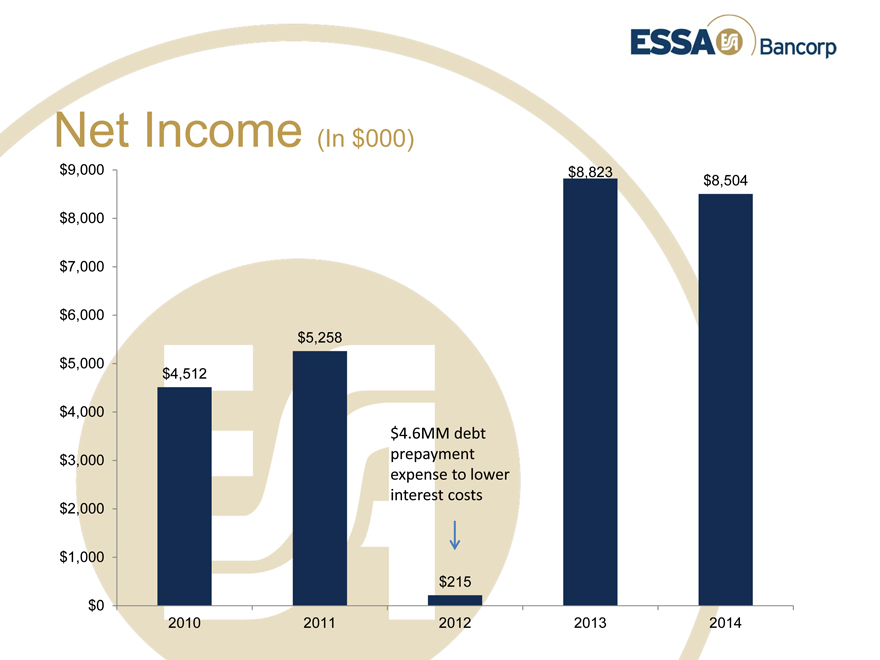
Net Income (In $000)
$9,000 $8,823 $8,504
$8,000
$7,000
$6,000 $5,258 $5,000 $4,512
$4,000
$4.6MM debt $3,000 prepayment expense to lower $2,000 interest costs
$1,000 $215 $0
2010 2011 2012 2013 2014
|
|
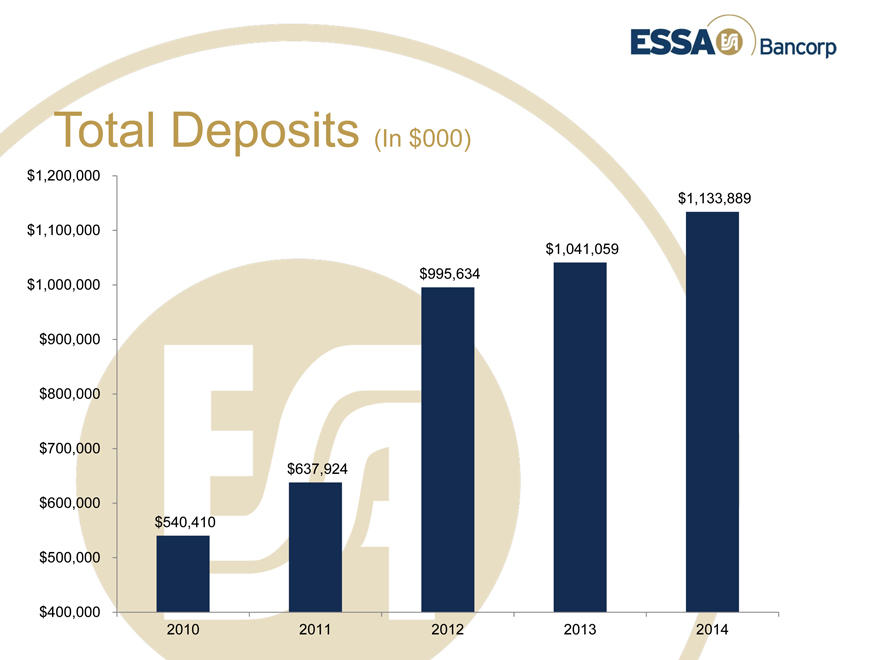
Total Deposits (In $000)
$1,200,000 $1,133,889
$1,100,000 $1,041,059 $995,634 $1,000,000
$900,000
$800,000
$700,000 $637,924
$600,000 $540,410
$500,000
$400,000
2010 2011 2012 2013 2014
|
|
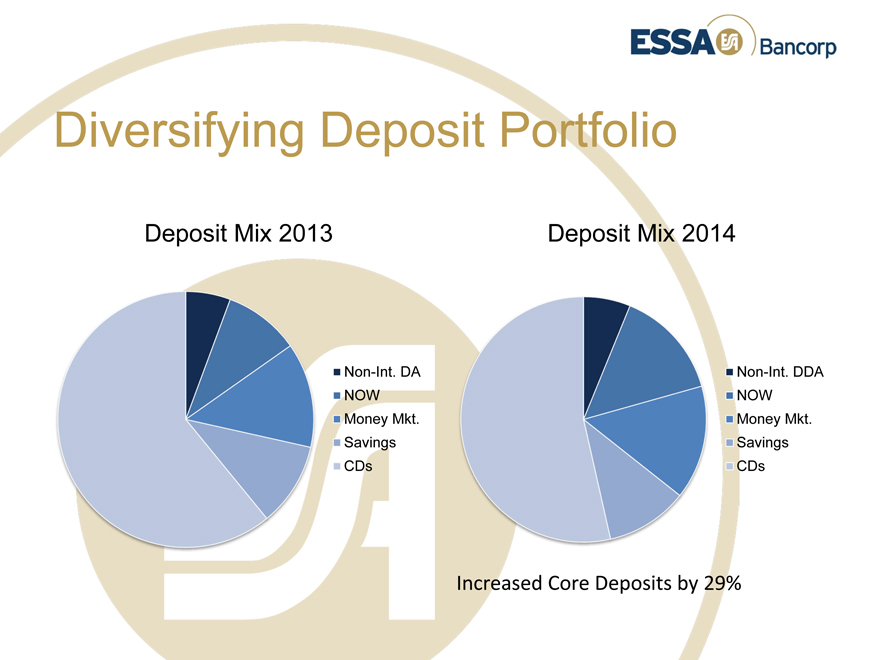
Diversifying Deposit Portfolio
Deposit Mix 2013 Deposit Mix 2014
Non-Int. DA Non-Int. DDA NOW NOW Money Mkt. Money Mkt. Savings Savings CDs CDs
Increased Core Deposits by 29%
|
|
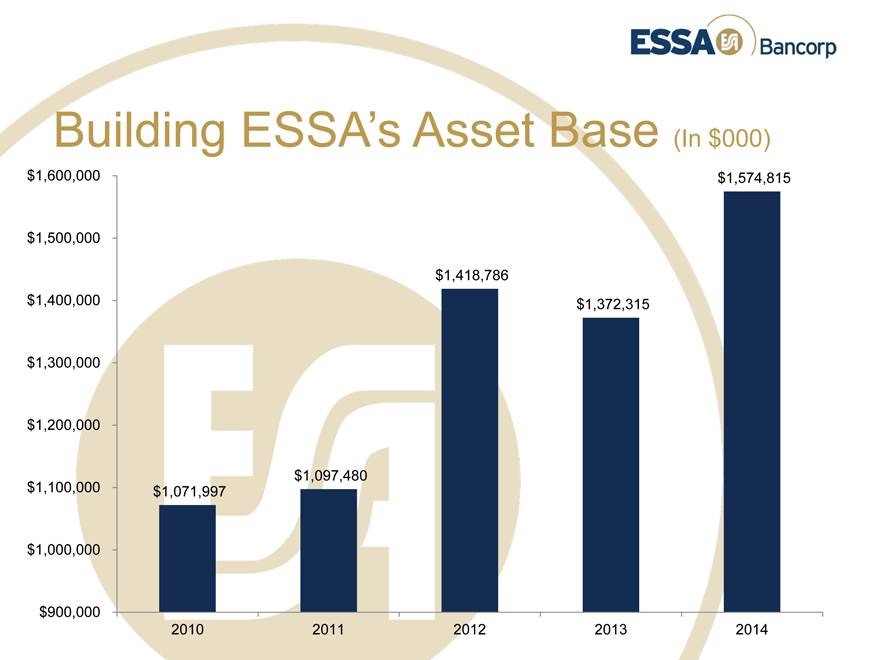
Building ESSA’s Asset Base (In $000)
$1,600,000 $1,574,815
$1,500,000
$1,418,786 $1,400,000 $1,372,315
$1,300,000
$1,200,000
$1,097,480 $1,100,000 $1,071,997
$1,000,000
$900,000
2010 2011 2012 2013 2014
|
|
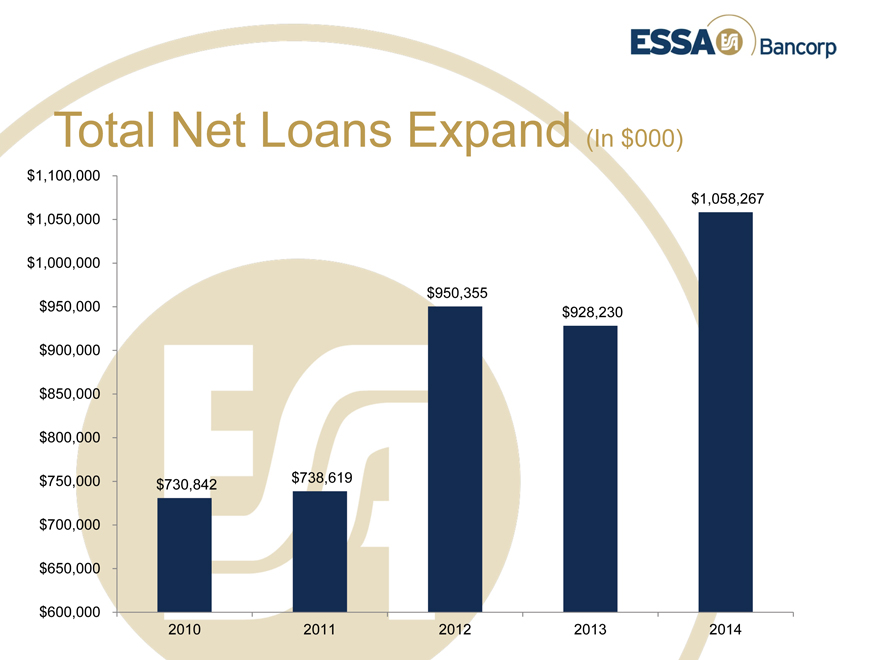
Total Net Loans Expand (In $000)
$1,100,000 $1,058,267 $1,050,000
$1,000,000
$950,000 $950,355 $928,230
$900,000 $850,000 $800,000
$750,000 $738,619 $730,842
$700,000
$650,000
$600,000
2010 2011 2012 2013 2014
|
|
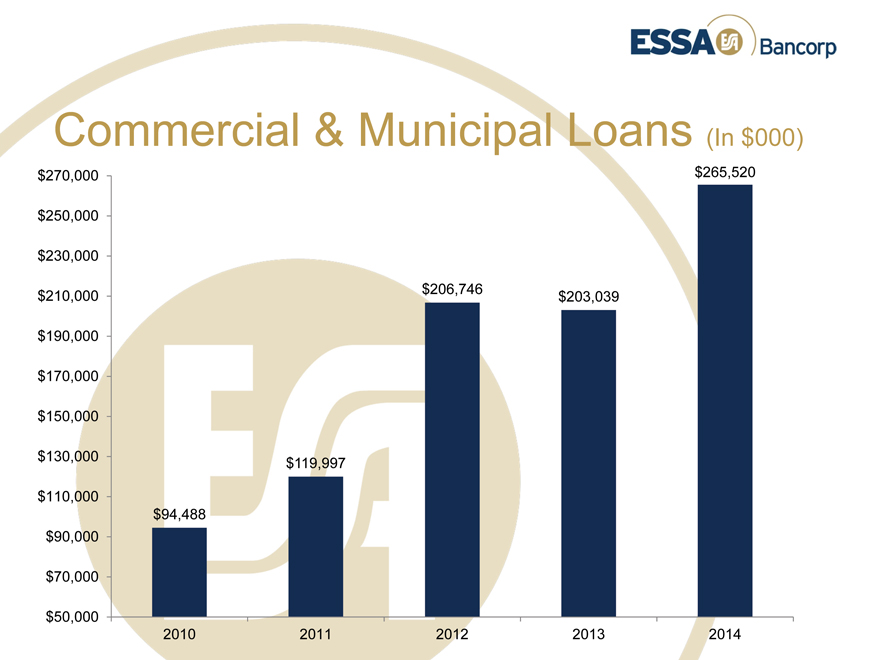
Commercial & Municipal Loans (In $000)
$270,000 $265,520
$250,000
$230,000
$206,746 $210,000 $203,039
$190,000 $170,000 $150,000
$130,000 $119,997
$110,000 $94,488 $90,000
$70,000
$50,000
2010 2011 2012 2013 2014
|
|
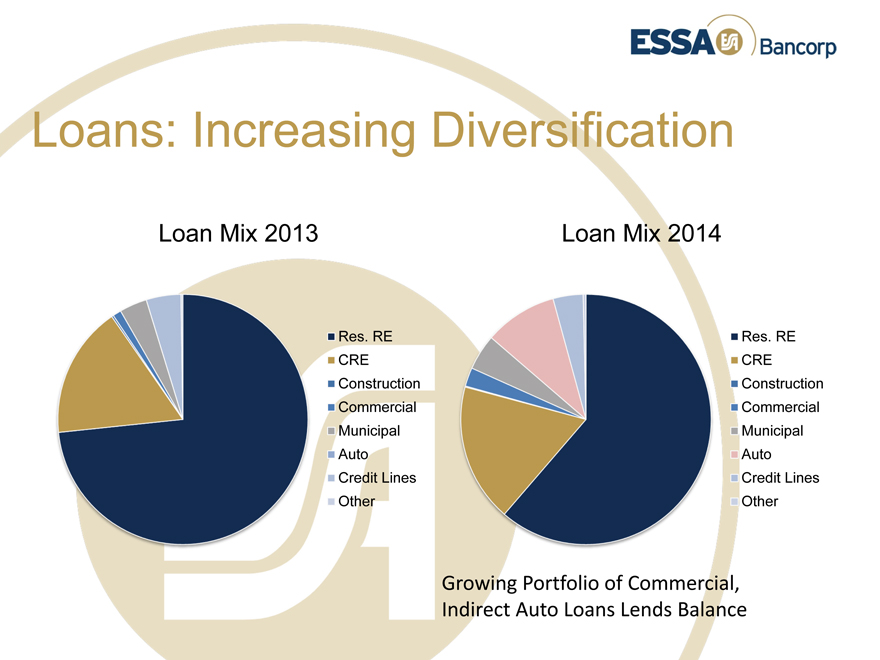
Loans: Increasing Diversification
Loan Mix 2013
Loan Mix 2014
Res. RE Res. RE CRE CRE Construction Construction Commercial Commercial Municipal Municipal Auto Auto Credit Lines Credit Lines Other Other
Growing Portfolio of Commercial,
Indirect Auto Loans Lends Balance
|
|
Value, Quality, Strength
|
|
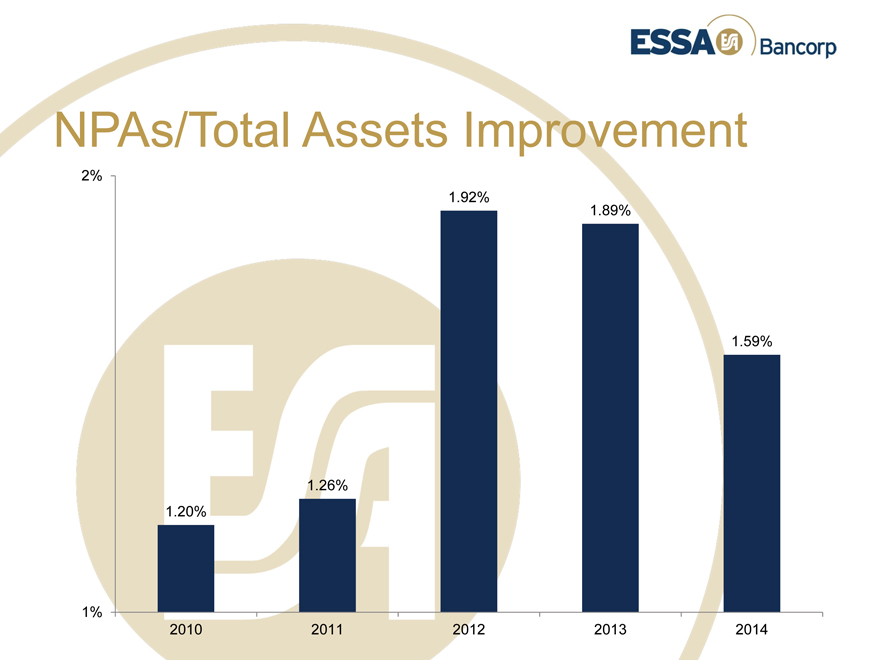
NPAs/Total Assets Improvement
2%
1.92% 1.89%
1.59%
1.26%
1.20%
1%
2010 2011 2012 2013 2014
|
|
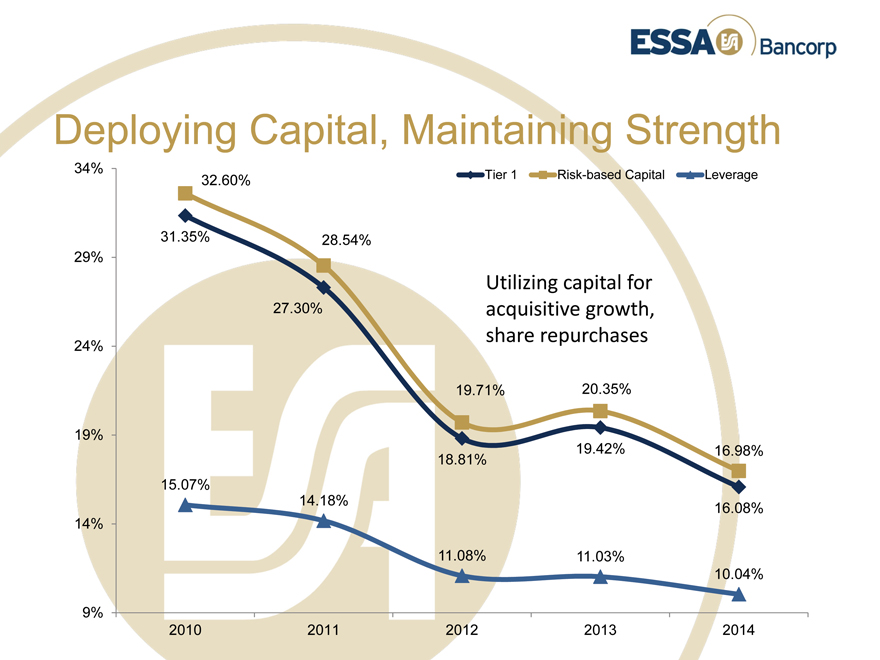
Deploying Capital, Maintaining Strength
34%
32.60% Tier 1 Risk-based Capital Leverage
31.35% 28.54% 29%
Utilizing capital for
27.30% acquisitive growth, share repurchases
24%
19.71% 20.35%
19% 19.42%
16.98%
18.81%
15.07%
14.18%
16.08% 14%
11.08% 11.03%
10.04%
9%
2010 2011 2012 2013 2014
|
|
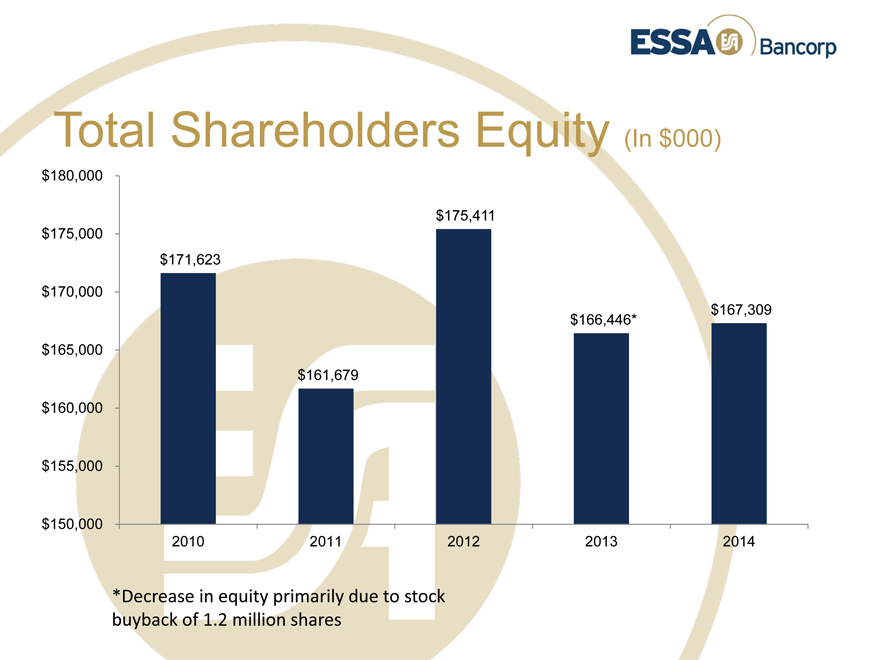
Total Shareholders Equity (In $000)
$180,000
$175,411 $175,000 $171,623
$170,000 $167,309 $166,446*
$165,000 $161,679
$160,000 $155,000 $150,000
2010
2011
2012
2013
2014
*Decrease in equity primarily due to stock
buyback of 1.2 million shares
|
|
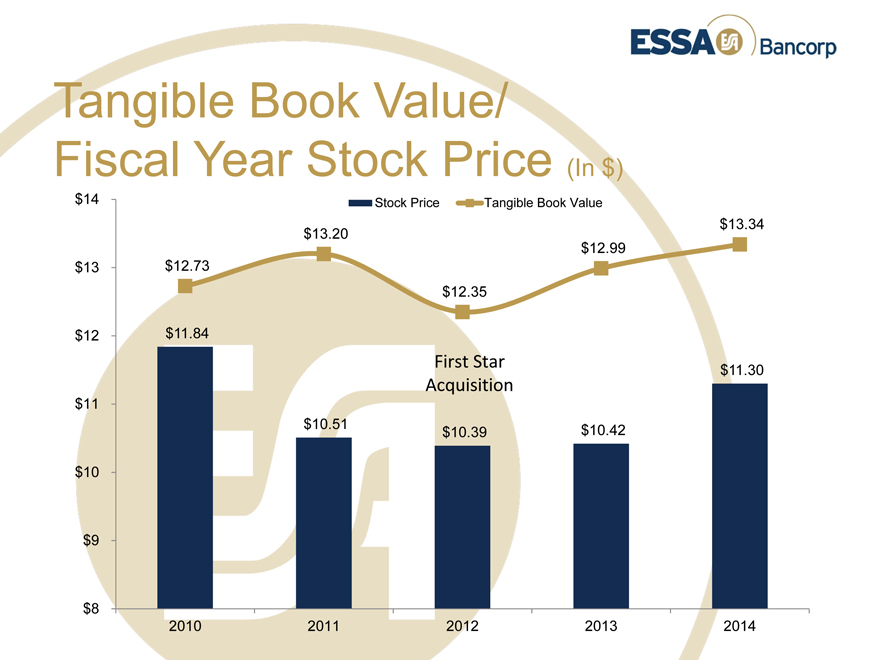
Tangible Book Value/ Fiscal Year Stock Price (In $)
$14 Stock Price Tangible Book Value
$13.34
$13.20
$12.99
$13 $12.73
$12.35
$12 $11.84
First Star
$11.30
Acquisition
$11
$10.51 $10.42
$10.39 $10
$9
$8
2010 2011 2012 2013 2014
|
|
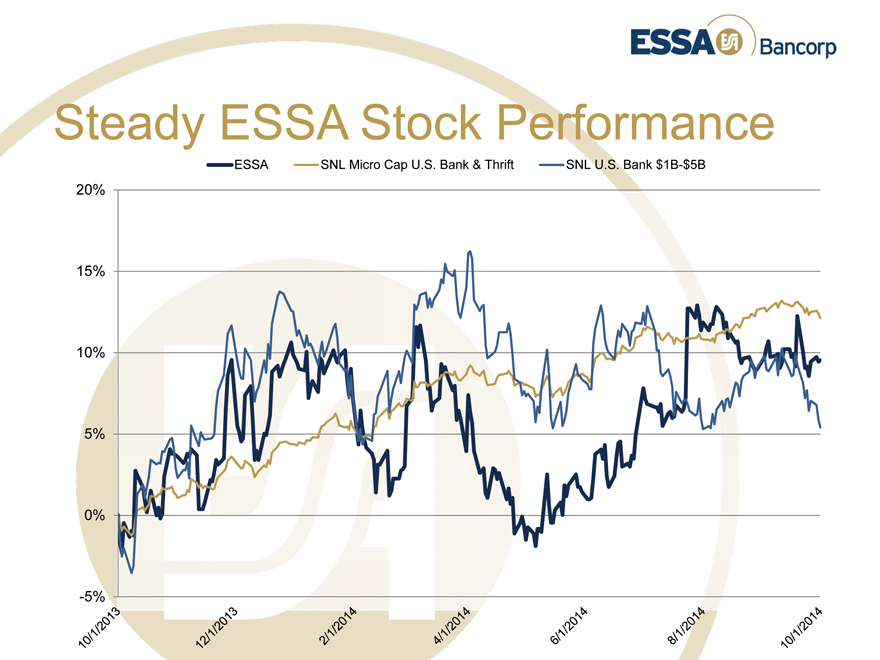
Steady ESSA Stock Performance
ESSA SNL Micro Cap U.S. Bank & Thrift
SNL U.S. Bank $1B-$5B
20% 15% 10% 5% 0%
-5%
|
|
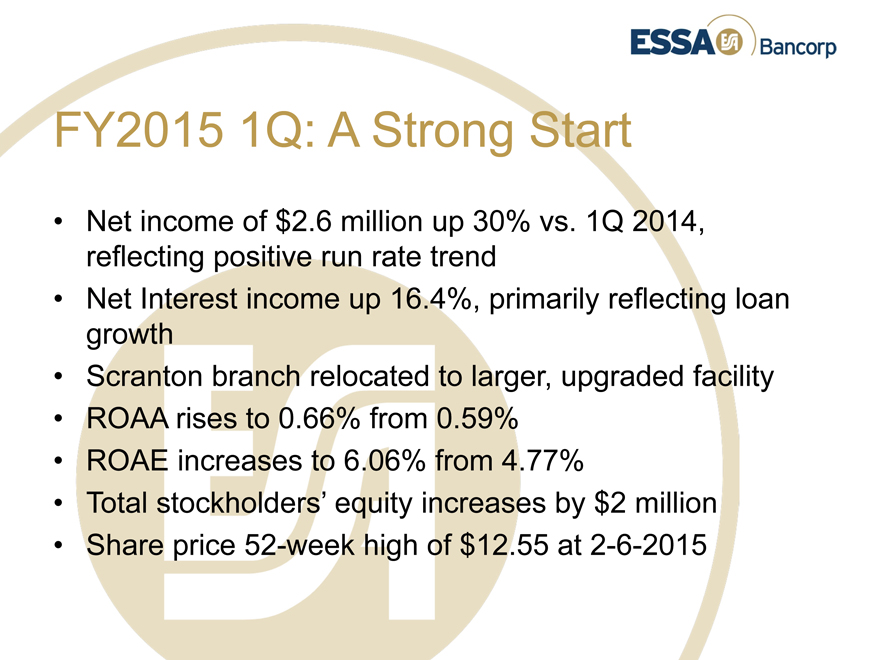
FY2015 1Q: A Strong Start
Net income of $2.6 million up 30% vs. 1Q 2014, reflecting positive run rate trend
Net Interest income up 16.4%, primarily reflecting loan growth
Scranton branch relocated to larger, upgraded facility
ROAA rises to 0.66% from 0.59%
ROAE increases to 6.06% from 4.77%
Total stockholders’ equity increases by $2 million
Share price 52-week high of $12.55 at 2-6-2015
|
|
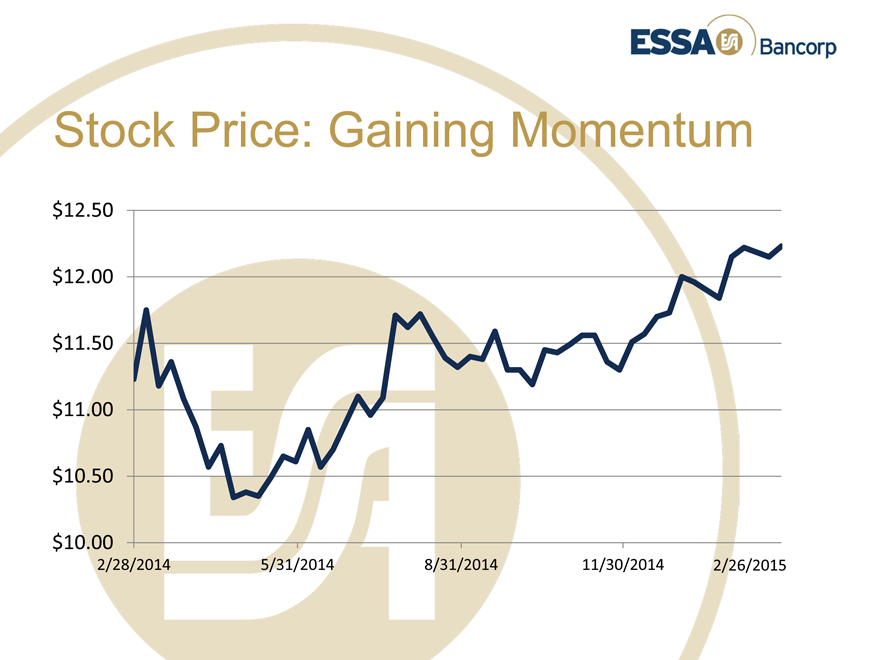
Stock Price: Gaining Momentum
$12.50
$12.00
$11.50
$11.00
$10.50
$10.00
2/28/2014 5/31/2014 8/31/2014 11/30/2014 2/26/2015
|
|
Looking Ahead: FY2015
Drive revenue growth through larger, diversified franchise
Leverage new commercial, municipal, indirect auto lending capabilities across the ESSA network
Expand retail banking, wealth management services to Scranton, Wilkes-Barre markets
Assess strategic branch and whole-bank acquisition opportunities
Increased quarterly dividend from $0.07 to $0.09 per share
Deliver balanced value through operational growth, earnings, opportunistic stock repurchases, and dividends
|
|

ESSA Bancorp, Inc.
2015 Annual Meeting