Attached files
| file | filename |
|---|---|
| EX-32 - EX-32 - ESSA Bancorp, Inc. | d43821dex32.htm |
| EX-23 - EX-23 - ESSA Bancorp, Inc. | d43821dex23.htm |
| EX-21 - EX-21 - ESSA Bancorp, Inc. | d43821dex21.htm |
| EX-31.1 - EX-31.1 - ESSA Bancorp, Inc. | d43821dex311.htm |
| EX-31.2 - EX-31.2 - ESSA Bancorp, Inc. | d43821dex312.htm |
Table of Contents
SECURITIES AND EXCHANGE COMMISSION
100 F Street NE
Washington, D.C. 20549
FORM 10-K
| x | Annual Report Pursuant to Section 13 or 15(d) of the Securities Exchange Act of 1934 |
For the Fiscal Year Ended September 30, 2015
or
| ¨ | Transition Report Pursuant to Section 13 or 15(d) of the Securities Exchange Act of 1934 |
For the transition period from to
Commission File No. 001-33384
ESSA Bancorp, Inc.
(Exact name of registrant as specified in its charter)
| Pennsylvania | 20-8023072 | |
| (State or other jurisdiction of incorporation or organization) |
(I.R.S. Employer Identification Number) | |
| 200 Palmer Street, Stroudsburg, Pennsylvania | 18360 | |
| (Address of Principal Executive Offices) | (Zip Code) | |
(570) 421-0531
(Registrant’s telephone number)
Securities Registered Pursuant to Section 12(b) of the Act:
| Title of each class |
Name of each exchange on which registered | |
| Common Stock, $0.01 par value | The NASDAQ Stock Market, LLC |
Securities Registered Pursuant to Section 12(g) of the Act: None
Indicate by check mark if the registrant is a well-known seasoned issuer, as defined in Rule 405 of the Securities Act. YES ¨ NO x
Indicate by check mark if the registrant is not required to file reports pursuant to Section 13 or Section 15(d) of the Act. YES ¨ NO x
Indicate by check mark whether the Registrant (1) has filed all reports required to be filed by Section 13 or 15(d) of the Securities Exchange Act of 1934 during the preceding twelve months (or for such shorter period that the Registrant was required to file such reports) and (2) has been subject to such requirements for the past 90 days. YES x NO ¨.
Indicate by check mark whether the registrant has submitted electronically and posted on its corporate Web site, if any, every Interactive Data File required to be submitted and posted pursuant to Rule 405 of Regulation S-T (§232.405 of this chapter) during the preceding 12 months (or for such shorter period that the registrant was required to submit and post such files). YES x NO ¨.
Indicate by check mark if disclosure of delinquent filers pursuant to Item 405 of Regulation S-K is not contained herein, and will not be contained, to the best of Registrant’s knowledge, in definitive proxy or information statements incorporated by reference in Part III of this Form 10-K or any amendment to this Form 10-K. x
Indicate by check mark whether the registrant is a large accelerated filer, an accelerated filer, a non-accelerated filer, or a smaller reporting company. See the definitions of “large accelerated filer,” “accelerated filer” and “smaller reporting company” in Rule 12b-2 of the Exchange Act.
| Large accelerated filer | ¨ | Accelerated filer | x | |||
| Non-accelerated filer | ¨ | Smaller reporting company | ¨ | |||
Indicate by check mark whether the Registrant is a shell company (as defined in Rule 12b-2 of the Exchange Act). YES ¨ NO x
As of December 1, 2015, there were 18,133,095 shares issued and 11,331,744 shares outstanding of the Registrant’s Common Stock.
The aggregate market value of the voting and non-voting common equity held by non-affiliates of the Registrant, computed by reference to the last sale price on March 31, 2015, was $130,837,471.
DOCUMENTS INCORPORATED BY REFERENCE
| • | Proxy Statement for the 2016 Annual Meeting of Stockholders of the Registrant (Part III). |
Table of Contents
| Item 1. |
1 | |||||
| Item 1A. |
27 | |||||
| Item 1B. |
32 | |||||
| Item 2. |
32 | |||||
| Item 3. |
33 | |||||
| Item 4. |
33 | |||||
| Item 5. |
34 | |||||
| Item 6. |
36 | |||||
| Item 7. |
Management’s Discussion and Analysis of Financial Condition and Results of Operations |
38 | ||||
| Item 7A. |
49 | |||||
| Item 8. |
49 | |||||
| Item 9. |
Changes in and Disagreements With Accountants on Accounting and Financial Disclosure |
49 | ||||
| Item 9A. |
49 | |||||
| Item 9B. |
50 | |||||
| Item 10. |
50 | |||||
| Item 11. |
50 | |||||
| Item 12. |
Security Ownership of Certain Beneficial Owners and Management and Related Stockholder Matters |
50 | ||||
| Item 13. |
Certain Relationships and Related Transactions, and Director Independence |
51 | ||||
| Item 14. |
51 | |||||
| Item 15. |
51 | |||||
i
Table of Contents
Forward Looking Statements
This Annual Report contains certain “forward-looking statements” which may be identified by the use of words such as “believe,” “expect,” “anticipate,” “should,” “planned,” “estimated” and “potential.” Examples of forward-looking statements include, but are not limited to, estimates with respect to our financial condition, results of operations and business that are subject to various factors which could cause actual results to differ materially from these estimates and most other statements that are not historical in nature. These factors include, but are not limited to, general and local economic conditions, changes in interest rates, deposit flows, demand for mortgage, and other loans, real estate values, competition, changes in accounting principles, policies, or guidelines, changes in legislation or regulation, and other economic, competitive, governmental, regulatory, and technological factors affecting our operations, pricing, products and services and the ability to successfully complete or close transactions or to integrate acquired entities. Because of these and a wide variety of other uncertainties, our actual future results may be materially different from the results indicated by these forward-looking statements. Please also see “Item 1A. Risk Factors.”
| Item 1. | Business |
ESSA Bancorp, Inc.
ESSA Bancorp, Inc. (“ESSA Bancorp” or the “Company”) is the Pennsylvania-chartered stock holding company of ESSA Bank & Trust (the “Bank”). ESSA Bancorp owns 100% of the outstanding shares of common stock of ESSA Bank & Trust. Since being formed in 2006, ESSA Bancorp has engaged primarily in the business of holding the common stock of ESSA Bank & Trust. Our executive offices are located at 200 Palmer Street, Stroudsburg, Pennsylvania 18360. Our telephone number at this address is (570) 421-0531. ESSA Bancorp is subject to comprehensive regulation and examination by the Federal Reserve Board of Governors. On July 31, 2012, ESSA Bancorp completed its acquisition of First Star Bancorp, Inc. and its wholly-owned subsidiary, First Star Bank. The total value of the consideration for the acquisition was $24.6 million, 50% of which was paid in cash and the remainder paid in the form of ESSA Bancorp common stock. On April 4, 2014, ESSA Bancorp completed its acquisition of Franklin Security Bancorp, Inc. and its wholly owned subsidiary, Franklin Security Bank. The total value of the consideration for the acquisition was $15.7 million which was paid in cash. On December 4, 2015, ESSA Bancorp completed its previously announced acquisition of Eagle National Bancorp, Inc. (“ENB”), whereby ESSA Bancorp acquired ENB and its wholly owned subsidiary, Eagle National Bank in an all cash transaction. Under the terms of the agreement, ENB stockholders received approximately $24.7 million, or $5.80 per share as of the December 4, 2015 closing date. Effective November 14, 2014, ESSA Bancorp converted its holding company status from a savings and loan holding company to a bank holding company, and it elected the financial holding company designation as a bank holding company. At September 30, 2015, ESSA Bancorp had consolidated assets of $1.6 billion, consolidated deposits of $1.1 billion and consolidated stockholders’ equity of $171.3 million. Consolidated net income for the fiscal year ended September 30, 2015 was $9.8 million.
ESSA Bank & Trust
General
ESSA Bank & Trust was organized in 1916. ESSA Bank & Trust is a Pennsylvania chartered full-service, community-oriented savings bank. We provide financial services to individuals, families and businesses through our 25 full-service banking offices, located in Monroe, Northampton, Lehigh, Lackawanna and Luzerne Counties, Pennsylvania. ESSA Bank & Trust is subject to comprehensive regulation and examination by the Pennsylvania Department of Banking and Securities and the Federal Deposit Insurance Corporation. Pursuant to changes in Pennsylvania law, ESSA Bank & Trust converted its charter from a Pennsylvania savings and loan association to a Pennsylvania savings bank. The charter change did not have a material effect on the operations of ESSA Bank & Trust.
ESSA Bank & Trust’s business consists primarily of accepting deposits from the general public and investing those deposits, together with funds generated from operations and borrowings, in residential first mortgage loans (including construction mortgage loans), commercial real estate loans, home equity loans and lines of credit, commercial and consumer loans (including indirect auto loans). We offer a variety of deposit accounts, including checking, savings and certificates of deposits. We also offer asset management and trust services. We offer investment services through our relationship with Cetera Investment Services LLC, a third party broker/dealer and investment advisor. We offer insurance benefit consulting services through our wholly owned subsidiary, ESSA Advisory Services, LLC.
ESSA Bank & Trust’s executive offices are located at 200 Palmer Street, Stroudsburg, Pennsylvania 18360. Our telephone number at this address is (570) 421-0531. Our website address is www.essabank.com.
1
Table of Contents
The Company is a public company, and files interim, quarterly and annual reports with the Securities and Exchange Commission (“SEC”). All filed SEC reports and interim filings can be obtained from the Bank’s website, on the “Investor Relations” page, without charge from the Company.
Market Area
At September 30, 2015, our 25 full-service banking offices consisted of 12 offices in Monroe County, six offices in Lehigh County, five offices in Northampton County, one office in Lackawanna County and one office in Luzerne County, Pennsylvania. Our primary market for deposits is currently concentrated around the areas where our full-service banking offices are located. Our primary lending area consists of the counties where our branch offices are located, and to a lesser extent, the contiguous counties in the Commonwealth of Pennsylvania.
Monroe County is located in eastern Pennsylvania, situated 90 miles north of Philadelphia, 75 miles west of New York and 116 miles northeast of Harrisburg. Monroe County is comprised of 611 square miles of mostly rural terrain. Major industries include tourism, construction and educational facilities. Northampton County is located south of Monroe County and directly borders New Jersey. Lehigh County is located southwest of Monroe County. Luzerne and Lackawanna Counties are located north of Monroe County. As of September 30, 2015, we had a deposit market share of approximately 30.19% in Monroe County, which represented the largest deposit market share in Monroe County, 2.59% in Northampton County, 1.39% in Lehigh County, 0.13% in Lackawanna County and 1.18% in Luzerne County.
Lending Activities
Historically, our principal lending activity has been the origination of first mortgage loans for the purchase, construction or refinancing of one- to four-family residential real property. In recent years, we have increased our originations of commercial loans, commercial real estate loans and indirect auto loans in an effort to increase interest income, diversify our loan portfolio, and better serve the community. Commercial real estate loans have increased from 10.6% of our total loan portfolio at September 30, 2011 to $200.0 million, or 18.0%, of our total loan portfolio at September 30, 2015. One- to four-family residential real estate mortgage loans represented $610.6 million, or 55.0%, of our loan portfolio at September 30, 2015. Home equity loans and lines of credit totaled $39.9 million, or 3.6%, of our loan portfolio at September 30, 2015. Commercial loans totaled $34.3 million, or 3.1%, of our loan portfolio at September 30, 2015 and construction first mortgage loans totaled $878,000, or 0.1%, of the total loan portfolio at September 30, 2015. Obligations of states and political subdivisions totaled $59.8 million, or 5.4%, of our loan portfolio at September 30, 2015. Auto loans totaled $162.2 million or 14.5% of the total loan portfolio at September 30, 2015. We originate other consumer loans on a limited basis.
Loan Portfolio Composition. The following table sets forth the composition of our loan portfolio, by type of loan at the dates indicated, excluding loans held for sale.
| At September 30, | ||||||||||||||||||||||||||||||||||||||||
| 2015 | 2014 | 2013 | 2012 | 2011 | ||||||||||||||||||||||||||||||||||||
| Amount | Percent | Amount | Percent | Amount | Percent | Amount | Percent | Amount | Percent | |||||||||||||||||||||||||||||||
| (Dollars in thousands) | ||||||||||||||||||||||||||||||||||||||||
| Residential first mortgage loans: |
||||||||||||||||||||||||||||||||||||||||
| One- to four-family |
$ | 610,582 | 55.0 | % | $ | 654,152 | 61.3 | % | $ | 686,651 | 73.3 | % | $ | 696,696 | 72.8 | % | $ | 583,599 | 78.1 | % | ||||||||||||||||||||
| Construction |
878 | 0.1 | 1,367 | 0.1 | 2,288 | 0.2 | 3,805 | 0.4 | 691 | 0.1 | ||||||||||||||||||||||||||||||
| Commercial |
34,314 | 3.1 | 25,807 | 2.4 | 10,125 | 1.1 | 12,818 | 1.3 | 14,766 | 2.0 | ||||||||||||||||||||||||||||||
| Commercial real estate |
200,004 | 18.0 | 190,536 | 17.9 | 159,469 | 17.0 | 160,192 | 16.7 | 79,362 | 10.6 | ||||||||||||||||||||||||||||||
| Obligations of states and political subdivisions |
59,820 | 5.4 | 49,177 | 4.6 | 33,445 | 3.6 | 33,736 | 3.5 | 25,869 | 3.5 | ||||||||||||||||||||||||||||||
| Home equity loans and lines of credit |
39,903 | 3.6 | 41,387 | 3.9 | 41,923 | 4.5 | 47,925 | 5.0 | 40,484 | 5.4 | ||||||||||||||||||||||||||||||
| Auto loans |
162,193 | 14.5 | 100,571 | 9.4 | 61 | — | 165 | — | 212 | — | ||||||||||||||||||||||||||||||
| Other |
3,343 | 0.3 | 3,904 | 0.4 | 2,332 | 0.3 | 2,320 | 0.3 | 1,806 | 0.3 | ||||||||||||||||||||||||||||||
|
|
|
|
|
|
|
|
|
|
|
|
|
|
|
|
|
|
|
|
|
|||||||||||||||||||||
| Total loans receivable |
$ | 1,111,037 | 100.0 | % | $ | 1,066,901 | 100.0 | % | $ | 936,294 | 100.0 | % | $ | 957,657 | 100.0 | % | $ | 746,789 | 100.0 | % | ||||||||||||||||||||
|
|
|
|
|
|
|
|
|
|
|
|||||||||||||||||||||||||||||||
| Allowance for loan losses |
(8,919 | ) | (8,634 | ) | (8,064 | ) | (7,302 | ) | (8,170 | ) | ||||||||||||||||||||||||||||||
|
|
|
|
|
|
|
|
|
|
|
|||||||||||||||||||||||||||||||
| Total loans receivable, net |
$ | 1,102,118 | $ | 1,058,267 | $ | 928,230 | $ | 950,355 | $ | 738,619 | ||||||||||||||||||||||||||||||
|
|
|
|
|
|
|
|
|
|
|
|||||||||||||||||||||||||||||||
2
Table of Contents
Loan Portfolio Maturities. The following table summarizes the scheduled repayments of our loan portfolio at September 30, 2015. Demand loans, loans having no stated repayment schedule or maturity, and overdraft loans are reported as being due in one year or less.
| One-to-four-family | Construction | Commercial | Commercial Real Estate | |||||||||||||
| (Dollars in thousands) | ||||||||||||||||
| Due During the Years Ending September 30, |
||||||||||||||||
| 2016 |
$ | 498 | $ | — | $ | 4,506 | $ | 18,007 | ||||||||
| 2017 |
1,444 | — | 1,915 | 19,161 | ||||||||||||
| 2018 |
7,217 | — | 712 | 14,272 | ||||||||||||
| 2019 to 2020 |
12,994 | — | 12,985 | 31,882 | ||||||||||||
| 2021 to 2025 |
102,799 | — | 10,556 | 28,473 | ||||||||||||
| 2026 to 2030 |
191,887 | — | 734 | 35,613 | ||||||||||||
| 2030 and beyond |
293,743 | 878 | 2,906 | 52,596 | ||||||||||||
|
|
|
|
|
|
|
|
|
|||||||||
| Total |
$ | 610,582 | $ | 878 | $ | 34,314 | $ | 200,004 | ||||||||
|
|
|
|
|
|
|
|
|
|||||||||
| Obligations of States and Political subdivisions |
Home Equity Loans and Lines of Credit |
Auto Loans | Other | Total | ||||||||||||||||
| (Dollars in thousands) | ||||||||||||||||||||
| Due During the Years Ending September 30, |
||||||||||||||||||||
| 2016 |
$ | 1,710 | $ | 1,268 | $ | 1,214 | $ | 312 | $ | 27,515 | ||||||||||
| 2017 |
850 | 850 | 4,796 | 160 | 29,176 | |||||||||||||||
| 2018 |
1,162 | 1,046 | 9,878 | 441 | 34,728 | |||||||||||||||
| 2019 to 2020 |
3,180 | 3,450 | 75,288 | 1,003 | 140,782 | |||||||||||||||
| 2021 to 2025 |
11,665 | 10,008 | 71,017 | 201 | 234,719 | |||||||||||||||
| 2026 to 2030 |
23,739 | 11,220 | — | 565 | 263,758 | |||||||||||||||
| 2030 and beyond |
17,514 | 12,061 | — | 661 | 380,359 | |||||||||||||||
|
|
|
|
|
|
|
|
|
|
|
|||||||||||
| Total |
$ | 59,820 | $ | 39,903 | $ | 162,193 | $ | 3,343 | $ | 1,111,037 | ||||||||||
|
|
|
|
|
|
|
|
|
|
|
|||||||||||
3
Table of Contents
The following table sets forth the scheduled repayments of fixed- and adjustable-rate loans at September 30, 2015 that are contractually due after September 30, 2016.
| Due After September 30, 2016 | ||||||||||||
| Fixed | Adjustable | Total | ||||||||||
| (In thousands) | ||||||||||||
| Residential first mortgage loans: |
||||||||||||
| One- to four-family |
$ | 574,388 | $ | 35,696 | $ | 610,084 | ||||||
| Construction |
878 | — | 878 | |||||||||
| Commercial |
24,614 | 5,194 | 29,808 | |||||||||
| Commercial real estate |
56,868 | 125,129 | 181,997 | |||||||||
| Obligations of states and political subdivisions |
24,839 | 33,271 | 58,110 | |||||||||
| Home equity loans and lines of credit |
13,713 | 24,922 | 38,635 | |||||||||
| Auto loans |
160,979 | — | 160,979 | |||||||||
| Other |
2,700 | 331 | 3,031 | |||||||||
|
|
|
|
|
|
|
|||||||
| Total |
$ | 858,979 | $ | 224,543 | $ | 1,083,522 | ||||||
|
|
|
|
|
|
|
|||||||
Loan Originations and Repayments. We originate residential mortgage loans pursuant to underwriting standards that generally conform to Fannie Mae and Freddie Mac guidelines. Loan origination activities are primarily concentrated in Monroe, Northampton, Lehigh, Lackawanna and Luzerne Counties, Pennsylvania and secondarily in other Pennsylvania counties contiguous to our primary market area. New loans are generated primarily from the efforts of employees and advertising, a network of select mortgage brokers, other parties with whom we do business, customer referrals, and from walk-in customers. Loan applications are centrally underwritten and processed at our corporate center.
One- to four-family Residential Loans. Historically, our principal lending activity has consisted of the origination of one- to four-family residential mortgage loans secured primarily by properties located in Monroe, Northampton, Lackawanna, Luzerne and Lehigh Counties, Pennsylvania. At September 30, 2015, approximately $610.6 million, or 55.0%, of our loan portfolio, consisted of one- to four-family residential loans. Our origination of one- to four-family loans increased in fiscal year 2015 compared to fiscal year 2014 and decreased compared to fiscal year 2013. Generally, one- to four-family residential mortgage loans are originated in amounts up to 80% of the lesser of the appraised value or purchase price of the property, although loans may be made with higher loan-to-value ratios if private mortgage insurance is specified to compensate for the risk. Fixed-rate loans are originated for terms of 10, 15, 20 and 30 years. At September 30, 2015, our largest loan secured by one- to four-family real estate had a principal balance of approximately $1.5 million and was secured by a single family house. This loan was performing in accordance with its repayment terms.
We also offer adjustable-rate mortgage loans which have initial fixed terms of one, three, five or seven-years before converting to an annual adjustment schedule based on changes in a designated United States Treasury index. We originated $2.2 of adjustable rate one- to four-family residential loans during the year ended September 30, 2015 and $897,000 during the year ended September 30, 2014. Our adjustable rate mortgage loans provide for maximum rate adjustments of 200 basis points per adjustment, with a lifetime maximum adjustment of 500 basis points. Our adjustable rate mortgage loans amortize over terms of up to 30 years.
Adjustable rate mortgage loans decrease the risk associated with changes in market interest rates by periodically repricing, but involve other risks. As interest rates increase, the principal and interest payments on the loan increase, thus increasing the potential for default by the borrower. At the same time, the marketability of the underlying collateral may be adversely affected by higher interest rates. Adjustment of the contractual interest rate is limited by the periodic and lifetime interest rate adjustments specified by our loan documents and therefore, is potentially limited in effectiveness during periods of rapidly rising interest rates. At September 30, 2015, $35.7 million, or 5.8%, of our one- to four-family residential loans had adjustable rates of interest.
All one- to four-family residential mortgage loans that we originate include “due-on-sale” clauses, which provides the right to declare a loan immediately due and payable in the event that the borrower sells or otherwise conveys title to the real property subject to the mortgage and the loan is not repaid.
4
Table of Contents
Regulations limit the amount that a savings bank may lend relative to the value of the real estate securing the loan, as determined by an appraisal of the property at the time the loan is originated. For all purchase money loans, we utilize outside independent appraisers approved by the Board of Directors. All purchase money and most refinance loans require a lender’s title insurance policy. Certain modest refinance requests may utilize an automated valuation model with an exterior inspection report and title search. We also require fire and casualty insurance and, where circumstances warrant, flood insurance.
Home Equity Loans and Lines of Credit. Home equity loans and lines of credit are generated by our loan originators. Eligible properties include primary and vacation homes in northeastern Pennsylvania, with the majority of loans being originated in Monroe, Northampton and Lehigh Counties. As of September 30, 2015, home equity loans and lines totaled about $39.9 million, or 3.6%, of our loan portfolio.
The maximum combined loan-to-value originated is currently 80%, depending on the collateral and the holder of the first mortgage. There is a small portion of the portfolio originated in years past that contains original combined loan-to-values of up to 90%. Our home equity lines of credit typically feature a 10 year draw period with interest-only payments permitted, followed by another 10 years of fully amortizing payments with no further ability to draw funds. Similar combined loan-to-value characteristics and standards exist for the lines as are outlined above for the loans.
Loan underwriting standards limit the maximum size of a junior lien loan to between $100,000 and $200,000, depending on the loan type and collateral. All loans exceeding 70-75% of value require an appraisal by bank-approved, licensed appraisers. Loans up to $25,000 with lesser loan-to-value ratios may utilize an automated valuation model. Title/lien searches are secured on all home equity loans and lines greater than $25,000.
Commercial Real Estate Loans. At September 30, 2015, $200.0 million, or 18.0%, of our total loan portfolio consisted of commercial real estate loans. Commercial real estate loans are secured by office buildings, mixed-use properties and other commercial properties. We generally originate adjustable rate commercial real estate loans with an initial term of five years and a repricing option, and a maximum term of up to 25 years. The maximum loan-to-value ratio for most commercial real estate loans is 75% to 80% and 85% for select loans with faster amortizations. At September 30, 2015, our largest commercial real estate relationship balance was $12.7 million, which was performing in accordance with its terms. At September 30, 2015, 46 of our loans secured by commercial real estate totaling $8.8 million were not performing in accordance with their terms and were on nonaccrual status.
We consider a number of factors in originating commercial real estate loans. We evaluate the qualifications and financial condition of the borrower, including credit history, profitability and expertise, as well as the value and condition of the mortgaged property securing the loan. When evaluating the qualifications of the borrower, we consider the financial resources of the borrower, the borrower’s experience in owning or managing similar property and the borrower’s payment history with us and other financial institutions. In evaluating the property securing the loan, the factors we consider include the net operating income of the mortgaged property before debt service and depreciation, the ratio of the loan amount to the appraised value of the mortgaged property and the debt service coverage ratio (the ratio of net operating income to debt service) to ensure that it is at least 120% of the monthly debt service. All commercial real estate loans in excess of $250,000 are appraised by outside independent appraisers approved by the Board of Directors. Personal guarantees are obtained from commercial real estate borrowers although we may occasionally waive this requirement given very strong loan to value and debt service coverage ratios. All purchase money and most asset refinance borrowers are required to obtain title insurance. We also require fire and casualty insurance and, where circumstances warrant, flood insurance.
Loans secured by commercial real estate generally are considered to present greater risk than one- to four-family residential loans. Commercial real estate loans often involve large loan balances to single borrowers or groups of related borrowers. Repayment of these loans depends to a large degree on the results of operations and management of the properties securing the loans or the businesses conducted on such property, and may be affected to a greater extent by adverse conditions in the real estate market or the economy in general. Accordingly, the nature of these loans makes them more difficult for management to monitor and evaluate.
First Mortgage Construction Loans. At September 30, 2015, $878,000, or 0.1%, of our total loan portfolio consisted of first mortgage construction loans. Our first mortgage construction loans are for the construction of residential properties. We currently offer fixed and adjustable-rate residential first mortgage construction loans. First mortgage construction loans are generally structured for permanent mortgage financing once the construction is completed. At September 30, 2015, our largest first mortgage construction loan balance was $294,000. The loan was performing in accordance with its terms. First mortgage construction loans will generally be made in amounts of up to 80% of the appraised value of the completed property, or the actual cost of the improvements. First mortgage construction loans require only the payment of interest during the construction period. Once converted to permanent financing, they generally repay over a 30 year period. Funds are disbursed based on our inspections in accordance with a schedule reflecting the completion of portions of the project.
5
Table of Contents
First mortgage construction loans generally involve a greater degree of credit risk than other one- to four-family residential mortgage loans. The risk of loss on a construction loan depends, in part, upon the accuracy of the initial estimate of the value of the property at completion of construction compared to the estimated cost of construction and the successful completion of construction within budget.
For all such loans, we utilize outside independent appraisers approved by the Board of Directors. All borrowers are required to obtain title insurance. We also require fire and casualty insurance and, where circumstances warrant, flood insurance on properties.
Commercial Loans. At September 30, 2015, approximately $34.3 million, or 3.1%, of our loan portfolio, consisted of commercial loans. We generally offer commercial loans to individuals and businesses located in our primary market area. The commercial loan portfolio includes lines of credit, equipment loans, vehicle loans, improvement loans and term loans. These loans are primarily secured by vehicles, machinery and equipment, inventory, accounts receivable, marketable securities, deposit accounts and real estate.
Obligations of States and Political Subdivisions. At September 30, 2015, $59.8 million, or 5.4%, of our total loan portfolio consisted of loan transactions including tax and revenue anticipation notes, general obligation notes, and authority general revenue notes. The financial strength of the state or political subdivision, type of transaction, relationship efforts, and profitability of return are considered when pricing and structuring each transaction.
Auto Loans. At September 30, 2015, $162.2 million, or 14.5% of our total loan portfolio consisted of auto loans. Franklin Security Bank specialized in indirect automobile lending. After the acquisition of Franklin Security Bank, ESSA retained a number of their experienced employees. Although collateralized, these loans require stringent underwriting standards and procedures. Each loan decision is based primarily on the credit history of the individual(s) and their ability to repay the loan. Collision and comprehensive insurance is required and the Bank must be listed as the loss payee.
Indirect auto loans are inherently risky as they are often secured by assets that depreciate rapidly. In some cases, repossessed collateral for a defaulted automobile loan may not provide an adequate source of repayment for the outstanding loan and the remaining deficiency may not warrant further substantial collection efforts against the borrower. Automobile loan collections depend on the borrower’s continuing financial stability, and therefore, are more likely to be adversely affected by job loss, divorce, illness, or personal bankruptcy.
Other Loans. We offer a variety of loans that are either unsecured or secured by property other than real estate. These loans include loans secured by deposits and personal unsecured loans. At September 30, 2015, these other loans totaled $3.3 million, or 0.3%, of the total loan portfolio.
Loan Approval Procedures and Authority. The loan approval process is intended to assess the borrower’s ability to repay the loan, the viability of the loan, and the adequacy of the value of the property that will secure the loan. To assess the borrower’s ability to repay, we review each borrower’s employment and credit history and information on the historical and projected income and expenses of mortgagors. For all loans the Board has granted lending authority to prescribed loan committees. Larger and more complex loan requests require the involvement of senior management or the Board.
Non-Performing Loans and Problem Assets
Performance of the loan portfolio is reviewed on a regular basis by Bank Management. A number of factors regarding the borrower, such as overall financial strength, collateral values and repayment ability, are considered in deciding what actions should be taken when determining the collectability of interest for accrual purposes.
When a loan, including a loan that is impaired, is classified as nonaccrual, the accrual of interest on such a loan is discontinued. A loan is typically classified as nonaccrual when the contractual payment of principal or interest has become 90 days past due or management has serious doubts about the further collectability of principal or interest, even though the loan is currently performing. A loan may remain on accrual status if it is in the process of collection and is either guaranteed or well secured. When a loan is placed on nonaccrual status, unpaid accrued interest is fully reversed. Interest payments received on nonaccrual loans are either applied against principal or reported as interest income, according to management’s judgment as to the collectability of principal.
Loans are usually restored to accrual status when the obligation is brought current, has performed in accordance with the contractual terms for a reasonable period of time, and the ultimate collectability of the total contractual principal and interest is no longer in doubt.
6
Table of Contents
Non-performing Loans. At September 30, 2015, $20.1 million, or 1.8% of our total loans, were non-performing loans. The majority of these loans were commercial real estate loans and residential mortgage loans. Commercial real estate loans totaled $8.8 million at September 30, 2015. Residential first mortgage loans that were 90 days or more past due or classified as non-performing troubled debt restructured loans totaled $9.8 million at September 30, 2015. In connection with the First Star Bank acquisition, the Company acquired loans with deteriorated credit quality totaling $12.9 million. These loans were carried at $7.5 million at September 30, 2012 and contributed to the significant increase in non-performing loans at September 30, 2012 compared to non-performing loans at September 30, 2011. These loans were adjusted to fair market value at the time of acquisition. The Company acquired no loans with deteriorated credit quality in connection with the acquisition of Franklin Security Bank in April 2014, or the assets from First National Community Bank in January 2014.
Real Estate Owned. At September 30, 2015, the Company had $2.5 million of real estate owned consisting of 33 properties. These properties are being carried on the Company’s books at fair value less estimated costs to sell. All these properties are being actively marketed and additional losses may occur.
Non-Performing Assets. The table below sets forth the amounts and categories of our non-performing assets at the dates indicated.
| At September 30, | ||||||||||||||||||||
| 2015 | 2014 | 2013 | 2012 | 2011 | ||||||||||||||||
| (Dollars in thousands) | ||||||||||||||||||||
| Non-accrual loans: |
||||||||||||||||||||
| Residential first mortgage loans: |
||||||||||||||||||||
| One- to four-family |
$ | 9,772 | $ | 9,778 | $ | 10,945 | $ | 10,536 | $ | 6,854 | ||||||||||
| Construction |
— | — | — | — | — | |||||||||||||||
| Commercial |
416 | 1,243 | 1,177 | 1,870 | 306 | |||||||||||||||
| Commercial real estate |
8,840 | 10,612 | 10,818 | 10,909 | 3,502 | |||||||||||||||
| Home equity loans and lines of credit |
690 | 259 | 339 | 373 | 248 | |||||||||||||||
| Auto loans |
366 | — | — | — | — | |||||||||||||||
| Other |
21 | 20 | — | 19 | 61 | |||||||||||||||
|
|
|
|
|
|
|
|
|
|
|
|||||||||||
| Total |
20,105 | 21,912 | 23,279 | 23,707 | 10,971 | |||||||||||||||
|
|
|
|
|
|
|
|
|
|
|
|||||||||||
| Accruing loans 90 days or more past due: |
||||||||||||||||||||
| Residential first mortgage loans: |
||||||||||||||||||||
| One- to four-family |
— | — | — | — | — | |||||||||||||||
| Construction |
— | — | — | — | — | |||||||||||||||
| Commercial |
— | — | — | — | — | |||||||||||||||
| Commercial real estate |
— | — | — | — | — | |||||||||||||||
| Home equity loans and lines of credit |
— | — | — | — | — | |||||||||||||||
| Auto Loans |
— | — | — | — | — | |||||||||||||||
| Other |
— | — | — | — | — | |||||||||||||||
|
|
|
|
|
|
|
|
|
|
|
|||||||||||
| Total loans 90 days or more past due |
— | — | — | — | — | |||||||||||||||
|
|
|
|
|
|
|
|
|
|
|
|||||||||||
| Non-performing troubled debt restructurings |
— | 238 | 585 | 533 | 529 | |||||||||||||||
|
|
|
|
|
|
|
|
|
|
|
|||||||||||
| Total non-performing loans |
20,105 | 22,150 | 23,864 | 24,240 | 11,500 | |||||||||||||||
|
|
|
|
|
|
|
|
|
|
|
|||||||||||
| Real estate owned |
2,480 | 2,759 | 2,111 | 2,998 | 2,356 | |||||||||||||||
| Other repossessed assets |
64 | 69 | — | — | — | |||||||||||||||
|
|
|
|
|
|
|
|
|
|
|
|||||||||||
| Total non-performing assets |
$ | 22,649 | $ | 24,978 | $ | 25,975 | $ | 27,238 | $ | 13,856 | ||||||||||
|
|
|
|
|
|
|
|
|
|
|
|||||||||||
| Troubled debt restructurings:* |
||||||||||||||||||||
| Residential first mortgage loans: |
||||||||||||||||||||
| One- to four-family |
$ | 6,575 | $ | 5,302 | $ | 6,024 | $ | 7,342 | $ | 5,430 | ||||||||||
| Construction |
— | — | — | — | — | |||||||||||||||
| Commercial |
— | — | 18 | 227 | 120 | |||||||||||||||
7
Table of Contents
| At September 30, | ||||||||||||||||||||
| 2015 | 2014 | 2013 | 2012 | 2011 | ||||||||||||||||
| (Dollars in thousands) | ||||||||||||||||||||
| Commercial real estate |
800 | 1,381 | 1,582 | 5,344 | 4,372 | |||||||||||||||
| Home equity loans and lines of credit |
264 | 103 | 197 | 167 | 250 | |||||||||||||||
| Auto loans |
— | — | — | — | — | |||||||||||||||
| Other |
— | — | — | — | 58 | |||||||||||||||
|
|
|
|
|
|
|
|
|
|
|
|||||||||||
| Total |
$ | 7,639 | $ | 6,786 | $ | 7,821 | $ | 13,080 | $ | 10,230 | ||||||||||
|
|
|
|
|
|
|
|
|
|
|
|||||||||||
| Ratios: |
||||||||||||||||||||
| Total non-performing loans to total loans |
1.81 | % | 2.08 | % | 2.55 | % | 2.53 | % | 1.54 | % | ||||||||||
| Total non-performing loans to total assets |
1.25 | % | 1.41 | % | 1.74 | % | 1.71 | % | 1.05 | % | ||||||||||
| Total non-performing assets to total assets |
1.41 | % | 1.58 | % | 1.89 | % | 1.92 | % | 1.26 | % | ||||||||||
| * | Non-performing troubled debt restructurings are included in total troubled debt restructurings for September 30, 2015 as part of the non-performing assets table. |
For the year ended September 30, 2015, gross interest income that would have been recorded had our non-accruing loans been current in accordance with their original terms was $188,000.
At September 30, 2015, the principal balance of troubled debt restructures was $7.6 million as compared to $6.8 million at September 30, 2014. Of the $7.6 million of troubled debt restructures at September 30, 2015, $2.0 million are performing loans and $5.6 million are non-accrual loans.
Of the 61 loans that make up our troubled debt restructures at September 30, 2015, no loans were granted a rate concession at a below market interest rate, 25 loans with balances totaling $3.5 million were granted market rate and terms concessions, 25 loans with balances totaling $3.1 million were granted terms concessions and 11 loans with balances totaling $964,000 were granted interest rate concessions.
Residential real estate loans made up the vast majority of our troubled debt restructures at September 30, 2015, and were comprised of 52 residential loans totaling $6.6 million, 6 commercial and commercial real estate loans totaling $800,000, and 3 consumer loans (home equity loans, home equity lines of credit, and other) totaling $264,000.
For the year ended September 30, 2015, 15 loans totaling $2.1 million were removed from TDR status, 2 loans totaling $308,000 were transferred to foreclosed real estate, 12 loans for $1.6 million had completed timely payments, and 1 loan totaling $198,000 was paid off.
We have modified terms of performing loans that do not meet the definition of a TDR. The vast majority of such loans were simply rate modifications of residential first mortgage loans in lieu of refinancing. The non-TDR rate modifications were all performing loans when the rates were reset to current market rates. For the year ended September 30, 2015, we modified 45 loans totaling $5.9 million. With regard to commercial loans, including commercial real estate loans, various non-troubled loans were modified, either for the purpose of a rate reduction to reflect current market rates (in lieu of a refinance) or the extension of a loan’s maturity date. In total we modified 21 commercial loans with an aggregate balance of approximately $12.2 million for the year ended September 30, 2015.
8
Table of Contents
Delinquencies. The following table sets forth certain information with respect to our loan portfolio delinquencies at the dates indicated. Loans delinquent for 90 days or more are generally classified as nonaccrual loans.
| Loans Delinquent For | ||||||||||||||||||||||||
| 60-89 Days | 90 Days and Over | Total | ||||||||||||||||||||||
| Number | Amount | Number | Amount | Number | Amount | |||||||||||||||||||
| (Dollars in thousands) | ||||||||||||||||||||||||
| At September 30, 2015 |
||||||||||||||||||||||||
| Residential first mortgage loans: |
||||||||||||||||||||||||
| One- to four-family |
$ | 9 | $ | 1,045 | $ | 94 | $ | 9,772 | $ | 103 | $ | 10,817 | ||||||||||||
| Construction |
— | — | — | — | — | — | ||||||||||||||||||
| Commercial |
1 | 7 | 8 | 416 | 9 | 423 | ||||||||||||||||||
| Commercial real estate |
4 | 587 | 46 | 8,840 | 50 | 9,427 | ||||||||||||||||||
| Obligations of states and political subdivisions |
— | — | — | — | — | — | ||||||||||||||||||
| Home equity loans and lines of credit |
1 | 45 | 20 | 690 | 21 | 735 | ||||||||||||||||||
| Auto loans |
12 | 180 | 24 | 366 | 36 | 546 | ||||||||||||||||||
| Other |
— | — | 3 | 21 | 3 | 21 | ||||||||||||||||||
|
|
|
|
|
|
|
|
|
|
|
|
|
|||||||||||||
| Total |
$ | 27 | $ | 1,864 | $ | 195 | $ | 20,105 | $ | 222 | $ | 21,969 | ||||||||||||
|
|
|
|
|
|
|
|
|
|
|
|
|
|||||||||||||
| At September 30, 2014 |
||||||||||||||||||||||||
| Residential first mortgage loans: |
||||||||||||||||||||||||
| One- to four-family |
$ | 14 | $ | 1,393 | $ | 100 | $ | 9,778 | $ | 114 | $ | 11,171 | ||||||||||||
| Construction |
— | — | — | — | — | — | ||||||||||||||||||
| Commercial |
3 | 30 | 21 | 1,243 | 24 | 1,273 | ||||||||||||||||||
| Commercial real estate |
2 | 89 | 54 | 10,612 | 56 | 10,701 | ||||||||||||||||||
| Obligations of states and political subdivisions |
— | — | — | — | — | — | ||||||||||||||||||
| Home equity loans and lines of credit |
3 | 33 | 18 | 259 | 21 | 292 | ||||||||||||||||||
| Auto loans |
4 | 33 | — | — | 4 | 33 | ||||||||||||||||||
| Other |
— | — | 2 | 20 | 2 | 20 | ||||||||||||||||||
|
|
|
|
|
|
|
|
|
|
|
|
|
|||||||||||||
| Total |
$ | 26 | $ | 1,578 | $ | 195 | $ | 21,912 | $ | 221 | $ | 23,490 | ||||||||||||
|
|
|
|
|
|
|
|
|
|
|
|
|
|||||||||||||
| At September 30, 2013 |
||||||||||||||||||||||||
| Residential first mortgage loans: |
||||||||||||||||||||||||
| One- to four-family |
$ | 8 | $ | 990 | $ | 92 | $ | 10,945 | $ | 100 | $ | 11,935 | ||||||||||||
| Construction |
— | — | — | — | — | — | ||||||||||||||||||
| Commercial |
— | — | 19 | 1,177 | 19 | 1,177 | ||||||||||||||||||
| Commercial real estate |
— | — | 61 | 10,818 | 61 | 10,818 | ||||||||||||||||||
| Obligations of states and political subdivisions |
— | — | — | — | — | — | ||||||||||||||||||
| Home equity loans and lines of credit |
4 | 77 | 10 | 339 | 14 | 416 | ||||||||||||||||||
| Auto loans |
— | — | — | — | — | — | ||||||||||||||||||
| Other |
— | — | — | — | — | — | ||||||||||||||||||
|
|
|
|
|
|
|
|
|
|
|
|
|
|||||||||||||
| Total |
$ | 12 | $ | 1,067 | $ | 182 | $ | 23,279 | $ | 194 | $ | 24,346 | ||||||||||||
|
|
|
|
|
|
|
|
|
|
|
|
|
|||||||||||||
| At September 30, 2012 |
||||||||||||||||||||||||
| Residential first mortgage loans: |
||||||||||||||||||||||||
| One- to four-family |
$ | 11 | $ | 1,274 | $ | 78 | $ | 10,536 | $ | 89 | $ | 11,810 | ||||||||||||
| Construction |
— | — | — | — | — | — | ||||||||||||||||||
| Commercial |
— | — | 27 | 1,870 | 27 | 1,870 | ||||||||||||||||||
| Commercial real estate |
3 | 3,348 | 59 | 10,909 | 62 | 14,257 | ||||||||||||||||||
| Obligations of states and political subdivisions |
— | — | — | — | — | — | ||||||||||||||||||
| Home equity loans and lines of credit |
4 | 138 | 15 | 373 | 19 | 511 | ||||||||||||||||||
| Auto loans |
— | — | — | — | — | — | ||||||||||||||||||
| Other |
— | — | 1 | 19 | 1 | 19 | ||||||||||||||||||
|
|
|
|
|
|
|
|
|
|
|
|
|
|||||||||||||
| Total |
$ | 18 | $ | 4,760 | $ | 180 | $ | 23,707 | $ | 198 | $ | 28,467 | ||||||||||||
|
|
|
|
|
|
|
|
|
|
|
|
|
|||||||||||||
| At September 30, 2011 |
||||||||||||||||||||||||
| Residential first mortgage loans: |
||||||||||||||||||||||||
| One- to four-family |
$ | 7 | $ | 928 | $ | 40 | $ | 6,854 | $ | 47 | $ | 7,782 | ||||||||||||
| Construction |
— | — | — | — | — | — | ||||||||||||||||||
| Commercial |
1 | 1 | 7 | 306 | 8 | 307 | ||||||||||||||||||
| Commercial real estate |
— | — | 17 | 3,502 | 17 | 3,502 | ||||||||||||||||||
| Home equity loans and lines of credit |
— | — | — | — | — | — | ||||||||||||||||||
| Auto loans |
5 | 187 | 8 | 248 | 13 | 435 | ||||||||||||||||||
| Other |
1 | 2 | 2 | 61 | 3 | 63 | ||||||||||||||||||
|
|
|
|
|
|
|
|
|
|
|
|
|
|||||||||||||
| Total |
$ | 14 | $ | 1,118 | $ | 74 | $ | 10,971 | $ | 88 | $ | 12,089 | ||||||||||||
|
|
|
|
|
|
|
|
|
|
|
|
|
|||||||||||||
9
Table of Contents
Classified Assets. Banking regulations and our Asset Classification Policy provide that loans and other assets considered to be of lesser quality should be classified as “Substandard,” “Doubtful” or “Loss” assets. An asset is considered Substandard if it is inadequately protected by the current net worth and paying capacity of the obligor or of the collateral pledged, if any. Substandard assets include those characterized by the distinct possibility that the institution will sustain some loss if the deficiencies are not corrected. Assets classified as Doubtful have all of the weaknesses inherent in those classified Substandard, with the added characteristic that the weaknesses present make collection or liquidation in full, on the basis of currently existing facts, conditions, and values, highly questionable and improbable. Assets classified as Loss are those considered uncollectible and of such little value that their continuance as assets without the establishment of a specific loss reserve is not warranted. We classify an asset as “Special Mention” if the asset has a potential weakness that warrants management’s close attention. While such assets are not impaired, management has concluded that if the potential weakness in the asset is not addressed, the value of the asset may deteriorate, thereby adversely affecting the repayment of the asset.
At September 30, 2015, the Company classified approximately $8.7 million of our assets as special mention of which $4.5 million were commercial and commercial real estate loans, $36.6 million as substandard of which $21.5 million were commercial and commercial real estate loans. No loans were classified doubtful or loss. On the basis of management’s review of its assets, at September 30, 2014, we classified approximately $14.4 million of our assets as special mention of which $8.4 million were commercial and commercial real estate loans, $41.4 million as substandard of which $22.1 million were commercial and commercial real estate loans, $298,000 of commercial real estate as doubtful and none as loss.
The loan portfolio is reviewed on a regular basis to determine whether any loans require classification in accordance with applicable regulations. Not all classified assets constitute non-performing assets.
Allowance for Loan Losses
Our allowance for loan losses is maintained at a level necessary to absorb loan losses that are both probable and reasonably estimable. Management, in determining the allowance for loan losses, considers the losses inherent in its loan portfolio and changes in the nature and volume of loan activities, along with the general economic and real estate market conditions. Our allowance for loan losses consists of two elements: (1) an allocated allowance, which comprises allowances established on specific loans and class allowances based on historical loss experience and current trends, and (2) an unallocated allowance based on general economic conditions and other risk factors in our markets and portfolios. We maintain a loan review system, which allows for a periodic review (at least quarterly) of our loan portfolio and the early identification of potential impaired loans. Such system takes into consideration, among other things, delinquency status, size of loans, type and market value of collateral and financial condition of the borrowers. Specific loan loss allowances are established for identified losses based on a review of such information. A loan evaluated for impairment is considered to be impaired when, based on current information and events, it is probable that we will be unable to collect all amounts due according to the contractual terms of the loan agreement. All loans identified as impaired are evaluated independently. We do not aggregate such loans for evaluation purposes. Loan impairment is measured based on the fair value of collateral method, taking into account the appraised value, any valuation assumptions used, estimated costs to sell and trends in the market since the appraisal date. General loan loss allowances are based upon a combination of factors including, but not limited to, actual loan loss experience, composition of the loan portfolio, current economic conditions, management’s judgment and losses which are probable and reasonably estimable. The allowance is increased through provisions charged against current earnings and recoveries of previously charged-off loans. Loans that are determined to be uncollectible are charged against the allowance. While management uses available information to recognize probable and reasonably estimable loan losses, future loss provisions may be necessary based on changing economic conditions. Payments received on impaired loans generally are either applied against principal or reported as interest income, according to management’s judgment as to the collectability of principal. The allowance for loan losses as of September 30, 2015 is maintained at a level that represents management’s best estimate of losses inherent in the loan portfolio, and such losses were both probable and reasonably estimable.
In addition, the Federal Reserve Board of Governors (the “Federal Reserve Board”), the FDIC and the Pennsylvania Department of Banking and Securities, as an integral part of their examination process, periodically review our allowance for loan losses. The banking regulators may require that we recognize additions to the allowance based on their analysis and review of information available to them at the time of their examination.
10
Table of Contents
The following table sets forth activity in our allowance for loan losses for the periods indicated.
| At or For the Years Ended September 30, |
||||||||||||||||||||
| 2015 | 2014 | 2013 | 2012 | 2011 | ||||||||||||||||
| (Dollars in thousands) | ||||||||||||||||||||
| Balance at beginning of year |
$ | 8,634 | $ | 8,064 | $ | 7,302 | $ | 8,170 | $ | 7,448 | ||||||||||
| Charge-offs: |
||||||||||||||||||||
| Residential first mortgage loans: |
||||||||||||||||||||
| One- to four-family |
(1,359 | ) | (1,709 | ) | (2,401 | ) | (2,366 | ) | (1,175 | ) | ||||||||||
| Construction |
— | — | — | — | — | |||||||||||||||
| Commercial |
(30 | ) | (101 | ) | — | (31 | ) | (131 | ) | |||||||||||
| Commercial real estate |
(65 | ) | (120 | ) | (403 | ) | (987 | ) | — | |||||||||||
| Obligations of states and political subdivisions |
— | — | — | — | — | |||||||||||||||
| Home equity loans and lines of credit |
(27 | ) | (145 | ) | (243 | ) | (380 | ) | (188 | ) | ||||||||||
| Auto loans |
(596 | ) | — | — | — | — | ||||||||||||||
| Other |
(6 | ) | (3 | ) | (6 | ) | (13 | ) | (4 | ) | ||||||||||
|
|
|
|
|
|
|
|
|
|
|
|||||||||||
| Total charge-offs |
(2,083 | ) | (2,078 | ) | (3,053 | ) | (3,777 | ) | (1,498 | ) | ||||||||||
|
|
|
|
|
|
|
|
|
|
|
|||||||||||
| Recoveries: |
||||||||||||||||||||
| Residential first mortgage loans: |
||||||||||||||||||||
| One- to four-family |
76 | 163 | 50 | 291 | 146 | |||||||||||||||
| Construction |
— | — | — | — | — | |||||||||||||||
| Commercial |
23 | 20 | — | 26 | 2 | |||||||||||||||
| Commercial real estate |
84 | 94 | 2 | 7 | — | |||||||||||||||
| Obligations of states and political subdivisions |
— | — | — | — | — | |||||||||||||||
| Home equity loans and lines of credit |
15 | 18 | 13 | 33 | 14 | |||||||||||||||
| Auto loans |
87 | — | — | — | — | |||||||||||||||
| Other |
8 | 3 | — | 2 | 3 | |||||||||||||||
|
|
|
|
|
|
|
|
|
|
|
|||||||||||
| Total recoveries |
293 | 298 | 65 | 359 | 165 | |||||||||||||||
|
|
|
|
|
|
|
|
|
|
|
|||||||||||
| Net charge-offs |
(1,790 | ) | (1,780 | ) | (2,988 | ) | (3,418 | ) | (1,333 | ) | ||||||||||
| Provision for loan losses |
2,075 | 2,350 | 3,750 | 2,550 | 2,055 | |||||||||||||||
|
|
|
|
|
|
|
|
|
|
|
|||||||||||
| Balance at end of year |
$ | 8,919 | $ | 8,634 | $ | 8,064 | $ | 7,302 | $ | 8,170 | ||||||||||
|
|
|
|
|
|
|
|
|
|
|
|||||||||||
| Ratios: |
||||||||||||||||||||
| Net charge-offs to average loans outstanding |
0.17 | % | 0.17 | % | 0.32 | % | 0.44 | % | 0.18 | % | ||||||||||
| Allowance for loan losses to non-performing loans at end of year |
44.36 | % | 38.98 | % | 33.79 | % | 30.12 | % | 71.04 | % | ||||||||||
| Allowance for loan losses to total loans at end of year |
0.80 | % | 0.81 | % | 0.86 | % | 0.76 | % | 1.09 | % | ||||||||||
Loans acquired by the Company as a result of the Company’s merger with First Star Bank, which closed on July 31, 2012, and Franklin Security Bank, which closed on April 4, 2014, were recorded at fair value on the purchase date without the carryover of any related allowance for loan losses. At each reporting date subsequent to their purchase, these loans have been included in the Company’s evaluation of the adequacy of its allowance for loan losses. At September 30, 2012, there were $207.1 million of former First Star loans without an accompanying allowance for loan loss included in the Company’s total loans when calculating the allowance for loan losses to total loans ratio. These loans were a significant factor in the decline of this ratio from 1.09% at September 30, 2011 to 0.76% at September 30, 2012. At September 30, 2013, there were $155.4 million of loans of former First Star loans included in the Company’s total loans when calculating the loan loss to total loans ratio. At September 30, 2013 there was an allowance for loan losses of $257,000 related to First Star loan that was included in the allowance for loan losses. This loan was not a significant factor in the increase in the allowance for loan losses to total loans ratio from 0.76% at September 30, 2012 to 0.86% at September 30, 2013. At September 30, 2014, there were $133.1 million of former First Star loans and $128.6 of former Franklin Security loans without an accompanying allowance for loan loss included in the Company’s total loans when calculating the allowance for loan losses to total loans ratio. These loans were a significant factor in the decline of this ratio from 0.86% at September 30, 2013 to 0.81% at September 30, 2014. At September 30, 2015, there were $111.4 million of former First Star loans and
11
Table of Contents
$88.9 million of former Franklin Security loans without an accompanying allowance for loan loss included in the Company’s total loans when calculating the allowance for loan losses to total loans ratio. These loans were not a significant factor in the decline of this ratio from 0.81% at September 30, 2014 to 0.80% at September 30, 2015. At September 30, 2012, there were $9.4 million of former First Star loans, without an accompanying allowance for loan losses included in the Company’s total loans when calculating the allowance for loan losses to non-performing loans (ALL to NPL) ratio. These loans were a significant factor in the decline in the ALL to NPL ratio from 71.04% at September 30, 2011 to 30.12% at September 30, 2012. At September 30, 2013, there were $7.3 million of former First Star loans included in the Company’s total loans when calculating the ALL to NPL ratio. At September 30, 2013 there was an allowance for loan losses of $257,000 related to one of these loans that was included in the allowance for loan losses. These loans were not a significant factor in the increase in the ALL to NPL ratio to 33.79% at September 30, 2013 from 30.12% at September 30, 2012. At September 30, 2014, there were $11.2 million of former First Star loans and $1.6 million of former Franklin Security loans included in the Company’s total loans when calculating the ALL to NPL ratio. At September 30, 2014 there was an allowance for loan losses of $66,000 related to one of these loans included in the Company’s total loans when calculating that was included in the allowance for loan losses. These loans were not a significant factor in the increase in the ALL to NPL ratio from 33.79% at September 30, 2013 to 38.98% at September 30, 2014. At September 30, 2015, there were $6.1 million of former First Star loans and $1.8 million of former Franklin Security loans included in the Company’s total loans when calculating the ALL to NPL ratio. At September 30, 2015 there was an allowance for loan losses of $266,000 related to these loans included in the Company’s total loans when calculating that was included in the allowance for loan losses. These loans were not a significant factor in the increase in the ALL to NPL ratio from 38.98% at September 30, 2014 to 44.36% at September 30, 2015.
As previously disclosed, the Bank’s primary federal regulator was changed from the Office of Thrift Supervision (“OTS”) to the Federal Deposit Insurance Corporation (“FDIC”) in July 2011. Because the FDIC places a different emphasis on the timing of charge-offs than the OTS did, the Company determined that a change to its allowance for loan loss process was necessary. Previously, where a loan loss was considered likely and that loss was measured, a specific allocation of the Company’s allowance for loan losses was made to cover this loss. Actual losses were charged off when the loan in question was foreclosed upon. Beginning in March of 2012, these likely losses are being charged-off against the allowance for loan losses when determined. The Company does not believe that these additional charge-offs reflect any deterioration of the credit quality of the Company’s loan portfolio. These charge-offs did, however, reduce the balance of the Company’s allowance for loan losses by a corresponding amount. Further, the Company believes that these charge-offs have also reduced the risk perceived in the loan portfolio and that the loans loss allowance at September 30, 2015 is reasonable and adequate.
See “Non-Performing Loans and Problem Assets.” There can be no assurance that we will not experience a deterioration of our loan portfolio, including increases in non-performing loans, problem assets and charge-offs, in the future.
12
Table of Contents
Allocation of Allowance for Loan Losses. The following tables set forth the allowance for loan losses allocated by loan category, the percent of the allowance to the total allowance and the percent of loans in each category to total loans at the dates indicated. The allowance for loan losses allocated to each category is not necessarily indicative of future losses in any particular category and does not restrict the use of the allowance to absorb losses in other categories.
| 2015 | 2014 | 2013 | ||||||||||||||||||||||||||||||||||
| Amount | Percent of Allowance to Total Allowance |
Percent of Loans in Category to Total Loans |
Amount | Percent of Allowance to Total Allowance |
Percent of Loans in Category to Total Loans |
Amount | Percent of Allowance to Total Allowance |
Percent of Loans in Category to Total Loans |
||||||||||||||||||||||||||||
| (Dollars in thousands) | ||||||||||||||||||||||||||||||||||||
| Residential first mortgage loans: |
||||||||||||||||||||||||||||||||||||
| One- to four-family |
$ | 5,140 | 57.63 | % | 55.00 | % | $ | 5,573 | 64.54 | % | 61.30 | % | $ | 5,787 | 71.76 | % | 73.34 | % | ||||||||||||||||||
| Construction |
7 | 0.08 | 0.10 | 11 | 0.13 | 0.13 | 20 | 0.25 | 0.24 | |||||||||||||||||||||||||||
| Commercial |
693 | 7.77 | 3.10 | 528 | 6.12 | 2.42 | 337 | 4.18 | 1.08 | |||||||||||||||||||||||||||
| Commercial real estate |
671 | 7.52 | 18.00 | 663 | 7.68 | 17.86 | 946 | 11.73 | 17.03 | |||||||||||||||||||||||||||
| Obligations of states and political subdivisions |
189 | 2.12 | 5.40 | 163 | 1.89 | 4.61 | 130 | 1.61 | 3.57 | |||||||||||||||||||||||||||
| Home equity loans and lines of credit |
461 | 5.17 | 3.60 | 470 | 5.44 | 3.88 | 430 | 5.33 | 4.48 | |||||||||||||||||||||||||||
| Auto loans |
1,570 | 17.60 | 14.50 | 459 | 5.32 | 9.43 | — | — | — | |||||||||||||||||||||||||||
| Other |
27 | 0.30 | 0.30 | 32 | 0.37 | 0.37 | 21 | 0.26 | 0.26 | |||||||||||||||||||||||||||
|
|
|
|
|
|
|
|
|
|
|
|
|
|
|
|
|
|
|
|||||||||||||||||||
| Total allocated allowance |
8,758 | 98.19 | 100.00 | 7,899 | 91.49 | 100.00 | 7,671 | 95.12 | 100.00 | |||||||||||||||||||||||||||
| Unallocated allowance |
161 | 1.81 | — | 735 | 8.51 | — | 393 | 4.88 | — | |||||||||||||||||||||||||||
|
|
|
|
|
|
|
|
|
|
|
|
|
|
|
|
|
|
|
|||||||||||||||||||
| Total allowance for loan losses |
$ | 8,919 | 100.00 | % | 100.00 | % | $ | 8,634 | 100.00 | % | 100.00 | % | $ | 8,064 | 100.00 | % | 100.00 | % | ||||||||||||||||||
|
|
|
|
|
|
|
|
|
|
|
|
|
|
|
|
|
|
|
|||||||||||||||||||
| 2012 | 2011 | |||||||||||||||||||||||
| Amount | Percent of Allowance to Total Allowance |
Percent of Loans in Category to Total Loans |
Amount | Percent of Allowance to Total Allowance |
Percent of Loans in Category to Total Loans |
|||||||||||||||||||
| (Dollars in thousands) | ||||||||||||||||||||||||
| Residential first mortgage loans: |
||||||||||||||||||||||||
| One- to four-family |
$ | 5,401 | 73.97 | % | 72.75 | % | $ | 5,220 | 63.89 | % | 78.10 | % | ||||||||||||
| Construction |
29 | 0.40 | 0.40 | 8 | 0.10 | 0.10 | ||||||||||||||||||
| Commercial |
474 | 6.49 | 1.34 | 500 | 6.12 | 2.00 | ||||||||||||||||||
| Commercial real estate |
699 | 9.57 | 16.73 | 1,329 | 16.26 | 10.63 | ||||||||||||||||||
| Obligations of states and political subdivisions |
127 | 1.74 | 3.52 | — | — | 3.47 | ||||||||||||||||||
| Home equity loans and lines of credit |
499 | 6.83 | 5.00 | 622 | 7.62 | 5.40 | ||||||||||||||||||
| Auto Loans |
— | — | — | — | — | — | ||||||||||||||||||
| Other |
22 | 0.30 | 0.26 | 80 | 0.98 | 0.30 | ||||||||||||||||||
|
|
|
|
|
|
|
|
|
|
|
|
|
|||||||||||||
| Total allocated allowance |
7,251 | 99.30 | 100.00 | 7,759 | 94.97 | 100.00 | ||||||||||||||||||
| Unallocated allowance |
51 | 0.70 | — | 411 | 5.03 | — | ||||||||||||||||||
|
|
|
|
|
|
|
|
|
|
|
|
|
|||||||||||||
| Total allowance for loan losses |
$ | 7,302 | 100.00 | % | 100.00 | % | $ | 8,170 | 100.00 | % | 100.00 | % | ||||||||||||
|
|
|
|
|
|
|
|
|
|
|
|
|
|||||||||||||
We use the accrual method of accounting for all performing loans. The accrual of interest income is generally discontinued when the contractual payment of principal or interest has become 90 days past due or management has serious doubts about further collectability of principal or interest, even though the loan is currently performing. When a loan is placed on nonaccrual status, unpaid interest previously credited to income is reversed. Interest received on nonaccrual loans is applied against principal. Generally, residential and consumer loans are restored to accrual status when the obligation is brought current in accordance with the contractual terms for a reasonable period of time and ultimate collectability of total contractual principal and interest is no longer in doubt. Commercial loans are restored to accrual status when the obligation is brought current, has performed in accordance with the contractual terms for a reasonable period of time and ultimate collectability of total contractual principal and interest no longer is in doubt.
13
Table of Contents
In our collection efforts, we will first attempt to cure any delinquent loan. If a real estate secured loan is placed on nonaccrual status, it will be subject to transfer to the real estate owned (“REO”) portfolio (comprised of properties acquired by or in lieu of foreclosure), upon which our loan servicing department will pursue the sale of the real estate. Prior to this transfer, the loan balance will be reduced, if necessary, to reflect its current market value less estimated costs to sell. Write downs of REO that occur after the initial transfer from the loan portfolio and costs of holding the property are recorded as other operating expenses, except for significant improvements which are capitalized to the extent that the carrying value does not exceed estimated net realizable value.
Fair values for determining the value of collateral are estimated from various sources, such as real estate appraisals, financial statements and from any other reliable sources of available information. For those loans deemed to be impaired, collateral value is reduced for the estimated costs to sell. Reductions of collateral value are based on historical loss experience, current market data, and any other source of reliable information specific to the collateral.
This analysis process is inherently subjective, as it requires us to make estimates that are susceptible to revisions as more information becomes available. Although we believe that we have established the allowance at levels to absorb probable and estimable losses, future additions may be necessary if economic or other conditions in the future differ from the current environment.
Securities Activities
Our securities investment policy is established by our Board of Directors. This policy dictates that investment decisions be made based on the safety of the investment, liquidity requirements, potential returns, cash flow targets, and consistency with our interest rate risk management strategy. Our investment policy is reviewed annually by our ALCO/Investment management committee. All policy changes recommended by this management committee must be approved by the Board of Directors. The Committee is comprised of the Chief Executive Officer, Chief Financial Officer, Controller, Chief Operating Officer and the Senior Vice President Administration/Operations. Authority to make investments under the approved guidelines is delegated by the Committee to appropriate officers. While general investment strategies are developed and authorized by the ALCO/Investment management committee, the execution of specific actions rests with the Chief Financial Officer.
The approved investment officers are authorized to execute investment transactions up to $5.0 million per transaction without the prior approval of the ALCO/Investment management committee and within the scope of the established investment policy. These officers are also authorized to execute investment transactions between $5.0 million and $10.0 million with the additional approval from the Chief Executive Officer. Each transaction in excess of $10.0 million must receive prior approval of the ALCO/Investment Committee.
Our current investment policy generally permits investments in debt securities issued by the U.S. government and U.S. agencies, municipal bonds, and corporate debt obligations, as well as investments in the Federal Home Loan Bank of Pittsburgh (federal agency securities) and, to a much lesser extent, other equity securities. Securities in these categories are classified as “investment securities” for financial reporting purposes. The policy also permits investments in mortgage-backed securities, including pass-through securities issued and guaranteed by Fannie Mae, Freddie Mac and Government National Mortgage Association (“GNMA”) as well as commercial paper, corporate debt and municipal bonds. Our current investment strategy uses a risk management approach of diversified investing in fixed-rate securities with short- to intermediate-term maturities, as well as adjustable-rate securities, which may have a longer term to maturity. The emphasis of this approach is to increase overall investment securities yields while managing interest rate risk.
Our policy is that, at the time of purchase, we designate a security as held to maturity, available-for-sale, or trading, depending on our ability and intent. Securities available-for-sale are reported at fair value, while securities held to maturity are reported at amortized cost. Currently, all securities are classified as available-for-sale.
Mortgage-Backed Securities. We purchase mortgage-backed securities in order to generate positive interest rate spreads with minimal administrative expense, lower credit risk as a result of the guarantees provided by Freddie Mac, Fannie Mae and GNMA and increased liquidity. We invest primarily in mortgage-backed securities issued or sponsored by Fannie Mae, Freddie Mac, and GNMA. At September 30, 2015, our mortgage-backed securities portfolio had a fair value of $237.0 million, consisting primarily of Freddie Mac, Fannie Mae and GNMA mortgage-backed securities.
Mortgage-backed securities are created by pooling mortgages and issuing a security collateralized by the pool of mortgages with an interest rate that is less than the interest rate on the underlying mortgages. Mortgage-backed securities typically represent a participation interest in a pool of single-family or multi-family mortgages, although most of our mortgage-backed securities are collateralized by single-family mortgages. The issuers of such securities (generally U.S. government agencies and U.S. government sponsored enterprises, including Fannie Mae, Freddie Mac and GNMA) pool and resell the participation interests in the form of securities to investors, such as ESSA Bank & Trust, and guarantee the payment of principal and interest to these investors.
14
Table of Contents
Investments in mortgage-backed securities involve a risk that actual prepayments will be greater or less than the prepayment rate estimated at the time of purchase, which may require adjustments to the amortization of any premium or accretion of any discount relating to such instruments, thereby affecting the net yield on such securities. We review prepayment estimates for our mortgage-backed securities at the time of purchase to ensure that prepayment assumptions are reasonable considering the underlying collateral for the securities at issue and current interest rates, and to determine the yield and estimated maturity of the mortgage-backed securities portfolio. Periodic reviews of current prepayment speeds are performed in order to ascertain whether prepayment estimates require modification that would cause amortization or accretion adjustments.
Equity Securities. At September 30, 2015, our equity securities had a fair value of $25,000.
In addition, we hold Federal Home Loan Bank of Pittsburgh (“FHLB-Pittsburgh”) common stock to qualify for membership in the Federal Home Loan Bank System and to be eligible to borrow funds under the FHLB advance program. There is no market for the common stock.
The aggregate fair value of our FHLB-Pittsburgh common stock as of September 30, 2015 was $13.8 million based on its par value. No unrealized gains or losses have been recorded because we have determined that the par value of the common stock represents its fair value. We owned shares of FHLB-Pittsburgh common stock at September 30, 2015 with a par value that was equal to what we were required to own to maintain our membership in the Federal Home Loan Bank System and to be eligible to obtain advances. We are required to purchase additional stock as our outstanding advances increase. Any excess stock we own is redeemed weekly by the FHLB-Pittsburgh.
We review equity and debt securities with significant declines in fair value on a periodic basis to determine whether they should be considered temporarily or other than temporarily impaired. If a decline in the fair value of a security is determined to be other than temporary, we are required to reduce the carrying value of the security to its fair value and record a non-cash, credit related impairment charge in the amount of the decline, net of tax effect, against our current income.
Our investment securities portfolio contains unrealized losses on securities, including mortgage-related instruments issued or backed by the full faith and credit of the United States government, or generally viewed as having the implied guarantee of the United States government, and debt obligations of a State or political subdivision.
Our policy is to recognize an other-than-temporary impairment of equity securities where the fair value has been significantly below cost for four consecutive quarters. For fixed maturity investments with unrealized losses due to interest rates where the Company does not intend to sell the security and it is more likely than not that the Company will not be required to sell the security before its anticipated recovery in market value, declines in value below cost are not assumed to be other than temporary. We review our position quarterly and concluded that at September 30, 2015, declines included in the table below represent temporary declines due to interest rate change, and we do not intend to sell those securities and it is more likely than not that we will not have to sell those securities before their anticipated recovery in market value.
15
Table of Contents
The following table sets forth the composition of our securities portfolio (excluding FHLB-Pittsburgh common stock) at the dates indicated.
| At September 30, | ||||||||||||||||||||||||
| 2015 | 2014 | 2013 | ||||||||||||||||||||||
| Amortized Cost |
Fair Value |
Amortized Cost |
Fair Value |
Amortized Cost |
Fair Value |
|||||||||||||||||||
| (In thousands) | ||||||||||||||||||||||||
| Investment securities available for sale: |
||||||||||||||||||||||||
| Mortgage-backed securities |
$ | 234,685 | $ | 237,007 | $ | 266,088 | $ | 265,052 | $ | 218,115 | $ | 217,837 | ||||||||||||
| Obligations of state and political subdivisions |
50,094 | 51,625 | 41,375 | 42,771 | 23,754 | 23,909 | ||||||||||||||||||
| U.S. government agency securities |
45,799 | 46,186 | 47,821 | 47,630 | 52,775 | 52,520 | ||||||||||||||||||
| Corporate obligations |
22,440 | 22,360 | 13,140 | 13,328 | 12,756 | 12,773 | ||||||||||||||||||
| Trust-preferred securities |
1,613 | 1,711 | 5,027 | 5,621 | 4,943 | 5,414 | ||||||||||||||||||
| Other debt securities |
20,313 | 20,493 | 6,618 | 6,651 | 1,147 | 1,154 | ||||||||||||||||||
|
|
|
|
|
|
|
|
|
|
|
|
|
|||||||||||||
| Total debt securities |
374,944 | 379,382 | 380,069 | 381,053 | 313,490 | 313,607 | ||||||||||||||||||
| Equity securities – financial services |
25 | 25 | 2,025 | 2,025 | 2,025 | 2,015 | ||||||||||||||||||
|
|
|
|
|
|
|
|
|
|
|
|
|
|||||||||||||
| Total investment securities available-for-sale |
$ | 374,969 | $ | 379,407 | $ | 382,094 | $ | 383,078 | $ | 315,515 | $ | 315,622 | ||||||||||||
|
|
|
|
|
|
|
|
|
|
|
|
|
|||||||||||||
16
Table of Contents
Portfolio Maturities and Yields. The composition and maturities of the investment securities portfolio at September 30, 2015 are summarized in the following table. Maturities are based on the final contractual payment dates, and do not reflect the impact of prepayments or early redemptions that may occur.
| One Year or Less | More than One Year through Five Years |
More than Five Years through Ten Years |
More than Ten Years | Total Securities | ||||||||||||||||||||||||||||||||||||||||
| Amortized Cost |
Weighted Average Yield |
Amortized Cost |
Weighted Average Yield |
Amortized Cost |
Weighted Average Yield |
Amortized Cost |
Weighted Average Yield |
Amortized Cost |
Fair Value |
Weighted Average Yield |
||||||||||||||||||||||||||||||||||
| (Dollars in thousands) | ||||||||||||||||||||||||||||||||||||||||||||
| Investment securities available for sale: |
||||||||||||||||||||||||||||||||||||||||||||
| U.S. government securities |
$ | 5,000 | 0.51 | % | $ | 35,591 | 0.30 | % | $ | 4,149 | 1.64 | % | $ | 1,059 | 0.62 | % | $ | 45,799 | $ | 46,186 | 1.23 | % | ||||||||||||||||||||||
| Obligations of state and political subdivisions |
504 | 0.70 | 10,858 | 1.44 | 22,074 | 1.58 | 16,658 | 5.24 | 50,094 | 51,625 | 2.76 | |||||||||||||||||||||||||||||||||
| Mortgage-backed securities |
— | 0.00 | 347 | 4.14 | 17,898 | 2.41 | 216,440 | 2.34 | 234,685 | 237,007 | 2.35 | |||||||||||||||||||||||||||||||||
| Corporate obligations |
1,000 | 2.49 | 6,471 | 4.78 | 11,969 | 4.44 | 3,000 | 3.50 | 22,440 | 22,360 | 4.32 | |||||||||||||||||||||||||||||||||
| Trust preferred securities |
— | 0.00 | — | 0.00 | — | 0.00 | 1,613 | 2.85 | 1,613 | 1,711 | 2.85 | |||||||||||||||||||||||||||||||||
| Other debt securities |
— | 0.00 | — | 0.00 | 5,312 | 2.72 | 15,001 | 2.68 | 20,313 | 20,493 | 2.69 | |||||||||||||||||||||||||||||||||
|
|
|
|
|
|
|
|
|
|
|
|
|
|||||||||||||||||||||||||||||||||
| Total debt securities |
6,504 | 0.83 | 53,267 | 1.77 | 61,402 | 2.48 | 253,771 | 2.56 | 374,944 | 379,382 | 2.41 | |||||||||||||||||||||||||||||||||
| Equity securities |
— | 0.00 | — | 0.00 | — | 0.00 | 25 | 0.00 | 25 | 25 | 0.00 | |||||||||||||||||||||||||||||||||
|
|
|
|
|
|
|
|
|
|
|
|
|
|||||||||||||||||||||||||||||||||
| Total investment securities available for-sale |
$ | 6,504 | 0.83 | % | $ | 53,267 | 1.77 | % | $ | 61,402 | 2.48 | % | $ | 253,796 | 2.56 | % | $ | 374,969 | $ | 379,407 | 2.41 | % | ||||||||||||||||||||||
|
|
|
|
|
|
|
|
|
|
|
|
|
|||||||||||||||||||||||||||||||||
17
Table of Contents
Sources of Funds
General. Deposits, borrowings, repayments and prepayments of loans and securities, proceeds from maturing securities and cash flows from operations are the primary sources of our funds for use in lending, investing and for other general purposes.
Deposits. We offer a variety of deposit accounts with a range of interest rates and terms. Our deposit accounts consist of savings accounts, NOW accounts, checking accounts, money market accounts, club accounts, certificates of deposit and IRAs and other qualified plan accounts. We provide commercial checking accounts for businesses.
At September 30, 2015, our deposits totaled $1.1 billion. Interest-bearing demand deposit, savings and club and money market deposits totaled $401.9 million at September 30, 2015. At September 30, 2015, we had a total of $596.3 million in certificates of deposit. Noninterest-bearing demand deposits totaled $98.5 million. Although we have a significant portion of our deposits in shorter-term certificates of deposit, we monitor activity on these accounts and, based on historical experience and our current pricing strategy, we believe we will retain a large portion of these accounts upon maturity.
Our deposits are obtained predominantly from the areas in which our branch offices are located. We rely on our favorable locations, customer service and competitive pricing to attract and retain these deposits. While we accept certificates of deposit in excess of $100,000 for which we may provide preferential rates, we generally do not solicit such deposits as they are more difficult to retain than core deposits. At September 30, 2015, we had a total of $271.9 million of brokered certificates of deposits, an increase of $53.5 million from the prior fiscal year end. Our brokered certificates of deposits range from less than one- to seven-year terms, and are purchased only through pre-approved brokers.
The following table sets forth the distribution of average deposit accounts, by account type, at the dates indicated.
| For the Years Ended September 30, | ||||||||||||||||||||||||||||||||||||
| 2015 | 2014 | 2013 | ||||||||||||||||||||||||||||||||||
| Average Balance |
Percent | Average Rate Paid |
Average Balance |
Percent | Average Rate Paid |
Average Balance |
Percent | Average Rate Paid |
||||||||||||||||||||||||||||
| (Dollars in thousands) | ||||||||||||||||||||||||||||||||||||
| Deposit type: |
||||||||||||||||||||||||||||||||||||
| Noninterest bearing demand accounts |
$ | 89,333 | 8.19 | % | — | % | $ | 64,253 | 6.01 | % | — | % | $ | 56,467 | 5.68 | % | — | % | ||||||||||||||||||
| Interest bearing NOW |
107,782 | 9.88 | % | 0.10 | 109,615 | 10.26 | % | 0.07 | 91,201 | 9.18 | % | 0.06 | ||||||||||||||||||||||||
| Money market |
186,121 | 17.06 | % | 0.25 | 155,841 | 14.59 | % | 0.20 | 143,103 | 14.40 | % | 0.23 | ||||||||||||||||||||||||
| Savings and club |
123,028 | 11.28 | % | 0.05 | 115,347 | 10.80 | % | 0.05 | 104,234 | 10.49 | % | 0.05 | ||||||||||||||||||||||||
| Certificates of deposit |
584,684 | 53.59 | % | 1.16 | 623,307 | 58.34 | % | 1.20 | 598,759 | 60.25 | % | 1.17 | ||||||||||||||||||||||||
|
|
|
|
|
|
|
|
|
|
|
|
|
|||||||||||||||||||||||||
| Total deposits |
$ | 1,090,948 | 100.00 | % | 0.68 | % | $ | 1,068,363 | 100.00 | % | 0.78 | % | $ | 993,764 | 100.00 | % | 0.75 | % | ||||||||||||||||||
|
|
|
|
|
|
|
|
|
|
|
|
|
|||||||||||||||||||||||||
As of September 30, 2015, the aggregate amount of outstanding certificates of deposit in amounts greater than or equal to $100,000 was approximately $165.2 million. The following table sets forth the maturity of those certificates as of September 30, 2015.
| At September 30, 2015 |
||||
| (In thousands) | ||||
| Three months or less |
$ | 25,951 | ||
| Over three months through six months |
14,580 | |||
| Over six months through one year |
23,703 | |||
| Over one year |
101,013 | |||
|
|
|
|||
| Total |
$ | 165,247 | ||
|
|
|
|||
18
Table of Contents
At September 30, 2015, $282.4 million of our certificates of deposit had maturities of one year or less. We monitor activity on these accounts and, based on historical experience and our current pricing strategy, we believe we will retain a significant portion of these accounts upon maturity.
Borrowings. Our short-term borrowings consist of Federal Home Loan Bank advances. The following table sets forth information concerning balances and interest rates on all of our short-term borrowings at the dates and for the years indicated.
| At or For the Years Ended September 30, | ||||||||||||
| 2015 | 2014 | 2013 | ||||||||||
| (Dollars in thousands) | ||||||||||||
| Balance at end of year |
$ | 91,339 | $ | 108,020 | $ | 23,000 | ||||||
| Maximum outstanding at any month end |
$ | 132,533 | $ | 108,020 | $ | 84,500 | ||||||
| Average balance during year |
$ | 115,006 | $ | 55,204 | $ | 45,792 | ||||||
| Weighted average interest rate at end of year |
0.40 | % | 0.33 | % | 0.29 | % | ||||||
| Average interest rate during year |
0.37 | % | 0.33 | % | 0.28 | % | ||||||
At September 30, 2015, we had the ability to borrow approximately $551.2 million under our credit facilities with the FHLB-Pittsburgh.
Competition
We face significant competition in both originating loans and attracting deposits. The counties in which we operate have a significant concentration of financial institutions, many of which are significantly larger institutions and have greater financial resources, and many of which are our competitors to varying degrees. Our competition for loans comes principally from commercial banks, savings banks, mortgage banking companies, credit unions, leasing companies, insurance companies and other financial service companies. Our most direct competition for deposits has historically come from commercial banks, savings banks and credit unions. We face additional competition for deposits from nondepository competitors such as the mutual fund industry, securities and brokerage firms and insurance companies.
We seek to meet this competition by the convenience of our branch locations, emphasizing personalized banking and the advantage of local decision-making in our banking business. Specifically, we promote and maintain relationships and build customer loyalty within local communities by focusing our marketing and community involvement on the specific needs of individual neighborhoods. As of September 30, 2015, ESSA Bank & Trust had the largest deposit market share in Monroe County, Pennsylvania. We do not rely on any individual, group, or entity for a material portion of our deposits.
Employees
As of September 30, 2015, we had 248 full-time employees, 54 part-time employees and one temporary employee. The employees are not represented by a collective bargaining unit and we consider our relationship with our employees to be good.
Subsidiary Activities
ESSA Bank & Trust has four wholly owned subsidiaries, ESSACOR, Inc., Pocono Investment Company, ESSA Advisory Services, LLC, and Integrated Financial Corporation and its fully owned subsidiary Integrated Abstract Incorporated. ESSACOR, Inc. is a Pennsylvania corporation that has been used to purchase properties at tax sales that represent collateral for delinquent loans of the Bank. Pocono Investment Company is a Delaware corporation formed as an investment company subsidiary to hold and manage certain investments of ESSA Bank & Trust, including certain intellectual property. ESSA Advisory Services, LLC is a Pennsylvania limited liability company owned 100% by ESSA Bank & Trust. ESSA Advisory Services, LLC is a full-service insurance benefits consulting company offering group services such as health insurance, life insurance, short term and long term disability, dental, vision and 401(K) retirement planning as well as individual health products. Integrated Financial Corporation is a Pennsylvania Corporation that provided investment advisory services to the general public and is currently inactive. Integrated Abstract Incorporated is a Pennsylvania Corporation that provided title insurance services and is currently inactive.
19
Table of Contents
SUPERVISION AND REGULATION
General
The Company is a Pennsylvania corporation. The Company was formerly regulated as a savings and loan holding company, and in November 2014 took the steps necessary to be regulated as a bank holding company. As a bank holding company, we are required to file certain reports with, and otherwise comply with the rules and regulations of the Federal Reserve Board.
ESSA Bank & Trust is a Pennsylvania-chartered savings bank and its deposit accounts are insured up to applicable limits by the Federal Deposit Insurance Corporation under the Deposit Insurance Fund (“DIF”). We are subject to extensive regulation by the Pennsylvania Department of Banking and Securities (the “Department”), our chartering agency, and by the FDIC, our primary federal regulator. We must file reports with the Department and the FDIC concerning our activities and financial condition, in addition to obtaining regulatory approvals prior to entering into certain transactions including, but not limited to, mergers with or acquisitions of other savings institutions. There are periodic examinations by the Department and the FDIC to test our compliance with various regulatory requirements. This regulation and supervision establishes a comprehensive framework of activities in which an institution can engage and is intended primarily for the protection of the FDIC insurance fund and depositors. The regulatory structure also gives the regulatory authorities extensive discretion in connection with their supervisory and enforcement activities and with their examination policies, including policies with respect to the classification of assets and the establishment of adequate loan loss reserves for regulatory purposes. Any change in such regulation, whether by the Department or the FDIC could have a material adverse impact on us and our operations.
Federal Legislation
The Dodd-Frank Wall Street Reform and Consumer Protection Act of 2010 (the “Dodd-Frank Act”), enacted on July 21, 2010, has significantly changed the bank regulatory structure and is affecting the lending, investment, trading and operating activities of depository institutions and their holding companies. The Dodd-Frank Act eliminated, as of July 21, 2011, our former primary federal regulator, the Office of Thrift Supervision, and required ESSA Bank & Trust to be regulated by the FDIC (the primary federal regulator for state-chartered banks that are not members of the Federal Reserve System). The Dodd-Frank Act also authorized the Federal Reserve Board to supervise and regulate all savings and loan holding companies such as ESSA Bancorp, Inc., in addition to the bank holding companies, that it currently regulates. The Dodd-Frank Act requires the Federal Reserve Board to set minimum capital levels for depository institution holding companies that are as stringent as those required for the insured depository subsidiaries, and the components of Tier 1 capital will be restricted to capital instruments that are currently considered to be Tier 1 capital for insured depository institutions. Under the Dodd-Frank Act, the proceeds of trust preferred securities are excluded from Tier 1 capital unless such securities were issued prior to May 19, 2010 by bank or savings and loan holding companies with less than $15 billion of assets. The legislation also establishes a floor for capital of insured depository institutions that cannot be lower than the standards in effect today, and directs the federal banking regulators to implement new leverage and capital requirements within 18 months from the enactment of the Dodd-Frank Act that take into account off-balance sheet activities and other risks, including risks relating to securitized products and derivatives. The required capital regulations have been issued and were effective January 1, 2015.
The Dodd-Frank Act also established the Consumer Financial Protection Bureau (“CFPB”) with substantial power to implement and oversee consumer protection laws. The CFPB Bureau has broad rulemaking authority for a wide range of consumer protection laws that apply to all banks and savings institutions such as ESSA Bank & Trust, including the authority to prohibit “unfair, deceptive or abusive” acts and practices. The CFPB has examination and enforcement authority over all banks and savings institutions with more than $10 billion in assets. Banks and savings institutions with $10 billion or less in assets continue to be examined for compliance by their applicable bank regulators.
The legislation broadened the base for FDIC insurance assessments. Assessments are now based on the average consolidated total assets less tangible equity capital of a depository institution. The Dodd-Frank Act also permanently increased the maximum amount of deposit insurance for banks, savings institutions and credit unions to $250,000 per depositor, retroactive to January 1, 2008. The Dodd-Frank Act increased stockholder influence over boards of directors by requiring companies to give stockholders a non-binding vote on executive compensation and so-called “golden parachute” payments, and by authorizing the Securities and Exchange Commission to promulgate rules that would allow stockholders to nominate their own candidates using a company’s proxy materials. The Dodd-Frank Act also provided for originators of certain securitized loans to retain a percentage of the risk for transferred loans, directed the Federal Reserve Board to regulate pricing of certain debit card interchange fees and contained a number of reforms related to mortgage origination.
The Dodd-Frank Act prohibits lenders from making residential mortgages unless the lender makes a reasonable and good faith determination that the borrower has a reasonable ability to repay the mortgage loan according to its terms. A borrower may recover statutory damages equal to all finance charges and fees paid within three years of a violation of the ability-to-repay rule and may raise a violation as a defense to foreclosure at any time. As authorized by the Dodd-Frank Act, the CFPB has adopted regulations
20
Table of Contents
defining “qualified mortgages” that would be presumed to comply with the Dodd-Frank Act’s ability-to-repay rules. Under the CFPB regulations, qualified mortgages must satisfy the following criteria: (i) no negative amortization, interest-only payments, balloon payments or a term greater than 30 years; (ii) no points or fees in excess of 3% of the loan amount for loans over $100,000; (iii) borrower’s income and assets are verified and documented; and (iv) the borrower’s debt-to-income ratio generally may not exceed 43%. Qualified mortgages are conclusively presumed to comply with the ability-to-repay rule unless the mortgage is a “higher cost” mortgage, in which case the presumption is rebuttable. ESSA Bank & Trust will not grant a non-qualified mortgage loan unless such loan falls under the “temporary qualified mortgage” guidance and there were additional factors to support the exception (which may include a review of the borrower’s creditworthiness and whether a deposit relationship exists).
Many of the provisions of the Dodd-Frank Act have delayed effective dates and the legislation requires extensive regulations which are still being implemented. Although the substance and scope of these regulations cannot be completely determined at this time, it is expected that the legislation and implementing regulations will increase our operating and compliance costs.
Regulation by the Pennsylvania Department of Banking and Securities
The Pennsylvania Banking Code of 1965, as amended (the “Banking Code”) contains detailed provisions governing the organization, location of offices, rights and responsibilities of directors, officers, employees, and depositors, as well as corporate powers, savings and investment operations and other aspects of ESSA Bank & Trust and its affairs. The Banking Code delegates extensive rulemaking power and administrative discretion to the Department so that the supervision and regulation of state-chartered savings banks may be flexible and readily responsive to changes in economic conditions and in savings and lending practices. The Department may also take enforcement actions against savings banks and may appoint a receiver or conservator for a savings bank under certain circumstances.
The Department generally examines each savings bank not less frequently than once every two years. Although the Department may accept the examinations and reports of the FDIC in lieu of the Department’s examination, the current practice is for the Department to conduct individual examinations. The Department may order any savings bank to discontinue any violation of law or unsafe or unsound business practice and may direct any trustee, officer, attorney, or employee of a savings bank engaged in an objectionable activity, after the Department has ordered the activity to be terminated, to show cause at a hearing before the Department why such person should not be removed.
ESSA Bank & Trust was formerly a Pennsylvania savings association. Recent changes to Pennsylvania law have repealed the Savings Association Code. Consequently, ESSA Bank & Trust converted its charter to a Pennsylvania savings bank whose state law powers are primarily governed by Chapter 5 of the Pennsylvania Baking Code of 1965, as amended. The charter conversion did not have a material effect on the operations of ESSA Bank & Trust.
Regulation by the Federal Deposit Insurance Corporation
ESSA Bank & Trust is also subject to extensive regulation, examination and supervision, among other things, by the Federal Deposit Insurance Corporation, as its primary federal regulator. Such regulation and supervision:
| • | limits the investment authority of ESSA Bank & Trust; |
| • | establishes a continuing and affirmative obligation, consistent with ESSA Bank & Trust’s safe and sound operation, to help meet the credit needs of its community, including low and moderate income neighborhoods; |
| • | establishes various capital categories resulting in various levels of regulatory scrutiny applied to the institutions in a particular category; and |
| • | establishes standards for safety and soundness. |
The FDIC generally examines each savings bank not less frequently than once every two years. The FDIC has the authority to order any savings bank or its directors, trustees, officers, attorneys or employees to discontinue any violation of law or unsafe or unsound banking practice.
Federal law and FDIC regulations generally limit the activities and investments of state-chartered FDIC insured banks and their subsidiaries to those permissible for national banks and their subsidiaries, unless such activities and investments are specifically exempted by law or consented to by the FDIC.
Before making a new investment or engaging in a new activity that is not permissible for a national bank or otherwise permissible under federal law or FDIC regulations, an insured savings bank must seek approval from the FDIC to make such investment or engage in such activity. The FDIC will not approve the activity unless the savings bank meets its minimum capital
21
Table of Contents
requirements and the FDIC determines that the activity does not present a significant risk to the FDIC insurance funds. Certain activities of subsidiaries that are engaged in activities permitted for national banks only through a “financial subsidiary” are subject to additional restrictions. Although ESSA Bank & Trust meets all conditions necessary to establish and engage in permitted activities through financial subsidiaries, it has not chosen to engage in such activities.
Transactions with Affiliates
Transactions between an insured bank, such as ESSA Bank & Trust, and any of its affiliates are governed by Sections 23A and 23B of the Federal Reserve Act and implementing regulations. An affiliate of a bank is any company or entity that controls, is controlled by or is under common control with the bank. Generally, a subsidiary of a bank that is not also a depository institution or financial subsidiary is not treated as an affiliate of the bank for purposes of Sections 23A and 23B.
Section 23A:
| • | limits the extent to which a bank or its subsidiaries may engage in “covered transactions” with any one affiliate to an amount equal to 10% of such bank’s capital stock and retained earnings, and limits all such transactions with all affiliates to an amount equal to 20% of such capital stock and retained earnings; and |
| • | requires that all such transactions be on terms that are consistent with safe and sound banking practices. |
The term “covered transaction” includes the making of loans, purchase of assets, issuance of guarantees and other similar types of transactions. Most loans by a bank to any of its affiliates must be secured by collateral in amounts ranging from 100% to 130% of the loan amounts, depending on the type of collateral. In addition, any covered transaction by a bank with an affiliate and any purchase of assets or services by a bank from an affiliate must be on terms that are substantially the same, or at least as favorable to the bank, as those that would be provided to a non-affiliate.
Insurance of Accounts and Regulation by the Federal Deposit Insurance Corporation
Deposit accounts in ESSA Bank & Trust are insured by the FDIC generally up to a maximum of $250,000 per separately insured depositor and up to a maximum of $250,000 for self-directed retirement accounts. ESSA Bank & Trust, therefore, is subject to FDIC deposit insurance assessments.
The FDIC imposes an assessment for deposit insurance against all insured depository institutions. Each institution’s assessment is based on the perceived risk to the insurance fund of the institution, with institutions deemed riskiest paying higher assessments. The Dodd-Frank Act required the FDIC to revise its procedures to base assessments on average total assets less tangible capital, rather than deposits. The FDIC issued a final rule which implemented that directive effective April 1, 2011 and adjusted its assessment schedule so that it now ranges from 2.5 basis points to 45 basis points of average total assets less tangible capital. Small banks, such as ESSA Bank & Trust, are assessed based on a risk classification determined by examination ratings, financial ratios and certain specified adjustments.
Insurance of deposits may be terminated by the Federal Deposit Insurance Corporation upon a finding that an institution has engaged in unsafe or unsound practices, is in an unsafe or unsound condition to continue operations or has violated any applicable law, regulation, rule, order or condition imposed by the Federal Deposit Insurance Corporation. ESSA Bank & Trust does not believe that it is taking or is subject to any action, condition or violation that could lead to termination of its deposit insurance.
All FDIC-insured institutions are required to pay a pro rata portion of the interest due on obligations issued by the Financing Corporation (“FICO”) for anticipated payments, issuance costs and custodial fees on bonds issued by the FICO in the 1980s to recapitalize the now defunct Federal Savings and Loan Insurance Corporation. The bonds issued by the FICO are due to mature in 2017 through 2019. For the quarter ended September 30, 2015, the annualized FICO assessment was 0.58 basis points of an institution’s total assets less tier 1 capital.
Capital Requirements
Federal regulations require FDIC insured depository institutions to meet several minimum capital standards: a common equity Tier 1 capital to risk-based assets ratio of 4.5%, a Tier 1 capital to risk-based assets ratio of 6.0%, a total capital to risk-based assets of 8%, and a 4% Tier 1 capital to total assets leverage ratio. The existing capital requirements were effective January 1, 2015 and are the result of a final rule implementing regulatory amendments based on recommendations of the Basel Committee on Banking Supervision and certain requirements of the Dodd-Frank Act.
As noted, the capital standards require the maintenance of common equity Tier 1 capital, Tier 1 capital and total capital to risk-weighted assets of at least 4.5%, 6% and 8%, respectively, and a leverage ratio of at least 4% Tier 1 capital. Common equity
22
Table of Contents
Tier 1 capital is generally defined as common stockholders’ equity and retained earnings. Tier 1 capital is generally defined as common equity Tier 1 and additional Tier 1 capital. Additional Tier 1 capital includes certain noncumulative perpetual preferred stock and related surplus and minority interests in equity accounts of consolidated subsidiaries. Total capital includes Tier 1 capital (common equity Tier 1 capital plus additional Tier 1 capital) and Tier 2 capital. Tier 2 capital is comprised of capital instruments and related surplus, meeting specified requirements, and may include cumulative preferred stock and long-term perpetual preferred stock, mandatory convertible securities, intermediate preferred stock and subordinated debt. Also included in Tier 2 capital is the allowance for loan and lease losses limited to a maximum of 1.25% of risk-weighted assets and, for institutions that have exercised an opt-out election regarding the treatment of Accumulated Other Comprehensive Income (“AOCI”), up to 45% of net unrealized gains on available-for-sale equity securities with readily determinable fair market values. Institutions that have not exercised the AOCI opt-out have AOCI incorporated into common equity Tier 1 capital (including unrealized gains and losses on available-for-sale-securities). Calculation of all types of regulatory capital is subject to deductions and adjustments specified in the regulations.
In determining the amount of risk-weighted assets for purposes of calculating risk-based capital ratios, all assets, including certain off-balance sheet assets (e.g., recourse obligations, direct credit substitutes, residual interests) are multiplied by a risk weight factor assigned by the regulations based on the risks believed inherent in the type of asset. Higher levels of capital are required for asset categories believed to present greater risk. For example, a risk weight of 0% is assigned to cash and U.S. government securities, a risk weight of 50% is generally assigned to prudently underwritten first lien one to four- family residential mortgages, a risk weight of 100% is assigned to commercial and consumer loans, a risk weight of 150% is assigned to certain past due loans and a risk weight of between 0% to 600% is assigned to permissible equity interests, depending on certain specified factors.
In addition to establishing the minimum regulatory capital requirements, the regulations limit capital distributions and certain discretionary bonus payments to management if the institution does not hold a “capital conservation buffer” consisting of 2.5% of common equity Tier 1 capital to risk-weighted asset above the amount necessary to meet its minimum risk-based capital requirements. The capital conservation buffer requirement is being phased in beginning January 1, 2016 at 0.625% of risk-weighted assets and increasing each year until fully implemented at 2.5% on January 1, 2019.
In assessing an institution’s capital adequacy, the FDIC takes into consideration, not only these numeric factors, but qualitative factors as well, and has the authority to establish higher capital requirements for individual institutions where deemed necessary.
At September 30, 2015, the ESSA Bank & Trust’s capital exceeded all applicable requirements.
Any state-chartered savings bank that fails any of the capital requirements is subject to possible enforcement actions by the FDIC. Such actions could include a capital directive, a cease and desist order, civil money penalties, the establishment of restrictions on an institution’s operations, termination of federal deposit insurance, and the appointment of a conservator or receiver. Certain corrective actions are required by law.
We are also subject to stringent capital guidelines of the Department. Although not adopted in regulation form, the Department utilizes capital standards of 6% leverage capital and 10% risk-based capital. The components of leverage and risk-based capital are substantially the same as those defined by the FDIC.
Dividends from ESSA Bank & Trust
Our ability to pay dividends depends, to a large extent, upon ESSA Bank & Trust’s ability to pay dividends to ESSA Bancorp. The Banking Code states, that no dividend may be paid out of surplus without approval of the Department. Dividends may be paid out of accumulated net earnings. No dividend may generally be paid that would result in ESSA Bank & Trust failing to comply with its regulatory capital requirements.
Prompt Corrective Action
Under the federal Prompt Corrective Action regulations, a savings bank is deemed to be (i) “well capitalized” if it has total risk-based capital of 10.0% or more, a Tier 1 risk-based capital ratio of 8.0% or more, a Tier I leverage capital ratio of 5.0% or more, a common equity Tier 1 ratio of 6.5% or more and is not subject to any written capital order or directive; (ii) “adequately capitalized” if it has a total risk-based capital ratio of 8.0% or more, a Tier I risk-based capital ratio of 6.0% or more, a Tier I leverage capital ratio of 4.0% or more, a common equity Tier 1 capital ratio of 4.5% or more, and does not meet the definition of “well capitalized”; (iii) “undercapitalized” if it has a total risk-based capital ratio that is less than 8.0%, a Tier I risk-based capital ratio that is less than 6.0%, a Tier I leverage capital ratio that is less than 4.0% or a common equity Tier 1 leverage ratio of less than 4.5%, (iv) “significantly undercapitalized” if it has a total risk-based capital ratio that is less than 6.0%, a Tier I risk-based capital ratio that is less than 4.0%, a Tier I leverage capital ratio that is less than 3.0% or a common equity Tier 1 ratio of less than 3%; and (v) “critically undercapitalized” if it has a ratio of tangible equity to total assets that is equal to or less than 2.0%. Federal regulations also specify circumstances under which a federal banking agency may reclassify a well capitalized institution as adequately capitalized and may require an adequately capitalized institution to comply with supervisory actions as if it were in the next lower category (except that the Federal Deposit Insurance Corporation may not reclassify a significantly undercapitalized institution as critically undercapitalized).
23
Table of Contents
Generally, the FDIC is required to appoint a receiver or conservator for a savings bank that becomes “critically undercapitalized” within specific time frames. The regulations also provide that a capital restoration plan must be filed with the FDIC within 45 days of the date a savings bank receives notice that it is “undercapitalized,” “significantly undercapitalized” or “critically undercapitalized.” Any holding company for the savings bank required to submit a capital restoration plan must guarantee the lesser of: an amount equal to 5% of a savings bank’s assets at the time it was notified or deemed to be undercapitalized by the FDIC, or the amount necessary to restore the savings bank to adequately capitalized status. This guarantee remains in place until the FDIC notifies the savings bank that it has maintained adequately capitalized status for each of four consecutive calendar quarters. The FDIC may also take any one of a number of discretionary supervisory actions against an undercapitalized savings bank, including the issuance of a capital directive and the replacement of senior executive officers and directors.
The Prompt Corrective categories discussed above were effective January 1, 2015 and reflect the revised regulatory capital requirements effective the same date.
As of September 30, 2015, the Bank was a “well-capitalized institution” under the Prompt Corrective Action regulations.
The USA PATRIOT Act
The USA PATRIOT Act of 2001 gave the federal government new powers to address terrorist threats through enhanced domestic security measures, expanded surveillance powers, increased information sharing and broadened anti-money laundering requirements. The USA PATRIOT Act also required the federal banking agencies to take into consideration the effectiveness of controls designed to combat money laundering activities in determining whether to approve a merger or other acquisition application of a member institution. Accordingly, if we engage in a merger or other acquisition, our controls designed to combat money laundering would be considered as part of the application process. We have established policies, procedures and systems designed to comply with these regulations.
Holding Company Regulation
Federal Regulation. The Company is a bank holding company that has elected to be a financial holding company and is subject to examination, regulation and periodic reporting under the Bank Holding Company Act of 1956 (the “Bank Holding Company Act”), as administered by the Federal Reserve Board. The Federal Reserve Board has adopted capital adequacy guidelines for bank holding companies on a consolidated basis. The Dodd-Frank Act required the Federal Reserve Board to promulgate consolidated capital requirements for depository institution holding companies that are no less stringent, both quantitatively and in terms of components of capital, than those applicable to institutions themselves. This eliminated the inclusion of certain instruments from tier 1 capital, such as trust preferred securities, that were previously includable for bank holding companies. The Dodd-Frank Act grandfathered instruments issued prior to May 19, 2010 by bank holding companies with less than $15 billion in assets. Consolidated regulatory capital requirements identical to those applicable to the subsidiary institutions apply to bank holding companies with greater than $500 million of assets, effective January 1, 2015. As in the case with the institutions themselves, the capital conservation buffer will be phased in between 2016 and 2019.
Regulations of the Federal Reserve Board provide that a bank holding company must serve as a source of strength to any of its subsidiary banks and must not conduct its activities in an unsafe or unsound manner. The Dodd-Frank Act codified the source of strength policy and required the issuance of implementing regulations. Under the prompt corrective action provisions of the Federal Deposit Insurance Act, a bank holding company parent of an undercapitalized subsidiary bank must guarantee, within limitations, the capital restoration plan that is required of an undercapitalized bank. If an undercapitalized bank fails to file an acceptable capital restoration plan or fails to implement an accepted plan, the Federal Reserve Board may prohibit the bank holding company parent of the undercapitalized bank from paying any dividend or making any other form of capital distribution without the prior approval of the Federal Reserve Board. In addition, Federal Reserve Board policy is that a bank holding company should pay cash dividends only to the extent that the company’s net income for the past year is consistent with the company’s capital needs, asset quality and overall financial condition.
A bank holding company is required to give the Federal Reserve Board prior written notice of any purchase or redemption of its outstanding equity securities if the gross consideration for the purchase or redemption, when combined with the net consideration paid for all such purchases or redemptions during the preceding 12 months, will be equal to 10% or more of the company’s consolidated net worth. The Federal Reserve Board may disapprove such a purchase or redemption if it determines that the proposal would constitute an unsafe and unsound practice, or would violate any law, regulation, Federal Reserve Board order or directive, or any condition imposed by, or written agreement with, the Federal Reserve Board. Such notice and approval is not required for a bank holding company that is as “well capitalized” under applicable regulations of the Federal Reserve Board, that has received a composite “1” or “2” rating, as well as a “satisfactory” rating for management, at its most recent bank holding company examination by the Federal Reserve Board, and that is not the subject of any unresolved supervisory issues. Federal Reserve Board guidance provides for agency prior review of bank holding company dividends and stock redemptions and repurchases in certain additional circumstances.
24
Table of Contents
As a financial holding company, we are permitted (1) to engage in other activities that the Federal Reserve Board determines to be financial in nature, incidental to an activity that is financial in nature, or complementary to a financial activity and that do not pose a substantial risk to the safety and soundness of depository institutions or the financial system generally, or (2) to acquire shares of companies engaged in such activities. We may not, however, directly or indirectly acquire the ownership or control of more than 5% of any class of voting shares, or substantially all of the assets, of a bank holding company or a bank, without the prior approval of the Federal Reserve Board.
In order to maintain our status as a financial holding company, we must remain “well capitalized” and “well managed” under applicable regulations. Failure to meet one or more of the requirements would mean, depending on the requirements not met, that we could not undertake new activities, make acquisitions other than those permitted generally for bank holding companies, or continue certain activities.
Federal Securities Laws
Shares of the Company’s common stock are registered with the SEC under Section 12(b) of the Securities Exchange Act of 1934, as amended (the “Exchange Act”). The Company is also subject to the proxy rules, tender offer rules, insider trading restrictions, annual and periodic reporting, and other requirements of the Exchange Act.
Sarbanes-Oxley Act of 2002
The Sarbanes-Oxley Act of 2002 was enacted in response to public concerns regarding corporate accountability in connection with certain accounting scandals. The stated goals of the Sarbanes-Oxley Act are to increase corporate responsibility, to provide for enhanced penalties for accounting and auditing improprieties at publicly traded companies, and to protect investors by improving the accuracy and reliability of corporate disclosures pursuant to the securities laws. The Sarbanes-Oxley Act generally applies to all companies that file or are required to file periodic reports with the Securities and Exchange Commission, under the Securities Exchange Act of 1934.
The Sarbanes-Oxley Act includes specific additional disclosure requirements, requires the Securities and Exchange Commission and national securities exchanges to adopt extensive additional disclosure, corporate governance and other related rules, and mandates further studies of certain issues by the Securities and Exchange Commission. The Sarbanes-Oxley Act represents significant federal involvement in matters traditionally left to state regulatory systems, such as the regulation of the accounting profession, and to corporate law, such as the relationship between a board of directors and management and between a board of directors and its committees.
Although we have and will continue to incur additional expense in complying with the provisions of the Sarbanes-Oxley Act and the resulting regulations, management does not expect that such compliance will have a material impact on our results of operations or financial condition.
Regulatory Enforcement Authority
Federal law provides federal banking regulators with substantial enforcement powers. This enforcement authority includes, among other things, the ability to assess civil money penalties, to issue cease-and-desist or removal orders, and to initiate injunctive actions against banking organizations and institution-affiliated parties, as defined. In general, these enforcement actions may be initiated for violations of laws and regulations and unsafe or unsound practices. Other actions or inactions may provide the basis for enforcement action, including misleading or untimely reports filed with regulatory authorities.
25
Table of Contents
FEDERAL AND STATE TAXATION
Federal Taxation
General. ESSA Bancorp, Inc. and ESSA Bank & Trust are subject to federal income taxation in the same general manner as other corporations, with some exceptions discussed below. The following discussion of federal taxation is intended only to summarize material federal income tax matters and is not a comprehensive description of the tax rules applicable to ESSA Bancorp, Inc. and ESSA Bank & Trust.
Method of Accounting. For federal income tax purposes, ESSA Bancorp, Inc. currently reports its income and expenses on the accrual method of accounting and uses a tax year ending September 30 for filing its consolidated federal income tax returns. The Small Business Protection Act of 1996 eliminated the use of the reserve method of accounting for bad debt reserves by savings institutions, effective for taxable years beginning after 1995.
Bad Debt Reserves. Prior to the Small Business Protection Act of 1996, ESSA Bank & Trust was permitted to establish a reserve for bad debts for tax purposes and to make annual additions to the reserve. These additions could, within specified formula limits, be deducted in arriving at ESSA Bank & Trust’s taxable income. As a result of the Small Business Protection Act of 1996, ESSA Bank & Trust must use the specific charge off method in computing its bad debt deduction for tax purposes.
Taxable Distributions and Recapture. Prior to the Small Business Protection Act of 1996, bad debt reserves created prior to 1988 were subject to recapture into taxable income if ESSA Bank & Trust failed to meet certain thrift asset and definition tests. The Small Business Protection Act of 1996 eliminated these thrift-related recapture rules. However, under current law, pre-1988 reserves remain subject to tax recapture should ESSA Bank & Trust make certain distributions from its tax bad debt reserve or cease to maintain a financial institution charter. At September 30, 2015, ESSA Bank & Trust’s total federal pre-1988 reserve was approximately $4.6 million. This reserve reflects the cumulative effects of federal tax deductions by ESSA Bank & Trust for which no federal income tax provision has been made.
Minimum Tax. The Internal Revenue Code of 1986, as amended, imposes an alternative minimum tax at a rate of 20% on a base of regular taxable income plus certain tax preferences, referred to as “alternative minimum taxable income.” The alternative minimum tax is payable to the extent alternative minimum tax income is in excess of the regular income tax. Net operating losses can, in general, offset no more than 90% of alternative minimum taxable income. Certain payments of alternative minimum tax may be used as credits against regular tax liabilities in future years. At September 30, 2014, ESSA Bank & Trust had no minimum tax credit carryforward.
Net Operating Loss Carryovers. A financial institution may carry back net operating losses to the preceding two taxable years (five years for losses incurred in 2001, 2002 and 2009) and forward to the succeeding 20 taxable years. At September 30, 2015, ESSA Bank & Trust had no net operating loss carryforward for federal income tax purposes.
Corporate Dividends. We may exclude from our income 100% of dividends received from ESSA Bank & Trust as a member of the same affiliated group of corporations.
Audit of Tax Returns. ESSA Bancorp’s federal income tax returns have not been audited in the most recent five-year period. The 2009, 2011, 2012, 2013 and 2014 tax years remain open.
State Taxation
Pennsylvania State Taxation. ESSA Bancorp, Inc. is subject to the Pennsylvania Corporate Net Income Tax, Capital Stock and Franchise Tax. The Corporation Net Income Tax rate for fiscal year 2015 is 10.0% and is imposed on unconsolidated taxable income for federal purposes with certain adjustments. In general, the Capital Stock and Franchise Tax is a property tax imposed on a corporation’s capital stock value at a statutorily defined rate, such value being determined in accordance with a fixed formula based upon average net income and net worth. ESSA Bank & Trust is subject to tax under the Pennsylvania Mutual Thrift Institutions Tax Act, as amended to include thrift institutions having capital stock. Pursuant to the Mutual Thrift Institutions Tax, the tax rate is 11.5%. The Mutual Thrift Institutions Tax exempts ESSA Bank & Trust from other taxes imposed by the Commonwealth of Pennsylvania for state income tax purposes and from all local taxation imposed by political subdivisions, except taxes on real estate and real estate transfers. The Mutual Thrift Institutions Tax is a tax upon net earnings, determined in accordance with generally accepted accounting principles with certain adjustments. The Mutual Thrift Institutions Tax, in computing income according to generally accepted accounting principles, allows for the deduction of interest earned on state and federal obligations, while disallowing a percentage of thrift’s interest expense deduction in the proportion of interest income on those securities to the overall interest income of ESSA Bank & Trust. Net operating losses, if any, thereafter can be carried forward three years for Mutual Thrift Institutions Tax purposes.
26
Table of Contents
| Item 1A. | Risk Factors |
In addition to factors discussed in the description of our business and elsewhere in this report, the following are factors that could adversely affect our future results of operations and financial condition.
We May Fail to Realize the Anticipated Benefits of Our Recently Completed Acquisition.
On December 4, 2015, we completed the acquisition of Eagle National Bank by ESSA Bank & Trust, our wholly-owned subsidiary, in conjunction with the Company’s acquisition of Eagle National Bank’s parent company, Eagle National Bancorp, Inc. The success of the acquisition will depend on, among other things, our ability to combine the businesses of Eagle National Bank and ESSA Bank & Trust in a manner that does not materially disrupt the customer relationships of either company. If we are unable to successfully achieve this objective, the anticipated benefits of the acquisition may not be realized fully or at all, or may take longer to realize than expected.
It is possible that the integration process related to the acquisition may result in the loss of key personnel, the disruption of our existing or the acquired business or inconsistencies in standards, controls, procedures and policies that may adversely impact its ability to maintain relationships with customers and employees, or to achieve the anticipated benefits of the acquisition.
The Dodd-Frank Act, Among Other Things, Established the CFPB, Tightened Capital Standards and Will Continue to Result In New Laws and Regulations That Are Expected to Increase Our Costs of Operations.
The Dodd-Frank Act is significantly changing the current bank regulatory structure and affecting the lending, deposit, investment, trading and operating activities of financial institutions and their holding companies. The Dodd-Frank Act requires various federal agencies to adopt a broad range of new rules and regulations, and to prepare numerous studies and reports for Congress. The federal agencies are given significant discretion in drafting the implementing rules and regulations, and consequently, many of the details and much of the impact of the Dodd-Frank Act may not be known for many months or years. However, it is expected that the legislation and implementing regulations will materially increase our operating and compliance costs.
The Dodd-Frank Act created the CFPB with broad powers to supervise and enforce consumer protection laws. The CFPB has broad rule-making authority for a wide range of consumer protection laws that apply to all banks and savings institutions, including the authority to prohibit “unfair, deceptive or abusive” acts and practices. The CFPB has examination and enforcement authority over all banks with more than $10 billion in assets. Banks with $10 billion or less in assets, such as ESSA Bank & Trust, will continue to be examined for compliance with the consumer laws by their primary bank regulators. The Dodd-Frank Act also weakens the federal preemption rules that have been applicable for national banks and federal savings associations, and gives state attorneys general the ability to enforce federal consumer protection laws.
The Dodd-Frank Act requires minimum leverage (Tier 1) and risk-based capital requirements for bank and savings and loan holding companies that are no less than those applicable to banks, which will exclude certain instruments that previously have been eligible for inclusion by bank holding companies as Tier 1 capital, such as trust preferred securities.
The Dodd-Frank Act also broadens the base for FDIC deposit insurance assessments. Assessments are now based on the average consolidated total assets less tangible equity capital of a financial institution, rather than deposits. The Dodd-Frank Act also permanently increases the maximum amount of deposit insurance for banks, savings institutions and credit unions to $250,000 per depositor, retroactive to January 1, 2008.
The Dodd-Frank Act requires publicly traded companies to give stockholders a non-binding vote on executive compensation and so-called “golden parachute” payments. It also provides that the listing standards of the national securities exchanges shall require listed companies to implement and disclose “clawback” policies mandating the recovery of incentive compensation paid to executive officers in connection with accounting restatements. The legislation also directs the Federal Reserve Board to promulgate rules prohibiting excessive compensation paid to bank holding company executives.
27
Table of Contents
The Company Became Subject to More Stringent Capital Requirements, Which May Adversely Impact Our Return on Equity, Require Us to Raise Additional Capital, or Constrain Us from Paying Dividends or Repurchasing Shares.
In July 2013, the federal banking agencies approved a new rule that has substantially amended regulatory risk-based capital rules. The final rule implements the regulatory capital reforms from the Basel Committee on Banking Supervision (“Basel III”) and changes required by the Dodd-Frank Act.
The final rule includes new minimum risk-based capital and leverage ratios, which were effective for us on January 1, 2015, and refines the definition of what constitutes “capital” for calculating these ratios. The new minimum capital requirements are: (i) a new common equity Tier 1 capital ratio of 4.5%; (ii) a Tier 1 to risk-based assets capital ratio of 6% (increased from 4%); (iii) a total capital ratio of 8% (unchanged from prior rules); and (iv) a Tier 1 leverage ratio of 4%. The final rule also requires unrealized gains and losses on certain “available-for-sale” securities holdings to be included for calculating regulatory capital requirements unless a one-time opt-out is exercised. ESSA Bank & Trust has elected to opt out of the requirement under the final rule to include certain “available-for-sale” securities holdings for calculating its regulatory capital requirements. The final rule also establishes a “capital conservation buffer” of 2.5%, and, when fully phased in, will result in the following minimum ratios: (i) a common equity Tier 1 capital ratio of 7.0%, (ii) a Tier 1 to risk-based assets capital ratio of 8.5%, and (iii) a total capital ratio of 10.5%. The new capital conservation buffer requirement will be phased in beginning in January 2016 at 0.625% of risk-weighted assets and will increase each year until fully implemented in January 2019. An institution will be subject to limitations on paying dividends, engaging in share repurchases and paying discretionary bonuses if its capital level falls below the buffer amount. These limitations will establish a maximum percentage of eligible retained income that can be utilized for such actions.
The application of more stringent capital requirements could, among other things, result in lower returns on equity, require the raising of additional capital, and result in regulatory actions if we were to be unable to comply with such requirements. Furthermore, the imposition of liquidity requirements in connection with the implementation of Basel III could result in our having to lengthen the term of our funding, restructure our business models, and/or increase our holdings of liquid assets. Implementation of changes to asset risk weightings for risk-based capital calculations, items included or deducted in calculating regulatory capital and/or additional capital conservation buffers could result in management modifying its business strategy, and could limit our ability to make distributions, including paying dividends or repurchasing shares. Specifically, beginning in 2016, ESSA Bank & Trust’s ability to pay dividends will be limited if it does not have the capital conservation buffer required by the new capital rules, which may further limit our ability to pay dividends to stockholders. See “Item 1. Business—Supervision and Regulation—Capital Requirements.”
New Regulations Could Restrict Our Ability to Originate and Sell Mortgage Loans.
The CFPB has issued a rule designed to clarify for lenders how they can avoid monetary damages under the Dodd-Frank Act, which would hold lenders accountable for ensuring a borrower’s ability to repay a mortgage. Loans that meet this “qualified mortgage” definition will be presumed to have complied with the new ability-to-repay standard. Under the CFPB’s rule, a “qualified mortgage” loan must not contain certain specified features, including:
| • | excessive upfront points and fees (those exceeding 3% of the total loan amount, less “bona fide discount points” for prime loans); |
| • | interest-only payments; |
| • | negative-amortization; and |
| • | terms longer than 30 years. |
Also, to qualify as a “qualified mortgage,” a borrower’s total debt-to-income ratio may not exceed 43%. Lenders must also verify and document the income and financial resources relied upon to qualify the borrower for the loan and underwrite the loan based on a fully amortizing payment schedule and maximum interest rate during the first five years, taking into account all applicable taxes, insurance and assessments. The CFPB’s rule on qualified mortgages could limit our ability or desire to make certain types of loans or loans to certain borrowers, or could make it more expensive/and or time consuming to make these loans, which could limit our growth or profitability.
Increases to the Allowance for Credit Losses May Cause Our Earnings to Decrease.
Our customers may not repay their loans according to the original terms, and the collateral securing the payment of those loans may be insufficient to pay any remaining loan balance. In addition, the estimates used to determine the fair value of such loans as of the acquisition date may be inconsistent with the actual performance of the acquired loans. Hence, we may experience significant credit losses, which could have a material adverse effect on our operating results. We make various assumptions and judgments about the collectability of our loan portfolio, including the creditworthiness of our borrowers and the value of the real estate and other assets serving as collateral for the repayment of loans. In determining the amount of the allowance for credit losses, we rely on loan quality
28
Table of Contents
reviews, past loss experience, and an evaluation of economic conditions, among other factors. If our assumptions prove to be incorrect, our allowance for credit losses may not be sufficient to cover losses inherent in our loan portfolio, resulting in additions to the allowance. Material additions to the allowance would materially decrease our net income.
Our emphasis on the origination of commercial real estate and business loans is one of the more significant factors in evaluating our allowance for credit losses. As we continue to increase the amount of these loans, additional or increased provisions for credit losses may be necessary and as a result would decrease our earnings.
Bank regulators periodically review our allowance for credit losses and may require us to increase our provision for credit losses or loan charge-offs. Any increase in our allowance for credit losses or loan charge-offs as required by these regulatory authorities could have a material adverse effect on our results of operations and/or financial condition.
Future Changes in Interest Rates Could Reduce Our Profits.
Our ability to make a profit largely depends on our net interest income, which could be negatively affected by changes in interest rates. Net interest income is the difference between:
| 1. | the interest income we earn on our interest-earning assets, such as loans and securities; and |
| 2. | the interest expense we pay on our interest-bearing liabilities, such as deposits and borrowings. |
From September, 2007 through December, 2008, the Federal Reserve Board of Governors decreased its target for the federal funds rate from 5.25% to 0.25%. The federal funds rate has remained at 0.25% since December 2008. While these short term market interest rates (which we use as a guide to price our deposits) decreased, longer term market interest rates (which we use as a guide to price our longer term loans) also decreased but not to the same degree. With the decline in shorter term market interest rates the Company’s cost of funds declined. This decline in our cost of funds was initially beneficial to our net interest spread. However, as short term market rates have remained low and longer term interest rates also declined, the Company’s net interest margin decreased from 2.93% for the year ended September 30, 2009 to 2.65% for the year ended September 30, 2012. The Company’s acquisition of First Star Bancorp was effective July 31, 2012. The acquisition, along with increases in longer term interest rates during the third and fourth quarter of our 2013 fiscal year, helped to increase our net interest margin to 3.08% for the year ended September 30, 2013. Rates remained low during the subsequent fiscal years. The resulting decline in the yield on our interest earning assets outpaced the decline in the cost of our interest bearing liabilities resulting in a decline in our net interest margin to 2.96% for the year ended September 30, 2015 from 2.97% for the year ended September 30, 2014 and from 3.08% for the year ended September 30, 2013. If shorter term interest rates increase or if longer term interest rates decline, there could be further negative pressure exerted on our net interest margin.
In addition, changes in interest rates can affect the average life of loans and mortgage-backed and related securities. A reduction in interest rates results in increased prepayments of loans and mortgage-backed and related securities, as borrowers refinance their loans in order to reduce their borrowing costs. This creates reinvestment risk, which is the risk that we may not be able to reinvest prepayments at rates that are comparable to the rates we earned on the prepaid loans or securities. Alternatively, increases in interest rates may decrease loan demand and/or make it more difficult for borrowers to repay adjustable rate loans.
Changes in interest rates also affect the current market value of our interest-earning securities portfolio. Generally, the value of securities moves inversely with changes in interest rates. At September 30, 2015, the fair value of our debt securities available for sale totaled $379.4 million. Unrealized net gains on these available for sale securities totaled approximately $4.4 million at September 30, 2015 and are reported as a separate component of stockholders’ equity. Decreases in the fair value of securities available for sale in future periods would have an adverse effect on stockholders’ equity.
We evaluate interest rate sensitivity by estimating the change in ESSA Bank & Trust’s Economic Value of Equity (EVE) over a range of interest rate scenarios. EVE is the net present value of the Company’s asset cash flows minus the net present value of the Company’s liability cash flows. At September 30, 2015, in the event of an immediate 200 basis point increase in interest rates, the Company’s model projects that we would experience a $35.4 million, or 18.1%, decrease in net portfolio value. See “Item 7. Management’s Discussion and Analysis of Financial Condition and Results of Operations—Management of Market Risk.”
Concentration of Loans in Our Primary Market Area, Which Has Experienced an Economic Downturn, May Increase the Risk of Increased Nonperforming Assets.
Our success depends primarily on the general economic conditions in the Pennsylvania counties of Monroe, Northampton, and Lehigh as nearly all of our loans are to customers in these markets. Accordingly, the local economic conditions in these market areas has a significant impact on the ability of borrowers to repay loans as well as our ability to originate new loans. As such, a continuation of the decline in real estate values in these market areas would also lower the value of the collateral securing loans on properties in these market areas. In addition, continued weakening in general economic conditions such as inflation, recession, unemployment or other factors beyond our control could negatively affect our financial results.
29
Table of Contents
Continued and Sustained Deterioration in the Housing Sector and Related Markets and Prolonged Elevated Unemployment Levels May Adversely Affect Our Business and Financial Results.
Over the last several years, general economic conditions continued to worsen nationally as well as in our market area. While we did not invest in sub-prime mortgages and related investments, our lending business is tied significantly to the housing market. Declines in home prices, and increases in foreclosures and unemployment levels, have adversely impacted the credit performance of real estate loans, resulting in the write-down of asset values. The continuing housing slump has resulted in reduced demand for the construction of new housing, further declines in home prices, and increased delinquencies on construction, residential and commercial mortgage loans. The ongoing concern about the economy in general has caused many lenders to reduce or cease providing funding to borrowers. These conditions may also cause a further reduction in loan demand, and increases in our non-performing assets, net charge-offs and provisions for loan losses. A worsening of these negative economic conditions could adversely affect our prospects for growth, asset and goodwill valuations and could result in a decrease in our interest income and a material increase in our provision for loan losses.
Our Continued Emphasis On Commercial Real Estate Lending Increases Our Exposure To Increased Lending Risks.
Our business strategy centers on continuing our emphasis on commercial real estate lending. We have grown our loan portfolio in recent years with respect to this type of loan and intend to continue to emphasize this type of lending. At September 30, 2015, $200.0 million, or 18.0%, of our total loan portfolio consisted of commercial real estate loans. Loans secured by commercial real estate generally expose a lender to greater risk of non-payment and loss than one- to four-family residential mortgage loans because repayment of the commercial real estate loans often depends on the successful operation of the property and the income stream of the underlying property. Additionally, such loans typically involve larger loan balances to single borrowers or groups of related borrowers compared to one- to four-family residential mortgage loans. Accordingly, an adverse development with respect to one loan or one credit relationship can expose us to greater risk of loss compared to an adverse development with respect to a one- to four-family residential mortgage loan. We seek to minimize these risks through our underwriting policies, which require such loans to be qualified on the basis of the property’s collateral value, net income and debt service ratio; however, there is no assurance that our underwriting policies will protect us from credit-related losses.
At September 30, 2015, our largest commercial real estate lending relationship was $12.7 million of loans located in Lehigh County, Pennsylvania and secured by real estate. This loan was performing in accordance with its repayment terms. See “Item 1. Business—Lending Activities—Commercial Real Estate Loans.”
Our Increased Auto Lending, As a Result of the Franklin Security Bank Acquisition, Increases Our Exposure to Increased Lending Risks.
At September 30, 2015, $162.2 million, or 14.5%, of our total loan portfolio consisted of auto loans. These loans were primarily indirect auto loans. Indirect auto loans are inherently risky as they are often secured by assets that depreciate rapidly. In some cases, repossessed collateral for a defaulted automobile loan may not provide an adequate source of repayment for the outstanding loan and the remaining deficiency may not warrant further substantial collection efforts against the borrower. Automobile loan collections depend on the borrower’s continuing financial stability, and therefore, are more likely to be adversely affected by job loss, divorce, illness, or personal bankruptcy.
Strong Competition Within Our Market Areas May Limit Our Growth and Profitability.
Competition in the banking and financial services industry is intense. In our market areas, we compete with commercial banks, savings institutions, mortgage brokerage firms, credit unions, finance companies, mutual funds, insurance companies, and brokerage and investment banking firms operating locally and elsewhere. Some of our competitors have greater name recognition and market presence that benefit them in attracting business, and offer certain services that we do not or cannot provide. In addition, larger competitors may be able to price loans and deposits more aggressively than we do, which could affect our ability to grow and remain profitable on a long-term basis. Our profitability depends upon our continued ability to successfully compete in our market areas. For additional information see “Item 1. Business—Competition.”
We Operate in a Highly Regulated Environment and May Be Adversely Affected by Changes in Laws and Regulations.
We are subject to extensive regulation, supervision, and examination by the Federal Reserve Board, the FDIC and the Department. Such regulators govern the activities in which we may engage, primarily for the protection of depositors. These regulatory authorities have extensive discretion in connection with their supervisory and enforcement activities, including the imposition of restrictions on the operation of a bank, the classification of assets by a bank, the imposition of higher capital requirements, and the adequacy of a bank’s allowance for credit losses. Any change in such regulation and oversight, whether in the form of regulatory policy, regulations, or legislation, could have a material impact on us and our operations. We believe that we are in substantial compliance with applicable federal, state and local laws, rules and regulations. Because our business is highly regulated,
30
Table of Contents
the laws, rules and applicable regulations are subject to regular modification and change. There can be no assurance that proposed laws, rules and regulations, or any other laws, rules or regulations, will not be adopted in the future, which could make compliance more difficult or expensive or otherwise adversely affect our business, financial condition or prospects.
The Soundness of Other Financial Services Institutions May Adversely Affect Our Credit Risk.
We rely on other financial services institutions through trading, clearing, counterparty, and other relationships. We maintain limits and monitor concentration levels of our counterparties as specified in our internal policies. Our reliance on other financial services institutions exposes us to credit risk in the event of default by these institutions or counterparties. These losses could adversely affect our results of operations and financial condition.
Risks Associated With System Failures, Interruptions, Or Breaches of Security Could Negatively Affect Our Earnings.
Information technology systems are critical to our business. We use various technology systems to manage our customer relationships, general ledger, securities investments, deposits, and loans. We have established policies and procedures to prevent or limit the impact of system failures, interruptions, and security breaches (including privacy breaches), but such events may still occur or may not be adequately addressed if they do occur. In addition, any compromise of our systems could deter customers from using our products and services. Although we rely on security systems to provide security and authentication necessary to effect the secure transmission of data, these precautions may not protect our systems from compromises or breaches of security.
In addition, we outsource a majority of our data processing to certain third-party providers. If these third-party providers encounter difficulties, or if we have difficulty communicating with them, our ability to adequately process and account for transactions could be affected, and our business operations could be adversely affected. Threats to information security also exist in the processing of customer information through various other vendors and their personnel.
The occurrence of any system failures, interruption, or breach of security could damage our reputation and result in a loss of customers and business thereby subjecting us to additional regulatory scrutiny, or could expose us to litigation and possible financial liability. Any of these events could have a material adverse effect on our financial condition and results of operations.
Risks Associated with Cyber-Security Could Negatively Affect Our Earnings.
The financial services industry has experienced an increase in both the number and severity of reported cyber attacks aimed at gaining unauthorized access to bank systems as a way to misappropriate assets and sensitive information, corrupt and destroy data, or cause operational disruptions.
We have established policies and procedures to prevent or limit the impact of security breaches, but such events may still occur or may not be adequately addressed if they do occur. Although we rely on security safeguards to secure our data, these safeguards may not fully protect our systems from compromises or breaches.
We also rely on the integrity and security of a variety of third party processors, payment, clearing and settlement systems, as well as the various participants involved in these systems, many of which have no direct relationship with us. Failure by these participants or their systems to protect our customers’ transaction data may put us at risk for possible losses due to fraud or operational disruption.
Our customers are also the target of cyber attacks and identity theft. Large scale identity theft could result in customers’ accounts being compromised and fraudulent activities being performed in their name. We have implemented certain safeguards against these types of activities but they may not fully protect us from fraudulent financial losses.
The occurrence of a breach of security involving our customers’ information, regardless of its origin, could damage our reputation and result in a loss of customers and business and subject us to additional regulatory scrutiny, and could expose us to litigation and possible financial liability. Any of these events could have a material adverse effect on our financial condition and results of operations.
Health Care Legislation Could Increase Our Expenses Or Require Us To Pass Further Costs On To Our Employees, Which Could Adversely Affect Our Operations, Financial Condition and Earnings.
Legislation enacted in 2010 requires companies to provide expanded health care coverage to their employees, such as affordable coverage to part-time employees and coverage to dependent adult children of employees. Companies will also be required
31
Table of Contents
to enroll new employees automatically into their health plans. Compliance with these and other new requirements of the health care legislation has increased our employee benefits expense, and requires us to pass these costs on to our employees, which could result in a competitive disadvantage in hiring and retaining qualified employees.
| Item 1B. | Unresolved Staff Comments |
Not applicable.
| Item 2. | Properties |
The following table provides certain information as of September 30, 2015 with respect to our main office located in Stroudsburg, Pennsylvania, and our 25 full service branch offices.
| Location |
Leased or Owned |
Year Acquired or Leased |
Square Footage |
|||||
| Main Office: |
||||||||
| 200 Palmer Street Stroudsburg, PA 18360 |
Owned | 2003 | 36,000 | |||||
| Full Service Branches: |
||||||||
| 249 Route 940 Blakeslee, PA 18610 |
Owned | 2002 | 2,688 | |||||
| 1881 Route 209 Brodheadsville, PA 18322 |
Owned | 1983 | 4,100 | |||||
| 695 North Courtland Street East Stroudsburg, PA 18301 |
Leased | 1999 | 472 | |||||
| 75 Washington Street East Stroudsburg, PA 18301 |
Owned | 1966 | 3,300 | |||||
| 5120 Milford Rd. East Stroudsburg, PA 18302 |
Owned | 2014 | 3,610 | |||||
| 3236 Route 940, Suite 23 Mt. Pocono, PA 18344 |
Leased | 1999 | 536 | |||||
| * 1321A Blue Valley Drive Pen Argyl, PA 18072 |
Leased | 2001 | 444 | |||||
| 744 Main Street Stroudsburg, PA 18360 |
Owned | 1985 | 12,000 | |||||
| 1070 North Ninth Street Stroudsburg, PA 18360 |
Leased | 2000 | 488 | |||||
| 2836 Route 611, Ste 105 Tannersville, PA 18372 |
Leased | 1993 | 611 | |||||
| 924 Weir Lake Road Suite 101 Brodheadsville, PA 18322 |
Leased | 1997 | 576 | |||||
| Tannersville Plaza 2826 Route 611 Tannersville, PA 18372 |
Owned | 2007 | 2,500 | |||||
| 975 Route 390 Cresco, PA 18326 |
Owned | 2010 | 2,912 | |||||
| 1500 N. Cedar Crest Blvd, Unit 2 Allentown, PA 18104 |
Leased | 2010 | 530 | |||||
| 5020 Route 873 Schnecksville, PA 18078 |
Leased | 2010 | 460 | |||||
32
Table of Contents
| Location |
Leased or Owned |
Year Acquired or Leased |
Square Footage |
|||||
| 418 West Broad Street Bethlehem, PA 18018 |
Owned | 2012 | 4,500 | |||||
| 358 South Walnut Street Bath, PA 18014 |
Leased | 2012 | 2,000 | |||||
| 2415 Park Avenue Easton, PA 18045 |
Owned | 2012 | 3,460 | |||||
| 14 South Main Street Nazareth, PA 18064 |
Leased | 2012 | 450 | |||||
| 471 West Wabash Street Allentown, PA 18103 |
Owned | 2012 | 4,411 | |||||
| 11 North Main Street Alburtis, PA 18011 |
Owned | 2012 | 2,091 | |||||
| 1430 Jacobsburg Road Wind Gap, PA 18091 |
Leased | 2012 | 1,400 | |||||
| 6302 Route 309 New Tripoli, PA 18066 |
Owned | 2012 | 3,460 | |||||
| 1065 Highway 315 Wilkes Barre, PA 18702 |
Leased | 2014 | 7,536 | |||||
| 300 Mulberry Street Scranton, PA 18503 |
Leased | 2014 | 3,800 | |||||
| Other Properties |
||||||||
| 746-752 Main Street Stroudsburg, PA 18360 |
Owned | 2005 | 4,650 | |||||
| 414 West Broad Street Bethlehem, PA 18018 |
Owned | 2012 | 3,604 | |||||
The net book value of our premises, land and equipment was $16.6 million at September 30, 2015.
| * | Company has previously disclosed that branch is closing December 23, 2015. |
| Item 3. | Legal Proceedings |
The Company and its subsidiaries are subject to various legal actions arising in the normal course of business. In the opinion of management, the resolution of these legal actions is not expected to have a material adverse effect on the Company’s results of operations.
| Item 4. | Mine Safety Disclosures |
Not applicable.
33
Table of Contents
| Item 5. | Market for Registrant’s Common Equity, Related Stockholder Matters and Issuer Purchases of Equity Securities |
The Company’s shares of common stock are traded on the Nasdaq Global Market under the symbol “ESSA.” The approximate number of holders of record of ESSA Bancorp, Inc.’s common stock as of September 30, 2015 was 2,039. Certain shares of ESSA Bancorp, Inc. are held in “nominee” or “street” name and accordingly, the number of beneficial owners of such shares is not known or included in the foregoing number. The following tables present quarterly market information for ESSA Bancorp, Inc.’s common stock for the periods ended September 30, 2014 and September 30, 2015. The following information was provided by the Nasdaq Stock Market.
| Fiscal 2015 |
High | Low | Dividends | |||||||||
| Quarter ended September 30, 2015 |
$ | 13.08 | $ | 12.28 | $ | 0.09 | ||||||
| Quarter ended June 30, 2015 |
13.09 | 12.72 | 0.09 | |||||||||
| Quarter ended March 31, 2015 |
12.99 | 11.67 | 0.09 | |||||||||
| Quarter ended December 31, 2014 |
12.00 | 11.19 | 0.07 | |||||||||
| Fiscal 2014 |
High | Low | Dividends | |||||||||
| Quarter ended September 30, 2014 |
$ | 11.73 | $ | 10.96 | $ | 0.07 | ||||||
| Quarter ended June 30, 2014 |
11.23 | 10.26 | 0.07 | |||||||||
| Quarter ended March 31, 2014 |
11.75 | 10.65 | 0.07 | |||||||||
| Quarter ended December 31, 2013 |
11.64 | 10.33 | 0.05 | |||||||||
The Board of Directors has the authority to declare cash dividends on shares of common stock, subject to statutory and regulatory requirements. We began to pay quarterly cash dividends in the third quarter of fiscal 2008. Our dividend was increased from $0.07 per share to $0.09 per share in the second quarter of fiscal 2015. In determining whether and in what amount to pay a cash dividend in the future, the Board will take into account a number of factors, including capital requirements, our consolidated financial condition and results of operations, tax considerations, statutory and regulatory limitations and general economic conditions. No assurances can be given that cash dividends will not be reduced or eliminated in the future.
The sources of funds for the payment of a cash dividend are the retained proceeds from the initial sale of shares of common stock and earnings on those proceeds, interest and principal payments with respect to ESSA Bancorp, Inc.’s loan to the Employee Stock Ownership Plan, and dividends from ESSA Bank & Trust. For a discussion of the limitations applicable to ESSA Bank & Trust’s ability to pay dividends, see “Item 1. Business—Supervision and Regulation.”
Stock Performance Graph
Set forth hereunder is a stock performance graph comparing (a) the cumulative total return on the Company’s common stock between September 30, 2010 and September 30, 2015, (b) the cumulative total return on stock included in the SNL Thrift Index over such period, and (c) the cumulative total return on stocks included in the Russell 2000 Index over such period. Cumulative return assumes the reinvestment of dividends, and is expressed in dollars based on an assumed investment of $100.
There can be no assurance that the ESSA Bancorp, Inc.’s stock performance will continue in the future with the same or similar trend depicted in the graph. ESSA Bancorp, Inc. will not make or endorse any predictions as to future stock performance.
34
Table of Contents
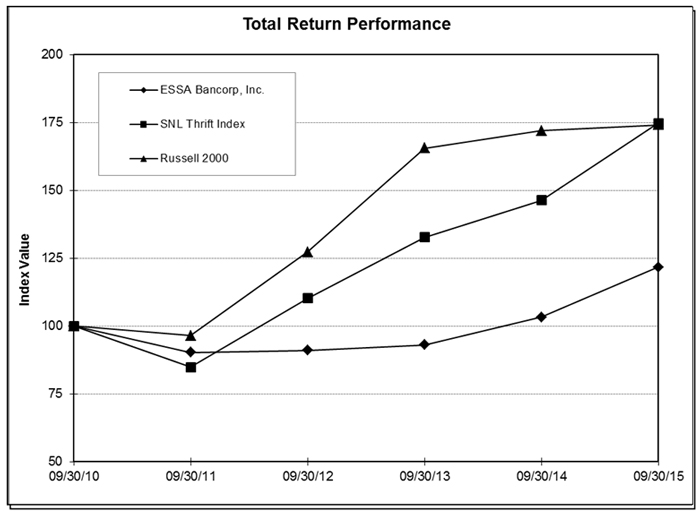
| Period Ending | ||||||||||||||||||||||||
| Index |
09/30/10 | 09/30/11 | 09/30/12 | 09/30/13 | 09/30/14 | 09/30/15 | ||||||||||||||||||
| ESSA Bancorp, Inc. |
100.00 | 90.25 | 91.00 | 93.00 | 103.24 | 121.65 | ||||||||||||||||||
| SNL Thrift Index |
100.00 | 84.79 | 110.19 | 132.66 | 146.32 | 174.75 | ||||||||||||||||||
| Russell 2000 |
100.00 | 96.47 | 127.25 | 165.50 | 172.01 | 174.15 | ||||||||||||||||||
Source: SNL Financial LC, Charlottesville, NC
35
Table of Contents
Through the year ended September 30, 2014, the Company repurchased a total of 6,627,100 shares of its common stock pursuant to five repurchase programs. In February 2014, the Company announced a sixth repurchase program to repurchase up to an additional 5% of its outstanding stock. During the year ended September 30, 2015, the Company purchased 261,600 shares at a weighted average cost of $12.11 per share. The following table presents a summary of the Company’s share repurchases during the quarter ended September 30, 2015.
Company Purchases of Common Stock
| Month Ending |
Total number of shares purchased |
Average price paid per share |
Total number of shares purchased as part of publicly announced plans or programs |
Maximum number of shares that may yet be purchased under the plans or programs |
||||||||||||
| July 31, 2015 |
6,500 | $ | 12.89 | 6,500 | 84,900 | |||||||||||
| August 31, 2015 |
5,200 | 12.57 | 5,200 | 79,700 | ||||||||||||
| September 30, 2015 |
57,000 | 13.02 | 57,000 | 22,700 | ||||||||||||
|
|
|
|
|
|
|
|||||||||||
| Total |
68,700 | $ | 12.93 | 68,700 | 22,700 | |||||||||||
|
|
|
|
|
|
|
|||||||||||
| Item 6. | Selected Financial Data |
The following information is derived from the audited consolidated financial statements of ESSA Bancorp, Inc. For additional information, reference is made to “Management’s Discussion and Analysis of Financial Condition and Results of Operations” and the Consolidated Financial Statements of ESSA Bancorp, Inc. and related notes included elsewhere in this Annual Report.
| At September 30, | ||||||||||||||||||||
| 2015 | 2014 | 2013 | 2012 | 2011 | ||||||||||||||||
| (In thousands) | ||||||||||||||||||||
| Selected Financial Condition Data: |
||||||||||||||||||||
| Total assets |
$ | 1,606,544 | $ | 1,574,815 | $ | 1,372,315 | $ | 1,418,786 | $ | 1,097,480 | ||||||||||
| Cash and cash equivalents |
18,758 | 22,301 | 26,648 | 15,550 | 41,694 | |||||||||||||||
| Investment securities: |
||||||||||||||||||||
| Available for sale |
379,407 | 383,078 | 315,622 | 329,585 | 245,393 | |||||||||||||||
| Loans, net |
1,102,118 | 1,058,267 | 928,230 | 950,355 | 738,619 | |||||||||||||||
| Regulatory stock |
13,831 | 14,284 | 9,415 | 21,914 | 16,882 | |||||||||||||||
| Premises and equipment |
16,553 | 16,957 | 15,747 | 16,170 | 11,494 | |||||||||||||||
| Bank owned life insurance |
30,655 | 29,720 | 28,797 | 27,848 | 23,256 | |||||||||||||||
| Deposits |
1,096,754 | 1,133,889 | 1,041,059 | 995,634 | 637,924 | |||||||||||||||
| Borrowed funds |
320,440 | 259,320 | 152,260 | 234,741 | 288,410 | |||||||||||||||
| Equity |
171,280 | 167,309 | 166,446 | 175,411 | 161,679 | |||||||||||||||
36
Table of Contents
| For the Years Ended September 30, | ||||||||||||||||||||
| 2015 | 2014 | 2013 | 2012 | 2011 | ||||||||||||||||
| (In thousands) | ||||||||||||||||||||
| Selected Data: |
||||||||||||||||||||
| Interest income |
$ | 54,179 | $ | 50,776 | $ | 51,102 | $ | 45,200 | $ | 47,176 | ||||||||||
| Interest expense |
10,390 | 10,627 | 11,257 | 16,132 | 18,280 | |||||||||||||||
|
|
|
|
|
|
|
|
|
|
|
|||||||||||
| Net interest income |
43,789 | 40,149 | 39,845 | 29,068 | 28,896 | |||||||||||||||
| Provision for loan losses |
2,075 | 2,350 | 3,750 | 2,550 | 2,055 | |||||||||||||||
|
|
|
|
|
|
|
|
|
|
|
|||||||||||
| Net interest income after provision for loan losses |
41,714 | 37,799 | 36,095 | 26,518 | 26,841 | |||||||||||||||
| Non-interest income |
7,896 | 7,407 | 8,024 | 6,735 | 6,325 | |||||||||||||||
| Non-interest expense |
36,865 | 33,811 | 32,462 | 33,005 | 26,045 | |||||||||||||||
|
|
|
|
|
|
|
|
|
|
|
|||||||||||
| Income before income tax expense |
12,745 | 11,395 | 11,657 | 248 | 7,121 | |||||||||||||||
| Income tax expense |
2,954 | 2,891 | 2,834 | 33 | 1,863 | |||||||||||||||
|
|
|
|
|
|
|
|
|
|
|
|||||||||||
| Net income |
$ | 9,791 | $ | 8,504 | $ | 8,823 | $ | 215 | $ | 5,258 | ||||||||||
|
|
|
|
|
|
|
|
|
|
|
|||||||||||
| Earnings per share |
||||||||||||||||||||
| Basic |
$ | 0.94 | $ | 0.79 | $ | 0.76 | $ | 0.02 | $ | 0.46 | ||||||||||
|
|
|
|
|
|
|
|
|
|
|
|||||||||||
| Diluted |
$ | 0.93 | $ | 0.79 | $ | 0.76 | $ | 0.02 | $ | 0.46 | ||||||||||
|
|
|
|
|
|
|
|
|
|
|
|||||||||||
| At or For the Years Ended September 30, | ||||||||||||||||||||
| 2015 | 2014 | 2013 | 2012 | 2011 | ||||||||||||||||
| Selected Financial Ratios and Other Data: |
||||||||||||||||||||
| Performance Ratios: |
||||||||||||||||||||
| Return on average assets |
0.62 | % | 0.59 | % | 0.64 | % | 0.02 | % | 0.48 | % | ||||||||||
| Return on average equity |
5.68 | % | 5.01 | % | 5.12 | % | 0.13 | % | 3.15 | % | ||||||||||
| Interest rate spread(1) |
2.89 | % | 2.89 | % | 2.97 | % | 2.42 | % | 2.47 | % | ||||||||||
| Net interest margin(2) |
2.96 | % | 2.97 | % | 3.08 | % | 2.65 | % | 2.78 | % | ||||||||||
| Efficiency ratio(3) |
71.33 | % | 71.10 | % | 67.81 | % | 91.90 | % | 75.62 | % | ||||||||||
| Noninterest expense to average total assets |
2.33 | % | 2.32 | % | 2.34 | % | 2.84 | % | 2.39 | % | ||||||||||
| Average interest-earning assets to average interest-bearing liabilities |
113.81 | % | 112.36 | % | 113.50 | % | 116.55 | % | 117.90 | % | ||||||||||
| Asset Quality Ratios: |
||||||||||||||||||||
| Non-performing assets as a percent of total assets |
1.41 | % | 1.58 | % | 1.89 | % | 1.92 | % | 1.26 | % | ||||||||||
| Non-performing loans as a percent of total loans |
1.81 | % | 2.08 | % | 2.55 | % | 2.53 | % | 1.54 | % | ||||||||||
| Allowance for loan losses as a percent of non-performing loans |
44.36 | % | 38.98 | % | 33.79 | % | 30.12 | % | 71.04 | % | ||||||||||
| Allowance for loan losses as a percent of total loans |
0.80 | % | 0.81 | % | 0.86 | % | 0.76 | % | 1.09 | % | ||||||||||
| Allowance for loan losses as a percent of non-performing loans excluding acquired loans |
72.89 | % | 65.78 | % | 50.33 | % | 49.34 | % | — | |||||||||||
| Allowance for loan losses as a percent of total loans excluding acquired loans |
0.98 | % | 1.07 | % | 1.03 | % | 0.97 | % | — | |||||||||||
| Capital Ratios: |
||||||||||||||||||||
| Total risk-based capital (to risk weighted assets) (4) |
16.35 | % | 16.98 | % | 20.35 | % | 19.71 | % | 28.54 | % | ||||||||||
| Common equity Tier 1 capital (to risk weighted assets) (4) |
15.47 | % | N/A | N/A | N/A | N/A | ||||||||||||||
| Tier 1 risk-based capital (to risk weighted assets) (4) |
15.47 | % | 16.08 | % | 19.42 | % | 18.81 | % | 27.30 | % | ||||||||||
| Tangible capital (to tangible assets) |
10.03 | % | 10.04 | % | 11.03 | % | 11.08 | % | 14.18 | % | ||||||||||
| Tier 1 leverage (core) capital (to adjusted tangible assets) (4) |
10.03 | % | 10.04 | % | 11.03 | % | 11.08 | % | 14.18 | % | ||||||||||
| Average equity to average total assets |
10.90 | % | 11.67 | % | 12.42 | % | 14.30 | % | 15.27 | % | ||||||||||
| Other Data: |
||||||||||||||||||||
| Number of full service offices |
25 | 27 | 26 | 26 | 17 | |||||||||||||||
37
Table of Contents
| (1) | The interest rate spread represents the difference between the weighted-average yield on a fully tax equivalent basis on interest-earning assets and the weighted-average cost of interest-bearing liabilities for the year. |
| (2) | The net interest margin represents net interest income on a fully tax equivalent basis as a percent of average interest-earning assets for the year. |
| (3) | The efficiency ratio represents non-interest expense divided by the sum of net interest income and non-interest income. |
| (4) | Ratios are for ESSA Bank & Trust and do not include capital retained at the holding company level. |
| Item 7. | Management’s Discussion and Analysis of Financial Condition and Results of Operations |
Business Strategy
Our business strategy is to grow and improve our profitability by:
| • | Increasing customer relationships through the offering of excellent service and the distribution of that service through effective delivery systems; |
| • | Continuing to transform into a full service community bank by meeting the financial services needs of our customers; |
| • | Continuing to develop into a high performing financial institution, in part by increasing interest revenue and fee income; |
| • | Remaining within our risk management parameters; and |
| • | Employing affordable technology to increase profitability and improve customer service. |
We intend to continue to pursue our business strategy, subject to changes necessitated by future market conditions and other factors. We also intend to focus on the following:
| • | Increasing customer relationships through a continued commitment to service and enhancing products and delivery systems. We will continue to increase customer relationships by focusing on customer satisfaction with regard to service, products, systems and operations. We have upgraded and expanded certain of our facilities, including our corporate center and added additional branches to provide additional capacity to manage future growth and expand our delivery systems. |
| • | Continuing to develop into a high performing financial institution. We will continue to enhance profitability by focusing on increasing non-interest income as well as increasing commercial products, including commercial real estate lending, which often have a higher profit margin than more traditional products. We also will pursue lower-cost commercial deposits as part of this strategy. |
| • | Remaining within our risk management parameters. We place significant emphasis on risk management and compliance training for all of our directors, officers and employees. We focus on establishing regulatory compliance programs to determine the degree of such compliance and to maintain the trust of our customers and community. |
| • | Employing cost-effective technology to increase profitability and improve customer service. We will continue to upgrade our technology in an efficient manner. We have implemented new software for marketing purposes and have upgraded both our internal and external communication systems. |
| • | Continuing our emphasis on commercial real estate lending to improve our overall performance. We intend to continue to emphasize the origination of higher interest rate margin commercial real estate loans as market conditions, regulations and other factors permit. We have expanded our commercial banking capabilities by adding experienced commercial bankers, and enhancing our direct marketing efforts to local businesses. |
| • | Expanding our banking franchise through branching and acquisitions. We will attempt to use our stock holding company structure, to expand our market footprint through de novo branching as well as through additional acquisitions of banks, savings institutions and other financial service providers in our primary market area. We will also consider establishing de novo branches or acquiring additional financial institutions in contiguous counties. We will continue to review and assess locations for new branches both within Monroe County and the contiguous counties around Monroe. There can be no assurance that we will be able to consummate any new acquisitions or establish any additional new branches. We may continue to explore acquisition opportunities involving other banks and thrifts, and possibly financial service companies, when and as they arise, as a means of supplementing internal growth, filling gaps in our current geographic market area and expanding our customer base, product lines and internal capabilities, although we have no current plans, arrangements or understandings to make any acquisitions. |
| • | Maintaining the quality of our loan portfolio. Maintaining the quality of our loan portfolio is a key factor in managing our growth. We will continue to use customary risk management techniques, such as independent internal and external loan reviews, risk-focused portfolio credit analysis and field inspections of collateral in overseeing the performance of our loan portfolio. |
38
Table of Contents
Critical Accounting Policies
We consider accounting policies that require management to exercise significant judgment or discretion or make significant assumptions that have, or could have, a material impact on the carrying value of certain assets or on income, to be critical accounting policies. We consider the following to be our critical accounting policies:
Allowance for Loan Losses. The allowance for loan losses is the estimated amount considered necessary to cover credit losses inherent in the loan portfolio at the balance sheet date. The allowance is established through the provision for loan losses which is charged against income. In determining the allowance for loan losses, management makes significant estimates and has identified this policy as one of our most critical. The methodology for determining the allowance for loan losses is considered a critical accounting policy by management due to the high degree of judgment involved, the subjectivity of the assumptions utilized and the potential for changes in the economic environment that could result in changes to the amount of the recorded allowance for loan losses.
As a substantial amount of our loan portfolio is collateralized by real estate, appraisals of the underlying value of property securing loans and discounted cash flow valuations of properties are critical in determining the amount of the allowance required for specific loans. Assumptions for appraisals and discounted cash flow valuations are instrumental in determining the value of properties. Overly optimistic assumptions or negative changes to assumptions could significantly impact the valuation of a property securing a loan and the related allowance determined. The assumptions supporting such appraisals and discounted cash flow valuations are carefully reviewed by management to determine that the resulting values reasonably reflect amounts realizable on the related loans.
Management performs a quarterly evaluation of the adequacy of the allowance for loan losses. Consideration is given to a variety of factors in establishing this estimate including, but not limited to, current economic conditions, delinquency statistics, geographic and industry concentrations, the adequacy of the underlying collateral, the financial strength of the borrower, results of internal and external loan reviews and other relevant factors. This evaluation is inherently subjective, as it requires material estimates that may be susceptible to significant revision based on changes in economic and real estate market conditions.
The analysis of the allowance for loan losses has two components: specific and general allocations. Specific allocations are made for loans that are determined to be impaired. Impairment is measured by determining the present value of expected future cash flows or, for collateral-dependent loans, the fair value of the collateral adjusted for market conditions and selling expenses. The general allocation is determined by segregating the remaining loans by type of loan, risk weighting (if applicable) and payment history. We also analyze historical loss experience, delinquency trends, general economic conditions and geographic and industry concentrations. This analysis establishes factors that are applied to the loan groups to determine the amount of the general allocations. Actual loan losses may be significantly more than the allowance for loan losses we have established which could have a material negative effect on our financial results.
Goodwill and Intangible Assets. Goodwill is not amortized, but it is tested at least annually for impairment in the fourth quarter, or more frequently if indicators of impairment are present. If the estimated current fair value of a reporting unit exceeds its carrying value, no additional testing is required and an impairment loss is not recorded. The Company uses market capitalization and multiples of tangible book value methods to determine the estimated current fair value of its reporting unit. Based on this analysis, no impairment was recorded in 2015 or 2014.
The other intangibles assets are assigned useful lives, which are amortized on an accelerated basis over their weighted-average lives. The Company periodically reviews the intangible assets for impairment as events or changes in circumstances indicate that the carrying amount of such asset may not be recoverable. Based on these reviews, no impairment was recorded in 2015 and 2014.
Employee Benefit Plans. The Bank maintains a noncontributory, defined benefit pension plan for all employees who have met age and length of service requirements. The Bank also maintains a defined contribution Section 401(k) plan covering eligible employees. The Company created an ESOP for the benefit of employees who meet certain eligibility requirements. The Company makes cash contributions to the ESOP on an annual basis.
The Company maintains an equity incentive plan to provide for issuance or granting of shares of common stock for stock options or restricted stock. The Company has recorded stock-based employee compensation cost using the fair value method as allowed under generally accepted accounting principles. Management estimated the fair values of all option grants using the Black-Scholes option-pricing model. Management estimated the expected life of the options using the simplified method as allowed under generally accepted accounting principles. The risk-free rate was determined utilizing the treasury yield for the expected life of the option contract.
39
Table of Contents
Fair Value Measurements. We group our assets at fair value in three levels, based on the markets in which the assets are traded and the reliability of the assumptions used to determine fair value. These levels are:
| • | Level I – Valuation is based upon quoted prices for identical instruments traded in active markets. |
| • | Level II – Valuation is based upon quoted prices for similar instruments in active markets, quoted prices for identical or similar instruments in markets that are not active, and model-based valuation techniques for which all significant assumptions are observable in the market. |
| • | Level III – Valuation is generated from model-based techniques that use significant assumptions not observable in the market. These unobservable assumptions reflect the Company’s own estimates of assumptions that market participants would use in pricing the asset. |
We base our fair values on the price that would be received to sell an asset or paid to transfer a liability in an orderly transaction between market participants at the measurement date. It is our policy to maximize the use of observable inputs and minimize the use of unobservable inputs when developing fair value measurements, in accordance with the fair value hierarchy in generally accepted accounting principles.
Fair value measurements for most of our assets are obtained from independent pricing services that we have engaged for this purpose. When available, we, or our independent pricing service, use quoted market prices to measure fair value. If market prices are not available, fair value measurement is based upon models that incorporate available trade, bid, and other market information. Subsequently, all of our financial instruments use either of the foregoing methodologies to determine fair value adjustments recorded to our financial statements. In certain cases, however, when market observable inputs for model-based valuation techniques may not be readily available, we are required to make judgments about assumptions market participants would use in estimating the fair value of financial instruments. The degree of management judgment involved in determining the fair value of a financial instrument is dependent upon the availability of quoted market prices or observable market parameters. For financial instruments that trade actively and have quoted market prices or observable market parameters, there is minimal subjectivity involved in measuring fair value. When observable market prices and parameters are not fully available, management judgment is necessary to estimate fair value. In addition, changes in the market conditions may reduce the availability of quoted prices or observable data. When market data is not available, we use valuation techniques requiring more management judgment to estimate the appropriate fair value measurement. Therefore, the results cannot be determined with precision and may not be realized in an actual sale or immediate settlement of the asset. Additionally, there may be inherent weaknesses in any calculation technique, and changes in the underlying assumptions used, including discount rates and estimates of future cash flows, that could significantly affect the results of current or future valuations.
Other-than-Temporary Investment Security Impairment. Securities are evaluated periodically to determine whether a decline in their value is other-than-temporary. Management utilizes criteria such as the magnitude and duration of the decline, in addition to the reasons underlying the decline, to determine whether the loss in value is other-than-temporary. The term “other-than-temporary” is not intended to indicate that the decline is permanent, but indicates that the prospect for a near-term recovery of value is not necessarily favorable, or that there is a lack of evidence to support a realizable value equal to or greater than the carrying value of the investment. Once a decline in value is determined to be other-than-temporary, the value of the security is reduced and a corresponding charge to earnings is recognized.
Deferred Income Taxes. We use the asset and liability method of accounting for income taxes. Under this method, deferred tax assets and liabilities are recognized for the future tax consequences attributable to differences between the financial statement carrying amounts of existing assets and liabilities and their respective tax bases. Deferred tax assets and liabilities are measured using enacted tax rates expected to apply to taxable income in the years in which those temporary differences are expected to be recovered or settled. If current available information raises doubt as to the realization of the deferred tax assets, a valuation allowance is established. We consider the determination of this valuation allowance to be a critical accounting policy because of the need to exercise significant judgment in evaluating the amount and timing of recognition of deferred tax liabilities and assets, including projections of future taxable income. These judgments and estimates are reviewed on a continual basis as regulatory and business factors change. A valuation allowance for deferred tax assets may be required if the amount of taxes recoverable through loss carryback declines, or if we project lower levels of future taxable income. Such a valuation allowance would be established through a charge to income tax expense which would adversely affect our operating results.
40
Table of Contents
Comparison of Financial Condition at September 30, 2015 and September 30, 2014
Total Assets. Total assets increased $31.7 million, or 2.0%, to $1.6 billion at September 30, 2015, compared to $1.6 billion at September 30, 2014. Increase in loans receivable were partially offset by declines in cash and cash equivalents, investment securities available for sale, and other assets.
Cash and Due from Banks. Cash and due from banks decreased $5.0 million, or 23.8%, to $15.9 million at September 30, 2015 from $20.9 million at September 30, 2014. The primary reasons for the decrease were declines in the Federal Reserve Bank’s required reserves of $2.6 million and the Company’s Federal Reserve demand deposit account of $1.3 million.
Interest-Bearing Deposits with Other Institutions. Interest-bearing deposits with other institutions increased $1.5 million, or 101.3%, to $2.9 million at September 30, 2015 from $1.4 million at September 30, 2014. The primary reason for the increase was an increase in the Company’s interest bearing demand deposit account at the FHLB-Pittsburgh of $1.5 million.
Investment Securities Available for Sale. Investment securities available for sale decreased $3.7 million, or 1.0%, to $379.4 million at September 30, 2015 from $383.1 million at September 30, 2014. The decrease was due primarily to decreases in mortgage backed securities of $28.0 million, which were offset in part by increases in other debt securities of $13.8 million, obligations of state and political subdivisions of $8.9 million and corporate obligations of $9.0 million.
Net Loans. Net loans increased $43.9 million, or 4.1%, to $1.10 billion at September 30, 2015 from $1.06 billion at September 30, 2014. The primary reasons for the increase was an increase in auto loans offset in part by a decrease in residential real estate loans. Residential real estate loans decreased by $43.6 million to $610.6 million at September 30, 2014 from $654.2 million at September 30, 2014. Commercial real estate loans increased by $9.5 million to $200.0 million at September 30, 2015 from $190.5 million at September 30, 2014. Home equity loans decreased by $1.5 to $39.9 million at September 30, 2015 from $41.4 million at September 30, 2014. Auto loans increased $61.6 million to $162.2 million at September 30, 2015 from $100.6 million at September 30, 2014.
Deposits. Deposits decreased by $37.1 million, or 3.3%, to $1.10 billion at September 30, 2015 from $1.13 billion at September 30, 2014 primarily as a result of declines in interest bearing demand accounts, money market accounts, and certificates of deposit offset in part by increases in non-interest bearing demand accounts and savings and club accounts. Overall, the changes in deposits at September 30, 2015 compared to September 30, 2014 included an increase in non-interest bearing demand accounts of $28.5 million, or 40.6%, declines in interest bearing NOW accounts of $53.7 million, or 32.7%, a decrease in money market accounts of $7.7 million, or 4.5%, an increase in savings and club accounts of $6.5 million, or 5.3%, and a decrease in certificates of deposit of $10.7 million, or 1.8%. Included in the certificates of deposit was an increase of $53.5 million, or 24.5%, in brokered certificates of deposit. The increase in brokered certificates of deposit was the result of brokered certificate being a cheaper funding source than other sources available. At September 30, 2015, the Company had $271.9 million of brokered certificates of deposit outstanding.
Borrowed Funds. Borrowed funds, short term and other, increased $61.1 million, or 23.6%, to $320.4 million at September 30, 2015 from $259.3 million at September 30, 2014. All borrowed funds are from the FHLB, which were more competitively priced than other wholesale funding sources.
Stockholders’ Equity. Stockholders’ equity increased by $4.0 million, or 2.4%, to $171.3 million at September 30, 2015 from $167.3 million at September 30, 2014.
Comparison of Operating Results for the Years Ended September 30, 2015 and September 30, 2014.
Net Income. Net income increased by $1.3 million, or 15.1%, to $9.8 million for the fiscal year ended September 30, 2015 from $8.5 million for the fiscal year ended September 30, 2014. An increase in net interest income, a decrease in the provision for loan losses and an increase in noninterest income were offset by an increase in noninterest expense.
Net Interest Income. Net interest income increased by $3.7 million, or 9.1%, to $43.8 million for fiscal year 2015 from $40.1 million for fiscal year 2014, primarily due to the increase in interest income from loans and investment securities.
Interest Income. Interest income increased $3.4 million, or 6.7%, to $54.2 million for fiscal year 2015 from $50.8 million for fiscal year 2014. The increase resulted from a $128.4 million increase in average interest earning assets which had the effect of increasing interest income by $4.8 million offset in part by a decrease of 8 basis points in the overall yield on earning assets to 3.69% from 3.77% which had the effect of decreasing interest income by $1.4 million. The increase in average interest earning assets during 2015 compared to 2014 included increases in average loans of $92.6 million, average investments of $13.4 million, average mortgage backed securities of $26.8 million and average regulatory stock of $1.9 million. These increases were partially offset by a decrease in average other assets of $6.3 million. The average yield on loans decreased to 4.16% for the fiscal year 2015, from 4.38% for the fiscal year 2014. The average yields on investment securities increased to 2.77% from 2.34% and the average yields on mortgage backed securities increased to 2.04% for 2015 from 2.01% for the 2014 period.
41
Table of Contents
Interest Expense. Interest expense decreased $237,000, or 2.2%, to $10.4 million for fiscal year 2015 from $10.6 million for fiscal year 2014, while average interest bearing liabilities increased by $97.4 million year over year. The decrease resulted from an 8 basis point decrease in the overall cost of interest bearing liabilities to 0.80% for fiscal 2015 from 0.88% for fiscal 2014 which had the effect of decreasing interest expense by $447,000 offset in part by an increase in average interest liabilities which had the effect of increasing interest expense by $210,000 for a net increased interest expense of $237,000. Average savings and club accounts increased by $7.7 million, average interest bearing demand deposit accounts decreased $1.8 million, average money market accounts increased $30.3 million and average certificates of deposit decreased $38.6 million. For fiscal 2015, average borrowed funds increased $99.9 million compared to fiscal 2014. The cost of money market accounts increased to 0.25% for fiscal year 2015 from 0.20% for fiscal year 2014. The cost of savings and club accounts remained unchanged at 0.05% for fiscal 2015. The cost of certificates of deposit decreased to 1.16% from 1.20% and the cost of borrowed funds decreased to 0.99% from 1.36% for fiscal years 2015 and 2014, respectively.
Provision for Loan Losses. The Company establishes provisions for loan losses, which are charged to earnings, at a level necessary to absorb known and inherent losses that are both probable and reasonably estimable at the date of the financial statements. In evaluating the level of the allowance for loan losses, management considers historical loss experience, the types of loans and the amount of loans in the loan portfolio, adverse situations that may affect the borrower’s ability to repay, the estimated value of any underlying collateral, peer group information and prevailing economic conditions. This evaluation is inherently subjective as it requires estimates that are susceptible to significant revision as more information becomes available or as future events occur. After an evaluation of these factors, the Company made a provision of $2.1 million for fiscal year 2015 compared to a $2.4 million provision for the 2014 fiscal year. The allowance for loan losses was $8.9 million, or 0.80%, of loans outstanding at September 30, 2015, compared to $8.6 million, or 0.81%, of loans outstanding at September 30, 2014.
Determining the amount of the allowance for loan losses necessarily involves a high degree of judgment. Management reviews the level of the allowance on a quarterly basis, and establishes the provision for loan losses based on the factors set forth in the preceding paragraph. Historically, the Bank’s loan portfolio has consisted primarily of one- to four-family residential mortgage loans. However, our current business plan calls for increases in commercial real estate loan originations. As management evaluates the allowance for loan losses, the increased risk associated with larger non-homogenous commercial real estate may result in large additions to the allowance for loan losses in future periods. Loans secured by commercial real estate generally expose a lender to greater risk of non-payment and loss than one- to four-family residential mortgage loans because repayment of the loans often depends on the successful operation of the property and the income stream of the underlying property. Additionally, such loans typically involve larger loan balances to single borrowers or groups of related borrowers compared to one- to four-family residential mortgage loans. Accordingly, an adverse development with respect to one loan or one credit relationship can expose us to greater risk of loss compared to an adverse development with respect to a one- to four-family residential mortgage loan.
Although we believe that we use the best information available to establish the allowance for loan losses, future additions to the allowance may be necessary, based on estimates that are susceptible to change as a result of changes in economic conditions and other factors. In addition, the Federal Reserve Board, as an integral part of its examination process, will periodically review our allowance for loan losses. This agency may require us to recognize adjustments to the allowance, based on its judgments about information available to it at the time of its examination.
Non-Interest Income. Non-interest income increased $489,000, or 6.6%, to $7.9 million for the year ended September 30, 2015, from $7.4 million for the comparable 2014 period. The increase was primarily due to increases in service charges on loans of $287,000, gain on sale of investments net of $453,000, and service fees on deposit accounts of $86,000 offset in part by declines in insurance commissions of $51,000, gain on acquisition of $241,000 and other income of $52,000.
Non-Interest Expense. Non-interest expense increased $3.1 million, or 9.0%, to $36.9 million for fiscal year 2015 from $33.8 million for the comparable period in 2014. The primary reason for the increase was due to operating a larger organization as a result of the acquisition of Franklin Security Bank in 2014. Compensation and employee benefits increased $1.7 million, other expenses increased $766,000, and advertising expense increased $341,000, offset by declines in merger costs and amortization of intangible assets.
Income Taxes. Income tax expense of $3.0 million was recognized for fiscal year 2015 compared to an income tax expense of $2.9 million recognized for fiscal year 2014.
42
Table of Contents
Comparison of Operating Results for the Years Ended September 30, 2014 and September 30, 2013.
Net Income. Net income decreased by $319,000, or 3.6%, to $8.5 million for the fiscal year ended September 30, 2014 from $8.8 million for the fiscal year ended September 30, 2013. An increase in net interest income and a decrease in the provision for loan losses was offset by a decrease in noninterest income and an increase in noninterest expense.
Net Interest Income. Net interest income increased by $304,000, or 0.8%, to $40.1 million for fiscal year 2014 from $39.8 million for fiscal year 2013.
Interest Income. Interest income decreased $326,000, or 0.6%, to $50.8 million for fiscal year 2014 from $51.1 million for fiscal year 2013. The decrease resulted from a 19 basis point decrease in the overall yield on interest earning assets to 3.77% from 3.96% for the prior year which had the effect of decreasing interest income by $2.8 million offset in part by a $60.6 million increase in average interest earning assets, which had the effect of increasing interest income by $2.4 million. The increase in average interest earning assets during 2014 compared to 2013 included increases in average loans of $44.5 million, average investments of $3.9 million and average mortgage backed securities of $15.6 million. These increases were partially offset by a decrease in average regulatory stock of $4.3 million. The average yield on loans decreased to 4.38% for the fiscal year 2014, from 4.73% for the fiscal year 2013. The average yields on investment securities increased to 2.34% from 1.96% and the average yields on mortgage backed securities increased to 2.01% from 1.99% for the 2014 and 2013 periods, respectively.
Interest Expense. Interest expense decreased $630,000, or 5.6%, to $10.6 million for fiscal year 2014 from $11.3 million for fiscal year 2013, while average interest bearing liabilities increased by $65.5 million year over year. The decrease resulted from an 11 basis point decrease in the overall cost of interest-bearing liabilities to 0.88% for fiscal 2014 from 0.99% for fiscal 2013. Average savings and club accounts increased by $11.1 million, average NOW accounts increased $18.4 million, average money market accounts increased $12.7 million and average certificates of deposit increased $24.5 million. For fiscal 2014, average borrowed funds decreased $1.3 million compared to fiscal 2013. The cost of money market accounts decreased to 0.20% for fiscal year 2014 from 0.23% for fiscal year 2013. The cost of savings and club accounts remained unchanged at 0.05% for fiscal 2014. The cost of certificates of deposit increased to 1.20% from 1.17% and the cost of borrowed funds decreased to 1.36% from 1.91% for fiscal years 2014 and 2013, respectively.
Provision for Loan Losses. The Company establishes provisions for loan losses, which are charged to earnings, at a level necessary to absorb known and inherent losses that are both probable and reasonably estimable at the date of the financial statements. In evaluating the level of the allowance for loan losses, management considers historical loss experience, the types of loans and the amount of loans in the loan portfolio, adverse situations that may affect the borrower’s ability to repay, the estimated value of any underlying collateral, peer group information and prevailing economic conditions. This evaluation is inherently subjective as it requires estimates that are susceptible to significant revision as more information becomes available or as future events occur. After an evaluation of these factors, the Company made a provision of $2.4 million for fiscal year 2014 compared to a $3.8 million provision for the 2013 fiscal year. The allowance for loan losses was $8.6 million, or 0.81%, of loans outstanding at September 30, 2014, compared to $8.1 million, or 0.86%, of loans outstanding at September 30, 2013.
Determining the amount of the allowance for loan losses necessarily involves a high degree of judgment. Management reviews the level of the allowance on a quarterly basis, and establishes the provision for loan losses based on the factors set forth in the preceding paragraph. Historically, the Bank’s loan portfolio has consisted primarily of one- to four-family residential mortgage loans. However, our current business plan calls for increases in commercial real estate loan originations. As management evaluates the allowance for loan losses, the increased risk associated with larger non-homogenous commercial real estate may result in large additions to the allowance for loan losses in future periods. Loans secured by commercial real estate generally expose a lender to greater risk of non-payment and loss than one-to-four family residential mortgage loans because repayment of the loans often depends on the successful operation of the property and the income stream of the underlying property. Additionally, such loans typically involve larger loan balances to single borrowers or groups of related borrowers compared to one-to-four family residential mortgage loans. Accordingly, an adverse development with respect to one loan or one credit relationship can expose us to greater risk of loss compared to an adverse development with respect to a one-to-four family residential mortgage loan.
Although we believe that we use the best information available to establish the allowance for loan losses, future additions to the allowance may be necessary, based on estimates that are susceptible to change as a result of changes in economic conditions and other factors. In addition, the Federal Reserve Board, as an integral part of its examination process, will periodically review our allowance for loan losses. This agency may require us to recognize adjustments to the allowance, based on its judgments about information available to it at the time of its examination.
Non-Interest Income. Non-interest income decreased $617,000 million, or 7.7%, to $7.4 million for the year ended September 30, 2014, from $8.0 million for the comparable 2013 period. The decrease was primarily due to a decrease in gain on sale of investments of $416,000, service charges and fees on loans of $162,000 and gain on sale of loans of $426,000, which were partially offset by an increase in gain on acquisition of $241,000.
43
Table of Contents
Non-Interest Expense. Non-interest expense increased $1.3 million, or 4.2%, to $33.8 million for fiscal year 2014 from $32.5 million for the comparable period in 2013. The primary reasons for the increase were increases in merger related costs of $522,000, increased other expenses of $292,000 and increased data processing costs of $363,000 which was partially offset by a decrease in compensation and employee benefits of $82,000.
Income Taxes. Income tax expense of $2.9 million was recognized for fiscal year 2014 compared to an income tax expense of $2.8 million recognized for fiscal year 2013.
44
Table of Contents
Average Balances and Yields. The following table sets forth average balance sheets, average yields and costs, and certain other information for the periods indicated. All average balances are monthly average balances. The yields set forth below include the effect of deferred fees and discounts and premiums that are amortized or accreted to interest income.
| For the Years Ended September 30, | ||||||||||||||||||||||||||||||||||||
| 2015 | 2014 | 2013 | ||||||||||||||||||||||||||||||||||
| Average Balance |
Interest Income/ Expense |
Yield/ Cost |
Average Balance |
Interest Income/ Expense |
Yield/ Cost |
Average Balance |
Interest Income/ Expense |
Yield/ Cost |
||||||||||||||||||||||||||||
| (Dollars in thousands) | ||||||||||||||||||||||||||||||||||||
| Interest-earning assets: |
||||||||||||||||||||||||||||||||||||
| Loans(1) (2) |
$ | 1,083,475 | $ | 45,067 | 4.16 | % | $ | 990,877 | $ | 43,382 | 4.38 | % | $ | 946,358 | $ | 44,744 | 4.73 | % | ||||||||||||||||||
| Investment securities |
||||||||||||||||||||||||||||||||||||
| Taxable(3) |
82,074 | 1,840 | 2.24 | % | 82,465 | 1,648 | 2.00 | % | 88,757 | 1,585 | 1.79 | % | ||||||||||||||||||||||||
| Exempt from federal income tax(3) (4) |
37,162 | 965 | 3.93 | % | 23,386 | 550 | 3.56 | % | 13,166 | 272 | 3.13 | % | ||||||||||||||||||||||||
|
|
|
|
|
|
|
|
|
|
|
|
|
|
|
|
|
|
|
|||||||||||||||||||
| Total investment securities |
119,236 | 2,805 | 2.77 | % | 105,851 | 2,198 | 2.34 | % | 101,923 | 1,857 | 1.96 | % | ||||||||||||||||||||||||
| Mortgage-backed securities |
262,106 | 5,359 | 2.04 | % | 235,320 | 4,737 | 2.01 | % | 219,697 | 4,373 | 1.99 | % | ||||||||||||||||||||||||
| Regulatory stock |
13,245 | 930 | 7.02 | % | 11,315 | 441 | 3.90 | % | 15,635 | 115 | 0.74 | % | ||||||||||||||||||||||||
| Other |
3,366 | 18 | 0.53 | % | 9,711 | 18 | 0.19 | % | 8,849 | 13 | 0.15 | % | ||||||||||||||||||||||||
|
|
|
|
|
|
|
|
|
|
|
|
|
|
|
|
|
|
|
|||||||||||||||||||
| Total interest-earning assets |
1,481,428 | 54,179 | 3.69 | % | 1,353,074 | 50,776 | 3.77 | % | 1,292,462 | 51,102 | 3.96 | % | ||||||||||||||||||||||||
| Allowance for loan losses |
(8,667 | ) | (8,457 | ) | (7,709 | ) | ||||||||||||||||||||||||||||||
| Noninterest-earning assets |
108,128 | 109,663 | 102,057 | |||||||||||||||||||||||||||||||||
|
|
|
|
|
|
|
|||||||||||||||||||||||||||||||
| Total assets |
$ | 1,580,889 | $ | 1,454,280 | $ | 1,386,810 | ||||||||||||||||||||||||||||||
|
|
|
|
|
|
|
|||||||||||||||||||||||||||||||
| Interest-bearing liabilities: |
||||||||||||||||||||||||||||||||||||
| NOW accounts |
$ | 107,782 | 103 | 0.10 | % | $ | 109,615 | 76 | 0.07 | % | $ | 91,201 | 51 | 0.06 | % | |||||||||||||||||||||
| Money market accounts |
186,121 | 465 | 0.25 | % | 155,841 | 315 | 0.20 | % | 143,103 | 327 | 0.23 | % | ||||||||||||||||||||||||
| Savings and club accounts |
123,028 | 62 | 0.05 | % | 115,347 | 61 | 0.05 | % | 104,234 | 50 | 0.05 | % | ||||||||||||||||||||||||
| Certificates of deposit |
584,684 | 6,795 | 1.16 | % | 623,307 | 7,455 | 1.20 | % | 598,759 | 6,980 | 1.17 | % | ||||||||||||||||||||||||
| Borrowed funds |
300,035 | 2,965 | 0.99 | % | 200,152 | 2,720 | 1.36 | % | 201,483 | 3,849 | 1.91 | % | ||||||||||||||||||||||||
|
|
|
|
|
|
|
|
|
|
|
|
|
|
|
|
|
|
|
|||||||||||||||||||
| Total interest-bearing liabilities |
1,301,650 | 10,390 | 0.80 | % | 1,204,262 | 10,627 | 0.88 | % | 1,138,780 | 11,257 | 0.99 | % | ||||||||||||||||||||||||
| Non-interest bearing demand accounts |
89,333 | 64,253 | 56,467 | |||||||||||||||||||||||||||||||||
| Noninterest-bearing liabilities |
17,616 | 16,097 | 19,277 | |||||||||||||||||||||||||||||||||
|
|
|
|
|
|
|
|||||||||||||||||||||||||||||||
| Total liabilities |
1,408,599 | 1,284,612 | 1,214,524 | |||||||||||||||||||||||||||||||||
| Equity |
172,290 | 169,668 | 172,286 | |||||||||||||||||||||||||||||||||
|
|
|
|
|
|
|
|||||||||||||||||||||||||||||||
| Total liabilities and equity |
$ | 1,580,889 | $ | 1,454,280 | $ | 1,386,810 | ||||||||||||||||||||||||||||||
|
|
|
|
|
|
|
|||||||||||||||||||||||||||||||
| Net interest income |
$ | 43,789 | $ | 40,149 | $ | 39,845 | ||||||||||||||||||||||||||||||
|
|
|
|
|
|
|
|||||||||||||||||||||||||||||||
| Interest rate spread |
2.89 | % | 2.89 | % | 2.97 | % | ||||||||||||||||||||||||||||||
| Net interest-earning assets |
$ | 179,778 | $ | 148,812 | $ | 153,682 | ||||||||||||||||||||||||||||||
|
|
|
|
|
|
|
|||||||||||||||||||||||||||||||
| Net interest margin(5) |
2.96 | % | 2.97 | % | 3.08 | % | ||||||||||||||||||||||||||||||
| Average interest-earning assets to average interest-bearing liabilities |
113.81 | % | 112.36 | % | 113.50 | % | ||||||||||||||||||||||||||||||
| (1) | Non-accruing loans are included in the outstanding loan balances. |
| (2) | Interest income on loans includes net amortized costs on loans totaling $1.1 million in 2015, $10,000 in 2014 and $43,000 in 2013. |
| (3) | Held to maturity securities are reported as amortized cost. Available for sale securities are reported at fair value. |
45
Table of Contents
| (4) | Yields on tax exempt securities have been calculated on a fully tax equivalent basis assuming a tax rate of 34%. |
| (5) | Represents the difference between interest earned and interest paid, divided by average total interest earning assets. |
Rate/Volume Analysis
The following table presents the effects of changing rates and volumes on our net interest income for the years indicated. The rate column shows the effects attributable to changes in rate (changes in rate multiplied by prior volume). The volume column shows the effects attributable to changes in volume (changes in volume multiplied by prior rate). The net column represents the sum of the prior columns. For purposes of this table, changes attributable to both rate and volume, which cannot be segregated, have been allocated proportionately based on the changes due to rate and the changes due to volume.
| For the Years Ended September 30, 2015 vs. 2014 |
For the Years Ended September 30, 2014 vs. 2013 |
|||||||||||||||||||||||
| Increase (Decrease) Due to |
Increase (Decrease) Due to |
|||||||||||||||||||||||
| Volume | Rate | Net | Volume | Rate | Net | |||||||||||||||||||
| (In thousands) | ||||||||||||||||||||||||
| Interest-earning assets: |
||||||||||||||||||||||||
| Loans |
$ | 3,932 | $ | (2,247 | ) | $ | 1,685 | $ | 2,045 | $ | (3,407 | ) | $ | (1,362 | ) | |||||||||
| Investment securities |
286 | 321 | 607 | 84 | 257 | 341 | ||||||||||||||||||
| Mortgage-backed securities |
553 | 69 | 622 | 322 | 42 | 364 | ||||||||||||||||||
| Regulatory stock |
86 | 403 | 489 | (23 | ) | 349 | 326 | |||||||||||||||||
| Other |
(18 | ) | 18 | — | 1 | 4 | 5 | |||||||||||||||||
|
|
|
|
|
|
|
|
|
|
|
|
|
|||||||||||||
| Total interest-earning assets |
4,839 | (1,436 | ) | 3,403 | 2,429 | (2,755 | ) | (326 | ) | |||||||||||||||
| Interest-bearing liabilities: |
||||||||||||||||||||||||
| NOW accounts |
(1 | ) | 28 | 27 | 39 | (14 | ) | 25 | ||||||||||||||||
| Money market accounts |
20 | 130 | 150 | 30 | (42 | ) | (12 | ) | ||||||||||||||||
| Savings and club accounts |
1 | — | 1 | 11 | — | 11 | ||||||||||||||||||
| Certificates of deposit |
(349 | ) | (311 | ) | (660 | ) | 309 | 166 | 475 | |||||||||||||||
| Borrowed funds |
539 | (294 | ) | 245 | (25 | ) | (1,104 | ) | (1,129 | ) | ||||||||||||||
|
|
|
|
|
|
|
|
|
|
|
|
|
|||||||||||||
| Total interest-bearing liabilities |
210 | (447 | ) | (237 | ) | 364 | (994 | ) | (630 | ) | ||||||||||||||
|
|
|
|
|
|
|
|
|
|
|
|
|
|||||||||||||
| Net change in interest income |
$ | 4,629 | $ | (989 | ) | $ | 3,640 | $ | 2,065 | $ | (1,761 | ) | $ | 304 | ||||||||||
|
|
|
|
|
|
|
|
|
|
|
|
|
|||||||||||||
Management of Market Risk
General. The majority of our assets and liabilities are monetary in nature. Consequently, our most significant form of market risk is interest rate risk. Our assets, consisting primarily of mortgage loans, have longer maturities than our liabilities, consisting primarily of deposits and borrowings. As a result, a principal part of our business strategy is to manage interest rate risk and reduce the exposure of our net interest income to changes in market interest rates. Accordingly, our Board of Directors has approved guidelines for managing the interest rate risk inherent in our assets and liabilities, given our business strategy, operating environment, capital, liquidity and performance objectives. Senior management monitors the level of interest rate risk on a regular basis and the asset/liability committee meets quarterly to review our asset/liability policies and interest rate risk position. We have sought to manage our interest rate risk in order to minimize the exposure of our earnings and capital to changes in interest rates.
Net interest income, which is the primary source of the Company’s earnings, is impacted by changes in interest rates and the relationship of different interest rates. To manage the impact of the rate changes, the balance sheet should be structured so that repricing opportunities exist for both assets and liabilities at approximately the same time intervals. The Company uses net interest simulation to assist in interest rate risk management. The process includes simulating various interest rate environments and their impact on net interest income. As of September 30, 2015, the level of net interest income at risk in a 200 basis points increase was within the Company’s policy limit of a decline less than 10% of net interest income. Due to the inability to reduce many deposit rates by the full 200 basis points, the Company’s net interest income at risk in a 100 basis point decline was within the Company’s policy limit of a decline of less than 10% of net interest income.
46
Table of Contents
The following table sets forth the results of the twelve month projected net interest income model as of September 30, 2015.
| Net Interest Income | ||||||||||||
| Change in Interest Rates in Basis Points (Rate Ramp) |
Amount $ |
Change $ |
Change (%) |
|||||||||
| (Dollars in thousands) | ||||||||||||
| -100 |
41,011 | (1,561 | ) | (3.7 | ) | |||||||
| Static |
42,572 | — | — | |||||||||
| +100 |
41,525 | (1,047 | ) | (2.5 | ) | |||||||
| +200 |
40,366 | (2,206 | ) | (5.2 | ) | |||||||
| +300 |
38,534 | (4,038 | ) | (9.5 | ) | |||||||
The above table indicates that as of September 30, 2015, in the event of a 300 basis point instantaneous increase in interest rates, the Company would experience a 9.5%, or $4.0 million, decrease in net interest income. In the event of a 100 basis point decrease in interest rates, the Company would experience a 3.7%, or $1.6 million, decrease in net interest income.
Another measure of interest rate sensitivity is to model changes in the economic value of equity through the use of immediate and sustained interest rate shocks. The following table illustrates the economic value of equity model results as of September 30, 2015.
| Economic Value of Equity | ||||||||||||
| Change in Interest Rates in Basis Points |
Amount $ |
Change $ |
Change (%) |
|||||||||
| (Dollars in thousands) | ||||||||||||
| -100 |
196,139 | 489 | 0.2 | |||||||||
| Flat |
195,650 | — | — | |||||||||
| +100 |
179,450 | (16,200 | ) | (8.3 | ) | |||||||
| +200 |
160,230 | (35,420 | ) | (18.1 | ) | |||||||
| +300 |
140,028 | (55,622 | ) | (28.4 | ) | |||||||
The preceding table indicates that as of September 30, 2015, in the event of an immediate and sustained 300 basis point increase in interest rates, the Company would experience a 28.4%, or $55.6 million, decrease in the present value of equity. If rates were to decrease 100 basis points, the Company would experience a 0.2%, or $489,000, increase in the present value of equity.
Certain shortcomings are inherent in the methodologies used in the above interest rate risk measurements. Modeling changes in net interest income requires the making of certain assumptions regarding prepayment and deposit decay rates, which may or may not reflect the manner in which actual yields and costs respond to changes in market interest rates. While management believes such assumptions are reasonable, there can be no assurance that assumed prepayment rates and decay rates will approximate actual future loan prepayment and deposit withdrawal activity. Moreover, the net interest income table presented assumes that the composition of interest sensitive assets and liabilities existing at the beginning of a period remains constant over the period being measured and also assumes that a particular change in interest rates is reflected uniformly across the yield curve regardless of the duration to maturity or repricing of specific assets and liabilities. Accordingly, although the net interest income table provides an indication of the Company’s interest rate risk exposure at a particular point in time, such measurement is not intended to and does not provide a precise forecast of the effect of changes in market interest rates on net interest income and will differ from actual results.
Liquidity and Capital Resources
We maintain liquid assets at levels we consider adequate to meet both our short-term and long-term liquidity needs. We adjust our liquidity levels to fund deposit outflows, repay our borrowings and to fund loan commitments. We also adjust liquidity as appropriate to meet asset and liability management objectives.
Our primary sources of liquidity are deposits, amortization and prepayment of loans and mortgage-backed securities, maturities of investment securities and other short-term investments, and earnings and funds provided from operations, as well as access to FHLB advances and other borrowings. While scheduled principal repayments on loans and mortgage-backed securities are a relatively predictable source of funds, deposit flows and loan prepayments are greatly influenced by market interest rates, economic conditions, and rates offered by our competition. We set the interest rates on our deposits to maintain a desired level of total deposits.
A portion of our liquidity consists of cash and cash equivalents and borrowings, which are a product of our operating, investing and financing activities. At September 30, 2015, $18.8 million of our assets were invested in cash and cash equivalents. Our primary sources of cash are principal repayments on loans, proceeds from the maturities of investment securities, principal repayments
47
Table of Contents
of mortgage-backed securities and increases in deposit accounts. Short-term investment securities (maturing in one year or less) totaled $6.5 million at September 30, 2015. As of September 30, 2015, we had $320.4 million in borrowings outstanding from the FHLB-Pittsburgh. We have access to FHLB advances of up to approximately $551.2 million.
At September 30, 2015, we had $84.3 million in loan commitments outstanding, which included $19.4 million in undisbursed construction loans, $31.6 million in unused home equity lines of credit and $26.9 million in commercial lines of credit. Certificates of deposit due within one year of September 30, 2015 totaled $282.4 million, or 47.4%, of certificates of deposit. If these maturing deposits do not remain with us, we will be required to seek other sources of funds, including other certificates of deposit and borrowings. Depending on market conditions, we may be required to pay higher rates on such deposits or other borrowings than we currently pay on the certificates of deposit due on or before September 30, 2015. We believe, however, based on past experience that a significant portion of our certificates of deposit will remain with us. We have the ability to attract and retain deposits by adjusting the interest rates offered.
As reported in the Consolidated Statements of Cash Flows, our cash flows are classified for financial reporting purposes as operating, investing or financing cash flows. Net cash provided by operating activities was $19.3 million, $14.5 million, and $23.2 million for the years ended September 30, 2015, 2014 and 2013, respectively. These amounts differ from our net income because of a variety of cash receipts and disbursements that did not affect net income for the respective periods. Net cash provided by/(used) in investing activities was $(40.4) million, $(9.7) million, and $34.2 million in fiscal years 2015, 2014 and 2013, respectively, principally reflecting our loan and investment security activities in the respective periods along with our acquisition of Franklin Security Bank in 2014. Investment security cash flows had the most significant effect, as net cash utilized in purchases amounted to $74.5 million, $77.8 million, and $131.3 million in the years ended September 30, 2015, 2014 and 2013, respectively. Cash proceeds from principal repayments, maturities and sales of investment securities amounted to $81.2 million, $66.3 million, and $135.1 million in the years ended September 30, 2015, 2014 and 2013, respectively. Deposit and borrowing cash flows have traditionally comprised most of our financing activities which resulted in net cash (used)/provided of $17.5 million in fiscal year 2015, $(9.1) million in fiscal year 2014, and $(46.3) million in fiscal year 2013. In addition, during fiscal 2015 we used $3.1 million and in fiscal 2014 we used $4.2 million and we used $14.5 million during fiscal 2013 to repurchase our stock as part of previously disclosed stock repurchase plans.
The following table summarizes our significant fixed and determinable contractual principal obligations and other funding needs by payment date at September 30, 2015. The payment amounts represent those amounts due to the recipient and do not include any unamortized premiums or discounts or other similar carrying amount adjustments.
| Payments Due by Period | ||||||||||||||||||||
| Contractual Obligations |
Less than One Year |
One to Three Years |
Three to Five Years |
More than Five Years |
Total | |||||||||||||||
| (In thousands) | ||||||||||||||||||||
| Long-term debt |
$ | 67,800 | $ | 118,605 | $ | 42,696 | $ | — | $ | 229,101 | ||||||||||
| Operating leases |
607 | 854 | 668 | 1,529 | 3,658 | |||||||||||||||
| Certificates of deposit |
282,444 | 198,069 | 107,995 | 7,819 | 596,327 | |||||||||||||||
|
|
|
|
|
|
|
|
|
|
|
|||||||||||
| Total |
$ | 350,851 | $ | 317,528 | $ | 151,359 | $ | 9,348 | $ | 829,086 | ||||||||||
|
|
|
|
|
|
|
|
|
|
|
|||||||||||
| Commitments to extend credit |
$ | 40,469 | $ | — | $ | — | $ | 43,820 | $ | 84,289 | ||||||||||
|
|
|
|
|
|
|
|
|
|
|
|||||||||||
We also have obligations under our post retirement plan as described in Note 13 to the Consolidated Financial Statements. The post retirement benefit payments represent actuarially determined future payments to eligible plan participants. We expect to contribute $631,000 to our post retirement plan in 2016.
Off-Balance Sheet Arrangements. In the normal course of operations, we engage in a variety of financial transactions that, in accordance with generally accepted accounting principles are not recorded in our financial statements. These transactions involve, to varying degrees, elements of credit, interest rate and liquidity risk. Such transactions are used primarily to manage customers’ requests for funding and take the form of loan commitments and lines of credit. For information about our loan commitments, letters of credit and unused lines of credit, see Note 11 of the notes to the Consolidated Financial Statements.
For fiscal year 2015, we did not engage in any off-balance-sheet transactions other than loan origination commitments and standby letters of credit in the normal course of our lending activities.
48
Table of Contents
Impact of Inflation and Changing Prices
The financial statements and related notes of ESSA Bancorp, Inc. have been prepared in accordance with United States generally accepted accounting principles (“GAAP”). GAAP generally requires the measurement of financial position and operating results in terms of historical dollars without consideration for changes in the relative purchasing power of money over time due to inflation. The impact of inflation is reflected in the increased cost of our operations. Unlike industrial companies, our assets and liabilities are primarily monetary in nature. As a result, changes in market interest rates have a greater impact on performance than the effects of inflation.
| Item 7A. | Quantitative and Qualitative Disclosures About Market Risk |
For information regarding market risk, see “Item 7. Management’s Discussion and Analysis of Financial Conditions and Results of Operation.”
| Item 8. | Financial Statements and Supplementary Data |
The Financial Statements are included in Part III, Item 15 of this Form 10-K.
| Item 9. | Changes in and Disagreements With Accountants on Accounting and Financial Disclosure |
Not Applicable.
| Item 9A. | Controls and Procedures |
| (a) | Evaluation of disclosure controls and procedures. |
Under the supervision and with the participation of our management, including our Principle Executive Officer and Principle Financial Officer, we evaluated the effectiveness of the design and operation of our disclosure controls and procedures (as defined in Rule 13a-15(e) and 15d-15(e) under the Exchange Act) as of the end of the fiscal year (the “Evaluation Date”). Based upon that evaluation, the Principle Executive Officer and Principle Financial Officer concluded that, as of the Evaluation Date, our disclosure controls and procedures were effective.
| (b) | Changes in internal controls. |
There were no changes in our internal control over financial reporting that occurred during the fourth quarter of fiscal 2015 that have materially affected, or are reasonably likely to materially affect, our internal control over financial reporting.
| (c) | Management report on internal control over financial reporting. |
The management of ESSA Bancorp, Inc. (the “Company”) is responsible for establishing and maintaining adequate internal control over financial reporting. ESSA Bancorp’s internal control system is a process designed to provide reasonable assurance to the Company’s management and board of directors regarding the preparation and fair presentation of published financial statements.
Our internal control over financial reporting includes policies and procedures that pertain to the maintenance of records that, in reasonable detail, accurately and fairly reflect transactions and dispositions of assets; provide reasonable assurances that transactions are recorded as necessary to permit preparation of financial statements in accordance with U.S. generally accepted accounting principles, and that receipts and expenditures are being made only in accordance with authorizations of management and the directors of ESSA Bancorp; and provide reasonable assurance regarding prevention or timely detection of unauthorized acquisition, use or disposition of ESSA Bancorp’s assets that could have a material effect on our financial statements.
All internal control systems, no matter how well designed, have inherent limitations. Therefore, even those systems determined to be effective can provide only reasonable assurance with respect to financial statement preparation and presentation. Also, projections of any evaluation of effectiveness to future periods are subject to the risk that controls may become inadequate because of changes in conditions, or that the degree of compliance with the policies or procedures may deteriorate.
ESSA Bancorp, Inc.’s management assessed the effectiveness of the Company’s internal control over financial reporting as of September 30, 2015. In making this assessment, we used the criteria set forth in 2013, by the
49
Table of Contents
Committee of Sponsoring Organizations of the Treadway Commission in Internal Control-Integrated Framework. Based on our assessment we believe that, as of September 30, 2015, the Company’s internal control over financial reporting is effective based on those criteria.
ESSA Bancorp, Inc.’s independent registered public accounting firm that audited the consolidated financial statements has issued an audit report on the effectiveness of the Company’s internal control over financial reporting as of September 30, 2015. See the Consolidated Financial Statements of ESSA Bancorp, Inc. and related notes included elsewhere in this Annual Report.
The Sarbanes-Oxley Act Section 302 Certifications have been filed with the SEC as exhibit 31.1 and exhibit 31.2 to this Annual Report on Form 10-K.
| Item 9B. | Other Information |
Not Applicable.
| Item 10. | Directors, Executive Officers and Corporate Governance |
Information regarding directors, executive officers and corporate governance of the Company is presented under the headings “Proposal 1 — Election of Directors-General,” “— Nominees for Directors,” “— Continuing Directors,” “— Board Meetings and Committees,” “— Executive Officers of the Bank Who Are Not Also Directors,” “Corporate Governance, Code of Ethics and Business conduct” and “Section 16(a) Beneficial Ownership Reporting Compliance” in the Company’s definitive Proxy Statement for the 2016 Annual Meeting of Stockholders to be held on March 3, 2016 (the “Proxy Statement”) and is incorporated herein by reference.
| Item 11. | Executive Compensation |
Information regarding executive compensation is presented under the headings “Proposal I—Election of Directors-Director Compensation,” “— Benefit Plans and Arrangements,” and “— Summary Compensation Table” in the Proxy Statement and is incorporated herein by reference.
| Item 12. | Security Ownership of Certain Beneficial Owners and Management and Related Stockholder Matters |
Information regarding security ownership of certain beneficial owners and management is presented under the heading “Security Ownership of Certain Beneficial Owners and Management” in the Proxy Statement and is incorporated herein by reference.
Securities Authorized for Issuance Under Equity Compensation Plans
Set forth below is information, as of September 30, 2015 regarding equity compensation plans categorized by those plans that have been approved by stockholders and those plans that have not been approved by stockholders.
| Plan |
Number of Securities to be Issued Upon Exercise of Outstanding Options, Warrants and Rights |
Weighted Average Exercise Price of Outstanding Options, Warrants and Rights |
Number of Securities Remaining Available For Future Issuance Under Equity Compensation Plans |
|||||||||
| Equity compensation plans approved by stockholders |
1,319,580 | $ | 12.35 | 398,209 | ||||||||
| Equity compensation plans not approved by stockholders |
— | — | — | |||||||||
|
|
|
|
|
|
|
|||||||
| Total |
1,319,580 | $ | 12.35 | 398,209 | ||||||||
|
|
|
|
|
|
|
|||||||
50
Table of Contents
| Item 13. | Certain Relationships and Related Transactions, and Director Independence |
Information regarding certain relationships and related transactions, and director independence is presented under the heading “Transactions with Certain Related Persons” and “Proposal II—Election of Directors—Director Independence” in the Proxy Statement and is incorporated herein by reference.
| Item 14. | Principal Accounting Fees and Services |
Information regarding principal accounting fees and services is presented under the heading “Proposal 2 — Ratification of Appointment of Independent Registered Public Accountants” in the Proxy Statement and is incorporated herein by reference.
| Item 15. | Exhibits, Financial Statement Schedules |
| (a)(1) | Financial Statements |
The following documents are filed as part of this Form 10-K.
| (A) | Report of Independent Registered Public Accounting Firm |
| (B) | Consolidated Balance Sheet - at September 30, 2015 and 2014 |
| (C) | Consolidated Statement of Income - Years ended September 30, 2015, 2014 and 2013 |
| (D) | Consolidated Statement of Changes in Stockholders’ Equity - Years ended September 30, 2015, 2014 and 2013 |
| (E) | Consolidated Statement of Cash Flows - Years ended September 30, 2015, 2014 and 2013 |
| (F) | Notes to Consolidated Financial Statements. |
| (a)(2) | Financial Statement Schedules |
None.
51
Table of Contents
| (a)(3) | Exhibits |
| 2.1 | Agreement and Plan of Merger by and among ESSA Bancorp, Inc., ESSA Acquisition Corp. and Eagle National Bancorp, Inc.(1) | |
| 3.1 | Articles of Incorporation of ESSA Bancorp, Inc.(2) | |
| 3.2 | Bylaws of ESSA Bancorp, Inc.(2) | |
| 4 | Form of Common Stock Certificate of ESSA Bancorp, Inc.(2) | |
| 10.1 | Amended and Restated Employment Agreement for Gary S. Olson(3) | |
| 10.2 | Amended and Restated Employment Agreement for Allan A. Muto(3) | |
| 10.3 | Amended and Restated Employment Agreement for Diane K. Reimer(3) | |
| 10.4 | Amended and Restated Employment Agreement for V. Gail Bryant (Warner)(3) | |
| 10.5 | Supplemental Executive Retirement Plan(4) | |
| 10.6 | Endorsement Split Dollar Life Insurance Agreement for Gary S. Olson(4) | |
| 10.7 | Endorsement Split Dollar Life Insurance Agreement for Allan A. Muto(4) | |
| 10.8 | Endorsement Split Dollar Life Insurance Agreement for Diane K. Reimer(4) | |
| 10.9 | Endorsement Split Dollar Life Insurance Agreement for V. Gail Warner (Bryant)(4) | |
| 10.10 | ESSA Bancorp, Inc. 2007 Equity Incentive Plan(5) | |
| 21 | Subsidiaries of Registrant | |
| 23 | Consent of S.R. Snodgrass, P.C. | |
| 31.1 | Certification of Chief Executive Officer pursuant to Section 302 of the Sarbanes-Oxley Act of 2002 | |
| 31.2 | Certification of Chief Financial Officer pursuant to Section 302 of the Sarbanes-Oxley Act of 2002 | |
| 32 | Certification of Chief Executive Officer and Chief Financial Officer pursuant to Section 906 of the Sarbanes-Oxley Act of 2002 | |
| 101.INS | XBRL Instance Document | |
| 101.SCH | XBRL Taxonomy Extension Schema Document | |
| 101.CAL | XBRL Taxonomy Calculation Linkbase Document | |
| 101.DEF | XBRL Taxonomy Definition Linkbase Document | |
| 101.LAB | XBRL Taxonomy Label Linkbase Document | |
| 101.PRE | XBRL Taxonomy Extension Presentation Linkbase Document | |
| 1 | Incorporated by reference to ESSA Bancorp, Inc.’s Current Report on Form 8-K filed with the Securities and Exchange Commission on July 29, 2015. |
| 2 | Incorporated by reference to the Registration Statement on Form S-1 of ESSA Bancorp, Inc. (file no. 333-139157), originally filed with the Securities and Exchange Commission on December 7, 2006. |
| 3 | Incorporated by reference to ESSA Bancorp, Inc.’s current report on Form 8-K filed with the Securities and Exchange Commission on May 1, 2013. |
| 4 | Incorporated by reference to ESSA Bancorp, Inc.’s current report on Form 8-K filed with the Securities and Exchange Commission on October 6, 2008. |
| 5 | Incorporated by reference to Appendix A to the Proxy Statement for the Annual Meeting of Stockholders of ESSA Bancorp, Inc. (file no. 001-33384), filed by ESSA Bancorp, Inc. under the Exchange Act on April 4, 2008. |
52
Table of Contents
ESSA BANCORP, INC. AND SUBSIDIARY
AUDITED CONSOLIDATED FINANCIAL STATEMENTS
SEPTEMBER 30, 2015
| Page Number | ||||
| Report on Management’s Assessment of Internal Control Over Financial Reporting |
F-1 | |||
| Report of Independent Registered Public Accounting Firm on Internal Control Over Financial Reporting |
F-2 - F-3 | |||
| Report of Independent Registered Public Accounting Firm on Financial Statements |
F-4 | |||
| Financial Statements |
||||
| F-5 | ||||
| F-6 | ||||
| F-7 | ||||
| F-8 | ||||
| F-9 - F-10 | ||||
| F-11 - F-70 | ||||
Table of Contents

REPORT ON MANAGEMENT’S ASSESSMENT OF INTERNAL CONTROL
OVER FINANCIAL REPORTING
ESSA Bancorp, Inc. (the “Company”) is responsible for the preparation, integrity, and fair presentation of the consolidated financial statements included in this annual report. The consolidated financial statements and notes included in this annual report have been prepared in conformity with United States generally accepted accounting principles and necessarily include some amounts that are based on management’s best estimates and judgments.
We, as management of the Company, are responsible for establishing and maintaining effective internal control over financial reporting that is designed to produce reliable financial statements in conformity with United States generally accepted accounting principles. The system of internal control over financial reporting as it relates to the financial statements is evaluated for effectiveness by management and tested for reliability. Actions are taken to correct potential deficiencies as they are identified. Any system of internal control, no matter how well designed, has inherent limitations, including the possibility that a control can be circumvented or overridden and misstatements due to error or fraud may occur and not be detected. Also, because of changes in conditions, internal control effectiveness may vary over time. Accordingly, even an effective system of internal control will provide only reasonable assurance with respect to financial statement preparation.
Management assessed the Company’s system of internal control over financial reporting as of September 30, 2015, in relation to criteria for effective internal control over financial reporting as described in “Internal Control — Integrated Framework,” issued by the Committee of Sponsoring Organizations of the Treadway Commission in 2013. Based on this assessment, management concludes that, as of September 30, 2015, its system of internal control over financial reporting is effective and meets the criteria of the “Internal Control — Integrated Framework”. S.R. Snodgrass P.C., independent registered public accounting firm, has issued an attestation report on management’s assessment of the Company’s internal control over financial reporting.
| /s/ Gary S. Olson |
| Gary S. Olson |
| President and Chief Executive Officer |
| /s/ Allan A. Muto |
| Allan A. Muto |
| Executive Vice President and Chief Financial Officer |
December 14, 2015
F-1
Table of Contents

REPORT OF INDEPENDENT REGISTERED PUBLIC ACCOUNTING FIRM
Board of Directors and Stockholders
ESSA Bancorp, Inc.
We have audited ESSA Bancorp, Inc. and subsidiary’s internal control over financial reporting as of September 30, 2015, based on criteria established in Internal Control — Integrated Framework issued by the Committee of Sponsoring Organizations of the Treadway Commission in 2013. ESSA Bancorp, Inc.’s management is responsible for maintaining effective internal control over financial reporting and for its assessment of the effectiveness of internal control over financial reporting included in the accompanying Report on Management’s Assessment of Internal Control Over Financial Reporting. Our responsibility is to express an opinion on ESSA Bancorp, Inc.’s internal control over financial reporting based on our audit.
We conducted our audit in accordance with the standards of the Public Company Accounting Oversight Board (United States). Those standards require that we plan and perform the audit to obtain reasonable assurance about whether effective internal control over financial reporting was maintained in all material respects. Our audit included obtaining an understanding of internal control over financial reporting, assessing the risk that a material weakness exists, and testing and evaluating the design and operating effectiveness of internal control based on the assessed risk. Our audit also included performing such other procedures as we considered necessary in the circumstances. We believe that our audit provides a reasonable basis for our opinion.
A company’s internal control over financial reporting is a process designed to provide reasonable assurance regarding the reliability of financial reporting and the preparation of financial statements for external purposes in accordance with generally accepted accounting principles. A company’s internal control over financial reporting includes those policies and procedures that (a) pertain to the maintenance of records that, in reasonable detail, accurately and fairly reflect the transactions and dispositions of the assets of the company; (b) provide reasonable assurance that transactions are recorded, as necessary, to permit preparation of financial statements in accordance with generally accepted accounting principles and that receipts and expenditures of the company are being made only in accordance with authorizations of management and directors of the company; and (c) provide reasonable assurance regarding prevention or timely detection of unauthorized acquisition, use, or disposition of the company’s assets that could have a material effect on the financial statements.
Because of its inherent limitations, internal control over financial reporting may not prevent or detect misstatements. Also, projections of any evaluation of effectiveness to future periods are subject to the risk that controls may become inadequate because of changes in conditions or that the degree of compliance with the policies or procedures may deteriorate.
In our opinion, ESSA Bancorp, Inc. maintained, in all material respects, effective internal control over financial reporting as of September 30, 2015, based on criteria established in Internal Control — Integrated Framework issued by the Committee of Sponsoring Organizations of the Treadway Commission in 2013.
F-2
Table of Contents

We have also audited, in accordance with the standards of the Public Company Accounting Oversight Board (United States), the consolidated balance sheets of ESSA Bancorp, Inc. and subsidiary as of September 30, 2015 and 2014, and the related consolidated statements of income, comprehensive income, changes in stockholders’ equity, and cash flows for each of the three years in the period ended September 30, 2015, and our report dated December 14, 2015, expressed an unqualified opinion.
/s/ S.R. Snodgras, P.C.
Wexford, Pennsylvania
December 14, 2015
F-3
Table of Contents

REPORT OF INDEPENDENT REGISTERED PUBLIC ACCOUNTING FIRM
Board of Directors and Stockholders
ESSA Bancorp, Inc.
We have audited the accompanying consolidated balance sheets of ESSA Bancorp, Inc. and subsidiary as of September 30, 2015 and 2014, and the related consolidated statements of income, comprehensive income, changes in stockholders’ equity, and cash flows for each of the three years in the period ended September 30, 2015. These consolidated financial statements are the responsibility of ESSA Bancorp, Inc.’s management. Our responsibility is to express an opinion on these consolidated financial statements based on our audits.
We conducted our audits in accordance with the standards of the Public Company Accounting Oversight Board (United States). Those standards require that we plan and perform the audit to obtain reasonable assurance about whether the financial statements are free of material misstatement. An audit includes examining, on a test basis, evidence supporting the amounts and disclosures in the financial statements. An audit also includes assessing the accounting principles used and significant estimates made by management, as well as evaluating the overall financial statement presentation. We believe that our audits provide a reasonable basis for our opinion.
In our opinion, the consolidated financial statements referred to above present fairly, in all material respects, the financial position of ESSA Bancorp, Inc. and subsidiary as of September 30, 2015 and 2014, and the results of their operations and their cash flows for each of the three years in the period ended September 30, 2015, in conformity with U.S. generally accepted accounting principles.
We have also audited, in accordance with the standards of the Public Company Accounting Oversight Board (United States), ESSA Bancorp, Inc. and subsidiary’s internal control over financial reporting as of September 30, 2015, based on criteria established in Internal Control — Integrated Framework issued by the Committee of Sponsoring Organizations of the Treadway Commission in 2013, and our report dated December 14, 2015, expressed an unqualified opinion on the effectiveness of ESSA Bancorp, Inc.’s internal control over financial reporting.
/s/ S.R. Snodgras, P.C.
Wexford, Pennsylvania
December 14, 2015
F-4
Table of Contents
ESSA BANCORP, INC. AND SUBSIDIARY
CONSOLIDATED BALANCE SHEET
| September 30, | ||||||||
| 2015 | 2014 | |||||||
| (dollars in thousands) | ||||||||
| ASSETS |
||||||||
| Cash and due from banks |
$ | 15,905 | $ | 20,884 | ||||
| Interest-bearing deposits with other institutions |
2,853 | 1,417 | ||||||
|
|
|
|
|
|||||
| Total cash and cash equivalents |
18,758 | 22,301 | ||||||
| Certificates of deposit |
1,750 | 1,767 | ||||||
| Investment securities available for sale, at fair value |
379,407 | 383,078 | ||||||
| Loans receivable (net of allowance for loan losses of $8,919 and $8,634) |
1,102,118 | 1,058,267 | ||||||
| Regulatory stock, at cost |
13,831 | 14,284 | ||||||
| Premises and equipment, net |
16,553 | 16,957 | ||||||
| Bank-owned life insurance |
30,655 | 29,720 | ||||||
| Foreclosed real estate |
2,480 | 2,759 | ||||||
| Intangible assets, net |
1,759 | 2,396 | ||||||
| Goodwill |
10,259 | 10,259 | ||||||
| Deferred income taxes |
11,149 | 12,027 | ||||||
| Other assets |
17,825 | 21,000 | ||||||
|
|
|
|
|
|||||
| TOTAL ASSETS |
$ | 1,606,544 | $ | 1,574,815 | ||||
|
|
|
|
|
|||||
| LIABILITIES |
||||||||
| Deposits |
$ | 1,096,754 | $ | 1,133,889 | ||||
| Short-term borrowings |
91,339 | 108,020 | ||||||
| Other borrowings |
229,101 | 151,300 | ||||||
| Advances by borrowers for taxes and insurance |
4,273 | 4,093 | ||||||
| Other liabilities |
13,797 | 10,204 | ||||||
|
|
|
|
|
|||||
| TOTAL LIABILITIES |
1,435,264 | 1,407,506 | ||||||
|
|
|
|
|
|||||
| STOCKHOLDERS’ EQUITY |
||||||||
| Preferred stock ($.01 par value; 10,000,000 shares authorized, none issued) |
— | — | ||||||
| Common stock ($.01 par value; 40,000,000 shares authorized, 18,133,095 issued; 11,353,244 and 11,590,378 outstanding at September 30, 2015 and 2014, respectively) |
181 | 181 | ||||||
| Additional paid-in capital |
182,295 | 182,486 | ||||||
| Unallocated common stock held by the Employee Stock Ownership Plan (“ESOP”) |
(9,627 | ) | (10,079 | ) | ||||
| Retained earnings |
83,658 | 77,413 | ||||||
| Treasury stock, at cost; 6,779,851 and 6,542,717 shares at September 30, 2015 and 2014, respectively |
(82,832 | ) | (80,113 | ) | ||||
| Accumulated other comprehensive loss |
(2,395 | ) | (2,579 | ) | ||||
|
|
|
|
|
|||||
| TOTAL STOCKHOLDERS’ EQUITY |
171,280 | 167,309 | ||||||
|
|
|
|
|
|||||
| TOTAL LIABILITIES AND STOCKHOLDERS’ EQUITY |
$ | 1,606,544 | $ | 1,574,815 | ||||
|
|
|
|
|
|||||
See accompanying notes to the consolidated financial statements.
F-5
Table of Contents
ESSA BANCORP, INC. AND SUBSIDIARY
CONSOLIDATED STATEMENT OF INCOME
| Years Ended September 30, | ||||||||||||
| 2015 | 2014 | 2013 | ||||||||||
| (dollars in thousands) | ||||||||||||
| INTEREST INCOME |
||||||||||||
| Loans receivable, including fees |
$ | 45,067 | $ | 43,382 | $ | 44,744 | ||||||
| Investment securities: |
||||||||||||
| Taxable |
7,199 | 6,385 | 5,958 | |||||||||
| Exempt from federal income tax |
965 | 550 | 272 | |||||||||
| Other investment income |
948 | 459 | 128 | |||||||||
|
|
|
|
|
|
|
|||||||
| Total interest income |
54,179 | 50,776 | 51,102 | |||||||||
|
|
|
|
|
|
|
|||||||
| INTEREST EXPENSE |
||||||||||||
| Deposits |
7,425 | 7,907 | 7,408 | |||||||||
| Short-term borrowings |
431 | 180 | 129 | |||||||||
| Other borrowings |
2,534 | 2,540 | 3,720 | |||||||||
|
|
|
|
|
|
|
|||||||
| Total interest expense |
10,390 | 10,627 | 11,257 | |||||||||
|
|
|
|
|
|
|
|||||||
| NET INTEREST INCOME |
43,789 | 40,149 | 39,845 | |||||||||
| Provision for loan losses |
2,075 | 2,350 | 3,750 | |||||||||
|
|
|
|
|
|
|
|||||||
| NET INTEREST INCOME AFTER PROVISION FOR LOAN LOSSES |
41,714 | 37,799 | 36,095 | |||||||||
|
|
|
|
|
|
|
|||||||
| NONINTEREST INCOME |
||||||||||||
| Service fees on deposit accounts |
3,271 | 3,185 | 3,133 | |||||||||
| Services charges and fees on loans |
1,152 | 865 | 1,027 | |||||||||
| Trust and investment fees |
901 | 906 | 853 | |||||||||
| Gain on sale of investments, net |
786 | 333 | 749 | |||||||||
| Gain on sale of loans, net |
— | — | 426 | |||||||||
| Earnings on bank-owned life insurance |
935 | 923 | 949 | |||||||||
| Insurance commissions |
790 | 841 | 838 | |||||||||
| Gain on acquisition |
— | 241 | — | |||||||||
| Other |
61 | 113 | 49 | |||||||||
|
|
|
|
|
|
|
|||||||
| Total noninterest income |
7,896 | 7,407 | 8,024 | |||||||||
|
|
|
|
|
|
|
|||||||
| NONINTEREST EXPENSE |
||||||||||||
| Compensation and employee benefits |
20,606 | 18,920 | 19,002 | |||||||||
| Occupancy and equipment |
4,150 | 4,050 | 3,895 | |||||||||
| Professional fees |
1,983 | 1,883 | 1,868 | |||||||||
| Data processing |
3,449 | 3,270 | 2,907 | |||||||||
| Advertising |
974 | 633 | 574 | |||||||||
| Federal Deposit Insurance Corporation (“FDIC”) premiums |
1,125 | 1,002 | 947 | |||||||||
| Gain on foreclosed real estate |
(148 | ) | (466 | ) | (468 | ) | ||||||
| Merger-related costs |
285 | 522 | — | |||||||||
| Amortization of intangible assets |
637 | 959 | 991 | |||||||||
| Other |
3,804 | 3,038 | 2,746 | |||||||||
|
|
|
|
|
|
|
|||||||
| Total noninterest expense |
36,865 | 33,811 | 32,462 | |||||||||
|
|
|
|
|
|
|
|||||||
| Income before income taxes |
12,745 | 11,395 | 11,657 | |||||||||
| Income taxes |
2,954 | 2,891 | 2,834 | |||||||||
|
|
|
|
|
|
|
|||||||
| NET INCOME |
$ | 9,791 | $ | 8,504 | $ | 8,823 | ||||||
|
|
|
|
|
|
|
|||||||
| Earnings per share: |
||||||||||||
| Basic |
$ | 0.94 | $ | 0.79 | $ | 0.76 | ||||||
| Diluted |
$ | 0.93 | $ | 0.79 | $ | 0.76 | ||||||
| Dividends per share |
$ | 0.34 | $ | 0.26 | $ | 0.20 | ||||||
See accompanying notes to the consolidated financial statements.
F-6
Table of Contents
ESSA BANCORP, INC. AND SUBSIDIARY
CONSOLIDATED STATEMENT OF COMPREHENSIVE INCOME
| Years Ended September 30, | ||||||||||||
| 2015 | 2014 | 2013 | ||||||||||
| (dollars in thousands) | ||||||||||||
| Net income |
$ | 9,791 | $ | 8,504 | $ | 8,823 | ||||||
| Other comprehensive income (loss): |
||||||||||||
| Investment securities available for sale: |
||||||||||||
| Unrealized holding gain (loss) |
4,240 | 1,210 | (8,550 | ) | ||||||||
| Tax effect |
(1,441 | ) | (412 | ) | 2,907 | |||||||
| Reclassification of gains recognized in net income |
(786 | ) | (333 | ) | (749 | ) | ||||||
| Tax effect |
268 | 113 | 255 | |||||||||
|
|
|
|
|
|
|
|||||||
| Net of tax amount |
2,281 | 578 | (6,137 | ) | ||||||||
|
|
|
|
|
|
|
|||||||
| Pension plan adjustment: |
||||||||||||
| Related to actuarial (losses) gains |
(3,177 | ) | (2,912 | ) | 4,763 | |||||||
| Tax effect |
1,080 | 990 | (1,619 | ) | ||||||||
|
|
|
|
|
|
|
|||||||
| Net of tax amount |
(2,097 | ) | (1,922 | ) | 3,144 | |||||||
|
|
|
|
|
|
|
|||||||
| Total other comprehensive income (loss) |
184 | (1,344 | ) | (2,993 | ) | |||||||
|
|
|
|
|
|
|
|||||||
| Comprehensive income |
$ | 9,975 | $ | 7,160 | $ | 5,830 | ||||||
|
|
|
|
|
|
|
|||||||
See accompanying notes to the consolidated financial statements.
F-7
Table of Contents
ESSA BANCORP, INC. AND SUBSIDIARY
CONSOLIDATED STATEMENT OF CHANGES IN STOCKHOLDERS’ EQUITY
|
Common Stock |
Additional Paid-In Capital |
Unallocated Common Stock Held by the ESOP |
Accumulated Other Comprehensive Income (Loss) |
Total Stockholders’ Equity |
||||||||||||||||||||||||||||
| Number of Shares |
Amount | Retained Earnings |
Treasury Stock |
|||||||||||||||||||||||||||||
| (dollars in thousands) | ||||||||||||||||||||||||||||||||
| Balance, September 30, 2012 |
13,229,908 | $ | 181 | $ | 181,220 | $ | (10,985 | ) | $ | 65,181 | $ | (61,944 | ) | $ | 1,758 | $ | 175,411 | |||||||||||||||
| Net income |
8,823 | 8,823 | ||||||||||||||||||||||||||||||
| Other comprehensive loss |
(2,993 | ) | (2,993 | ) | ||||||||||||||||||||||||||||
| Cash dividends declared ($.20 per share) |
(2,295 | ) | (2,295 | ) | ||||||||||||||||||||||||||||
| Stock-based compensation |
1,516 | 1,516 | ||||||||||||||||||||||||||||||
| Allocation of ESOP stock |
32 | 453 | 485 | |||||||||||||||||||||||||||||
| Allocation of treasury shares to incentive plan |
30,000 | (328 | ) | 328 | — | |||||||||||||||||||||||||||
| Treasury shares purchased |
(1,314,344 | ) | (14,501 | ) | (14,501 | ) | ||||||||||||||||||||||||||
|
|
|
|
|
|
|
|
|
|
|
|
|
|
|
|
|
|||||||||||||||||
| Balance, September 30, 2013 |
11,945,564 | 181 | 182,440 | (10,532 | ) | 71,709 | (76,117 | ) | (1,235 | ) | 166,446 | |||||||||||||||||||||
| Net income |
8,504 | 8,504 | ||||||||||||||||||||||||||||||
| Other comprehensive loss |
(1,344 | ) | (1,344 | ) | ||||||||||||||||||||||||||||
| Cash dividends declared ($.26 per share) |
(2,800 | ) | (2,800 | ) | ||||||||||||||||||||||||||||
| Stock-based compensation |
219 | 219 | ||||||||||||||||||||||||||||||
| Allocation of ESOP stock |
47 | 453 | 500 | |||||||||||||||||||||||||||||
| Allocation of treasury shares to incentive plan |
14,600 | (220 | ) | 220 | — | |||||||||||||||||||||||||||
| Treasury shares purchased |
(369,786 | ) | (4,216 | ) | (4,216 | ) | ||||||||||||||||||||||||||
|
|
|
|
|
|
|
|
|
|
|
|
|
|
|
|
|
|||||||||||||||||
| Balance, September 30, 2014 |
11,590,378 | 181 | 182,486 | (10,079 | ) | 77,413 | (80,113 | ) | (2,579 | ) | 167,309 | |||||||||||||||||||||
| Net income |
9,791 | 9,791 | ||||||||||||||||||||||||||||||
| Other comprehensive income |
184 | 184 | ||||||||||||||||||||||||||||||
| Cash dividends declared ($.34 per share) |
(3,546 | ) | (3,546 | ) | ||||||||||||||||||||||||||||
| Stock-based compensation |
113 | 113 | ||||||||||||||||||||||||||||||
| Allocation of ESOP stock |
109 | 452 | 561 | |||||||||||||||||||||||||||||
| Allocation of treasury shares to incentive plan |
21,843 | (413 | ) | 413 | — | |||||||||||||||||||||||||||
| Treasury shares purchased |
(258,977 | ) | (3,132 | ) | (3,132 | ) | ||||||||||||||||||||||||||
|
|
|
|
|
|
|
|
|
|
|
|
|
|
|
|
|
|||||||||||||||||
| Balance, September 30, 2015 |
11,353,244 | $ | 181 | $ | 182,295 | $ | (9,627 | ) | $ | 83,658 | $ | (82,832 | ) | $ | (2,395 | ) | $ | 171,280 | ||||||||||||||
|
|
|
|
|
|
|
|
|
|
|
|
|
|
|
|
|
|||||||||||||||||
See accompanying notes to the consolidated financial statements.
F-8
Table of Contents
ESSA BANCORP, INC. AND SUBSIDIARY
CONSOLIDATED STATEMENT OF CASH FLOWS
| Years Ended September 30, | ||||||||||||
| 2015 | 2014 | 2013 | ||||||||||
| (dollars in thousands) | ||||||||||||
| OPERATING ACTIVITIES |
||||||||||||
| Net income |
$ | 9,791 | $ | 8,504 | $ | 8,823 | ||||||
| Adjustments to reconcile net income to net cash provided by operating activities: |
||||||||||||
| Provision for loan losses |
2,075 | 2,350 | 3,750 | |||||||||
| Provision for depreciation and amortization |
1,326 | 1,261 | 1,145 | |||||||||
| Amortization and accretion of discounts and premiums, net |
2,389 | 1,199 | 1,504 | |||||||||
| Net gain on sale of investment securities |
(786 | ) | (333 | ) | (749 | ) | ||||||
| Gain on sale of loans, net |
— | — | (426 | ) | ||||||||
| Origination of mortgage loans sold |
— | — | (19,530 | ) | ||||||||
| Proceeds from sale of mortgage loans originated for sale |
— | — | 19,956 | |||||||||
| Compensation expense from ESOP |
561 | 500 | 485 | |||||||||
| Stock-based compensation |
113 | 219 | 1,516 | |||||||||
| (Increase) decrease in accrued interest receivable |
(7 | ) | (648 | ) | 544 | |||||||
| Increase (decrease) in accrued interest payable |
35 | (2 | ) | (295 | ) | |||||||
| Earnings on bank-owned life insurance |
(935 | ) | (923 | ) | (949 | ) | ||||||
| Deferred federal income taxes |
784 | 1,386 | 1,188 | |||||||||
| Decrease in prepaid FDIC insurance premiums |
— | — | 1,934 | |||||||||
| Increase (decrease) in accrued pension liability |
206 | (344 | ) | 4,587 | ||||||||
| Gain on foreclosed real estate |
(167 | ) | (466 | ) | (468 | ) | ||||||
| Amortization of intangible assets |
637 | 959 | 991 | |||||||||
| Gain on acquisition |
— | (241 | ) | — | ||||||||
| Other, net |
3,314 | 1,047 | (812 | ) | ||||||||
|
|
|
|
|
|
|
|||||||
| Net cash provided by operating activities |
19,336 | 14,468 | 23,194 | |||||||||
|
|
|
|
|
|
|
|||||||
| INVESTING ACTIVITIES |
||||||||||||
| Purchase of certificates of deposit |
(250 | ) | — | (501 | ) | |||||||
| Certificate of deposit maturities |
267 | — | — | |||||||||
| Investment securities available for sale: |
||||||||||||
| Proceeds from sale of investment securities |
20,953 | 25,354 | 39,212 | |||||||||
| Proceeds from principal repayments and maturities |
60,241 | 40,948 | 95,919 | |||||||||
| Purchases |
(74,531 | ) | (77,836 | ) | (131,264 | ) | ||||||
| Decrease (increase) in loans receivable, net |
(49,790 | ) | 18,201 | 16,719 | ||||||||
| Redemption of regulatory stock |
16,352 | 3,246 | 13,795 | |||||||||
| Purchase of regulatory stock |
(15,899 | ) | (6,546 | ) | (1,296 | ) | ||||||
| Investment in limited partnership |
— | (98 | ) | (327 | ) | |||||||
| Proceeds from sale of foreclosed real estate |
3,254 | 3,028 | 3,150 | |||||||||
| Capital improvements to foreclosed real estate |
(85 | ) | (151 | ) | (96 | ) | ||||||
| Investment in insurance brokerage subsidiary |
— | — | (276 | ) | ||||||||
| Acquisition, net of cash acquired |
— | (15,174 | ) | — | ||||||||
| Purchase of premises, equipment, and software |
(878 | ) | (677 | ) | (806 | ) | ||||||
|
|
|
|
|
|
|
|||||||
| Net cash (used for) provided by investing activities |
(40,366 | ) | (9,705 | ) | 34,229 | |||||||
|
|
|
|
|
|
|
|||||||
| FINANCING ACTIVITIES |
||||||||||||
| (Decrease) increase in deposits, net |
(37,135 | ) | (78,108 | ) | 51,422 | |||||||
| Net increase (decrease) in short-term borrowings |
(16,681 | ) | 85,020 | (20,281 | ) | |||||||
| Proceeds from other borrowings |
91,101 | 55,750 | 27,800 | |||||||||
| Repayment of other borrowings |
(13,300 | ) | (63,887 | ) | (90,000 | ) | ||||||
| Increase (decrease) in advances by borrowers for taxes and insurance |
180 | (869 | ) | 1,530 | ||||||||
| Purchase of treasury stock shares |
(3,132 | ) | (4,216 | ) | (14,501 | ) | ||||||
| Dividends on common stock |
(3,546 | ) | (2,800 | ) | (2,295 | ) | ||||||
|
|
|
|
|
|
|
|||||||
| Net cash provided by (used for) financing activities |
17,487 | (9,110 | ) | (46,325 | ) | |||||||
|
|
|
|
|
|
|
|||||||
| Increase (decrease) in cash and cash equivalents |
(3,543 | ) | (4,347 | ) | 11,098 | |||||||
| CASH AND CASH EQUIVALENTS AT BEGINNING OF YEAR |
22,301 | 26,648 | 15,550 | |||||||||
|
|
|
|
|
|
|
|||||||
| CASH AND CASH EQUIVALENTS AT END OF YEAR |
$ | 18,758 | $ | 22,301 | $ | 26,648 | ||||||
|
|
|
|
|
|
|
|||||||
See accompanying notes to the consolidated financial statements.
F-9
Table of Contents
ESSA BANCORP, INC. AND SUBSIDIARY
CONSOLIDATED STATEMENT OF CASH FLOWS (Continued)
| SUPPLEMENTAL CASH FLOW DISCLOSURES |
||||||||||||
| Cash paid: |
||||||||||||
| Interest |
$ | 10,355 | $ | 10,629 | $ | 11,552 | ||||||
| Income taxes |
375 | — | 662 | |||||||||
| Noncash items: |
||||||||||||
| Transfers from loans to foreclosed real estate |
2,723 | 2,623 | 1,699 | |||||||||
| Acquisitions: |
||||||||||||
| Cash paid, net |
— | 11,058 | — | |||||||||
| Noncash assets acquired: |
||||||||||||
| Investments available for sale |
— | 55,901 | — | |||||||||
| Loans receivable |
— | 153,218 | — | |||||||||
| Regulatory stock |
— | 1,569 | — | |||||||||
| Premises and equipment |
— | 1,802 | — | |||||||||
| Foreclosed real estate |
— | 436 | — | |||||||||
| Accrued interest receivable |
— | 3 | — | |||||||||
| Intangible assets |
— | 889 | — | |||||||||
| Goodwill |
— | 1,442 | — | |||||||||
| Deferred tax assets |
— | 1,031 | — | |||||||||
| Other assets |
— | 2,504 | — | |||||||||
|
|
|
|
|
|
|
|||||||
| — | 218,795 | — | ||||||||||
| Liabilities assumed: |
||||||||||||
| Certificates of deposit |
— | 93,938 | — | |||||||||
| Deposits other than certificates of deposit |
— | 77,000 | — | |||||||||
| Borrowings |
— | 30,177 | — | |||||||||
| Other liabilities |
— | 2,265 | — | |||||||||
|
|
|
|
|
|
|
|||||||
| — | 203,380 | — | ||||||||||
| Net noncash assets acquired |
$ | — | $ | 15,415 | $ | — | ||||||
|
|
|
|
|
|
|
|||||||
See accompanying notes to the consolidated financial statements.
F-10
Table of Contents
ESSA BANCORP, INC. AND SUBSIDIARY
NOTES TO THE CONSOLIDATED FINANCIAL STATEMENTS
| 1. | SUMMARY OF SIGNIFICANT ACCOUNTING POLICIES |
A summary of significant accounting and reporting policies applied in the presentation of the accompanying financial statements follows:
Nature of Operations and Basis of Presentation
The consolidated financial statements include the accounts of ESSA Bancorp, Inc. (the “Company”), its wholly owned subsidiary, ESSA Bank & Trust (the “Bank”), and the Bank’s wholly owned subsidiaries, ESSACOR Inc.; Pocono Investments Company; ESSA Advisory Services, LLC; Integrated Financial Corporation; and Integrated Abstract Incorporated, a wholly owned subsidiary of Integrated Financial Corporation. The primary purpose of the Company is to act as a holding company for the Bank. On November 6, 2014, the Company converted its status from a savings and loan holding company to a bank holding company. Earlier in the year, the Bank converted from a Pennsylvania-chartered savings association to a Pennsylvania-chartered savings bank. The Bank’s primary business consists of the taking of deposits and granting of loans to customers generally in Monroe, Northampton, Lehigh, Lackawanna, and Luzerne counties, Pennsylvania. The Bank is subject to regulation and supervision by the Pennsylvania Department of Banking and Securities and the Federal Deposit Insurance Corporation. The investment in subsidiary on the parent company’s financial statements is carried at the parent company’s equity in the underlying net assets.
ESSACOR, Inc. is a Pennsylvania corporation that has been used to purchase properties at tax sales that represent collateral for delinquent loans of the Bank. Pocono Investment Company is a Delaware corporation formed as an investment company subsidiary to hold and manage certain investments, including certain intellectual property. ESSA Advisory Services, LLC is a Pennsylvania limited liability company owned 100 percent by ESSA Bank & Trust. ESSA Advisory Services, LLC is a full-service insurance benefits consulting company offering group services such as health insurance, life insurance, short-term and long-term disability, dental, vision, and 401(k) retirement planning as well as individual health products. Integrated Financial Corporation is a Pennsylvania Corporation that provided investment advisory services to the general public and is currently inactive. Integrated Abstract Incorporated is a Pennsylvania Corporation that provided title insurance services and is currently inactive. All significant intercompany accounts and transactions have been eliminated in consolidation.
Use of Estimates in the Preparation of Financial Statements
The accounting principles followed by the Company and its subsidiary and the methods of applying these principles conform to U.S. generally accepted accounting principles and to general practice within the banking industry. In preparing the consolidated financial statements, the Company is required to make estimates and assumptions that affect the reported amounts of assets and liabilities as of the Consolidated Balance Sheet date and related revenues and expenses for the period. Actual results could differ significantly from those estimates.
Securities
The Company determines the appropriate classification of debt securities at the time of purchase and reevaluates such designation as of each balance sheet date.
F-11
Table of Contents
| 1. | SUMMARY OF SIGNIFICANT ACCOUNTING POLICIES (Continued) |
Securities (Continued)
Securities classified as available for sale are those securities that the Company intends to hold for an indefinite period of time but not necessarily to maturity. Any decision to sell a security classified as available for sale would be based on various factors, including significant movement in interest rates, changes in maturity mix of the Company’s assets and liabilities, liquidity needs, regulatory capital considerations, and other similar factors.
Securities available for sale are carried at fair value. Unrealized gains and losses are reported in other comprehensive income, net of the related deferred tax effects. Realized gains or losses, determined on the basis of the cost of the specific securities sold, are included in earnings. Premiums and discounts are recognized in interest income using the interest method over the period to maturity.
Declines in the fair value of available-for-sale securities below their cost that are deemed to be other than temporary are reflected in earnings as realized losses. In estimating other-than-temporary impairment losses, the Company considers: (1) the length of time and the extent to which the fair value has been less than cost; (2) the financial condition and near-term prospects of the issuer; and (3) the Company’s intent to sell the security or whether it’s more likely than not that the Company would be required to sell the security before its anticipated recovery in market value.
Loans Receivable
Loans receivable that the Company has the intent and ability to hold for the foreseeable future or until maturity or payoff are stated at their outstanding unpaid principal balances, net of an allowance for loan losses and any deferred fees and costs. Interest income is accrued on the unpaid principal balance. Loan origination fees, net of certain direct origination costs, are deferred and recognized as an adjustment of the yield (interest income) of the related loans. The Company is generally amortizing these amounts over the contractual life of the loan.
The accrual of interest is generally discontinued when the contractual payment of principal or interest has become 90 days past due or the Company has serious doubts about further collectability of principal or interest, even though the loan is currently performing. A loan may remain on accrual status if it is in the process of collection and is either guaranteed or well secured. When a loan is placed on nonaccrual status, unpaid interest credited to income is reversed. Interest received on nonaccrual loans generally is either applied against principal or reported as interest income, according to the Company’s judgment as to the collectability of principal. Generally, loans are restored to accrual status when the obligation is brought current and has performed in accordance with the contractual terms for a reasonable period of time and the ultimate collectability of the total contractual principal and interest is no longer in doubt.
Loans Acquired
Loans acquired including loans that have evidence of deterioration of credit quality since origination and for which it is probable, at acquisition, that the Company will be unable to collect all contractually required payments receivable, are initially recorded at fair value (as determined by the present value of expected future cash flows)
F-12
Table of Contents
| 1. | SUMMARY OF SIGNIFICANT ACCOUNTING POLICIES (Continued) |
Loans Acquired (Continued)
with no valuation allowance. Loans are evaluated individually to determine if there is evidence of deterioration of credit quality since origination. The difference between the undiscounted cash flows expected at acquisition and the investment in the loan, or the “accretable yield,” is recognized as interest income on a level-yield method over the life of the loan. Contractually required payments for interest and principal that exceed the undiscounted cash flows expected at acquisition, or the “non-accretable difference,” are not recognized as a yield adjustment or as a loss accrual or a valuation allowance. Increases in expected cash flows subsequent to the initial investment are recognized prospectively through adjustment of the yield on the loan over its remaining estimated life. Decreases in expected cash flows are recognized immediately as impairment. Any valuation allowances on these impaired loans reflect only losses incurred after acquisition.
For purchased loans acquired that are not deemed impaired at acquisition, credit discounts representing the principal losses expected over the life of the loan are a component of the initial fair value. Loans are aggregated and accounted for as a pool of loans if the loans being aggregated have common risk characteristics. Subsequent to the purchase date, the methods utilized to estimate the required allowance for credit losses for these loans is similar to originated loans; however, the Company records a provision for loan losses only when the required allowance exceeds any remaining credit discounts. The remaining differences between the purchase price and the unpaid principal balance at the date of acquisition are recorded in interest income over the life of the loans.
Allowance for Loan Losses
The allowance for loan losses is established through provisions for loan losses charged against income. Loans deemed to be uncollectible are charged against the allowance for loan losses, and subsequent recoveries, if any, are credited to the allowance.
The allowance for loan losses is maintained at a level by management which represents the evaluation of known and inherent risks in the loan portfolio at the consolidated balance sheet date. Management’s periodic evaluation of the adequacy of the allowance is based on the Company’s past loan loss experience, known and inherent risks in the portfolio, adverse situations that may affect the borrower’s ability to repay, the estimated value of any underlying collateral, composition of the loan portfolio, current economic conditions, and other relevant factors. This evaluation is inherently subjective, since it requires material estimates that may be susceptible to significant change, including the amounts and timing of future cash flows expected to be received on impaired loans.
The allowance consists of specific and general components. The specific component relates to loans that are classified as impaired. For such loans an allowance is established when the discounted cash flows (or collateral value or observable market price) of the impaired loan is lower than the carrying value of that loan. The general component covers nonclassified loans and is based on historical loss experience adjusted for qualitative factors.
All loans are considered impaired when, based on current information and events, it is probable that the Company will be unable to collect the scheduled payments of principal or interest when due according to the contractual terms of the loan agreement and all loan types are considered impaired if the loan is restructured in a troubled debt restructuring. Factors considered by management in determining impairment include payment status, collateral value, and the probability of collecting scheduled principal and interest payments when due. Loans that experience insignificant payment delays and payment shortfalls generally are not classified as impaired. Management
F-13
Table of Contents
| 1. | SUMMARY OF SIGNIFICANT ACCOUNTING POLICIES (Continued) |
Allowance for Loan Losses (Continued)
determines the significance of payment delays and payment shortfalls on a case-by-case basis, taking into consideration all of the circumstances surrounding the loan and the borrower, including the length of the delay, the reasons for the delay, the borrower’s prior payment record, and the amount of the shortfall in relation to the principal and interest owed. Impairment is measured on a loan-by-loan basis for commercial and construction loans by the present value of expected future cash flows discounted at the loan’s effective interest rate, the loan’s obtainable market price, or the fair value of the collateral if the loan is collateral-dependent.
Large groups of smaller-balance homogeneous loans are collectively evaluated for impairment. Accordingly, the Company does not separately identify individual consumer and residential mortgage loans for impairment disclosures unless such loans are part of a larger relationship that is impaired or classified as a troubled debt restructuring or is more than 180 days past due.
A loan is considered to be a troubled debt restructuring (“TDR”) loan when the Company grants a concession to the borrower because of the borrower’s financial condition that it would not otherwise consider. Such concessions include the reduction of interest rates, forgiveness of principal or interest, or other modifications of interest rates that are less than the current market rate for new obligations with similar risk. TDR loans that are in compliance with their modified terms and that yield a market rate may be removed from the TDR status after one year of performance.
Regulatory Stock
Regulatory stock consists of Federal Home Loan Bank (“FHLB”) of Pittsburgh stock and Atlantic Central Bankers Bank stock. Regulatory stocks are carried at cost. The Company is a member of the Federal Home Loan Bank System and holds stock in the Federal Home Loan Bank of Pittsburgh. As a member, the Company maintains an investment in the capital stock of the FHLB of Pittsburgh in an amount not less than 10 basis points of the outstanding member asset value plus 4.0 percent of its outstanding FHLB borrowings, as calculated throughout the year. The equity security is accounted for at cost and classified separately on the Consolidated Balance Sheet. The stock is bought from and sold to the FHLB based upon its $100 par value. The stock does not have a readily determinable fair value and as such is classified as restricted stock, carried at cost and evaluated by management. The stock’s value is determined by the ultimate recoverability of the par value rather than by recognizing temporary declines. The determination of whether the par value will ultimately be recovered is influenced by criteria such as the following: (a) The significance of the decline in net assets of the FHLB as compared to the capital stock amount and the length of time this situation has persisted; (b) commitments by the FHLB to make payments required by law or regulation and the level of such payments in relation to the operating performance; (c) the impact of legislative and regulatory changes on the customer base of the FHLB; and (d) the liquidity position of the FHLB. With consideration given to these factors, management concluded that the stock was not impaired at September 30, 2015.
Loan Servicing
Servicing assets are recognized as separate assets when rights are acquired through purchase or through sale of financial assets. Capitalized servicing rights are reported in other assets and are amortized into noninterest income in proportion to, and over the period of, the estimated future net servicing income of the underlying financial assets. Servicing assets are evaluated for impairment based upon a third-party appraisal. Fair value is determined using prices for similar assets with similar characteristics, when available, or based upon discounted cash flows using market-based assumptions. Impairment is recognized through a valuation allowance to the extent that fair value is less than the capitalized amount. The Company’s loan servicing assets at September 30, 2015 and 2014, were not impaired. Total servicing assets included in other assets as of September 30, 2015 and 2014, were $412,000 and $688,000, respectively.
F-14
Table of Contents
| 1. | SUMMARY OF SIGNIFICANT ACCOUNTING POLICIES (Continued) |
Premises and Equipment
Land is carried at cost. Premises and equipment are stated at cost less accumulated depreciation. Depreciation is calculated using the straight-line method over the useful lives of the related assets, which range from 10 to 40 years for buildings, land improvements, and leasehold improvements and 3 to 7 years for furniture, fixtures, and equipment. Expenditures for maintenance and repairs are charged to operations as incurred. Costs of major additions and improvements are capitalized.
Bank-Owned Life Insurance (“BOLI”)
The Company owns insurance on the lives of a certain group of key employees. The policies were purchased to help offset the increase in the costs of various fringe benefit plans, including healthcare. The cash surrender value of these policies is included as an asset on the Consolidated Balance Sheet, and any increase in cash surrender value is recorded as noninterest income on the Consolidated Statement of Income. In the event of the death of an insured individual under these policies, the Company would receive a death benefit which would be recorded as noninterest income.
Foreclosed Real Estate
Real estate owned acquired in settlement of foreclosed loans is carried at fair value minus estimated costs to sell. At acquisition of real estate acquired in settlement of foreclosed loans, the excess of the remaining loan balance over the asset’s estimated fair value less cost to sell is charged off against the allowance for loan losses. Subsequent declines in the asset’s value are recognized as noninterest expense in the Consolidated Statement of Income. Operating expenses of such properties, net of related income, are expensed in the period incurred.
Goodwill and Intangible Assets
Goodwill is not amortized, but it is tested at least annually for impairment in the fourth quarter, or more frequently if indicators of impairment are present. If the estimated current fair value of a reporting unit exceeds its carrying value, no additional testing is required and an impairment loss is not recorded. The Company uses market capitalization and multiples of tangible book value methods to determine the estimated current fair value of its reporting unit. Based on this analysis, no impairment was recorded in 2015 or 2014.
The other intangible assets are assigned useful lives, which are amortized on an accelerated basis over their weighted-average lives. The Company periodically reviews intangible assets for impairment as events or changes in circumstances indicate that the carrying amount of such asset may not be recoverable. Based on these reviews, no impairment was recorded in 2015 and 2014.
The following tables provide information for the carrying amount of goodwill and intangible assets.
| Goodwill |
2015 | 2014 | ||||||
| Balance at beginning of year |
$ | 10,259 | $ | 8,817 | ||||
| Goodwill acquired |
— | 1,442 | ||||||
|
|
|
|
|
|||||
| Balance at end of year |
$ | 10,259 | $ | 10,259 | ||||
|
|
|
|
|
|||||
| Intangible assets |
2015 | 2014 | ||||||
| Balance at beginning of year |
$ | 2,396 | $ | 2,466 | ||||
| Intangible assets acquired |
— | 889 | ||||||
| Amortization |
(637 | ) | (959 | ) | ||||
|
|
|
|
|
|||||
| Balance at end of year |
$ | 1,759 | $ | 2,396 | ||||
|
|
|
|
|
|||||
F-15
Table of Contents
| 1. | SUMMARY OF SIGNIFICANT ACCOUNTING POLICIES (Continued) |
Goodwill and Intangible Assets (Continued)
Amortizable intangible assets were composed of the following:
| September 30, | ||||||||||||
| 2015 | 2014 | |||||||||||
| Gross Carrying Amount |
Accumulated Amortization |
|||||||||||
| (dollars in thousands) | ||||||||||||
| Customer data |
$ | 3,297 | $ | 1,628 | $ | 1,145 | ||||||
| Employment obligations |
1,620 | 1,530 | 1,376 | |||||||||
|
|
|
|
|
|
|
|||||||
| $ | 4,917 | $ | 3,158 | $ | 2,521 | |||||||
|
|
|
|
|
|
|
|||||||
| 2015 | 2014 | |||||||
| Aggregate amortization expense: |
||||||||
| As of the years ended September 30 |
$ | 637 | $ | 959 | ||||
Estimated future amortization expense:
| 2016 |
$ | 510,000 | ||
| 2017 |
369,000 | |||
| 2018 |
262,000 | |||
| 2019 |
146,000 | |||
| 2020 |
139,000 | |||
| 2021 |
136,000 | |||
| 2022 |
109,000 | |||
| 2023 |
58,000 | |||
| 2024 |
30,000 | |||
|
|
|
|||
| $ | 1,759,000 | |||
|
|
|
|||
Employee Benefit Plans
The Bank maintains a noncontributory, defined benefit pension plan for all employees who have met age and length of service requirements. The Bank also maintains a defined contribution Section 401(k) plan covering eligible employees. The Company created an ESOP for the benefit of employees who meet certain eligibility requirements. The Company makes cash contributions to the ESOP on an annual basis.
The Company maintains an equity incentive plan to provide for issuance or granting of shares of common stock for stock options or restricted stock. The Company has recorded stock-based employee compensation cost using the fair value method as allowed under generally accepted accounting principles. Management estimated the fair values of all option grants using the Black-Scholes option-pricing model. Management estimated the expected life of the options using the simplified method as allowed under generally accepted accounting principles. The risk-free rate was determined utilizing the treasury yield for the expected life of the option contract.
F-16
Table of Contents
| 1. | SUMMARY OF SIGNIFICANT ACCOUNTING POLICIES (Continued) |
Advertising Costs
In accordance with generally accepted accounting principles, the Company expenses all advertising expenditures incurred.
Transfers of Financial Assets
Transfers of financial assets are accounted for as sales when control over the assets has been surrendered. Control over transferred assets is deemed to be surrendered when (1) the assets have been isolated from the Company; (2) the transferee obtains the right (free of conditions that constrain it from taking advantage of that right) to pledge or exchange the transferred assets; and (3) the Company does not maintain effective control over the transferred assets through an agreement to repurchase them before their maturity.
Income Taxes
Deferred tax assets and liabilities are reflected based on the differences between the financial statement and the income tax basis of assets and liabilities using the enacted marginal tax rates. Deferred income tax expense and benefit are based on the changes in the deferred tax assets or liabilities from period to period. Deferred tax assets and liabilities are reflected at currently enacted income tax rates applicable to the period in which such items are expected to be realized or settled. As changes in tax rates are enacted, deferred tax assets and liabilities are adjusted through the provision for income taxes. The Company files a consolidated federal income tax return and individual state income tax returns.
The Company prescribes a recognition threshold and a measurement attribute for the financial statement recognition and measurement of a tax position taken or expected to be taken in a tax return. Benefits from tax positions should be recognized in the financial statements only when it is more likely than not that the tax position will be sustained upon examination by the appropriate taxing authority that would have full knowledge of all relevant information. A tax position that meets the more-likely-than-not recognition threshold is measured at the largest amount of benefit that is greater than 50 percent likely of being realized upon ultimate settlement. Tax positions that previously failed to meet the more-likely-than-not recognition threshold should be recognized in the first subsequent financial reporting period in which that threshold is met. Previously recognized tax positions that no longer meet the more-likely-than-not recognition threshold should be derecognized in the first subsequent financial reporting period in which that threshold is no longer met. Accounting literature also provides guidance on the accounting for and disclosure of unrecognized tax benefits, interest, and penalties. In accordance with generally accepted accounting principles, interest or penalties incurred for income taxes will be recorded as a component of other expenses.
Cash and Cash Equivalents
The Company has defined cash and cash equivalents as cash and due from banks and interest-bearing deposits with other institutions with original maturities of less than 90 days.
Earnings Per Share
The Company provides dual presentation of basic and diluted earnings per share. Basic earnings per share are calculated utilizing net income as reported as the numerator and average shares outstanding as the denominator. The computation of diluted earnings per share differs in that the dilutive effects of any options are adjusted for in the denominator.
F-17
Table of Contents
| 1. | SUMMARY OF SIGNIFICANT ACCOUNTING POLICIES (Continued) |
Comprehensive Income (Loss)
The Company is required to present comprehensive income (loss) and its components in a full set of general-purpose financial statements for all periods presented. Other comprehensive income (loss) is composed of net unrealized holding gains or losses on its available-for-sale investment and mortgage-backed securities portfolio, as well as changes in unrecognized pension cost.
The components of accumulated other comprehensive income (loss), net of tax, as of year-end were as follows:
| 2015 | 2014 | 2013 | ||||||||||
| Net unrealized gain on securities available for sale |
$ | 2,930 | $ | 649 | $ | 71 | ||||||
| Net unrecognized pension cost |
(5,325 | ) | (3,228 | ) | (1,306 | ) | ||||||
|
|
|
|
|
|
|
|||||||
| Total |
$ | (2,395 | ) | $ | (2,579 | ) | $ | (1,235 | ) | |||
|
|
|
|
|
|
|
|||||||
Fair Value Measurements
We group our assets at fair value in three levels, based on the markets in which the assets are traded and the reliability of the assumptions used to determine fair value. These levels are:
| • | Level I – Valuation is based upon quoted prices for identical instruments traded in active markets. |
| • | Level II – Valuation is based upon quoted prices for similar instruments in active markets, quoted prices for identical or similar instruments in markets that are not active, and model-based valuation techniques for which all significant assumptions are observable in the market. |
| • | Level III – Valuation is generated from model-based techniques that use significant assumptions not observable in the market. These unobservable assumptions reflect the Company’s own estimates of assumptions that market participants would use in pricing the asset. |
We base our fair values on the price that would be received to sell an asset or paid to transfer a liability in an orderly transaction between market participants at the measurement date. It is our policy to maximize the use of observable inputs and minimize the use of unobservable inputs when developing fair value measurements, in accordance with the fair value hierarchy in generally accepted accounting principles.
Fair value measurements for most of our assets are obtained from independent pricing services that we have engaged for this purpose. When available, we, or our independent pricing service, use quoted market prices to measure fair value. If market prices are not available, fair value measurement is based upon models that incorporate available trade, bid, and other market information. Subsequently, all of our financial instruments use either of the foregoing methodologies to determine fair value adjustments recorded to our financial statements. In certain cases, however, when market observable inputs for model-based valuation techniques may not be readily available, we are required to make judgments about assumptions market participants would use in estimating the fair value of financial instruments. The degree of management judgment involved in determining the fair value of a financial instrument is dependent upon the availability of quoted market prices or observable market parameters. For financial instruments that trade actively and have quoted market prices or observable market parameters, there is minimal subjectivity involved in measuring fair value. When observable market prices and parameters are not fully available, management judgment is necessary to estimate fair value. In addition, changes in the market conditions may reduce the availability of quoted prices or observable data. When market data is not available, we use valuation techniques requiring more management judgment to estimate the appropriate fair value measurement. Therefore, the results cannot be determined with precision and may not be realized in an actual sale or immediate settlement of the asset. Additionally, there may be inherent weaknesses in any calculation technique, and changes in the underlying assumptions used, including discount rates and estimates of future cash flows, that could significantly affect the results of current or future valuations.
F-18
Table of Contents
| 1. | SUMMARY OF SIGNIFICANT ACCOUNTING POLICIES (Continued) |
Reclassification of Comparative Amounts
Certain items previously reported have been reclassified to conform to the current year’s reporting format. Such reclassifications did not affect consolidated net income or consolidated stockholders’ equity.
Recent Accounting Pronouncements
In January 2014, the Financial Accounting Standards Board (“FASB”) issued Accounting Standards Update (“ASU”) 2014-01, Investments – Equity Method and Joint Ventures (Topic 323): Accounting for Investments in Qualified Affordable Housing Projects. The amendments in this Update permit reporting entities to make an accounting policy election to account for their investments in qualified affordable housing projects using the proportional amortization method if certain conditions are met. Under the proportional amortization method, an entity amortizes the initial cost of the investment in proportion to the tax credits and other tax benefits received and recognizes the net investment performance in the income statement as a component of income tax expense (benefit). The amendments in this Update should be applied retrospectively to all periods presented. A reporting entity that uses the effective yield method to account for its investments in qualified affordable housing projects before the date of adoption may continue to apply the effective yield method for those preexisting investments. The amendments in this Update are effective for public business entities for annual periods and interim reporting periods within those annual periods, beginning after December 15, 2014. Early adoption is permitted. This Update is not expected to have a significant impact on the Company’s financial statements.
In January 2014, the FASB issued ASU 2014-04, Receivables – Troubled Debt Restructurings by Creditors (Subtopic 310-40): Reclassification of Residential Real Estate Collateralized Consumer Mortgage Loans upon Foreclosure. The amendments in this Update clarify that an in substance repossession or foreclosure occurs, and a creditor is considered to have received physical possession of residential real estate property collateralizing a consumer mortgage loan, upon either (1) the creditor obtaining legal title to the residential real estate property upon completion of a foreclosure or (2) the borrower conveying all interest in the residential real estate property to the creditor to satisfy that loan through completion of a deed in lieu of foreclosure or through a similar legal agreement. Additionally, the amendments require interim and annual disclosure of both (1) the amount of foreclosed residential real estate property held by the creditor and (2) the recorded investment in consumer mortgage loans collateralized by residential real estate property that are in the process of foreclosure according to local requirements of the applicable jurisdiction. The amendments in this Update are effective for public business entities for annual periods, and interim periods within those annual periods, beginning after December 15, 2014. An entity can elect to adopt the amendments in this Update using either a modified retrospective transition method or a prospective transition method. This Update is not expected to have a significant impact on the Company’s financial statements.
In May 2014, the FASB issued ASU 2014-09, Revenue from Contracts with Customers (a new revenue recognition standard). The Update’s core principle is that a company will recognize revenue to depict the transfer of goods or services to customers in an amount that reflects the consideration to which the entity expects to be entitled in exchange for those goods or services. In addition, this update specifies the accounting for certain costs to obtain or fulfill a contract with a customer and expands disclosure requirements for revenue recognition. This Update is effective for annual reporting periods beginning after December 15, 2016, including interim periods within that reporting period. The Company is evaluating the effect of adopting this new accounting Update.
In June 2014, the FASB issued ASU 2014-11, Transfers and Servicing (Topic 860): Repurchase-to-Maturity Transactions, Repurchase Financings, and Disclosures. The amendments in this Update change the accounting for repurchase-to-maturity transactions to secured borrowing accounting. For repurchase financing arrangements, the amendments require separate accounting for a transfer of a financial asset executed contemporaneously with a repurchase agreement with the same counterparty, which will result in secured borrowing accounting for the repurchase agreement. The amendments also require enhanced disclosures. The accounting changes in this Update are effective for the first interim or annual period beginning after December 15, 2014. An entity is required to present changes in accounting for transactions outstanding on the effective date as a cumulative-effect adjustment to retained earnings as of the beginning of the period of adoption. Earlier application is prohibited. The disclosure for certain transactions accounted for as a sale is required to be presented for interim and annual periods beginning after December 15, 2014,
F-19
Table of Contents
| 1. | SUMMARY OF SIGNIFICANT ACCOUNTING POLICIES (Continued) |
Recent Accounting Pronouncements (Continued)
and the disclosure for repurchase agreements, securities lending transactions, and repurchase-to-maturity transactions accounted for as secured borrowings is required to be presented for annual periods beginning after December 15, 2014, and for interim periods beginning after March 15, 2015. The disclosures are not required to be presented for comparative periods before the effective date. This Update did not have a significant impact on the Company’s financial statements.
In June 2014, the FASB issued ASU 2014-12, Compensation-Stock Compensation (Topic 718): Accounting for Share-Based Payments when the Terms of an Award Provide that a Performance Target Could Be Achieved After the Requisite Service Period. The amendments require that a performance target that affects vesting and that could be achieved after the requisite service period be treated as a performance condition. The amendments in this Update are effective for annual periods and interim periods within those annual periods beginning after December 15, 2015. Earlier adoption is permitted. Entities may apply the amendments in this Update either (a) prospectively to all awards granted or modified after the effective date or (b) retrospectively to all awards with performance targets that are outstanding as of the beginning of the earliest annual period presented in the financial statements and to all new or modified awards thereafter. If retrospective transition is adopted, the cumulative effect of applying this Update as of the beginning of the earliest annual period presented in the financial statements should be recognized as an adjustment to the opening retained earnings balance at that date. Additionally, if retrospective transition is adopted, an entity may use hindsight in measuring and recognizing the compensation cost. This Update is not expected to have a significant impact on the Company’s financial statements.
In August 2014, the FASB issued ASU 2014-14, Receivables – Troubled Debt Restructurings by Creditors (Subtopic 310-40). The amendments in this Update require that a mortgage loan be derecognized and that a separate other receivable be recognized upon foreclosure if the following conditions are met: (1) the loan has a government guarantee that is not separable from the loan before foreclosure, (2) at the time of foreclosure, the creditor has the intent to convey the real estate property to the guarantor and make a claim on the guarantee, and the creditor has the ability to recover under that claim, and (3) at the time of foreclosure, any amount of the claim that is determined on the basis of the fair value of the real estate is fixed. Upon foreclosure, the separate other receivable should be measured based on the amount of the loan balance (principal and interest) expected to be recovered from the guarantor. The amendments in this Update are effective for public business entities for annual periods, and interim periods within those annual periods, beginning after December 15, 2014. This Update is not expected to have a significant impact on the Company’s financial statements
In August 2014, the FASB issued ASU 2014-15, Presentation of Financial Statements -Going Concern (Subtopic 205-40). The amendments in this Update provide guidance in accounting principles generally accepted in the United States of America about management’s responsibility to evaluate whether there is substantial doubt about an entity’s ability to continue as a going concern and to provide related footnote disclosures. The amendments in this Update are effective for the annual period ending after December 15, 2016, and for annual periods and interim periods thereafter. Early application is permitted. This Update is not expected to have a significant impact on the Company’s financial statements.
In November 2014, the FASB issued ASU 2014-16, Derivatives and Hedging (Topic 815): Determining Whether the Host Contract in a Hybrid Financial Instrument Issued in the Form of a Share Is More Akin to Debt or to Equity (a consensus of the FASB Emerging Issues Task Force). This ASU clarifies how current U.S. GAAP should be interpreted in subjectively evaluating the economic characteristics and risks of a host contract in a hybrid financial instrument that is issued in the form of a share. Public business entities are required to implement the new requirements in fiscal years and interim periods within those fiscal years beginning after December 15, 2015. This Update is not expected to have a significant impact on the Company’s financial statements.
In January 2015, the FASB issued ASU 2015-01, Income Statement –Extraordinary and Unusual Items, as part of its initiative to reduce complexity in accounting standards. This Update eliminates from GAAP the concept of extraordinary items. The amendments in this Update are effective for fiscal years, and interim periods within those fiscal years, beginning after December 15, 2015. A reporting entity may apply the amendments prospectively. A reporting entity also may apply the amendments retrospectively to all prior periods presented in the financial statements. Early adoption is permitted provided that the guidance is applied from the beginning of the fiscal year of adoption. This Update is not expected to have a significant impact on the Company’s financial statements.
F-20
Table of Contents
| 1. | SUMMARY OF SIGNIFICANT ACCOUNTING POLICIES (Continued) |
Recent Accounting Pronouncements (Continued)
In February 2015, the FASB issued ASU 2015-02, Consolidation (Topic 810). The amendments in this Update affect reporting entities that are required to evaluate whether they should consolidate certain legal entities. All legal entities are subject to reevaluation under the revised consolidation model. Specifically, the amendments (1) Modify the evaluation of whether limited partnerships and similar legal entities are variable interest entities (VIEs) or voting interest entities; (2) Eliminate the presumption that a general partner should consolidate a limited partnership; (3) Affect the consolidation analysis of reporting entities that are involved with VIEs, particularly those that have fee arrangements and related party relationships; (4) Provide a scope exception from consolidation guidance for reporting entities with interests in legal entities that are required to comply with or operate in accordance with requirements that are similar to those in Rule 2a-7 of the Investment Company Act of 1940 for registered money market funds. The amendments in this Update are effective for public business entities for fiscal years, and for interim periods within those fiscal years, beginning after December 15, 2015. For all other entities, the amendments in this Update are effective for fiscal years beginning after December 15, 2016, and for interim periods within fiscal years beginning after December 15, 2017. This Update is not expected to have a significant impact on the Company’s financial statements.
In April 2015, the FASB issued ASU 2015-03, Interest-Imputation of Interest (Subtopic 835-30), as part of its initiative to reduce complexity in accounting standards. To simplify presentation of debt issuance costs, the amendments in this Update require that debt issuance costs related to a recognized debt liability be presented in the balance sheet as a direct deduction from the carrying amount of that debt liability, consistent with debt discounts. The recognition and measurement guidance for debt issuance costs are not affected by the amendments in this Update. For public business entities, the amendments in this Update are effective for financial statements issued for fiscal years beginning after December 15, 2015, and interim periods within those fiscal years. For all other entities, the amendments in this Update are effective for financial statements issued for fiscal years beginning after December 15, 2015, and interim periods within fiscal years beginning after December 15, 2016. An entity should apply the new guidance on a retrospective basis, wherein the balance sheet of each individual period presented should be adjusted to reflect the period-specific effects of applying the new guidance. This Update is not expected to have a significant impact on the Company’s financial statements.
In April 2015, the FASB issued ASU 2015-04, Compensation-Retirement Benefits (Topic 715), as part of its initiative to reduce complexity in accounting standards. For an entity with a fiscal year-end that does not coincide with a month-end, the amendments in this Update provide a practical expedient that permits the entity to measure defined benefit plan assets and obligations using the month-end that is closest to the entity’s fiscal year-end and apply that practical expedient consistently from year to year. The practical expedient should be applied consistently to all plans if an entity has more than one plan. The amendments in this Update are effective for public business entities for financial statements issued for fiscal years beginning after December 15, 2015, and interim periods within those fiscal years. For all other entities, the amendments in this Update are effective for financial statements issued for fiscal years beginning after December 15, 2016, and interim periods within fiscal years beginning after December 15, 2017. Earlier application is permitted. This Update is not expected to have a significant impact on the Company’s financial statements.
In April 2015, the FASB issued ASU 2015-05, Intangible – Goodwill and Other Internal Use Software (Topic 350-40), as part of its initiative to reduce complexity in accounting standards. This guidance will help entities evaluate the accounting for fees paid by a customer in a cloud computing arrangement. The amendments in this Update provide guidance to customers about whether a cloud computing arrangement includes a software license. If a cloud computing arrangement includes a software license, then the customer should account for the software license element of the arrangement consistent with the acquisition of other software licenses. If a cloud computing arrangement does not include a software license, the customer should account for the arrangement as a service contract. For public business entities, the Board decided that the amendments will be effective for annual periods, including interim periods within those annual periods, beginning after December 15, 2015. For all other entities, the amendments will be effective for annual periods beginning after December 15, 2015, and interim periods in annual periods beginning after December 15, 2016. Early adoption is permitted for all entities. This Update is not expected to have a significant impact on the Company’s financial statements.
F-21
Table of Contents
| 1. | SUMMARY OF SIGNIFICANT ACCOUNTING POLICIES (Continued) |
Recent Accounting Pronouncements (Continued)
In May 2015, the FASB issued ASU 2015-08, Business Combinations - Pushdown Accounting - Amendment to SEC Paragraphs Pursuant to Staff Accounting Bulletin No. 115. This ASU was issued to amend various SEC paragraphs pursuant to the issuance of Staff Accounting Bulletin No. 115. This Update did not have a significant impact on the Company’s financial statements.
In May 2015, the FASB issued ASU 2015-09, Financial Services-Insurance (Topic 944) - Disclosure about Short-Duration Contracts. The amendments apply to all insurance entities that issue short-duration contracts as defined in Topic 944, Financial Services-Insurance. The amendments require insurance entities to disclose for annual reporting periods certain information about the liability for unpaid claims and claim adjustment expenses. The amendments also require insurance entities to disclose information about significant changes in methodologies and assumptions used to calculate the liability for unpaid claims and claim adjustment expenses, including reasons for the change and the effects on the financial statements. Additionally, the amendments require insurance entities to disclose for annual and interim reporting periods a rollforward of the liability for unpaid claims and claim adjustment expenses, described in Topic 944. For health insurance claims, the amendments require the disclosure of the total of incurred-but-not-reported liabilities plus expected development on reported claims included in the liability for unpaid claims and claim adjustment expenses. For public business entities, the amendments in this Update are effective for annual periods beginning after December 15, 2015, and interim periods within annual periods beginning after December 15, 2016. For all other entities, the amendments in this Update are effective for annual periods beginning after December 15, 2016, and interim periods within annual periods beginning after December 15, 2017. This Update is not expected to have a significant impact on the Company’s financial statements.
In June 2015, the FASB issued ASU 2015-10, Technical Corrections and Improvements. The amendments in this Update represent changes to clarify the Codification, correct unintended application of guidance, or make minor improvements to the Codification that are not expected to have a significant effect on current accounting practice or create a significant administrative cost to most entities. Transition guidance varies based on the amendments in this Update. The amendments in this Update that require transition guidance are effective for all entities for fiscal years, and interim periods within those fiscal years, beginning after December 15, 2015. Early adoption is permitted, including adoption in an interim period. All other amendments will be effective upon the issuance of this Update. This Update is not expected to have a significant impact on the Company’s financial statements.
In August 2015, the FASB issued ASU 2015-14, Revenue from Contracts with Customers (Topic 606). The amendments in this Update defer the effective date of ASU 2014-09 for all entities by one year. Public business entities, certain not-for-profit entities, and certain employee benefit plans should apply the guidance in ASU 2014-09 to annual reporting periods beginning after December 15, 2017, including interim reporting periods within that reporting period. All other entities should apply the guidance in ASU 2014-09 to annual reporting periods beginning after December 15, 2018, and interim reporting periods within annual reporting periods beginning after December 15, 2019. The Company is evaluating the effect of adopting this new accounting Update.
In August 2015, the FASB issued ASU 2015-15, Interest – Imputation of Interest (Subtopic 835-30): Presentation And Subsequent Measurement of Debt Issuance Costs Associated with Line-of-Credit Arrangements - Amendments to SEC Paragraphs Pursuant to Staff Announcement at June 18, 2015 EITF Meeting. This Update adds SEC paragraphs pursuant to the SEC Staff Announcement at the June 18, 2015 Emerging Issues Task Force meeting about the presentation and subsequent measurement of debt issuance costs associated with line-of-credit arrangements. This Update is not expected to have a significant impact on the Company’s financial statements.
F-22
Table of Contents
| 1. | SUMMARY OF SIGNIFICANT ACCOUNTING POLICIES (Continued) |
Recent Accounting Pronouncements (Continued)
In September 2015, the FASB issued ASU 2015-16, Business Combinations (Topic 805). The amendments in this Update require that an acquirer recognizes adjustments to provisional amounts that are identified during the measurement period in the reporting period in which the adjustment amounts are determined. The amendments in this Update require that the acquirer record, in the same period’s financial statements, the effect on earnings of changes in depreciation, amortization, or other income effects, if any, as a result of the change to the provisional amounts, calculated as if the accounting had been completed at the acquisition date. The amendments in this Update require an entity to present separately on the face of the income statement or disclose in the notes the portion of the amount recorded in current-period earnings by line item that would have been recorded in previous reporting periods if the adjustment to the provisional amounts had been recognized as of the acquisition date. For public business entities, the amendments in this Update are effective for fiscal years beginning after December 15, 2015, including interim periods within those fiscal years. For all other entities, the amendments in this Update are effective for fiscal years beginning after December 15, 2016, and interim periods within fiscal years beginning after December 15, 2017. This Update is not expected to have a significant impact on the Company’s financial statements.
| 2. | EARNINGS PER SHARE |
The following table sets forth the composition of the weighted-average common shares (denominator) used in the basic and diluted earnings per share computation for the years ended September 30, 2015, 2014, and 2013.
| 2015 | 2014 | 2013 | ||||||||||
| Weighted-average common shares outstanding |
18,133,095 | 18,133,095 | 18,133,095 | |||||||||
| Average treasury stock shares |
(6,682,911 | ) | (6,284,870 | ) | (5,475,194 | ) | ||||||
| Average unearned ESOP shares |
(973,168 | ) | (1,018,444 | ) | (1,063,720 | ) | ||||||
| Average unearned nonvested shares |
(22,560 | ) | (12,351 | ) | (34,627 | ) | ||||||
|
|
|
|
|
|
|
|||||||
| Weighted-average common shares and common stock equivalents used to calculate basic earnings per share |
10,454,456 | 10,817,430 | 11,559,554 | |||||||||
| Additional common stock equivalents (nonvested stock) used to calculate diluted earnings per share |
9,787 | 3,485 | — | |||||||||
| Additional common stock equivalents (stock options) used to calculate diluted earnings per share |
78,887 | — | — | |||||||||
|
|
|
|
|
|
|
|||||||
| Weighted-average common shares and common stock equivalents used to calculate diluted earnings per share |
10,543,130 | 10,820,915 | 11,559,554 | |||||||||
|
|
|
|
|
|
|
|||||||
At September 30, 2015, there were 12,230 shares of nonvested stock outstanding at a price of $11.07 per share that were not included in the computation of diluted earnings per share because to do so would have been anti-dilutive. At September 30, 2014, there were 966 shares of nonvested stock outstanding at a price of $10.94 per share and options to purchase 1,443,379 shares of common stock outstanding at a price of $12.35 per share that were not included in the computation of diluted earnings per share because to do so would have been anti-dilutive. At September 30, 2013, there were 19,998 shares of nonvested stock outstanding at a price of $10.94 per share and options to purchase 1,443,379 shares of common stock outstanding at a price of $12.35 per share that were not included in the computation of diluted earnings per share because to do so would have been anti-dilutive.
F-23
Table of Contents
| 3. | INVESTMENT SECURITIES |
The amortized cost and fair value of investment securities available for sale are summarized as follows (in thousands):
| 2015 | ||||||||||||||||
| Amortized Cost |
Gross Unrealized Gains |
Gross Unrealized Losses |
Fair Value |
|||||||||||||
| Available for sale |
||||||||||||||||
| Fannie Mae |
$ | 130,476 | $ | 2,052 | $ | (541 | ) | $ | 131,987 | |||||||
| Freddie Mac |
88,514 | 1,063 | (286 | ) | 89,291 | |||||||||||
| Governmental National Mortgage Association securities |
13,201 | 103 | (52 | ) | 13,252 | |||||||||||
| Other mortgage-backed securities |
2,494 | — | (17 | ) | 2,477 | |||||||||||
|
|
|
|
|
|
|
|
|
|||||||||
| Total mortgage-backed securities |
234,685 | 3,218 | (896 | ) | 237,007 | |||||||||||
| Obligations of states and political subdivisions |
50,094 | 1,676 | (145 | ) | 51,625 | |||||||||||
| U.S. government agency securities |
45,799 | 399 | (12 | ) | 46,186 | |||||||||||
| Corporate obligations |
22,440 | 157 | (237 | ) | 22,360 | |||||||||||
| Trust-preferred securities |
1,613 | 98 | — | 1,711 | ||||||||||||
| Other debt securities |
20,313 | 216 | (36 | ) | 20,493 | |||||||||||
|
|
|
|
|
|
|
|
|
|||||||||
| Total debt securities |
374,944 | 5,764 | (1,326 | ) | 379,382 | |||||||||||
| Equity securities - financial services |
25 | — | — | 25 | ||||||||||||
|
|
|
|
|
|
|
|
|
|||||||||
| Total |
$ | 374,969 | $ | 5,764 | $ | (1,326 | ) | $ | 379,407 | |||||||
|
|
|
|
|
|
|
|
|
|||||||||
| 2014 | ||||||||||||||||
| Amortized Cost |
Gross Unrealized Gains |
Gross Unrealized Losses |
Fair Value |
|||||||||||||
| Available for sale |
||||||||||||||||
| Fannie Mae |
$ | 144,291 | $ | 1,327 | $ | (1,550 | ) | $ | 144,068 | |||||||
| Freddie Mac |
99,556 | 548 | (1,277 | ) | 98,827 | |||||||||||
| Governmental National Mortgage Association securities |
19,446 | 92 | (161 | ) | 19,377 | |||||||||||
| Other mortgage-backed securities |
2,795 | — | (15 | ) | 2,780 | |||||||||||
|
|
|
|
|
|
|
|
|
|||||||||
| Total mortgage-backed securities |
266,088 | 1,967 | (3,003 | ) | 265,052 | |||||||||||
| Obligations of states and political subdivisions |
41,375 | 1,654 | (258 | ) | 42,771 | |||||||||||
| U.S. government agency securities |
47,821 | 192 | (383 | ) | 47,630 | |||||||||||
| Corporate obligations |
13,140 | 236 | (48 | ) | 13,328 | |||||||||||
| Trust-preferred securities |
5,027 | 594 | — | 5,621 | ||||||||||||
| Other debt securities |
6,618 | 51 | (18 | ) | 6,651 | |||||||||||
|
|
|
|
|
|
|
|
|
|||||||||
| Total debt securities |
380,069 | 4,694 | (3,710 | ) | 381,053 | |||||||||||
| Equity securities - financial services |
2,025 | — | — | 2,025 | ||||||||||||
|
|
|
|
|
|
|
|
|
|||||||||
| Total |
$ | 382,094 | $ | 4,694 | $ | (3,710 | ) | $ | 383,078 | |||||||
|
|
|
|
|
|
|
|
|
|||||||||
F-24
Table of Contents
| 3. | INVESTMENT SECURITIES (Continued) |
The amortized cost and fair value of debt securities at September 30, 2015, by contractual maturity, are shown below. Expected maturities will differ from contractual maturities because borrowers may have the right to call or prepay obligations with or without call or prepayment penalties (in thousands):
| Available for Sale | ||||||||
| Amortized Cost |
Fair Value |
|||||||
| Due in one year or less |
$ | 6,504 | $ | 6,519 | ||||
| Due after one year through five years |
53,267 | 53,908 | ||||||
| Due after five years through ten years |
61,402 | 62,288 | ||||||
| Due after ten years |
253,771 | 256,667 | ||||||
|
|
|
|
|
|||||
| Total |
$ | 374,944 | $ | 379,382 | ||||
|
|
|
|
|
|||||
For the years ended September 30, 2015, 2014, and 2013, the Company realized gross gains of $796,000, $457,000, and $766,000, and gross losses of $10,000, $124,000, and $17,000, respectively, and proceeds from the sale of investment securities of $20,953,000, $25,354,000, and $39,212,000, respectively.
Investment securities with carrying values of $93,446,000 and $136,053,000 at September 30, 2015 and 2014, respectively, were pledged to secure public deposits and other purposes as required by law.
| 4. | UNREALIZED LOSSES ON SECURITIES |
The following table shows the Company’s gross unrealized losses and fair value, aggregated by investment category and length of time that the individual securities have been in a continuous unrealized loss position (in thousands):
| 2015 | ||||||||||||||||||||||||||||
| Less than Twelve Months | Twelve Months or Greater | Total | ||||||||||||||||||||||||||
| Number of Securities |
Fair Value |
Gross Unrealized Losses |
Fair Value |
Gross Unrealized Losses |
Fair Value |
Gross Unrealized Losses |
||||||||||||||||||||||
| Fannie Mae |
22 | $ | 7,238 | $ | (28 | ) | $ | 23,609 | $ | (513 | ) | $ | 30,847 | $ | (541 | ) | ||||||||||||
| Freddie Mac |
12 | 1,487 | (1 | ) | 15,477 | (285 | ) | 16,964 | (286 | ) | ||||||||||||||||||
| Governmental National Mortgage Association securities |
2 | — | — | 2,209 | (52 | ) | 2,209 | (52 | ) | |||||||||||||||||||
| Other mortgage-backed securities |
3 | — | — | 2,477 | (17 | ) | 2,477 | (17 | ) | |||||||||||||||||||
| Obligations of states and political subdivisions |
14 | 9,184 | (57 | ) | 4,667 | (88 | ) | 13,851 | (145 | ) | ||||||||||||||||||
| U.S. government agency securities |
3 | 3,246 | (12 | ) | — | — | 3,246 | (12 | ) | |||||||||||||||||||
| Corporate obligations |
10 | 9,263 | (207 | ) | 970 | (30 | ) | 10,233 | (237 | ) | ||||||||||||||||||
| Other debt securities |
6 | 5,232 | (26 | ) | 1,748 | (10 | ) | 6,980 | (36 | ) | ||||||||||||||||||
|
|
|
|
|
|
|
|
|
|
|
|
|
|
|
|||||||||||||||
| Total |
72 | $ | 35,650 | $ | (331 | ) | $ | 51,157 | $ | (995 | ) | $ | 86,807 | $ | (1,326 | ) | ||||||||||||
|
|
|
|
|
|
|
|
|
|
|
|
|
|
|
|||||||||||||||
F-25
Table of Contents
| 4. | UNREALIZED LOSSES ON SECURITIES (Continued) |
| 2014 | ||||||||||||||||||||||||||||
| Less than Twelve Months | Twelve Months or Greater | Total | ||||||||||||||||||||||||||
| Number of Securities |
Fair Value |
Gross Unrealized Losses |
Fair Value |
Gross Unrealized Losses |
Fair Value |
Gross Unrealized Losses |
||||||||||||||||||||||
| Fannie Mae |
39 | $ | 34,377 | $ | (164 | ) | $ | 33,249 | $ | (1,386 | ) | $ | 67,626 | $ | (1,550 | ) | ||||||||||||
| Freddie Mac |
36 | 38,210 | (216 | ) | 29,269 | (1,061 | ) | 67,479 | (1,277 | ) | ||||||||||||||||||
| Governmental National Mortgage Association securities |
5 | 4,127 | (22 | ) | 2,981 | (139 | ) | 7,108 | (161 | ) | ||||||||||||||||||
| Other mortgage-backed securities |
3 | — | — | 2,780 | (15 | ) | 2,780 | (15 | ) | |||||||||||||||||||
| Obligations of states and political subdivisions |
5 | — | — | 7,207 | (258 | ) | 7,207 | (258 | ) | |||||||||||||||||||
| U.S. government agency securities |
11 | 8,004 | (25 | ) | 18,629 | (358 | ) | 26,633 | (383 | ) | ||||||||||||||||||
| Corporate obligations |
5 | 3,142 | (32 | ) | 1,130 | (16 | ) | 4,272 | (48 | ) | ||||||||||||||||||
| Other debt securities |
2 | 1,980 | (18 | ) | — | — | 1,980 | (18 | ) | |||||||||||||||||||
|
|
|
|
|
|
|
|
|
|
|
|
|
|
|
|||||||||||||||
| Total |
106 | $ | 89,840 | $ | (477 | ) | $ | 95,245 | $ | (3,233 | ) | $ | 185,085 | $ | (3,710 | ) | ||||||||||||
|
|
|
|
|
|
|
|
|
|
|
|
|
|
|
|||||||||||||||
The Company’s investment securities portfolio contains unrealized losses on securities, including mortgage-related instruments issued or backed by the full faith and credit of the United States government, or generally viewed as having the implied guarantee of the U.S. government, other mortgage-backed securities, corporate obligations, obligations of states and political subdivisions and other debt securities.
The Company reviews its position quarterly and has asserted that at September 30, 2015 and 2014, the declines outlined in the above table represent temporary declines and the Company would not be required to sell the security before its anticipated recovery in market value.
The Company has concluded that any impairment of its investment securities portfolio at September 30, 2015 and 2014, is not other than temporary but is the result of interest rate changes that are not expected to result in the noncollection of principal and interest during the period.
| 5. | LOANS RECEIVABLE |
Loans receivable consist of the following (in thousands):
| 2015 | 2014 | |||||||
| Real estate loans: |
||||||||
| Residential |
$ | 610,582 | $ | 654,152 | ||||
| Construction |
878 | 1,367 | ||||||
| Commercial |
200,004 | 190,536 | ||||||
| Commercial |
34,314 | 25,807 | ||||||
| Obligations of states and political subdivisions |
59,820 | 49,177 | ||||||
| Home equity loans and lines of credit |
39,903 | 41,387 | ||||||
| Auto loans |
162,193 | 100,571 | ||||||
| Other |
3,343 | 3,904 | ||||||
|
|
|
|
|
|||||
| 1,111,037 | 1,066,901 | |||||||
| Less allowance for loan losses |
8,919 | 8,634 | ||||||
|
|
|
|
|
|||||
| Net loans |
$ | 1,102,118 | $ | 1,058,267 | ||||
|
|
|
|
|
|||||
F-26
Table of Contents
| 5. | LOANS RECEIVABLE (Continued) |
Included in the September 30, 2015 balances are loans acquired from First National Community Bank and Franklin Security Bank in 2014 and First Star Bank in 2012.
Upon acquisition, the Company evaluated whether each acquired loan (regardless of size) was within the scope of ASC 310-30, Receivables-Loans and Debt Securities Acquired with Deteriorated Credit Quality. Purchased credit-impaired loans are loans that have evidence of credit deterioration since origination and for which it is probable at the date of acquisition that the Company will not collect all contractually required principal and interest payments. As of the acquisition dates, none of the loans acquired from First National Community Bank and Franklin Security Bank had evidence of credit deterioration.
F-27
Table of Contents
| 5. | LOANS RECEIVABLE (Continued) |
Changes in the accretable yield for purchased credit-impaired loans were as follows, since acquisition, for the periods ended September 30, 2015 and 2014.
| September 30, 2015 | September 30, 2014 | |||||||
| Balance at beginning of period |
$ | 170 | $ | — | ||||
| Reclassification and other |
228 | 872 | ||||||
| Accretion |
(140 | ) | (702 | ) | ||||
|
|
|
|
|
|||||
| Balance at end of period |
$ | 258 | $ | 170 | ||||
|
|
|
|
|
|||||
Included in reclassification and other for loans acquired without specific evidence of deterioration in credit quality were $228,000 and $872,000 of reclassifications from nonaccretable discounts to accretable discounts in 2015 and 2014 respectively.
The following table presents additional information regarding loans acquired and accounted for in accordance with ASC 310-30 (in thousands):
| September 30, 2015 | September 30, 2014 | |||||||
| Acquired Loans with Specific Evidence or Deterioration in Credit Quality (ASC 310-30) |
Acquired Loans with Specific Evidence or Deterioration in Credit Quality (ASC 310-30) |
|||||||
| Outstanding balance |
$ | 4,779 | $ | 6,177 | ||||
| Carrying amount |
4,162 | 5,097 | ||||||
There has been $266,000 in allowance for loan losses recorded for acquired loans with or without specific evidence of deterioration in credit quality as of September 30, 2015. There has been $157,000 in allowance for loan losses recorded for acquired loans with or without specific evidence of deterioration in credit quality as of September 30, 2014. In addition, no allowance for loan losses has been reversed.
Loans serviced by the Company for others amounted to $81,659,000 and $104,810,000 at September 30, 2015 and 2014, respectively.
The Company’s primary business activity is with customers located within its local trade area. Commercial, residential, and consumer loans are granted. The Company also funds commercial and residential loans originated outside its immediate trade area provided such loans meet the Company’s credit policy guidelines. Although the Company has a diversified loan portfolio at September 30, 2015 and 2014, loans outstanding to individuals and businesses are dependent upon the local economic conditions in its immediate trade area.
At September 30, 2015, 2014, and 2013, the Company had nonaccrual loans of $20,105,000, $21,912,000, and $23,279,000, respectively. Additional interest income that would have been recorded under the original terms of the loan agreements amounted to $188,000, $660,000, and $883,000, for the years ended September 30, 2015, 2014, and 2013, respectively.
Impaired loans for the years ended September 30 are summarized as follows (in thousands):
| 2015 | 2014 | 2013 | ||||||||||
| Impaired loans with a related allowance |
$ | 2,772 | $ | 3,318 | $ | 6,160 | ||||||
| Impaired loans without a related allowance |
30,099 | 33,647 | 31,066 | |||||||||
| Related allowance for loan losses |
568 | 468 | 819 | |||||||||
| Average recorded balance of impaired loans |
34,539 | 37,345 | 37,386 | |||||||||
| Interest income recognized |
1,207 | 1,234 | 860 | |||||||||
28
Table of Contents
| 5. | LOANS RECEIVABLE (Continued) |
The following table shows the amount of loans in each category that was individually and collectively evaluated for impairment at the dates indicated (in thousands):
| Total Loans |
Individually Evaluated for Impairment |
Loans Acquired with Deteriorated Credit Quality |
Collectively Evaluated for Impairment |
|||||||||||||
| September 30, 2015 |
||||||||||||||||
| Real estate loans: |
||||||||||||||||
| Residential |
$ | 610,582 | $ | 11,985 | $ | — | $ | 598,597 | ||||||||
| Construction |
878 | — | — | 878 | ||||||||||||
| Commercial |
200,004 | 15,100 | 4,108 | 180,796 | ||||||||||||
| Commercial |
34,314 | 204 | 54 | 34,056 | ||||||||||||
| Obligations of states and political subdivisions |
59,820 | — | — | 59,820 | ||||||||||||
| Home equity loans and lines of credit |
39,903 | 795 | — | 39,108 | ||||||||||||
| Auto Loans |
162,193 | 625 | — | 161,568 | ||||||||||||
| Other |
3,343 | — | — | 3,343 | ||||||||||||
|
|
|
|
|
|
|
|
|
|||||||||
| Total |
$ | 1,111,037 | $ | 28,709 | $ | 4,162 | $ | 1,078,166 | ||||||||
|
|
|
|
|
|
|
|
|
|||||||||
| Total Loans |
Individually Evaluated for Impairment |
Loans Acquired with Deteriorated Credit Quality |
Collectively Evaluated for Impairment |
|||||||||||||
| September 30, 2014 |
||||||||||||||||
| Real estate loans: |
||||||||||||||||
| Residential |
$ | 654,152 | $ | 13,528 | $ | 110 | $ | 640,514 | ||||||||
| Construction |
1,367 | — | — | 1,367 | ||||||||||||
| Commercial |
190,536 | 17,517 | 4,727 | 168,292 | ||||||||||||
| Commercial |
25,807 | 456 | 263 | 25,088 | ||||||||||||
| Obligations of states and political subdivisions |
49,177 | — | — | 49,177 | ||||||||||||
| Home equity loans and lines of credit |
41,387 | 266 | (3 | ) | 41,124 | |||||||||||
| Auto Loans |
100,571 | 101 | — | 100,470 | ||||||||||||
| Other |
3,904 | — | — | 3,904 | ||||||||||||
|
|
|
|
|
|
|
|
|
|||||||||
| Total |
$ | 1,066,901 | $ | 31,868 | $ | 5,097 | $ | 1,029,936 | ||||||||
|
|
|
|
|
|
|
|
|
|||||||||
F-29
Table of Contents
| 5. | LOANS RECEIVABLE (Continued) |
The Company maintains a loan review system, which allows for a periodic review of our loan portfolio and the early identification of potential impaired loans. Such system takes into consideration, among other things, delinquency status, size of loans, type and market value of collateral, and financial condition of the borrowers. Specific loan loss allowances are established for identified losses based on a review of such information. A loan evaluated for impairment is considered to be impaired when, based on current information and events, it is probable that the Company will be unable to collect all amounts due according to the contractual terms of the loan agreement. All loans identified as impaired are evaluated independently. The Company does not aggregate such loans for evaluation purposes. Impairment is measured on a loan-by-loan basis for commercial and construction loans by the present value of expected future cash flows discounted at the loan’s effective interest rate, the loan’s obtainable market price, or the fair value of the collateral if the loan is collateral-dependent.
Large groups of smaller-balance homogeneous loans are collectively evaluated for impairment. Accordingly, the Company does not separately identify individual consumer and residential mortgage loans for impairment disclosures, unless such loans are part of a larger relationship that is impaired or are classified as a troubled debt restructuring.
A loan is considered to be a troubled debt restructuring (“TDR”) loan when the Company grants a concession to the borrower because of the borrower’s financial condition that it would not otherwise consider. Such concessions include the reduction of interest rates, forgiveness of principal or interest, or other modifications of interest rates that are less than the current market rate for new obligations with similar risk. TDR loans that are in compliance with their modified terms and that yield a market rate of interest may be removed from the TDR status after one year of performance.
F-30
Table of Contents
| 5. | LOANS RECEIVABLE (Continued) |
The following table includes the recorded investment and unpaid principal balances for impaired loans with the associated allowance amount, if applicable. Also presented are the average recorded investments in the impaired loans and the related amount of interest recognized during the time within the period that the impaired loans were impaired (in thousands).
| Recorded Investment |
Unpaid Principal Balance |
Associated Allowance |
Average Recorded Investment |
Interest Income Recognized |
||||||||||||||||
| September 30, 2015 |
||||||||||||||||||||
| With no specific allowance recorded: |
||||||||||||||||||||
| Real estate loans: |
||||||||||||||||||||
| Residential |
$ | 9,552 | $ | 11,521 | $ | — | $ | 10,105 | $ | 274 | ||||||||||
| Construction |
— | — | — | — | — | |||||||||||||||
| Commercial |
19,208 | 20,167 | — | 20,425 | 851 | |||||||||||||||
| Commercial |
258 | 270 | — | 480 | 10 | |||||||||||||||
| Obligations of states and political subdivisions |
— | — | — | — | — | |||||||||||||||
| Home equity loans and lines of credit |
731 | 743 | — | 379 | 7 | |||||||||||||||
| Auto loans |
350 | 464 | — | 102 | 3 | |||||||||||||||
| Other |
— | — | — | — | — | |||||||||||||||
|
|
|
|
|
|
|
|
|
|
|
|||||||||||
| Subtotal |
30,099 | 33,165 | — | 31,491 | 1,145 | |||||||||||||||
|
|
|
|
|
|
|
|
|
|
|
|||||||||||
| With an allowance recorded: |
||||||||||||||||||||
| Real estate loans: |
||||||||||||||||||||
| Residential |
2,433 | 2,639 | 373 | 2,624 | 52 | |||||||||||||||
| Construction |
— | — | — | — | — | |||||||||||||||
| Commercial |
— | — | — | 281 | — | |||||||||||||||
| Commercial |
— | — | — | — | — | |||||||||||||||
| Obligations of states and political subdivisions |
— | — | — | — | — | |||||||||||||||
| Home equity loans and lines of credit |
64 | 93 | 64 | 43 | — | |||||||||||||||
| Auto loans |
275 | 275 | 131 | 100 | 10 | |||||||||||||||
| Other |
— | — | — | — | — | |||||||||||||||
|
|
|
|
|
|
|
|
|
|
|
|||||||||||
| Subtotal |
2,772 | 3,007 | 568 | 3,048 | 62 | |||||||||||||||
|
|
|
|
|
|
|
|
|
|
|
|||||||||||
| Total: |
||||||||||||||||||||
| Real estate loans: |
||||||||||||||||||||
| Residential |
11,985 | 14,160 | 373 | 12,729 | 326 | |||||||||||||||
| Construction |
— | — | — | — | — | |||||||||||||||
| Commercial |
19,208 | 20,167 | — | 20,706 | 851 | |||||||||||||||
| Commercial |
258 | 270 | — | 480 | 10 | |||||||||||||||
| Obligations of states and political subdivisions |
— | — | — | — | — | |||||||||||||||
| Home equity loans and lines of credit |
795 | 836 | 64 | 422 | 7 | |||||||||||||||
| Auto loans |
625 | 739 | 131 | 202 | 13 | |||||||||||||||
| Other |
— | — | — | — | — | |||||||||||||||
|
|
|
|
|
|
|
|
|
|
|
|||||||||||
| Total |
$ | 32,871 | $ | 36,172 | $ | 568 | $ | 34,539 | $ | 1,207 | ||||||||||
|
|
|
|
|
|
|
|
|
|
|
|||||||||||
F-31
Table of Contents
| 5. | LOANS RECEIVABLE (Continued) |
| Recorded Investment |
Unpaid Principal Balance |
Associated Allowance |
Average Recorded Investment |
Interest Income Recognized |
||||||||||||||||
| September 30, 2014 |
||||||||||||||||||||
| With no specific allowance recorded: |
||||||||||||||||||||
| Real estate loans: |
||||||||||||||||||||
| Residential |
$ | 11,030 | $ | 13,225 | $ | — | $ | 9,687 | $ | 311 | ||||||||||
| Construction |
— | — | — | — | — | |||||||||||||||
| Commercial |
21,587 | 22,428 | — | 20,200 | 726 | |||||||||||||||
| Commercial |
719 | 777 | — | 2,146 | 92 | |||||||||||||||
| Obligations of states and political subdivisions |
— | — | — | — | — | |||||||||||||||
| Home equity loans and lines of credit |
210 | 377 | — | 260 | 7 | |||||||||||||||
| Auto loans |
101 | 101 | — | 99 | — | |||||||||||||||
| Other |
— | — | — | — | — | |||||||||||||||
|
|
|
|
|
|
|
|
|
|
|
|||||||||||
| Subtotal |
33,647 | 36,908 | — | 32,392 | 1,136 | |||||||||||||||
|
|
|
|
|
|
|
|
|
|
|
|||||||||||
| With an allowance recorded: |
||||||||||||||||||||
| Real estate loans: |
||||||||||||||||||||
| Residential |
2,608 | 2,997 | 334 | 3,330 | 98 | |||||||||||||||
| Construction |
— | — | — | — | — | |||||||||||||||
| Commercial |
657 | 677 | 84 | 1,598 | — | |||||||||||||||
| Commercial |
— | — | — | — | — | |||||||||||||||
| Obligations of states and political subdivisions |
— | — | — | — | — | |||||||||||||||
| Home equity loans and lines of credit |
53 | 76 | 50 | 25 | — | |||||||||||||||
| Auto loans |
— | — | — | — | — | |||||||||||||||
| Other |
— | — | — | — | — | |||||||||||||||
|
|
|
|
|
|
|
|
|
|
|
|||||||||||
| Subtotal |
3,318 | 3,750 | 468 | 4,953 | 98 | |||||||||||||||
|
|
|
|
|
|
|
|
|
|
|
|||||||||||
| Total: |
||||||||||||||||||||
| Real estate loans: |
||||||||||||||||||||
| Residential |
13,638 | 16,222 | 334 | 13,017 | 409 | |||||||||||||||
| Construction |
— | — | — | — | — | |||||||||||||||
| Commercial |
22,244 | 23,105 | 84 | 21,798 | 726 | |||||||||||||||
| Commercial |
719 | 777 | — | 2,146 | 92 | |||||||||||||||
| Obligations of states and political subdivisions |
— | — | — | — | — | |||||||||||||||
| Home equity loans and lines of credit |
263 | 453 | 50 | 285 | 7 | |||||||||||||||
| Auto loans |
101 | 101 | — | 99 | — | |||||||||||||||
| Other |
— | — | — | — | — | |||||||||||||||
|
|
|
|
|
|
|
|
|
|
|
|||||||||||
| Total |
$ | 36,965 | $ | 40,658 | $ | 468 | $ | 37,345 | $ | 1,234 | ||||||||||
|
|
|
|
|
|
|
|
|
|
|
|||||||||||
F-32
Table of Contents
| 5. | LOANS RECEIVABLE (Continued) |
The Company uses a ten-point internal risk-rating system to monitor the credit quality of the overall loan portfolio. The first six categories are considered not criticized and are aggregated as Pass-rated. The criticized rating categories utilized by management generally follow bank regulatory definitions. The Special Mention category includes assets that are fundamentally sound yet, exhibit potentially unacceptable credit risk or deteriorating trends or characteristics which if left uncorrected, may result in deterioration of the repayment prospects for the asset or in the Company’s credit position at some future date. Loans in the Substandard category have well-defined weaknesses that jeopardize the liquidation of the debt and have a distinct possibility that some loss will be sustained if the weaknesses are not corrected. All loans greater than 90 days past due are considered Substandard. Loans in the Doubtful category have all the weaknesses inherent in one classified Substandard with the added characteristic that the weaknesses make collection or liquidation in full, on the basis of currently existing facts, conditions, and values, highly questionable and improbable. Loans in the Loss category are considered uncollectible and of little value that their continuance as bankable assets is not warranted.
To help ensure that risk ratings are accurate and reflect the present and future capacity of borrowers to repay a loan as agreed, the Company has a structured loan rating process with several layers of internal and external oversight. Generally, consumer and residential mortgage loans are included in the Pass categories unless a specific action, such as bankruptcy, repossession, or death, occurs to raise awareness of a possible credit event. The Company’s Commercial Loan Officers are responsible for the timely and accurate risk rating of the loans in their portfolios at origination and on an ongoing basis. The Company’s Commercial Loan Officers perform an annual review of all commercial relationships $500,000 or greater. Confirmation of the appropriate risk grade is included in the review on an ongoing basis. The Company engages an external consultant to conduct loan reviews on at least a semiannual basis. Generally, the external consultant reviews commercial relationships greater than $1,000,000 and/or all criticized relationships. Detailed reviews, including plans for resolution, are performed on loans classified as Substandard on a quarterly basis. Loans in the Special Mention and Substandard categories that are evaluated for impairment are given separate consideration in the determination of the allowance.
The following table presents the classes of the loan portfolio summarized by the aggregate Pass and the criticized categories of Special Mention, Substandard, and Doubtful within the internal risk rating system as of September 30, 2015 and 2014 (in thousands):
| Pass | Special Mention |
Substandard | Doubtful | Total | ||||||||||||||||
| September 30, 2015 |
||||||||||||||||||||
| Commercial real estate loans |
$ | 174,516 | $ | 4,521 | $ | 20,967 | $ | — | $ | 200,004 | ||||||||||
| Commercial |
33,801 | — | 513 | — | 34,314 | |||||||||||||||
| Obligations of states and political subdivisions |
59,820 | — | — | — | 59,820 | |||||||||||||||
|
|
|
|
|
|
|
|
|
|
|
|||||||||||
| Total |
$ | 268,137 | $ | 4,521 | $ | 21,480 | $ | — | $ | 294,138 | ||||||||||
|
|
|
|
|
|
|
|
|
|
|
|||||||||||
| Pass | Special Mention |
Substandard | Doubtful | Total | ||||||||||||||||
| September 30, 2014 |
||||||||||||||||||||
| Commercial real estate loans |
$ | 160,749 | $ | 8,020 | $ | 21,469 | $ | 298 | $ | 190,536 | ||||||||||
| Commercial |
24,874 | 345 | 588 | — | 25,807 | |||||||||||||||
| Obligations of states and political subdivisions |
49,177 | — | — | — | 49,177 | |||||||||||||||
|
|
|
|
|
|
|
|
|
|
|
|||||||||||
| Total |
$ | 234,800 | $ | 8,365 | $ | 22,057 | $ | 298 | $ | 265,520 | ||||||||||
|
|
|
|
|
|
|
|
|
|
|
|||||||||||
All other loans are underwritten and structured using standardized criteria and characteristics, primarily payment performance, and are normally risk rated and monitored collectively on a monthly basis. These are typically loans to individuals in the consumer categories and are delineated as either performing or nonperforming.
F-33
Table of Contents
| 5. | LOANS RECEIVABLE (Continued) |
For residential real estate loans, construction real estate loans, home equity loans and lines of credit, auto loans, and other loans, the Company evaluates credit quality based on the performance of the individual credits. The following table presents the recorded investment in the loan classes based on payment activity as of September 30, 2015 and 2014 (in thousands):
| Performing | Nonperforming | Total | ||||||||||
| September 30, 2015 |
||||||||||||
| Real estate loans: |
||||||||||||
| Residential |
$ | 600,810 | $ | 9,772 | $ | 610,582 | ||||||
| Construction |
878 | — | 878 | |||||||||
| Home equity loans and lines of credit |
39,213 | 690 | 39,903 | |||||||||
| Auto Loans |
161,827 | 366 | 162,193 | |||||||||
| Other |
3,322 | 21 | 3,343 | |||||||||
|
|
|
|
|
|
|
|||||||
| Total |
$ | 806,050 | $ | 10,849 | $ | 816,899 | ||||||
|
|
|
|
|
|
|
|||||||
| Performing | Nonperforming | Total | ||||||||||
| September 30, 2014 |
||||||||||||
| Real estate loans: |
||||||||||||
| Residential |
$ | 644,374 | $ | 9,778 | $ | 654,152 | ||||||
| Construction |
1,367 | — | 1,367 | |||||||||
| Home equity loans and lines of credit |
41,128 | 259 | 41,387 | |||||||||
| Auto Loans |
100,571 | — | 100,571 | |||||||||
| Other |
3,884 | 20 | 3,904 | |||||||||
|
|
|
|
|
|
|
|||||||
| Total |
$ | 791,324 | $ | 10,057 | $ | 801,381 | ||||||
|
|
|
|
|
|
|
|||||||
The Company further monitors the performance and credit quality of the loan portfolio by analyzing the age of the portfolio as determined by the length of time a recorded payment is past due. The following table presents the classes of the loan portfolio summarized by the aging categories of performing loans and nonaccrual loans as of September 30, 2015 and 2014 (in thousands):
| Current | 31-60 Days Past Due |
61-90 Days Past Due |
Greater than 90 Days Past Due |
Non- accrual |
Total Past Due |
Total Loans |
||||||||||||||||||||||
| September 30, 2015 |
||||||||||||||||||||||||||||
| Real estate loans: |
||||||||||||||||||||||||||||
| Residential |
$ | 598,190 | $ | 1,575 | $ | 1,045 | $ | — | $ | 9,772 | $ | 12,392 | $ | 610,582 | ||||||||||||||
| Construction |
878 | — | — | — | — | — | 878 | |||||||||||||||||||||
| Commercial |
190,440 | 137 | 587 | — | 8,840 | 9,564 | 200,004 | |||||||||||||||||||||
| Commercial |
33,545 | 346 | 7 | — | 416 | 769 | 34,314 | |||||||||||||||||||||
| Obligations of states and political subdivisions |
59,820 | — | — | — | — | — | 59,820 | |||||||||||||||||||||
| Home equity loans and lines of credit |
39,136 | 32 | 45 | — | 690 | 767 | 39,903 | |||||||||||||||||||||
| Auto loans |
160,272 | 1,375 | 180 | — | 366 | 1,921 | 162,193 | |||||||||||||||||||||
| Other |
3,295 | 27 | — | — | 21 | 48 | 3,343 | |||||||||||||||||||||
|
|
|
|
|
|
|
|
|
|
|
|
|
|
|
|||||||||||||||
| Total |
$ | 1,085,576 | $ | 3,492 | $ | 1,864 | $ | — | $ | 20,105 | $ | 25,461 | $ | 1,111,037 | ||||||||||||||
|
|
|
|
|
|
|
|
|
|
|
|
|
|
|
|||||||||||||||
F-34
Table of Contents
| 5. | LOANS RECEIVABLE (Continued) |
| Current | 31-60 Days Past Due |
61-90 Days Past Due |
Greater than 90 Days Past Due |
Non- accrual |
Total Past Due |
Total Loans |
||||||||||||||||||||||
| September 30, 2014 |
||||||||||||||||||||||||||||
| Real estate loans: |
||||||||||||||||||||||||||||
| Residential |
$ | 640,583 | $ | 2,398 | $ | 1,393 | $ | — | $ | 9,778 | $ | 13,569 | $ | 654,152 | ||||||||||||||
| Construction |
1,367 | — | — | — | — | — | 1,367 | |||||||||||||||||||||
| Commercial |
179,319 | 516 | 89 | — | 10,612 | 11,217 | 190,536 | |||||||||||||||||||||
| Commercial |
24,424 | 110 | 30 | — | 1,243 | 1,383 | 25,807 | |||||||||||||||||||||
| Obligations of states and political subdivisions |
49,159 | 18 | — | — | — | 18 | 49,177 | |||||||||||||||||||||
| Home equity loans and lines of credit |
40,870 | 225 | 33 | — | 259 | 517 | 41,387 | |||||||||||||||||||||
| Auto loans |
100,112 | 426 | 33 | — | — | 459 | 100,571 | |||||||||||||||||||||
| Other |
3,884 | — | — | — | 20 | 20 | 3,904 | |||||||||||||||||||||
|
|
|
|
|
|
|
|
|
|
|
|
|
|
|
|||||||||||||||
| Total |
$ | 1,039,718 | $ | 3,693 | $ | 1,578 | $ | — | $ | 21,912 | $ | 27,183 | $ | 1,066,901 | ||||||||||||||
|
|
|
|
|
|
|
|
|
|
|
|
|
|
|
|||||||||||||||
The allowance for loan losses (“ALL”) is maintained at a level necessary to absorb loan losses that are both probable and reasonably estimable. Management, in determining the allowance for loan losses, considers the losses inherent in its loan portfolio and changes in the nature and volume of loan activities, along with the general economic and real estate market conditions. The allowance for loan losses consists of two elements: (1) an allocated allowance, which comprises allowances established on specific loans and class allowances based on historical loss experience and current trends, and (2) an allocated allowance based on general economic conditions and other risk factors in our markets and portfolios. We maintain a loan review system, which allows for a periodic review of our loan portfolio and the early identification of potential impaired loans. Such system takes into consideration, among other things, delinquency status, size of loans, type and market value of collateral, and financial condition of the borrowers. General loan loss allowances are based upon a combination of factors including, but not limited to, actual loan loss experience, composition of the loan portfolio, current economic conditions, management’s judgment and losses which are probable and reasonably estimable. The allowance is increased through provisions charged against current earnings and recoveries of previously charged-off loans. Loans that are determined to be uncollectible are charged against the allowance. While management uses available information to recognize probable and reasonably estimable loan losses, future loss provisions may be necessary, based on changing economic conditions. Payments received on impaired loans generally are either applied against principal or reported as interest income, according to management’s judgment as to the collectability of principal. The allowance for loan losses as of September 30, 2015, is maintained at a level that represents management’s best estimate of losses inherent in the loan portfolio, and such losses were both probable and reasonably estimable.
F-35
Table of Contents
| 5. | LOANS RECEIVABLE (Continued) |
In addition, the FDIC and the Pennsylvania Department of Banking, as an integral part of their examination process, have periodically reviewed the Company’s allowance for loan losses. The banking regulators may require that the Company recognize additions to the allowance based on their analysis and review of information available to it at the time of their examination.
Management reviews the loan portfolio on a quarterly basis using a defined, consistently applied process in order to make appropriate and timely adjustments to the ALL. When information confirms all or part of specific loans to be uncollectible, these amounts are promptly charged-off against the ALL.
The following table summarizes the primary segments of the ALL, segregated into the amount required for loans individually evaluated for impairment and the amount required for loans collectively evaluated for impairment as of September 30, 2015, 2014 and 2013 (in thousands):
| Real Estate Loans |
Obligations of States and Political |
Home Equity Loans and Lines of |
||||||||||||||||||||||||||||||||||||||
| Residential | Construction | Commercial | Commercial | Subdivisions | Credit | Auto | Other | Unallocated | Total | |||||||||||||||||||||||||||||||
| ALL balance at September 30, 2012 |
$ | 5,401 | $ | 29 | $ | 699 | $ | 474 | $ | 127 | $ | 499 | $ | — | $ | 22 | $ | 51 | $ | 7,302 | ||||||||||||||||||||
| Charge-offs |
(2,401 | ) | — | (403 | ) | — | — | (243 | ) | — | (6 | ) | — | (3,053 | ) | |||||||||||||||||||||||||
| Recoveries |
50 | — | 2 | — | — | 13 | — | — | — | 65 | ||||||||||||||||||||||||||||||
| Provision |
2,737 | (9 | ) | 648 | (137 | ) | 3 | 161 | — | 5 | 342 | 3,750 | ||||||||||||||||||||||||||||
|
|
|
|
|
|
|
|
|
|
|
|
|
|
|
|
|
|
|
|
|
|||||||||||||||||||||
| ALL balance at September 30, 2013 |
$ | 5,787 | $ | 20 | $ | 946 | $ | 337 | $ | 130 | $ | 430 | $ | — | $ | 21 | $ | 393 | $ | 8,064 | ||||||||||||||||||||
|
|
|
|
|
|
|
|
|
|
|
|
|
|
|
|
|
|
|
|
|
|||||||||||||||||||||
| ALL balance at September 30, 2013 |
$ | 5,787 | $ | 20 | $ | 946 | $ | 337 | $ | 130 | $ | 430 | $ | — | $ | 21 | $ | 393 | $ | 8,064 | ||||||||||||||||||||
| Charge-offs |
(1,709 | ) | — | (120 | ) | (101 | ) | — | (145 | ) | — | (3 | ) | — | (2,078 | ) | ||||||||||||||||||||||||
| Recoveries |
163 | — | 94 | 20 | — | 18 | — | 3 | — | 298 | ||||||||||||||||||||||||||||||
| Provision |
1,332 | (9 | ) | (257 | ) | 272 | 33 | 167 | 459 | 11 | 342 | 2,350 | ||||||||||||||||||||||||||||
|
|
|
|
|
|
|
|
|
|
|
|
|
|
|
|
|
|
|
|
|
|||||||||||||||||||||
| ALL balance at September 30, 2014 |
$ | 5,573 | $ | 11 | $ | 663 | $ | 528 | $ | 163 | $ | 470 | $ | 459 | $ | 32 | $ | 735 | $ | 8,634 | ||||||||||||||||||||
|
|
|
|
|
|
|
|
|
|
|
|
|
|
|
|
|
|
|
|
|
|||||||||||||||||||||
| ALL balance at September 30, 2014 |
$ | 5,573 | $ | 11 | $ | 663 | $ | 528 | $ | 163 | $ | 470 | $ | 459 | $ | 32 | $ | 735 | $ | 8,634 | ||||||||||||||||||||
| Charge-offs |
(1,359 | ) | — | (65 | ) | (30 | ) | — | (27 | ) | (596 | ) | (6 | ) | — | (2,083 | ) | |||||||||||||||||||||||
| Recoveries |
76 | — | 84 | 23 | — | 15 | 87 | 8 | — | 293 | ||||||||||||||||||||||||||||||
| Provision |
850 | (4 | ) | (11 | ) | 172 | 26 | 3 | 1,620 | (7 | ) | (574 | ) | 2,075 | ||||||||||||||||||||||||||
|
|
|
|
|
|
|
|
|
|
|
|
|
|
|
|
|
|
|
|
|
|||||||||||||||||||||
| ALL balance at September 30, 2015 |
$ | 5,140 | $ | 7 | $ | 671 | $ | 693 | $ | 189 | $ | 461 | $ | 1,570 | $ | 27 | $ | 161 | $ | 8,919 | ||||||||||||||||||||
|
|
|
|
|
|
|
|
|
|
|
|
|
|
|
|
|
|
|
|
|
|||||||||||||||||||||
| Individually evaluated for impairment |
$ | 373 | $ | — | $ | — | $ | — | $ | — | $ | 64 | $ | 131 | $ | — | $ | — | $ | 568 | ||||||||||||||||||||
| Collectively evaluated for impairment |
4,767 | 7 | 671 | 693 | 189 | 397 | 1,439 | 27 | 161 | 8,351 | ||||||||||||||||||||||||||||||
|
|
|
|
|
|
|
|
|
|
|
|
|
|
|
|
|
|
|
|
|
|||||||||||||||||||||
| ALL balance at September 30, 2015 |
$ | 5,140 | $ | 7 | $ | 671 | $ | 693 | $ | 189 | $ | 461 | $ | 1,570 | $ | 27 | $ | 161 | $ | 8,919 | ||||||||||||||||||||
|
|
|
|
|
|
|
|
|
|
|
|
|
|
|
|
|
|
|
|
|
|||||||||||||||||||||
| Individually evaluated for impairment |
$ | 334 | $ | — | $ | 84 | $ | — | $ | — | $ | 50 | $ | — | $ | — | $ | — | $ | 468 | ||||||||||||||||||||
| Collectively evaluated for impairment |
5,239 | 11 | 579 | 528 | 163 | 420 | 459 | 32 | 735 | 8,166 | ||||||||||||||||||||||||||||||
|
|
|
|
|
|
|
|
|
|
|
|
|
|
|
|
|
|
|
|
|
|||||||||||||||||||||
| ALL balance at September 30, 2014 |
$ | 5,573 | $ | 11 | $ | 663 | $ | 528 | $ | 163 | $ | 470 | $ | 459 | $ | 32 | $ | 735 | $ | 8,634 | ||||||||||||||||||||
|
|
|
|
|
|
|
|
|
|
|
|
|
|
|
|
|
|
|
|
|
|||||||||||||||||||||
F-36
Table of Contents
| 5. | LOANS RECEIVABLE (Continued) |
The allowance for loan losses is based on estimates, and actual losses will vary from current estimates. Management believes that the granularity of the homogeneous pools and the related historical loss ratios and other qualitative factors, as well as the consistency in the application of assumptions, result in an ALL that is representative of the risk found in the components of the portfolio at any given date. The Company allocated increased provisions to the residential real estate, commercial, obligations of states and political subdivisions, home equity loans and line of credit, and indirect auto loans segments for the year ended September 30, 2015, due to increased loans balances and/or charge-off activity in those segments. Outstanding loan balances of indirect auto loans, which increased $61.6 million from September 30, 2014 to September 30, 2015, had the largest increase in provisions. The Company allocated decreased allowance for loan loss provisions to the construction loans, commercial real estate, and other loans segments due to declining loan balances and actual loss experience being less than previously estimated. The Company allocated increased provisions to the residential real estate, commercial and home equity loans, and lines of credit segments for the year ended September 30, 2014, due to increased charge-off activity in those segments. The Company allocated decreased allowance for loan loss provisions to the commercial real estate segment due to actual loss experience being less than previously estimated. Despite the above allocations, the allowance for loan losses is general in nature and is available to absorb losses from any loan segment.
F-37
Table of Contents
| 5. | LOANS RECEIVABLE (Continued) |
The following is a summary of troubled debt restructurings granted during the periods indicated (in thousands).
| For the Year Ended September 30, 2015 | ||||||||||||
| Number of Contracts |
Pre-Modification Outstanding Recorded Investment |
Post-Modification Outstanding Recorded Investment |
||||||||||
| Troubled debt restructurings | ||||||||||||
| Real estate loans: |
||||||||||||
| Residential |
14 | $ | 2,775 | $ | 2,775 | |||||||
| Construction |
— | — | — | |||||||||
| Commercial |
— | — | — | |||||||||
| Commercial |
— | — | — | |||||||||
| Obligations of states and political subdivisions |
— | — | — | |||||||||
| Home equity loans and lines of credit |
2 | 175 | 175 | |||||||||
| Auto loans |
— | — | — | |||||||||
| Other |
— | — | — | |||||||||
|
|
|
|
|
|
|
|||||||
| Total |
16 | $ | 2,950 | $ | 2,950 | |||||||
|
|
|
|
|
|
|
|||||||
| For the Year Ended September 30, 2014 | ||||||||||||
| Number of Contracts |
Pre-Modification Outstanding Recorded Investment |
Post-Modification Outstanding Recorded Investment |
||||||||||
| Troubled debt restructurings | ||||||||||||
| Real estate loans: |
||||||||||||
| Residential |
9 | $ | 1,366 | $ | 1,366 | |||||||
| Construction |
— | — | — | |||||||||
| Commercial |
3 | 487 | 487 | |||||||||
| Commercial |
1 | 279 | 279 | |||||||||
| Obligations of states and political subdivisions |
— | — | — | |||||||||
| Home equity loans and lines of credit |
— | — | — | |||||||||
| Auto loans |
— | — | — | |||||||||
| Other |
— | — | — | |||||||||
|
|
|
|
|
|
|
|||||||
| Total |
13 | $ | 2,132 | $ | 2,132 | |||||||
|
|
|
|
|
|
|
|||||||
Of the sixteen new troubled debt restructurings granted for the year ended September 30, 2015, twelve loans totaling $2.3 million were granted terms and rate concessions and three loans totaling $480,000 were granted terms concessions and one loan for $177,000 was granted an interest rate concession.
Of the thirteen new troubled debt restructurings granted for the year ended September 30, 2014, seven loans totaling $996,000 were granted terms and rate concessions and six loans totaling $1.1 million were granted terms concessions.
For the year ended September 30, 2015 there were two residential mortgages totaling $208,000 that defaulted within one year of modification. For the years ended September 30, 2014 and 2013, there were no loan modifications classified as troubled debt restructurings that subsequently defaulted within one year of modification.
F-38
Table of Contents
| 6. | PREMISES AND EQUIPMENT |
Premises and equipment consist of the following (in thousands):
| 2015 | 2014 | |||||||
| Land and land improvements |
$ | 6,167 | $ | 6,167 | ||||
| Buildings and leasehold improvements |
16,047 | 15,646 | ||||||
| Furniture, fixtures, and equipment |
10,402 | 10,005 | ||||||
| Construction in process |
14 | 85 | ||||||
|
|
|
|
|
|||||
| 32,630 | 31,903 | |||||||
| Less accumulated depreciation |
(16,077 | ) | (14,946 | ) | ||||
|
|
|
|
|
|||||
| Total |
$ | 16,553 | $ | 16,957 | ||||
|
|
|
|
|
|||||
Depreciation expense amounted to $1,131,000, $1,097,000, and $1,019,000, for the years ended September 30, 2015, 2014, and 2013, respectively.
| 7. | DEPOSITS |
Deposits and their respective weighted-average interest rates consist of the following major classifications (in thousands):
| 2015 | 2014 | |||||||||||||||
| Weighted- Average Interest Rate |
Amount | Weighted- Average Interest Rate |
Amount | |||||||||||||
| Noninterest-bearing demand accounts |
— | % | $ | 98,514 | — | % | $ | 70,048 | ||||||||
| Interest bearing demand accounts |
0.09 | 110,268 | 0.07 | 163,936 | ||||||||||||
| Money market accounts |
0.23 | 162,418 | 0.23 | 170,158 | ||||||||||||
| Savings and club accounts |
0.05 | 129,227 | 0.05 | 122,734 | ||||||||||||
| Certificates of deposit |
1.11 | 596,327 | 1.25 | 607,013 | ||||||||||||
|
|
|
|
|
|||||||||||||
| Total |
0.65 | % | $ | 1,096,754 | 0.72 | % | $ | 1,133,889 | ||||||||
|
|
|
|
|
|||||||||||||
F-39
Table of Contents
| 7. | DEPOSITS (Continued) |
| 2015 | 2014 | |||||||||||||||
| Weighted- Average Interest Rate |
Amount | Weighted- Average Interest Rate |
Amount | |||||||||||||
| Certificates of deposit: |
||||||||||||||||
| 0.00 - 2.00% |
0.98 | % | $ | 541,503 | 0.97 | % | $ | 503,905 | ||||||||
| 2.01 - 4.00% |
2.36 | 54,824 | 2.63 | 103,108 | ||||||||||||
|
|
|
|
|
|||||||||||||
| Total |
1.11 | % | $ | 596,327 | 1.25 | % | $ | 607,013 | ||||||||
|
|
|
|
|
|||||||||||||
At September 30 scheduled maturities of certificates of deposit are as follows (in thousands):
| Within three months |
$ | 104,181 | ||
| Three through six months |
69,371 | |||
| Six through twelve months |
108,892 | |||
| Over twelve months |
313,883 | |||
|
|
|
|||
| Total |
$ | 596,327 | ||
|
|
|
|||
Brokered deposits totaled $271,916,000 and $218,368,000 at September 30, 2015 and 2014, respectively. The aggregate amount of certificates of deposit with a minimum denomination of $250,000 were $25,677,000 and $25,562,000 at September 30, 2015 and 2014, respectively.
The scheduled maturities of certificates of deposit in denominations of $100,000 or more as of September 30, 2015, are as follows (in thousands):
| Within three months |
$ | 25,951 | ||
| Three through six months |
14,580 | |||
| Six through twelve months |
23,703 | |||
| Over twelve months |
101,013 | |||
|
|
|
|||
| Total |
$ | 165,247 | ||
|
|
|
|||
A summary of interest expense on deposits for the years ended September 30 is as follows (in thousands):
| 2015 | 2014 | 2013 | ||||||||||
| Interest bearing demand accounts |
$ | 103 | $ | 76 | $ | 51 | ||||||
| Money market accounts |
465 | 315 | 327 | |||||||||
| Savings and club accounts |
62 | 61 | 51 | |||||||||
| Certificates of deposits |
6,795 | 7,455 | 6,979 | |||||||||
|
|
|
|
|
|
|
|||||||
| Total |
$ | 7,425 | $ | 7,907 | $ | 7,408 | ||||||
|
|
|
|
|
|
|
|||||||
F-40
Table of Contents
| 8. | SHORT-TERM BORROWINGS |
As of September 30, 2015 and 2014, the Company had $91,339,000 and $108,020,000 of short-term borrowings, respectively, of which $38,839,000 in 2015 and $5,020,000 in 2014 were advances on a $150,000,000 line of credit with the FHLB.
All borrowings from the FHLB are secured by a blanket lien on qualified collateral, defined principally as investment securities and mortgage loans that are owned by the Company free and clear of any liens or encumbrances. At September 30, 2015, the Company had a borrowing limit of approximately $551.2 million, with a variable rate of interest, based on the FHLB’s cost of funds.
The following table sets forth information concerning short-term borrowings (in thousands):
| 2015 | 2014 | |||||||
| Balance at year-end |
$ | 91,339 | $ | 108,020 | ||||
| Maximum amount outstanding at any month-end |
132,533 | 108,020 | ||||||
| Average balance outstanding during the year |
115,006 | 55,204 | ||||||
| Weighted-average interest rate: |
||||||||
| As of year-end |
0.40 | % | 0.33 | % | ||||
| Paid during the year |
0.37 | % | 0.33 | % | ||||
Average balances outstanding during the year represent daily average balances, and average interest rates represent interest expenses divided by the related average balance.
| 9. | OTHER BORROWINGS |
The following table presents contractual maturities of FHLB long-term advances (in thousands):
| Maturity Range | Weighted- Average |
Stated Interest Rate Ranged |
||||||||||||||||||||||||||
| Description |
From | To | Interest Rate | From | To | 2015 | 2014 | |||||||||||||||||||||
| Convertible |
12/5/2018 | 12/5/2018 | 3.30 | % | 3.30 | % | 3.30 | % | $ | 5,000 | $ | 5,000 | ||||||||||||||||
| Fixed rate |
11/5/2015 | 9/21/2020 | 1.58 | 0.63 | 2.85 | 119,951 | 116,300 | |||||||||||||||||||||
| Mid-term |
10/30/2015 | 9/10/2018 | 0.81 | 0.45 | 1.27 | 104,150 | 30,000 | |||||||||||||||||||||
|
|
|
|
|
|||||||||||||||||||||||||
| Total |
$ | 229,101 | $ | 151,300 | ||||||||||||||||||||||||
|
|
|
|
|
|||||||||||||||||||||||||
F-41
Table of Contents
| 9. | OTHER BORROWINGS (Continued) |
Maturities of FHLB long-term advances are summarized as follows (in thousands):
| Year Ending September 30, |
Amount | Weighted- Average Rate |
||||||
| 2016 |
$ | 67,800 | 0.94 | % | ||||
| 2017 |
76,030 | 1.05 | ||||||
| 2018 |
42,575 | 1.45 | ||||||
| 2019 |
34,050 | 2.03 | ||||||
| 2020 |
8,646 | 1.81 | ||||||
|
|
|
|||||||
| Total |
$ | 229,101 | 1.27 | % | ||||
|
|
|
|||||||
Included above is one convertible note for $5,000,000 which is convertible to a variable-rate advance on specific dates at the discretion of the FHLB. Should the FHLB convert this advance, the Bank has the option of accepting the variable rate or repaying the advance without penalty.
The FHLB long-term advances are secured by qualifying assets of the Bank, which include the FHLB stock, securities, and first-mortgage loans.
F-42
Table of Contents
| 10. | INCOME TAXES |
The provision for income taxes consists of (in thousands):
| 2015 | 2014 | 2013 | ||||||||||
| Current: |
||||||||||||
| Federal |
$ | 2,154 | $ | 1,505 | $ | 1,646 | ||||||
| State |
16 | — | — | |||||||||
|
|
|
|
|
|
|
|||||||
| Total current taxes |
2,170 | 1,505 | 1,646 | |||||||||
| Deferred income tax benefit |
784 | 1,386 | 1,188 | |||||||||
|
|
|
|
|
|
|
|||||||
| Total income tax provision |
$ | 2,954 | $ | 2,891 | $ | 2,834 | ||||||
|
|
|
|
|
|
|
|||||||
The tax effects of deductible and taxable temporary differences that gave rise to significant portions of the deferred tax assets and deferred tax liabilities are as follows (in thousands):
| 2015 | 2014 | |||||||
| Deferred tax assets: |
||||||||
| Allowance for loan losses |
$ | 3,032 | $ | 2,936 | ||||
| Employee benefit plan |
2,743 | 1,663 | ||||||
| Investment losses subject to Section 382 limitation |
4,637 | 4,910 | ||||||
| Purchase accounting adjustment |
604 | 1,423 | ||||||
| Other |
4,093 | 3,964 | ||||||
|
|
|
|
|
|||||
| Total gross deferred tax assets |
15,109 | 14,896 | ||||||
|
|
|
|
|
|||||
| Deferred tax liabilities: |
||||||||
| Pension plan |
1,184 | 1,254 | ||||||
| Net unrealized gain on securities |
1,509 | 335 | ||||||
| Mortgage servicing rights |
104 | 119 | ||||||
| Premises and equipment |
273 | 258 | ||||||
| Other |
890 | 903 | ||||||
|
|
|
|
|
|||||
| Total gross deferred tax liabilities |
3,960 | 2,869 | ||||||
|
|
|
|
|
|||||
| Net deferred tax assets |
$ | 11,149 | $ | 12,027 | ||||
|
|
|
|
|
|||||
The Company establishes a valuation allowance for deferred tax assets when management believes that the deferred tax assets are not likely to be realized either through a carryback to taxable income in prior years, future reversals of existing taxable temporary differences, and, to a lesser extent, future taxable income.
Accounting principles prescribe a recognition threshold and a measurement attribute for the financial statement recognition and measurement of a tax position taken or expected to be taken in a tax return. Benefits from tax positions should be recognized in the financial statements only when it is more likely than not that the tax position will be sustained upon examination by the appropriate taxing authority that would have full knowledge of all relevant information. A tax position that meets the more-likely-than-not recognition threshold is measured at the largest amount of benefit that is greater than 50 percent likely of being realized upon ultimate settlement. Tax positions that previously failed to meet the more-likely-than-not recognition threshold should be recognized in the first subsequent financial reporting period in which that threshold is met. Previously recognized tax positions that no longer meet the more-likely-than-not recognition threshold should be derecognized in the first subsequent financial reporting period in which that threshold is no longer met.
There is currently no liability for uncertain tax positions and no known unrecognized tax benefits. The Company recognizes, when applicable, interest and penalties related to unrecognized tax benefits in the provision for income taxes in the Consolidated Statement of Income. The Company’s federal and state income tax returns for taxable years through 2008 have been closed for purposes of examination by the Internal Revenue Service and the Pennsylvania Department of Revenue. Tax year 2010 has also been closed. Tax year 2009 was reopened to file an amended return in June 2013.
F-43
Table of Contents
| 10. | INCOME TAXES (Continued) |
The reconciliation of the federal statutory rate and the Company’s effective income tax rate is as follows (in thousands):
| 2015 | 2014 | 2013 | ||||||||||||||||||||||
| Amount | % of Pretax Income |
Amount | % of Pretax Income |
Amount | % of Pretax Income |
|||||||||||||||||||
| Provision at statutory rate |
$ | 4,333 | 34.0 | % | $ | 3,874 | 34.0 | % | $ | 3,963 | 34.0 | % | ||||||||||||
| Income from bank-owned life insurance |
(318 | ) | (2.5 | ) | (314 | ) | (2.8 | ) | (322 | ) | (2.8 | ) | ||||||||||||
| Tax-exempt income |
(752 | ) | (5.9 | ) | (536 | ) | (4.7 | ) | (388 | ) | (3.3 | ) | ||||||||||||
| Low-income housing credits |
(254 | ) | (2.0 | ) | (140 | ) | (1.2 | ) | (289 | ) | (2.5 | ) | ||||||||||||
| Nondeductible merger expenses |
21 | 0.2 | — | — | — | — | ||||||||||||||||||
| Other, net |
(76 | ) | (0.6 | ) | 7 | 0.1 | (130 | ) | (1.1 | ) | ||||||||||||||
|
|
|
|
|
|
|
|
|
|
|
|
|
|||||||||||||
| Actual tax expense and effective rate |
$ | 2,954 | 23.2 | % | $ | 2,891 | 25.4 | % | $ | 2,834 | 24.3 | % | ||||||||||||
|
|
|
|
|
|
|
|
|
|
|
|
|
|||||||||||||
The Bank is subject to the Pennsylvania Mutual Thrift Institutions Tax that is calculated at 11.5 percent of earnings based on U.S. generally accepted accounting principles with certain adjustments.
Retained earnings include $4.6 million at September 30, 2015, for which no provision for federal income tax has been made. This amount represents deductions for bad debt reserves for tax purposes, which were only allowed to savings institutions that met certain definitional tests prescribed by the Internal Revenue Code of 1986, as amended. The Small Business Job Protection Act of 1996 eliminated the special bad debt deduction granted solely to thrifts. Under the terms of the Act, there would be no recapture of the pre-1988 (base year) reserves. However, these pre-1988 reserves would be subject to recapture under the rules of the Internal Revenue Code if the Bank itself pays a cash dividend in excess of earnings and profits or liquidates. The Act also provides for the recapture of deductions arising from the Bank’s applicable excess reserve, which is defined as the total amount of reserve over the base year reserve. The Bank’s total reserve exceeds the base year reserve, and deferred taxes have been provided for this excess.
| 11. | COMMITMENTS |
In the normal course of business, management makes various commitments that are not reflected in the consolidated financial statements. These commitments involve, to varying degrees, elements of credit and interest rate risk in excess of the amount recognized in the Consolidated Balance Sheet. The Company’s exposure to credit loss in the event of nonperformance by the other parties to the financial instruments is represented by the contractual amounts as disclosed. Losses, if any, are charged to the allowance for loan losses. The Company minimizes its exposure to credit loss under these commitments by subjecting them to credit approval and review procedures and collateral requirements, as deemed necessary, in compliance with lending policy guidelines.
The off-balance sheet commitments consist of the following (in thousands):
| 2015 | 2014 | |||||||
| Commitments to extend credit |
$ | 37,238 | $ | 40,615 | ||||
| Standby letters of credit |
3,231 | 7,521 | ||||||
| Unfunded lines of credit |
43,820 | 44,039 | ||||||
Commitments to extend credit consist of fixed and variable rate commitments with interest rates ranging from 2.90 percent to 5.00 percent. The commitments outstanding at September 30, 2015, contractually mature in less than one year.
F-44
Table of Contents
| 11. | COMMITMENTS (Continued) |
The instruments involve, to varying degrees, elements of credit and interest rate risk in excess of the amount recognized in the Consolidated Balance Sheet. The Company uses the same credit policies in making commitments and conditional obligations as it does for on-balance sheet instruments. The amount of collateral obtained, as deemed necessary, is based upon management’s credit evaluation in compliance with the lending policy guidelines. Since many of the credit line commitments are expected to expire without being fully drawn upon, the total contractual amounts do not necessarily represent future funding requirements.
Standby letters of credit and financial guarantees represent conditional commitments issued to guarantee performance of a customer to a third party. The coverage period for these instruments is typically a one-year period with renewal option subject to prior approval by management. Fees earned from the issuance of these letters are recognized over the coverage period. For secured letters of credit, the collateral is typically Company deposit instruments.
| 12. | LEASE COMMITMENTS AND TOTAL RENTAL EXPENSE |
The Company leases various branch locations and other offices under long-term operating leases. Future minimum lease payments by year and in the aggregate, under noncancellable operating leases with initial or remaining terms of one year or more, consisted of the following at September 30, 2015 (in thousands):
| 2016 |
$ | 607 | ||
| 2017 |
478 | |||
| 2018 |
376 | |||
| 2019 |
332 | |||
| 2020 |
336 | |||
| 2021 and beyond |
1,273 | |||
|
|
|
|||
| Total |
$ | 3,402 | ||
|
|
|
|||
The total rental expenses for the above leases for the years ended September 30, 2015, 2014, and 2013, were $917,000, $952,000, and $913,000, respectively. The Company also operates six offices that currently do not have long-term operating leases.
| 13. | EMPLOYEE BENEFITS |
Employee Stock Ownership Plan (“ESOP”)
The Company created an ESOP for the benefit of employees who meet the eligibility requirements, which include having completed one year of service with the Company or its subsidiary and attained age 21. The ESOP trust acquired 1,358,472 shares of the Company’s stock from proceeds from a loan with the Company. The Company makes cash contributions to the ESOP on an annual basis sufficient to enable the ESOP to make the required loan payments. Cash dividends paid on allocated shares are distributed to participants and cash dividends paid on unallocated shares are used to repay the outstanding debt of the ESOP. The ESOP trust’s outstanding loan bears interest at 3.25 percent and requires an annual payment of principal and interest of $718,000 through December of 2036. The Company’s ESOP, which is internally leveraged, does not report the loans receivable extended to the ESOP as assets and does not report the ESOP debt due to the Company.
F-45
Table of Contents
| 13. | EMPLOYEE BENEFITS (Continued) |
Employee Stock Ownership Plan (“ESOP”) (Continued)
As the debt is repaid, shares are released from the collateral and allocated to qualified employees based on the proportion of payments made during the year to the remaining amount of payments due on the loan through maturity. Accordingly, the shares pledged as collateral are reported as unallocated common stock held by the ESOP shares in the Consolidated Balance Sheet. As shares are released from collateral, the Company reports compensation expense equal to the current market price of the shares, and the shares become outstanding for earnings-per-share computations. The Company recognized ESOP expense of $561,000, $500,000, and $485,000 for the years ended September 30, 2015, 2014, and 2013, respectively.
The following table presents the components of the ESOP shares:
| 2015 | 2014 | |||||||
| Allocated shares |
328,573 | 292,428 | ||||||
| Shares committed to be released |
33,962 | 33,962 | ||||||
| Unreleased shares |
962,251 | 1,007,533 | ||||||
|
|
|
|
|
|||||
| Total ESOP shares |
1,324,786 | 1,333,923 | ||||||
|
|
|
|
|
|||||
| Fair value of unreleased shares (in thousands) |
$ | 12,471 | $ | 11,385 | ||||
|
|
|
|
|
|||||
Equity Incentive Plan
The Company implemented the ESSA Bancorp, Inc. Equity Incentive Plan (the “Plan”). The Plan provides for a total of 2,377,326 shares of common stock for issuance upon the grant or exercise of awards. Of the shares available under the Plan, 1,698,090 may be issued in connection with the exercise of stock options and 679,236 may be issued as restricted stock. The Plan allows for the granting of non-qualified stock options (“NSOs”), incentive stock options (“ISOs”), and restricted stock. Options are granted at no less than the fair value of the Company’s common stock on the date of the grant.
Certain officers, employees, and outside directors were granted in aggregate 1,140,469 NSOs; 317,910 ISOs; and 590,320 shares of restricted stock. Certain officers were granted in aggregate 30,000 shares of restricted stock on April 1, 2013, 19,880 of restricted stock on July 22, 2014 and 21,843 shares of restricted stock on May 20, 2015. In accordance with generally accepted accounting principles, the Company expenses the fair value of all share-based compensation grants over the requisite service periods.
The Company classifies share-based compensation for employees and outside directors within “Compensation and employee benefits” in the consolidated statement of income to correspond with the same line item as compensation paid. Additionally, generally accepted accounting principles require the Company to report: (1) the expense associated with the grants as an adjustment to operating cash flows, and (2) any benefits of realized tax deductions in excess of previously recognized tax benefits on compensation expense as a financing cash flow.
Stock options vested over a five-year service period and expire ten years after grant date. Management recognizes compensation expense for the fair values of these awards, which vested on a straight-line basis over the requisite service period of the awards.
The 2013 restricted shares vested over an 18-month service period. The 2014 restricted shares vest over a 39-month service period. The 2015 restricted shares vest over a 41 month service period. The product of the number of shares granted and the grant date market price of the Company’s common stock determine the fair value of restricted shares under the Company’s restricted stock plan. Management recognizes compensation expense for the fair value of restricted shares on a straight-line basis over the requisite service period for the entire award.
F-46
Table of Contents
| 13. | EMPLOYEE BENEFITS (Continued) |
Equity Incentive Plan (Continued)
During the years ended September 30, 2015, 2014, and 2013, the Company recorded $95,000, $219,000, and $1.5 million of share-based compensation expense, consisting of stock option expense of $0, $0, and $458,000, and restricted stock expense of $95,000, $219,000, and $1.1 million, respectively. Expected future compensation expense relating to the 26,311 restricted shares at September 30, 2015, is $386,000 over the remaining vesting periods of two and three years.
The following is a summary of the Company’s stock option activity and related information for its option plan for the year ended September 30, 2015.
| Number of Stock Options |
Weighted- Average Exercise Price |
Weighted- Average Remaining Contractual Term (in years) |
Aggregate Intrinsic Value (in thousands) |
|||||||||||||
| Outstanding, September 30, 2014 |
1,443,379 | $ | 12.35 | 3.67 | $ | — | ||||||||||
| Granted |
— | — | — | — | ||||||||||||
| Exercised |
(5,000 | ) | 12.35 | 2.67 | — | |||||||||||
| Forfeited |
(123,799 | ) | 12.35 | 2.67 | — | |||||||||||
|
|
|
|||||||||||||||
| Outstanding, September 30, 2015 |
1,314,580 | 12.35 | 2.67 | 802,000 | ||||||||||||
|
|
|
|||||||||||||||
| Exercisable at year-end |
1,314,580 | 12.35 | 2.67 | 802,000 | ||||||||||||
|
|
|
|||||||||||||||
The following is a summary of the status of the Company’s restricted stock as of September 30, 2015, and changes therein during the year then ended:
| Number of Restricted Stock |
Weighted- Average Grant Date Fair Value |
|||||||
| Nonvested at September 30, 2014 |
14,906 | $ | 11.07 | |||||
| Granted |
21,843 | 13.05 | ||||||
| Vested |
(10,438 | ) | 12.11 | |||||
| Forfeited |
— | — | ||||||
|
|
|
|||||||
| Nonvested at September 30, 2015 |
26,311 | 12.30 | ||||||
|
|
|
|||||||
Defined Benefit Plan
The Bank sponsors a trusteed, noncontributory defined benefit pension plan covering substantially all employees and officers. The plan calls for benefits to be paid to eligible employees at retirement based primarily upon years of service with the Bank and compensation rates near retirement. The Bank’s funding policy is to make annual contributions, if needed, based upon the funding formula developed by the plan’s actuary.
F-47
Table of Contents
| 13. | EMPLOYEE BENEFITS (Continued) |
Defined Benefit Plan (Continued)
The following table sets forth the change in plan assets and benefit obligation at September 30 (in thousands):
| 2015 | 2014 | |||||||||||
| Change in benefit obligation: |
||||||||||||
| Benefit obligation at beginning of year |
$ | 18,598 | $ | 14,997 | ||||||||
| Service cost |
873 | 577 | ||||||||||
| Interest cost |
826 | 763 | ||||||||||
| Actuarial losses |
2,124 | 3,383 | ||||||||||
| Benefits paid |
(328 | ) | (1,122 | ) | ||||||||
|
|
|
|
|
|||||||||
| Benefit obligation at end of year |
22,093 | 18,598 | ||||||||||
|
|
|
|
|
|||||||||
| Change in plan assets: |
||||||||||||
| Fair value of plan assets at beginning of year |
17,395 | 16,363 | ||||||||||
| Actual return on plan assets |
(60 | ) | 1,604 | |||||||||
| Contributions |
500 | 550 | ||||||||||
| Benefits paid |
(328 | ) | (1,122 | ) | ||||||||
|
|
|
|
|
|||||||||
| Fair value of plan assets at end of year |
17,507 | 17,395 | ||||||||||
|
|
|
|
|
|||||||||
| Funded status |
$ | (4,586 | ) | $ | (1,203 | ) | ||||||
|
|
|
|
|
|||||||||
| Amounts not yet recognized as a component of net periodic pension cost (in thousands): |
||||||||||||
| 2015 | 2014 | 2013 | ||||||||||
| Amounts recognized in accumulated other comprehensive loss consist of: |
||||||||||||
| Net loss |
$ | 8,068 | $ | 4,891 | $ | 1,979 | ||||||
|
|
|
|
|
|
|
|||||||
The accumulated benefit obligation for the defined benefit pension plan was $16,341,000 and $13,253,000 at September 30, 2015 and 2014, respectively.
F-48
Table of Contents
| 13. | EMPLOYEE BENEFITS (Continued) |
Defined Benefit Plan (Continued)
The following table comprises the components of net periodic benefit cost for the years ended September 30 (in thousands):
| 2015 | 2014 | 2013 | ||||||||||
| Service cost |
$ | 873 | $ | 577 | $ | 702 | ||||||
| Interest cost |
826 | 763 | 716 | |||||||||
| Expected return on plan assets |
(1,233 | ) | (1,162 | ) | (1,034 | ) | ||||||
| Amortization of unrecognized loss |
241 | 28 | 392 | |||||||||
|
|
|
|
|
|
|
|||||||
| Net periodic benefit cost |
$ | 707 | $ | 206 | $ | 776 | ||||||
|
|
|
|
|
|
|
|||||||
The estimated net loss for the defined benefit pension plan that will be amortized from accumulated other comprehensive loss into net periodic benefit cost over the next fiscal year is $477,000.
Weighted-average assumptions used to determine benefit obligations:
| 2015 | 2014 | |||||||
| Discount rate |
4.45 | % | 4.45 | % | ||||
| Rate of compensation increase |
4.00 | 4.00 | ||||||
Weighted-average assumptions used to determine net periodic benefit cost for the years ended:
| 2015 | 2014 | 2013 | ||||||||||
| Discount rate |
4.45 | % | 5.10 | % | 4.15 | % | ||||||
| Expected long-term return on plan assets |
7.00 | 7.00 | 7.00 | |||||||||
| Rate of compensation increase |
4.00 | 4.00 | 4.00 | |||||||||
The expected long-term rate of return was estimated using market benchmarks by which the plan assets would outperform the market in the future, based on historical experience adjusted for changes in asset allocation and expectations for overall lower future returns on similar investments compared with past periods.
Plan Assets
The following tables set forth by level, within the fair value hierarchy, the plan’s financial assets at fair value as of September 30, 2015 and 2014 (in thousands):
| September 30, 2015 | ||||||||||||||||
| Level I | Level II | Level III | Total | |||||||||||||
| Assets: |
||||||||||||||||
| Investment in collective trusts |
||||||||||||||||
| Fixed income |
$ | — | $ | 7,074 | $ | — | $ | 7,074 | ||||||||
| Equity |
— | 10,430 | — | 10,430 | ||||||||||||
| Investment in short-term investments |
— | 3 | — | 3 | ||||||||||||
|
|
|
|
|
|
|
|
|
|||||||||
| Total assets at fair value |
$ | — | $ | 17,507 | $ | — | $ | 17,507 | ||||||||
|
|
|
|
|
|
|
|
|
|||||||||
F-49
Table of Contents
| 13. | EMPLOYEE BENEFITS (Continued) |
Defined Benefit Plan (Continued)
| September 30, 2014 | ||||||||||||||||
| Level I | Level II | Level III | Total | |||||||||||||
| Assets: |
||||||||||||||||
| Investment in collective trusts |
||||||||||||||||
| Fixed income |
$ | — | $ | 6,995 | $ | — | $ | 6,995 | ||||||||
| Equity |
— | 10,385 | — | 10,385 | ||||||||||||
| Investment in short-term investments |
— | 15 | — | 15 | ||||||||||||
|
|
|
|
|
|
|
|
|
|||||||||
| Total assets at fair value |
$ | — | $ | 17,395 | $ | — | $ | 17,395 | ||||||||
|
|
|
|
|
|
|
|
|
|||||||||
Investments in collective trusts and short-term investments are valued at the net asset value of shares held by the plan.
The Bank’s defined benefit pension plan weighted-average asset allocations at September 30, by asset category, are as follows:
| Asset Category |
2015 | 2014 | ||||||
| Cash and fixed income securities |
40.3 | % | 40.2 | % | ||||
| Equity securities |
59.6 | 59.7 | ||||||
| Other |
0.1 | 0.1 | ||||||
|
|
|
|
|
|||||
| Total |
100.0 | % | 100.0 | % | ||||
|
|
|
|
|
|||||
The Bank believes that the plan’s risk and liquidity position are, in large part, a function of the asset class mix. The Bank desires to utilize a portfolio mix that results in a balanced investment strategy. Three asset classes are outlined, as above. The target allocations of these classes are as follows: equity securities, 65 percent, and cash and fixed income securities, 35 percent.
Cash Flows
The Bank expects to contribute $631,000 to its pension plan in 2016.
Estimated future benefit payments, which reflect expected future service, as appropriate, are as follows (in thousands):
| 2016 |
$ | 85 | ||
| 2017 |
92 | |||
| 2018 |
117 | |||
| 2019 |
211 | |||
| 2020 |
284 | |||
| 2021-2025 |
4,447 |
F-50
Table of Contents
| 13. | EMPLOYEE BENEFITS (Continued) |
401(k) Plan
The Bank also has a savings plan qualified under Section 401(k) of the Internal Revenue Code, which covers substantially all employees over 21 years of age. Employees can contribute to the plan, but are not required to. Employer contributions were suspended in January 2011.
Supplemental Executive Retirement Plan
The Bank maintains a salary continuation agreement with certain executives of the Bank, which provides for benefits upon retirement to be paid to the executive for no less than 192 months, unless the executive elects to receive the present value of the payments as a lump sum. The Bank has recorded accruals of $771,000 and $680,000 at September 30, 2015 and 2014, respectively which represent the estimated present value (using a discount rate of 6.00 percent) of the benefits earned under this agreement. There was $91,000 in expense related to the supplemental executive retirement plan for the year ended September 30, 2015. There was no expense related to the supplemental executive retirement plan for the years ended September 30, 2014, and 2013.
| 14. | REGULATORY RESTRICTIONS |
Reserve Requirements
The Bank is required to maintain reserve funds in cash or in deposit with the Federal Reserve Bank. The required reserve at September 30, 2015 and 2014, was $5,212,000 and $7,860,000, respectively.
Dividend Restrictions
Federal banking laws, regulations, and policies limit the Bank’s ability to pay dividends to the Company. Dividends may be declared and paid by the Bank only out of net earnings for the then current year. A dividend may not be declared or paid if it would impair the general reserves of the Bank as required to be maintained under the Pennsylvania Banking.
F-51
Table of Contents
| 15. | REGULATORY CAPITAL REQUIREMENTS |
Federal regulations require the Bank and the Company to maintain certain minimum amounts of capital. Specifically, the Bank and the Company are required to maintain certain minimum dollar amounts and ratios of Total and Tier 1 capital to risk-weighted assets, of Tier 1 capital to average total assets, and common equity Tier 1 capital to risk-weighted assets.
In addition to the capital requirements, the Federal Deposit Insurance Corporation Improvement Act (“FDICIA”) established five capital categories ranging from “well capitalized” to “critically undercapitalized.” Should any institution fail to meet the requirements to be considered “adequately capitalized,” it would become subject to a series of increasingly restrictive regulatory actions. Management believes that, as of September 30, 2015, the Bank met all capital adequacy requirements to which it is subject.
In July of 2013 the respective U.S. federal banking agencies issued final rules implementing Basel III and the Dodd-Frank Act capital requirements to be fully-phased in on a global basis on January 1, 2019. The new regulations established a new tangible common equity capital requirement, increase the minimum requirement for the current Tier 1 risk-weighted asset (“RWA”) ratio, phase out certain kinds of tangibles treated as capital and certain types of instruments and change the risk weightings of certain assets used to determine requirement capital ratios. Provisions of the Dodd-Frank Act generally require these capital rules to apply to bank holding companies and their subsidiaries. The new common equity Tier 1 capital component requires capital of the highest quality-predominantly composed of retained earnings and common stock instruments. For community banks, such as ESSA Bank & Trust, a common equity Tier 1 capital ratio of 4.5% became effective on January 1, 2015. The new capital rules also increased the current minimum of Tier 1 capital ratio from 4.0% to 6.0% beginning on January 1, 2015. In addition, in order to make capital distributions and pay discretionary bonuses to executive officers without restriction, an institution must also maintain greater than 2.5% in common equity attributable to a capital conservation buffer to be phased in from January 1, 2016 until January 1, 2019. The new rules also increase the risk weights for several categories of assets, including an increase from 100% to 150% for certain acquisition, development and construction loans and more than 90-day past due exposures. The new capital rules maintain the general structure of the prompt corrective action rules, but incorporate the new common equity Tier 1 capital requirement and the increased Tier 1 RWA requirement into the prompt corrective action framework.
Bank holding companies are generally subject to statutory capital requirements, which were implemented by certain of the new capital regulations described above that became effective on January 1, 2015. However, the Small Banking Holding Company Policy Statement exempts certain small bank holding companies like the Company from those requirements provided that they meet certain conditions.
As of September 30, 2015 and 2014, the FDIC categorized the Bank and the Federal Reserve categorized the Company as well capitalized under the regulatory framework for prompt corrective action. To be classified as a well-capitalized financial institution, Total risk-based, Tier 1 risk-based and Tier 1 leverage capital must be at least 10 percent, 8 percent, and 5 percent, respectively. There have been no conditions or events since the notification that management believes have changed the Bank’s or the Company’s category.
F-52
Table of Contents
The following table reconciles the Bank’s capital under U.S. generally accepted accounting principles to regulatory capital (in thousands):
| 2015 | 2014 | |||||||
| Total stockholders’ equity |
$ | 167,112 | $ | 164,694 | ||||
| Accumulated other comprehensive loss |
2,395 | 2,579 | ||||||
| Goodwill and certain other intangible assets |
(11,005 | ) | (12,655 | ) | ||||
| Disallowed servicing assets |
— | (69 | ) | |||||
|
|
|
|
|
|||||
| Tier I, common equity and core capital |
158,502 | 154,549 | ||||||
| Allowance for loan losses |
8,971 | 8,218 | ||||||
|
|
|
|
|
|||||
| Total risk-based capital |
$ | 167,473 | $ | 162,767 | ||||
|
|
|
|
|
|||||
F-53
Table of Contents
| 15. | REGULATORY CAPITAL REQUIREMENTS (Continued) |
The Bank’s actual capital ratios are presented in the following table (in thousands):
| 2015 | 2014 | |||||||||||||||
| Amount | Ratio | Amount | Ratio | |||||||||||||
| Total capital |
||||||||||||||||
| Actual |
$ | 167,473 | 16.3 | % | $ | 162,767 | 16.9 | % | ||||||||
| For capital adequacy purposes |
81,956 | 8.0 | 76,898 | 8.0 | ||||||||||||
| To be well capitalized |
102,445 | 10.0 | 96,123 | 10.0 | ||||||||||||
| Tier 1 capital |
||||||||||||||||
| Actual |
$ | 158,502 | 15.5 | % | $ | 154,549 | 16.1 | % | ||||||||
| For capital adequacy purposes |
61,467 | 6.0 | 38,449 | 4.0 | ||||||||||||
| To be well capitalized |
81,956 | 8.0 | 57,674 | 6.0 | ||||||||||||
| Common equity tier 1 capital |
||||||||||||||||
| Actual |
$ | 158,502 | 15.5 | % | $ | n/a | n/a | % | ||||||||
| For capital adequacy purposes |
46,100 | 4.5 | n/a | n/a | ||||||||||||
| To be well capitalized |
66,589 | 6.5 | n/a | n/a | ||||||||||||
| Tier 1 capital |
||||||||||||||||
| Actual |
$ | 158,502 | 10.0 | % | $ | 154,549 | 10.0 | % | ||||||||
| For capital adequacy purposes |
63,195 | 4.0 | 61,579 | 4.0 | ||||||||||||
| To be well capitalized |
78,993 | 5.0 | 76,974 | 5.0 | ||||||||||||
The Company’s ratios do not differ significantly from the Bank’s ratios presented above.
F-54
Table of Contents
| 16. | FAIR VALUE MEASUREMENTS |
The following disclosures show the hierarchal disclosure framework associated within the level of pricing observations utilized in measuring assets and liabilities at fair value. The definition of fair value maintains the exchange price notion in earlier definitions of fair value but focuses on the exit price of the asset or liability. The exit price is the price that would be received to sell the asset or paid to transfer the liability adjusted for certain inherent risks and restrictions.
The following table presents information about the Company’s securities, real estate owned, and impaired loans measured at fair value as of September 30, 2015 and 2014, and indicates the fair value hierarchy of the valuation techniques utilized by the Company to determine such fair value:
| September 30, 2015 | ||||||||||||||||
| Level I | Level II | Level III | Total | |||||||||||||
| Assets measured at fair value on a recurring basis: |
||||||||||||||||
| Investment securities available for sale: |
||||||||||||||||
| Mortgage-backed securities |
$ | — | $ | 237,007 | $ | — | $ | 237,007 | ||||||||
| Obligations of states and political subdivisions |
— | 51,625 | — | 51,625 | ||||||||||||
| U.S. government agency securities |
— | 46,186 | — | 46,186 | ||||||||||||
| Corporate obligations |
— | 20,360 | 2,000 | 22,360 | ||||||||||||
| Trust-preferred securities |
— | — | 1,711 | 1,711 | ||||||||||||
| Other debt securities |
— | 19,993 | 500 | 20,493 | ||||||||||||
| Equity securities - financial services |
25 | — | — | 25 | ||||||||||||
|
|
|
|
|
|
|
|
|
|||||||||
| Total securities |
25 | 375,171 | 4,211 | 379,407 | ||||||||||||
| Assets measured at fair value on a nonrecurring basis: |
||||||||||||||||
| Foreclosed real estate owned |
— | — | 2,480 | 2,480 | ||||||||||||
| Impaired loans |
— | — | 32,303 | 32,303 | ||||||||||||
| Mortgage servicing rights |
— | — | 412 | 412 | ||||||||||||
| September 30, 2014 | ||||||||||||||||
| Level I | Level II | Level III | Total | |||||||||||||
| Assets measured at fair value on a recurring basis: |
||||||||||||||||
| Investment securities available for sale: |
||||||||||||||||
| Mortgage-backed securities |
$ | — | $ | 265,052 | $ | — | $ | 265,052 | ||||||||
| Obligations of states and political subdivisions |
— | 42,771 | — | 42,771 | ||||||||||||
| U.S. government agency securities |
— | 47,630 | — | 47,630 | ||||||||||||
| Corporate obligations |
— | 13,328 | — | 13,328 | ||||||||||||
| Trust-preferred securities |
— | 3,891 | 1,730 | 5,621 | ||||||||||||
| Other debt securities |
— | 6,151 | 500 | 6,651 | ||||||||||||
| Equity securities - financial services |
2,025 | — | — | 2,025 | ||||||||||||
|
|
|
|
|
|
|
|
|
|||||||||
| Total securities |
2,025 | 378,823 | 2,230 | 383,078 | ||||||||||||
| Assets measured at fair value on a nonrecurring basis: |
||||||||||||||||
| Foreclosed real estate owned |
— | — | 2,759 | 2,759 | ||||||||||||
| Impaired loans |
— | — | 36,497 | 36,497 | ||||||||||||
| Mortgage servicing rights |
— | — | 688 | 688 | ||||||||||||
F-55
Table of Contents
| 16. | FAIR VALUE MEASUREMENTS (Continued) |
The following table presents a summary of changes in the fair value of the Company’s Level III investments for the years ended September 30, 2015 and 2014 (in thousands).
| Fair Value Measurement Using Significant Unobservable Inputs (Level III) |
||||||||
| September 30, 2015 | September 30, 2014 | |||||||
| Beginning balance |
$ | 2,230 | $ | 1,800 | ||||
| Purchases, sales, issuances, settlements, net |
2,000 | — | ||||||
| Total unrealized gain: |
||||||||
| Included in earnings |
— | — | ||||||
| Included in other comprehensive income |
(19 | ) | (57 | ) | ||||
| Transfers in and/or out of Level III |
— | 487 | ||||||
|
|
|
|
|
|||||
| $ | 4,211 | $ | 2,230 | |||||
|
|
|
|
|
|||||
Financial assets and liabilities must be identified as having been valued according to a specified level of input, I, II, or III. Level I inputs are quoted prices (unadjusted) in active markets for identical assets or liabilities that the Company has the ability to access at the measurement date. Fair values determined by Level II inputs utilize inputs other than quoted prices included in Level I that are observable for the asset, either directly or indirectly. Level II inputs include quoted prices for similar assets in active markets, and inputs other than quoted prices that are observable for the asset or liability. Level III inputs are unobservable inputs for the asset, and include situations where there is little, if any, market activity for the asset or liability. In certain cases, the inputs used to measure fair value may fall into different levels of the fair value hierarchy. In such cases, the level in the fair value hierarchy, within which the fair value measurement in its entirety falls, has been determined based on the lowest level input that is significant to the fair value measurement in its entirety. The Company’s assessment of the significance of a particular input to the fair value measurement in its entirety requires judgment, and considers factors specific to the asset.
The measurement of fair value should be consistent with one of the following valuation techniques: market approach, income approach, and/or cost approach. The market approach uses prices and other relevant information generated by market transactions involving identical or comparable assets or liabilities (including a business). For example, valuation techniques consistent with the market approach often use market multiples derived from a set of comparables. Multiples might lie in ranges with a different multiple for each comparable. The selection of where within the range the appropriate multiple falls requires judgment, considering factors specific to the measurement (qualitative and quantitative). Valuation techniques consistent with the market approach include matrix pricing. Matrix pricing is a mathematical technique used principally to value debt securities without relying exclusively on quoted prices for the specific securities, but rather by relying on a security’s relationship to other benchmark quoted securities. Most of the securities classified as available for sale are reported at fair value utilizing Level II inputs. For these securities, the Company obtains fair value measurements from an independent pricing service. The fair value measurements consider observable data that may include dealer quoted market spreads, cash flows, the U.S. Treasury yield curve, live trading levels, trade execution data, market consensus prepayment speeds, credit information and the bond’s terms and conditions, among other things. Securities reported at fair value utilizing Level I inputs are limited to actively traded equity securities whose market price is readily available from the New York Stock Exchange or the NASDAQ exchange. Foreclosed real estate is measured at fair value, less cost to sell at the date of foreclosure, valuations are periodically performed by management and the assets are carried at the lower of carrying amount or fair value, less cost to sell. Income and expenses from operations and changes in valuation allowance are included in the net expenses from foreclosed real estate. Impaired loans are reported at fair value utilizing level three inputs. For these loans, a review of the collateral is conducted and an appropriate allowance for loan losses is allocated to the loan. At September 30, 2015, 227 impaired loans with a carrying value of $32.9 million were reduced by specific valuation allowance totaling $568,000 resulting in a net fair value of $32.3 million based on Level III inputs. At September 30, 2014, 264 impaired loans with a carrying value of $37.0 million were reduced by specific valuation allowance totaling $468,000 resulting in a net fair value of $36.5 million based on Level III inputs.
F-56
Table of Contents
| 16. | FAIR VALUE MEASUREMENTS (Continued) |
The following table presents additional quantitative information about assets measured at fair value on a nonrecurring basis and for which the Company has utilized Level III inputs to determine fair value:
| Quantitative Information About Level III Fair Value Measurements | ||||||||||
| Fair Value Estimate |
Valuation Techniques |
Unobservable Input |
Range (Weighted Average) | |||||||
| September 30, 2015 |
||||||||||
| Impaired loans |
$ | 32,303 | Appraisal of collateral (1) | Appraisal adjustments (2) | 0% to 60% (22.3%) | |||||
| Foreclosed real estate owned |
2,480 | Appraisal of collateral (1), (3) | Appraisal adjustments (2) | 20% to 46% (21.3%) | ||||||
| Mortgage servicing rights |
412 | Discounted cash flow | Discount rate | 6% to 11% (10.1%) | ||||||
| Prepayment speeds | 5% to 79% (17.9%) | |||||||||
| September 30, 2014 |
||||||||||
| Impaired loans |
$ | 36,497 | Appraisal of collateral (1) | Appraisal adjustments (2) | 0% to 35% (23%) | |||||
| Foreclosed real estate owned |
2,759 | Appraisal of collateral (1), (3) | Appraisal adjustments (2) | 19% to 35% (21.2%) | ||||||
| Mortgage servicing rights |
688 | Discounted cash flow | Discount rate | 6% to 11% (9.7%) | ||||||
| Prepayment speeds | 7% to 85% (18.5%) | |||||||||
| (1) | Fair value is generally determined through independent appraisals of the underlying collateral, which generally include various Level III inputs which are not identifiable. |
| (2) | Appraisals may be adjusted by management for qualitative factors such as economic conditions and estimated liquidation expenses. The range of liquidation expenses and other appraisal adjustments is presented as a percent of the appraisal. |
| (3) | Includes qualitative adjustments by management and estimated liquidation expenses. |
Investment Securities Available for Sale
The fair value of securities available for sale are determined by obtaining quoted market prices on nationally recognized securities exchanges (Level 1), or matrix pricing (Level 2), which is a mathematical technique used widely in the industry to value debt securities without relying exclusively on quoted market prices for the specific securities but rather by relying on the securities’ relationship to other benchmark quoted prices. For certain securities which are not traded in active markets or are subject to transfer restrictions, valuations are adjusted to reflect illiquidity and/or non-transferability, and such adjustments are generally based on available market evidence (Level 3). In the absence of such evidence, management’s best estimate is used. Management’s best estimate consists of both internal and external support on certain Level 3 investments. Internal cash flow models using a present value formula that includes assumptions market participants would use along with indicative exit pricing obtained from broker/dealers (where available) are used to support fair values of certain Level 3 investments, if applicable.
F-57
Table of Contents
| 16. | FAIR VALUE MEASUREMENTS (Continued) |
Impaired Loans
The Company has measured impairment on impaired loans generally based on the fair value of the loan’s collateral. Evaluating impaired loan collateral is based on Level II inputs utilizing outside appraisals. Those impaired loans for which management incorporates significant adjustments for sales costs and other discount assumptions regarding market conditions are considered Level III fair values. The fair value consists of the loan balances of $32.9 million less their valuation allowances of $568,000 at September 30, 2015. The fair value consists of the loan balances of $37.0 million less their valuation allowances of $468,000 at September 30, 2014.
Foreclosed Real Estate Owned
Foreclosed real estate owned is measured at fair value, less cost to sell at the date of foreclosure; valuations are periodically performed by management; and the assets are carried at fair value, less cost to sell. Income and expenses from operations and changes in valuation allowance are included in the net expenses from foreclosed real estate.
| 17. | FAIR VALUE OF FINANCIAL INSTRUMENTS |
The fair values of the Company’s financial instruments are as follows (in thousands):
| September 30, 2015 | ||||||||||||||||||||
| Carrying Value |
Level I | Level II | Level III | Total Fair Value |
||||||||||||||||
| Financial assets: |
||||||||||||||||||||
| Cash and cash equivalents |
$ | 18,758 | $ | 18,758 | $ | — | $ | — | $ | 18,758 | ||||||||||
| Certificates of deposit |
1,750 | — | — | 1,774 | 1,774 | |||||||||||||||
| Investment and mortgage-backed securities available for sale |
379,407 | 25 | 375,171 | 4,211 | 379,407 | |||||||||||||||
| Loans receivable, net |
1,102,118 | — | — | 1,123,436 | 1,123,436 | |||||||||||||||
| Accrued interest receivable |
5,068 | 5,068 | — | — | 5,068 | |||||||||||||||
| Regulatory stock |
13,831 | 13,831 | — | — | 13,831 | |||||||||||||||
| Mortgage servicing rights |
412 | — | — | 412 | 412 | |||||||||||||||
| Bank-owned life insurance |
30,655 | 30,655 | — | — | 30,655 | |||||||||||||||
| Financial liabilities: |
||||||||||||||||||||
| Deposits |
$ | 1,096,754 | $ | 500,427 | $ | — | $ | 600,250 | $ | 1,100,677 | ||||||||||
| Short-term borrowings |
91,339 | 91,339 | — | — | 91,339 | |||||||||||||||
| Other borrowings |
229,101 | — | — | 230,255 | 230,255 | |||||||||||||||
| Advances by borrowers for taxes and insurance |
4,273 | 4,273 | — | — | 4,273 | |||||||||||||||
| Accrued interest payable |
866 | 866 | — | — | 866 | |||||||||||||||
F-58
Table of Contents
| 17. | FAIR VALUE OF FINANCIAL INSTRUMENTS (Continued) |
| September 30, 2014 | ||||||||||||||||||||
| Carrying Value |
Level I | Level II | Level III | Total Fair Value |
||||||||||||||||
| Financial assets: |
||||||||||||||||||||
| Cash and cash equivalents |
$ | 22,301 | $ | 22,301 | $ | — | $ | — | $ | 22,301 | ||||||||||
| Certificates of deposit |
1,767 | — | — | 1,785 | 1,785 | |||||||||||||||
| Investment and mortgage-backed securities available for sale |
383,078 | 2,025 | 378,823 | 2,230 | 383,078 | |||||||||||||||
| Loans receivable, net |
1,058,267 | — | — | 1,077,585 | 1,077,585 | |||||||||||||||
| Accrued interest receivable |
5,061 | 5,061 | — | — | 5,061 | |||||||||||||||
| Regulatory stock |
14,284 | 14,284 | — | — | 14,284 | |||||||||||||||
| Mortgage servicing rights |
688 | — | — | 688 | 688 | |||||||||||||||
| Bank-owned life insurance |
29,720 | 29,720 | — | — | 29,720 | |||||||||||||||
| Financial liabilities: |
||||||||||||||||||||
| Deposits |
$ | 1,133,889 | $ | 526,876 | $ | — | $ | 608,936 | $ | 1,135,812 | ||||||||||
| Short-term borrowings |
108,020 | 108,020 | — | — | 108,020 | |||||||||||||||
| Other borrowings |
151,300 | — | — | 151,617 | 151,617 | |||||||||||||||
| Advances by borrowers for taxes and insurance |
4,093 | 4,093 | — | — | 4,093 | |||||||||||||||
| Accrued interest payable |
831 | 831 | — | — | 831 | |||||||||||||||
Financial instruments are defined as cash, evidence of an ownership interest in an entity, or a contract which creates an obligation or right to receive or deliver cash or another financial instrument from/to a second entity on potentially favorable or unfavorable terms.
Fair value is defined as the amount at which a financial instrument could be exchanged in a current transaction between willing parties other than in a forced or liquidation sale. If a quoted market price is available for a financial instrument, the fair value would be calculated based upon the market price per trading unit of the instrument.
F-59
Table of Contents
| 17. | FAIR VALUE OF FINANCIAL INSTRUMENTS (Continued) |
If no readily available market exists, the fair value for financial instruments should be based upon management’s judgment regarding current economic conditions, interest rate risk, expected cash flows, future estimated losses, and other factors as determined through various option pricing formulas or simulation modeling.
As many of these assumptions result from judgments made by management based upon estimates which are inherently uncertain, the resulting values may not be indicative of the amount realizable in the sale of a particular financial instrument. In addition, changes in the assumptions on which the values are based may have a significant impact on the resulting estimated values.
As certain assets and liabilities, such as deferred tax assets, premises and equipment, and many other operational elements of the Company, are not considered financial instruments but have value, this fair value of financial instruments would not represent the full market value of the Company.
The Company employed simulation modeling in determining the fair value of financial instruments for which quoted market prices were not available based upon the following assumptions:
Cash and Cash Equivalents, Accrued Interest Receivable, Short-Term Borrowings, Advances by Borrowers for Taxes and Insurance, and Accrued Interest Payable
The fair value approximates the current book value.
Bank-Owned Life Insurance
The fair value is equal to the cash surrender value of the bank-owned life insurance.
Investment and Mortgage-Backed Securities Available for Sale and Regulatory Stock
The fair value of investment and mortgage-backed securities available for sale is equal to the available quoted market price. If no quoted market price is available, fair value is estimated using the quoted market price for similar securities. Since the regulatory stock is not actively traded on a secondary market and held exclusively by member financial institutions, the fair market value approximates the carrying amount.
Certificates of Deposit, Loans Receivable, Deposits, Other Borrowings, and Mortgage Servicing Rights
The fair values for loans and mortgage servicing rights are estimated by discounting contractual cash flows and adjusting for prepayment estimates. Discount rates are based upon rates generally charged for such loans with similar characteristics. Demand, savings, and money market deposit accounts are valued at the amount payable on demand as of year-end. Fair values for certificates of deposit, time deposits, and other borrowings are estimated using a discounted cash flow calculation that applies contractual costs currently being offered in the existing portfolio to current market rates being offered for deposits and borrowings of similar remaining maturities.
Commitments to Extend Credit
These financial instruments are generally not subject to sale, and fair values are not readily available. The carrying value, represented by the net deferred fee arising from the unrecognized commitment, and the fair value, determined by discounting the remaining contractual fee over the term of the commitment using fees currently charged to enter into similar agreements with similar credit risk, are not considered material for disclosure. The contractual amounts of unfunded commitments are presented in Note 11.
F-60
Table of Contents
| 18. | SUBSEQUENT EVENTS |
Acquisition of Eagle National Bancorp, Inc.
On July 29, 2015, ESSA and Eagle National Bancorp, Inc. (“Eagle”) issued a press release announcing the signing of an Agreement and Plan of Merger (the “Merger Agreement”) by and among ESSA and Eagle pursuant to which ESSA will acquire Eagle and its wholly-owned subsidiary, Eagle National Bank.
Under the terms of the Merger Agreement, ESSA has agreed to pay $5.80 in cash for each of the 4,250,820 outstanding Eagle common shares. The aggregate cash consideration to be paid by ESSA in respect of the outstanding Eagle common shares and the cash-out of outstanding Eagle stock options is approximately $24.7 million.
It is anticipated that Eagle National Bank will be merged with and into ESSA upon completion of the transaction. At that time, Eagle National’s banking offices located in Chester and Delaware counties will become branches of ESSA. As of September 30, 2015, Eagle and ESSA had total consolidated assets of $1.8 billion, total loans of $1.2 billion and total deposits of $1.3 billion.
ESSA has received regulatory approval of the merger from the Federal Deposit Insurance Corporation and the Pennsylvania Department of Banking and Securities and the shareholders of Eagle have also approved the merger. The transaction closed at the close of business of December 4, 2015. Management is still in the process of determining the fair value adjustments that will be applied as part of the business combination accounting. As such, neither the selected pro forma balance sheet information nor the selected pro forma income statement information presented as follows includes the impact of fair value adjustments.
ESSA Bancorp, Inc. and Eagle National Bancorp, Inc.
Pro Forma Selected Balance Sheet Items (unaudited)
| September 30, 2015 | September 30, 2014 | |||||||
| ASSETS |
||||||||
| Cash and due from financial institutions |
$ | 11,530 | $ | 27,278 | ||||
| Securities available for sale |
418,814 | 416,251 | ||||||
| Loans, net of allowance |
1,227,591 | 1,187,475 | ||||||
| Premises and equipment, net |
17,191 | 17,790 | ||||||
| LIABILITIES |
||||||||
| Total deposits |
1,254,275 | 1,297,996 | ||||||
| Federal Home Loan Bank advances |
320,440 | 259,320 | ||||||
| Securities sold under agreements to repurchase |
1,052 | 1,605 | ||||||
| SHAREHOLDERS’ EQUITY |
||||||||
| Total shareholders’ equity |
171,280 | 167,309 | ||||||
F-61
Table of Contents
| 18. | SUBSEQUENT EVENTS (Continued) |
The following table presents financial information regarding the former Franklin Security Bancorp, Inc. (see Note 22) and Eagle National Bancorp, Inc. The table has been prepared for comparative purposes only and is not necessarily indicative of actual results that would have been attained had the acquisition occurred as of the beginning of the periods presented, nor is it indicative of future results.
ESSA Bancorp, Inc., Eagle National Bancorp, Inc. and Franklin Security Bancorp, Inc.
Pro Forma Condensed Income Statement (unaudited)
| September 30, 2015 | September 30, 2014 | |||||||
| Net interest income |
$ | 50,238 | $ | 49,734 | ||||
| Total noninterest income |
8,628 | 8,298 | ||||||
| Net income |
$ | 9,804 | $ | 7,706 | ||||
| Earnings per share, basic |
$ | 0.94 | $ | 0.71 | ||||
| Earnings per share, diluted |
$ | 0.93 | $ | 0.71 | ||||
F-62
Table of Contents
| 19. | ACCUMULATED OTHER COMPREHENSIVE INCOME (LOSS) |
The activity in accumulated other comprehensive income (loss) for the years ended September 30, 2015 and 2014, is as follows (in thousands):
| Accumulated Other Comprehensive Income (Loss) (1) | ||||||||||||
| Defined Benefit Pension Plan |
Unrealized Gains (Losses) on Securities Available for Sale |
Total | ||||||||||
| Balance at September 30, 2014 |
$ | (3,228 | ) | $ | 649 | $ | (2,579 | ) | ||||
| Other comprehensive income before reclassifications |
— | 2,799 | 2,799 | |||||||||
| Amounts reclassified from accumulated other comprehensive loss |
(2,097 | ) | (518 | ) | (2,615 | ) | ||||||
|
|
|
|
|
|
|
|||||||
| Period change |
(2,097 | ) | 2,281 | 184 | ||||||||
|
|
|
|
|
|
|
|||||||
| Balance at September 30, 2015 |
$ | (5,325 | ) | $ | 2,930 | $ | (2,395 | ) | ||||
|
|
|
|
|
|
|
|||||||
| Balance at September 30, 2013 |
$ | (1,306 | ) | $ | 71 | $ | (1,235 | ) | ||||
| Other comprehensive income before reclassifications |
— | 798 | 798 | |||||||||
| Amounts reclassified from accumulated other comprehensive loss |
(1,922 | ) | (220 | ) | (2,142 | ) | ||||||
|
|
|
|
|
|
|
|||||||
| Period change |
(1,922 | ) | 578 | (1,344 | ) | |||||||
|
|
|
|
|
|
|
|||||||
| Balance at September 30, 2014 |
$ | (3,228 | ) | $ | 649 | $ | (2,579 | ) | ||||
|
|
|
|
|
|
|
|||||||
| (1) | All amounts are net of tax. Related income tax expense or benefit is calculated using an income tax rate approximating 34%. |
F-63
Table of Contents
| 19. | ACCUMULATED OTHER COMPREHENSIVE INCOME (Continued) |
| Details About Accumulated Other Comprehensive Loss Components |
Amount Reclassified from Accumulated Other Comprehensive Loss For the Year Ended September 30, (3) |
Affected Line Item in the Consolidated Statement of Income | ||||||||
| (in thousands) |
2015 | 2014 | ||||||||
| Securities available for sale (1): |
||||||||||
| Net securities gains reclassified into earnings |
$ | 786 | $ | 333 | Gain on sale of investments, net | |||||
| Related income tax expense |
(268 | ) | (113 | ) | Income taxes | |||||
|
|
|
|
|
|||||||
| Net effect on accumulated other comprehensive loss for the period |
518 | 220 | Net of tax | |||||||
|
|
|
|
|
|||||||
| Defined benefit pension plan (2): |
||||||||||
| Amortization of net (loss) gain and prior service costs |
3,177 | 2,912 | Compensation and employee benefits | |||||||
| Related income tax expense |
(1,080 | ) | (990 | ) | Income taxes | |||||
|
|
|
|
|
|||||||
| Net effect on accumulated other comprehensive loss for the period |
2,097 | 1,922 | Net of tax | |||||||
|
|
|
|
|
|||||||
| Total reclassifications for the period |
$ | 2,615 | $ | 2,142 | Net of tax | |||||
|
|
|
|
|
|||||||
| (1) | For additional details related to unrealized gains on securities and related amounts reclassified from accumulated other comprehensive loss see Note 3, “Investment Securities.” |
| (2) | Included in the computation of net periodic pension cost. See Note 13, “Employee Benefits” for additional detail. |
| (3) | Amounts in parenthesis indicate debits. |
F-64
Table of Contents
| 20. | PARENT COMPANY |
Condensed financial statements of ESSA Bancorp, Inc. are as follows (in thousands):
CONDENSED BALANCE SHEET
| September 30, | ||||||||
| 2015 | 2014 | |||||||
| ASSETS |
||||||||
| Cash and due from banks |
$ | 2,258 | $ | 758 | ||||
| Certificates of deposit |
— | 17 | ||||||
| Investment securities available for sale |
25 | 25 | ||||||
| Investment in subsidiary |
167,112 | 164,694 | ||||||
| Premises and equipment, net |
1,144 | 1,127 | ||||||
| Other assets |
801 | 784 | ||||||
|
|
|
|
|
|||||
| TOTAL ASSETS |
$ | 171,340 | $ | 167,405 | ||||
|
|
|
|
|
|||||
| LIABILITIES AND STOCKHOLDERS’ EQUITY |
||||||||
| Other liabilities |
$ | 60 | $ | 96 | ||||
| Stockholders’ equity |
171,280 | 167,309 | ||||||
|
|
|
|
|
|||||
| TOTAL LIABILITIES AND STOCKHOLDERS’ EQUITY |
$ | 171,340 | $ | 167,405 | ||||
|
|
|
|
|
|||||
CONDENSED STATEMENT OF INCOME
| Year Ended September 30, | ||||||||||||
| 2015 | 2014 | 2013 | ||||||||||
| INCOME |
||||||||||||
| Interest income |
$ | 376 | $ | 381 | $ | 408 | ||||||
| Net gains on sale of investments |
— | — | 30 | |||||||||
| Dividends |
8,000 | 27,000 | 15,000 | |||||||||
|
|
|
|
|
|
|
|||||||
| Total income |
8,376 | 27,381 | 15,438 | |||||||||
|
|
|
|
|
|
|
|||||||
| EXPENSES |
||||||||||||
| Professional fees |
755 | 1,091 | 505 | |||||||||
| Other |
64 | 453 | 527 | |||||||||
|
|
|
|
|
|
|
|||||||
| Total expenses |
819 | 1,544 | 1,032 | |||||||||
|
|
|
|
|
|
|
|||||||
| Income before income tax expense |
7,557 | 25,837 | 14,406 | |||||||||
| Income tax benefit |
(118 | ) | (905 | ) | — | |||||||
|
|
|
|
|
|
|
|||||||
| Income before equity in undistributed net earnings of subsidiary |
7,675 | 26,742 | 14,406 | |||||||||
| Equity in undistributed net earnings of subsidiary |
2,116 | (18,238 | ) | (5,583 | ) | |||||||
|
|
|
|
|
|
|
|||||||
| NET INCOME |
$ | 9,791 | $ | 8,504 | $ | 8,823 | ||||||
|
|
|
|
|
|
|
|||||||
| COMPREHENSIVE INCOME |
$ | 9,975 | $ | 7,160 | $ | 5,830 | ||||||
|
|
|
|
|
|
|
|||||||
F-65
Table of Contents
| 20. | PARENT COMPANY (Continued) |
CONDENSED STATEMENT OF CASH FLOWS
| Year Ended September 30, | ||||||||||||
| 2015 | 2014 | 2013 | ||||||||||
| OPERATING ACTIVITIES |
||||||||||||
| Net income |
$ | 9,791 | $ | 8,504 | $ | 8,823 | ||||||
| Adjustments to reconcile net income to net cash provided by operating activities: |
||||||||||||
| Equity in undistributed net earnings of subsidiary |
(2,116 | ) | 18,238 | 5,583 | ||||||||
| Provision for depreciation |
24 | — | — | |||||||||
| Net gains on sale of investments |
— | — | (30 | ) | ||||||||
| (Decrease) increase in accrued income taxes |
40 | (888 | ) | (12 | ) | |||||||
| Decrease in accrued interest receivable |
8 | 8 | 8 | |||||||||
| Deferred federal income taxes |
(3 | ) | 1,480 | (29 | ) | |||||||
| Other, net |
458 | (634 | ) | 798 | ||||||||
|
|
|
|
|
|
|
|||||||
| Net cash provided by operating activities |
8,202 | 26,708 | 15,141 | |||||||||
|
|
|
|
|
|
|
|||||||
| INVESTING ACTIVITIES |
||||||||||||
| Certificate of deposit maturities |
17 | — | — | |||||||||
| Business acquisitions |
— | (15,174 | ) | — | ||||||||
| Purchase of premises, equipment and software |
(41 | ) | — | — | ||||||||
| Proceeds from principal repayment, maturities, and sales |
— | — | 1,200 | |||||||||
|
|
|
|
|
|
|
|||||||
| Net cash provided by (used for) investing activities |
(24 | ) | (15,174 | ) | 1,200 | |||||||
|
|
|
|
|
|
|
|||||||
| FINANCING ACTIVITIES |
||||||||||||
| Repayment of trust-preferred debt |
— | (6,955 | ) | — | ||||||||
| Purchase of treasury stock shares |
(3,132 | ) | (4,216 | ) | (14,501 | ) | ||||||
| Dividends on common stock |
(3,546 | ) | (2,800 | ) | (2,295 | ) | ||||||
|
|
|
|
|
|
|
|||||||
| Net cash used for financing activities |
(6,678 | ) | (13,971 | ) | (16,796 | ) | ||||||
|
|
|
|
|
|
|
|||||||
| Increase (decrease) in cash |
1,500 | (2,437 | ) | (455 | ) | |||||||
| CASH AT BEGINNING OF YEAR |
758 | 3,195 | 3,650 | |||||||||
|
|
|
|
|
|
|
|||||||
| CASH AT END OF YEAR |
$ | 2,258 | $ | 758 | $ | 3,195 | ||||||
|
|
|
|
|
|
|
|||||||
F-66
Table of Contents
| 21. | SELECTED QUARTERLY DATA (UNAUDITED) |
| Three Months Ended | ||||||||||||||||
| December 31, 2014 |
March 31, 2015 |
June 30, 2015 |
September 30, 2015 |
|||||||||||||
| Total interest income |
$ | 13,708 | $ | 13,580 | $ | 13,568 | $ | 13,323 | ||||||||
| Total interest expense |
2,658 | 2,578 | 2,557 | 2,597 | ||||||||||||
|
|
|
|
|
|
|
|
|
|||||||||
| Net interest income |
11,050 | 11,002 | 11,011 | 10,726 | ||||||||||||
| Provision for loan losses |
450 | 525 | 525 | 575 | ||||||||||||
|
|
|
|
|
|
|
|
|
|||||||||
| Net interest income after provision for loan losses |
10,600 | 10,477 | 10,486 | 10,151 | ||||||||||||
| Total noninterest income |
1,814 | 1,901 | 1,948 | 2,233 | ||||||||||||
| Total noninterest expense |
8,966 | 9,098 | 9,359 | 9,442 | ||||||||||||
|
|
|
|
|
|
|
|
|
|||||||||
| Income before income taxes |
3,448 | 3,280 | 3,075 | 2,942 | ||||||||||||
| Income taxes expense |
852 | 848 | 618 | 636 | ||||||||||||
|
|
|
|
|
|
|
|
|
|||||||||
| Net income |
$ | 2,596 | $ | 2,432 | $ | 2,457 | $ | 2,306 | ||||||||
|
|
|
|
|
|
|
|
|
|||||||||
| Per share data: |
||||||||||||||||
| Net income |
||||||||||||||||
| Basic |
$ | 0.25 | $ | 0.23 | $ | 0.24 | $ | 0.22 | ||||||||
| Diluted |
$ | 0.25 | $ | 0.23 | $ | 0.23 | $ | 0.22 | ||||||||
| Average shares outstanding |
||||||||||||||||
| Basic |
10,516,097 | 10,442,310 | 10,431,461 | 10,426,195 | ||||||||||||
| Diluted |
10,516,097 | 10,521,147 | 10,565,123 | 10,550,243 | ||||||||||||
| Three Months Ended | ||||||||||||||||
| December 31, 2013 |
March 31, 2014 |
June 30, 2014 |
September 30, 2014 |
|||||||||||||
| Total interest income |
$ | 12,182 | $ | 11,523 | $ | 13,785 | $ | 13,286 | ||||||||
| Total interest expense |
2,691 | 2,585 | 2,688 | 2,663 | ||||||||||||
|
|
|
|
|
|
|
|
|
|||||||||
| Net interest income |
9,491 | 8,938 | 11,097 | 10,623 | ||||||||||||
| Provision for loan losses |
750 | 750 | 500 | 350 | ||||||||||||
|
|
|
|
|
|
|
|
|
|||||||||
| Net interest income after provision for loan losses |
8,741 | 8,188 | 10,597 | 10,273 | ||||||||||||
| Total noninterest income |
1,627 | 1,752 | 2,100 | 1,929 | ||||||||||||
| Total noninterest expense |
7,748 | 7,884 | 9,095 | 9,085 | ||||||||||||
|
|
|
|
|
|
|
|
|
|||||||||
| Income before income taxes |
2,620 | 2,056 | 3,602 | 3,117 | ||||||||||||
| Income taxes benefit |
616 | 554 | 976 | 745 | ||||||||||||
|
|
|
|
|
|
|
|
|
|||||||||
| Net income |
$ | 2,004 | $ | 1,502 | $ | 2,626 | $ | 2,372 | ||||||||
|
|
|
|
|
|
|
|
|
|||||||||
| Per share data: |
||||||||||||||||
| Net income |
||||||||||||||||
| Basic |
$ | 0.18 | $ | 0.14 | $ | 0.24 | $ | 0.22 | ||||||||
| Diluted |
$ | 0.18 | $ | 0.14 | $ | 0.24 | $ | 0.22 | ||||||||
| Average shares outstanding |
||||||||||||||||
| Basic |
10,890,156 | 10,859,519 | 10,837,592 | 10,672,848 | ||||||||||||
| Diluted |
10,906,229 | 10,859,703 | 10,837,592 | 10,687,163 | ||||||||||||
F-67
Table of Contents
| 22. | ACQUISITIONS |
Acquisition of FNCB Branch
On January 24, 2014, the Company closed on a purchase transaction to acquire a branch facility, customer deposits, and loans of First National Community Bank (“FNCB”), the subsidiary of First National Community Bancorp, Inc., in a cash transaction. The acquired branch is located in the Monroe County, Pennsylvania market. Under the terms of the agreement, the Company acquired all of the branch facilities, customer deposits and loans of FNCB and received net cash of $4.6 million.
The acquired assets and assumed liabilities were measured at fair values. Management made significant estimates and exercised significant judgment in accounting for the acquisition. Management measured loan fair values based on loan file reviews (including borrower financial statements or tax returns), appraised collateral values, expected cash flows and historical loss factors of FNCB. Real estate acquired through foreclosure was primarily valued based on appraised collateral values.
The business combination resulted in the acquisition of loans without evidence of credit quality deterioration. FNCB’s loans were fair valued by discounting both expected principal and interest cash flows using an observable discount rate for similar instruments that a market participant would consider in determining fair value. Additionally, consideration was given to management’s best estimates of default rates and payment speeds. At acquisition, FNCB’s loan portfolio without evidence of deterioration totaled $1.0 million and was recorded at a fair value of $1.0 million.
| Total purchase price |
$ | 4,640 | ||
| Net cash acquired: |
||||
| Cash |
$ | 11 | ||
| Loans receivable and accrued interest receivable |
1,033 | |||
| Premises and equipment, net |
1,626 | |||
| Certificates of deposits |
(3,069 | ) | ||
| Deposits other than certificates of deposits |
(5,683 | ) | ||
|
|
|
|||
| (6,082 | ) | |||
|
|
|
|||
| Goodwill resulting from FNCB purchase |
$ | 1,442 | ||
|
|
|
|||
Supplemental pro forma financial information related to the FNCB acquisition has not been provided as it would be impracticable to do so. Historical financial information regarding the acquired branch is not accessible and, thus, the amounts would require estimates so significant as to render the disclosure irrelevant.
F-68
Table of Contents
| 22. | ACQUISITIONS (Continued) |
Acquisition of Franklin Security Bancorp, Inc.
On April 4, 2014, the Company closed on a merger transaction to acquire Franklin Security Bancorp, Inc., the parent company of Franklin Security Bank, in a cash transaction. Under the terms of the merger agreement, the Company acquired all of the outstanding shares of Franklin Security Bancorp, Inc. for a total cash purchase price of approximately $15.7 million. Franklin Security Bank has been merged into ESSA Bank & Trust, with ESSA Bank & Trust as the surviving entity. The acquisition added two branch locations in the Scranton/Wilkes-Barre, Pennsylvania, market, establishing the Company’s presence in that market.
The acquired assets and assumed liabilities were measured at fair values. Management made significant estimates and exercised significant judgment in accounting for the acquisition. Management measured loan fair values based on loan file reviews (including borrower financial statements or tax returns), appraised collateral values, expected cash flows, and historical loss factors of Franklin Security Bank. Real estate acquired through foreclosure was primarily valued based on appraised collateral values. The Company also recorded an identifiable intangible asset representing the core deposit base of Franklin Security Bank based on management’s evaluation of the cost of such deposits relative to alternative funding sources. Management used market quotations to measure the fair value of investment securities and FHLB advances. The business combination resulted in the acquisition of loans without evidence of credit quality deterioration. At the acquisition date, the Company determined that there were no purchased impaired loans. The method of measuring carrying value of purchased loans differs from loans originated by the Company (originated loans), and as such, the Company identifies purchased loans and purchased loans with a credit quality discount and originated loans at amortized cost.
Franklin Security Bank’s loans without evidence of credit deterioration were measured to fair value by discounting both expected principal and interest cash flows using an observable discount rate for similar instruments that a market participant would consider in determining fair value. Additionally, consideration was given to management’s best estimates of default rates and payment speeds. At acquisition, Franklin Security Bank’s loan portfolio without evidence of deterioration totaled $155.3 million and was recorded at a fair value of $152.2 million.
F-69
Table of Contents
| 22. | ACQUISITIONS (Continued) |
Acquisition of Franklin Security Bancorp, Inc. (Continued)
The following condensed statement reflects the values assigned to Franklin Security Bancorp, Inc.’s net assets as of the acquisition date:
| Total purchase price |
$ | 15,698 | ||
| Net assets acquired: |
||||
| Cash |
$ | (19,825 | ) | |
| Investments available for sale |
55,901 | |||
| Loans receivable |
152,188 | |||
| Regulatory stock |
1,569 | |||
| Premises and equipment, net |
176 | |||
| Foreclosed real estate |
436 | |||
| Intangible assets |
889 | |||
| Deferred tax assets |
1,031 | |||
| Other assets |
2,504 | |||
| Certificates of deposits |
(90,869 | ) | ||
| Deposits other than certificates of deposits |
(71,317 | ) | ||
| Borrowings |
(30,177 | ) | ||
| Other liabilities |
(2,265 | ) | ||
|
|
|
|||
| Gain resulting from Franklin Security Bancorp, Inc. acquisition |
$ | 241 | ||
|
|
|
|||
F-70
Table of Contents
SIGNATURES
Pursuant to the requirements of Section 13 or 15(d) of the Securities Exchange Act of 1934, the Registrant has duly caused this report to be signed on its behalf by the undersigned, thereunto duly authorized.
| ESSA BANCORP, INC. | ||||||
| December 14, 2015 | By: | /s/ Gary S. Olson | ||||
| Gary S. Olson President and Chief Executive Officer (Duly Authorized Representative) | ||||||
Pursuant to the requirements of the Securities Exchange of 1934, this report has been signed below by the following persons on behalf of the Registrant and in the capacities and on the dates indicated.
| Signatures | Title | Date | ||
| /s/ Gary S. Olson Gary S. Olson |
President, Chief Executive Officer and Director |
December 14, 2015 | ||
| /s/ Allan A. Muto Allan A. Muto |
Executive Vice President and Chief Financial Officer |
December 14, 2015 | ||
| /s/ William P. Douglass William P. Douglass |
Chairman of the Board |
December 14, 2015 | ||
| /s/ Timothy S. Fallon Timothy S. Fallon |
Director |
December 14, 2015 | ||
| /s/ Daniel J. Henning Daniel J. Henning |
Director |
December 14, 2015 | ||
| /s/ Philip H. Hosbach IV Philip H. Hosbach IV |
Director |
December 14, 2015 | ||
| /s/ Frederick E. Kutteroff Frederick E. Kutteroff |
Director |
December 14, 2015 | ||
| /s/ Brian T. Regan Brian T. Regan |
Director |
December 14, 2015 | ||
| /s/ Robert C. Selig, Jr. Robert C. Selig, Jr. |
Director |
December 14, 2015 | ||
| /s/ William A. Viechnicki, D.D.S. William A. Viechnicki, D.D.S. |
Director |
December 14, 2015 | ||
| /s/ Elizabeth B. Weekes Elizabeth B. Weekes |
Director |
December 14, 2015 | ||