Attached files
| file | filename |
|---|---|
| 8-K/A - 8-K/A - US ECOLOGY, INC. | usecology_8ka.htm |
Exhibit 99.2

1 US Ecology, Inc. Q4 2014 Earnings Conference Call February 27, 2015* *Presentation was amended and refiled on March 2, 2015

2 Today’s Hosts Jeff Feeler President & Chief Executive Officer Eric Gerratt Executive Vice President & Chief Financial Officer Steve Welling Executive Vice President of Sales and Marketing Simon Bell Executive Vice President of Operations – Environmental Services Mario Romero Executive Vice President of Operations – Field and Industrial Services 2

3 During the course of this presentation the Company will be making forward - looking statements (as such term is defined in the Private Securities Litigation Reform Act of 1995 ) that are based on our current expectations, beliefs and assumptions about the industry and markets in which US Ecology, Inc . and its subsidiaries operate . Such statements may include, but are not limited to, statements about the Company's ability to integrate its acquisition of EQ — The Environmental Quality Company (EQ), expected synergies from the transaction, projections of the financial results of the combined company and other statements that are not historical facts . Such statements involve known and unknown risks, uncertainties and other factors that could cause the actual results of the Company to differ materially from the results expressed or implied by such statements, including general economic and business conditions, conditions affecting the industries served by US Ecology, EQ and their respective subsidiaries, conditions affecting our customers and suppliers, competitor responses to our products and services, the overall market acceptance of such products and services, the integration and performance of acquisitions (including the acquisition of EQ) and other factors disclosed in the Company's periodic reports filed with the Securities and Exchange Commission . For information on other factors that could cause actual results to differ materially from expectations, please refer to US Ecology, Inc . 's December 31 , 2013 Annual Report on Form 10 - K and other reports filed with the Securities and Exchange Commission . Many of the factors that will determine the Company's future results are beyond the ability of management to control or predict . Readers should not place undue reliance on forward - looking statements, which reflect management's views only as of the date such statements are made . The Company undertakes no obligation to revise or update any forward - looking statements, or to make any other forward - looking statements, whether as a result of new information, future events or otherwise . Important assumptions and other important factors that could cause actual results to differ materially from those set forth in the forward - looking information include a loss of a major customer or contract, compliance with and changes to applicable laws, rules, or regulations, access to cost effective transportation services, access to insurance, surety bonds and other financial assurances, loss of key personnel, lawsuits, labor disputes, adverse economic conditions, government funding or competitive pressures, incidents or adverse weather conditions that could limit or suspend specific operations, implementation of new technologies, market conditions, average selling prices for recycled materials, our ability to replace business from recently completed large projects, our ability to perform under required contracts, our ability to permit and contract for timely construction of new or expanded disposal cells, our willingness or ability to pay dividends and our ability to effectively close, integrate and realize anticipated synergies from future acquisitions, which can be impacted by the failure of the acquired company to achieve anticipated revenues, earnings or cash flows, assumption of liabilities that exceed our estimates, potential compliance issues, diversion of management's attention or other resources from our existing business, risks associated with entering product / service areas in which we have limited experience, increases in working capital investment, unexpected capital expenditures, potential losses of key employees and customers of the acquired company and future write - offs of intangible and other assets, including goodwill, if the acquired operations fail to generate sufficient cash flows . 3 Safe Harbor

4 Highlights • Q4 2014 • Full year 2014 Financial Review • Segments Overview • Q4 2014 • Full Year 2014 • 2014 Pro forma Results • Financial Position, Cash Flow & Return Metrics 2015 Business Outlook Questions & Comments Appendix: Reconciliations 4 Agenda

5 • Strong Q4 results capped off an exceptional year • Delivered quarterly revenue of $157.2 million • Generated operating income of $19.1 million • Reported Adjusted EBITDA 1 of $31.2 million • Net income was $8.7 million • Adjusted EPS 1 was $0.42 • Integration on schedule; continue to be pleased with progress 1 See definition and reconciliation of Adjusted EBITDA and Adjusted earnings per share on pages 21 – 27 of this presentation or at tached as Exhibit A to our earnings release filed with the SEC on Form 8 - K 5 Q4‘14 Highlights

6 • Strong Financial Results including: ― Revenue of $ 447.4 million; ― Operating income of $ 72.5 million; ― Adjusted EBITDA of $ 109.0 million 1 ― Net income of $ 38.2 million; Adjusted EPS of $ 2.02 • Record Legacy US Ecology financial results ― Treatment and disposal revenue of $180.6 million ― Operating income of $60.0 million 2 ― Adjusted EBITDA of $73.4 million 3 • EQ acquisition strategically transformed the company both geographically and by broadening our service offering • Acquired assets delivered stronger than anticipated results, post ownership • We are better positioned today than ever before! 1 See reconciliation of Adjusted EBITDA and Adjusted earnings per share on pages 22 - 27 of this presentation or attached as Exhibit A to our earnings release filed with the SEC on Form 8 - K. Includes $6.4 million of business development expenses 2 Excludes $6.0 million of business development expenses 3 Includes $6.0 million of business development expenses 6 2014 Highlights

7 Financial Review
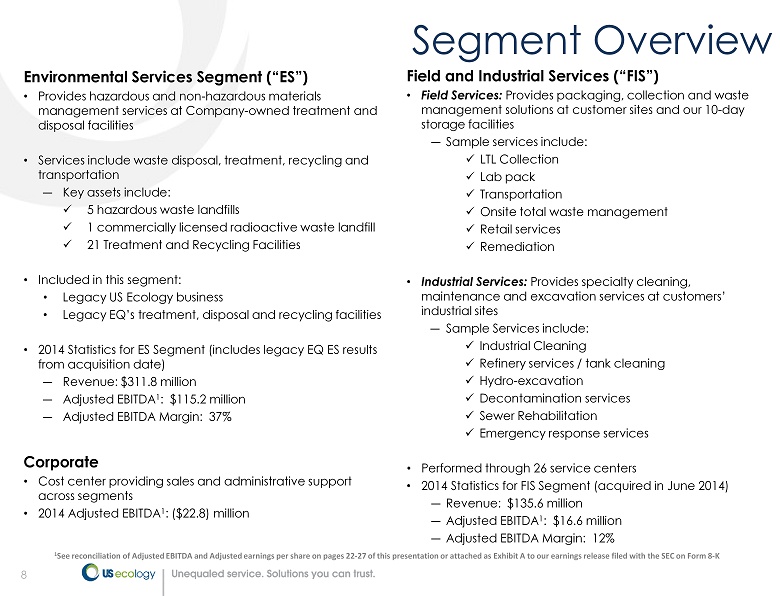
8 Environmental Services Segment (“ES”) • Provides hazardous and non - hazardous materials management services at Company - owned treatment and disposal facilities • Services include waste disposal, treatment, recycling and transportation ― Key assets include: x 5 hazardous waste landfills x 1 commercially licensed radioactive waste landfill x 21 Treatment and Recycling Facilities • Included in this segment: • Legacy US Ecology business • Legacy EQ’s treatment, disposal and recycling facilities • 2014 Statistics for ES Segment (includes legacy EQ ES results from acquisition date) ― Revenue: $311.8 million ― Adjusted EBITDA 1 : $115.2 million ― Adjusted EBITDA Margin : 37% 8 Field and Industrial Services (“FIS”) • Field Services: Provides packaging, collection and waste management solutions at customer sites and our 10 - day storage facilities ― Sample services include: x LTL Collection x Lab pack x Transportation x Onsite total waste management x Retail services x Remediation • Industrial Services: Provides specialty cleaning, maintenance and excavation services at customers’ industrial sites ― Sample Services include: x Industrial Cleaning x Refinery services / tank cleaning x Hydro - excavation x Decontamination services x Sewer Rehabilitation x Emergency response services • Performed through 26 service centers • 2014 Statistics for FIS Segment (acquired in June 2014) ― Revenue: $135.6 million ― Adjusted EBITDA 1 : $16.6 million ― Adjusted EBITDA Margin: 12% Corporate • Cost center providing sales and administrative support across segments • 2014 Adjusted EBITDA 1 : ($22.8) million Segment Overview 1 See reconciliation of Adjusted EBITDA and Adjusted earnings per share on pages 22 - 27 of this presentation or attached as Exhibit A to our earnings release filed with the SEC on Form 8 - K

9 • Total revenue $ 157.2 million compared with $59.4 million ― EQ assets contributed $102.4 million • ES revenue $97.7 million, up from $59.4 million in prior year • FIS revenue $59.5 million (no revenue in prior year period) • Legacy US Ecology revenue of $ 54.8 million, down $4.6 million from prior year ― 13% lower Event business; 3% improvement on Base Business ▪ Q4 ’13 Event business benefited from project acceleration work ― Decline related to private cleanup and refinery customer groupings ― Top customer represented 10% of revenue; top 10 customers represented 27% of revenue Legacy US Ecology % Change Q4 '14 vs. Q4 '13 (1) Government Cleanup 55% Other Industry 1% Broker 0% Rate Regulated -1% Private Cleanup -23% Refinery -26% Q4 ‘14 Financial Review 62% 38% Revenue ES FIS (1) Amounts exclude EQ and transportation services 7% 3% 8% 49% 18% 15% Legacy US Ecology % of Q4 '14 T&D Revenue Government Cleanup Rate Regulated Refinery Broker Other Industry Private Cleanup

10 Gross profit was $ 46.2 million, up from $23.1 million • EQ contributed $25.2 million • ES gross p rofit was $ 34.2 million, up from $23.1 million same period last year ― Legacy US Ecology was $21 million, down 9% in Q4’14 on lower revenue ― Legacy US Ecology T&D margin was 48% in both periods SG&A was $27.1 million compared with $7.7 million • EQ contributed $18.7 million Q4 ’14 operating income was $19.1 million, up from $15.4 million • EQ contributed $6.5 million of operating income during the quarter ― Includes intangible amortization of approximately $2.6 million Q4 ’14 Adjusted EBITDA 1 was $31.2 million, up from $20.2 million • EQ contributed $13.6 million of Adjusted EBITDA 1 Q4’14 net income was $8.7 million, down from $9.2 million Q4 ’14 Adjusted EPS 1 was $ 0.42 per share, down from $0.52 per share • Comparability impacted by higher share count in Q4 ’14 10 Q4 ‘14 Financial Review 1 See reconciliation of Adjusted EBITDA and Adjusted earnings per share on pages 21 - 27 of this presentation or attached as Exhibit A to our earnings release filed with the SEC on Form 8 - K
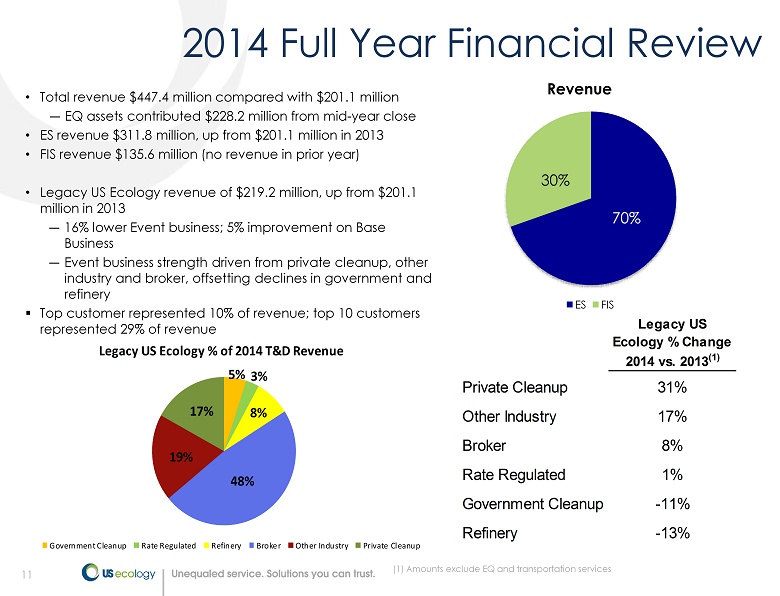
11 • Total revenue $447.4 million compared with $201.1 million ― EQ assets contributed $228.2 million from mid - year close • ES revenue $311.8 million, up from $201.1 million in 2013 • FIS revenue $135.6 million (no revenue in prior year) • Legacy US Ecology revenue of $219.2 million, up from $201.1 million in 2013 ― 16% lower Event business; 5% improvement on Base Business ― Event business strength driven from private cleanup, other industry and broker, offsetting declines in government and refinery ▪ Top customer represented 10% of revenue; top 10 customers represented 29% of revenue Legacy US Ecology % Change 2014 vs. 2013 (1) Private Cleanup 31% Other Industry 17% Broker 8% Rate Regulated 1% Government Cleanup -11% Refinery -13% 2014 Full Year Financial Review 70% 30% Revenue ES FIS (1) Amounts exclude EQ and transportation services 5% 3% 8% 48% 19% 17% Legacy US Ecology % of 2014 T&D Revenue Government Cleanup Rate Regulated Refinery Broker Other Industry Private Cleanup

12 12 2014 Full Year Financial Review Gross profit was $145.8 million, up from $79.0 million • EQ contributed $57.4 million from close on June 17 th • ES gross profit was $117.5 million, up from $79.0 million last year ― Legacy US Ecology was $88.4 million, up 12% in 2014 ― Legacy US Ecology T&D margin was 49% in 2014, up from 48% in 2013 SG&A was $73.3 million compared with $26.1 million • EQ contributed $38.9 million • Business development costs of $6.4 million Operating income was $72.5 million, up from $52.9 million in 2013 • EQ contributed $18.5 million of operating income ― Includes intangible amortization of approximately $6.8 million Adjusted EBITDA 1 was $109.0 million, up from $71.2 million in 2013 • EQ contributed $35.6 million of Adjusted EBITDA 1 • Includes $6.4 million of business development costs 2014 net income was $38.2 million, up from $32.2 million in 2013 Adjusted EPS 1 was $2.02 per share, up from $1.82 per share in 2013 • EQ contributed approximately $0.20 per share • Share count 16% higher due to December 2013 equity offering 1 See reconciliation of Adjusted EBITDA and Adjusted earnings per share on pages 21 - 27 of this presentation or attached as Exhibit A to our earnings release filed with the SEC on Form 8 - K

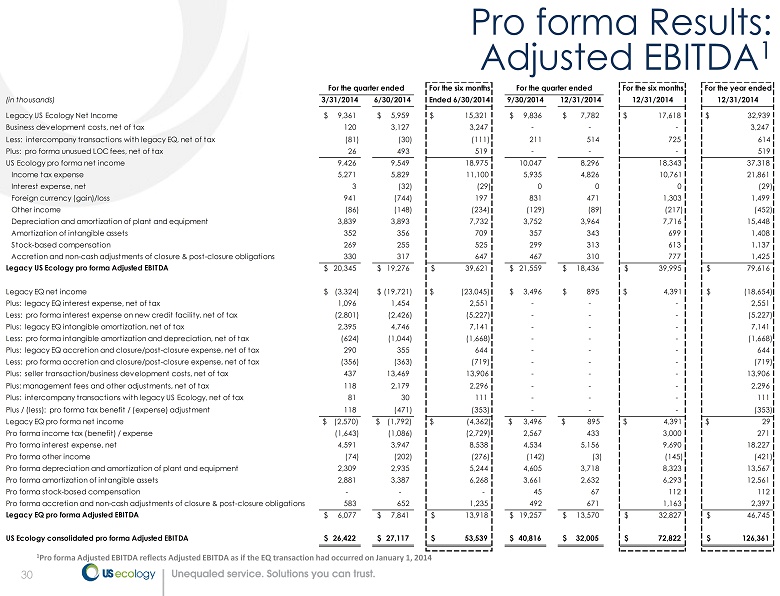
13 13 2014 Pro Forma Results • EQ first half results (prior to ownership) impacted by normal seasonality and severe weather conditions • Deferment of work pushed into second half results • EQ saw a significant improvement in results post US Ecology ownership • Pro forma EQ 1 results would have been break even to EPS in 2014; actual results show $0.20 accretion • Pro forma 1 combined company 2014 EPS would have been $1.72 vs. $2.02 adjusted EPS as reported • Pro forma 1 net income was $37.3 million 1 See reconciliation of pro forma revenue, eps and Adjusted EBITDA on pages 28 - 30 of this presentation
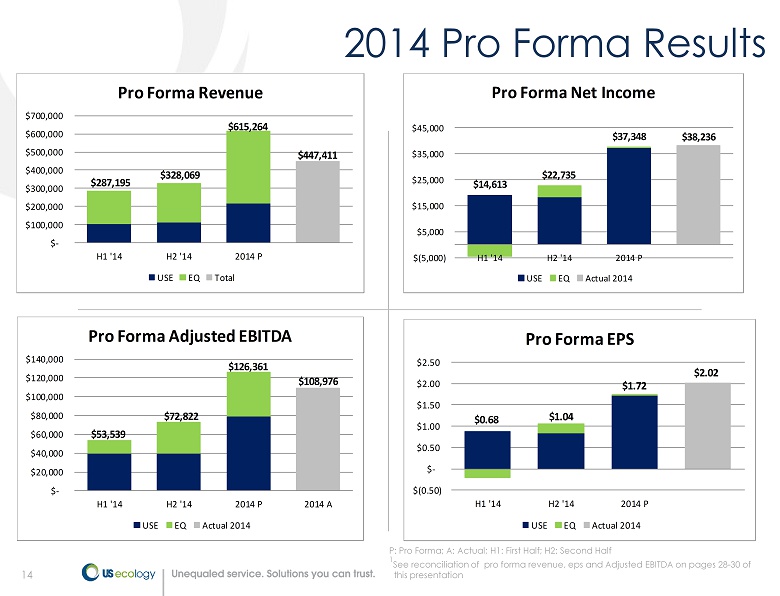
14 14 2014 Pro Forma Results P: Pro Forma; A: Actual; H1: First Half; H2: Second Half 1 See reconciliation of pro forma revenue, eps and Adjusted EBITDA on pages 28 - 30 of this presentation $- $100,000 $200,000 $300,000 $400,000 $500,000 $600,000 $700,000 H1 '14 H2 '14 2014 P Pro Forma Revenue USE EQ Total $615,264 $328,069 $287,195 $447,411 $(5,000) $5,000 $15,000 $25,000 $35,000 $45,000 H1 '14 H2 '14 2014 P Pro Forma Net Income USE EQ Actual 2014 $14,613 $22,735 $37,348 $38,236 $- $20,000 $40,000 $60,000 $80,000 $100,000 $120,000 $140,000 H1 '14 H2 '14 2014 P 2014 A Pro Forma Adjusted EBITDA USE EQ Actual 2014 $53,539 $72,822 $126,361 $108,976 $(0.50) $- $0.50 $1.00 $1.50 $2.00 $2.50 H1 '14 H2 '14 2014 P Pro Forma EPS USE EQ Actual 2014 $0.68 $1.04 $1.72 $2.02

15 15 Financial Position, Cash Flow & Return Metrics • Exited 2014 with cash of $23.0 million; net borrowings on our credit agreement of $371.7 million • Working Capital = $79.4 million compared to $89.2 million at September 30, 2014 • 2014 cash generated from operations = $71.4 million • 2014 capital expenditures = $28.4 million • 2014 dividends paid = $15.5 million • 2014 payments on long - term debt = $19.4 million • Pro forma return on total capital 1 = 6.4% • Pro forma return on total assets 1 = 4.1% • Pro forma return on total equity 1 = 15.5% 1 Pro forma return calculated as of December 31, 2014 assuming full year of EQ operations.

16 Revenue estimate of $585 million to $620 million • ES revenue range of $345 million to $370 million • FIS revenue estimate of $240 to $250 million Adjusted EBITDA 1 estimated to range from $137 million to $143 million • Represents growth up to 13% over pro forma 2014 results Earnings Per Share 1 estimated between $1.76 to $1.92 per diluted share • Represents growth up to 12% over pro forma 2014 results Capital Expenditures estimated between $40 million to $45 million • Includes carryover capital from 2014 16 2015 Business Outlook 1 Guidance excludes non - cash foreign currency translation gains or losses and business development expenses

17 Business Climate and Segment Outlook: • ES Segment ― Base Business growth of mid - single digits ― Event pipeline remains strong, solid bidding activity ▪ Pipeline is building as we gain visibility to summertime work ▪ Backfilling projects expected to complete in second half ― Expect roll out of new combined sales team with expanded network • FIS Segment ― Expect solid growth in industrial service, deploying new capital, building out dedicated sales network and winning new business ― Expanding our field services opportunities and solutions under a new expanded network ― Focused on revenue quality, key theme since our ownership 17 2015 Business Outlook

18 18 2015 Business Outlook 59% 41% Avg. Revenue Guidance Range by Segment ES FIS P: Pro Forma; L: Low End of Range; H: High End of Range $560,000 $570,000 $580,000 $590,000 $600,000 $610,000 $620,000 $630,000 2014 P 2015 L 2015 H Revenue $620,000 $585,000 $615,000 $620,000 $585,000 $615,000 $1.60 $1.65 $1.70 $1.75 $1.80 $1.85 $1.90 $1.95 2014 P 2015 L 2015 H EPS $1.92 $1.72 $1.76 $115,000 $120,000 $125,000 $130,000 $135,000 $140,000 $145,000 2014 P 2015 L 2015 H Adjusted EBITDA $143,000 $126,000 $137,000 $143,000 $137,000

19 We invite your questions & comments! Questions and Comments 19

20 We invite your questions & comments! Appendix 20

21 US Ecology reports adjusted EBITDA, adjusted earnings per diluted share, pro forma Adjusted EBITDA, pro forma earnings per diluted per share and pro forma revenue results, which are non - GAAP financial measures, as a complement to results provided in accordance with generally accepted accounting principles in the United States (GAAP) and believes that such information provides analysts, stockholders, and other users information to better understand the Company’s operating performance . Because adjusted EBITDA, adjusted earnings per diluted share, pro forma Adjusted EBITDA , pro forma earnings per diluted per share and pro forma revenue are not measurements determined in accordance with GAAP and are thus susceptible to varying calculations they may not be comparable to similar measures used by other companies . Items excluded from adjusted EBITDA, adjusted earnings per diluted share, pro forma Adjusted EBITDA , pro forma earnings per diluted per share and pro forma revenue are significant components in understanding and assessing financial performance . Adjusted EBITDA, adjusted earnings per diluted share, pro forma Adjusted EBITDA , pro forma earnings per diluted per share and pro forma revenue should not be considered in isolation or as an alternative to, or substitute for, revenue, net income, cash flows generated by operations, investing or financing activities, or other financial statement data presented in the consolidated financial statements as indicators of financial performance or liquidity . Adjusted EBITDA , adjusted earnings per diluted share, pro forma Adjusted EBITDA , pro forma earnings per diluted per share and pro forma revenue have limitations as analytical tools and should not be considered in isolation or a substitute for analyzing our results as reported under GAAP . 21 Adjusted and Pro Forma EBITDA, EPS & Revenue
22 Adjusted EBITDA The Company defines adjusted EBITDA as net income before interest expense, interest income, income tax expense, depreciation, amortization, stock based compensation, accretion of closure and post - closure liabilities, foreign currency gain/loss and other income/expense, which are not considered part of usual business operations . Adjusted Earnings Per Diluted Share The Company defines adjusted earnings per diluted share as net income plus the after tax impact of non - cash, non - operational foreign currency gains or losses (“Foreign Currency Gain/Loss”) plus the after tax impact of business development costs divided by the number of diluted shares used in the earnings per share calculation . The Foreign Currency Gain/Loss excluded from the earnings per diluted share calculation are related to intercompany loans between our Canadian subsidiary and the U . S . parent which have been established as part of our tax and treasury management strategy . These intercompany loans are payable in Canadian dollars (“CAD”) requiring us to revalue the outstanding loan balance through our consolidated income statement based on the CAD/United States currency movements from period to period . We believe excluding the currency movements for these intercompany financial instruments provides meaningful information to investors regarding the operational and financial performance of the Company . 22 Definitions of Adjusted EBITDA and EPS

23 23 Financial Results: Q4‘14 vs. Q4‘13 amounts in thousands except per share data 2014 2013 $ Change % Change Revenue $ 157,174 $ 59,360 $ 97,814 164.8% Gross profit 46,213 23,056 23,157 100.4% SG&A 27,065 7,702 19,363 251.4% Operating income 19,148 15,354 3,794 24.7% Interest expense, net (5,158) (169) (4,989) 2952.1% Foreign currency gain (loss) (472) (879) 407 -46.3% Other 93 84 9 10.7% Pretax income 13,611 14,390 (779) -5.4% Income tax expense 4,934 5,183 (249) -4.8% Net income $ 8,677 $ 9,207 $ (530) -5.8% Diluted EPS $ 0.40 $ 0.48 $ (0.08) -16.7% Diluted shares outstanding 21,673 19,281 Adjusted EBITDA Reconciliation Net Income 8,677$ 9,207$ Income tax expense 4,934 5,183 Interest expense, net 5,158 169 Foreign currency (gain)/ loss 472 879 Other income (93) (84) Depreciation and amortization 7,682 4,023 Amortization of intangibles 2,974 369 Stock-based compensation 382 264 Accretion and non-cash adjustments of closure & post-closure obligations 981 187 Adjusted EBITDA 31,167$ 20,197$ 10,970$ 54.3% Three Months Ended December 31,

24 24 Financial Results: Q4‘14 vs. Q4‘13 (in thousands, except per share data) Adjusted Earnings Per Share Reconciliation per share per share Net income / earnings per diluted share 8,677$ 0.40$ 9,207$ 0.48$ Business development costs, net of tax 514 0.02 228 0.01 Non-cash foreign currency (gain) loss, net of tax 77 - 684 0.03 Adjusted net income / adjusted earnings per diluted share 9,268$ $ 0.42 10,119$ $ 0.52 Shares used in earnings per diluted share calculation 21,673 19,281 Three Months Ended December 31, 2014 2013
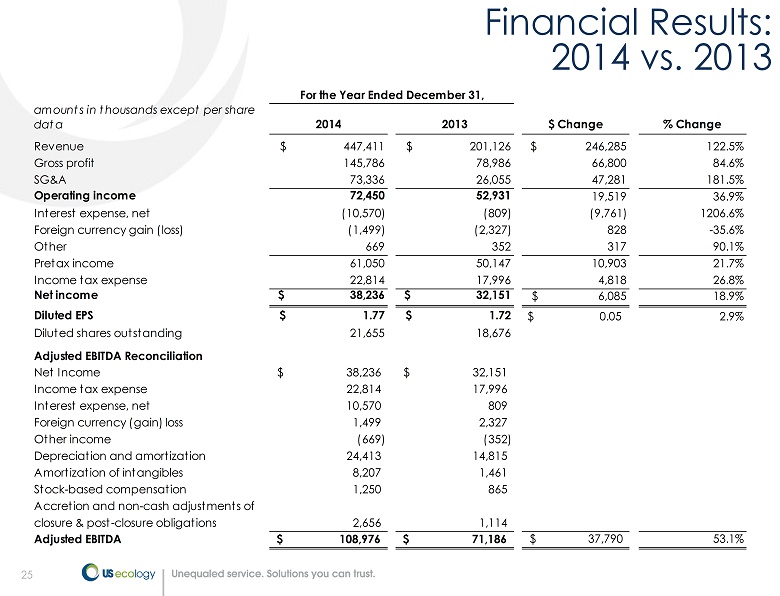
25 25 Financial Results: 2014 vs. 2013 amounts in thousands except per share data 2014 2013 $ Change % Change Revenue $ 447,411 $ 201,126 $ 246,285 122.5% Gross profit 145,786 78,986 66,800 84.6% SG&A 73,336 26,055 47,281 181.5% Operating income 72,450 52,931 19,519 36.9% Interest expense, net (10,570) (809) (9,761) 1206.6% Foreign currency gain (loss) (1,499) (2,327) 828 -35.6% Other 669 352 317 90.1% Pretax income 61,050 50,147 10,903 21.7% Income tax expense 22,814 17,996 4,818 26.8% Net income $ 38,236 $ 32,151 $ 6,085 18.9% Diluted EPS $ 1.77 $ 1.72 $ 0.05 2.9% Diluted shares outstanding 21,655 18,676 Adjusted EBITDA Reconciliation Net Income 38,236$ 32,151$ Income tax expense 22,814 17,996 Interest expense, net 10,570 809 Foreign currency (gain) loss 1,499 2,327 Other income (669) (352) Depreciation and amortization 24,413 14,815 Amortization of intangibles 8,207 1,461 Stock-based compensation 1,250 865 Accretion and non-cash adjustments of closure & post-closure obligations 2,656 1,114 Adjusted EBITDA 108,976$ 71,186$ 37,790$ 53.1% For the Year Ended December 31,

26 26 Financial Results: 2014 vs. 2013 (in thousands, except per share data) Adjusted Earnings Per Share Reconciliation per share per share Net income / earnings per diluted share 38,236$ 1.77$ 32,151$ 1.72$ Business development costs, net of tax 4,851 0.22 254 0.01 Non-cash foreign currency (gain) loss, net of tax 700 0.03 1,597 0.09 Adjusted net income / adjusted earnings per diluted share 43,787$ $ 2.02 34,002$ $ 1.82 Shares used in earnings per diluted share calculation 21,655 18,676 For the Year Ended December 31, 2014 2013

27 27 Financial Results: Q14’14 vs. Q4’13 and 2014 vs. 2013 (in thousands) Legacy US Ecology Legacy EQ Consolidated US Ecology Legacy US Ecology Legacy EQ Consolidated US Ecology Net Income 4,461$ 4,216$ 8,677$ 27,061$ 11,175$ 38,236$ Income tax expense 2,623 2,311 4,934 15,405 7,409 22,814 Interest expense, net 5,200 (42) 5,158 10,457 113 10,570 Foreign currency (gain)/ loss 472 - 472 1,499 - 1,499 Other income (89) (4) (93) (451) (218) (669) Depreciation and amortization 3,964 3,718 7,682 15,448 8,965 24,413 Amortization of intangibles 343 2,631 2,974 1,408 6,799 8,207 Stock-based compensation 313 69 382 1,137 113 1,250 Accretion and non-cash adjustments of closure & post-closure obligations 310 671 981 1,425 1,231 2,656 Adjusted EBITDA 17,597$ 13,570$ 31,167$ 73,389$ 35,587$ 108,976$ Three Months Ended December 31, 2014 The Year Ended December 31, 2014
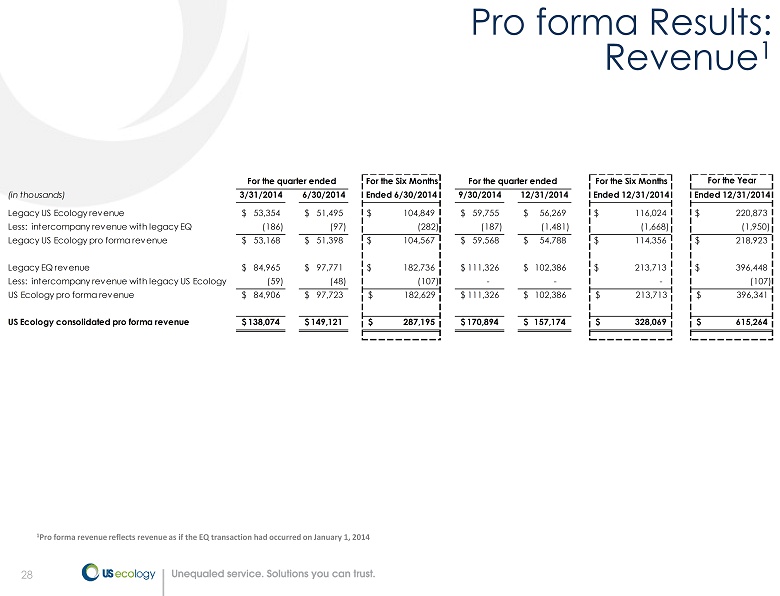
28 28 Pro forma Results: Revenue 1 For the Six Months For the Six Months For the Year (in thousands) 3/31/2014 6/30/2014 Ended 6/30/2014 9/30/2014 12/31/2014 Ended 12/31/2014 Ended 12/31/2014 Legacy US Ecology revenue 53,354$ 51,495$ $ 104,849 59,755$ 56,269$ $ 116,024 $ 220,873 Less: intercompany revenue with legacy EQ (186) (97) (282) (187) (1,481) (1,668) (1,950) Legacy US Ecology pro forma revenue 53,168$ 51,398$ $ 104,567 59,568$ 54,788$ $ 114,356 $ 218,923 Legacy EQ revenue 84,965$ 97,771$ $ 182,736 111,326$ 102,386$ $ 213,713 $ 396,448 Less: intercompany revenue with legacy US Ecology (59) (48) (107) - - - (107) US Ecology pro forma revenue 84,906$ 97,723$ 182,629$ 111,326$ 102,386$ 213,713$ 396,341$ US Ecology consolidated pro forma revenue 138,074$ 149,121$ 287,195$ 170,894$ 157,174$ 328,069$ 615,264$ For the quarter ended For the quarter ended 1 Pro forma revenue reflects revenue as if the EQ transaction had occurred on January 1, 2014

29 29 Pro forma Results: Earnings Per Share 1 1 Pro forma Diluted Earnings Share reflects diluted EPS as if the EQ transaction had occurred on January 1, 2014 (in thousands, except per share data) per share per share per share per share per share per share per share Legacy US Ecology net income / earnings per diluted share 9,361$ 0.44$ 5,959$ 0.28$ $ 15,321 $ 0.71 9,836$ 0.45$ 7,782$ 0.36$ $ 17,618 $ 0.81 32,939$ 1.52$ ` Business development costs, net of tax 120 0.01 3,127 0.14 3,247 0.15 211 0.01 514 0.02 725 0.03 3,972 0.18 Less: intercompany transactions with legacy EQ, net of tax (81) (0.00) (30) (0.00) (111) (0.01) - - - - - - (111) (0.01) Plus: pro forma unusued LOC fees, net of tax 26 0.00 493 0.02 519 0.02 - - - - - - 519 0.02 Legacy US Ecology pro forma net income/ earnings per diluted Share $ 9,426 $ 0.44 $ 9,549 $ 0.44 $ 18,975 $ 0.88 $ 10,047 $ 0.46 $ 8,296 $ 0.38 $ 18,343 $ 0.84 $ 37,318 $ 1.72 Legacy EQ net income/earnings per dliuted share (3,324)$ (0.15)$ (19,721)$ (0.91)$ $(23,045) $ (1.06) 3,496$ 0.16$ 895$ 0.04$ $ 4,391 $ 0.20 (18,654)$ (0.86)$ Plus: seller transaction/business development costs, net of tax 437 0.02 13,469 0.62$ 13,906 0.64 - - - - - - 13,906 0.64$ Plus: management fees and other adjustments, net of tax 118 0.01 2,179 0.10$ 2,296 0.11 - - - - - - 2,296 0.11$ Plus: legacy EQ interest expense, net of tax 1,096 0.05 1,454 0.07$ 2,551 0.12 - - - - - - 2,551 0.12$ Less: pro forma interest expense on new credit facility, net of tax (2,801) (0.13) (2,426) (0.11)$ (5,227) (0.24) - - - - - - (5,227) (0.24)$ Plus: legacy EQ intangible amortization, net of tax 2,395 0.11 4,746 0.22$ 7,141 0.33 - - - - - - 7,141 0.33$ Less: pro forma intangible amortization and depreciation, net of tax (624) (0.03) (1,044) (0.05)$ (1,668) (0.08) - - - - - - (1,668) (0.08)$ Plus: legacy EQ accretion and closure/post-closure expense, net of tax 290 0.01 355 0.02$ 644 0.03 - - - - - - 644 0.03$ Less: pro forma accretion and closure/post-closure expense, net of tax (356) (0.02) (363) (0.02)$ (719) (0.03) - - - - - - (719) (0.03)$ Plus: intercompany transactions with legacy US Ecology, net of tax 81 0.00 30 0.00$ 111 0.01 - - - - - - 111 0.01$ Plus / (less): pro forma tax benefit / (expense) adjustment 118 0.01 (471) (0.02)$ (353) (0.02) - - - - - - (353) (0.02)$ Legacy EQ pro forma net income/earnings per diluted share $ (2,570) $ (0.12) $ (1,792) $ (0.08) $ (4,362) $ (0.20) $ 3,496 $ 0.16 $ 895 $ 0.04 $ 4,391 $ 0.20 $ 29 $ 0.00 US Ecology pro forma net income/earnings per diluted share 6,856$ 0.32$ 7,757$ 0.36$ 14,613$ 0.68$ 13,543$ 0.62$ 9,191$ 0.42$ 22,735$ 1.04$ 37,348$ 1.72$ Shares used in earnings per diluted share calculation 21,475 21,667 21,680 21,673 21,655 For the six months Ended 6/30/2014 For the quarter ended For the quarter ended For the year 3/31/2014 6/30/2014 9/30/2014 12/31/2014 Ended 12/31/2014 For the six months Ended 12/31/2014