Attached files
| file | filename |
|---|---|
| 8-K - 8-K - BROADWIND, INC. | a15-5286_28k.htm |
| EX-99.1 - EX-99.1 - BROADWIND, INC. | a15-5286_2ex99d1.htm |
Exhibit 99.2
|
|
2014 Earnings Conference Call February 26, 2015 |

|
|
Industry Data and Forward-Looking Statements Disclaimer Broadwind obtained the industry and market data used throughout this presentation from our own research, internal surveys and studies conducted by third parties, independent industry associations or general publications and other publicly available information. Independent industry publications and surveys generally state that they have obtained information from sources believed to be reliable, but do not guarantee the accuracy and completeness of such information. Forecasts are particularly likely to be inaccurate, especially over long periods of time. We are not aware of any misstatements in the industry data we have presented herein, but estimates involve risks and uncertainties and are subject to change based on various factors beyond our control. This presentation includes various forward-looking statements within the meaning of Section 27A of the Securities Act of 1933 and Section 21E of the Securities Exchange Act of 1934 that involve risks, uncertainties and assumptions, such as statements regarding our future financial condition or results of operations or prospects and strategies for future growth, including with respect to estimated 2015 guidance. Statements in this presentation that are not historical are forward-looking statements. These statements are based on current expectations and we undertake no obligation to update these statements to reflect events or circumstances occurring after this presentation. Such statements are subject to various risks and uncertainties that could cause actual results to vary materially from those stated. Such risks and uncertainties include, but are not limited to: expectations regarding our business, end-markets, relationships with customers and our ability to diversify our customer base; the impact of competition and economic volatility on the industries in which we compete; our ability to realize revenue from customer orders and backlog; the impact of regulation on end-markets, including the wind energy industry in particular; the sufficiency of our liquidity and working capital; the ability to preserve and utilize our tax net operating loss carry-forwards; and other risks and uncertainties described in our filings with the Securities and Exchange Commission, including those contained in Part I, Item A “Risk Factors” of our Annual Reports on Form 10-K. This presentation contains non-GAAP financial information. We believe that certain non-GAAP financial measures may provide users of this financial information meaningful comparisons between current results and results in prior operating periods. We believe that these non-GAAP financial measures can provide additional meaningful reflection of underlying trends of the business because they provide a comparison of historical information that excludes certain infrequently occurring or non-operational items that impact the overall comparability. Non-GAAP financial measures should be viewed in addition to, and not as an alternative to, our reported results prepared in accordance with GAAP. Please see our earnings release dated February 26, 2015 for a reconciliation of certain non-GAAP measures presented in this presentation. 2/26/15 © 2015 Broadwind Energy, Inc. All rights reserved. 2 |
|
|
2014 – Continued Steady Improvement, Despite Some Headwinds CAGR 15% Full-Year Highlights Tower capacity positioned well for 2015; Gears and Services orders well ahead of PY Completed 3-year, $13.7M restructuring investment Good expense management; SG&A reduced to 9% of sales, down 11 percentage points since 2010 Operating loss narrowed to $5.9M (1) 2010 excludes $41M Intangible impairment +$23M recovery Q4 Highlights New orders of $30M; ending backlog of $202M Revenue of $53.8M, down 5% from Q4 ‘13 due to short-term production issues at Abilene tower facility Margins negatively impacted by shortfall in towers SG&A expense reduced to 9% of sales, from 10% in Q4 ‘13 Cash and related assets totaled $20M; debt reduced to $4M 2/26/15 © 2015 Broadwind Energy, Inc. All rights reserved. 3 |

|
|
Towers Recovery UpdateAbilene Production –Avg. Sections Per ProgressWeek Passed customer site qualification milestone10 Improvements in weld and paint quality8 Strengthened supervision via internal transfers to 6 Abilene4 Production yield becoming more predictable2 Still ramping up to target production of 10 sections 0 per week Q2 Q3 Q4 Jan Feb WK1 Feb Wk2 Feb 2015 running 2 tower types in Abilene vs. 1 in 2014West Coast Port Delays Managing day to day regarding foreign sourced components Redirecting components to other ports Accelerated tower production where components were more readily available … $5M revenue recognition delayed to Q2-Q32/26/15 © 2015 Broadwind Energy, Inc. All rights reserved. 4 |

|
|
Orders and Backlog Orders – $M $78M in Towers & Weldments orders in 2014 vs. PY record high 2014 Gearing orders well ahead of PY . . . oil and gas weakness may delay the timing of some deliveries Services orders up 85% over PY; strong demand for blade repair Order Backlog – $M Strong 2014 ending backlog of $202M ~80% of 2015 revenue was in backlog at year end 2013 2014 % Change Book : Bill Towers & Weldments $361.5 $77.6 -79% .42 Gearing 34.5 41.9 21% .99 Services 8.5 15.7 85% 1.01 Total $404.4 $135.1 -67% .56 Record-high backlog; Tower orders placed ahead of PTC expiration 2/26/15 © 2015 Broadwind Energy, Inc. All rights reserved. 5 |
|
|
Wind Market Update Industry Update PTC passed late in December, retroactive to 1/1/14 6 GW purchased in last 2 weeks of 2014 ~13GW under construction at 12/31/14 7.6 GW in TX, 2.4 GW in Midwest, 1.2 GW in Plains >3.3GW of PPAs signed in 2014 and merchant hedge market rebounding EPA Clean Power Plan should result in additional demand for wind Industry lobbying for more consistent, stable policy; multiple opportunities to get an extension passed in 2015 Major corporations continue to buy wind direct 2014 buys: IKEA 98 MW, Microsoft 235 MW, Google 240 MW, Wal-Mart 116 MW Yieldco’s enhancing growth prospects with stronger balance sheets Source: MAKE Consulting 2/26/15 © 2015 Broadwind Energy, Inc. All rights reserved. 6 |

|
|
Gearing - Outlook Backlog - $20M O&G Delay of ~ $2M of orders into Q3 and Q4 Q1 impact estimated near $3M due to production loss Some offset to market conditions by gaining share Steel Major Cap Ex spending going on in steel segment Increase in both quotes and dollar values Wind Aftermarket business firm and likely to rise as aging fleets require more work Mining Market beginning to improve, albeit slowly Increase in orders coming from new customers 2/26/15 © 2015 Broadwind Energy, Inc. All rights reserved. 7 |

|
|
2015 Priorities Grow top line by 6-8% Achieve profitability Sell 2016 tower capacity Continue to diversify industry and customer base Implement robust new product introduction process 2/26/15 © 2015 Broadwind Energy, Inc. All rights reserved. 8 |
|
|
Key Focus: Margin Improvement BWEN Margins % of Sales Gross Margin *Excl restructuring ** Excl 2010 impairment Adj. EBITDA* Operating Margin** Q4 Results Revenue, profit, EPS declines all due to low Abilene tower production and $3M of one-time expenses to address customer issues 2014 Results Revenue growth due to producing 11% more towers Margins lower due to 2H Abilene tower production challenges Gearing loss improved significantly – $9.4M vs. $17.9M in 2013 Q4 2013 Q4 2014 2013 FY 2014 FY Revenue ($M) $56.4 $53.8 $215.7 $241.3 Gross Profit ($M) 2.2 -0.1 12.3 17.5 -% of Sales 3.8 -0.2 5.7 7.2 Operating Exp ($M) 6.1 5.1 25.6 23.4 -% of Sales 10.8 9.5 11.8 9.7 Operating Loss ($M) -4.0 -5.2 -13.2 -5.9 - % of Sales -7.0 -9.7 -6.1 -2.5 EPS (Continuing) -.26 -.35 -.72 -.42 2/26/15 © 2015 Broadwind Energy, Inc. All rights reserved. 9 |

|
|
Towers and Weldments Immediate Focus Restore Abilene production to full capacity Consolidate Abilene weldments production into single plant Standardize new product introduction process Q4 2013 Q4 2014 2013 FY 2014 FY Orders ($M) $193.2 $21.1 $361.5 $77.6 Towers Sold (#) 111 101 392 435 Revenue ($M) 43.4 38.6 159.5 184.9 Operating Inc ($M) 5.8 .5 19.6 18.1 -% of Sales 13.3 1.4 12.3 9.8 Adj. EBITDA ($M) 7.4 1.6 24.8 22.3 - % of Sales 17.1 4.2 15.6 12.0 Q4 Results Abilene production problems resulted in $3M in higher labor costs, warranty and delivery penalties Manitowoc plant ran exceptionally well Volume effect of lower production -- $1M 2014 Results Increased production 11% First half 2014 momentum impacted by production issues in Abilene 2015 Objectives Build weldments backlog Sell 2016 tower capacity Reduce production cost through increased welding and paint productivity Expand ERP system utilization 2/26/15 © 2015 Broadwind Energy, Inc. All rights reserved. 10 |

|
|
Gearing Immediate Focus Build backlog to respond to weakening oil and gas market Manage cost structure to reduce break-even point Q4 2013 Q4 2014 2013 FY 2014 FY Orders ($M) $5.1 $6.3 $34.5 $41.9 Revenue ($M) 11.6 10.7 43.2 42.3 Operating Loss ($M) -5.6 -2.4 -17.9 -9.4 -% of Sales -48.2 -22.0 -41.5 -22.3 Adj. EBITDA ($M) -1.2 -.7 -3.6 -.9 - % of Sales -10.0 -6.2 -8.3 -2.2 Q4 Results Plant consolidation project complete Orders up 24% from Q4 2013 Improved operational parameters Operating loss down sharply 2014 Results Orders up 21% from 2013 Revenue down from 2013; production delays in first half of year 2014 benefitted from lower restructuring costs and non-cash charges, higher margins and absence of regulatory charge 2015 Objectives Continue cross-training to improve labor productivity Close control of working capital 2/26/15 © 2015 Broadwind Energy, Inc. All rights reserved. 11 |

|
|
Services Q4 2013 Q4 2014 2013 FY 2014 FY Orders ($M) $2.4 $2.3 $8.5 $15.7 Revenue ($M) 2.0 4.6 17.2 15.6 Operating Loss ($M) -1.5 -1.1 -4.7 -4.5 -% of Sales -74.5% -23.9% -27.4% -28.9% Adj. EBITDA ($M) -1.1 -.8 -2.6 -3.1 - % of Sales -55.5% -17.0% -14.9% -19.7% Q4 Results Revenue more than double Q4 2013; strong blade repair and technician fieldwork Operating loss narrowed – increased volume, better utilization and lower operating expenses 2014 Results Orders up 85% from 2013 Revenue down due to absence of large drivetrain assembly project in 2013 Operating loss down due to less restructuring and lower operating expenses, partly offset by lower volumes 2015 Objectives Increase gearbox rebuild throughput Improve margins Immediate Focus Increase order rate Maintain/improve productivity Secure multi-year service agreements 2/26/15 © 2015 Broadwind Energy, Inc. All rights reserved. 12 |

|
|
Key Focus: Liquidity Management 2013 2014 Adj. EBITDA $10,346 $8,877 Op. Working Cap (Inc)/Dec 16,239 -8,505 Other Operating Cash -331 2,129 Operating Cash Flow 26,254 2,501 Capital Expenditures -6,950 -6,504 Asset Sales 13,249 1,065 Debt Incr/(Decr) -7,506 -1,135 Stock Proceeds/(Repurchases) 18 -1,833 Summary Cash Flow – selected items Operating Working Capital Capital Spending vs Asset Sales Capital Spending Asset Sales Asset sales have funded 60% of capital investment 2/26/15 © 2015 Broadwind Energy, Inc. All rights reserved. 13 |
|
|
Balance Sheet YE 2012 YE 2013 YE 2014 Cash Assets 846 26,162 20,256 Op Working Capital 21,587 5,348 13,853 Net PPE 78,889 69,077 62,952 Other Assets 21,148 12,577 8,476 (Debt and Cap Leases) -7,121 (5,082) (4,111) (Other Liabilities) -12,001 (12,752) (13,046) Equity 103,348 95,330 88,380 Cash assets have declined with increased working capital requirement to support Abilene production issues—should recover in second half of 2015 Investment in Property, Plant and Equipment is decreasing as capital spending trails depreciation despite restructuring capital outlay Book value = $5.95/share 2/26/15 © 2015 Broadwind Energy, Inc. All rights reserved. 14 |

|
|
Other Highlights SEC investigation resolved Successfully passed first SOX 404 audit since filing status reverted to “accelerated” Restructuring project outlays initiated in 2011 are now complete – total investment of $13.7M YE 2014 Net Operating Loss carry-forward estimated at $174M 2/26/15 © 2015 Broadwind Energy, Inc. All rights reserved. 15 |
|
|
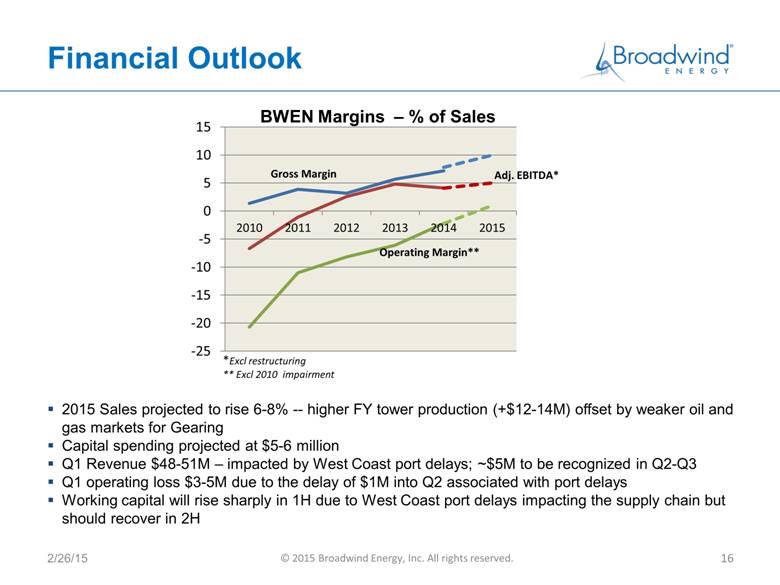
portsAccelerated tower production where components were more readily available … $5M revenue recognition delayed to Q2-Q3 2/26/15 © 2015 Broadwind Energy, Inc. All rights reserved. 4 Financial Outlook BWEN Margins — % of Sales 15 10 Gross Margin Adj. EBITDA* 5 0 2010 2011 2012 2013 2014 2015 -5 Operating Margin** -10 -15 -20 -25 *Excl restructuring ** Excl2010 impairment 2015 Sales projected to rise 6-8% —higher FY tower production (+$12-14M) offset by weaker oil and gas markets for GearingCapital spending projected at $5-6 millionQ1 Revenue $48-51M —impacted by West Coast port delays; ~$5M to be recognized in Q2-Q3Q1 operating loss $3-5M due to the delay of $1M into Q2 associated with port delaysWorking capital will rise sharply in 1H due to West Coast port delays impacting the supply chain but should recover in 2H 2/26/15 © 2015 Broadwind Energy, Inc. All rights reserved. 16 |
|
|
Click to edit Master title style Click to edit Master text styles Second level Third level Fourth level Fifth level Broadwind Energy is committed to helping customers maximize performance of their energy and infrastructure investments— quicker, easier and smarter. 2/26/15 © 2015 Broadwind Energy, Inc. All rights reserved. 17 |