Attached files
| file | filename |
|---|---|
| 8-K - 8-K - Silver Bay Realty Trust Corp. | sby8kq42014earningsrelease.htm |
| EX-99.1 - EXHIBIT 99.1 - Silver Bay Realty Trust Corp. | q4-2014earningspressrelease.htm |

1 SILVER BAY REALTY TRUST CORP. F o u r t h Q u a r t e r 2 0 1 4 E a r n i n g s P r e s e n t a t i o n
2 S A F E H A R B O R S T A T E M E N T F O R W A R D - L O O K I N G S T A T E M E N T S This presentation includes “forward-looking statements” within the meaning of the safe harbor provisions of the United States Private Securities Litigation Reform Act of 1995. Actual results may differ from expectations, estimates and projections and, consequently, readers should not rely on these forward-looking statements as predictions of future events. Words such as “expect,” “target,” “assume,” “estimate,” “project,” “budget,” “forecast,” “anticipate,” “intend,” “plan,” “may,” “will,” “could,” “should,” “believe,” “predicts,” “potential,” “continue,” and similar expressions are intended to identify such forward-looking statements. These forward-looking statements involve significant risks and uncertainties that could cause actual results to differ materially from expected results. Factors that could cause actual results to differ include: adverse economic or real estate developments in Silver Bay’s markets; defaults on, early terminations of or non-renewal of leases by residents; difficulties in identifying properties to acquire and completing acquisitions; increased time and/or expense to gain possession and renovate properties; increased vacancy, resident turnover, or turnover costs; Silver Bay’s ability to control or reduce operating expenses, including repairs and maintenance expense and other costs such as real estate taxes, homeowners’ association fees, insurance and other costs outside the Company’s control; Silver Bay’s failure to successfully operate its properties; Silver Bay’s ability to obtain financing arrangements; Silver Bay’s failure to meet the conditions to draw under the revolving credit facility; delays or a failure to close on all or a portion of the portfolio of properties owned and operated by The American Home (“the Portfolio”); inability to obtain financing for the transaction, maintenance or capital improvement costs related to the Portfolio that exceed our assumptions, defaults among residents of the Portfolio that exceed our assumptions, poor operations of the Portfolio prior to the closing date and difficulties with successfully integrating the Portfolio into Silver Bay’s existing portfolio; the Company’s ability to hire and retain skilled managerial, investment, financial and operational personnel; the Company’s ability to perform under the covenants of its revolving credit facility and securitization loan; general volatility of the markets in which it participates; interest rates and the market value of Silver Bay’s assets; the impact of changes in governmental regulations, tax law and rates, and similar matters. Readers are cautioned not to place undue reliance upon any forward-looking statements, which speak only as of the date made. Silver Bay does not undertake or accept any obligation to release publicly any updates or revisions to any forward-looking statement to reflect any change in its expectations or any change in events, conditions or circumstances on which any such statement is based. Additional information concerning these and other risk factors is contained in Silver Bay’s most recent filings with the Securities and Exchange Commission (“SEC”). All subsequent written and oral forward looking statements concerning Silver Bay or matters attributable to Silver Bay or any person acting on its behalf are expressly qualified in their entirety by the cautionary statements above.
3 COMPANY HIGHLIGHTS Fourth quarter revenue increased 24% to $20.7 million compared to the year-ago quarter Net operating income (“NOI”)(1) outpaced revenue growth, recording a 31% increase to $10.9 million Generated Core Funds from Operations (“Core FFO”)(1) of $4.9 million, an increase of 142% compared with the year-ago quarter Completed a $313 million securitization transaction in 2014 In 2014, increased portfolio by 20% year-over-year to approximately 6,780 properties, primarily adding homes to Silver Bay’s Florida markets, Dallas and Atlanta Achieved 3% rental increases on renewals for 2014 On February 18th, 2015, Silver Bay entered into a definitive agreement to acquire The American Home Portfolio for approximately $263 million in cash (1) NOI and Core FFO are non-GAAP financial measures. Core FFO per share amounts are based upon weighted average common shares and common units of the Operating Partnership for the respective periods. See the non-GAAP reconciliation included in the appendix.
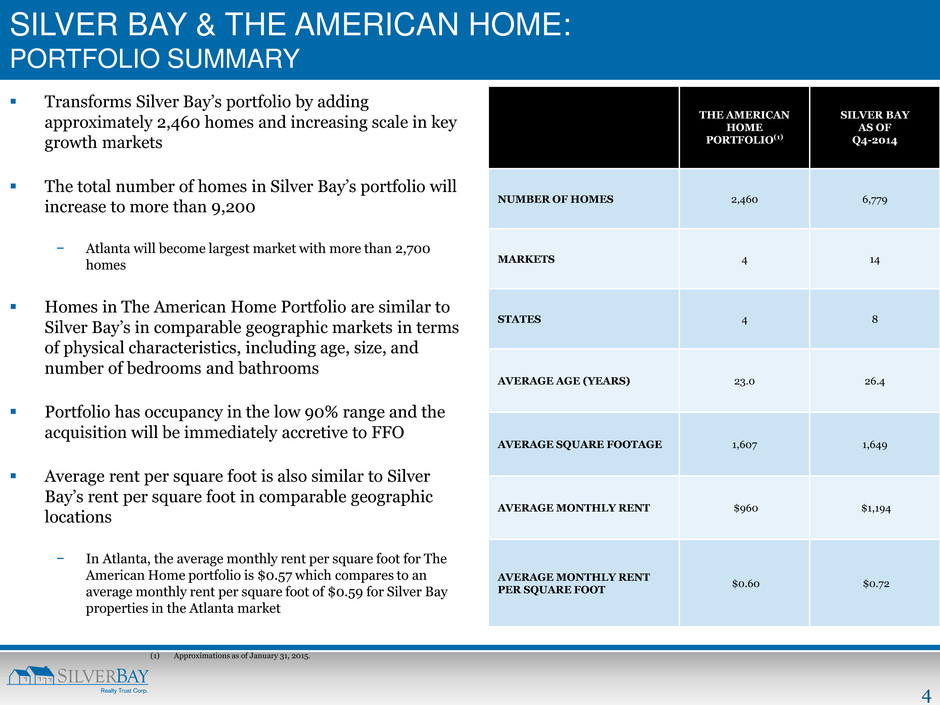
4 SILVER BAY & THE AMERICAN HOME: PORTFOLIO SUMMARY Transforms Silver Bay’s portfolio by adding approximately 2,460 homes and increasing scale in key growth markets The total number of homes in Silver Bay’s portfolio will increase to more than 9,200 − Atlanta will become largest market with more than 2,700 homes Homes in The American Home Portfolio are similar to Silver Bay’s in comparable geographic markets in terms of physical characteristics, including age, size, and number of bedrooms and bathrooms Portfolio has occupancy in the low 90% range and the acquisition will be immediately accretive to FFO Average rent per square foot is also similar to Silver Bay’s rent per square foot in comparable geographic locations − In Atlanta, the average monthly rent per square foot for The American Home portfolio is $0.57 which compares to an average monthly rent per square foot of $0.59 for Silver Bay properties in the Atlanta market THE AMERICAN HOME PORTFOLIO(1) SILVER BAY AS OF Q4-2014 NUMBER OF HOMES 2,460 6,779 MARKETS 4 14 STATES 4 8 AVERAGE AGE (YEARS) 23.0 26.4 AVERAGE SQUARE FOOTAGE 1,607 1,649 AVERAGE MONTHLY RENT $960 $1,194 AVERAGE MONTHLY RENT PER SQUARE FOOT $0.60 $0.72 (1) Approximations as of January 31, 2015.
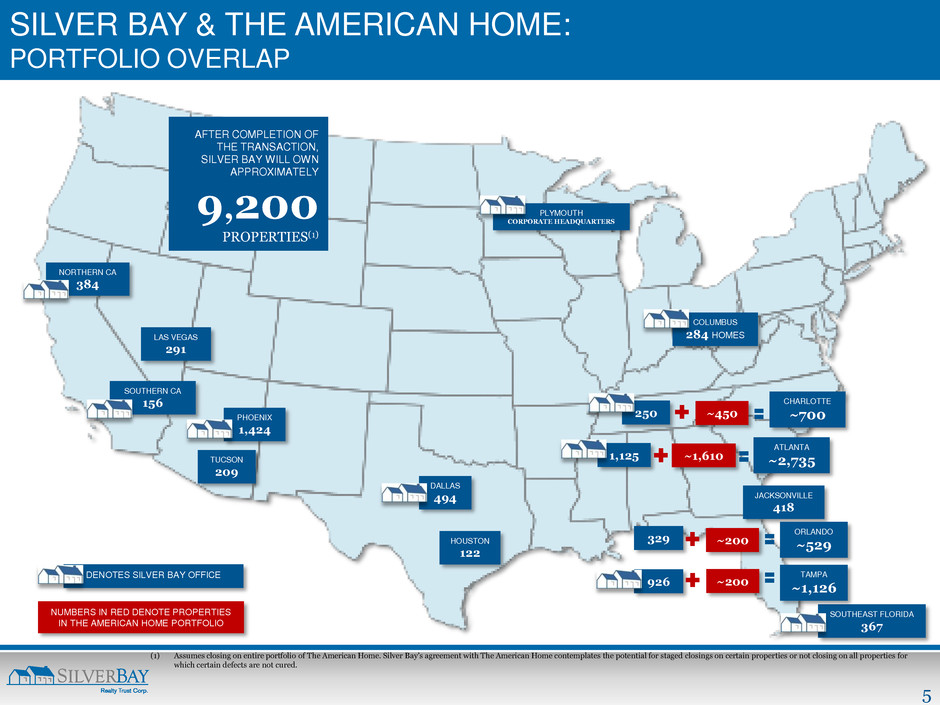
5 SILVER BAY & THE AMERICAN HOME: PORTFOLIO OVERLAP DENOTES SILVER BAY OFFICE NORTHERN CA 384 SOUTHERN CA 156 LAS VEGAS 291 PHOENIX 1,424 TUCSON 209 DALLAS 494 HOUSTON 122 SOUTHEAST FLORIDA 367 926 329 JACKSONVILLE 418 1,125 250 COLUMBUS 284 HOMES PLYMOUTH CORPORATE HEADQUARTERS ~1,610 ATLANTA ~2,735 ~450 CHARLOTTE ~700 ~200 TAMPA ~1,126 ~200 ORLANDO ~529 AFTER COMPLETION OF THE TRANSACTION, SILVER BAY WILL OWN APPROXIMATELY 9,200 PROPERTIES(1) NUMBERS IN RED DENOTE PROPERTIES IN THE AMERICAN HOME PORTFOLIO (1) Assumes closing on entire portfolio of The American Home. Silver Bay’s agreement with The American Home contemplates the potential for staged closings on certain properties or not closing on all properties for which certain defects are not cured.
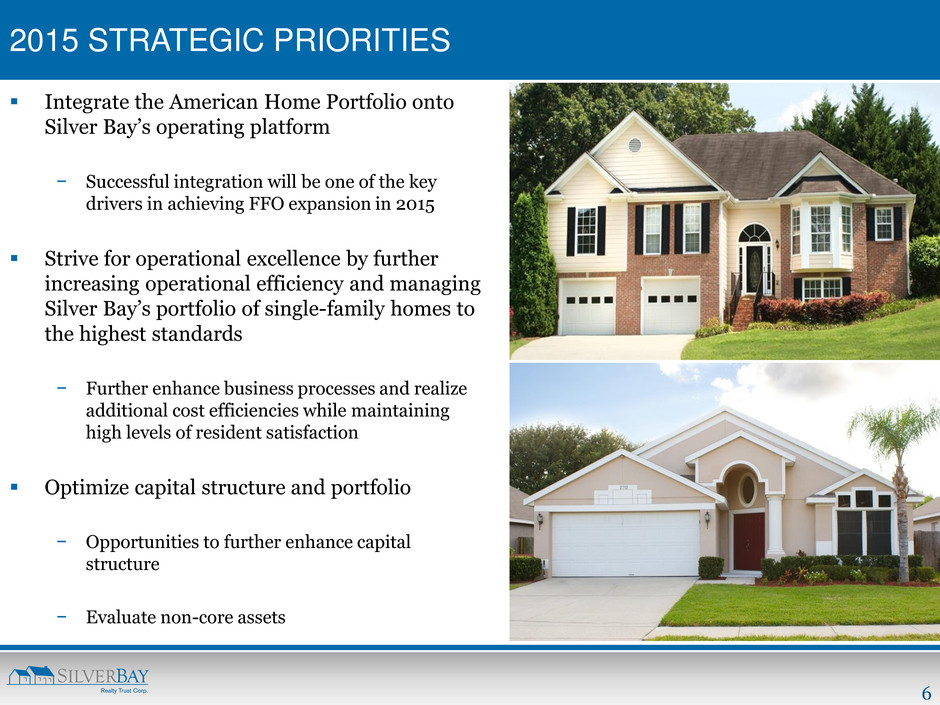
6 2015 STRATEGIC PRIORITIES Integrate the American Home Portfolio onto Silver Bay’s operating platform − Successful integration will be one of the key drivers in achieving FFO expansion in 2015 Strive for operational excellence by further increasing operational efficiency and managing Silver Bay’s portfolio of single-family homes to the highest standards − Further enhance business processes and realize additional cost efficiencies while maintaining high levels of resident satisfaction Optimize capital structure and portfolio − Opportunities to further enhance capital structure − Evaluate non-core assets
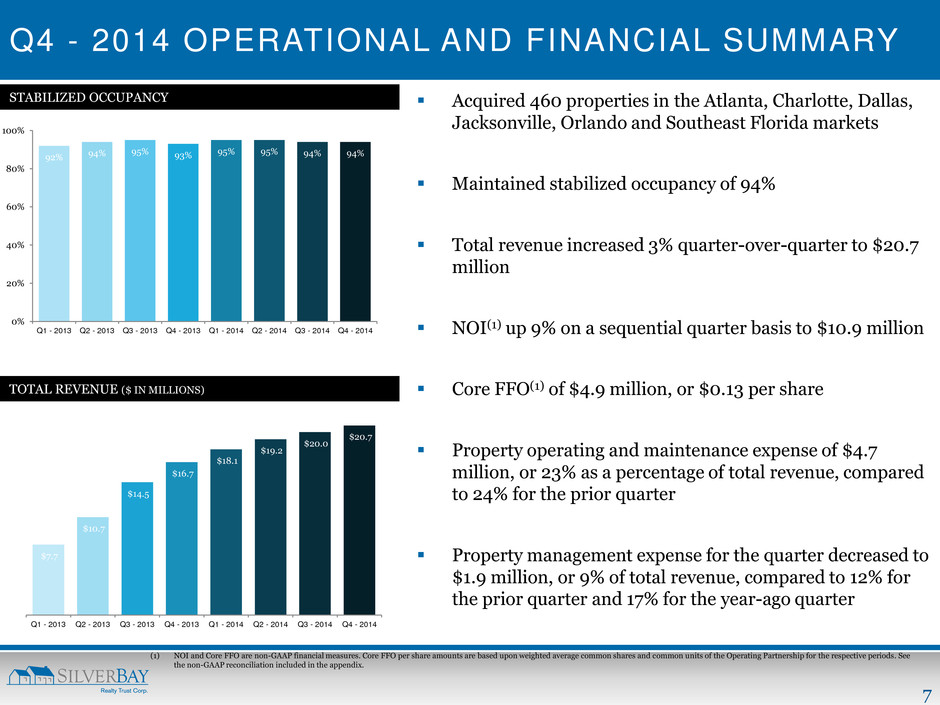
7 Q4 - 2014 OPERATIONAL AND FINANCIAL SUMMARY Acquired 460 properties in the Atlanta, Charlotte, Dallas, Jacksonville, Orlando and Southeast Florida markets Maintained stabilized occupancy of 94% Total revenue increased 3% quarter-over-quarter to $20.7 million NOI(1) up 9% on a sequential quarter basis to $10.9 million Core FFO(1) of $4.9 million, or $0.13 per share Property operating and maintenance expense of $4.7 million, or 23% as a percentage of total revenue, compared to 24% for the prior quarter Property management expense for the quarter decreased to $1.9 million, or 9% of total revenue, compared to 12% for the prior quarter and 17% for the year-ago quarter (1) NOI and Core FFO are non-GAAP financial measures. Core FFO per share amounts are based upon weighted average common shares and common units of the Operating Partnership for the respective periods. See the non-GAAP reconciliation included in the appendix. 92% 94% 95% 93% 95% 95% 94% 94% 0% 20% 40% 60% 80% 100% Q1 - 2013 Q2 - 2013 Q3 - 2013 Q4 - 2013 Q1 - 2014 Q2 - 2014 Q3 - 2014 Q4 - 2014 $7.7 $10.7 $14.5 $16.7 $18.1 $19.2 $20.0 $20.7 Q1 - 2013 Q2 - 2013 Q3 - 2013 Q4 - 2013 Q1 - 2014 Q2 - 2014 Q3 - 2014 Q4 - 2014 TOTAL REVENUE ($ IN MILLIONS) STABILIZED OCCUPANCY
8 A P P E N D I X
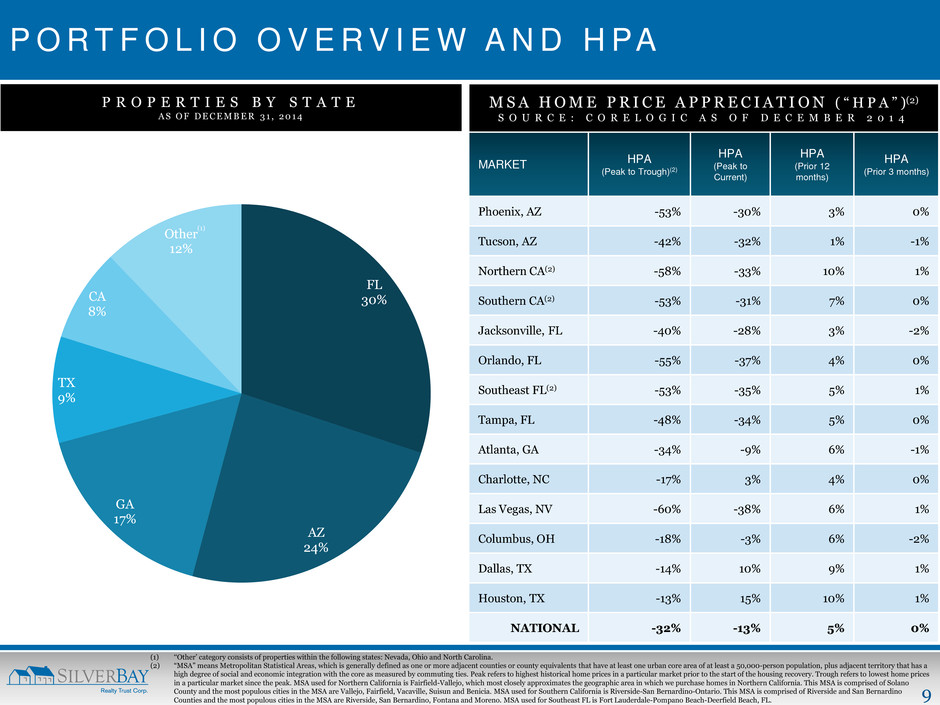
9 P O R T F O L I O O V E R V I E W A N D H PA P R O P E R T I E S B Y S T A T E A S O F D E C E M B E R 3 1 , 2 0 1 4 (1) ‘‘Other’ category consists of properties within the following states: Nevada, Ohio and North Carolina. (2) “MSA” means Metropolitan Statistical Areas, which is generally defined as one or more adjacent counties or county equivalents that have at least one urban core area of at least a 50,000-person population, plus adjacent territory that has a high degree of social and economic integration with the core as measured by commuting ties. Peak refers to highest historical home prices in a particular market prior to the start of the housing recovery. Trough refers to lowest home prices in a particular market since the peak. MSA used for Northern California is Fairfield-Vallejo, which most closely approximates the geographic area in which we purchase homes in Northern California. This MSA is comprised of Solano County and the most populous cities in the MSA are Vallejo, Fairfield, Vacaville, Suisun and Benicia. MSA used for Southern California is Riverside-San Bernardino-Ontario. This MSA is comprised of Riverside and San Bernardino Counties and the most populous cities in the MSA are Riverside, San Bernardino, Fontana and Moreno. MSA used for Southeast FL is Fort Lauderdale-Pompano Beach-Deerfield Beach, FL. FL 30% AZ 24% GA 17% TX 9% CA 8% Other 12% M S A H O M E P R I C E A P P R E C I A T I O N ( “ H P A ” )(2) S O U R C E : C O R E L O G I C A S O F D E C E M B E R 2 0 1 4 MARKET HPA (Peak to Trough)(2) HPA (Peak to Current) HPA (Prior 12 months) HPA (Prior 3 months) Phoenix, AZ -53% -30% 3% 0% Tucson, AZ -42% -32% 1% -1% Northern CA(2) -58% -33% 10% 1% Southern CA(2) -53% -31% 7% 0% Jacksonville, FL -40% -28% 3% -2% Orlando, FL -55% -37% 4% 0% Southeast FL(2) -53% -35% 5% 1% Tampa, FL -48% -34% 5% 0% Atlanta, GA -34% -9% 6% -1% Charlotte, NC -17% 3% 4% 0% Las Vegas, NV -60% -38% 6% 1% Columbus, OH -18% -3% 6% -2% Dallas, TX -14% 10% 9% 1% Houston, TX -13% 15% 10% 1% NATIONAL -32% -13% 5% 0% (1)
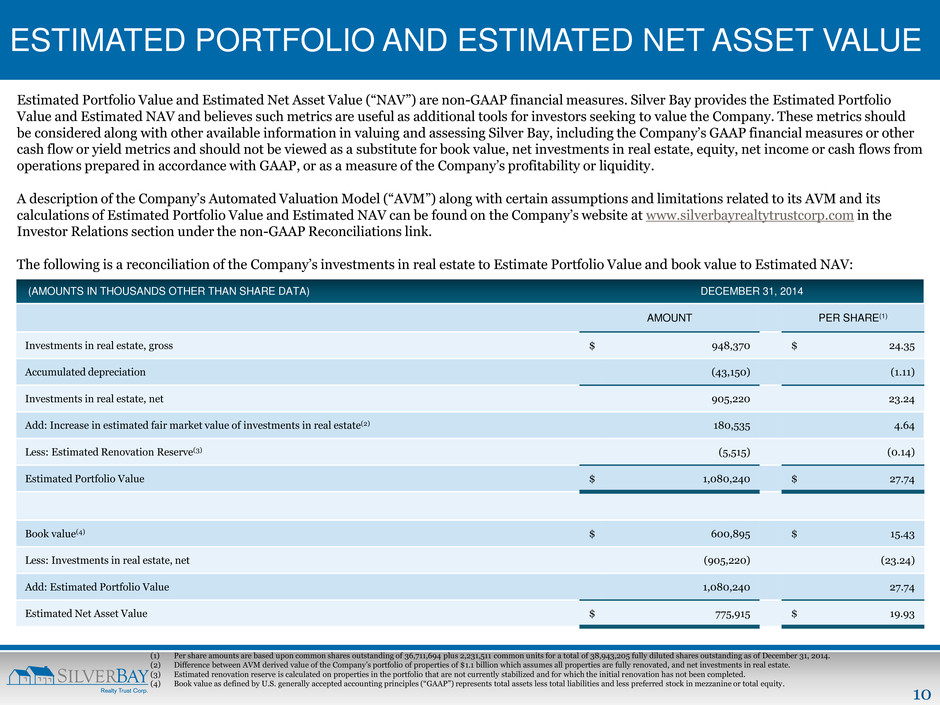
10 ESTIMATED PORTFOLIO AND ESTIMATED NET ASSET VALUE Estimated Portfolio Value and Estimated Net Asset Value (“NAV”) are non-GAAP financial measures. Silver Bay provides the Estimated Portfolio Value and Estimated NAV and believes such metrics are useful as additional tools for investors seeking to value the Company. These metrics should be considered along with other available information in valuing and assessing Silver Bay, including the Company’s GAAP financial measures or other cash flow or yield metrics and should not be viewed as a substitute for book value, net investments in real estate, equity, net income or cash flows from operations prepared in accordance with GAAP, or as a measure of the Company’s profitability or liquidity. A description of the Company’s Automated Valuation Model (“AVM”) along with certain assumptions and limitations related to its AVM and its calculations of Estimated Portfolio Value and Estimated NAV can be found on the Company’s website at www.silverbayrealtytrustcorp.com in the Investor Relations section under the non-GAAP Reconciliations link. The following is a reconciliation of the Company’s investments in real estate to Estimate Portfolio Value and book value to Estimated NAV: (1) Per share amounts are based upon common shares outstanding of 36,711,694 plus 2,231,511 common units for a total of 38,943,205 fully diluted shares outstanding as of December 31, 2014. (2) Difference between AVM derived value of the Company’s portfolio of properties of $1.1 billion which assumes all properties are fully renovated, and net investments in real estate. (3) Estimated renovation reserve is calculated on properties in the portfolio that are not currently stabilized and for which the initial renovation has not been completed. (4) Book value as defined by U.S. generally accepted accounting principles (“GAAP”) represents total assets less total liabilities and less preferred stock in mezzanine or total equity. (AMOUNTS IN THOUSANDS OTHER THAN SHARE DATA) DECEMBER 31, 2014 AMOUNT PER SHARE(1) Investments in real estate, gross $ 948,370 $ 24.35 Accumulated depreciation (43,150) (1.11) Investments in real estate, net 905,220 23.24 Add: Increase in estimated fair market value of investments in real estate(2) 180,535 4.64 Less: Estimated Renovation Reserve(3) (5,515) (0.14) Estimated Portfolio Value $ 1,080,240 $ 27.74 Book value(4) $ 600,895 $ 15.43 Less: Investments in real estate, net (905,220) (23.24) Add: Estimated Portfolio Value 1,080,240 27.74 Estimated Net Asset Value $ 775,915 $ 19.93

11 N E T O P E R A T I N G I N C O M E Net operating income (“NOI”) is a non-GAAP financial measure defined by the Company as total revenue less property operating and maintenance, real estate taxes, homeowners’ association fees, property management expenses, and certain other non-cash or unrelated non-operating expenses. NOI excludes depreciation and amortization, advisory management fees, management internalization, general and administrative expenses, interest expense, and other expenses. Additionally, NOI excludes costs incurred on market ready properties prior to their initial lease, the 5% property management fee payable prior to the Internalization because it more closely represents additional advisory management fee, management internalization, non-cash share based property management stock compensation, expensed acquisition fees and costs, and certain other property management costs. NOI is a non-GAAP financial measure that the company considers to be meaningful, when considered with the financial statements determined in accordance with U.S. GAAP. The Company believes NOI is helpful to investors in understanding the core performance of the real estate operations of the Company. The following is a reconciliation of the Company’s NOI to net loss as determined in accordance with GAAP (amounts in thousands): THREE MONTHS ENDED YEAR ENDED THREE MONTHS ENDED DECEMBER 31, 2014 DECEMBER 31, 2013 DECEMBER 31, 2014 DECEMBER 31, 2013 SEPTEMBER 30, 2014 Net loss $ (2,492) $ (5,060) $ (56,697) $ (24,550) $ (44,870) Depreciation and amortization 6,823 6,174 25,623 20,235 6,427 Advisory management fee - affiliates - 2,179 6,621 9,775 2,251 Management internalization 194 - 39,373 - 39,179 General and administrative 3,278 2,110 11,079 7,453 2,331 Interest expense 2,876 1,764 12,066 2,911 4,221 Other 88 594 611 1,284 161 Property operating and maintenance add back: Market ready costs prior to initial lease 58 - 278 - 76 Property management add backs: 5% property management fee - 116 288 645 97 Acquisitions fees and costs expensed - 130 60 840 - System implementation costs - 278 139 971 15 Other 30 7 268 308 85 Total property management add backs 30 531 755 2,764 197 Net operating income $ 10,855 $ 8,292 $ 39,709 $ 19,872 $ 9,973 Net operating income as a percentage of total revenue 52.5% 49.6% 51.0% 40.1% 49.9%
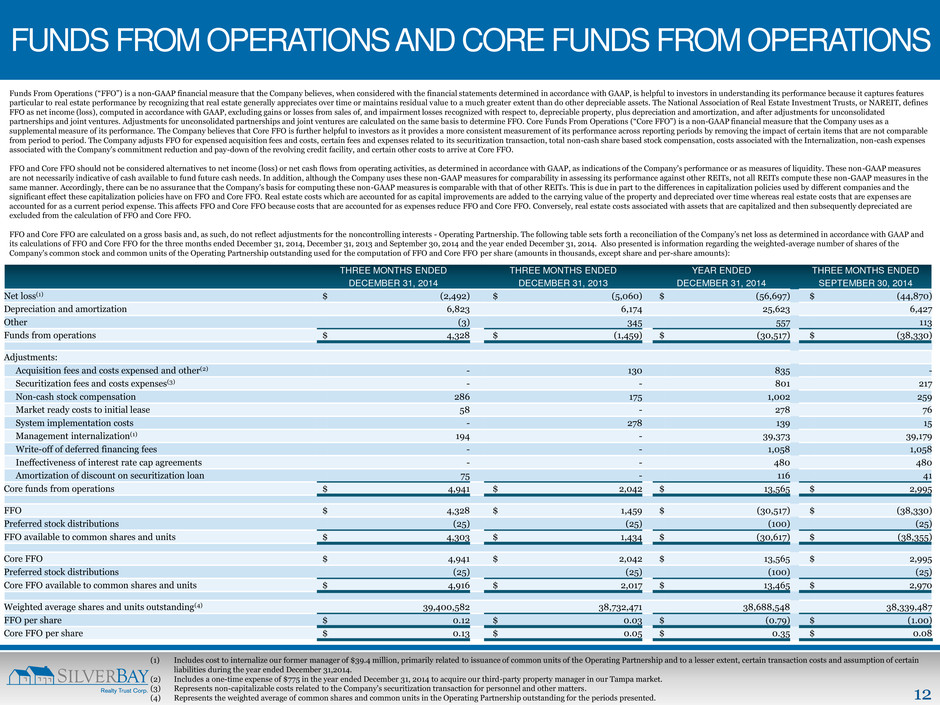
12 FUNDS FROM OPERATIONS AND CORE FUNDS FROM OPERATIONS Funds From Operations (“FFO”) is a non-GAAP financial measure that the Company believes, when considered with the financial statements determined in accordance with GAAP, is helpful to investors in understanding its performance because it captures features particular to real estate performance by recognizing that real estate generally appreciates over time or maintains residual value to a much greater extent than do other depreciable assets. The National Association of Real Estate Investment Trusts, or NAREIT, defines FFO as net income (loss), computed in accordance with GAAP, excluding gains or losses from sales of, and impairment losses recognized with respect to, depreciable property, plus depreciation and amortization, and after adjustments for unconsolidated partnerships and joint ventures. Adjustments for unconsolidated partnerships and joint ventures are calculated on the same basis to determine FFO. Core Funds From Operations (“Core FFO”) is a non-GAAP financial measure that the Company uses as a supplemental measure of its performance. The Company believes that Core FFO is further helpful to investors as it provides a more consistent measurement of its performance across reporting periods by removing the impact of certain items that are not comparable from period to period. The Company adjusts FFO for expensed acquisition fees and costs, certain fees and expenses related to its securitization transaction, total non-cash share based stock compensation, costs associated with the Internalization, non-cash expenses associated with the Company's commitment reduction and pay-down of the revolving credit facility, and certain other costs to arrive at Core FFO. FFO and Core FFO should not be considered alternatives to net income (loss) or net cash flows from operating activities, as determined in accordance with GAAP, as indications of the Company's performance or as measures of liquidity. These non-GAAP measures are not necessarily indicative of cash available to fund future cash needs. In addition, although the Company uses these non-GAAP measures for comparability in assessing its performance against other REITs, not all REITs compute these non-GAAP measures in the same manner. Accordingly, there can be no assurance that the Company's basis for computing these non-GAAP measures is comparable with that of other REITs. This is due in part to the differences in capitalization policies used by different companies and the significant effect these capitalization policies have on FFO and Core FFO. Real estate costs which are accounted for as capital improvements are added to the carrying value of the property and depreciated over time whereas real estate costs that are expenses are accounted for as a current period expense. This affects FFO and Core FFO because costs that are accounted for as expenses reduce FFO and Core FFO. Conversely, real estate costs associated with assets that are capitalized and then subsequently depreciated are excluded from the calculation of FFO and Core FFO. FFO and Core FFO are calculated on a gross basis and, as such, do not reflect adjustments for the noncontrolling interests - Operating Partnership. The following table sets forth a reconciliation of the Company’s net loss as determined in accordance with GAAP and its calculations of FFO and Core FFO for the three months ended December 31, 2014, December 31, 2013 and September 30, 2014 and the year ended December 31, 2014. Also presented is information regarding the weighted-average number of shares of the Company's common stock and common units of the Operating Partnership outstanding used for the computation of FFO and Core FFO per share (amounts in thousands, except share and per-share amounts): THREE MONTHS ENDED DECEMBER 31, 2014 THREE MONTHS ENDED DECEMBER 31, 2013 YEAR ENDED DECEMBER 31, 2014 THREE MONTHS ENDED SEPTEMBER 30, 2014 Net loss(1) $ (2,492) $ (5,060) $ (56,697) $ (44,870) Depreciation and amortization 6,823 6,174 25,623 6,427 Other (3) 345 557 113 Funds from operations $ 4,328 $ (1,459) $ (30,517) $ (38,330) Adjustments: Acquisition fees and costs expensed and other(2) - 130 835 - Securitization fees and costs expenses(3) - - 801 217 Non-cash stock compensation 286 175 1,002 259 Market ready costs to initial lease 58 - 278 76 System implementation costs - 278 139 15 Management internalization(1) 194 - 39,373 39,179 Write-off of deferred financing fees - - 1,058 1,058 Ineffectiveness of interest rate cap agreements - - 480 480 Amortization of discount on securitization loan 75 - 116 41 Core funds from operations $ 4,941 $ 2,042 $ 13,565 $ 2,995 FFO $ 4,328 $ 1,459 $ (30,517) $ (38,330) Preferred stock distributions (25) (25) (100) (25) FFO available to common shares and units $ 4,303 $ 1,434 $ (30,617) $ (38,355) Core FFO $ 4,941 $ 2,042 $ 13,565 $ 2,995 Preferred stock distributions (25) (25) (100) (25) Core FFO available to common shares and units $ 4,916 $ 2,017 $ 13,465 $ 2,970 Weighted average shares and units outstanding(4) 39,400,582 38,732,471 38,688,548 38,339,487 FFO per share $ 0.12 $ 0.03 $ (0.79) $ (1.00) Core FFO per share $ 0.13 $ 0.05 $ 0.35 $ 0.08 (1) Includes cost to internalize our former manager of $39.4 million, primarily related to issuance of common units of the Operating Partnership and to a lesser extent, certain transaction costs and assumption of certain liabilities during the year ended December 31,2014. (2) Includes a one-time expense of $775 in the year ended December 31, 2014 to acquire our third-party property manager in our Tampa market. (3) Represents non-capitalizable costs related to the Company's securitization transaction for personnel and other matters. (4) Represents the weighted average of common shares and common units in the Operating Partnership outstanding for the periods presented.

13 3300 FERNBROOK LANE NORTH| SUITE 210 | PLYMOUTH | MN | 55477 P: 952.358.4400 | E: INVES TO RS@ SILVERBAYMGMT .C OM
