Attached files
| file | filename |
|---|---|
| EX-3.2 - EXHIBIT 3.2 - Silver Bay Realty Trust Corp. | sby2015123110kexh32.htm |
| EX-31.2 - EXHIBIT 31.2 - Silver Bay Realty Trust Corp. | sby2015123110kexh312.htm |
| EX-2.14 - EXHIBIT 2.14 - Silver Bay Realty Trust Corp. | sby2015123110kexh214.htm |
| EX-32.1 - EXHIBIT 32.1 - Silver Bay Realty Trust Corp. | sby2015123110kexh321.htm |
| EX-32.2 - EXHIBIT 32.2 - Silver Bay Realty Trust Corp. | sby2015123110kexh322.htm |
| EX-23.1 - EXHIBIT 23.1 - Silver Bay Realty Trust Corp. | sby2015123110kexh231.htm |
| EX-21.1 - EXHIBIT 21.1 - Silver Bay Realty Trust Corp. | sby2015123110kexh211.htm |
| EX-31.1 - EXHIBIT 31.1 - Silver Bay Realty Trust Corp. | sby2015123110kexh311.htm |
UNITED STATES
SECURITIES AND EXCHANGE COMMISSION
Washington, D.C. 20549
Form 10-K
(Mark One)
x | ANNUAL REPORT PURSUANT TO SECTION 13 OR 15(d) OF THE SECURITIES EXCHANGE ACT OF 1934 |
For the fiscal year ended December 31, 2015
o | TRANSITION REPORT PURSUANT TO SECTION 13 OR 15(d) OF THE SECURITIES EXCHANGE ACT OF 1934 |
For the transition period from to
Commission file number 001- 35760
SILVER BAY REALTY TRUST CORP.
(Exact name of registrant as specified in its charter)
Maryland | 90-0867250 | |
(State or other jurisdiction of | (I.R.S. Employer | |
incorporation or organization) | Identification No.) | |
3300 Fernbrook Lane North, Suite 210 | ||
Plymouth, Minnesota | 55447 | |
(Address of principal executive offices) | (Zip Code) | |
(952) 358-4400
(Registrant’s telephone number, including area code)
Securities registered pursuant to Section 12(b) of the Act:
Title of Each Class | Name of Each Exchange on Which Registered | |
Common Stock, $0.01 par value | New York Stock Exchange | |
Securities registered pursuant to section 12(g) of the Act: None
Indicate by check mark if the registrant is a well-known seasoned issuer, as defined in Rule 405 of the Securities Act. Yes o No x
Indicate by check mark if the registrant is not required to file reports pursuant to Section 13 or Section 15(d) of the Act. Yes o No x
Indicate by check mark whether the registrant (1) has filed all reports required to be filed by Section 13 or 15(d) of the Securities Exchange Act of 1934 during the preceding 12 months (or for such shorter period that the registrant was required to file such reports), and (2) has been subject to such filing requirements for the past 90 days. Yes x No o
Indicate by check mark whether the registrant has submitted electronically and posted on its corporate Web site, if any, every Interactive Data File required to be submitted and posted pursuant to Rule 405 of Regulation S-T (§ 232.405 of this chapter) during the preceding 12 months (or for such shorter period that the registrant was required to submit and post such files). Yes x No o
Indicate by check mark if disclosure of delinquent filers pursuant to Item 405 of Regulation S-K (§ 229.405 of this chapter) is not contained herein, and will not be contained, to the best of registrant’s knowledge, in definitive proxy or information statements incorporated by reference in Part III of this Form 10-K or any amendment to this Form 10-K. x
Indicate by check mark whether the registrant is a large accelerated filer, an accelerated filer, a non-accelerated filer, or a smaller reporting company. See the definitions of “large accelerated filer,” “accelerated filer” and “smaller reporting company” in Rule 12b-2 of the Exchange Act. (Check one):
Large accelerated filer o | Accelerated filer x | Non-accelerated filer o | Smaller reporting company o | |||
(Do not check if a smaller reporting company) | ||||||
Indicate by check mark whether the registrant is a shell company (as defined in Rule 12b-2 of the Act). Yes o No x
As of June 30, 2015, the aggregate market value of the registrant’s common stock held by non-affiliates of the registrant was $545 million based on the closing sale price as reported on the NYSE on June 30, 2015.
As of February 22, 2016, 36,160,766 shares of common stock, par value $0.01 per share, of Silver Bay Realty Trust Corp. were outstanding.
DOCUMENTS INCORPORATED BY REFERENCE
Part III of this Annual Report on Form 10-K incorporates by reference certain information from the definitive proxy statement to be filed for the registrant’s 2016 Annual Meeting of Stockholders. The registrant intends to file the proxy statement with the Securities and Exchange Commission within 120 days of December 31, 2015.
Table of Contents
Page | ||
SPECIAL NOTE REGARDING FORWARD-LOOKING STATEMENTS
This Annual Report on Form 10-K and its exhibits contain forward-looking statements within the meaning of the federal securities laws. Forward-looking statements relate to expectations, beliefs, projections, future plans and strategies, anticipated events or trends and similar expressions concerning matters that are not historical facts. In some cases, you can identify forward-looking statements by the use of forward-looking terminology such as “may,” “will,” “should,” “expects,” “intends,” “plans,” “anticipates,” “believes,” “estimates,” “predicts,” or “potential” or the negative of these words and phrases or similar words or phrases which are predictions of or indicate future events or trends and which do not relate solely to historical matters. You can also identify forward-looking statements by discussions of strategy, plans or intentions. Examples of forward-looking statements include statements about our projected operating results, our ability to successfully lease and operate acquired properties, including turnover rates, projected operating costs, estimates relating to our ability to make distributions to our stockholders in the future, market trends in our industry, real estate values and prices, and the general economy.
The forward-looking statements contained in this report reflect our current views about future events and are subject to numerous known and unknown risks, uncertainties, assumptions and changes in circumstances that may cause our actual results to differ significantly from those expressed or implied in any forward-looking statement. We are not able to predict all of the factors that may affect future results. We caution you therefore against relying on any of these forward-looking statements. They are neither statements of historical fact nor guarantees or assurances of future performance. Important factors that could cause actual results to differ materially from those in the forward-looking statements include national, regional or local economic, business, competitive, market and regulatory conditions and the following:
• | Those factors described in the discussion on risk factors in Part I, Item 1A, “Risk Factors,” Part II, Item 7A "Quantitative and Qualitative Disclosures about Market Risk" and Part II, Item 7 “Management’s Discussion and Analysis of Financial Condition and Results of Operations” in this Annual Report on Form 10-K and other risks and uncertainties detailed in this and our other reports and filings with the Securities and Exchange Commission. |
• | Our ability to successfully employ a new and untested business model in a new industry with no proven track record; |
• | Poor performance of the properties acquired in the Portfolio Acquisition (defined below); |
• | Real estate appreciation or depreciation in our markets and the supply of single-family homes in our markets; |
• | General economic conditions in our markets, such as changes in employment and household earnings and expenses or the reversal of population, employment, or homeownership trends in our markets that could affect the demand for rental housing; |
Our ability to maintain high occupancy rates and to attract and retain qualified residents in light of increased competition in the leasing market for quality residents and the relatively short duration of our leases;
• | Our ability to maintain rents at levels that are sufficient to keep pace with rising costs of operations; |
• | Lease defaults by our residents; |
• | Our ability to contain renovation, maintenance, turnover, marketing, and other operating costs for our properties; |
• | Our ability to continue to build our operational expertise and to establish our platform and processes related to residential management; |
• | Our dependence on key personnel to carry out our business and investment strategies and our ability to hire and retain skilled managerial, investment, financial, and operational personnel; |
• | The performance of third-party vendors and service providers, including third-party management professionals, maintenance providers, leasing agents, and property managers; |
• | Our ability to obtain additional capital or debt financing to expand our portfolio of single-family properties and our ability to repay our debt, including borrowings under our revolving credit facility and securitization loan and to meet our other obligations under our revolving credit facility and securitization loan; |
3
• | Competition from other investors in identifying and acquiring single-family properties that meet our underwriting criteria and leasing such properties to qualified residents; |
• | The availability of additional properties that meet our criteria and our ability to purchase such properties on favorable terms; |
• | The accuracy of assumptions in determining whether a particular property meets our investment criteria, including assumptions related to estimated time of possession and estimated renovation costs and time frames, annual operating costs, market rental rates and potential rent amounts, time from purchase to leasing, and resident default rates; |
• | Our ability to accurately estimate the time and expense required to possess, renovate, repair, upgrade, and rent properties and to keep them maintained in rentable condition, and the existence of unforeseen defects and problems that require extensive renovation and capital expenditures; |
• | The concentration of our investments in single-family properties which subject us to risks inherent in investments in a single type of property and seasonal fluctuations in rental demand; |
• | The concentration of our properties in our markets, which increases the risk of adverse changes in our operating results if there were adverse developments in local economic conditions or the demand for single-family rental homes or natural disasters in these markets; and |
• | Failure to qualify as a REIT or to remain qualified as a REIT, which will subject us to federal income tax at regular corporate rates and could subject us to a substantial tax liability. |
The forward-looking statements in this Annual Report on Form 10-K represent our views as of the date of this report. We anticipate that subsequent events and developments will cause our views to change. However, while we may elect to update these forward-looking statements at some point in the future, we have no current intention of doing so except to the extent required by applicable laws. You should, therefore, not rely on these forward-looking statements as representing our views as of any date subsequent to the date of this Annual Report on Form 10-K.
4
PART I
Item 1. Business.
We are an internally-managed Maryland corporation focused on the acquisition, renovation, leasing, and management of single-family properties in select markets in the United States. Our objective is to generate attractive risk-adjusted returns for our stockholders over the long term through dividends and capital appreciation. We generate virtually all of our revenue by leasing our portfolio of single-family properties. As of December 31, 2015, we owned 9,022 single-family properties in Arizona, California, Florida, Georgia, Nevada, North Carolina, Ohio, South Carolina and Texas, excluding properties reflected as assets held for sale on our consolidated balance sheets.
We have elected to be treated as a real estate investment trust ("REIT") for U.S. federal tax purposes, commencing with, and in connection with the filing of our federal tax return for, the taxable year ended December 31, 2012. As a REIT, we generally are not subject to federal income tax on the taxable income that we distribute to our stockholders. If we fail to qualify as a REIT in any taxable year, we will be subject to federal income tax at regular corporate rates. Even if we continue to qualify for taxation as a REIT, we may be subject to some federal, state and local taxes on our income or property. In addition, the income of our taxable REIT subsidiaries ("TRSs") is subject to taxation at regular corporate rates.
Silver Bay Realty Trust Corp. was incorporated in Maryland in June 2012. Silver Bay Realty Trust Corp. conducts its business and owns all of its properties through Silver Bay Operating Partnership L.P. (the "Operating Partnership"), a Delaware limited partnership. Silver Bay Realty Trust Corp.'s wholly owned subsidiary, Silver Bay Management LLC (the "General Partner") is the sole general partner of the Operating Partnership. Silver Bay Realty Trust Corp. has no material assets or liabilities other than its investment in the Operating Partnership. As of December 31, 2015, Silver Bay Realty Trust Corp. owned, through a combination of direct and indirect interests, 94.2% of the partnership interests in the Operating Partnership. Except as otherwise required by the context, references to the “Company,” “Silver Bay,” “we,” “us” and “our” refer collectively to Silver Bay Realty Trust Corp., the Operating Partnership and the direct and indirect subsidiaries of each.
Through September 30, 2014, we were externally managed by PRCM Real Estate Advisers LLC (our "Former Manager"). During this time, we relied on our Former Manager to provide or obtain on our behalf the personnel and services necessary for us to conduct our business as we had no employees of our own. On September 30, 2014, we closed a transaction to internalize our management (the "Internalization") and now own all material assets and intellectual property rights of our Former Manager previously used in the conduct of its business. In connection with the Internalization, the officers and employees who worked for our Former Manager became our employees.
Our principal executive office is located at 3300 Fernbrook Lane North, Suite 210, Plymouth, Minnesota 55447. Our telephone number is (952) 358-4400. Our web address is www.silverbayrealtytrustcorp.com. Our common stock is listed on the New York Stock Exchange ("NYSE") under the symbol “SBY.”
Business Strategy
Our strategy is to acquire, renovate, lease, and manage single-family properties located in select markets in order to generate attractive risk-adjusted returns for our stockholders over the long term through dividends and capital appreciation. We intend to hold our properties over the long term. Although we may consider the opportunistic disposition of assets, we have no predetermined investment horizon that would require their sale.
Management Overview
Our approach to management relies on centralization of corporate oversight and certain property management functions. Immediate property management functions for properties are performed at the local level by our local employees or, in some markets, by third-party local property management contractors. As of December 31, 2015, we had 176 employees and managed 94.5% of our properties directly without the use of third-party property managers in eleven markets (Atlanta, Phoenix, Tampa, Charlotte, Orlando, Dallas, Jacksonville, Southeast Florida, Northern and Southern California and Columbus). In markets managed by third parties, our regional asset management personnel oversee the local property managers in their performance of local property management functions. Our centralized platform consists of teams dedicated to (1) property management; (2) customer service and resident communication; (3) information technology; (4) marketing; (5) property renovations and maintenance; (6) acquisitions and (7) treasury, accounting, legal and corporate matters.
5
Acquisitions
Although we review potential acquisition opportunities from time to time and will consider making opportunistic acquisitions, we are not, as of this date of this report, actively acquiring new properties due to capital constraints. When we do acquire properties, we employ a top-down selection process in our investment strategy. We start by identifying what we believe are the most attractive markets for developing a single-family rental business by evaluating existing and projected housing dynamics. Housing prices and rental demand are driven in part by macroeconomic and demographic factors. We scrutinize many of these factors, including existing supply of homes, vacancy rates, prior and projected population and household growth, prior and projected migration, regional building activity, mortgage delinquency figures, employment trends, income ratios, and price-to-rent ratios.
Once in a market, we acquire single-family properties through a variety of acquisition channels, including brokers, multiple listing services, short sales, foreclosure auctions, online auctions, and portfolio purchases from institutions or investor groups. We focus on maintaining a disciplined property selection process that incorporates local knowledge to better understand the fundamentals of the housing markets in which we operate, and we continually reevaluate the capital allocation among our markets in which we are making acquisitions. Our multi-market and multi-channel investment strategy historically provided flexibility in deploying capital.
We conduct diligence on and underwrite each property we purchase. As part of the diligence process, our personnel conduct on-site assessments for broker and portfolio-sourced properties and drive-by inspections for auction-sourced properties. We also receive title commitments prior to closing for purchases outside the auction process and use a network of title insurance providers to conduct preliminary title work before purchasing properties through the auction channel. When underwriting a property, our personnel determine the maximum purchase price at which a property would meet our net yield requirements using a model that incorporates factors such as estimated rent, renovation costs, operating expenses, ongoing capital expenditures, and vacancy. Our underwriting process assumes that the property will be held for an indefinite period of time and does not reflect an assumed rental growth rate. This net-yield based price is then compared to the market price, which is determined by local personnel using comparable sales analysis, and reduced to the market price if the market price is less than the net yield based price. For portfolio acquisitions, we have historically assessed market pricing using our proprietary automated valuation model designed to assess hundreds of potentially comparable properties and evaluate thousands of data points.
Acquisitions may be financed from various sources, including proceeds from the sale of equity securities, retained cash flow, debt financings, securitizations, or the issuance of common units in the Operating Partnership. Availability of financing from such sources on acceptable terms will greatly impact our pace of acquisitions, as will our current preference for portfolio acquisitions, which are inherently less predictable than purchases through other channels.
Property Renovation
Most of our properties have required renovation and standardization before they are ready for resident occupancy. We refer to the process of possessing, renovating, marketing, and leasing a property as property stabilization. Our renovation and maintenance approach is generally consistent across our various acquisition channels. We maintain system-wide standards for our properties that are implemented at the local level and directed at increasing attractiveness to potential residents, reducing future maintenance expense, and increasing the long-term value of the property. Currently, our local project management personnel oversee the renovation of our properties in all of our markets. Historically, we used a mix of employees of our Former Manager and third-party property managers to oversee the work of local contractors engaged to renovate our properties.
Following acquisition of a property, our project managers use Silver Bay’s renovation standards, including any market-specific requirements, to prepare a project scope for initial renovation. Project managers then circulate the project scopes for bid to our approved contractors and vendors. All final bids are approved by construction managers. Once renovation work commences, local project management personnel oversee its quality of work and timely completion. Following completion of a renovation, our personnel perform a detailed quality control inspection to validate that the agreed-upon work has been completed and to determine that the property is in rent-ready condition.
Operations and Management
General. Our leasing and management strategy seeks to maximize revenue by balancing occupancy and rental rates while minimizing our operating expenses. To meet these objectives, we focus on finding qualified residents and reducing resident turnover by providing quality and consistency in our customer service, maintenance, leasing, and marketing operations. Our approach to management and operations relies on centralization of corporate oversight and certain property
6
management functions. Immediate property management functions for properties are performed at the local level in internally managed markets by our local employees or, in some markets, by third-party property managers.
Marketing. We establish the rental rates at which properties will be offered based on comparable rent analyses conducted by local property managers and reviewed by our regional property managers or chief operating officer. Factors considered in conducting comparable rent analyses include the size, age, condition, bedroom and bath count, and various qualitative factors, such as neighborhood characteristics and access to quality schools, transportation, employment centers and services of the subject home and the comparable properties.
We conduct marketing activities for all internally managed markets from a centralized location to achieve consistency and quality in our advertising. We advertise available properties through yard signage, internet-based services, our website, multiple listing services and local leasing contacts. In markets with third-party property management, local managers use similar advertising channels for properties they manage. We use third-party leasing agents to show our properties to prospective residents. In markets with third-party property management, local managers schedule showings for properties they manage and use a mix of employees or third-party leasing agents.
Lease Applications and Approvals. In markets that are internally managed, we receive lease applications online by means of our website, and applications are centrally processed for consistency and efficiency. Through our technology, much of the screening process for prospective residents is automated, which reduces processing time for any lease applicant in internally managed markets. In markets that are managed by third-party managers, a similar process is followed. Our underwriting criteria and leasing standards are used to screen all prospective residents and determine whether to approve or deny any lease application. Third-party property managers follow a similar process when screening for the properties they manage and are provided our screening criteria for use in screening prospective residents. The application and evaluation process in all markets includes obtaining appropriate identification, an evaluation of credit and income, a review of the applicant’s rental history, a background check for criminal activity and income verification. Waivers of any threshold underwriting criteria or leasing standards must be approved centrally in accordance with our policies.
Rent Collection. We have established centralized collections for all of our markets. Residents may pay rent online or through a variety of other electronic methods, debit or credit card, or by check mailed to a lockbox. Residents who do not pay rent by the end of the grace period are sent a notice and assessed a late fee. Receivables are monitored centrally on a regular basis. If an eviction action becomes necessary in markets that we manage internally, we engage local counsel to assist in processing the eviction in compliance with local laws. Third-party property managers follow a similar process.
Resident Relations and Property Maintenance. As part of our ongoing property management, we conduct routine repairs and maintenance as appropriate and manage resident relations to maximize long-term rental income and cash flows from our properties. We use a centralized call center for resident inquiries and maintenance requests. Residents can also contact us through the resident portal on our website in markets we directly manage. In markets with third-party property management, these third party managers handle repairs and maintenance and resident relations under the oversight of our regional managers.
Renewal and Turnover. We manage the lease renewal process centrally for all internally-managed markets. Prior to expiration of a lease, local managers receive a list of upcoming lease expirations and use comparable rent analyses to propose an appropriate renewal rate and new rent should the property become vacant. These rates are reviewed and approved by our regional property managers or chief operating officer. If a resident elects not to renew the lease, generally the resident will be allowed to remain in occupancy under a month-to-month tenancy with a rent at, or above, the existing rent. In markets managed by third-party property managers, a similar process is followed.
In the event of turnover, each property is inspected after the resident vacates to determine the necessary scope of repair work, and where applicable, offset the costs of such repairs against resident deposits. We use an extensive move-in and move-out checklist to determine what repairs are necessary in preparation for re-leasing the properties. Marketing begins in advance of the lease-ready date to minimize the number of days the home is on the market. Third-party property managers use similar processes in the event of a turnover in the markets they manage. Turnover work is processed in a similar manner to an initial renovation with approval of certain high cost turnovers in all markets, oversight of turnover by the local property manager and use of a detailed quality control checklist. In markets with third-party managers, our third party managers follow similar processes and receive approval for certain high cost turnovers.
7
Technology
Technology plays an important role in assisting us to build and manage a portfolio of geographically dispersed assets. We have developed and continue to develop a technological infrastructure with tools that:
• | centrally aggregate information from employees and third-party property managers; |
• | provide our employees and third-party property managers with tools to facilitate their various roles, including mobile applications that reduce the need for time spent in the office; |
• | screen target properties for acquisition; |
• | allow real-time monitoring and management of the portfolio; |
• | integrate property management, accounting and asset management systems; |
• | enable the residents to interact with us online; and |
• | use a secure and scalable cloud-based environment with mobile accessibility. |
Dispositions
We periodically sell properties after determining the property or related market no longer fit our portfolio and may sell properties when we view market conditions are favorable given other potential uses of capital. To date, our disposition activity has been limited. One unique feature of single-family rental properties derives from the dual market for the assets: the investor market and the owner-occupant market. When comparing the two markets, selling into the investor market typically has the advantage of lower transaction costs, faster execution and a limited period of time (if any) during which we hold the properties without generating positive cash flow. Selling into the owner-occupant market often results in greater gross selling prices, the extent to which varies greatly market-by-market, but also involves higher transaction costs and a period of time from move-out of the prior resident to sale during which we incur costs without corresponding revenue. When we decide to sell a market, we generally solicit competing bids from investors, consider the sales price of each proposal and compare such price to our estimate of pricing in the owner-occupant market. We then execute the sales type that we believe will provide the greatest value. When we decide to sell an individual property, we generally sell the property into the owner-occupant market using the applicable multiple listing service.
Acquisition of The American Home Real Estate Investment Trust, Inc. Portfolio
During the year ended December 31, 2015, we acquired a portfolio of 2,461 properties (the “Acquired Properties”) from the American Home Real Estate Investment Trust, Inc. ("TAH"). The acquisition was substantially completed on April 1, 2015 (the "Portfolio Acquisition"). The aggregate purchase price for the Portfolio Acquisition was $263.0 million. The Portfolio Acquisition was financed using proceeds obtained under our revolving credit facility, which was amended and restated on February 18, 2015 to increase the borrowing capacity to $400.0 million from $200.0 million. The homes are primarily located in Atlanta, Charlotte, Tampa and Orlando. The Acquired Properties were substantially leased as of the acquisition date with aggregate occupancy of approximately 93% and average existing rents of approximately $960 per month on April 1, 2015.
Internalization of Our Former Manager
Through September 30, 2014, we were externally managed by our Former Manager. During this time, we relied on our Former Manager to provide or obtain on our behalf the personnel and services necessary for us to conduct our business as we had no employees of our own. On September 30, 2014, we closed the Internalization and now own all material assets and intellectual property rights of our Former Manager previously used in the conduct of its business. In connection with the Internalization, the officers and employees who worked for our Former Manager became our employees.
Our Former Manager was a joint venture between Provident Real Estate Advisors LLC ("Provident"), and an affiliate of Pine River Capital Management L.P. ("Pine River"). The Internalization was effected pursuant to the Contribution Agreement dated August 3, 2014 among Pine River, Provident, our Former Manager and the Operating Partnership (the "Contribution Agreement"). Pursuant to the Contribution Agreement, we acquired all economic interests in our Former Manager in exchange for aggregate consideration of 2,231,511 common units in the Operating Partnership. These common units are redeemable for cash or, at our election, a number of Silver Bay common shares on a one-for-one basis. Of this
8
aggregate consideration, Pine River received 1,487,674 common units and Provident received 743,837 common units, which reflects the parties two-thirds and one-third ownership of our Former Manager prior to the Internalization. We have an effective registration statement on file with the Securities and Exchange Commission ("SEC") registering the resale of our common shares issuable upon redemption of the common units. The initial issuance of the common units to Pine River and Provident was undertaken in reliance upon the exemption from the registration requirements afforded by Section 4(a)(2) Securities Act of 1933, as amended.
The Contribution Agreement included a net worth adjustment, payable in cash, in the event that the closing net worth of our Former Manager was greater or less than $0 after making an adjustment to exclude any liabilities for accrued bonus compensation payable to the Chief Executive Officer and personnel providing data analytics directly supporting the investment function of Silver Bay. We settled the net worth adjustment on September 30, 2014 based on estimated amounts. The net worth adjustment was finalized in the fourth quarter of 2014 with a de minimis payment. As a result of this transaction, as of September 30, 2014, we no longer pay fees or expense reimbursements to our Former Manager or our Former Manager's operating subsidiary.
Formation Transactions
In connection with our initial public offering in December 2012, we completed a series of contribution and merger transactions (the "Formation Transactions") through which we acquired an initial portfolio (our "Initial Portfolio") of more than 3,300 single-family properties from Two Harbors Investment Corp. ("Two Harbors"), and the owners of the membership interests of entities managed by Provident (the "Provident Entities") in consideration of 23,917,642 shares of our common stock, 1,000 shares of our 10% cumulative redeemable preferred stock, 27,459 common units in the Operating Partnership and approximately $5.3 million in cash.
Our acquisition of Two Harbors Property Investment LLC (now known as Silver Bay Property Investment LLC) ("Silver Bay Property" or our "Predecessor") accounted for more than 2,400 properties in our Initial Portfolio. Silver Bay Property began acquiring this portfolio of single-family residential properties to rent for income and to hold for investment in the first quarter of 2012. Acquisition of the Provident Entities accounted for 881 properties in our Initial Portfolio. Provident began acquiring, renovating, managing and overseeing the leasing of these single-family properties in 2009, acquiring properties in Arizona, Florida, Georgia and Nevada through the Provident Entities, five private limited liability companies for which Provident served as the managing member.
For accounting purposes, our Predecessor was considered the acquiring or surviving entity, meaning our balance sheet reflects the historical assets and liabilities of our Predecessor at historical cost. The contribution of the Provident Entities, on the other hand, was accounted for as an acquisition under the purchase method of accounting, meaning the assets and liabilities of the Provident Entities were recorded at the estimated fair value of the acquired assets and assumed liabilities. As a result of the Formation Transactions, we are considered a continuation of our Predecessor’s business operations.
Financing Strategy
To date, we have funded our acquisitions and other capital needs through a mix of equity capital, cash generated by our operations, borrowings under our revolving credit facility and borrowings in connection with our securitization. We entered our current revolving credit facility on May 10, 2013 and amended it on February 18, 2015 to increase the borrowing capacity from $200.0 million to $400.0 million and extend its term. We closed our securitization transaction on August 12, 2014, which involved the sale of $312.7 million of certificates. See Item 7, "Management's Discussion and Analysis of Financial Conditions and Results of Operations," including "Liquidity and Capital Resources" of this Annual Report on Form 10-K, for additional information regarding our revolving credit facility and securitization transaction.We continually explore additional capital options available to us, and our decision to pursue such options will be based on our assessment of a variety of factors, including the relative cost of the financing, the impact on our estimated net asset value and cash flow generation, and the available growth opportunities.
Competition
The residential rental market has historically been fragmented in both its ownership and operations. We face competition from local owners and operators, as well as an emerging class of institutional managers. When acquiring single-family properties, we face competition from individual investors, private pools of capital and other institutional buyers which may increase the prices for properties that we would like to purchase and reduce our ability to achieve our desired portfolio size or expected yields. We also compete for desirable residents against the same entities as well as multifamily lessors. We believe
9
that having an integrated and scalable platform with local market presence and using our wealth of existing in-house expertise provide us competitive advantages.
Seasonality
We believe that our business and related operating results will be impacted by seasonal factors throughout the year. In particular, we have experienced higher levels of resident move-outs during the summer months, which impacts both our rental revenues and related turnover costs. Further, our property operating costs and stabilized capital expenditures have been seasonally impacted in most markets for expenditures related to HVAC repairs during the summer season.
Regulation
General
Our properties are subject to various covenants, laws, and ordinances, and certain of our properties are also subject to the rules of the various homeowners’ associations where such properties are located. We believe that we are in material compliance with such covenants, laws, ordinances and rules and our leasing terms require that our residents agree to comply with such covenants, laws, ordinances, and rules.
Fair Housing Act
The Fair Housing Act ("FHA"), its state law counterparts, and the regulations promulgated by U.S. Department of Housing and Urban Development and various state agencies, prohibit discrimination in housing on the basis of race or color, national origin, religion, sex, familial status (including children under the age of 18 living with parents or legal custodians, pregnant women and people securing custody of children under the age of 18) or handicap (disability) and, in some states, on financial capability and other bases. We believe that we are in material compliance with the FHA and other regulations.
Environmental Matters
As an owner of real estate, we are subject to various federal, state and local environmental laws, regulations, and ordinances and also could be liable to third parties as a result of environmental contamination or noncompliance at our properties even if we no longer own such properties. See the discussion under Item 1A, “Risk Factors,” under the caption “We may be subject to unknown or contingent liabilities or restrictions related to properties that we acquire for which we may have limited or no recourse.”
REIT Qualification
We have elected to be taxed as a REIT, commencing with our initial taxable year ended on December 31, 2012. Our qualification as a REIT depends upon our ability to meet on a continuing basis, through actual investment and operating results, various requirements under the Internal Revenue Code of 1986, as amended (the "Code") relating to, among other things, the sources of our gross income, the composition and values of our assets, our distribution levels, and the diversity of ownership of our shares. We believe that we have been organized in conformity with the requirements for qualification and taxation as a REIT under the Code, and that we conduct our operations in a manner that will enable us to continue to meet the requirements for qualification and taxation as a REIT going forward.
As long as we qualify as a REIT, we generally will not be subject to U.S. federal income tax on the REIT taxable income that we distribute to our stockholders. If we fail to qualify as a REIT in any taxable year and do not qualify for certain statutory relief, we will be subject to U.S. federal income tax at regular corporate rates and will be precluded from qualifying as a REIT for the subsequent four taxable years following the year during which we lose our REIT qualification. Even if we qualify for taxation as a REIT, we may be subject to certain U.S. federal, state, and local taxes on our income or property. In addition, each TRS we own is subject to U.S. federal, state, and local taxes on its income or property.
Employees
As of December 31, 2015, we had 176 full-time employees, which we supplement with temporary and contract resources. None of our personnel are covered by a collective bargaining agreement.
10
Available Information
Our website address is www.silverbayrealtytrustcorp.com. We make available, free of charge on our website (on the Investor Relations page under “SEC Filings”), our annual reports on Form 10-K, quarterly reports on Form 10-Q, current reports on Form 8-K, and any amendments to those reports, as are filed or furnished pursuant to Section 13(a) or 15(d) of the Securities Exchange Act of 1934, as amended (the "Exchange Act") as well as our proxy statements with respect to our annual meetings of stockholders, as soon as reasonably practicable after we electronically file such material with, or furnish it to, the SEC. Our Exchange Act reports filed with, or furnished to, the SEC are also available at the SEC’s website at www.sec.gov.
We intend to webcast our earnings calls and may webcast certain events we participate in or host with members of the investment community on our investor relations website. Additionally, we provide notifications of news or announcements regarding our financial performance, including SEC filings, investor events, press and earnings releases as part of our investor relations website. Investors and others can receive notifications of new information posted on our investor relations website in real time by signing up for email alerts and RSS feeds. Further corporate governance information, including charters for our board committees, our Code of Business Conduct and Ethics, and our whistleblowing procedures, are available on our website on the Investor Relations page. The contents of our website referred to in this Annual Report on Form 10-K are not intended to be incorporated by reference into this Form 10-K or in any other report or document we file with the SEC, and any references to our website is intended to be inactive textual references only.
Item 1A. Risk Factors.
Set forth below are the risks that we believe are material to our stockholders. You should carefully consider the following risks in evaluating our company and our business. The occurrence of any of the following risks could materially adversely impact our financial condition, results of operations, cash flow, the market price of our common stock and our ability, among other things, to make distributions to our stockholders, which in turn could cause our stockholders to lose all or a part of their investment. Some statements in the following risk factors constitute forward-looking statements. Please refer to the section entitled “Special Note Regarding Forward-Looking Statements” at the beginning of this Annual Report on Form 10-K.
Risks Related to Our Business
We are employing a new and untested business model in a new industry with no proven track record, which makes our business difficult to evaluate.
The large-scale single-family rental industry is relatively new in the United States. Until 2012, the single-family rental business consisted primarily of private and individual investors in local markets and was managed individually or by small, local property managers. We were formed on the assumption that a company can acquire and operate single-family properties on a large-scale basis and achieve attractive yields by employing a disciplined approach to acquisitions and renovations, economies of scale in marketing and management, and developing a brand-name presence. Our assumptions are unproven, and if they prove to be incorrect, then we may fail to provide the financial returns that investors hope or expect to receive. No peer companies exist with an established track record from which to predict whether our investment strategy can be implemented successfully over time. While past performance is not indicative of future results, it is difficult to evaluate our potential future performance without the benefit of established track records from companies implementing a similar investment strategy.
Our investment strategy involves accumulating a large number of residential properties and leasing them to suitable residents. We may encounter unanticipated problems implementing our investment strategy, which may have a material adverse effect on our results of operations and our ability to make distributions on our common stock and may cause our stock price to decline significantly. No assurance can be given that we will be successful in implementing our investment strategy or that we will be successful in achieving our objective of providing attractive risk-adjusted returns to our stockholders over the long term.
We believe the acquisition, operation and management of multifamily residential properties is the most comparable established business model to our business, but in contrast to multifamily operations, the geographic dispersion of single-family properties creates significantly greater operational and maintenance challenges and, potentially, significantly higher per-unit operating costs. For example, although we intend to inspect our portfolio properties periodically, the geographic dispersion of our assets means we will not inspect our assets as frequently as may occur in the multifamily industry, meaning we may not become aware of conditions such as water infiltration, mold, or infestation until significant damage has been done to a property that may require extensive remediation and repairs and the provision of substitute housing for a resident. In addition, because each home has unique features, appliances and building materials, we believe the renovations, maintenance, marketing and operational tasks are far more varied and demanding than in a typical multifamily setting. We cannot provide any assurance that
11
operating a large portfolio of single-family rental properties can be executed in a cost-effective and profitable manner or that our business plan will succeed.
We have a limited operating history and may not be able to operate our business successfully or generate sufficient cash flows to make or sustain distributions to our stockholders.
Silver Bay Realty Trust Corp. was organized in June 2012 and has a limited operating history. There is no long-term historical financial data available for us, our acquired properties, or other companies in the single-family rental industry to assist investors in assessing our earnings potential or whether we can operate profitably. We cannot assure you that we will be able to operate our business successfully or implement our operating policies and strategies as described in this Annual Report. The results of our operations will depend on many factors, including:
• | the availability of additional properties that meet our criteria and our ability to purchase such properties on favorable terms; |
• | real estate appreciation or depreciation in our markets; |
• | our ability to contain renovation, maintenance, turnover, marketing, and other operating costs for our properties; |
• | our ability to maintain high occupancy rates and target rent levels; |
• | general economic conditions in our markets, such as changes in employment and household earnings and expenses; |
• | costs that are beyond our control, including title litigation, litigation with residents or tenant organizations, legal compliance, real estate taxes, homeowners’ association fees, and insurance; |
• | judicial and regulatory developments affecting landlord-tenant relations that may affect or delay our ability to dispossess or evict occupants or increase rents; |
• | judicial and regulatory developments affecting banks’ and other mortgage holders’ ability to foreclose on delinquent borrowers; |
• | reversal of population, employment, or homeownership trends in our markets; |
• | interest rate levels and volatility, which may affect the accessibility of short-and long-term financing on desirable terms; and |
• | competition from other investors entering the single-family rental market. |
We are still building our operational expertise and systems.
We continue to build our operational expertise and to establish our platform and processes related to residential management, including leasing, brand development, tracking, accounting systems, and billing and payment processing. Building operational expertise and establishing a platform are difficult, expensive, and time-consuming tasks, and we can expect problems to arise despite our best efforts. There is a significant risk that operational problems will have an adverse effect upon our financial performance, especially in newer markets.
Our success depends, in part, upon our ability to hire and retain skilled managerial, investment, financial, and operational personnel.
The implementation of our business plan requires that we employ qualified personnel. Competition for skilled managerial, investment, financial, and operational personnel is intense. Several large real estate investors have entered the single-family rental business and we face increased challenges in hiring and retaining personnel. We cannot assure our stockholders that we will be successful in attracting and retaining such skilled personnel. If we are unable to hire and retain qualified personnel as required, our growth and operating results could be adversely affected.
12
We are dependent on our executive officers and dedicated personnel, and the departure of any of our key personnel could materially and adversely affect us.
We rely on a small number of persons to carry out our business and investment strategies. Any of our senior management may cease to provide services to us at any time. The loss of the services of any of our key management personnel, or our inability to recruit and retain qualified personnel in the future, could have an adverse effect on our business and financial results. For example, David Miller, our former Chief Executive Officer, resigned on January 19, 2016 and our board of directors has begun a search for a permanent replacement. We cannot assure you that we will be able to attract a qualified, permanent Chief Executive Officer who has the desired qualifications on acceptable terms or at all. In the future, we may need to attract and retain qualified additional senior management but may not be able to do so on favorable terms or at all.
We are dependent on our investment in a single asset class, which exposes us to downturns in the single-family properties sector.
We have concentrated our investments in single-family properties. As a result, we are subject to risks inherent in investments in a single type of property. A downturn or slowdown in the rental demand for single-family housing may have more pronounced effects on the cash available for distribution or on the value of our assets than if we had more fully diversified our investments. There are seasonal fluctuations in rental demand with demand higher in the spring and summer than in the fall and winter. Such seasonal fluctuations may impact our operating results.
We face significant competition in the leasing market for quality residents, which may limit our ability to rent our single-family homes on favorable terms or at all.
We depend on rental income from residents for substantially all of our revenues. As a result, our success depends in large part upon our ability to attract and retain qualified residents for our properties. We face competition for residents from other lessors of single-family properties, apartment buildings and condominium units. The continuing development of apartment buildings and condominium units in many of our markets increases the supply of housing and exacerbates competition for residents. Many of these competitors may successfully attract residents with better incentives and amenities, which could adversely affect our ability to obtain quality residents and lease our single-family properties on favorable terms or at all. Additionally, some competing housing options may qualify for government subsidies that may make such options more affordable and therefore more attractive than our properties.
If rents and occupancy levels in our markets do not increase sufficiently to keep pace with rising costs of operations or otherwise decline, our income and distributable cash will decline.
The success of our business model depends, in part, on conditions in the single-family rental market in our markets. Our asset acquisitions have been premised on assumptions about occupancy and rent levels, and if those assumptions prove to be inaccurate, our cash flows and profitability will be reduced. Rental rates and occupancy levels have benefited in recent periods from macro trends affecting the U.S. economy and residential real estate markets in particular, including a declining homeownership rate.
We do not expect these favorable trends to continue indefinitely and some have begun to reverse. Eventually, a strengthening of the U.S. economy and job growth, coupled with government programs designed to encourage homeownership or to keep homeowners in their homes, continuing low interest rates, or other factors, may contribute to a stabilization or reversal of the current trend that favors renting rather than homeownership. In addition, as investors like us have sought and continue to seek to capitalize on opportunities to purchase undervalued housing assets and convert them to productive uses, the supply of single-family rental properties available for purchase has decreased and will continue to decrease and the competition for residents may intensify. A softening of the rental market in our target areas would reduce our rental income and profitability.
Our revenue and expenses are not directly correlated, and because a large percentage of our costs and expenses are fixed, we may not be able to adapt our cost structure to offset declines in our revenue.
Many of the expenses associated with our business, such as acquisition costs, renovation and maintenance costs, real estate taxes, homeowners' association ("HOA") fees, personal and property taxes, insurance, utilities, personnel costs and benefits, and other general corporate expenses are fixed and do not necessarily decrease with a reduction in revenue from our business. Our assets are also prone to depreciation and will require a significant amount of ongoing capital expenditures. Our expenses and ongoing capital expenditures will also be affected by inflationary increases and certain of our cost increases may exceed the rate of inflation. By contrast, as described above, our rental income will be affected by many factors beyond our control such as the availability of alternative rental housing and economic conditions in our markets. In addition, state and local
13
regulations may require us to maintain properties that we own, even if the cost of maintenance is greater than the value of the property or any potential benefit from renting the property. As a result, we may not be able to fully offset rising costs and capital spending by raising rents, which could have a material adverse effect on our results of operations and cash available for distribution.
Poor resident selection and defaults by renters may negatively affect our financial performance and reputation.
Our success depends in large part upon our ability to attract and retain qualified residents. This will depend, in turn, upon our ability to screen applicants, identify qualified residents, and avoid residents who may default. We rely on information supplied by prospective residents in their rental applications to make leasing decisions and we cannot be certain this information is accurate. We may not successfully screen applicants, and as a result, we may rent to residents who default on our leases or fail to comply with the terms of the lease or HOA regulations, which may negatively affect our financial performance, reputation, and the quality and value of our properties. For example, residents may default on payment of rent, make unreasonable and repeated demands for service or improvements, make unsupported or unjustified complaints to regulatory or political authorities, make use of our properties for illegal purposes, damage or make unauthorized structural changes to our properties which may not be fully covered by security deposits or insurance, refuse to leave the property when the lease is terminated, engage in domestic violence or similar disturbances, disturb nearby residents with noise, trash, odors or eyesores, fail to comply with HOA regulations, sublet to less desirable individuals in violation of our leases, or permit unauthorized persons to live with them.
In the event of a resident default or bankruptcy, we may experience delays in enforcing our rights as landlord and obtaining possession of the premises and incur legal, maintenance, and other costs in protecting our investment. In addition, we will incur turnover costs associated with re-leasing the properties such as marketing and brokerage commissions, will not collect revenue while the property sits vacant, and may be unable to re-lease the property at the rental rate previously received.
Short-term leases of residential property may expose us to the effects of declining market rents.
Substantially all of our leases are of a duration of less than two years and are one year in the majority of cases. Because these leases permit the residents to leave at the end of the lease term without penalty, our rental revenues may be affected by declines in market rents more quickly than if our leases were for longer terms. Short-term leases may result in high turnover, which involves costs such as restoring the properties, marketing costs, and lower occupancy levels. Because we have a limited operating history, we cannot accurately predict our turnover rate or the associated costs we will incur. Moreover, we cannot assure you that our leases will be renewed on equal or better terms or at all. If our residents do not renew their leases or abandon their leases during the lease term, we may experience lower than expected occupancy rates and some homes may remain vacant for extended periods of time. Extended vacancy terms may apply downward pressure to rental rates as we may accept rental rates below our targets in order to incentivize residents to choose our homes or prevent the value of our homes from becoming impaired as a result of extended vacancy periods. If either of our occupancy rates or rental rates decreases, our ability to generate positive cash flows may be negatively affected.
We may have difficulty selling our real estate investments or may be restricted from selling property, and we may choose to use all or a portion of the net proceeds from a sale of property for other purposes rather than distribute such proceeds to our stockholders.
Real estate investments are relatively illiquid and, as a result, we may have a limited ability to sell our properties. When we sell any of our properties, we may recognize a loss on such sale. We may elect not to distribute any proceeds from the sale of properties to our stockholders. Instead, we may use such proceeds for other purposes, including:
• | purchasing additional properties; |
• | repaying debt or buying back stock; |
• | buying out interests of any co-venturers or other partners in any joint venture in which we are a party; |
• | creating working capital reserves; or |
• | making repairs, maintenance or other capital improvements or expenditures to our remaining properties. |
Our ability to sell our properties may also be limited by our need to avoid the 100% prohibited transactions tax that is imposed on gain recognized by a REIT from the sale of property characterized as dealer property. In order to ensure that we
14
avoid such characterization, we may be required to hold our properties for a minimum period of time and comply with certain other requirements in the Code or dispose of our properties through a TRS.
We will need additional capital or debt financing and such financing may not be available.
The acquisition of single-family properties on a large scale requires significant capital. To date, our properties have been purchased and renovated with a mix of cash and debt financing under our revolving credit facility and securitization loan. We may be unable to leverage our assets or obtain additional financing to the extent desired. We may also choose to fund our growth by issuing additional equity, which may be dilutive to our stockholders.
Our access to capital depends, in part, on:
• | general business conditions; |
• | financial market conditions; |
• | the market’s perception of our business prospects and growth potential; |
• | our current debt levels; and |
• | our current and expected earnings, cash flow and distributions. |
We cannot assure you that we will be able to obtain debt or equity financing on terms favorable or acceptable to us or at all. If we do not have sufficient capacity under our revolving credit facility or future financing agreements, or if other sources of financing (such as equity offerings) are not available to us, we may not be able to resume future acquisitions of single-family properties, or may dispose of certain properties in our portfolio at inopportune times, in order to meet liquidity and other requirements.
Our revolving credit facility, securitization loan and any other debt we may incur in the future could expose us to additional risks, adversely affect our operating results, require us to sell properties, and adversely affect our ability to make or sustain distributions to our stockholders and the market price of our common stock.
Our financing strategy contemplates the use of secured or unsecured debt, including our revolving credit facility and securitization loan, to finance long-term growth. Our governing documents contain no limitations on the amount of debt that we may incur. As a result, we may incur substantial debt in the future.
Incurring debt could subject us to many risks, including the risks that:
• | our cash flows from operations will be insufficient to make required payments of principal and interest; |
• | our debt may increase our vulnerability to adverse economic and industry conditions; |
• | we will be subject to restrictive covenants that require us to satisfy and remain in compliance with certain financial requirements, that impose limitations on the type or extent of activities we conduct, or that restrict the amount of additional debt we may employ; |
• | we may be required to dedicate a substantial portion of our cash flows from operations to payments on our debt, thereby reducing cash available for distribution to our stockholders, operations and capital expenditures, future business opportunities, or other purposes; and |
• | the terms of any refinancing may not be as favorable as the terms of the debt being refinanced. |
If we are not able to generate sufficient cash flow to service our revolving credit facility, securitization loan and other current and future debt obligations, as well as satisfy the REIT distribution requirement, we may need to refinance our debt or raise additional equity. If, at the time of any refinancing, prevailing interest rates or other factors result in higher interest rates on refinancing, increases in interest expense could adversely affect our cash flows and, consequently, cash available for distribution to our stockholders. For example, recent turmoil in the global markets and recent events in the real estate and securitization markets, as well as the debt markets and the economy generally, have caused significant dislocations, illiquidity and volatility in the market for asset-backed securities and mortgage-backed securities, as well as a severe, ongoing disruption
15
in the wider global financial markets, including a significant reduction of investor demand for, and purchases of, asset-backed securities and structured financial products. Disruptions in the securitization market could preclude our ability to use securitization as a financing source or could render it an inefficient source of financing making us more dependent on alterative sourcing of financing that might not be as favorable as securitizations in otherwise favorable markets.
In addition, our revolving credit facility and securitization loan accrue interest at a varying rate based on LIBOR. To the extent this interest rate increases, the cost of our borrowings will increase as well. To the extent we are required to raise additional equity to satisfy such debt, existing stockholders would see their interests diluted. If we are unable to refinance our debt or raise additional equity on acceptable terms, we may be forced to dispose of substantial numbers of properties on disadvantageous terms, potentially resulting in losses.
Our current revolving credit facility and securitization loan require us to comply with various financial tests, including those relating to debt yield, debt service coverage ratios, total liquidity and net worth. Future debt agreements we may enter into may have similar or additional provisions. In the event that we are unable to satisfy these requirements or are unable to meet repayment obligations relating to our current and any future debt, we will risk losing some or all of our properties that may be pledged to secure our obligations to foreclosure or we may be forced to sell properties at a loss. In addition, our current revolving credit facility and securitization loan documents contain, and we expect future debt agreements will contain, events of default, including payment defaults, covenant defaults, breaches of representations and warranties, bankruptcy and insolvency, judgments, change of control and cross-default with certain other indebtedness and other events of default customary for these types of agreements. Because credit agreements typically contain cross-default provisions, a default that occurs under any one agreement could allow the lenders under our other agreements to also declare a default.
Failure to hedge effectively against interest rate changes may adversely affect our results of operations and our ability to make distributions to stockholders.
In connection with our revolving credit facility and securitization loan, we have obtained interest rate caps, and subject to complying with the requirements for REIT qualification, we may obtain in the future one or more additional forms of interest rate protection—in the form of swap agreements, interest rate cap contracts or similar agreements—to hedge against the possible negative effects of interest rate fluctuations. However, we cannot assure you that any hedging will adequately relieve the adverse effects of interest rate increases or that counterparties under these agreements will honor their obligations thereunder. In addition, we may be subject to risks of default by hedging counterparties. Adverse economic conditions could also cause the terms on which we borrow to be unfavorable. We could be required to liquidate one or more of our investments at times which may not permit us to receive an attractive return on our investments in order to meet our debt service obligations.
The REIT provisions of the Code may also limit our ability to hedge effectively. Under current law, any income that we generate from derivatives or other transactions intended to hedge our interest rate risks, or any income from foreign currencies or other hedges, will generally be treated as nonqualifying income for purposes of the REIT 75% and 95% gross income tests unless specified requirements are met. As a result of these rules, we may have to limit our use of hedging techniques that might otherwise be advantageous, which could result in greater risks associated with interest rate or other changes that we would otherwise incur.
We face significant competition for future acquisitions, which may limit our strategic opportunities and increase the cost to acquire those properties.
We face significant competition for attractive acquisition opportunities in our markets from other large real estate investors, some of which have greater financial resources and a lower cost of capital than we do. Several REITs and other funds have deployed and continue to deploy, and others may deploy in the near future, significant amounts of capital to purchase single-family homes and may have investment objectives that overlap and compete with ours, including in our markets. This activity has adversely impacted our level of purchases in certain of our markets. If our business model or a similar model proves to be successful, we can expect competition to intensify significantly. As a result, the purchase price of potential acquisition properties may be significantly elevated, or we may be unable to acquire properties on desirable terms or at all.
We intend to continue to expand our scale of operations and may make acquisitions even if the rental and housing markets are not as favorable as they have been in recent years, which could reduce our yield per share.
Although we are not actively acquiring new properties, we may seek to do so again at which point our growth would depend on the availability of acquisition opportunities in our markets at attractive prices. We believe various factors and market conditions have made homes available for purchase at prices that are below replacement cost. Housing prices have been
16
increasing over the past few years, and we expect that in the future they will continue to stabilize and return to more normalized levels, and therefore future acquisitions may be more costly. There are many factors that may cause a recovery in the housing market that would result in future acquisitions becoming more expensive and possibly less attractive than past opportunities, including:
• | improvements in the overall economy and job market; |
• | reductions in the supply of residential properties compared to demand; |
• | a resumption of consumer lending activity and greater availability of consumer credit; |
• | improvements in the pricing and terms of mortgage-backed securities; |
• | the emergence of increased competition for single-family assets from private investors and entities with similar investment objectives to ours; and |
• | tax or other government incentives that encourage homeownership. |
We have not adopted and do not expect to adopt a policy of making future acquisitions only if they are accretive to existing yields and distributable cash. We will continue to invest significant resources developing our property management platform and may resume acquiring properties if we believe such properties offer an attractive total return opportunity through cash flow generation and asset appreciation. Accordingly, future acquisitions may have lower yield characteristics than our current portfolio and if such future acquisitions are funded through equity issuances, the yield and distributable cash per share will be reduced and the value of our common stock may decline.
We may not be able to effectively manage our growth, which requires significant resources, and failure to do so may have an adverse effect on our business and our financial results may be adversely affected.
We plan to continue to refine our operations and may resume the acquisition of properties in the future. If we do, our future operating results depend upon our ability to effectively manage this growth, which is dependent, in part, upon our ability to:
• | stabilize and manage an increasing number of properties and resident relationships while maintaining a high level of customer service and building and enhancing our brand; |
• | identify and supervise suitable vendors and employees to provide services to our properties; |
• | continue to improve our operational and financial controls and reporting procedures and systems; and |
• | scale our technology and other infrastructure platforms to adequately service new properties. |
We cannot assure you that we will be able to achieve these results or that we may otherwise be able to manage our growth effectively. Any failure to do so may have an adverse effect on our business and financial results.
Acquiring properties during periods when the single-family home sector is experiencing substantial inflows of capital and intense competition may result in inflated purchase prices and increase the likelihood that our properties will not appreciate in value and may, instead, decrease in value.
The allocation of substantial amounts of capital for investment in the single-family home sector and significant competition for income producing real estate may inflate the purchase prices for such assets. To the extent we purchased, or in the future purchase, real estate in such an environment, it is possible that the value of our properties may not appreciate and may, instead, decrease in value, perhaps significantly, below the amount we paid for such properties. In addition to macroeconomic and local economic factors, technical factors, such as a decrease in the amount of capital allocated to the single-family home sector and the number of investors participating in the sector, could cause the value of our properties to decline.
17
Our dependence upon third party vendors for key services may harm our operating results or reputation if the vendors fail to perform.
We rely on local, third-party vendors and service providers, including third-party house renovation professionals, maintenance providers, leasing agents, and property management companies in situations where it is cost-effective to do so or if our internal staff is unable to perform these functions. For example, we currently use third-party property managers for approximately 5.5% of our current properties. We do not have exclusive or long-term contractual relationships with any of these third-party providers, and we can provide no assurance that we will have uninterrupted or unlimited access to their services. Furthermore, selecting, managing, and supervising these third-party service providers requires significant management resources and expertise. Poor performance by third-party service providers, especially those who interact with residents in our properties, will reflect poorly on us and could significantly damage our reputation among desirable residents. If we do not select, manage, and supervise appropriate third parties for these services, our brand and reputation and operating results may suffer. Moreover, notwithstanding our efforts to implement and enforce strong policies and practices regarding service providers, we may not successfully detect and prevent fraud, incompetence, or theft by our third-party service providers, which could expose us to material liability or responsibility for associated damages, fines, or penalties.
In addition, any delay in identifying a third-party service provider or removal or termination of existing third-party service providers would require us to seek new vendors or providers, which would create delays and adversely affect our operating results.
Claims of deficiencies in the foreclosure process may result in rescission of our purchases or challenges to title.
Allegations of deficiencies in foreclosure practices could result in claims challenging the validity of some foreclosures that have occurred to date, potentially placing our claim of ownership to the properties at risk. Our title insurance policies may not provide adequate protection in such instances or such proceedings may result in a complete loss without compensation.
Each state has its own laws governing the procedures to foreclose on mortgages and deeds of trust, and state laws generally require strict compliance with these laws in both judicial and non-judicial foreclosures. Courts and administrative agencies have been actively involved in enforcing state laws governing foreclosures, and in some circumstances have imposed new rules and requirements regarding foreclosures. Some courts have delayed or prohibited foreclosures based on alleged failures to comply with proper transfers of title, notice, identification of parties in interest, documentation, and other legal requirements. Further, foreclosed owners and their legal representatives, including some prominent and well-financed legal firms, have brought litigation questioning the validity and finality of foreclosures that have already occurred.
These developments may call into question the validity of our title to houses acquired at foreclosure, or result in rescission rights or other borrower remedies, which could result in a loss of a property purchased by us that may not be covered by title insurance or an increase in litigation costs incurred with respect to properties obtained through foreclosure.
Our underwriting criteria and evaluation of properties involves a number of assumptions that may prove inaccurate, which may cause us to overpay for our properties or incur significant costs to renovate and market a property.
In determining whether a particular property meets our investment criteria, we make a number of assumptions, including assumptions related to estimated time of possession and estimated renovation costs and time frames, annual operating costs, market rental rates and potential rent amounts, time from purchase to leasing, and resident default rates. These assumptions may prove inaccurate, causing us to pay too much for properties we acquire or to overvalue our properties, or our properties may fail to perform as we expect. Adjustments to the assumptions we make in evaluating potential purchases may result in fewer properties qualifying under our investment criteria.
Furthermore, the properties we acquire may vary materially in terms of quality and type of construction, location, and hazards. Our success depends on our ability to estimate accurately the time and expense required to possess, renovate, repair, upgrade, and rent properties and to keep them maintained in rentable condition. In addition, market and regulatory environments relating to single-family residential properties have been changing rapidly, making future trends difficult to forecast. Such changes affect the accuracy of our assumptions and, in turn, may adversely affect our operating results.
Certain of our older properties may contain lead-based paint, which we may be required to remove or could expose us to liability, either of which would adversely affect our operating results.
Approximately 39% of the properties we owned as of December 31, 2015 are over 30 years old, and those premises may contain lead-based paint. The existence of lead paint is especially a concern in residential units and can cause health
18
problems, particularly for children. A structure built prior to 1978 may contain lead-based paint and may present a potential exposure to lead; however, structures built after 1978 are not likely to contain lead-based paint. Federal and state laws impose certain disclosure requirements and restrict and regulate renovation activities on housing built before 1978. Violation of these restrictions could result in fines or criminal liability, and we could be subject to liability arising from lawsuits alleging personal injury or related claims. Although we attempt to comply with all such regulations, and we cannot guarantee that we will not incur any material liabilities as a result of the presence of lead paint in our properties.
A substantial portion of our properties were purchased at auction, where we generally are not able to conduct a thorough inspection before purchasing the properties, and we may not accurately assess the extent of renovations required.
Approximately 40% of our properties owned as of December 31, 2015 were purchased at auction and we may purchase properties at auction in the future. When we purchase properties at auction, we generally do not have the opportunity to conduct interior inspections and may not be able to access a property to conduct more than the most cursory of exterior inspections. These inspection processes may fail to reveal major defects associated with properties we acquire, which may result in renovation and maintenance costs and time frames that exceed our estimates and negatively affect our financial results and earnings.
Properties acquired through portfolio acquisitions may subject us to the risk of acquiring properties that do not fit our target investment criteria and may be costly or time consuming to divest, which may adversely affect our operating results.
We have acquired and may in the future acquire properties purchased as portfolios from other owners of single-family properties, like the Portfolio Acquisition. To the extent the management and leasing of such properties has not been consistent with our property management and leasing standards, we may be subject to a variety of risks, including risks relating to the condition of the properties, the credit quality and employment stability of the residents, and compliance with applicable laws, among others. When acquiring portfolios, we may not conduct interior inspections on each property and may fail to appropriately discover or predict defects associated with such properties, which may result in renovation and maintenance costs and time frames that exceed our estimates and negatively affect our financial results and earnings. In addition, financial and other information provided to us regarding such portfolios during our due diligence may be inaccurate, and we may not discover such inaccuracies until it is too late to seek remedies against such sellers. To the extent we timely pursue such remedies, we may not be able to successfully prevail against the seller in an action seeking damages for such inaccuracies. If we conclude that certain properties purchased in portfolio acquisitions do not fit our target investment criteria, we may decide to sell, rather than renovate and rent, these properties, which could take an extended period of time and may not result in a sale at an attractive price.
The intended benefits of the Portfolio Acquisition may not be realized, which could have a negative impact on our results of operations, financial conditions, the market price of our common stock, and our distributions to our stockholders.
The Portfolio Acquisition represents the largest acquisition of a property portfolio by us other than our initial portfolio acquisition in connection with our formation in December 2012. We may be subject to additional risks as a result of, and may not be able to achieve the anticipated benefits of, the Portfolio Acquisition. For example, more than 90% of the properties acquired in the Portfolio Acquisition were occupied upon acquisition and approximately 80% of the properties have not yet undergone an initial renovation to bring them in line with Silver Bay standards. These initial renovations typically require greater expenditures than a standard turnover, which impacts our cash available for distribution to stockholders or other uses. We acquired assets in connection with the Portfolio Acquisition on an "as is" basis with most representations of the seller surviving after the closing of the Portfolio Acquisition for a limited period of time and subject to a liability cap, which limits our future recourse against the seller for breaches of representations, which in turn may expose us to unexpected material losses or expenses in the future.
Additional risks that we could face as a result of the Portfolio Acquisition include, among others:
• | inability to maintain consistent standards, controls, policies and procedures, or realize the anticipated benefits of the acquisition within the anticipated timeframe or at all; |
• | projections of estimated future revenues, capital expenditures, cost savings or operating metrics that we develop during the due diligence and integration planning process might be inaccurate; |
• | the value of acquired assets may decline; |
19
• | unanticipated issues, expenses and liabilities and exposure to any undisclosed or unknown potential liabilities relating to the properties acquired; and |
• | potential underinsured losses on the properties acquired. |
Failure to realize the intended benefits of the Portfolio Acquisition could have a material adverse effect on our results of operations, financial condition, the market price of our common stock and our distributions to our stockholders.
We may not have control over timing and costs arising from renovation of properties, which may adversely affect our operating results and ability to make distributions to our stockholders.
Nearly all of our properties require some level of renovation immediately upon their acquisition or in the future following expiration of a lease or otherwise. We may acquire properties that we plan to extensively renovate. We may also acquire properties that we expect to be in good condition only to discover unforeseen defects and problems that require extensive renovation and capital expenditures. In addition, we will be required to make ongoing capital improvements and replacements and may need to perform significant renovations and repairs from time to time that resident deposits and insurance may not cover.
Our properties have infrastructure and appliances of varying ages and conditions. Consequently, we expect that we will routinely retain independent contractors and trade professionals to perform physical repair work, and we will be exposed to all of the risks inherent in property renovation, including potential cost overruns, increases in labor and materials costs, delays by contractors in completing work, delays in the timing of receiving necessary work permits, certificates of occupancy, and poor workmanship. Although we do not expect that renovation difficulties on any individual property will be significant to our overall results, if our assumptions regarding the costs or timing of renovation across our portfolio prove to be materially inaccurate, our operating results and ability to make distributions to our stockholders may be adversely affected.
We may be subject to unknown or contingent liabilities or restrictions related to properties that we acquire for which we may have limited or no recourse.
Assets and entities that we have acquired or may acquire in the future may be subject to unknown or contingent liabilities for which we may have limited or no recourse against the sellers. Unknown or contingent liabilities might include liabilities for or with respect to liens attached to properties, unpaid real estate tax, utilities, or HOA charges for which a subsequent owner remains liable, clean-up or remediation of environmental conditions or code violations, claims of customers, vendors, or other persons dealing with the acquired entities, and tax liabilities. Purchases of single-family properties acquired at auction, in short sales, from lenders, or in portfolio purchases typically involve few or no representations or warranties with respect to the properties and may allow us limited or no recourse against the sellers. Such properties also often have unpaid tax, utility, and HOA liabilities for which we may be obligated but fail to anticipate. As a result, the total amount of costs and expenses that we may incur with respect to liabilities associated with acquired properties and entities may exceed our expectations, which may adversely affect our operating results and financial condition.
Additionally, these properties may be subject to covenants, conditions, or restrictions that restrict the use or ownership of such properties, including prohibitions on leasing. We may not discover such restrictions during the acquisition process and such restrictions may adversely affect our ability to operate such properties as we intend.
Our portfolio consists of properties that are geographically concentrated and any adverse developments in local economic conditions, the demand for single-family rental homes in these markets, or natural disasters may negatively affect our operating results.
Our portfolio consists of properties that are geographically concentrated in Arizona, California, Florida, Georgia, Nevada, North Carolina, Ohio, South Carolina and Texas. As of December 31, 2015, approximately 58% of our properties were concentrated in only three markets — Phoenix, AZ, Atlanta, GA, and Tampa, FL. As such, we are susceptible to local economic conditions, other regulations, the supply of and demand for single-family rental properties, and natural disasters in these areas. If there is a downturn in the local economies, an oversupply of or decrease in demand for single-family rental properties in these markets or natural disasters in these geographical areas, our business could be materially adversely affected to a greater extent than if we owned a real estate portfolio that was more geographically diversified. We base an important part of our business plan on our belief that property values and operating fundamentals for single-family properties in most of our markets will improve significantly over the next several years. However, most of our markets experienced substantial economic downturns in recent years and could experience similar or worse economic downturns in the future. We can provide no assurance as to the extent property values and operating fundamentals in these markets will improve, if at all. If these markets
20
experience economic downturn in the future, the value of our properties could decline and our ability to execute our business plan may be adversely affected, which could adversely affect our financial condition, operating results and ability to make distributions to our stockholders.
A significant number of our residential properties are part of HOAs and we and our residents are subject to the rules and regulations of such HOAs, which may be arbitrary or restrictive, and violations of such rules may subject us to additional fees and penalties and litigation with such HOAs, which would be costly.
A significant number of the properties in our portfolio are located within HOAs, which are private entities that regulate the activities of and levy assessments on properties in a residential subdivision. HOAs in which we own properties may have or enact onerous or arbitrary rules that restrict our ability to renovate, market, or lease our properties or require us to renovate or maintain such properties at standards or costs that are in excess of our planned operating budgets. Such rules may include requirements for landscaping, limitations on signage promoting a property for lease or sale, or the use of specific construction materials used in renovations. Some HOAs also impose limits on the number of property owners who may rent their homes, which if met or exceeded, would cause us to incur additional costs to resell the property and opportunity costs of lost rental income. Many HOAs impose restrictions on the conduct of occupants of homes and the use of common areas, and we may have residents who violate HOA rules and for which we may be liable as the property owner. The boards of directors of the HOAs in which we own properties may not make important disclosures about the properties or may block our access to HOA records, initiate litigation, restrict our ability to sell our properties, impose assessments, or arbitrarily change the HOA rules. We may be unaware of or unable to review or comply with HOA rules before purchasing a property and any such excessively restrictive or arbitrary regulations may cause us to sell such property at a loss, prevent us from renting such property, or otherwise reduce our cash flow from such property, which would have an adverse effect on our returns on the property.
We may be subject to losses that are uninsurable, not economically insurable, or in excess of our insurance coverage.
We currently attempt to ensure that all of the properties we acquire are adequately insured to cover casualty losses. However, many of the policies covering casualty losses may be subject to substantial deductibles and carveouts, and we will be self-insured up to the amount of the deductibles and carveouts. Since some claims against us will not exceed the deductibles under our insurance policies, we will be effectively self-insured for some claims. We may not carry or may discontinue certain types of insurance coverage on some or all of our properties if the cost of premiums for such insurance in our judgment exceeds the value of the coverage discounted for the risk of loss.
Our properties may be damaged by adverse weather conditions and natural disasters such as earthquakes, tsunamis, wind, hail, floods, landslides, and fires. In addition, our properties may be subject to environmental liabilities and we will be exposed to personal liability for accidents which may occur on our properties. Our insurance may not be adequate to cover all damages or losses from these events, or it may not be economically prudent to purchase insurance for certain types of losses, such as hurricanes or earthquakes. As a result, we may incur significant costs in the event of adverse weather conditions and natural disasters or events which result in damage or injury. Because we tend to concentrate ownership in markets, if we own numerous properties in an area affected by a natural disaster or similar catastrophic event, it could damage or destroy a substantial portion of our properties, and expose us to liabilities to our affected residents to immediately repair or replace their leaseholds on non-economic terms.
If we experience losses that are uninsured or exceed policy limits, we could incur significant uninsured costs or liabilities, lose the capital invested in the properties, and lose the anticipated future cash flows from those properties. In addition, our environmental or personal liability may result in losses substantially in excess of the value of the related property.
New or existing laws, regulations, and covenants that are applicable to our properties, including permit, license, and zoning requirements, may adversely affect our ability to make future acquisitions or renovations, result in significant costs or delays, and adversely affect our growth strategy.
Our properties are subject to various covenants and local laws and regulatory requirements, including permitting and licensing requirements. Local regulations, including municipal or local ordinances, zoning restrictions and restrictive covenants imposed by community developers or HOAs, may restrict our use of our properties and may require us to obtain approval from local officials or community standards organizations at any time with respect to our properties, including prior to acquiring a property or when undertaking renovations. Among other things, these restrictions may relate to fire and safety, seismic, asbestos cleanup, or hazardous material abatement requirements. Existing regulatory policies may adversely affect the timing or cost of our future acquisitions or renovations, and additional regulations may increase such delays or result in additional
21
costs. Our failure to obtain permits, licenses, and zoning approvals on a timely basis could have a material adverse effect on our business, financial condition, and results of operations.
Class action, tenant rights, and consumer demands and litigation may result in increased expenses and harm our financial results.
Numerous tenants’ rights and consumer rights organizations exist throughout the country and operate in our markets, and as we grow in scale, we may attract attention from some of these organizations and become a target of legal demands or litigation. Many such consumer organizations have become more active and better funded in connection with mortgage foreclosure-related issues, and with the large settlements identified above and the increased market for single-family rentals arising from displaced homeownership, some of these organizations may shift their litigation, lobbying, fundraising and grass roots organizing activities to focus on landlord-tenant issues. While we intend to conduct our business lawfully and in compliance with applicable landlord-tenant and consumer laws, such organizations might work in conjunction with trial and pro bono lawyers in one state or multiple states to attempt to bring claims against us on a class action basis for damages or injunctive relief. We cannot anticipate what form such legal actions might take, or what remedies they may seek. Additionally, these organizations may lobby local county and municipal attorneys or state attorneys general to pursue enforcement or litigation against us, or may lobby state and local legislatures to pass new laws and regulations to constrain our business operations. If they are successful in any such endeavors, they could directly limit and constrain our business operations, and may impose on us significant litigation expenses, including settlements to avoid continued litigation or judgments for damages or injunctions.
Title defects could lead to material losses on our investments in our properties.
Our title to a property, especially those acquired at auction, may be challenged for a variety of reasons including allegations of defects in the foreclosure process. Title insurance may not prove adequate in these instances. We have in the past, and may again in the future, acquire a number of our homes on an “as is” basis at auctions or otherwise. When acquiring properties on an “as is” basis, title commitments are often not available prior to purchase, and title reports or title information may not reflect all senior liens, which may increase the possibility of acquiring houses outside predetermined acquisition and price parameters, purchasing residences with title defects and deed restrictions, HOA restrictions on leasing, or purchasing the wrong residence without the benefit of title insurance prior to closing. Although we use various policies, procedures, and practices to assess the state of title prior to purchase, there can be no assurance that these policies and procedures will be completely effective, which could lead to a material if not complete loss on our investment in such properties.
For properties we acquire through the foreclosure auction process, we do not obtain title commitments prior to purchase, and we are not able to perform the type of title review that is customary in acquisitions of real property. As a result, our knowledge of potential title issues will be limited, and no title insurance protection will be in place. This lack of title knowledge and insurance protection may result in third parties having claims against our title to such properties that may materially and adversely affect the values of the properties or call into question the validity of our title to such properties. Without title insurance, we are fully exposed to, and would have to defend ourselves against, such claims. Further, if any such claims are superior to our title to the property we acquired, we risk loss of the property purchased.
Increased scrutiny of title matters, particularly in the case of foreclosures, could lead to legal challenges with respect to the validity of the sale. In the absence of title insurance, the sale may be rescinded and we may be unable to recover our purchase price, resulting in a complete loss. Title insurance obtained subsequent to purchase offers little protection against discoverable defects because they are typically excluded from such policies. In addition, even if we are able to acquire title insurance on a property, the insurance may not cover all defects or the significant legal costs associated with obtaining clear title.
Any of these risks could adversely affect our operating results, cash flows, and ability to make distributions to our stockholders.
Eminent domain could lead to material losses on our investments in our properties.
Governmental authorities may exercise eminent domain to acquire land on which our properties are built. Any such exercise of eminent domain would allow us to recover only the fair value of the affected property. Our acquisition strategy is premised on the concept that this “fair value” will be substantially less than the intrinsic value of the property for a number of years, and we could effectively have no profit potential from properties acquired by the government through eminent domain. Several cities are also exploring proposals to use eminent domain to acquire mortgages to assist homeowners to remain in their homes, potentially reducing the supply of single-family properties in our markets.
22
We are involved in a variety of legal actions and administrative proceedings as a result of which we may incur significant costs.
We are currently involved in, and expect that we will continue to be involved in, a variety of legal actions and administrative proceedings that arise from time to time in the ordinary course of business. These matters include eviction proceedings and other landlord-tenant disputes, challenges to title and ownership rights (including actions brought by prior owners alleging wrongful foreclosure by their lender or servicer) and issues with local housing officials arising from the condition or maintenance of the property. While we intend to vigorously defend any non-meritorious claim or proceeding, no assurance can be given that we will not incur significant costs or be subject to material losses as a result.
Increasing real estate taxes, HOA fees, and insurance costs may negatively affect our financial results.
As a result of our substantial real estate holdings, the cost of real estate taxes and insuring our properties is a significant component of our expenses. In addition, a significant portion of the properties in our portfolio are subject to HOAs, which have the power to increase monthly charges and make assessments for capital improvements and common area repairs. Real estate taxes, HOA fees, and insurance premiums are subject to significant increases, which can be outside of our control. If the costs associated with real estate taxes, HOA fees, and assessments or insurance should rise significantly and we are unable to raise rents to offset such increases, our results of operations would be negatively impacted.
Declining real estate valuations and impairment charges could adversely affect our earnings and financial condition.
We periodically review the value of our properties to determine whether their value, based on market factors, projected income and generally accepted accounting principles, has permanently decreased such that it is necessary or appropriate to take an impairment loss in the relevant accounting period. Such a loss would cause an immediate reduction of net income in the applicable accounting period and would be reflected in a decrease in our balance sheet assets. The reduction of net income from impairment losses could lead to a reduction in our dividends, both in the relevant accounting period and in future periods. Even if we do not determine that it is necessary or appropriate to record an impairment loss, a reduction in the intrinsic value of a property would become manifest over time through reduced income from the property and would therefore affect our earnings and financial condition.
Security breaches and other disruptions could compromise our information and expose us to liability, which would cause our business and reputation to suffer.
In the ordinary course of our business we acquire and store sensitive data, including intellectual property, our proprietary business information and personally identifiable information of our prospective and current residents, our employees and third-party service providers in our branch offices and on our networks and website. The secure processing and maintenance of this information is critical to our operations and business strategy. Despite our security measures, our information technology and infrastructure may be vulnerable to attacks by hackers or breached due to employee error, malfeasance, or other disruptions. Any such breach could compromise our networks and the information stored there could be accessed, publicly disclosed, lost or stolen. Any such access, disclosure or other loss of information could result in legal claims or proceedings, liability under laws that protect the privacy of personal information, regulatory penalties, disruption to our operations and the services we provide to customers or damage to our reputation, which could adversely affect our results of operations and competitive position.
As a public company, we are obligated to develop and maintain proper and effective internal control over financial reporting. We may not complete our analysis of our internal control over financial reporting in a timely manner, or these internal controls may not be determined to be effective, which may adversely affect investor confidence in our company and, as a result, the value of our common stock.
Each year, we are required, pursuant to Section 404 of the Sarbanes-Oxley Act, to furnish a report by management on, among other things, the effectiveness of our internal control over financial reporting. This assessment includes disclosure of any material weaknesses identified by our management in our internal control over financial reporting, as well as a statement that our independent registered public accounting firm has issued an opinion on our internal control over financial reporting. We may not be able to complete our evaluation, testing, and any required remediation in a timely fashion. In addition, any remediation efforts may not enable us to avoid a material weakness in the future. During the evaluation and testing process, if we identify one or more material weaknesses in our internal control over financial reporting, we will be unable to assert that our internal controls are effective.
23
Our independent registered public accounting firm is not required to formally attest to the effectiveness of our internal control over financial reporting pursuant to Section 404 until we are no longer an “emerging growth company,” as defined in the Jumpstart Our Business Startups Act of 2012 (the "JOBS Act"), for so long as we take advantage of the exemptions contained in the JOBS Act. We will remain an “emerging growth company” for up to five years after our initial public offering, although if the market value of our common stock that is held by non-affiliates exceeds $700 million as of any June 30 before that time, we would cease to be an “emerging growth company” as of the following December 31. At such time, our independent registered public accounting firm may issue a report that is adverse in the event it is not satisfied with the level at which our controls are documented, designed, or operating.
If we are unable to assert that our internal control over financial reporting is effective, or if our independent registered public accounting firm is unable to express an opinion on the effectiveness of our internal controls, investors could lose confidence in the accuracy and completeness of our financial reports, which could cause the price of our common stock to decline, and we may become subject to investigation or sanctions by the SEC. In addition, the existence of a material weakness or significant deficiency could also result in errors in our financial statements that could require a restatement or cause us to fail to meet our public company reporting obligations. To comply with the requirements of being a public company, we may need to undertake various actions, such as implementing new internal controls and procedures and hiring accounting or internal audit staff.
Risks Related to the Real Estate Industry
Our operating performance is subject to risks associated with the real estate industry that could reduce the rent we receive, decrease the value of our properties, or adversely affect our financial condition.
Real estate investments are subject to various risks and fluctuations and cycles in value and demand, many of which are beyond our control. Certain events may decrease cash available for dividends as well as the value of our properties. These events include:
• | adverse changes in national or local real estate, economic, or demographic conditions; |
• | vacancies or our inability to rent our homes on favorable terms or at favorable rental rates; |
• | bankruptcies or adverse changes in the financial conditions of the residents of our properties; |
• | resident turnover or our inability to collect rent from residents; |
• | reduced demand for single-family home rentals and changes in the relative popularity of properties and neighborhoods; |
• | increased supply of single-family homes and availability of financing; |
• | increases in expenses, including insurance costs, labor costs, energy prices, real estate assessments, and other taxes and costs of compliance with laws, regulations, and governmental policies to the extent that we are unable to pass on these increases to our residents; |
• | changes in interest rates, availability, and terms of debt financing; |
• | the illiquidity of real estate investments generally; |
• | residents’ perceptions of the safety, convenience, and attractiveness of our properties and the neighborhoods where they are acquired; |
• | the ability or unwillingness of residents to pay rent increases; |
• | the effects of rent controls, stabilization laws and other laws or covenants regulating rental rates; and |
• | changes in, and changes in enforcement of, laws, regulations and governmental policies, including health, safety, environmental, rental property, zoning and tax laws, governmental fiscal policies, and the Americans with Disabilities Act of 1990. |
24
In addition, periods of economic slowdown or recession, rising interest rates or declining demand for real estate, or the public perception that any of these events may occur, could result in a general decline in rents or an increased incidence of defaults under existing leases. If we cannot operate our properties to meet our financial expectations, our financial condition, results of operations, cash flow, per share trading price of our common stock, ability to satisfy our debt service obligations and ability to pay dividends to stockholders could be adversely affected.
Mortgage loan modification programs and future legislative action may adversely affect the number of available properties that meet our investment criteria.
The U.S. government, through the Federal Reserve, the FHA and the Federal Depository Insurance Corporation (FDIC), has implemented a number of programs designed to provide homeowners with assistance in avoiding residential mortgage loan foreclosures, including the Home Affordable Modification Program, which seeks to provide relief to homeowners whose mortgages are in or may be subject to foreclosure, and the Home Affordable Refinance Program, which allows certain borrowers who are underwater on their mortgage but current on their mortgage payments to refinance their loans. Several states, including states in which our current markets are located, have adopted or are considering similar legislation. These programs and other loss mitigation programs may involve, among other things, the modification or refinancing of mortgage loans or providing homeowners with additional relief from loan foreclosures. Such loan modifications and other measures are intended and designed to lead to fewer foreclosures, which will decrease the supply of properties that meet our investment criteria.
In addition, numerous federal and state legislatures have considered, proposed, or adopted legislation to constrain foreclosures, or may do so in the future. For example, in 2012, California enacted a law imposing new limitations on foreclosures while a request for a loan modification is pending. The Dodd-Frank Act also created the Consumer Financial Protection Bureau, which supervises and enforces federal consumer protection laws as they apply to banks, credit unions, and other financial companies, including mortgage servicers. It remains uncertain as to whether any of these measures will have a significant impact on foreclosure volumes or what the timing of that impact would be. If foreclosure volumes were to decline significantly, we would expect REO inventory levels to decline or to grow at a slower pace, which would make it more difficult to find target assets at attractive prices and might constrain our growth or reduce our long-term profitability. Also, the number of families seeking rental housing might be reduced by such legislation, reducing rental housing demand in our markets.
A prolonged economic slowdown or a lengthy or severe recession or stagnation or decline in home values could impair our assets and harm our operations.
The risks associated with our business are more severe during periods of economic slowdown or recession. For example, the ability of residents to pay their rent typically depends on the income or assets of the residents. During an economic slowdown, unemployment rises and increasing numbers of residents have difficulty making payments on their obligations, including rent. Any sustained period of increased payment delinquencies or defaults could adversely affect our revenues, results of operations, financial condition, business prospects and ability to make distributions to stockholders. Thus any prolonged economic slowdown or a lengthy or severe recession, whether caused by global unrest, acts or threats of terrorism, breakdowns in the financial system or otherwise, could impair our assets or the performance of our assets and harm our operations.
Risks Related to Our Common Stock
Sales of common stock in the future may have adverse effects on our share price.
Subject to applicable law, our board of directors has the authority, without further stockholder approval, to issue additional authorized shares of common stock and preferred stock (or securities which are convertible or exchangeable for common stock or preferred stock) on the terms and for the consideration it deems appropriate. We cannot predict the effect, if any, of future sales of our common stock, or the effect, if any, of the availability of shares for future sales, on the market price of our common stock. We may expand the scale of our operations and may utilize the proceeds of future equity offerings to accomplish that strategy. To the extent the proceeds of any future equity offering are invested in residential assets that have less favorable yield characteristics than our then existing portfolio, our stockholders will suffer dilution in their yield and distributable cash per share.
Additionally, as of the closing of the Internalization, Pine River and Provident received an aggregate of 2,231,511 common units of our Operating Partnership, representing approximately 6.2% of our outstanding common shares as of December 31, 2015 (or 5.8% of fully-diluted shares as of December 31, 2015 assuming issuance and redemption for common shares of the 2,231,511 common units to be received by the Pine River and Provident in the Internalization). As long as the
25
resale registration statement that we filed with the SEC covering these shares remains effective, these shares will be freely transferable without restriction if and when they are issued. The market price of our common stock may decline significantly if Pine River and Provident either or both were to sell a significant portion of their common stock within a short timeframe. Sales of substantial amounts of common stock or the perception that such sales could occur may adversely affect the prevailing market price for our common stock.
The trading volume and market price of our common stock may be volatile and could decline substantially in the future.
We cannot assure stockholders that the market price of our common stock will not fluctuate or decline significantly in the future, including as a result of factors unrelated to our operating performance or prospects. Some of the factors that could negatively affect the market price or increase the volatility of our common stock include:
• | our actual or projected operating results, financial condition, cash flows and liquidity or changes in business strategy or prospects; |
• | equity issuances by us, or share resales by our stockholders, or the perception that such issuances or resales may occur; |
• | actual or anticipated accounting problems; |
• | publication of research reports about us or the real estate industry; |
• | changes in market valuations of similar companies; |
• | adverse market reaction to any increased indebtedness we incur in the future; |
• | additions to or departures of our key personnel; |
• | speculation in the press or investment community; |
• | our failure to meet, or the lowering of, our earnings estimates or those of any securities analysts; |
• | increases in market interest rates, which may lead investors to seek alternative investments paying higher dividends or interest, or to demand a higher distribution yield for our common stock, and which would result in increased interest expense on our variable rate debt, if any; |
• | failure to maintain our REIT qualification; |
• | price and volume fluctuations in the stock market generally, such as those experienced in the last half of 2015 and the beginning of 2016; and |
• | general market and economic conditions, including the current state of the credit and capital markets. |
We have not established a minimum distribution payment level and we cannot assure you of our ability to pay distributions in the future.
We are generally required to distribute to our stockholders at least 90% of our taxable income each year in order to qualify as a REIT under the Code, which we currently intend to satisfy through quarterly cash distributions of all or substantially all of our REIT taxable income in such year, subject to certain adjustments. We have not established a minimum distribution payment level and our ability to pay distributions may be adversely affected by a number of factors, including the risk factors described in this Annual Report. All distributions will be made at the discretion of our board of directors and will depend on our earnings, financial condition, maintenance of our REIT qualification and other factors that our board of directors may deem relevant from time to time. As a result, no assurance can be given that we will be able to make distributions to our stockholders at any time or that the level of any distributions will achieve any specific market yield or will increase or be maintained over time. Any failure to achieve expected distributions could materially and adversely affect the price of our common stock.
26
We are an “emerging growth company” and we cannot be certain if the reduced disclosure requirements applicable to emerging growth companies will make our common stock less attractive to investors.
We currently qualify as an “emerging growth company” as defined in the JOBS Act, and may take advantage of certain exemptions from various reporting requirements that are applicable to other public companies that are not “emerging growth companies,” including not being required to comply with the auditor attestation requirements of section 404 of the Sarbanes-Oxley Act, reduced disclosure obligations regarding executive compensation in our periodic reports and proxy statements, and exemptions from the requirements of holding a nonbinding advisory vote on executive compensation and stockholder approval of any golden parachute payments not previously approved. We cannot predict if investors will find our common stock less attractive because we may rely on these exemptions. If some investors find our common stock less attractive as a result, there may be a less active trading market for our common stock and our stock price may be more volatile.
Risks Related to Our Organization and Structure
Certain provisions of Maryland law could inhibit changes in control, preventing our stockholders from realizing a potential premium over the market price of our stock in a proposed acquisition.
Certain provisions of the Maryland General Corporation Law ("MGCL") may have the effect of deterring a third party from making a proposal to acquire us or of impeding a change in control under circumstances that otherwise could provide the holders of our common stock with the opportunity to realize a premium over the then-prevailing market price of our common stock. We are subject to the “business combination” provisions of the MGCL that, subject to limitations, prohibit certain business combinations (including a merger, consolidation, share exchange, or, in circumstances specified in the statute, an asset transfer or issuance or reclassification of equity securities) between us and an “interested stockholder” (defined generally as any person who beneficially owns 10% or more of our then outstanding voting capital stock or an affiliate or associate of ours who, at any time within the two-year period prior to the date in question, was the beneficial owner of 10% or more of our then outstanding voting capital stock, provided that our board of directors did not approve in advance the transaction by which the stockholders otherwise would have become an interested stockholder) or an affiliate thereof for five years after the most recent date on which the stockholder becomes an interested stockholder. After the five-year prohibition, any business combination between us and an interested stockholder generally must be recommended by our board of directors and approved by the affirmative vote of at least (1) 80% of the votes entitled to be cast by holders of outstanding shares of our voting capital stock; and (2) two-thirds of the votes entitled to be cast by holders of voting capital stock of the corporation other than shares held by the interested stockholder with whom or with whose affiliate the business combination is to be effected or held by an affiliate or associate of the interested stockholder. These super-majority vote requirements do not apply if our common stockholders receive a minimum price, as defined under Maryland law, for their shares in the form of cash or other consideration in the same form as previously paid by the interested stockholder for its shares. These provisions of the MGCL do not apply, however, to business combinations that are approved or exempted by a board of directors prior to the time that the interested stockholder becomes an interested stockholder. Pursuant to the statute, our board of directors has by resolution exempted business combinations between us and any other person, provided that such business combination is first approved by our board of directors (including a majority of our directors who are not affiliates or associates of such person), though our board of directors may vote to repeal the resolution at any time.
The “control share” provisions of the MGCL provide that “control shares” of a Maryland corporation (defined as shares which, when aggregated with other shares controlled by the stockholder (except solely by virtue of a revocable proxy), entitle the stockholder to exercise one of three increasing ranges of voting power in electing directors) acquired in a “control share acquisition” (defined as the direct or indirect acquisition of ownership or control of “control shares”) have no voting rights except to the extent approved by our stockholders by the affirmative vote of at least two-thirds of all the votes entitled to be cast on the matter, excluding votes entitled to be cast by the acquiror of control shares, our officers and our personnel who are also our directors. Our bylaws contain a provision exempting from the control share acquisition statute any and all acquisitions by any person of shares of our stock. There can be no assurance that this provision will not be amended or eliminated at any time in the future.
The “unsolicited takeover” provisions of the MGCL permit our board of directors, without stockholder approval and regardless of what is currently provided in our charter or bylaws, to implement certain provisions if we have a class of equity securities registered under the Exchange Act (which we have) and at least three independent directors. These provisions may have the effect of inhibiting a third party from making an acquisition proposal for us or of delaying, deferring or preventing a change in control of us under the circumstances that otherwise could provide the holders of shares of common stock with the opportunity to realize a premium over the then current market price. Our charter contains a provision whereby we have elected to be subject to the provisions of Title 3, Subtitle 8 of the MGCL relating to the filling of vacancies on our board of directors.
27
Our authorized but unissued shares of common and preferred stock may prevent a change in our control.
Our charter authorizes our board of directors to issue additional authorized but unissued shares of common or preferred stock. In addition, our board of directors may, without stockholder approval, amend our charter to increase the aggregate number of our shares of stock or the number of shares of stock of any class or series that we have authority to issue and classify or reclassify any unissued shares of common or preferred stock and set the preferences, rights and other terms of the classified or reclassified shares. As a result, our board of directors may establish a series or class of shares of common or preferred stock that could delay or prevent a transaction or a change in control that might involve a premium price for our shares of common stock or otherwise be in the best interest of our stockholders.
Risks Related to Our Taxation as a REIT
If we do not qualify as a REIT or fail to remain qualified as a REIT, we will be subject to federal income tax at regular corporate rates and could face a substantial tax liability, which would reduce the amount of cash available for distribution to our stockholders.
If we were to fail to qualify as a REIT in any taxable year, we would be subject to federal (and applicable state and local) income tax, including any applicable alternative minimum tax, on our taxable income at regular corporate rates. Dividends paid to our stockholders would not be deductible by us in computing our taxable income and would be taxable to our stockholders under the rules generally applicable to corporate distributions. The corporate tax liability arising from this inability to deduct dividends paid could be substantial and would reduce the amount of cash available for distribution to our stockholders, which in turn could have an adverse impact on the value of our common stock. Unless we were entitled to relief under certain Code provisions, we also would be disqualified from taxation as a REIT for the four taxable years following the year in which we failed to qualify as a REIT.
Dividends payable by REITs do not generally qualify for the reduced tax rates available for some dividends.
The federal income tax rate on certain corporate dividends paid to individuals and other non-corporate taxpayers currently is at a reduced rate of 15% or 20%, depending on the recipient’s income. Dividends paid by REITs to individuals and other non-corporate stockholders are not generally eligible for the reduced rate. This may cause investors to view investments in REITs to be less attractive than investments in non-REITs, which in turn may adversely affect the value of stock of REITs, including our common stock.
REIT distribution requirements could adversely affect our economic performance.
We generally must distribute annually at least 90% of our taxable income, subject to certain adjustments and excluding any net capital gain, in order to comply with REIT requirements. To the extent that we satisfy this distribution requirement, but distribute less than 100% of our taxable income, we will be subject to federal corporate income tax on our undistributed taxable income. In addition, we will be subject to a 4% nondeductible excise tax if the actual amount that we pay out to our stockholders in a calendar year is less than a minimum amount required under the Code. We intend to make distributions to our stockholders to comply with the REIT requirements of the Code.
Compliance with the REIT distribution requirements may hinder our ability to grow, which could adversely affect the value of our common stock. Furthermore, we may find it difficult or impossible to meet distribution requirements in certain circumstances. The requirement to distribute most of our taxable income could cause us to: (i) sell assets in adverse market conditions, (ii) borrow on unfavorable terms, (iii) distribute amounts that would otherwise be used to make future acquisitions or capital expenditures, or (iv) make a taxable distribution of our shares as part of a distribution in which stockholders may elect to receive shares or cash, in order to comply with REIT requirements. These alternatives could adversely affect our economic performance.
If the initial tax basis that we established for our assets is challenged by the IRS, we may have to distribute additional amounts in order to satisfy the REIT distribution requirements.
We established our initial tax basis in the assets received in connection with our formation and initial public offering in part by reference to the trading price of our common stock. The IRS could assert that our initial tax basis is less than the amount determined by us (or is a carryover basis). If the IRS were successful in sustaining such an assertion, this would result in decreased depreciation deductions and increased gain on any asset dispositions, and thus increased taxable income, as compared to the amounts we had originally calculated and reported. This could result in our being required to distribute
28
additional amounts in order to maintain our REIT status and avoid corporate taxes and also could result in our owing interest and penalties.
The stock ownership limit imposed by the Code for REITs and our charter may restrict our business combination opportunities.
In order for us to maintain our qualification as a REIT under the Code, not more than 50% in value of our outstanding stock may be owned, directly or indirectly, by five or fewer individuals (as defined in the Code to include certain entities) at any time during the last half of each taxable year following our first year. Our charter, with certain exceptions, authorizes our board of directors to take the actions that are necessary and desirable to preserve our qualification as a REIT. Our charter provides that, unless exempted by our board of directors, no person may own more than 9.8% of the aggregate value of our outstanding capital stock. Our board may grant an exemption in its sole discretion, subject to such conditions, representations and undertakings as it may determine. The ownership limits imposed by the tax law are based upon direct or indirect ownership by “individuals,” but only during the last half of a tax year. The ownership limits contained in our charter key off of the ownership at any time by any “person,” which term includes entities. These ownership limitations in our charter are common in REIT charters and are intended to provide added assurance of compliance with the tax law requirements and to minimize administrative burdens. However, these ownership limits might also delay or prevent a transaction or a change in our control that might involve a premium price for our common stock or otherwise be in the best interest of our stockholders.
Even if we qualify as a REIT, we may face other tax liabilities that reduce our cash flow.
Even if we qualify for taxation as a REIT, we may be subject to certain federal, state and local taxes on our income and assets, including taxes on any undistributed income, tax on income from some activities conducted as a result of a foreclosure, and state or local income, property and transfer taxes. In addition, we could, in certain circumstances, be required to pay an excise tax or penalty tax (which could be significant in amount) in order to utilize one or more of the relief provisions under the Code to maintain our qualification as a REIT. In addition, in order to meet the REIT qualification requirements or to avert the imposition of a 100% tax that applies to certain gains derived by a REIT from sales of “dealer property,” we may hold some of our assets or conduct activities through subsidiary corporations that will be subject to corporate-level income tax at regular rates (a “taxable REIT subsidiary,” or TRS). In addition, if we lend money to a TRS, the TRS may be unable to deduct all or a portion of the interest paid to us, which could result in an even higher corporate level tax liability. Any of these taxes would decrease cash available for distribution to our stockholders.
Furthermore, the Code imposes a 100% tax on certain transactions between a TRS and its parent REIT that are not conducted on an arm’s-length basis. We will structure our transaction with any TRS on terms that we believe are arm’s-length to avoid incurring the 100% excise tax described above. There can be no assurances, however, that we will be able to avoid application of the 100% tax.
Complying with REIT requirements may cause us to forgo otherwise attractive opportunities.
To qualify as a REIT for federal income tax purposes, we must continually satisfy tests concerning, among other things, the sources of our income, the nature and diversification of our assets, the amounts that we distribute to our stockholders and the ownership of our stock. We may be required to make distributions to stockholders at disadvantageous times or when we do not have funds readily available for distribution, and we may be unable to pursue investments that would be otherwise advantageous to us in order to satisfy the source-of-income or asset-diversification requirements for qualifying as a REIT. Thus, compliance with the REIT requirements may hinder our ability to make certain attractive investments.
We may in the future choose to pay dividends in our own stock, in which case our stockholders may be required to pay income taxes in excess of the cash dividends they receive.
We may in the future distribute taxable dividends that are payable in cash and shares of our common stock at the election of each stockholder, but subject to a limitation on the amount of cash that may be distributed. Taxable stockholders receiving such dividends will be required to include the full amount of the dividend, whether received as cash or shares of our common stock, as ordinary income to the extent of our current and accumulated earnings and profits for federal income tax purposes. As a result, stockholders may be required to pay income taxes with respect to such dividends in excess of the cash dividends received. If a U.S. stockholder sells the stock that it receives as a dividend in order to pay this tax, the sales proceeds may be less than the amount included in income with respect to the dividend, depending on the market price of our stock at the time of the sale. Furthermore, with respect to certain non-U.S. stockholders, we may be required to withhold U.S. tax with respect to such dividends, including in respect of all or a portion of such dividend that is payable in stock. In addition, if a
29
significant number of our stockholders determine to sell shares of our common stock in order to pay taxes owed on dividends, it may put downward pressure on the trading price of our common stock.
Under a previously applicable Revenue Procedure, 90% of taxable cash/stock dividends of a REIT could be paid in stock. It is unclear whether and to what extent we will be able to pay taxable dividends in cash and stock. Moreover, various aspects of such a taxable cash/stock dividend are uncertain and have not yet been addressed by the IRS. No assurance can be given that the IRS will not impose additional requirements in the future with respect to taxable cash/stock dividends or assert that the requirements for such taxable cash/stock dividends have not been met.
The REIT rules relating to prohibited transactions could affect our disposition of assets and adversely affect our profitability.
From time to time, we may choose to transfer or dispose of some of the properties in our portfolios. A REIT’s net income from “prohibited transactions” is subject to a 100% tax. In general, prohibited transactions are sales or other dispositions of property, other than foreclosure property, held primarily for sale to customers in the ordinary course of business, or “dealer property.” We intend to conduct our activities so as not to generate prohibited transaction income. However, the avoidance of this tax on prohibited transactions could cause us to undertake less substantial sales of property than we would otherwise undertake in order to maximize our profits. In addition, to comply with certain statutory requirements of a prohibited transactions safe harbor, we may have to sell numerous properties to a single or a few purchasers, which could cause us to be less profitable than would be the case if we sold properties on a property-by-property basis.
The ability of our board of directors to revoke our REIT election without shareholder approval may cause adverse consequences to our stockholders.
Our charter provides that our board of directors may revoke or otherwise terminate our REIT election, without the approval of our stockholders, if it determines that it is no longer in our best interest to continue to qualify as a REIT. If we cease to be a REIT, we would become subject to U.S. federal income tax on our taxable income and would no longer be required to distribute most of our taxable income to our shareholders, which may have adverse consequences on the total return to our shareholders.
If the Operating Partnership fails to qualify as a partnership for federal income tax purposes, we could fail to qualify as a REIT and suffer other adverse consequences.
We believe that the Operating Partnership is organized and operates in a manner so as to be treated as a partnership and not an association or a publicly traded partnership taxable as a corporation, for federal income tax purposes. As a partnership, the Operating Partnership is not subject to federal income tax on its income. Instead, each of the partners is allocated its share of the Operating Partnership’s items of gain, loss, income, deductions, and credit. No assurance can be provided, however, that the IRS will not challenge the Operating Partnership’s status as a partnership for federal income tax purposes, or that a court would not sustain such a challenge. If the IRS were successful in treating the Operating Partnership as an association or publicly traded partnership taxable as a corporation for federal income tax purposes, we could fail to meet the gross income tests and certain of the asset tests applicable to REITs and, accordingly, could cease to qualify as a REIT. Also, the failure of the Operating Partnership to qualify as a partnership would cause it to become subject to federal corporate income tax, which would reduce significantly the amount of its cash available for distribution to its partners, including us.
Distributions to tax-exempt investors may be classified as unrelated business taxable income.
Neither ordinary nor capital gain distributions with respect to our common stock nor gain from the sale of common stock should generally constitute unrelated business taxable income to a tax-exempt investor. However, there are certain exceptions to this rule. In particular:
• | part of the income and gain recognized by certain qualified employee pension trusts with respect to our common stock may be treated as unrelated business taxable income if shares of our common stock are predominantly held by qualified employee pension trusts, and we are required to rely on a special look-through rule for purposes of meeting one of the REIT ownership tests, and we are not operated in a manner to avoid treatment of such income or gain as unrelated business taxable income; |
• | part of any income and gain recognized by a tax-exempt investor with respect to our common stock would constitute unrelated business taxable income if the investor incurs debt in order to acquire the common stock; and |
30
• | part or all of any income or gain recognized with respect to our common stock by social clubs, voluntary employee benefit associations, supplemental unemployment benefit trusts and qualified group legal services plans which are exempt from federal income taxation under the Code may be treated as unrelated business taxable income. |
Qualifying as a REIT involves highly technical and complex provisions of the Code and a violation of these provisions could jeopardize our REIT status.
Qualification as a REIT involves the application of highly technical and complex Code provisions for which only limited judicial and administrative authorities exist. Even a technical or inadvertent violation could jeopardize our REIT qualification. Our qualification as a REIT depends on our satisfaction of certain asset, income, organizational, distribution, stockholder ownership and other requirements on a continuing basis. In addition, our ability to satisfy the requirements to qualify as a REIT may depend in part on the actions of third parties over which we may have no control or only limited influence, including in cases where we own an equity interest in an entity that is classified as a partnership for federal income tax purposes.
New legislation or administrative or judicial action, in each instance potentially with retroactive effect, could make it more difficult or impossible for us to qualify as a REIT.
The present federal income tax treatment of REITs may be modified, possibly with retroactive effect, by legislative, judicial or administrative action at any time, which could affect the federal income tax treatment of an investment in us. The federal income tax rules relating to REITs are constantly under review by persons involved in the legislative process, the IRS and the U.S. Treasury Department, which results in frequent statutory changes and revisions to regulations and interpretations. Revisions in federal tax laws and interpretations thereof could adversely affect us or cause us to change our investments and commitments and affect the tax considerations of an investment in us. For example, the recently enacted Protecting Americans from Tax Hikes Act of 2015 (the "Act") contains numerous changes to the U.S. federal income tax rules applicable to REITs. Such changes include modifications to various rules that apply to our ownership of, and business relationship with, our TRSs (including a reduction in the maximum allowable value of our assets attributable to TRSs from 25% to 20%) which could impact our ability to enter into future investments.The provisions enacted in by the Act could result in changes in our tax positions or investments, and future legislative changes related to those rules described above could have a materially adverse impact on our results of operations and financial condition.
31
Item 1B. Unresolved Staff Comments.
None.
Item 2. Properties.
The following table provides a summary of our portfolio of single-family properties as of December 31, 2015:
Market | Number of Properties (1) | Aggregate Cost Basis (2) (thousands) | Average Cost Basis Per Property (thousands) | Average Age (in years) (3) | Average Square Footage | |||||||||||
Atlanta | 2,723 | $ | 316,287 | $ | 116 | 22.0 | 1,799 | |||||||||
Phoenix | 1,424 | 202,811 | 142 | 27.2 | 1,636 | |||||||||||
Tampa | 1,113 | 159,426 | 143 | 27.6 | 1,623 | |||||||||||
Charlotte (4) | 686 | 84,597 | 123 | 15.7 | 1,644 | |||||||||||
Dallas | 504 | 67,648 | 134 | 24.0 | 1,618 | |||||||||||
Orlando | 496 | 66,122 | 133 | 28.6 | 1,498 | |||||||||||
Jacksonville | 452 | 59,652 | 132 | 27.4 | 1,537 | |||||||||||
Southeast FL (5) | 384 | 76,589 | 199 | 44.6 | 1,494 | |||||||||||
Northern CA (6) | 382 | 72,662 | 190 | 47.4 | 1,399 | |||||||||||
Las Vegas | 290 | 41,270 | 142 | 19.7 | 1,717 | |||||||||||
Columbus | 284 | 33,136 | 117 | 38.6 | 1,414 | |||||||||||
Tucson | 209 | 17,485 | 84 | 43.0 | 1,330 | |||||||||||
Southern CA (7) | 75 | 11,999 | 160 | 46.8 | 1,366 | |||||||||||
Totals | 9,022 | $ | 1,209,684 | $ | 134 | 27.0 | 1,641 | |||||||||
_______________
(1) | Total properties exclude properties reflected as assets held for sale on our consolidated balance sheets and any properties previously acquired in purchases that have been subsequently rescinded or vacated. |
(2) | Aggregate cost basis includes all capitalized costs, determined in accordance with U.S. generally accepted accounting policies ("GAAP"), incurred through December 31, 2015 for the acquisition, stabilization, and significant post-stabilization renovation of properties, including land, building, possession costs, and renovation costs. Aggregate cost basis includes $14.7 million in capital improvements, incurred from our formation through December 31, 2015, made to properties that had been previously renovated, but does not include accumulated depreciation. |
(3) | As of December 31, 2015, approximately 4% of our properties were less than 10 years old, 38% were between 10 and 20 years old, 19% were between 20 and 30 years old, 19% were between 30 and 40 years old, 10% were between 40 and 50 years old, and 10% were more than 50 years old. Average age is an annual calculation. |
(4) | Charlotte market includes properties in South Carolina due to its proximity to Charlotte, North Carolina. |
(5) | Southeast Florida market currently consists of Miami-Dade, Broward, and Palm Beach counties. |
(6) | Northern California market currently consists of Contra Costa, Napa, and Solano counties. |
(7) | Southern California market currently consists of Riverside and San Bernardino counties. |
32
The following table summarizes the leasing status of our properties as of December 31, 2015:
Market | Number of Properties | Number of Stabilized Properties (1) | Properties Leased | Properties Vacant | Aggregate Portfolio Occupancy Rate | Stabilized Occupancy Rate | Average Monthly Rent (2) | Average Remaining Lease Term (Months) (3) | ||||||||||||||||
Atlanta | 2,723 | 2,723 | 2,629 | 94 | 96.5 | % | 96.5 | % | $ | 1,060 | 7.7 | |||||||||||||
Phoenix | 1,424 | 1,424 | 1,347 | 77 | 94.6 | % | 94.6 | % | 1,102 | 6.5 | ||||||||||||||
Tampa | 1,113 | 1,113 | 1,062 | 51 | 95.4 | % | 95.4 | % | 1,298 | 7.8 | ||||||||||||||
Charlotte | 686 | 685 | 658 | 28 | 95.9 | % | 96.1 | % | 1,063 | 6.8 | ||||||||||||||
Dallas | 504 | 504 | 481 | 23 | 95.4 | % | 95.4 | % | 1,297 | 6.8 | ||||||||||||||
Orlando | 496 | 496 | 481 | 15 | 97.0 | % | 97.0 | % | 1,155 | 5.9 | ||||||||||||||
Jacksonville | 452 | 452 | 436 | 16 | 96.5 | % | 96.5 | % | 1,133 | 7.1 | ||||||||||||||
Southeast FL | 384 | 383 | 356 | 28 | 92.7 | % | 93.0 | % | 1,650 | 5.4 | ||||||||||||||
Northern CA | 382 | 382 | 372 | 10 | 97.4 | % | 97.4 | % | 1,609 | 6.9 | ||||||||||||||
Las Vegas | 290 | 290 | 285 | 5 | 98.3 | % | 98.3 | % | 1,189 | 7.0 | ||||||||||||||
Columbus | 284 | 284 | 276 | 8 | 97.2 | % | 97.2 | % | 1,072 | 7.6 | ||||||||||||||
Tucson | 209 | 209 | 200 | 9 | 95.7 | % | 95.7 | % | 844 | 5.2 | ||||||||||||||
Southern CA | 75 | 75 | 62 | 13 | 82.7 | % | 82.7 | % | 1,225 | 3.2 | ||||||||||||||
Totals | 9,022 | 9,020 | 8,645 | 377 | 95.8 | % | 95.8 | % | $ | 1,167 | 7.0 | |||||||||||||
_______________
(1) | We consider a property stabilized at the earlier of (i) its first authorized occupancy or (ii) 90 days after the renovations for such property are complete regardless of whether the property is leased. Properties acquired with in-place leases are considered stabilized even though such properties may require future renovation to meet our standards and may have existing residents who would not otherwise meet our resident screening requirements. |
(2) | Average monthly rent for leased properties was calculated as the average of the contracted monthly rent for all leased properties as of December 31, 2015 and reflects rent concessions amortized over the life of the related lease. |
(3) | Average remaining lease term assumes a remaining term of 30 days for leases in month-to-month status. |
33
Item 3. Legal Proceedings.
From time to time, we are party to claims and routine litigation arising in the ordinary course of our business. We do not believe that the results of any such claims or litigation individually, or in the aggregate, will have a material adverse effect on our business, financial position, or results of operations.
Item 4. Mine Safety Disclosures.
Not applicable.
34
PART II
Item 5. Market for Registrant’s Common Equity, Related Stockholder Matters and Issuer Purchases of Equity Securities.
Market Information
Our common stock is listed on the NYSE under the symbol “SBY”. Below is a summary of the high and low prices for our common stock for each quarterly period during calendar years ended December 31, 2015 and December 31, 2014, as reported on the NYSE:
Quarter Ended | High | Low | ||||||
December 31, 2015 | $ | 16.91 | $ | 15.00 | ||||
September 30, 2015 | 16.86 | 15.31 | ||||||
June 30, 2015 | 16.75 | 15.03 | ||||||
March 31, 2015 | 17.04 | 15.38 | ||||||
December 31, 2014 | 17.10 | 15.96 | ||||||
September 30, 2014 | 16.89 | 15.74 | ||||||
June 30, 2014 | 16.82 | 14.65 | ||||||
March 31, 2014 | 16.98 | 15.31 | ||||||
Holders
As of February 19, 2016, there were 184 registered holders of our common stock. This figure does not reflect the beneficial ownership of shares held in nominee name.
Dividends
The following table presents cash dividends declared on our common stock during calendar years ended December 31, 2015 and December 31, 2014:
Declaration Date | Record Date | Payment Date | Cash Dividend per Share | |||||
December 17, 2015 | December 28, 2015 | January 8, 2016 | $ | 0.13 | ||||
September 25, 2015 | October 6, 2015 | October 16, 2015 | 0.12 | |||||
June 17, 2015 | June 29, 2015 | July 10, 2015 | 0.12 | |||||
March 25, 2015 | April 6, 2015 | April 17, 2015 | 0.09 | |||||
December 18, 2014 | December 29, 2014 | January 9, 2015 | 0.06 | |||||
September 4, 2014 | September 22, 2014 | October 3, 2014 | 0.04 | |||||
June 19, 2014 | June 30, 2014 | July 11, 2014 | 0.03 | |||||
March 13, 2014 | March 24, 2014 | April 4, 2014 | 0.03 | |||||
We intend to make quarterly distributions to our common stockholders. U.S. federal income tax law requires that a REIT distribute annually at least 90% of its net taxable income, excluding net capital gains, and that it pay tax at regular corporate rates to the extent that it annually distributes less than 100% of its REIT taxable income, including capital gains.
Dividends and other distributions will be authorized by our board of directors in its sole discretion out of funds legally available and will be dependent upon a number of factors, including actual results of operations, restrictions under Maryland law and our financial condition. See Item 1A, “Risk Factors,” and Item 7, “Management’s Discussion and Analysis of Financial Conditions and Results of Operations,” including “Liquidity and Capital Resources,” of this Annual Report on Form 10-K, for information regarding the sources of funds used for dividends and for a discussion of factors, if any, which may adversely affect our ability to pay dividends in 2016 and thereafter.
35
Securities Authorized for Issuance under Equity Compensation Plans
The following table provides information as of December 31, 2015 with respect to shares of our common stock that may be issued under our equity compensation plans.
Plan Category | Number of securities to be issued upon exercise of outstanding stock awards | Weighted-average exercise price of outstanding stock awards | Number of securities remaining available for future issuance under equity compensation plans (excluding securities reflected in first column) | ||||||
Equity compensation plans approved by security holders | — | — | 243,329 | ||||||
Equity compensation plans not approved by security holders | — | — | — | ||||||
Total | — | — | 243,329 | ||||||
Unregistered Sales of Equity Securities
None.
Purchases of Equity Securities by the Issuer and Affiliated Purchasers
On July 1, 2013, our board of directors authorized a share repurchase program, which allowed us to repurchase up to 2,500,000 shares of our common stock. On November 25, 2014, our board of directors authorized an increase of 2,500,000 shares to the previously authorized share repurchase program for a total of 5,000,000 shares. Following is repurchase activity for the fourth quarter of 2015:
Period | Total Number of Shares Purchased | Average Price Paid Per Share | Total Number of Shares Purchased as Part of Publicly Announced Plans or Programs | Maximum Number of Shares That May Yet be Purchased Under the Plans or Programs | |||||||||
October 1, 2015 — October 31, 2015 (1) | 283 | $ | 16.54 | — | 1,566,676 | ||||||||
November 1, 2015 — November 30, 2015 | — | — | — | 1,566,676 | |||||||||
December 1, 2015 — December 31, 2015 (1) | 6,490 | 15.71 | — | 1,566,676 | |||||||||
Total | 6,773 | $ | 15.74 | — | 1,566,676 | ||||||||
_______________
(1) | Consists of shares withheld to settle tax withholding obligations related to the vesting of restricted stock awards. |
36
Performance Graph
The following graph compares the stockholders’ cumulative total return, assuming $100 invested at December 14, 2012 (the first day of trading), with all reinvestment of dividends, as if such amounts had been invested in: (i) our common stock; (ii) the stocks included in the Standard and Poor’s 500 Stock Index (“S&P 500”); and (iii) the stocks included in the MSCI US REIT Index.
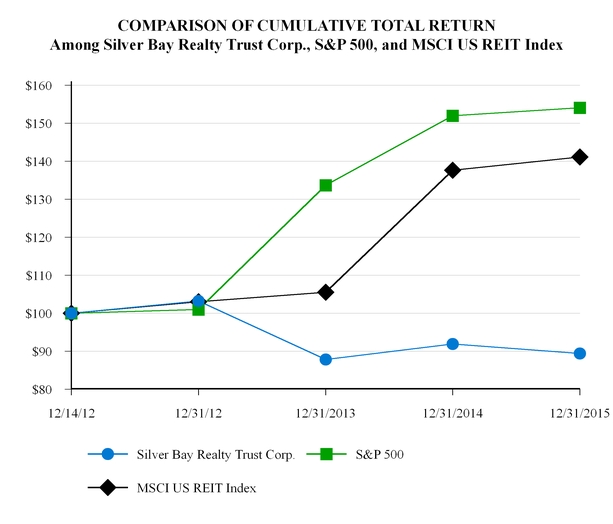
Period Ending | ||||||||||||||||||||
Index | 12/14/2012 | 12/31/2012 | 12/31/2013 | 12/31/2014 | 12/31/2015 | |||||||||||||||
Silver Bay Realty Trust Corp. | $ | 100.00 | $ | 103.23 | $ | 87.87 | $ | 91.89 | $ | 89.42 | ||||||||||
S&P 500 | $ | 100.00 | $ | 100.97 | $ | 133.67 | $ | 151.97 | $ | 154.07 | ||||||||||
MSCI US REIT Index | $ | 100.00 | $ | 103.02 | $ | 105.56 | $ | 137.64 | $ | 141.10 | ||||||||||
37
Item 6. Selected Financial Data.
Our selected financial data set forth below should be read in conjunction with our consolidated financial statements and the accompanying notes included under Item 8 of this Annual Report on Form 10-K.
At or for the Year Ended December 31, | ||||||||||||||||
(in thousands, except per share and property count data) | 2015 | 2014 (1) | 2013 | 2012 (2) | ||||||||||||
Consolidated Statements of Operations and Comprehensive Loss Data: | ||||||||||||||||
Total Revenue | $ | 113,694 | $ | 77,930 | $ | 49,593 | $ | 3,616 | ||||||||
Expenses: | ||||||||||||||||
Property operating and maintenance | 22,106 | 17,274 | 12,472 | 1,868 | ||||||||||||
Real estate taxes | 15,847 | 11,042 | 6,893 | 1,273 | ||||||||||||
Homeowners’ association fees | 1,912 | 1,260 | 1,129 | 391 | ||||||||||||
Property management | 11,093 | 9,401 | 11,683 | 459 | ||||||||||||
Depreciation and amortization | 35,189 | 25,623 | 20,235 | 2,106 | ||||||||||||
Advisory management fee - affiliates | — | 6,621 | 9,775 | 2,159 | ||||||||||||
Management internalization | — | 39,373 | — | — | ||||||||||||
Portfolio acquisition expense | 2,064 | — | — | — | ||||||||||||
General and administrative | 15,915 | 10,334 | 6,834 | 843 | ||||||||||||
Share-based compensation | 2,613 | 1,022 | 927 | 38 | ||||||||||||
Interest expense | 21,275 | 11,586 | 2,911 | — | ||||||||||||
Total expenses | 128,014 | 133,536 | 72,859 | 9,137 | ||||||||||||
Loss before other income (expense) and income taxes | (14,320 | ) | (55,606 | ) | (23,266 | ) | (5,521 | ) | ||||||||
Other income (expense) | 3,610 | (1,091 | ) | (1,284 | ) | — | ||||||||||
Income tax benefit, net | 758 | — | — | — | ||||||||||||
Net loss | $ | (9,952 | ) | $ | (56,697 | ) | $ | (24,550 | ) | $ | (5,521 | ) | ||||
Per Common Share and Share Information: | ||||||||||||||||
Net loss attributable to common shares - basic and diluted (3) | $ | (0.26 | ) | $ | (1.49 | ) | $ | (0.63 | ) | $ | (0.04 | ) | ||||
Weighted average common shares outstanding | 36,209,999 | 38,119,971 | 39,073,994 | 37,328,213 | ||||||||||||
Dividends declared per common share | $ | 0.46 | $ | 0.16 | $ | 0.04 | $ | — | ||||||||
Balance Sheet Data: | ||||||||||||||||
Investments in real estate, net | $ | 1,134,777 | $ | 905,220 | $ | 757,407 | $ | 418,693 | ||||||||
Cash | 29,028 | 49,854 | 43,717 | 228,139 | ||||||||||||
Escrow deposits | 15,472 | 20,211 | 24,461 | 19,727 | ||||||||||||
Total assets | 1,224,419 | 1,002,380 | 846,078 | 677,302 | ||||||||||||
Securitization loan | 303,880 | 310,665 | — | — | ||||||||||||
Revolving credit facility | 326,472 | 67,096 | 164,825 | — | ||||||||||||
Total liabilities | 661,566 | 400,485 | 187,118 | 16,889 | ||||||||||||
10% cumulative redeemable preferred stock | 1,000 | 1,000 | 1,000 | 1,000 | ||||||||||||
Total equity | 561,853 | 600,895 | 657,960 | 659,413 | ||||||||||||
38
At or for the Year Ended December 31, | ||||||||||||||||
(in thousands, except per share and property count data) | 2015 | 2014 (1) | 2013 | 2012 (2) | ||||||||||||
Other Data: | ||||||||||||||||
Non-GAAP Financial Measures: | ||||||||||||||||
Net operating income ("NOI") (4) | $ | 62,905 | $ | 39,709 | $ | 19,872 | $ | (365 | ) | |||||||
NOI as a percentage of total revenue | 55 | % | 51 | % | 40 | % | (10 | )% | ||||||||
Funds from operations ("FFO") (5) | 21,003 | (30,517 | ) | (3,637 | ) | (3,415 | ) | |||||||||
Core FFO (5) | 25,405 | 13,565 | (905 | ) | (3,377 | ) | ||||||||||
FFO per share | 0.54 | (0.79 | ) | (0.10 | ) | (0.09 | ) | |||||||||
Core FFO per share | 0.66 | 0.35 | (0.03 | ) | (0.09 | ) | ||||||||||
Weighted average common shares and units outstanding | 38,441,510 | 38,688,548 | 39,101,378 | 37,355,672 | ||||||||||||
Aggregate Portfolio Data: | ||||||||||||||||
Total properties owned(6) | 9,022 | 6,779 | 5,642 | 3,405 | ||||||||||||
Leased properties | 8,645 | 5,812 | 4,973 | 1,705 | ||||||||||||
Aggregate occupancy percentage | 96 | % | 86 | % | 88 | % | 50 | % | ||||||||
Average monthly rent per leased property | $ | 1,167 | $ | 1,194 | $ | 1,160 | $ | 1,148 | ||||||||
Stabilized Property Data (7): | ||||||||||||||||
Stabilized properties owned | 9,020 | 6,214 | 5,365 | 1,815 | ||||||||||||
Occupancy percentage | 96 | % | 94 | % | 93 | % | 94 | % | ||||||||
_______________
(1) | On September 30, 2014, we closed the Internalization. Following such transaction, we no longer incur advisory management fees to our Former Manager and now incur certain expenses, classified as general and administrative, which were previously borne by our Former Manager for the compensation of our Chief Executive Officer and personnel providing data analytics directly supporting the investment function and certain other costs. |
(2) | Our 2012 consolidated financial results include the results of our Predecessor since it commenced formal operations and the results of the Provident Entities since December 19, 2012, the date we acquired those entities. As a consequence, our financial results for 2012 are not indicative of future performance as they largely reflect the operations of our Predecessor, which began formal operations in February 2012 when it began acquiring single-family properties, and includes only 12 days of results for the more stabilized portfolio of the Provident entities. |
(3) | We calculated the 2012 loss per share only for the period our common stock was outstanding during the year, referred to as the post-formation period. Prior to our initial public offering and Formation Transactions, we did not have any publicly issued common stock. The Formation Transactions closed on December 19, 2012, therefore we have defined the post-formation period to be the date of the Formation Transactions through December 31, 2012, or 12 days of activity. |
(4) | We define NOI as total revenue less property operating and maintenance, real estate taxes, homeowners’ association fees, and property management expenses. NOI excludes depreciation and amortization, the former advisory management fees, management internalization, portfolio acquisition expense, general and administrative expenses, share-based compensation, interest expense, net gain on disposition of real estate, ineffectiveness of interest rate cap agreements, income tax benefit, net and other non-comparable items as applicable. Additionally, NOI excludes certain property management add backs, such as the former 5% property management fee payable prior to the Internalization because it more closely represents additional advisory management fee, expensed acquisition fees and costs, and certain other property management costs. |
NOI is a non-GAAP financial measure that we consider to be meaningful when considered with the financial statements determined in accordance with GAAP. We believe NOI is helpful to investors in understanding the core performance of our real estate operations. NOI should not be considered an alternative to net loss or net cash flows from operating activities, as determined in accordance with GAAP, as indications of our performance or as measures of liquidity. Although we use this non-GAAP measure for comparability in assessing our performance against other REITs, not all REITs compute this non-GAAP measure in the same manner. Accordingly, there can be no assurance that our basis for computing this non-GAAP measure is comparable with that of other REITs.
A reconciliation of NOI to net loss as determined in accordance with GAAP is located in Item 7, “Management’s Discussion and Analysis of Financial Condition and Results of Operations - Net Operating Income,” in this Annual Report on Form 10-K.
(5) | FFO is a non-GAAP financial measure that we believe, when considered with the financial statements determined in accordance with GAAP, is helpful to investors in understanding our performance because it captures features particular to real estate |
39
performance by recognizing that real estate generally appreciates over time or maintains residual value to a much greater extent than do other depreciable assets. The National Association of Real Estate Investment Trusts ("NAREIT") defines FFO as net income (loss), computed in accordance with GAAP, excluding gains or losses from sales of, and impairment losses recognized with respect to, depreciable property, plus depreciation and amortization, and after adjustments for unconsolidated partnerships and joint ventures. Adjustments for unconsolidated partnerships and joint ventures are calculated on the same basis to determine FFO.
Core FFO is a non-GAAP financial measure that we use as a supplemental measure of our performance. We believe that Core FFO is further helpful to investors as it provides a more consistent measurement of our performance across reporting periods by removing the impact of certain items that are not comparable from period to period. We adjust FFO for expensed acquisition fees and costs, including those associated with the Portfolio Acquisition, certain fees and expenses related to our Securitization Transaction, share-based compensation, costs associated with the Internalization, write-offs of expenses associated with changes in our debt structure, income tax (benefit) on the disposition of real estate and certain other non-cash or non-comparable costs to arrive at Core FFO.
FFO and Core FFO should not be considered alternatives to net income (loss) or net cash flows from operating activities, as determined in accordance with GAAP, as indications of our performance or as measures of liquidity. These non-GAAP measures are not necessarily indicative of cash available to fund future cash needs. In addition, although we use these non-GAAP measures for comparability in assessing our performance against other REITs, not all REITs compute these non-GAAP measures in the same manner. Accordingly, there can be no assurance that our basis for computing these non-GAAP measures is comparable with that of other REITs. This is due in part to the differences in capitalization policies used by different companies and the significant effect these capitalization policies have on FFO and Core FFO. Real estate costs which are accounted for as capital improvements are added to the carrying value of the property and depreciated over time, whereas real estate costs that are expenses are accounted for as a current period expense. This affects FFO and Core FFO because costs that are accounted for as expenses reduce FFO and Core FFO. Conversely, real estate costs associated with assets that are capitalized and then subsequently depreciated are excluded from the calculation of FFO and Core FFO.
FFO and Core FFO are calculated on a gross basis and as such, do not reflect adjustments for the noncontrolling interests - Operating Partnership.
A reconciliation of FFO and Core FFO to net loss as determined in accordance with GAAP is located in Item 7, “Management’s Discussion and Analysis of Financial Condition and Results of Operations - Funds From Operations and Core Funds From Operations,” in this Annual Report on Form 10-K.
(6) | Excludes properties reflected as assets held for sale on our consolidated balance sheets and any properties previously acquired in purchases that have been subsequently rescinded or vacated. |
(7) | We consider a property stabilized at the earlier of (i) its first authorized occupancy or (ii) 90 days after the renovations for such property are complete regardless of whether the property is leased. Properties acquired with in-place leases are considered stabilized even though such properties may require future renovation to meet our standards and may have existing residents who would not otherwise meet our resident screening requirements. |
40
Item 7. Management’s Discussion and Analysis of Financial Condition and Results of Operations.
The following discussion should be read in conjunction with the financial statements and related notes appearing elsewhere in this Annual Report on Form 10-K. This report, including the following Management’s Discussion and Analysis of Financial Condition and Results of Operations, contains forward-looking statements regarding future events or trends that should be read in conjunction with the factors described under “Special Note Regarding Forward-Looking Statements” included in this report. In addition, our actual results could differ materially from those projected in such forward-looking statements as a result of the factors discussed under “Special Note Regarding Forward-Looking Statements” as well as the risk factors described in Item 1A, “Risk Factors,” of this report.
Overview
We are an internally-managed Maryland corporation that focuses on the acquisition, renovation, leasing, and management of single-family properties in select markets in the United States. Our objective is to generate attractive risk-adjusted returns for our stockholders over the long term through dividends and capital appreciation. We generate virtually all of our revenue by leasing our portfolio of single-family properties. As of December 31, 2015, we owned 9,022 single-family properties for rental purposes in Arizona, California, Florida, Georgia, Nevada, North Carolina, Ohio, South Carolina and Texas, excluding properties reflected as assets held for sale on our consolidated balance sheets.
We have elected to be treated as a real estate investment trust ("REIT") for U.S. federal tax purposes, commencing with, and in connection with the filing of our federal tax return for, our taxable year ended December 31, 2012. As a REIT, we generally are not subject to federal income tax on the taxable income that we distribute to our stockholders. If we fail to qualify as a REIT in any taxable year, we will be subject to federal income tax at regular corporate rates. Even if we continue to qualify for taxation as a REIT, we may be subject to some federal, state and local taxes on our income or property. In addition, the income of our taxable REIT subsidiaries ("TRSs") is subject to taxation at regular corporate rates.
Silver Bay Realty Trust Corp. was incorporated in Maryland in June 2012. Silver Bay Realty Trust Corp. conducts its business and owns all of its properties through Silver Bay Operating Partnership L.P. (the "Operating Partnership"), a Delaware limited partnership. Silver Bay Realty Trust Corp.’s wholly owned subsidiary, Silver Bay Management LLC (the "General Partner") is the sole general partner of the Operating Partnership. Silver Bay Realty Trust Corp. has no material assets or liabilities other than its investment in the Operating Partnership. As of December 31, 2015, Silver Bay Realty Trust Corp. owned, through a combination of direct and indirect interests, 94.2% of the partnership interests in the Operating Partnership. Except as otherwise required by the context, references to the “Company,” “Silver Bay,” “we,” “us” and “our” refer collectively to Silver Bay Realty Trust Corp., the Operating Partnership and the direct and indirect subsidiaries of each.
Through September 30, 2014, we were externally managed by PRCM Real Estate Advisers LLC (our "Former Manager"). During this time, we relied on our Former Manager to provide or obtain on our behalf the personnel and services necessary for us to conduct our business as we had no employees of our own. On September 30, 2014, we closed a transaction to internalize our management (the "Internalization") and now own all material assets and intellectual property rights of our Former Manager previously used in the conduct of its business. In connection with the Internalization, the officers and employees who worked for our Former Manager became our employees.
Management Internalization Transaction
On September 30, 2014, we closed the Internalization after receiving the required stockholder approval for the transaction. The Internalization was completed under the terms of a contribution agreement (the “Contribution Agreement”) among Silver Bay, Pine River Domestic Management L.P. ("Pine River"), Provident Real Estate Advisors LLC ("Provident"), our Former Manager, and the Operating Partnership, pursuant to which we acquired our Former Manager in exchange for 2,231,511 common units of the Operating Partnership. These common units are redeemable for cash or, at our election, a number of our common shares on a one-for-one basis. We incurred $39.4 million of expenses during 2014 in connection with the Internalization. These costs primarily relate to the issuance of common units at $36.2 million, and to a lesser extent, certain transaction fees and expenses and the assumption of certain liabilities in connection with the transaction.
The Contribution Agreement included a net worth adjustment, payable in cash, in the event that the closing net worth of our Former Manager was greater or less than $0 after making an adjustment to exclude any liabilities for accrued bonus compensation payable to our Chief Executive Officer and personnel providing data analytics directly supporting our investment function. We settled this net worth adjustment on September 30, 2014 based upon estimated amounts. The net worth adjustment was finalized in the fourth quarter of 2014 and the settlement was de minimis.
41
Our Former Manager received management fees and expense reimbursement under the advisory management agreement and property management and acquisition services agreement through September 30, 2014. As a result of this transaction, as of September 30, 2014, we no longer pay fees or expense reimbursements to our Former Manager or our Former Manager's operating subsidiary.
Acquisition of The American Home Real Estate Investment Trust, Inc. Portfolio
During the year ended December 31, 2015, we acquired a portfolio of 2,461 properties (the "Acquired Properties") from The American Home Real Estate Investment Trust, Inc. ("TAH"). The acquisition was substantially completed on April 1, 2015 (the "Portfolio Acquisition"). The aggregate purchase price for the Portfolio Acquisition was $263.0 million. The Portfolio Acquisition was financed using proceeds obtained under our revolving credit facility, which was amended and restated on February 18, 2015 to increase the borrowing capacity to $400.0 million from $200.0 million. The homes are primarily located in Atlanta, Charlotte, Tampa and Orlando. The Acquired Properties were substantially leased as of the acquisition date with aggregate occupancy of approximately 93% and average existing rents of approximately $960 per month on April 1, 2015.
Highlights of 2015
• | We expanded our portfolio by 2,243 properties, increasing our gross investment in real estate by $261.3 million to $1.2 billion. |
• | We acquired 2,461 properties from TAH in the Portfolio Acquisition for $263.0 million. |
• | We sold 230 single-family homes, of which 122 were located in Houston and 42 were located in Southern California, for total gross proceeds of $29.2 million. Net gain on sales totaled $4.0 million during the year ended December 31, 2015, excluding the net gain on homes acquired in the Portfolio Acquisition whose gain will be re-assigned to the purchase price within one year of the acquisition. |
• | Aggregate occupancy as of December 31, 2015 was 95.8% as compared to 85.7% as of December 31, 2014. |
• | Net loss for 2015 was $10.0 million, or $(0.26) per share compared to a net loss for 2014 of $56.7 million, or $(1.49) per share. |
• | We grew Net Operating Income ("NOI") from $39.7 million, or 51.0% of revenue in 2014, to $62.9 million, or 55.3% of revenue in 2015. |
• | We grew Funds From Operations ("FFO") from $(30.5) million, or $(0.79) per share in 2014, to $21.0 million, or $0.54 per share in 2015. Core Funds From Operations ("Core FFO") increased from $13.6 million, or $0.35 per share in 2014, to $25.4 million, or $0.66 per share in 2015. |
• | We internalized certain third-party property managers, resulting in the growth of our internal property management platform, as a percentage of all properties owned, from 72.5% at December 31, 2014 to 94.5% at December 31, 2015. |
• | We grew the annual dividend on our common stock nearly three-fold from $0.16 per share declared in 2014 to $0.46 per share declared in 2015. |
42
Property Portfolio
Our investments in real estate consist of single-family properties located in select markets. As of December 31, 2015, we owned 9,022 single-family properties in the following markets:
Market | Number of Properties (1) | Aggregate Cost Basis (2)(thousands) | Average Cost Basis Per Property (thousands) | Average Age (in years) (3) | Average Square Footage | ||||||||||||
Atlanta | 2,723 | $ | 316,287 | $ | 116 | 22.0 | 1,799 | ||||||||||
Phoenix | 1,424 | 202,811 | 142 | 27.2 | 1,636 | ||||||||||||
Tampa | 1,113 | 159,426 | 143 | 27.6 | 1,623 | ||||||||||||
Charlotte (4) | 686 | 84,597 | 123 | 15.7 | 1,644 | ||||||||||||
Dallas | 504 | 67,648 | 134 | 24.0 | 1,618 | ||||||||||||
Orlando | 496 | 66,122 | 133 | 28.6 | 1,498 | ||||||||||||
Jacksonville | 452 | 59,652 | 132 | 27.4 | 1,537 | ||||||||||||
Southeast FL (5) | 384 | 76,589 | 199 | 44.6 | 1,494 | ||||||||||||
Northern CA (6) | 382 | 72,662 | 190 | 47.4 | 1,399 | ||||||||||||
Las Vegas | 290 | 41,270 | 142 | 19.7 | 1,717 | ||||||||||||
Columbus | 284 | 33,136 | 117 | 38.6 | 1,414 | ||||||||||||
Tucson | 209 | 17,485 | 84 | 43.0 | 1,330 | ||||||||||||
Southern CA (7) | 75 | 11,999 | 160 | 46.8 | 1,366 | ||||||||||||
Totals | 9,022 | $ | 1,209,684 | $ | 134 | 27.0 | 1,641 | ||||||||||
_______________
(1) | Total properties exclude properties reflected as assets held for sale on our consolidated balance sheets and any properties previously acquired in purchases that have been subsequently rescinded or vacated. |
(2) | Aggregate cost basis includes all capitalized costs, determined in accordance with U.S. generally accepted accounting principles ("GAAP"), incurred through December 31, 2015 for the acquisition, stabilization, and significant post-stabilization renovation of properties, including land, building, possession costs and renovation costs. Aggregate cost basis includes $14.7 million in capital improvements, incurred from our formation through December 31, 2015, made to properties that had been previously renovated, but does not include accumulated depreciation. |
(3) | As of December 31, 2015, approximately 4% of our properties were less than 10 years old, 38% were between 10 and 20 years old, 19% were between 20 and 30 years old, 19% were between 30 and 40 years old, 10% were between 40 and 50 years old, and 10% were more than 50 years old. Average age is an annual calculation. |
(4) | Charlotte market includes properties in South Carolina due to its proximity to Charlotte, North Carolina. |
(5) | Southeast Florida market currently consists of Miami-Dade, Broward and Palm Beach counties. |
(6) | Northern California market currently consists of Contra Costa, Napa and Solano counties. |
(7) | Southern California market currently consists of Riverside and San Bernardino counties. |
Factors likely to affect Silver Bay Results of Operations
Our results of operations and financial condition will be affected by numerous factors, many of which are beyond our control. Some of the key factors we expect to impact our results of operations and financial condition include our pace and costs of acquisitions, the time and costs required to stabilize a newly-acquired property and convert the same to rental use, the age of our properties, rental rates, the varying costs of internal and external property management, seasonality, occupancy levels, rates of resident turnover, home price appreciation, changes in homeownership rates, changes in homeowners’ association fees and real estate taxes, changes in insurance costs, expenses incurred in the maintenance and turnover of our properties, resident defaults, our expense ratios and our capital structure. Certain of these factors are described in greater detail below.
Acquisitions
We acquired 2,551 properties in 2015, primarily as a result of the Portfolio Acquisition.
43
The following is a summary of our acquisition activity by quarter for the year ended December 31, 2015:
Quarter Ended, | Acquired properties (1) | ||
March 31, 2015 | 85 | ||
June 30, 2015 | 2,443 | ||
September 30, 2015 | 18 | ||
December 31, 2015 | 5 | ||
Total | 2,551 | ||
_______________
(1) | Other than the Portfolio Acquisition, our acquisitions in 2015 were sourced through brokers, which refers to a purchase of a single property directly from the owner, including "real estate owned" (REO), short sales, and properties listed on a multiple listing service. |
Although we continue to review potential acquisition opportunities from time to time, we do not currently expect to acquire new properties in the near term. If we were to resume acquiring new properties, our ability to identify and acquire single-family properties that meet our investment criteria will be affected by home prices in our markets, the inventory of properties available through our acquisition channels, competition for our target assets, and our capital available for investment. Acquisitions may be financed from various sources, including proceeds from the sale of equity securities, retained cash flow, debt financings, securitizations, or the issuance of common units in the Operating Partnership. Availability of financing from such sources on acceptable terms will greatly impact our pace of acquisitions, as will any preference we may then have for portfolio acquisitions, which are inherently less predictable than purchases through other channels.
Stabilization, Renovation, and Leasing
Before an acquired property becomes an income producing asset, we must possess, renovate, market, and lease the property. We refer to this process as property stabilization. We consider a property stabilized at the earlier of (i) its first authorized occupancy or (ii) 90 days after the renovations for such property are complete regardless of whether the property is leased. Properties acquired with in-place leases are considered stabilized even though such properties may require future renovation to meet our standards and may have existing residents who would not otherwise meet our resident screening requirements. The time to stabilize a newly acquired property can vary significantly among properties for several reasons, including the property's acquisition channel, the age and condition of the property, whether the property was vacant when acquired, local demand for properties, our marketing techniques, and the size of our available inventory of rent ready properties.
44
The following table summarizes the leasing status of our properties as of December 31, 2015:
Market | Number of Properties | Number of Stabilized Properties | Properties Leased | Properties Vacant | Aggregate Portfolio Occupancy Rate | Stabilized Occupancy Rate | Average Monthly Rent (1) | Average Remaining Lease Term (Months) (2) | ||||||||||||||||
Atlanta | 2,723 | 2,723 | 2,629 | 94 | 96.5 | % | 96.5 | % | $ | 1,060 | 7.7 | |||||||||||||
Phoenix | 1,424 | 1,424 | 1,347 | 77 | 94.6 | % | 94.6 | % | 1,102 | 6.5 | ||||||||||||||
Tampa | 1,113 | 1,113 | 1,062 | 51 | 95.4 | % | 95.4 | % | 1,298 | 7.8 | ||||||||||||||
Charlotte | 686 | 685 | 658 | 28 | 95.9 | % | 96.1 | % | 1,063 | 6.8 | ||||||||||||||
Dallas | 504 | 504 | 481 | 23 | 95.4 | % | 95.4 | % | 1,297 | 6.8 | ||||||||||||||
Orlando | 496 | 496 | 481 | 15 | 97.0 | % | 97.0 | % | 1,155 | 5.9 | ||||||||||||||
Jacksonville | 452 | 452 | 436 | 16 | 96.5 | % | 96.5 | % | 1,133 | 7.1 | ||||||||||||||
Southeast FL | 384 | 383 | 356 | 28 | 92.7 | % | 93.0 | % | 1,650 | 5.4 | ||||||||||||||
Northern CA | 382 | 382 | 372 | 10 | 97.4 | % | 97.4 | % | 1,609 | 6.9 | ||||||||||||||
Las Vegas | 290 | 290 | 285 | 5 | 98.3 | % | 98.3 | % | 1,189 | 7.0 | ||||||||||||||
Columbus | 284 | 284 | 276 | 8 | 97.2 | % | 97.2 | % | 1,072 | 7.6 | ||||||||||||||
Tucson | 209 | 209 | 200 | 9 | 95.7 | % | 95.7 | % | 844 | 5.2 | ||||||||||||||
Southern CA | 75 | 75 | 62 | 13 | 82.7 | % | 82.7 | % | 1,225 | 3.2 | ||||||||||||||
Totals | 9,022 | 9,020 | 8,645 | 377 | 95.8 | % | 95.8 | % | $ | 1,167 | 7.0 | |||||||||||||
_______________
(1) | Average monthly rent for leased properties was calculated as the average of the contracted monthly rent for all leased properties as of December 31, 2015 and reflects rent concessions amortized over the life of the related lease. |
(2) | Average remaining lease term assumes a remaining term of 30 days for leases in month-to-month status. |
Aggregate portfolio occupancy increased to 95.8% as of December 31, 2015 as compared to 85.7% as of December 31, 2014, primarily as a result of stabilization activity in all our markets in addition to the Portfolio Acquisition being substantially leased as of the date of the acquisition.
In the quarter ended December 31, 2015, 596 properties turned over. This turnover number includes move-outs, evictions and lease breaks on our stabilized portfolio but excludes evictions of unauthorized residents at time of acquisition. Quarterly turnover for the three months ended December 31, 2015 was 6.6%. Quarterly turnover represents the number of properties turned over in the period divided by the number of properties in stabilized status at period-end (i.e. 9,020 properties as of December 31, 2015). The total number of properties with lease expirations in the three months ended December 31, 2015 was 1,885, including properties with month-to-month occupancy in the period. Of these properties, 372 properties turned over (an 80.3% retention rate for these properties).
The following is a summary of our turnover percentage by quarter for the years ended December 31, 2015 and 2014:
Quarter | Turnover (1) | |||||
2015 | 2014 | |||||
First | 5.8 | % | 6.6 | % | ||
Second | 7.0 | % | 8.1 | % | ||
Third | 8.2 | % | 8.9 | % | ||
Fourth | 6.6 | % | 6.6 | % | ||
Total | 27.6 | % | 30.2 | % | ||
_______________
(1) | Quarterly turnover percentage represents the number of properties turned over in each respective period divided by the number of properties in stabilized status as of each respective period-end. |
45
Results of Operations
The following are our results of operations for the years ended December 31, 2015, 2014, and 2013:
Income Statement Data | Year Ended December 31, | ||||||||||||||||||
(amounts in thousands) | 2015 | % of Revenue | 2014 | % of Revenue | 2013 | % of Revenue | |||||||||||||
Revenue: | |||||||||||||||||||
Total revenue | $ | 113,694 | 100.0 | % | $ | 77,930 | 100.0 | % | $ | 49,593 | 100.0 | % | |||||||
Expenses: | |||||||||||||||||||
Property operating and maintenance | 22,106 | 19.4 | % | 17,274 | 22.2 | % | 12,472 | 25.1 | % | ||||||||||
Real estate taxes | 15,847 | 13.9 | % | 11,042 | 14.2 | % | 6,893 | 13.9 | % | ||||||||||
Homeowners’ association fees | 1,912 | 1.7 | % | 1,260 | 1.6 | % | 1,129 | 2.3 | % | ||||||||||
Property management | 11,093 | 9.8 | % | 9,401 | 12.1 | % | 11,683 | 23.6 | % | ||||||||||
Depreciation and amortization | 35,189 | 31.0 | % | 25,623 | 32.9 | % | 20,235 | 40.8 | % | ||||||||||
Advisory management fee - affiliates | — | — | % | 6,621 | 8.5 | % | 9,775 | 19.7 | % | ||||||||||
Management internalization | — | — | % | 39,373 | 50.5 | % | — | — | % | ||||||||||
Portfolio acquisition expense | 2,064 | 1.8 | % | — | — | % | — | — | % | ||||||||||
General and administrative | 15,915 | 14.0 | % | 10,334 | 13.3 | % | 6,834 | 13.8 | % | ||||||||||
Share-based compensation | 2,613 | 2.3 | % | 1,022 | 1.3 | % | 927 | 1.9 | % | ||||||||||
Interest expense | 21,275 | 18.7 | % | 11,586 | 14.9 | % | 2,911 | 5.9 | % | ||||||||||
Total expenses | 128,014 | 133,536 | 72,859 | ||||||||||||||||
Loss before other income (expense) and income taxes | (14,320 | ) | (55,606 | ) | (23,266 | ) | |||||||||||||
Total other income (expense) | 3,610 | 3.2 | % | (1,091 | ) | (1.4 | )% | (1,284 | ) | (2.6 | )% | ||||||||
Income tax benefit, net | 758 | 0.7 | % | — | — | % | — | — | % | ||||||||||
Net loss | $ | (9,952 | ) | $ | (56,697 | ) | $ | (24,550 | ) | ||||||||||
Comparison of the Year Ended December 31, 2015 and the Year Ended December 31, 2014
Revenue
We earn revenue primarily from rents collected from residents under lease agreements for our single-family properties. These include short-term leases that we enter into directly with our residents, which generally have a term of one year. The most important drivers of revenue (aside from portfolio growth) are rental and occupancy rates. Our revenue may be affected by macroeconomic, local and property level factors, including market conditions, seasonality, resident defaults or vacancies, timing of renovation activities and occupancy of properties and timing to re-lease vacant properties.
Total revenue increased $35.8 million, or 45.9%, in 2015 over the prior year. This increase was primarily related to the Portfolio Acquisition and our increased aggregate occupancy, which increased to 95.8% as of December 31, 2015 from 85.7% as of December 31, 2014. We owned 8,645 leased properties as of December 31, 2015 as compared to 5,812 as of December 31, 2014. We achieved an average monthly rent for leased properties in our portfolio of $1,167 as compared to $1,194 as of December 31, 2014, primarily as a result of changes to portfolio mix. Excluding the Portfolio Acquisition, our average monthly rent increased 3.1% over the prior year period due to increases achieved on renewal and new move in offset minimally by changes to portfolio mix.
46
Expenses
Property Operating and Maintenance. Property operating and maintenance increased $4.8 million, or 28.0%, in 2015 over the prior year. Included in property operating and maintenance are repairs and maintenance, expenses associated with resident turnover, property insurance, bad debt and utilities and landscape maintenance on market ready properties not leased. The increase in these expenses from the prior year was due primarily to increased turnover, repair and maintenance and bad debt expense which was generally due to the significant increase in the number of properties owned and in-service during the year ended December 31, 2015 as compared to the prior year period. As a percentage of revenue, property operating and maintenance declined 2.8 percentage points, primarily driven by improved turnover and insurance rates year-over-year.
Real Estate Taxes. Real estate taxes are expensed once a property is placed in service. Real estate taxes increased $4.8 million, or 43.5%, in 2015 over the prior year. The increase in real estate taxes was attributable to the significant increase in the number of properties owned and in-service in 2015 as compared to 2014 and to a lesser extent increased property tax assessments attributable to home price appreciation in certain markets. As a percentage of revenue, real estate taxes decreased slightly primarily due to mix with the Portfolio Acquisition offset in part by tax increases in certain markets that exceeded rent increases.
Property Management. As of December 31, 2015, we internally managed 94.5% of our portfolio, including all of our properties in Atlanta, Phoenix, Tampa, Charlotte, Dallas, Orlando, Jacksonville, Southeast Florida, Northern California, Columbus and Southern California. We used third-party property managers in Las Vegas and Tucson. Prior to the Internalization, rather than compensating our Former Manager’s operating subsidiary with commissions or fees based on rental income, we reimbursed all costs and expenses of our Former Manager’s operating subsidiary incurred on our behalf. In addition to these costs, we paid a property management fee to our Former Manager’s operating subsidiary equal to 5% of certain compensation and overhead costs incurred as a result of providing services to us, which reduced the advisory management fee paid to our Former Manager by the same amount. Following the Internalization, we incur all property management costs directly. Third-party property management arrangements include fees based on a percentage of rental income and other fees collected from our residents and, in some cases, fees for renovation oversight and leasing activities.
Property management increased $1.7 million, or 18.0%, in 2015 compared to the prior year. This increase related primarily to the significant increase in the number of properties owned in the year ended December 31, 2015 and the related increase in property management personnel offset by the reclassification of certain personnel-related costs post Internalization, the lack of system implementation costs, and the lack of the 5% property management fee beginning in the fourth quarter of 2014. Beginning in the fourth quarter of 2014, we began classifying certain personnel-related costs on a prospective basis that were previously classified as property management as general and administrative, due to changes in the management structure resulting from the Internalization. We incurred $2.0 million in such reclassified costs in the year ended December 31, 2014, which are now reflected as general and administrative. As a percentage of revenue, property management decreased 2.3 percentage points over the prior year period, primarily due to the reclassification noted above.
Depreciation and Amortization. Depreciation and amortization includes depreciation on real estate assets placed in-service and amortization of deferred lease fees and in-place leases. Depreciation and amortization increased $9.6 million, or 37.3%, in 2015 compared to the prior year, primarily as a result of the significant increase in the number of properties owned and in-service in 2015 compared to 2014.
Advisory Management Fee. Prior to the Internalization, we relied on our Former Manager to provide or obtain on our behalf the personnel and services necessary for us to conduct our business because we had no employees of our own. Under this previous arrangement, we paid our Former Manager a quarterly advisory management fee equal to 0.375% (a 1.5% annual rate) of our average fully diluted market capitalization during the preceding quarter, less the 5% property management fee paid to our Former Manager’s operating subsidiary. As a result of the Internalization, beginning in the fourth quarter of 2014, we ceased incurring the advisory management fee and, as described below, general and administrative expenses related to certain personnel expenses and certain other expenses previously borne by our Former Manager have increased. As a result, we incurred no advisory management fees in 2015 compared to $6.6 million in 2014.
Management Internalization. We did not incur any expenses during 2015 in connection with the Internalization as compared to $39.4 million during 2014. These costs primarily related to the issuance of 2,231,511 common units of the Operating Partnership at $36.2 million, and to a lesser extent, certain transaction fees and expenses and the assumption of certain liabilities in connection with the transaction.
Portfolio Acquisition Expense. We incurred $2.1 million of costs associated with the Portfolio Acquisition in the year ended December 31, 2015. We had no such costs for 2014.
47
General and Administrative. General and administrative include those costs related to being a public company, expense reimbursements under the advisory management agreement with our Former Manager through the date of Internalization on September 30, 2014, certain personnel costs we now incur directly following the Internalization and other expenses associated with our corporate and administrative functions. Under the advisory management agreement, we paid all costs and expenses of our Former Manager incurred in the operation of its business, other than the compensation of our Chief Executive Officer and personnel providing data analytics directly supporting the investment function. Beginning in the fourth quarter of 2014, general and administrative now includes these expenses previously borne by our Former Manager. General and administrative now also includes certain personnel and operational costs classified as property management prior to Internalization. These changes primarily caused the year over year increase in general and administrative expense of $5.6 million.
Share-Based Compensation. Share-based compensation expense includes costs associated with our restricted stock awards to our board of directors and certain employees and our performance stock unit awards to certain members of management.
Share-based compensation expense increased $1.6 million in 2015 compared to the prior year, due to awards made in February and May 2015, which are described in Note 6 of the consolidated financial statements included within this Annual Report on Form 10-K.
Interest Expense. Interest expense includes interest incurred on the outstanding balance of our debt, an unused line fee on the undrawn amount of the revolving credit facility, debt service costs, and amortization of deferred financing fees, net of certain amounts capitalized for properties undergoing renovation activities. Interest expense increased $9.7 million or 83.6%, in 2015 compared to the prior year. The change is primarily attributable to a higher average outstanding balance of debt and amortization of additional financing fees incurred in the securitization transaction and the credit facility upsize.
Total Other Income (Expense). Total other income (expense) consists of activities related to our sales of investments in real estate as well as loss on derivative financial instruments, net. Total other income (expense) was $3.6 million and $(1.1) million for the years ended December 31, 2015 and 2014, respectively. The increase in other income is primarily due to the net gain on disposition of real estate related to our Houston portfolio along with certain other properties, a decrease related to the ineffectiveness in interest rate cap agreements and a decrease in held for sale operating costs in 2015 as compared to 2014.
Income Tax Benefit, Net. We intend to operate and to be taxed as a REIT under the Internal Revenue Code of 1986, as amended (the "Code") and intend to comply with the requirements of the Code relating to REITs. We have TRSs where certain investments may be made and activities conducted that may have otherwise been subject to the prohibited transactions tax and may not be favorably treated for purposes of complying with the various requirements for REIT qualification. The income and losses within the TRSs are subject to federal, state, and local income taxes. Deferred tax assets and liabilities are recognized for future tax consequences attributable to differences between the financial statement carrying amounts of existing assets and liabilities and their respective tax basis.
We recognized a net income tax benefit of $0.8 million during the year ended December 31, 2015 which was primarily related to the reversal of a net deferred tax asset valuation allowance in 2015. Prior to 2015, our TRS had a history of losses and, as a result, had historically recognized a valuation allowance for net deferred tax assets. Each quarter, we evaluate the need to retain all or a portion of the valuation allowance on our net deferred tax assets. In the fourth quarter of 2015, we determined that it was more likely than not that the deferred tax assets, including any remaining net operating losses will be realized in certain TRS entities. In making this determination, we analyzed, among other things, our recent history of earnings, forecasts of future earnings from sales of depreciable property, and our cumulative earnings for the last year.
Comparison of the Year Ended December 31, 2014 and the Year Ended December 31, 2013
Revenue
Total revenue for 2014 increased $28.3 million or 57.1% over the prior year. This increase was due primarily to the increase in the number of properties leased and secondarily to an increase in average monthly rent at December 31, 2014, as compared to the prior year end. We owned 5,812 leased properties as of December 31, 2014 as compared to 4,973 as of December 31, 2013. We achieved an average monthly rent for leased properties in our portfolio of $1,194 as of December 31, 2014 as compared to $1,160 as of December 31, 2013.
48
Expenses
Property Operating and Maintenance. Property operating and maintenance increased $4.8 million, or 38.5%, in 2014 over the prior year. The increase in these expenses from the prior year was due primarily to increased turnover, repair and maintenance and property insurance costs. The increase in turnover costs was attributable to a higher aggregate number of turnovers experienced in our leased portfolio in 2014 resulting from the increased number of leased properties compared to 2013. The increase in repair and maintenance and property insurance costs was primarily attributable to the increase in the number of properties owned and in-service in 2014 as compared to the prior year and to a lesser extent to an increase in coverage of our property insurance required under our securitization loan.
Real Estate Taxes. Real estate taxes are expensed once a property is placed in service. Real estate taxes increased $4.1 million, or 60.2%, in 2014 over the prior year. The increase in real estate taxes was attributable to the significant increase in the number of properties owned and in-service in 2014 as compared to 2013, and increased property tax rates driven in part by appreciation of the values of our homes in certain markets.
Property Management. As of December 31, 2014, we internally managed 72.5% of our portfolio, including all of our properties in Phoenix, Atlanta, Southeast Florida, Columbus, Tampa, Southern California, Charlotte and Northern California. We used third-party property managers in our other markets.
Property management decreased $2.3 million, or 19.5%, in 2014 compared to the prior year, due to decreases in certain personnel-related costs and software implementation costs. Of this decrease, $675,000 was attributable to the classification of certain personnel-related costs as general and administrative, beginning in the fourth quarter of 2014, that had previously been classified as property management.
Depreciation and Amortization. Depreciation and amortization included depreciation on real estate assets placed in-service and amortization of deferred lease fees and in-place leases. Depreciation and amortization increased $5.4 million, or 26.6%, in 2014 compared to the prior year, primarily as a result of an increase in the number of properties being depreciated in 2014 compared to 2013. The sequential year increase was partially offset by a decrease in amortization of in-place leases, as the Provident in-place leases acquired in our Formation Transactions were substantially amortized as of December 31, 2013. Amortization expense for the Provident in-place leases was $29,000 and $2.0 million for 2014 and 2013, respectively.
Advisory Management Fee. Advisory management fees decreased $3.2 million, or 32.3%, in 2014 compared to 2013, primarily due to the Internalization at the end of the third quarter of 2014 (at which point we ceased incurring the advisory management fee), and secondarily due to a decrease in our average stock price and reduction in the average number of shares outstanding in 2014.
Management Internalization. We incurred $39.4 million of expenses during 2014 in connection with the Internalization. These costs primarily related to the issuance of 2,231,511 common units of the Operating Partnership at $36.2 million, and to a lesser extent, certain transaction fees and expenses and the assumption of certain liabilities in connection with the transaction.
General and Administrative. General and administrative increased $3.5 million, or 51.2%, in 2014 compared to the prior year, which was primarily attributable to increased personnel, a portion of which related to our payment of compensation previously borne by our Former Manager, non-capitalizable costs related to our securitization transaction for personnel and other matters, and a one-time expense of $775,000 incurred in the second quarter of 2014 to acquire our third-party property manager in the Tampa market.
Share-based Compensation. Share-based compensation expense increased $0.1 million, or 10.2%, in 2014 compared to the prior year, due to awards made in February and May 2014, which are described in Note 6 of the consolidated financial statements included within this Annual Report on Form 10-K.
Interest Expense. Interest expense included interest incurred on the outstanding balance of our debt, an unused line fee on the undrawn amount of the revolving credit facility, debt service costs, and amortization of deferred financing fees, net of certain amounts capitalized for properties undergoing renovation activities. Interest expense increased $8.7 million, in 2014 compared to the prior year, which was primarily attributable to a higher average outstanding balance of debt in 2014, as compared to 2013, and amortization of additional financing fees incurred in the securitization transaction. In addition, in the third quarter of 2014 we incurred certain charges associated with the commitment reduction and pay-down of our revolving credit facility, including a $1.1 million write-off of deferred financing fees.
49
Critical Accounting Policies
The preparation of financial statements in accordance with GAAP requires us to make certain judgments and assumptions, based on information available at the time of our preparation of the financial statements, in determining accounting estimates used in preparation of the statements. Our significant accounting policies are described below.
Accounting estimates are considered critical if the estimate requires us to make assumptions about matters that were highly uncertain at the time the accounting estimate was made and if different estimates reasonably could have been used in the reporting period or changes in the accounting estimate are reasonably likely to occur from period to period that would have a material impact on our financial condition, results of operations or cash flows.
Revenue Recognition
We lease our single-family properties under operating leases. The lease periods are generally short-term in nature (one or two years) and reflect market rental rates. Rental income, net of concessions and sales tax, is recognized on a straight-line basis over the term of the lease.
We periodically evaluate the collectability of our resident and other receivables and record an allowance for doubtful accounts for any estimated probable losses. This allowance is estimated based on payment history and probability of collection. We generally do not require collateral other than resident security deposits.
We recognize sales of real estate when the sale has closed, title has passed, adequate initial and continuing investment by the buyer is received, possession and other attributes of ownership have been transferred to the buyer, and we are not obligated to perform significant additional activities after closing. All these conditions are typically met at or shortly after closing.
Investments in Real Estate
Property acquisitions are evaluated to determine whether they meet the definition of a business combination or of an asset acquisition under GAAP. For asset acquisitions, we capitalize (1) pre-acquisition costs to the extent such costs would have been capitalized had we owned the asset when the cost was incurred, and (2) closing and other direct acquisition costs. We then allocate the total cost of the property including acquisition costs, between land and building based on their relative fair values, generally utilizing the relative allocation that was contained in the property tax assessment of the same or a similar property, adjusted as deemed necessary.
For acquisitions that do not qualify as an asset acquisition, we evaluate the acquisition to determine if it qualifies as a business combination. For acquired properties where we have determined that the property has a resident with an existing lease in place, we account for the acquisition as a business combination. For acquisitions that qualify as a business combination, we (1) expense the acquisition costs in the period in which the costs were incurred and (2) assign the cost of the property among land, building and in-place lease intangibles, if any, based on their fair value. The fair values of acquired in-place lease intangibles are based on costs to execute similar leases including commissions and other related costs. The origination value of in-place leases also includes an estimate of lost rent revenue at in-place rental rates during the estimated time required to lease up the property from vacant to the occupancy level at the date of acquisition. The in-place lease intangible is amortized over the life of the remaining lease.
If, at acquisition, a property needs to be renovated before it is ready for its intended use, we commence the necessary stabilization and renovation activities. During this stabilization period, we capitalize all direct and indirect costs incurred in renovating the property. If we acquire a property with an existing lease, we capitalize the cost of the initial renovation of such property following lease expiration and resident move out.
Once a property is ready for its intended use, expenditures for ordinary maintenance and repairs thereafter are expensed to operations as incurred, and we capitalize expenditures that improve or extend the life of a home.
We begin depreciating properties to be held and used when they are ready for their intended use. We compute depreciation using the straight-line method over the estimated useful lives of the respective assets. We depreciate buildings and building improvements over 27.5 years, and we depreciate other land improvements over periods ranging from three to 15 years, with no salvage value. Land is not depreciated.
50
Properties are classified as assets held for sale when they meet the applicable GAAP criteria, including that the property is being listed for sale and that it is ready to be sold in its current condition. Held-for-sale properties are reported at the lower of their carrying amount or estimated fair value less costs to sell.
Impairment of Real Estate
We evaluate our long-lived assets for impairment periodically or whenever events or changes in circumstances indicate that their carrying amount may not be recoverable. If an impairment indicator exists, we compare the expected future undiscounted cash flows against the net carrying amount of a property. Significant indicators of impairment may include declines in homes values, rental rate and occupancy and significant changes in the economy. We make our assessment at the individual property level because it represents the lowest level of identifiable cash flows. We prepare our future undiscounted cash flow analysis using estimates based on current rental rates, renewals and occupancy and using inputs from our annual long-range planning process and historical performance.
When preparing these estimates, we consider each property’s historical results, current operating trends, current market conditions, anticipated future capital expenditures and remaining useful life. These estimates may be impacted by variable factors including inflation, expected rental rates, the general health of the economy and market competition. If the sum of the estimated undiscounted cash flows is less than the net carrying amount of the property, we record an impairment loss for the difference between the estimated fair value of the individual property and the carrying amount of the property at that date. To determine the estimated fair value, we consider both recent comparable homes sales and the use of discounted projected future cash flows. The rates used to discount projected future cash flows reflect a weighted average cost of capital that a market participant would incur.
For long-lived assets to be disposed of, an impairment loss is recognized when the estimated fair value of the asset, less the estimated cost to sell, is less than the carrying amount of the asset at the time we have determined to sell the asset. Long-lived assets held for sale and their related liabilities are separately reported, with the long-lived assets reported at the lower of their carrying amount or their estimated fair value, less their costs to sell and any operations associated with the properties is reflected as discontinued operations. Assets held for sale are not depreciated nor are they included in our operating metrics at period end.
Income Taxes
We plan to operate in a manner that will allow us to qualify for taxation as a REIT, under the Code (the "Code") and intend to comply with the requirements of the Code related to REITs. As long as we qualify as a REIT, we do not generally expect to pay U.S. federal corporate level taxes. Many of the REIT requirements, however, are highly technical and complex. If we were to fail to meet the REIT requirements, we would be subject to U.S. federal, state and local income taxes on REIT taxable income. Refer to Note 4 of the consolidated financial statements for further description of our income taxes.
Our financial results are generally not expected to reflect provisions for current or deferred income taxes, except for those taxable benefits or provisions recognized by our TRSs. Deferred tax assets and liabilities are measured using enacted tax rates expected to apply to taxable income in the years in which these temporary differences are expected to be realized. A valuation allowance is provided if we believe it is more likely than not that all or some portion of our deferred tax assets will not be realized. Any increase or decrease in the valuation allowance that results from a change in circumstances, and that causes us to change judgment about the ability to realize the related deferred tax asset is included in the provision when such changes occur.
Derivative Instruments
We manage economic risks, including interest rate, liquidity, and credit risk, primarily by managing the amount, sources, and duration of our debt funding and the use of derivative financial instruments. Specifically, we enter into derivative financial instruments to manage exposures that arise from business activities that result in the receipt or payment of future known and uncertain cash amounts, the value of which are determined by interest rates. Our derivative financial instruments are used to manage differences in the amount, timing, and duration of our known or expected cash receipts and our known or expected cash payments principally related to our borrowings. We do not use these derivatives for speculative purposes, but instead they are used to manage our exposure to interest rate changes.
As required by the Financial Accounting Standards Board (“FASB”) Accounting Standards Codification (“ASC”) 815, Derivatives and Hedging, we record all derivatives in the consolidated balance sheet at fair value. The accounting for changes in the fair value of derivatives depends on the intended use of the derivative, whether we have elected to designate a derivative
51
in a hedging relationship and apply hedge accounting and whether the hedging relationship has satisfied the criteria necessary to apply hedge accounting. Derivatives designated and qualifying as a hedge of the exposure to changes in the fair value of an asset, liability, or firm commitment attributable to a particular risk, such as interest rate risk, are considered fair value hedges. Derivatives designated and qualifying as a hedge of the exposure to variability in expected future cash flows, or other types of forecasted transactions, are considered cash flow hedges. Hedge accounting generally provides for the matching of the timing of gain or loss recognition on the hedging instrument with the recognition of the changes in the fair value of the hedged asset or liability that are attributable to the hedged risk in a fair value hedge or the earnings effect of the hedged forecasted transactions in a cash flow hedge. We may enter into derivative contracts that are intended to economically hedge certain of our risk, even though hedge accounting does not apply or we elect not to apply hedge accounting. The effective portion of changes in the fair value of derivatives designated and that qualify as cash flow hedges is recorded in accumulated other comprehensive income and is subsequently reclassified into earnings in the period that the hedged forecasted transaction affects earnings.
Recent Accounting Pronouncements
Under the Jumpstart Our Business Startups Act (the "JOBS Act"), we meet the definition of an “emerging growth company.” We have irrevocably elected to opt out of the extended transition period for complying with new or revised accounting standards pursuant to Section 107(b) of the JOBS Act. As a result, we will comply with new or revised accounting standards on the relevant dates on which adoption of such standards is required for non-emerging growth companies.
We consider the applicability and impact of all accounting standard updates ("ASUs"). ASUs not listed below were assessed and determined to be either not applicable or are expected to have minimal impact on our consolidated financial position or results of operations.
In May 2014, the FASB issued ASU 2014-09, Revenue from Contracts with Customers, which creates a new Topic, Accounting Standards Codification Topic 606. The standard is principle-based and provides a five-step model to determine when and how revenue is recognized. The core principle is that a company should recognize revenue when it transfers promised goods or services to customers in an amount that reflects the consideration to which the company expects to be entitled in exchange for those goods or services. This standard is effective for interim or annual periods beginning after December 15, 2017 and allows for either full retrospective or modified retrospective adoption. Early adoption of this standard is only allowed as of the original effective date, annual periods beginning after December 15, 2016. We are currently evaluating the impact the adoption of Topic 606 will have on our consolidated financial statements.
In February 2015, the FASB issued ASU 2015-02, Amendments to the Consolidation Analysis. This update is intended to improve targeted areas of consolidation guidance by simplifying the consolidation evaluation process, and by placing more emphasis on risk of loss when determining a controlling financial interest. The provisions of this ASU are effective for interim and annual periods beginning after December 15, 2015. We are currently in the process of evaluating the impact of adoption of the ASU on our consolidated financial statements.
In April 2015, the FASB issued ASU 2015-03, Simplifying the Presentation of Debt Issuance Costs, which changes the presentation of debt issuance costs for term debt in financial statements. ASU 2015-03 requires an entity to present such costs in the balance sheet as a direct deduction from the related debt liability rather than as an asset. Amortization of the costs will continue to be reported as interest expense. ASU 2015-03 is effective for annual reporting periods beginning after December 15, 2015. Early adoption is permitted. The new guidance will be applied retrospectively to each prior period presented. The impact will be a reduction of other assets and the associated reported debt liability related to the securitization loan.
Liquidity and Capital Resources
Liquidity is a measure of our ability to meet potential cash requirements, fund and maintain our assets and operations, make interest payments and make distributions to our stockholders. Our liquidity, to a certain extent, is subject to general economic, financial, competitive and other factors that are beyond our control. Our near-term liquidity requirements consist primarily of maintaining properties, funding our operations, and making interest payments and distributions to our stockholders.
Our liquidity and capital resources as of December 31, 2015 consisted of cash of $29.0 million, escrow deposits of $15.5 million, including cash held in reserve at financial institutions as required by our debt agreements of $15.2 million, and $73.5 million available under our revolving credit facility.
We believe our cash flows from operations together with current cash and funds available under our revolving credit facility will be sufficient to fund the anticipated needs of our operations, including the renovation of certain properties in
52
2016. We may also opportunistically utilize the capital markets to raise additional capital, including through the issuance of debt and equity securities (including the issuance of common units in the Operating Partnership) and securitizations in the future, but there can be no assurance that we will be able to access adequate liquidity sources on favorable terms or at all.
Securitization Loan
On August 12, 2014, we completed a securitization transaction (the "Securitization Transaction") in which we received gross proceeds of $311.2 million, net of an original issue discount of $1.5 million and before issuance costs and reserves. The Securitization Transaction involved the issuance and sale of single-family rental pass-through certificates that represent beneficial ownership interests in a loan secured by 3,084 single-family properties (the "Securitization Properties") sold to one of our affiliates from our portfolio. In the Securitization Transaction, we sold approximately $312.7 million of certificates, with a blended effective interest rate of the London Interbank Offered Rate ("LIBOR") plus 1.92%, inclusive of the amortization of the original issue discount, plus monthly servicing fees of 0.1355% per tranche. The original issue discount will be accreted and recognized to interest expense through the fully extended maturity date of September 9, 2019.
As part of the Securitization Transaction, one of our subsidiaries (the "Borrower") entered into a loan agreement described below (the "Securitization Loan"). The Securitization Loan was subsequently deposited into a trust in exchange for the pass-through certificates. The pass-through certificates represent the entire beneficial interest in the trust and were sold in a private offering through the placement agents retained for the transaction. The certificates were offered and sold under Rule 144A and Regulation S under the Securities Act of 1933, as amended. During the year ended December 31, 2015, we paid down $7.1 million on the Securitization Loan to effect the release of certain properties from the first priority mortgages securing the Securitization Loan, primarily related to the sale of our Houston portfolio. As of December 31, 2015, the Securitization Loan was secured by 3,011 properties.
The Securitization Loan has an initial term of two years, with three, 12-month extension options, resulting in a fully extended maturity date of September 9, 2019, and bears interest at a blended effective interest rate of LIBOR plus 1.94%, plus monthly servicing fees of 0.1355%, payable monthly. The change in the blended effective interest rate at December 31, 2015 as compared to the date of issuance is as a result of the pay down noted above.
All amounts outstanding under the Securitization Loan are secured by first priority mortgages on the Securitization Properties in addition to the equity interests in, and certain assets of, the Borrower. The amounts outstanding under the Securitization Loan and certain obligations contained therein are guaranteed by the Operating Partnership only in the case of certain bad acts (including bankruptcy) as outlined in the transaction documents.
The Securitization Loan does not contractually restrict our ability to pay dividends but certain covenants contained therein may limit the amount of cash available for distribution. The Securitization Loan documents require us to maintain certain covenants, including a minimum debt yield on the Securitization Properties, and contain customary events of default for a facility of this type, including payment defaults, covenant defaults, breaches of representations and warranties, bankruptcy and insolvency, judgments, and cross-default with certain other indebtedness. We believe we were in compliance with all financial covenants under the Securitization Loan as of December 31, 2015.
We used proceeds of the Securitization Loan to pay down the full balance of our revolving credit facility at closing and the remaining proceeds were used for working capital and other corporate purposes, including the acquisition, financing and renovation of properties and the repurchase of common stock. Simultaneously, we reduced the size of our revolving credit facility from $350.0 million to $200.0 million (which has subsequently been amended as discussed below). As a result, we wrote off $1.1 million of deferred financing fees and reclassified $0.5 million from accumulated other comprehensive loss to ineffectiveness of interest rate cap agreements due to hedge ineffectiveness in the associated credit facility interest rate cap agreements during the third quarter of 2014.
Revolving Credit Facility
Certain of our subsidiaries have a revolving credit facility with a syndicate of banks. On February 18, 2015, we amended and restated the revolving credit facility to increase the borrowing capacity to $400.0 million from $200.0 million and subsequently amended the revolving credit facility to address certain interest calculation mechanics. As amended, the revolving credit facility bears interest at a varying rate of LIBOR plus 300 basis points with a LIBOR floor of 0.0%, payable monthly. Prior to the amendment, the revolving credit facility bore interest at a varying rate of LIBOR plus 3.5% subject to a LIBOR floor of 0.5%. We are also required to pay a monthly fee on the unused portion of the revolving credit facility at a rate of 0.5% per annum, when the balance outstanding is less than $200.0 million or 0.3% per annum when the balance outstanding is equal or greater than $200.0 million. As part of the amendment, the term on the revolving credit facility was extended to February 18,
53
2018 and the advance rate for borrowings was increased to 65% from 55%. The advance rate is based on the aggregate value of the eligible properties which value is calculated as the lesser of (a) the third-party broker price opinion value or (b) the original purchase price plus certain renovation and other capitalized costs of the properties. We used proceeds from the revolving credit facility to fund the Portfolio Acquisition. The remaining proceeds were used for working capital and other corporate purposes, including the acquisition, financing and renovation of properties. At December 31, 2015, there was $326.5 million outstanding under the facility and $73.5 million available for borrowing.
All amounts outstanding under the revolving credit facility are collateralized by the equity interests and assets of certain of our subsidiaries ("Pledged Subsidiaries"), which exclude the owners of the Securitization Properties. The amounts outstanding under the revolving credit facility and certain obligations contained therein are guaranteed by Silver Bay Realty Trust Corp. and the Operating Partnership only in the case of certain bad acts (including bankruptcy) and up to $20.0 million for completion of certain property renovations, as outlined in the credit documents. As of December 31, 2015, there were 5,894 properties pledged in the revolving credit facility.
The revolving credit facility does not contractually restrict our ability to pay dividends but certain covenants contained therein may limit the amount of cash available for distribution. For example, in the final year of the revolving credit facility, all cash generated by the properties in the Pledged Subsidiaries must be used to pay down the principal amount outstanding under the revolving credit facility. The revolving credit facility documents require us to meet certain quarterly financial tests pertaining to net worth, total liquidity, debt yield, and debt service coverage ratios and contain customary events of default for a facility of this type, including payment defaults, covenant defaults, breaches of representations and warranties, bankruptcy and insolvency, judgments, change of control and cross-default with certain other indebtedness. We must maintain total liquidity of $25.0 million and a net worth of at least $125.0 million, as determined in accordance with our revolving credit facility. We believe we were in compliance with all financial covenants under the revolving credit facility as of December 31, 2015.
Interest Rate Cap Agreements
We enter into interest rate cap agreements to manage interest rate risk associated with our variable rate debt. As of December 31, 2015, we have two interest rate cap agreements at LIBOR of 3.00% with an aggregate notional amount of $349.1 million and termination dates of February 17, 2018 and February 18, 2018 to hedge interest rate risk associated with our revolving credit facility. As of December 31, 2015, we also have one interest rate cap agreement at LIBOR of 3.1085% with a notional amount of $312.7 million and a termination date of September 15, 2016 to hedge interest rate risk associated with our Securitization Loan and one forward-starting interest rate cap agreement at LIBOR of 3.1085% with a notional amount of $200.0 million to hedge interest rate risk associated with our Securitization Loan for the period September 15, 2016 through September 15, 2019.
Operating Activities
Net cash provided by operating activities during 2015 was $31.1 million compared to net cash provided by operating activities of $8.7 million during 2014 and net cash used by operating activities of $15.4 million during 2013. Our operating cash flows during 2015 were driven by an increase in our portfolio of cash-generating properties and a decrease in cash on deposit with certain third-party property managers as we internalized property management across our portfolio. Our operating cash flows during 2014 were driven by an increase in our portfolio of cash-generating properties and 2013 cash flows were affected by our commitment of certain funds to escrow deposits.
Investing Activities
Our net cash used in investing activities is generally used to fund acquisitions and capital expenditures. Net cash used in investing activities during 2015 was $268.8 million and was largely driven by the Portfolio Acquisition. We used $273.3 million for property acquisitions and another $25.7 million on capital improvements, of which $17.5 million was attributable to our initial renovation of properties, which includes properties purchased in a bulk purchase that have been renovated for the first time, and $8.2 million was attributable to capital improvements made to properties that had been previously renovated. In addition, we received $29.2 million in proceeds from the sale of real estate, primarily due to the sale of our Houston portfolio and certain other properties.
The average renovation cost per property was approximately $28,500 or 25% of the purchase price for all properties placed in service since our Predecessor commenced operations through December 31, 2015, including properties acquired with an in-place lease but excluding properties acquired from entities managed by Provident Real Estate Advisors LLC and TAH. These renovation costs included capitalized expenditures for renovations, property taxes, homeowners' association dues,
54
interest, property insurance, costs required to gain possession of the property and other capitalized expenditures until the property is ready for its intended use.
Cash used in investing activities in 2014 and 2013 was $166.9 million and $350.9 million, respectively, and was primarily the result of us executing our acquisition and renovation strategies on newly acquired properties. In 2014 and 2013, we used $136.0 million and $265.8 million, respectively, for property acquisitions. In 2014, we used another $37.8 million on capital improvements, of which $32.2 million was attributable to our initial renovation of properties, which includes properties purchased in a bulk purchase which have been renovated for the first time, and $5.6 million was attributable to capital improvements made to properties that had been previously renovated. In 2013, we used $102.1 million on capital improvements, of which $99.5 million was attributable to our initial renovation of properties and $2.6 million was attributable to capital improvements made to properties that had been previously renovated.
The acquisition of properties involves payments beyond the purchase price, including payments for property inspections, closing costs, title insurance, transfer taxes, recording fees, broker commissions, and property taxes or homeowners’ association dues in arrears, along with capitalized interest on properties purchased since we obtained debt in May 2013. Typically, these costs are capitalized as components of the purchase price of the acquired asset unless the property was purchased with an existing lease. We also make significant capital expenditures to renovate and maintain our properties to Silver Bay standards. Our ultimate success depends in part on our ability to make prudent, cost-effective decisions measured over the long term with respect to these expenditures. Although we continue to review potential acquisition opportunities from time to time, we do not currently expect to acquire any new properties in the near term.
Financing Activities
Our net cash related to financing activities is generally affected by any borrowings and capital activities net of any dividends and distributions paid to our common shareholders and non-controlling interests. Net cash provided by financing activities during 2015 was $216.8 million and was primarily attributable to a draw on the revolving credit facility of $282.0 million, used mostly to fund the Portfolio Acquisition, partially reduced by repayments of our revolving credit facility of $22.6 million, dividends paid of $15.0 million, repurchases and retirement of our common stock of $12.4 million, repayment of our Securitization Loan of $7.1 million and deferred financing costs of $5.8 million.
Net cash provided by financing activities during 2014 was $164.3 million and was primarily attributable to proceeds from our Securitization Loan of $311.2 million and $137.8 million in proceeds from our revolving credit facility, reduced by repayments of our revolving credit facility of $235.5 million, repurchases of our common stock of $31.5 million, deferred financing costs of $12.3 million and dividends paid of $4.3 million. In addition to the pay-down of our revolving credit facility, we used the proceeds from our Securitization Transaction to repurchase common stock, invest in residential properties and for other general corporate purposes.
Cash provided by financing activities in 2013 was $181.9 million and was primarily attributable to the proceeds from the revolving credit facility of $164.8 million and to a lesser extent the net proceeds from the exercise of the underwriters' overallotment option in our initial public offering of $34.5 million, reduced by $11.6 million in repurchases of our common stock and deferred financing costs of $4.0 million. We used these net proceeds from our revolving credit facility and the underwriters’ overallotment to invest in residential properties and for other general corporate purposes.
Payment Obligations
We have an obligation to pay dividends on our outstanding 10% cumulative redeemable preferred stock with a $1.0 million aggregate liquidation preference in preference to dividends paid on our common stock. We declared $0.1 million in preferred dividends during 2015.
We have elected to be treated as a REIT for U.S. federal income tax purposes. As a REIT, under U.S. federal income tax law we are required to distribute annually at least 90% of our REIT taxable income, without regard to the deduction for dividends paid and excluding net capital gains, and to pay tax at regular corporate rates to the extent that we annually distribute less than 100% of our REIT taxable income. Subject to the requirements of the Maryland General Corporation Law, we intend to pay quarterly dividends to our stockholders, if and to the extent authorized by our board of directors. On December 17, 2015, our board of directors declared $4.7 million in common stock dividends and $290,000 in distributions on the common units, which were paid on January 8, 2016.
55
The 2,231,511 common units issued by the Operating Partnership in connection with the Internalization may be redeemed for cash or, at our election, a number of our common shares on a one-for-one basis. To the extent that we redeem the common units for cash, our liquidity will decrease. As of December 31, 2015, none of the common units had been redeemed.
Off-Balance Sheet Arrangements
We have no obligations, assets or liabilities which would be considered off-balance sheet arrangements. We have not participated in transactions that create relationships with unconsolidated entities or financial partnerships, often referred to as variable interest entities, which would have been established for the purpose of facilitating off-balance sheet arrangements.
Aggregate Contractual Obligations
The following table summarizes the effect on our liquidity and cash flows from certain contractual obligations, as of December 31, 2015:
(in thousands) | Total | Less than One Year | One to Three Years | Three to Five Years | More Than Five Years | |||||||||||||||
Purchase obligations | $ | 3,359 | $ | 3,212 | $ | 147 | $ | — | $ | — | ||||||||||
Long-term debt obligations (1) | 684,435 | 20,041 | 354,514 | 309,880 | — | |||||||||||||||
Operating lease obligations (2) | 2,007 | 538 | 787 | 499 | 183 | |||||||||||||||
Total | $ | 689,801 | $ | 23,791 | $ | 355,448 | $ | 310,379 | $ | 183 | ||||||||||
_______________
(1) | Includes estimated interest payments on the respective debt based on amounts outstanding as of December 31, 2015 and rates in effect as of such date. The revolving credit facility was amended and restated on February 18, 2015 and has a new maturity date of February 18, 2018. The Securitization Loan has an initial maturity date of September 9, 2016 and three, 12-month extension options resulting in a fully extended maturity date of September 9, 2019; this analysis assumes our exercise of the three extension options, which is management's intent. |
(2) | Includes operating leases for corporate and market offices. |
Net Operating Income
We define net operating income ("NOI") as total revenue less property operating and maintenance, real estate taxes, homeowners’ association fees, and property management expenses. NOI excludes depreciation and amortization, the former advisory management fees, management internalization, portfolio acquisition expense, general and administrative expenses, share-based compensation, interest expense, net gain on disposition of real estate, ineffectiveness of interest rate cap agreements, income tax benefit, net and other non-comparable items as applicable. Additionally, NOI excludes certain property management add backs, such as the 5% property management fee payable prior to the Internalization because it more closely represents additional advisory management fee, expensed acquisition fees and costs, and certain other property management costs.
We consider NOI to be a meaningful financial measure when considered with the financial statements determined in accordance with GAAP. We believe NOI is helpful to investors in understanding the core performance of our real estate operations.
56
The following is a reconciliation of our NOI to net loss as determined in accordance with GAAP for the years ended December 31, 2015, 2014, 2013 and 2012 (amounts in thousands):
Year Ended December 31, | ||||||||||||||||
2015 | 2014 | 2013 | 2012 | |||||||||||||
Net loss | $ | (9,952 | ) | $ | (56,697 | ) | $ | (24,550 | ) | $ | (5,521 | ) | ||||
Depreciation and amortization | 35,189 | 25,623 | 20,235 | 2,106 | ||||||||||||
Advisory management fee - affiliates | — | 6,621 | 9,775 | 2,159 | ||||||||||||
Management internalization | — | 39,373 | — | — | ||||||||||||
Portfolio acquisition expense | 2,064 | — | — | — | ||||||||||||
General and administrative | 15,915 | 10,334 | 6,834 | 843 | ||||||||||||
Share-based compensation | 2,613 | 1,022 | 927 | 38 | ||||||||||||
Interest expense | 21,275 | 11,586 | 2,911 | — | ||||||||||||
Net gain on disposition of real estate | (4,044 | ) | (174 | ) | (114 | ) | — | |||||||||
Ineffectiveness of interest rate cap agreements | 51 | 480 | — | — | ||||||||||||
Other expense | 383 | 785 | 1,398 | — | ||||||||||||
Income tax benefit, net | (758 | ) | — | — | — | |||||||||||
Property operating and maintenance add back: | ||||||||||||||||
Market ready costs prior to initial lease and other | 169 | 278 | — | — | ||||||||||||
Property management add backs | — | 478 | 2,456 | 10 | ||||||||||||
Net operating income | $ | 62,905 | $ | 39,709 | $ | 19,872 | $ | (365 | ) | |||||||
Net operating income as a percentage of total revenue | 55.3 | % | 51.0 | % | 40.1 | % | (10.1 | )% | ||||||||
NOI should not be considered an alternative to net loss or net cash flows from operating activities, as determined in accordance with GAAP, as indications of our performance or as measures of liquidity. Although we use this non-GAAP measure for comparability in assessing our performance against other REITs, not all REITs compute this non-GAAP measure in the same manner. Accordingly, there can be no assurance that our basis for computing this non-GAAP measure is comparable with that of other REITs.
Funds From Operations and Core Funds From Operations
Funds From Operations ("FFO") is a non-GAAP financial measure that we believe, when considered with the financial statements determined in accordance with GAAP, is helpful to investors in understanding our performance because it captures features particular to real estate performance by recognizing that real estate generally appreciates over time or maintains residual value to a much greater extent than do other depreciable assets. The National Association of Real Estate Investment Trusts ("NAREIT") defines FFO as net income (loss), computed in accordance with GAAP, excluding gains or losses from sales of, and impairment losses recognized with respect to, depreciable property, plus depreciation and amortization, and after adjustments for unconsolidated partnerships and joint ventures. Adjustments for unconsolidated partnerships and joint ventures are calculated on the same basis to determine FFO.
Core Funds From Operations ("Core FFO") is a non-GAAP financial measure that we use as a supplemental measure of our performance. We believe that Core FFO is further helpful to investors as it provides a more consistent measurement of our performance across reporting periods by removing the impact of certain items that are not comparable from period to period. We adjust FFO for expensed acquisition fees and costs, including those associated with the Portfolio Acquisition, certain fees and expenses related to our Securitization Transaction, share-based compensation, write-offs of expenses associated with changes in our debt structure, income tax (benefit) on the disposition of real estate, and certain other non-cash or non-comparable costs to arrive at Core FFO.
FFO and Core FFO should not be considered alternatives to net income (loss) or net cash flows from operating activities, as determined in accordance with GAAP, as indications of our performance or as measures of liquidity. These non-GAAP measures are not necessarily indicative of cash available to fund future cash needs. In addition, although we use these non-GAAP measures for comparability in assessing our performance against other REITs, not all REITs compute these non-GAAP measures in the same manner. Accordingly, there can be no assurance that our basis for computing these non-GAAP measures is comparable with that of other REITs. This is due in part to the differences in capitalization policies used by different companies and the significant effect these capitalization policies have on FFO and Core FFO. Real estate costs which
57
are accounted for as capital improvements are added to the carrying value of the property and depreciated over time, whereas real estate costs that are expenses are accounted for as a current period expense. This impacts FFO and Core FFO because costs that are accounted for as expenses reduce FFO and Core FFO. Conversely, real estate costs associated with assets that are capitalized and then subsequently depreciated are excluded from the calculation of FFO and Core FFO.
FFO and Core FFO are calculated on a gross basis and as such, do not reflect adjustments for the noncontrolling interests - Operating Partnership.
The following table sets forth a reconciliation of our net loss as determined in accordance with GAAP and our calculations of FFO and Core FFO for the years ended December 31, 2015, 2014, 2013 and 2012. Also presented is information regarding the weighted-average number of shares of our common stock and common units of the Operating Partnership outstanding used for the computation of FFO and Core FFO per share (amounts in thousands, except share and per-share amounts):
Year Ended December 31, | ||||||||||||||||
2015 | 2014 | 2013 | 2012 | |||||||||||||
Net loss (1) | $ | (9,952 | ) | $ | (56,697 | ) | $ | (24,550 | ) | $ | (5,521 | ) | ||||
Depreciation and amortization | 35,189 | 25,623 | 20,235 | 2,106 | ||||||||||||
Net gain on disposition of real estate | (4,044 | ) | (174 | ) | (114 | ) | — | |||||||||
Other expense (income) | (190 | ) | 731 | 792 | — | |||||||||||
Funds from operations | $ | 21,003 | $ | (30,517 | ) | $ | (3,637 | ) | $ | (3,415 | ) | |||||
Adjustments: | ||||||||||||||||
Portfolio acquisition expense (2) | $ | 2,064 | $ | — | $ | — | $ | — | ||||||||
Acquisition fees and costs expensed and other (3) | — | 815 | 834 | — | ||||||||||||
Securitization fees and costs expensed (4) | — | 801 | — | — | ||||||||||||
Share-based compensation | 2,613 | 1,022 | 927 | 38 | ||||||||||||
Market ready costs prior to initial lease and other | 169 | 278 | — | — | ||||||||||||
System implementation costs | — | 139 | 971 | — | ||||||||||||
Management internalization (1) | — | 39,373 | — | — | ||||||||||||
Write-off of deferred financing fees | 31 | 1,058 | — | — | ||||||||||||
Ineffectiveness of interest rate cap agreements | 51 | 480 | — | — | ||||||||||||
Amortization of discount on securitization loan | 301 | 116 | — | — | ||||||||||||
Income tax (benefit) on disposition of real estate | (941 | ) | — | — | — | |||||||||||
Other expense (5) | 114 | — | — | — | ||||||||||||
Core funds from operations | $ | 25,405 | $ | 13,565 | $ | (905 | ) | $ | (3,377 | ) | ||||||
FFO | $ | 21,003 | $ | (30,517 | ) | $ | (3,637 | ) | $ | (3,415 | ) | |||||
Preferred stock distributions | (100 | ) | (100 | ) | (100 | ) | (3 | ) | ||||||||
FFO available to common shares and units | $ | 20,903 | $ | (30,617 | ) | $ | (3,737 | ) | $ | (3,418 | ) | |||||
Core FFO | $ | 25,405 | $ | 13,565 | $ | (905 | ) | $ | (3,377 | ) | ||||||
Preferred stock distributions | (100 | ) | (100 | ) | (100 | ) | (3 | ) | ||||||||
Core FFO available to common shares and units | $ | 25,305 | $ | 13,465 | $ | (1,005 | ) | $ | (3,380 | ) | ||||||
Weighted average common shares and units outstanding (6) | 38,441,510 | 38,688,548 | 39,101,378 | 37,355,672 | ||||||||||||
FFO per share | $ | 0.54 | $ | (0.79 | ) | $ | (0.10 | ) | $ | (0.09 | ) | |||||
Core FFO per share | $ | 0.66 | $ | 0.35 | $ | (0.03 | ) | $ | (0.09 | ) | ||||||
58
_______________
(1) | Includes cost to internalize our Former Manager of $39.4 million, primarily related to issuance of common units of the Operating Partnership and to a lesser extent, certain transaction costs and assumption of certain liabilities during the year ended December 31, 2014. |
(2) | Includes a one-time expense for costs related to the Portfolio Acquisition. |
(3) | Includes a one-time expense reflected in general and administrative expense during the year ended December 31, 2014 to acquire the former Tampa third-party property manager. |
(4) | Represents non-capitalizable costs related to our Securitization Transaction for personnel and other matters. |
(5) | Non-comparable costs from prior periods. |
(6) | Represents the weighted average of common shares and common units in the Operating Partnership outstanding for the periods presented. |
59
Item 7A. Quantitative and Qualitative Disclosures About Market Risk.
Market risk refers to the risk of loss from adverse changes in market prices and interest rates. Our future revenue, cash flows and fair values relevant to certain financial instruments are dependent upon prevailing market interest rates. Our Securitization Loan and revolving credit facility have variable rates of interest. We are therefore most vulnerable to changes in short-term LIBOR interest rates. On August 12, 2014, we completed a Securitization Transaction in which we received gross proceeds of $311.2 million, net of an original issue discount of $1.5 million (refer to Note 5 of the consolidated financial statements). The Securitization Loan has an initial term of two years, with three, 12-month extension options, resulting in a fully extended maturity date of September 9, 2019, and (as of December 31, 2015) bears interest at a blended effective interest rate of LIBOR plus 1.94%, inclusive of the amortization of the original issue discount, plus monthly servicing fees of 0.1355%. In August 2014, we hedged our exposure to increases in the one-month LIBOR rate by entering into an interest rate cap agreement with a notional amount of $312.7 million, which caps the benchmark rate at 3.1085% on the Securitization Loan for the initial two-year term of the loan. In January 2015, we entered into a forward-starting interest rate cap agreement with a notional amount of $200.0 million, which caps the benchmark rate at 3.1085% from September 15, 2016 through the fully extended maturity date of September 9, 2019. We do not use derivatives for trading or speculative purposes.
We also maintain a $400.0 million revolving credit facility which bears interest at a varying rate of LIBOR plus 3.00% subject to a LIBOR floor of 0.0%. We hedge our exposure to increases in the three-month LIBOR rate by entering into interest rate cap agreements, which cap the benchmark rate at 3.00% on the outstanding balance of the revolving credit facility. Refer to Note 5 of the consolidated financial statements for further details on the revolving credit facility and the associated interest rate caps.
At December 31, 2015, we had an outstanding balance on the revolving credit facility of $326.5 million and a balance subject to interest payments on the Securitization Loan of $305.0 million, which includes the discount. If the weighted average interest rate on this variable rate debt had been 1.0% higher or lower, the annual interest expense would increase or decrease by $6.3 million, respectively. These amounts were determined by considering the impact of hypothetical interest rates on our debt. This analysis does not consider the effects of the changes in overall economic activity that could exist in such an environment and assumes no changes in our financial structure.
The fair value of our financial instruments (including cash, escrow deposits, resident prepaid rent and security deposits, resident rent receivable, accounts payable and accrued expenses) approximate their carrying values because of their short-term nature. The fair value of our 10% cumulative redeemable preferred stock approximates its liquidation value. The fair values of our revolving credit facility and Securitization Loan approximate fair value as the rates are consistent with those demanded in the market for facilities with similar risks and maturities.
We cannot predict with certainty the effect of adverse changes in interest rates on our Securitization Loan and revolving credit facility and, therefore, our exposure to market risk, nor can we provide any assurance that long-term debt will be available at advantageous pricing. Consequently, future results may differ materially from the estimated adverse changes discussed above.
60
Item 8. Financial Statements and Supplementary Data.
SILVER BAY REALTY TRUST CORP.
INDEX TO CONSOLIDATED FINANCIAL STATEMENTS
Page | |
61
REPORT OF INDEPENDENT REGISTERED PUBLIC ACCOUNTING FIRM
The Board of Directors and Stockholders
of Silver Bay Realty Trust Corp.
We have audited the accompanying consolidated balance sheets of Silver Bay Realty Trust Corp. (the “Company”) as of December 31, 2015 and 2014, and the related consolidated statements of operations and comprehensive loss, changes in equity, and cash flows for each of the three years in the period ended December 31, 2015. Our audits also included the financial statement schedule listed in the Index at Item 15(a). These financial statements and schedule are the responsibility of the Company’s management. Our responsibility is to express an opinion on these financial statements and schedule based on our audits.
We conducted our audits in accordance with the standards of the Public Company Accounting Oversight Board (United States). Those standards require that we plan and perform the audit to obtain reasonable assurance about whether the financial statements are free of material misstatement. We were not engaged to perform an audit of the Company’s internal control over financial reporting. Our audits included consideration of internal control over financial reporting as a basis for designing audit procedures that are appropriate in the circumstances, but not for the purpose of expressing an opinion on the effectiveness of the Company’s internal control over financial reporting. Accordingly, we express no such opinion. An audit also includes examining, on a test basis, evidence supporting the amounts and disclosures in the financial statements, assessing the accounting principles used and significant estimates made by management, and evaluating the overall financial statement presentation. We believe that our audits provide a reasonable basis for our opinion.
In our opinion, the financial statements referred to above present fairly, in all material respects, the consolidated financial position of Silver Bay Realty Trust Corp. at December 31, 2015 and 2014, and the consolidated results of its operations and its cash flows for each of the three years in the period ended December 31, 2015, in conformity with U.S. generally accepted accounting principles. Also, in our opinion, the related financial statement schedule, when considered in relation to the basic financial statements taken as a whole, presents fairly in all material respects the information set forth therein.
/s/ Ernst & Young LLP
February 25, 2016
Minneapolis, Minnesota
62
Silver Bay Realty Trust Corp.
Consolidated Balance Sheets
(amounts in thousands except share data)
December 31, 2015 | December 31, 2014 | ||||||
Assets | |||||||
Investments in real estate: | |||||||
Land and land improvements | $ | 220,110 | $ | 167,780 | |||
Building and improvements | 989,574 | 780,590 | |||||
1,209,684 | 948,370 | ||||||
Accumulated depreciation | (74,907 | ) | (43,150 | ) | |||
Investments in real estate, net | 1,134,777 | 905,220 | |||||
Assets held for sale | 11,184 | 2,010 | |||||
Cash | 29,028 | 49,854 | |||||
Escrow deposits | 15,472 | 20,211 | |||||
Resident security deposits | 12,521 | 8,595 | |||||
In-place lease and deferred lease costs, net | 689 | 688 | |||||
Deferred financing costs, net | 13,075 | 11,960 | |||||
Other assets | 7,673 | 3,842 | |||||
Total assets | $ | 1,224,419 | $ | 1,002,380 | |||
Liabilities and Equity | |||||||
Liabilities: | |||||||
Securitization loan, net of unamortized discount of $1,086 and $1,387, respectively | $ | 303,880 | $ | 310,665 | |||
Revolving credit facility | 326,472 | 67,096 | |||||
Accounts payable and accrued expenses | 16,752 | 13,090 | |||||
Resident prepaid rent and security deposits | 14,462 | 9,634 | |||||
Total liabilities | 661,566 | 400,485 | |||||
10% cumulative redeemable preferred stock, $0.01 par; 50,000,000 authorized, 1,000 issued and outstanding | 1,000 | 1,000 | |||||
Equity: | |||||||
Stockholders’ equity: | |||||||
Common stock $0.01 par; 450,000,000 shares authorized; 36,063,187 and 36,711,694, respectively, shares issued and outstanding | 359 | 366 | |||||
Additional paid-in capital | 651,987 | 660,776 | |||||
Accumulated other comprehensive loss | (1,613 | ) | (86 | ) | |||
Cumulative deficit | (121,620 | ) | (94,593 | ) | |||
Total stockholders’ equity | 529,113 | 566,463 | |||||
Noncontrolling interests - Operating Partnership | 32,740 | 34,432 | |||||
Total equity | 561,853 | 600,895 | |||||
Total liabilities and equity | $ | 1,224,419 | $ | 1,002,380 | |||
See accompanying notes to the consolidated financial statements.
63
Silver Bay Realty Trust Corp. Consolidated Statements of Operations and Comprehensive Loss (amounts in thousands except share data) | |||||||||||
Year Ended December 31, | |||||||||||
2015 | 2014 | 2013 | |||||||||
Revenue: | |||||||||||
Rental income | $ | 111,159 | $ | 75,910 | $ | 47,953 | |||||
Other income | 2,535 | 2,020 | 1,640 | ||||||||
Total revenue | 113,694 | 77,930 | 49,593 | ||||||||
Expenses: | |||||||||||
Property operating and maintenance | 22,106 | 17,274 | 12,472 | ||||||||
Real estate taxes | 15,847 | 11,042 | 6,893 | ||||||||
Homeowners’ association fees | 1,912 | 1,260 | 1,129 | ||||||||
Property management | 11,093 | 9,401 | 11,683 | ||||||||
Depreciation and amortization | 35,189 | 25,623 | 20,235 | ||||||||
Advisory management fee - affiliates | — | 6,621 | 9,775 | ||||||||
Management internalization | — | 39,373 | — | ||||||||
Portfolio acquisition expense | 2,064 | — | — | ||||||||
General and administrative | 15,915 | 10,334 | 6,834 | ||||||||
Share-based compensation | 2,613 | 1,022 | 927 | ||||||||
Interest expense | 21,275 | 11,586 | 2,911 | ||||||||
Total expenses | 128,014 | 133,536 | 72,859 | ||||||||
Loss before other income (expense), income taxes and non-controlling interests | (14,320 | ) | (55,606 | ) | (23,266 | ) | |||||
Other income (expense): | |||||||||||
Net gain on disposition of real estate | 4,044 | 174 | 114 | ||||||||
Ineffectiveness of interest rate cap agreements | (51 | ) | (480 | ) | — | ||||||
Other expense | (383 | ) | (785 | ) | (1,398 | ) | |||||
Total other income (expense) | 3,610 | (1,091 | ) | (1,284 | ) | ||||||
Loss before income taxes and non-controlling interests | (10,710 | ) | (56,697 | ) | (24,550 | ) | |||||
Income tax benefit, net | 758 | — | — | ||||||||
Net loss | (9,952 | ) | (56,697 | ) | (24,550 | ) | |||||
Net loss attributable to noncontrolling interests - Operating Partnership | 577 | 143 | 17 | ||||||||
Net loss attributable to controlling interests | (9,375 | ) | (56,554 | ) | (24,533 | ) | |||||
Preferred stock distributions | (100 | ) | (100 | ) | (100 | ) | |||||
Net loss attributable to common stockholders | $ | (9,475 | ) | $ | (56,654 | ) | $ | (24,633 | ) | ||
Loss per share - basic and diluted (Note 9): | |||||||||||
Net loss attributable to common shares | $ | (0.26 | ) | $ | (1.49 | ) | $ | (0.63 | ) | ||
Weighted average common shares outstanding | 36,209,999 | 38,119,971 | 39,073,994 | ||||||||
Comprehensive Loss: | |||||||||||
Net loss | $ | (9,952 | ) | $ | (56,697 | ) | $ | (24,550 | ) | ||
Other comprehensive loss: | |||||||||||
Change in fair value of interest rate cap agreements | (1,587 | ) | (291 | ) | (276 | ) | |||||
Losses reclassified into earnings from other comprehensive (loss) income | 60 | 481 | — | ||||||||
Other comprehensive (loss) income | (1,527 | ) | 190 | (276 | ) | ||||||
Comprehensive loss | (11,479 | ) | (56,507 | ) | (24,826 | ) | |||||
Less comprehensive loss attributable to noncontrolling interests - Operating Partnership | 669 | 143 | 17 | ||||||||
Comprehensive loss attributable to controlling interests | $ | (10,810 | ) | $ | (56,364 | ) | $ | (24,809 | ) | ||
See accompanying notes to the consolidated financial statements.
64
Silver Bay Realty Trust Corp.
Consolidated Statements of Changes in Equity
For the Years Ended December 31, 2015, 2014 and 2013
(amounts in thousands except share data)
Common Stock | ||||||||||||||||||||||||||||||
Shares | Par Value Amount | Additional Paid-In Capital | Accumulated Other Comprehensive Loss | Cumulative Deficit | Total Stockholders’ Equity | Noncontrolling Interests - Operating Partnership | Total Equity | |||||||||||||||||||||||
Balance at January 1, 2013 | 37,328,213 | $ | 372 | $ | 664,146 | $ | — | $ | (5,609 | ) | $ | 658,909 | $ | 504 | $ | 659,413 | ||||||||||||||
Net proceeds from sale of common stock | 1,987,500 | 20 | 34,368 | — | — | 34,388 | — | 34,388 | ||||||||||||||||||||||
Non-cash equity awards, net | (23,351 | ) | 1 | 1,062 | — | — | 1,063 | — | 1,063 | |||||||||||||||||||||
Repurchase and retirement of common stock | (758,353 | ) | (8 | ) | (11,752 | ) | — | — | (11,760 | ) | — | (11,760 | ) | |||||||||||||||||
Dividends declared | — | — | — | — | (1,653 | ) | (1,653 | ) | — | (1,653 | ) | |||||||||||||||||||
Other | — | — | 1,335 | — | — | 1,335 | — | 1,335 | ||||||||||||||||||||||
Net loss | — | — | — | — | (24,533 | ) | (24,533 | ) | (17 | ) | (24,550 | ) | ||||||||||||||||||
Other comprehensive loss | — | — | — | (276 | ) | — | (276 | ) | — | (276 | ) | |||||||||||||||||||
Conversion of Operating Partnership units into common shares | 27,459 | — | 487 | — | — | 487 | (487 | ) | — | |||||||||||||||||||||
Balance at December 31, 2013 | 38,561,468 | 385 | 689,646 | (276 | ) | (31,795 | ) | 657,960 | — | 657,960 | ||||||||||||||||||||
Non-cash equity awards, net | 68,062 | — | 1,002 | — | — | 1,002 | — | 1,002 | ||||||||||||||||||||||
Repurchase and retirement of common stock | (1,917,836 | ) | (19 | ) | (31,470 | ) | — | — | (31,489 | ) | — | (31,489 | ) | |||||||||||||||||
Dividends declared | — | — | — | — | (6,244 | ) | (6,244 | ) | — | (6,244 | ) | |||||||||||||||||||
Net loss | — | — | — | — | (56,554 | ) | (56,554 | ) | (143 | ) | (56,697 | ) | ||||||||||||||||||
Issuance of common Operating Partnership units in connection with management internalization | — | — | — | — | — | — | 36,173 | 36,173 | ||||||||||||||||||||||
Other comprehensive loss | — | — | — | (291 | ) | — | (291 | ) | — | (291 | ) | |||||||||||||||||||
Losses reclassified into earnings from other comprehensive loss | — | — | — | 481 | — | 481 | — | 481 | ||||||||||||||||||||||
Adjustment to noncontrolling interests - Operating Partnership | — | — | 1,598 | — | — | 1,598 | (1,598 | ) | — | |||||||||||||||||||||
Balance at December 31, 2014 | 36,711,694 | 366 | 660,776 | (86 | ) | (94,593 | ) | 566,463 | 34,432 | 600,895 | ||||||||||||||||||||
Non-cash equity awards, net | 132,932 | 1 | 2,522 | — | — | 2,523 | — | 2,523 | ||||||||||||||||||||||
Repurchase and retirement of common stock | (781,439 | ) | (8 | ) | (12,426 | ) | — | — | (12,434 | ) | — | (12,434 | ) | |||||||||||||||||
Dividends declared | — | — | — | — | (17,652 | ) | (17,652 | ) | — | (17,652 | ) | |||||||||||||||||||
Net loss | — | — | — | — | (9,375 | ) | (9,375 | ) | (577 | ) | (9,952 | ) | ||||||||||||||||||
Other comprehensive loss | — | — | — | (1,587 | ) | — | (1,587 | ) | — | (1,587 | ) | |||||||||||||||||||
Losses reclassified into earnings from other comprehensive loss | — | — | — | 60 | — | 60 | — | 60 | ||||||||||||||||||||||
Adjustment to noncontrolling interests - Operating Partnership | — | — | 1,115 | — | — | 1,115 | (1,115 | ) | — | |||||||||||||||||||||
Balance at December 31, 2015 | 36,063,187 | $ | 359 | $ | 651,987 | $ | (1,613 | ) | $ | (121,620 | ) | $ | 529,113 | $ | 32,740 | $ | 561,853 | |||||||||||||
See accompanying notes to the consolidated financial statements.
65
Silver Bay Realty Trust Corp. Consolidated Statements of Cash Flows (amounts in thousands) | |||||||||||
Year Ended December 31, | |||||||||||
2015 | 2014 | 2013 | |||||||||
Cash Flows From Operating Activities: | |||||||||||
Net loss | $ | (9,952 | ) | $ | (56,697 | ) | $ | (24,550 | ) | ||
Adjustments to reconcile net loss to net cash provided (used) by operating activities: | |||||||||||
Depreciation and amortization | 35,189 | 25,623 | 20,235 | ||||||||
Non-cash management internalization | — | 36,173 | — | ||||||||
Non-cash share-based compensation | 2,523 | 1,002 | 921 | ||||||||
Losses reclassified into earnings from other comprehensive loss | 60 | 481 | — | ||||||||
Amortization and write-off of deferred financing costs | 4,668 | 3,613 | 815 | ||||||||
Amortization of discount on securitization loan | 301 | 116 | — | ||||||||
Bad debt expense | 1,426 | 671 | 771 | ||||||||
Net gain on disposition of real estate | (4,044 | ) | (174 | ) | (114 | ) | |||||
Income tax valuation allowance reversal | 941 | — | — | ||||||||
Other | 566 | 840 | 792 | ||||||||
Net change in assets and liabilities: | |||||||||||
Decrease (increase) in escrow cash for operating activities | 3,766 | 5,062 | (16,111 | ) | |||||||
(Increase) decrease in deferred lease fees and other assets | (7,505 | ) | (2,184 | ) | 779 | ||||||
Increase in accounts payable, accrued property expenses, and prepaid rent | 3,208 | 1,799 | 1,150 | ||||||||
Decrease in related party payables, net | — | (7,611 | ) | (39 | ) | ||||||
Net cash provided (used) by operating activities | 31,147 | 8,714 | (15,351 | ) | |||||||
Cash Flows From Investing Activities: | |||||||||||
Purchase of investments in real estate | (273,266 | ) | (136,045 | ) | (265,809 | ) | |||||
Capital improvements of investments in real estate | (25,651 | ) | (37,846 | ) | (102,149 | ) | |||||
Decrease (increase) in escrow cash for investing activities | 972 | (731 | ) | 11,377 | |||||||
Proceeds from sale of real estate | 29,223 | 5,979 | 5,939 | ||||||||
Cash acquired in management internalization | — | 2,069 | — | ||||||||
Other | (43 | ) | (295 | ) | (299 | ) | |||||
Net cash used by investing activities | (268,765 | ) | (166,869 | ) | (350,941 | ) | |||||
Cash Flows From Financing Activities: | |||||||||||
Proceeds from securitization loan | — | 311,164 | — | ||||||||
Payments on securitization loan | (7,085 | ) | (615 | ) | — | ||||||
Proceeds from revolving credit facility | 281,963 | 137,779 | 164,825 | ||||||||
Payments on revolving credit facility | (22,587 | ) | (235,508 | ) | — | ||||||
Deferred financing costs paid | (5,783 | ) | (12,348 | ) | (4,040 | ) | |||||
Purchase of interest rate cap agreements | (2,250 | ) | (393 | ) | (533 | ) | |||||
Repurchase and retirement of common stock | (12,434 | ) | (31,489 | ) | (11,639 | ) | |||||
Dividends paid | (15,032 | ) | (4,298 | ) | (1,256 | ) | |||||
Proceeds from issuance of common stock, net of offering costs | — | — | 34,513 | ||||||||
Net cash provided by financing activities | 216,792 | 164,292 | 181,870 | ||||||||
Net change in cash | (20,826 | ) | 6,137 | (184,422 | ) | ||||||
Cash at beginning of year | 49,854 | 43,717 | 228,139 | ||||||||
Cash at end of year | $ | 29,028 | $ | 49,854 | $ | 43,717 | |||||
See accompanying notes to the consolidated financial statements.
66
Silver Bay Realty Trust Corp. Consolidated Statements of Cash Flows (amounts in thousands) | |||||||||||
Supplemental disclosure of cash flow information: | |||||||||||
Cash paid for interest, net of amounts capitalized | $ | 15,974 | $ | 7,690 | $ | 1,889 | |||||
Cash paid for taxes | $ | 181 | $ | — | $ | — | |||||
Board of directors stock compensation | $ | — | $ | — | $ | 125 | |||||
Decrease in fair value of interest rate cap agreements | $ | 1,587 | $ | 291 | $ | 276 | |||||
Non-cash investing and financing activities: | |||||||||||
Common stock and unit dividends declared, but not paid | $ | 4,978 | $ | 2,331 | $ | 385 | |||||
Advisory management fee - additional basis | $ | — | $ | — | $ | 1,335 | |||||
Change in contingent consideration | $ | — | $ | — | $ | 388 | |||||
Capital improvements in accounts payable | $ | 597 | $ | 1,950 | $ | 1,630 | |||||
Conversion of Operating Partnership units into common shares | $ | — | $ | — | $ | 487 | |||||
Non-cash management internalization transaction: | |||||||||||
Issuance of units to noncontrolling interests | $ | — | $ | 36,173 | $ | — | |||||
Other liabilities acquired in management internalization | $ | — | $ | (2,067 | ) | $ | — | ||||
See accompanying notes to the consolidated financial statements.
67
SILVER BAY REALTY TRUST CORP.
NOTES TO THE CONSOLIDATED FINANCIAL STATEMENTS
(amounts in thousands, except share data and property counts)
Note 1. Organization and Operations
Silver Bay Realty Trust Corp. ("Silver Bay" or the "Company"), is a Maryland corporation that focuses on the acquisition, renovation, leasing, and management of single-family properties in select markets in the United States.
As of December 31, 2015, the Company owned 9,022 single-family properties, excluding assets held for sale, in Arizona, California, Florida, Georgia, Nevada, North Carolina, Ohio, South Carolina and Texas.
During the year ended December 31, 2015, the Company acquired a portfolio of 2,461 properties (the "Acquired Properties") from The American Home Real Estate Investment Trust ("TAH"). The acquisition was substantially completed on April 1, 2015 (the "Portfolio Acquisition"). The homes are primarily located in Atlanta, GA, Charlotte, NC, Tampa, FL, and Orlando, FL. See Note 3 for further description of this transaction.
The Company is the continuation of the operations of Silver Bay Property Investment LLC (the "Predecessor"). At the time of its formation, the Predecessor was a wholly owned subsidiary of Two Harbors Investment Corp. ("Two Harbors"). The Predecessor began formal operations in February 2012, when it started acquiring single-family residential rental properties. The Company in its current form was created on December 19, 2012, through a series of formation transactions (the "Formation Transactions"), which included an initial public offering (the "Offering"), the contribution of equity interests in the Predecessor by Two Harbors, and the acquisition of entities (the "Provident Entities") managed by Provident Real Estate Advisors LLC ("Provident"), which owned 881 single-family properties.
In connection with the Offering, the Company restructured its ownership to conduct its business through a traditional umbrella partnership ("UPREIT structure") in which substantially all of its assets are held by, and its operations are conducted through, Silver Bay Operating Partnership L.P. (the "Operating Partnership"), a Delaware limited partnership. The Company's wholly owned subsidiary, Silver Bay Management LLC, is the sole general partner of the Operating Partnership. As of December 31, 2015, the Company owned, through a combination of direct and indirect interests, 94.2% of the partnership interests in the Operating Partnership.
The Company has elected to be treated as a real estate investment trust ("REIT") for U.S. federal tax purposes, commencing with, and in connection with the filing of its federal tax return for, its taxable year ended December 31, 2012. As a REIT, the Company will generally not be subject to federal income tax on the taxable income that it distributes to its stockholders. If the Company fails to qualify as a REIT in any taxable year, it will be subject to federal income tax at regular corporate rates. Even if it qualifies for taxation as a REIT, the Company may be subject to some federal, state and local taxes on its income or property. In addition, the income of any taxable REIT subsidiary ("TRS") that the Company owns will be subject to taxation at regular corporate rates.
Through September 30, 2014, the Company was externally managed by PRCM Real Estate Advisers LLC (the "Former Manager"). During this time, the Company relied on the Former Manager to provide or obtain on its behalf the personnel and services necessary for it to conduct its business as the Company had no employees of its own. On September 30, 2014, the Company closed a transaction to internalize its management (the "Internalization") and now owns all material assets and intellectual property rights of the Former Manager previously used in the conduct of its business. In connection with the Internalization, the officers and employees who worked for the Former Manager became employees of the Company (see Note 10).
Note 2. Basis of Presentation and Significant Accounting Policies
Principles of Consolidation
The accompanying consolidated financial statements include the accounts of the Company and the Operating Partnership. The Company consolidates real estate partnerships and other entities that are not variable interest entities ("VIE") when it owns, directly or indirectly, a majority voting interest in the entity or is otherwise able to control the entity. All intercompany balances and transactions have been eliminated in consolidation. The accompanying consolidated financial statements have been prepared in accordance with U.S. generally accepted accounting principles ("GAAP").
68
SILVER BAY REALTY TRUST CORP.
NOTES TO THE CONSOLIDATED FINANCIAL STATEMENTS
(amounts in thousands, except share data and property counts)
GAAP requires the Company to identify entities for which control is achieved through means other than voting rights and to determine which business enterprise is the primary beneficiary of VIEs. A VIE is broadly defined as an entity with one or more of the following characteristics: (a) the total equity investment at risk is insufficient to finance the entity’s activities without additional subordinated financial support; (b) as a group, the holders of the equity investment at risk lack (i) the ability to make decisions about the entity’s activities through voting or similar rights, (ii) the obligation to absorb the expected losses of the entity, or (iii) the right to receive the expected residual returns of the entity; or (c) the equity investors have voting rights that are not proportional to their economic interests, and substantially all of the entity’s activities either involve, or are conducted on behalf of, an investor that has disproportionately few voting rights. The Company consolidates its investment in a VIE when it determines that it is its primary beneficiary. The Company may change its original assessment of a VIE upon subsequent events such as the modification of contractual arrangements that affects the characteristics or adequacy of the entity’s equity investments at risk and the disposition of all or a portion of an interest held by the primary beneficiary.
The Company identifies the primary beneficiary of a VIE as the enterprise that has both: (i) the power to direct the activities of the VIE that most significantly impact the entity’s economic performance; and (ii) the obligation to absorb losses or the right to receive benefits of the VIE that could be significant to the entity. The Company performs this analysis on an ongoing basis. As of December 31, 2015 and 2014, respectively, the Company had no VIEs.
Use of Estimates
The preparation of financial statements in conformity with GAAP requires management to make estimates and assumptions regarding future events that may affect the reported amounts and disclosures in the financial statements. The Company’s estimates are inherently subjective in nature and actual results could differ from these estimates.
Reclassifications
Certain reclassifications have been made to amounts in prior period financial statements to conform to current period presentation. These reclassifications have not changed the previously reported results of operations or stockholders’ equity.
Investments in Real Estate
Operating real estate assets are stated at cost and consist of land and improvements, buildings and improvements, including other capitalizable costs incurred during their possession, renovation and acquisition.
Single-family properties acquired that are not subject to an existing lease are treated as asset acquisitions and, as such, are recorded at their purchase price, including acquisition costs, which is allocated to land and building based upon their relative fair values at the date of acquisition. Fair value is determined under the guidance of Codification Topic, Fair Value Measurements (“ASC 820”), and is primarily based on unobservable data inputs which are categorized as Level 3 valuations. In making estimates of fair values for purposes of allocating the purchase price of individually acquired properties that are not subject to an existing lease, the Company utilizes its own market knowledge and published market data. In this regard, the Company also utilizes information obtained from county tax assessment records to assist in the determination of the fair value of the land and building.
Single-family properties that are acquired either subject to an existing lease or as part of a portfolio level transaction are treated as a business combination under the guidance of Codification Topic, Business Combinations (“ASC 805”), and, as such, are recorded at fair value, assigned to land, building and the existing lease, if applicable, based upon their fair values at the date of acquisition, with acquisition fees and other costs expensed as incurred. The Company engages a third party valuation specialist to assist management in the determination of fair value for purposes of assigning the purchase price of properties acquired as part of portfolio level transactions along with information obtained from county tax assessment records to assist in the determination of the fair value of the land and building. The value of acquired lease related intangibles, if any, is estimated based upon the costs the Company would have incurred to lease the property under similar terms. Such costs are capitalized and amortized over the remaining life of the lease.
The nature of the Company's business requires that in certain circumstances Silver Bay acquires single-family properties subject to existing liens. Liens that the Company expects to be extinguished in cash are estimated and accrued for on the date of acquisition and recorded as a cost of the property.
69
SILVER BAY REALTY TRUST CORP.
NOTES TO THE CONSOLIDATED FINANCIAL STATEMENTS
(amounts in thousands, except share data and property counts)
Building and improvements depreciation is computed on the straight-line basis over the estimated useful lives of the assets. The Company generally uses a 27.5-year estimated life with no salvage value. Depreciation on land improvements is computed on the straight-line basis over the estimated useful lives of the assets, generally 3 to 15 years with no salvage value. Land is not depreciated. The Company considers the value of acquired in-place leases in the allocation of purchase price and the amortization period reflects the average remaining term of each respective in-place acquired lease. The lease periods are generally short-term in nature (one or two years).
The Company incurs costs to prepare certain of its acquired properties to be placed in service. These costs are capitalized and allocated to building improvement costs or land improvement costs as part of such properties’ initial renovation. If the Company acquires a property with an existing lease, the Company capitalizes the cost of the initial renovation of such property following lease expiration and resident move out. Expenditures for ordinary maintenance and repairs are expensed to operations as incurred and expenditures for significant capital expenditures that improve the asset and extend the useful life of the asset are capitalized and depreciated over their remaining useful life.
The Company evaluates its long-lived assets for indicators of impairment periodically or whenever events or changes in circumstances indicate that an asset’s carrying amount may not be recoverable. The judgments regarding the existence of impairment indicators are based on factors such as operational performance, market conditions and the Company’s ability to hold, and its intent with regard to, each asset. If an impairment indicator exists, the Company compares the expected future undiscounted cash flows against the carrying amount of the asset. If the sum of the estimated undiscounted cash flows is less than the carrying amount of the asset, the Company records an impairment loss for the difference between the estimated fair value and the carrying amount of the asset.
Single-Family Properties Held for Sale and Discontinued Operations
Single-family properties are classified as held for sale when they meet the applicable GAAP criteria, including, but not limited to, being listed for sale and the home is in present condition for immediate sale, the existence of an active program to locate a buyer and the probable sale of the home within one year. Upon identification as held for sale, the property is subject to the Company’s impairment test and an impairment loss is immediately recognized when the estimated fair value, less costs to sell, is less than the carrying amount of the asset. The property is then marketed for sale and classified as held for sale in the consolidated financial statements. Depreciation ceases to be recorded upon designation of an asset as held for sale. As of December 31, 2015 and 2014, the Company had 98 and 20 single-family properties, respectively, classified as held for sale. These properties did not have material historical operating results under the Company's ownership. At December 31, 2015 and 2014, the Company had $11,184 and $2,010, respectively, of assets held for sale.
For the years ended December 31, 2015, 2014 and 2013, the Company recognized impairment charges of $95, $601 and $792 respectively, classified as other expense on the consolidated statements of operations and comprehensive loss. For the years ended December 31, 2015, 2014 and 2013, the Company recognized a net gain on sale of assets of $4,044, $174 and $114, respectively, classified as net gain on disposition of real estate on the consolidated statements of operations and comprehensive loss.
In 2014, the Financial Accounting Standards Board ("FASB") issued Accounting Standards Update 2014-08, Reporting Discontinued Operations and Disclosures of Disposals of Components of an Entity (“ASU 2014-08”), which raises the threshold for disposals to qualify as discontinued operations. A discontinued operation is defined as: (1) a component of an entity or group of components that has been disposed of or classified as held for sale and represents a strategic shift that has or will have a major effect on an entity’s operations and financial results; or (2) an acquired business that is classified as held for sale on the acquisition date. ASU 2014-08 also requires additional disclosures regarding discontinued operations, as well as material disposals that do not meet the definition of discontinued operations. The application of this guidance is prospective from the date of adoption and applies only to disposals (or new classifications to held for sale) that have not been reported as discontinued operations or held for sale in previously issued financial statements. The Company adopted ASU 2014-08 during the quarter ended March 31, 2015.
Cash
The Company maintains its cash and escrow deposits at financial institutions. The combined account balances at one or more institutions typically exceed the Federal Depository Insurance Corporation ("FDIC") insurance coverage, and, as a
70
SILVER BAY REALTY TRUST CORP.
NOTES TO THE CONSOLIDATED FINANCIAL STATEMENTS
(amounts in thousands, except share data and property counts)
result, there is a concentration of credit risk related to amounts on deposit in excess of FDIC insurance coverage. The Company believes that the risk is not significant, as the Company does not anticipate the financial institutions’ non-performance.
Escrow Deposits
Escrow deposits primarily include cash held in reserve at financial institutions, as required by the Company's debt agreements described in Note 5. In addition, escrow deposits include refundable and non-refundable cash and earnest money on deposit with certain third party property managers for property operating costs and earnest money deposits.
Deferred Lease Costs, Net
Direct and incremental costs incurred by the Company to lease properties are capitalized and amortized over the life of the lease and reflected as deferred lease costs on the consolidated balance sheets. Amortization of leasing costs is included in depreciation and amortization on the consolidated statements of operations and comprehensive loss.
Rent and Other Receivables, Net
The Company maintains an allowance for doubtful accounts for estimated losses that may result from the inability of residents to make required rent or other payments. This allowance is estimated based on payment history and current occupancy status. The Company generally does not require collateral or other security from its residents, other than security deposits. If estimates of collectability differ from the cash received, the timing and amount of the Company’s reported revenue could be impacted.
At December 31, 2015 and 2014, the Company had $978 and $725 in gross rent receivables, respectively, and $164 and $107 in allowances for doubtful accounts, respectively, classified as other assets on the consolidated balance sheets.
For the years ended December 31, 2015, 2014 and 2013, the Company recognized $1,426, $671 and $771 in bad debt expense, respectively, classified as property operating and maintenance on the consolidated statements of operations and comprehensive loss.
Fair Value of Financial Instruments, Including Derivative Instruments
The valuation of financial instruments requires the Company to make estimates and judgments that affect the fair value of the instruments. The Company, where possible, bases the fair values of its financial instruments, including its derivative instruments, on listed market prices and third party quotes. Where these are not available, the Company bases its estimates on current instruments with similar terms and maturities or on other factors relevant to the financial instruments.
In the normal course of business, the Company is exposed to the effect of interest rate changes. The Company seeks to manage these risks through the use of derivatives to hedge interest rate risk on debt instruments.
The Company recognizes derivatives as either assets or liabilities on the consolidated balance sheets and measures those instruments at fair value. In addition, fair value adjustments will affect either accumulated other comprehensive loss (a component of stockholders’ equity) or net income (loss) depending on whether the derivative instruments qualify as a hedge for accounting purposes and, if so, the nature of the hedging activity. The Company does not use derivatives for trading or speculative purposes.
Deferred Financing Costs, Net
Costs incurred in the placement of the Company’s debt are deferred and amortized, as a component of interest expense on the consolidated statements of operations and comprehensive loss, using the effective interest method, or alternative methods that approximate the effective interest method. The costs are amortized over the terms of the related debt, which, where applicable, reflect the intended exercise of renewal options.
71
SILVER BAY REALTY TRUST CORP.
NOTES TO THE CONSOLIDATED FINANCIAL STATEMENTS
(amounts in thousands, except share data and property counts)
Revenue Recognition
Rental income, net of concessions and sales tax, attributable to resident leases is recorded on a straight-line basis over the term of the lease. Leases entered into between residents and the Company for the rental of property units are generally year-to-year and renewable upon consent of both parties on an annual or monthly basis.
The Company recognizes other revenues such as pet fees, late fees, and application fee income when the related fees are earned and are realized or realizable.
The Company recognizes sales of real estate when the sale has closed, title has passed, adequate initial and continuing investment by the buyer is received, possession and other attributes of ownership have been transferred to the buyer, and the Company is not obligated to perform significant additional activities after closing. All of these conditions are typically met at or shortly after closing.
Noncontrolling Interests
The ownership interests in a consolidated subsidiary that are not held by the Company are noncontrolling interests and are reported on the consolidated balance sheets within equity, separately from the Company’s equity. However, securities that are redeemable for cash or other assets at the option of the holder, not solely within the control of the issuer, must be classified outside of permanent equity. This would result in certain outside ownership interests being included as redeemable noncontrolling interests outside of permanent equity in the consolidated balance sheets. The Company makes this determination based on terms in applicable agreements, specifically in relation to redemption provisions. Additionally, with respect to noncontrolling interests for which the Company has a choice to settle the contract by delivery of its own shares, the Company considered the guidance in the Codification Topic, Derivatives and Hedging —Contracts in Entity’s Own Equity (“ASC 815-40”) to evaluate whether it controls the actions or events necessary to issue the maximum number of shares that could be required to be delivered under share settlement of the contract. The Company presents the noncontrolling interest for common Operating Partnership units in the equity section of its consolidated balance sheets.
Net income (loss) is allocated to common Operating Partnership unit holders based on their respective ownership percentage of the Operating Partnership. Such ownership percentage is calculated by dividing the number of common Operating Partnership units held by the common Operating Partnership unit holders by the total Operating Partnership units held by the common Operating Partnership unit holders and the Company. Additional issuance or repurchase of shares of common stock or common Operating Partnership units changes the percentage ownership of both the noncontrolling interests — common Operating Partnership unit holders and the Company. Due in part to the exchange rights (which provide for the redemption of common Operating Partnership units into shares for common stock on a one-for-one basis), such transactions and the proceeds or costs therefrom are treated as capital transactions and result in an allocation between stockholders’ equity and noncontrolling interests to account for the change in the respective percentage ownership of the underlying equity of the Operating Partnership.
At both December 31, 2015 and 2014, the Company had 2,231,511 common Operating Partnership units classified as noncontrolling interests, respectively. As described in Note 10, the 2,231,511 common Operating Partnership units were issued on September 30, 2014 pursuant to the Internalization.
Preferred Stock
The Company accounts for its 10% cumulative redeemable preferred stock in accordance with the Codification Topic, Distinguishing Liabilities from Equity—SEC Materials (“ASC 480-10-S99”). Holders of the Company’s 10% cumulative redeemable preferred stock have certain preference rights with respect to the common stock. Based on the Company’s analysis, the preferred stock has been classified as redeemable interests outside of permanent equity in the mezzanine section of the Company’s consolidated balance sheets as a result of certain redemption requirements or other terms.
Earnings (Loss) Per Share
Basic and diluted earnings (loss) per share are computed by dividing net income (loss) attributable to common stockholders by the weighted average number of common shares and potential common shares outstanding during the years ended December 31, 2015, 2014 and 2013. For both basic and diluted per share calculations, potential common shares represent
72
SILVER BAY REALTY TRUST CORP.
NOTES TO THE CONSOLIDATED FINANCIAL STATEMENTS
(amounts in thousands, except share data and property counts)
issued and unvested shares of restricted stock, which have full rights to the common stock dividend declarations of the Company. The common Operating Partnership units are excluded from the calculation of earnings (loss) per share as their inclusion would not be dilutive.
Equity Incentive Plan
The Company adopted an equity incentive plan which provides incentive compensation to attract and retain qualified directors, officers, advisors, consultants and other personnel of the Company. The plan permits the granting of stock options, restricted shares of common stock, restricted stock units, phantom shares, dividend equivalent rights, or other equity-based awards. The equity incentive plan is administered by the compensation committee of the Company’s board of directors.
The cost of restricted shares of common stock awarded to independent directors is based on the price of the Company’s stock as of the date of grant, in accordance with Codification Topic, Compensation - Stock Compensation (“ASC 718”). Prior to the Internalization, the cost of equity awards to employees of the Former Manager and the Former Manager’s operating subsidiary were measured at each reporting date based on the price of the Company’s stock as of period end, in accordance with Codification Topic, Equity (“ASC 505”). On the date of the Internalization, the employees of the Former Manager and the Former Manager's operating subsidiary became employees of the Company and the Company fixed the measurement of the awards to the respective employees to the stock price as of such date in accordance with ASC 718. The respective awards will not be subsequently remeasured and future awards to employees, subsequent to the Internalization, will be measured based on the price of the Company's stock as of the date of grant in accordance with ASC 718. All equity awards are amortized ratably over the applicable service period.
The Company recognizes compensation expense for performance stock units ("PSUs") based on the grant-date fair value and the service period of the respective awards. These units represent shares potentially issuable in the future based upon the Company's stock performance over a three-year performance period. Fair value of the PSUs are estimated using a Monte-Carlo simulation model.
Income Taxes
The Company has elected to be taxed as a REIT under the Internal Revenue Code ("the Code") and the corresponding provisions of state law. To qualify as a REIT, the Company must distribute at least 90% of its annual REIT taxable income to stockholders (not including taxable income retained in its taxable subsidiaries) within the time frame set forth in the Code and the Company must also meet certain other requirements. In addition, because certain activities, if performed by the Company, may cause the Company to earn income which is not qualifying for the REIT gross income tests, the Company formed or acquired TRS entities, as defined in the Code, to engage in such activities. These TRS activities are subject to both federal and state income taxes on any taxable income of such entities after consideration of any net operating losses, as well as any REIT taxable income not distributed to stockholders.
The Company assesses its tax positions for all open tax years and determines whether the Company has any material unrecognized liabilities in accordance with Codification Topic, Income Taxes (“ASC 740”). The Company records these liabilities to the extent the Company deems them more likely than not to be incurred. The Company classifies interest and penalties on material uncertain tax positions as income tax expense, on its consolidated statements of operations and comprehensive loss.
Deferred Tax Assets and Liabilities
Income recognition for GAAP and tax differ in certain respects. These differences often reflect differing accounting treatments for tax and GAAP, such as differing basis on capitalized assets, differing treatment for certain acquired assets and real estate asset impairments and the timing of expense recognition for certain accrued liabilities and net operating losses. Some of these differences are temporary in nature and create timing mismatches between when taxable income is earned and the tax is paid versus when the GAAP income is recognized and the tax provision is recorded. Some of these differences are permanent since certain income (or expense) may be recorded for tax but not for GAAP (or vice-versa). One such significant permanent difference is the Company’s ability as a REIT to deduct dividends paid to stockholders as an expense for tax, but not for GAAP. The Company's deferred tax assets also include net operating losses generated or acquired.
73
SILVER BAY REALTY TRUST CORP.
NOTES TO THE CONSOLIDATED FINANCIAL STATEMENTS
(amounts in thousands, except share data and property counts)
As a result of these temporary differences, the Company’s TRS entities, may recognize taxable income in periods prior or subsequent to when it recognizes income for GAAP. When this occurs, the TRS will pay or defer the tax liability and establish deferred tax assets or deferred tax liabilities, respectively, for GAAP.
As income previously taxed is subsequently realized in future periods under GAAP, the deferred tax asset is reversed and a tax expense is recognized. Alternatively, as income previously recognized for GAAP is subsequently realized in future periods for tax, the deferred tax liability is reversed and a tax benefit is recognized. To date, the Company’s deferred tax assets and/or liabilities are generated solely by differences in GAAP and taxable income from the TRS entities. GAAP and tax differences in the REIT may create additional deferred tax assets to the extent the Company does not distribute all of its taxable income.
A valuation allowance is provided if the Company believes it is more likely than not that all or some portion of deferred tax assets will not be realized. Any increase or decrease in the valuation allowance that results from a change in circumstances and that causes the Company to change judgment about the realizability of the related deferred tax asset is included in the provision when such changes occur.
Segment reporting
In accordance with Codification Topic, Segment Reporting ("ASC 280"), the Company has determined that it has one reportable segment with activities related to leasing and operating single-family homes as rental properties. The Company's properties are geographically dispersed and management evaluates operating performance at the market level and while each market and its properties are unique, the aggregate market portfolios have similar economic interests and operating performance. The distribution of the properties throughout the United States reflects the Company's belief that geographic diversification helps insulate the portfolio from regional economic influences.
Recent Accounting Pronouncements
Under the Jumpstart Our Business Startups Act (the "JOBS Act") the Company meets the definition of an “emerging growth company.” The Company has irrevocably elected to opt out of the extended transition period for complying with new or revised U.S. accounting standards pursuant to Section 107(b) of the JOBS Act. As a result, the Company will comply with new or revised accounting standards on the relevant dates on which adoption of such standards is required for non-emerging growth companies.
The Company considers the applicability and impact of all accounting standard updates ("ASUs"). ASUs not listed below were assessed and determined to be either not applicable or are expected to have minimal impact on the Company's consolidated financial position or results of operations.
In May 2014, the FASB issued ASU 2014-09, Revenue from Contracts with Customers, which creates a new Topic, Accounting Standards Codification Topic 606. The standard is principle-based and provides a five-step model to determine when and how revenue is recognized. The core principle is that a company should recognize revenue when it transfers promised goods or services to customers in an amount that reflects the consideration to which the company expects to be entitled in exchange for those goods or services. This standard is effective for interim or annual periods beginning after December 15, 2017 and allows for either full retrospective or modified retrospective adoption. Early adoption of this standard is only allowed as of the original effective date, annual periods beginning after December 15, 2016. The Company is currently evaluating the impact the adoption of Topic 606 will have on its consolidated financial statements.
In February 2015, the FASB issued ASU 2015-02, Amendments to the Consolidation Analysis. This update is intended to improve targeted areas of consolidation guidance by simplifying the consolidation evaluation process, and by placing more emphasis on risk of loss when determining a controlling financial interest. The provisions of this ASU are effective for interim and annual periods beginning after December 15, 2015. The adoption of this standard is not expected to have a material impact on the Company's financial statements.
In April 2015, the FASB issued ASU 2015-03, Simplifying the Presentation of Debt Issuance Costs, which changes the presentation of debt issuance costs for term debt in financial statements. ASU 2015-03 requires an entity to present such costs in the balance sheet as a direct deduction from the related debt liability rather than as an asset. Amortization of the costs will continue to be reported as interest expense. ASU 2015-03 is effective for annual reporting periods beginning after December 15,
74
SILVER BAY REALTY TRUST CORP.
NOTES TO THE CONSOLIDATED FINANCIAL STATEMENTS
(amounts in thousands, except share data and property counts)
2015. Early adoption is permitted. The new guidance will be applied retrospectively to each prior period presented. The impact will be a reduction of other assets and the associated reported debt liability related to the securitization loan.
Note 3. Investment in Real Estate
Acquisition of The American Home Real Estate Investment Trust, Inc. Portfolio
During the year ended December 31, 2015, the Company acquired a portfolio of 2,461 properties from TAH. The aggregate purchase price for the Portfolio Acquisition was $263,000 and was substantially completed on April 1, 2015. The Portfolio Acquisition was financed using proceeds obtained under the Company's revolving credit facility, which was amended and restated on February 18, 2015 to increase the borrowing capacity to $400,000 from $200,000 (see Note 5). The homes are primarily located in Atlanta, GA, Charlotte, NC, Tampa, FL, and Orlando, FL.
The purchase price included a holdback of $7,890, which is held by a third-party escrow agent on TAH's behalf under the terms of an escrow agreement and will be used to satisfy any claims by the Company made within 15 months of the closing date, including for breach by TAH or certain of its subsidiaries under the purchase agreement.
The Company also incurred $2,064 in transaction expenses associated with the Portfolio Acquisition in the year ended December 31, 2015. These costs are expensed as incurred in accordance with ASC 805 and are included in portfolio acquisition expense in the consolidated statements of operations and comprehensive loss.
The following table summarizes the acquisition date fair values of the assets and liabilities acquired as part of the Portfolio Acquisition:
Land and land improvements | $ | 55,684 | |
Buildings and improvements | 207,316 | ||
Estimated fair value of assets and liabilities acquired | $ | 263,000 | |
These allocations are subject to revision within the measurement period, not to exceed one year from the date of the Portfolio Acquisition.
Since the date of the Portfolio Acquisition, the Company has consolidated the 2,461 properties acquired as part of the transaction and the related results of these operations are reflected in the Company's consolidated financial statements.
Total revenue and net income (loss) attributable to the Portfolio Acquisition that was included in the Company's consolidated statements of operations and comprehensive loss from the date of acquisition through December 31, 2015 were $19,919 and $(3,909), respectively.
75
SILVER BAY REALTY TRUST CORP.
NOTES TO THE CONSOLIDATED FINANCIAL STATEMENTS
(amounts in thousands, except share data and property counts)
The following table illustrates the effect on net loss and loss per share - basic and diluted as if the Company had completed the Portfolio Acquisition on January 1, 2014:
Year Ended December 31, | ||||||||
2015 | 2014 | |||||||
Revenue (1) | $ | 120,309 | $ | 101,868 | ||||
Net loss (1) (2) (3) | $ | (10,076 | ) | $ | (70,754 | ) | ||
Net loss attributable to common shareholders (1) (2) (3) | $ | (9,599 | ) | $ | (70,711 | ) | ||
Loss per share - basic and diluted (1) (2) (3) | $ | (0.27 | ) | $ | (1.85 | ) | ||
Weighted average common shares outstanding | 36,209,999 | 38,119,971 | ||||||
(1) The unaudited pro forma information includes revenue and operating expenses based on the historical operations of TAH as well as the Company and does not purport to be indicative of what the Company's operating results would have been had the Portfolio Acquisition occurred on January 1, 2014.
(2) Assumes portfolio acquisition expense for the year ended December 31, 2015 had been incurred on January 1, 2014, and thus is included in the year ended December 31, 2014.
(3) Includes net gain on disposition of real estate as noted in the consolidated statements of operations and comprehensive loss.
Sale of Real Estate Assets
During the year ended December 31, 2015, the Company sold its Houston portfolio along with certain other properties for an aggregate sales price of $29,223, resulting in an aggregate net gain of $4,044, which has been classified as net gain on disposition of real estate in the consolidated statements of operations and comprehensive loss. In connection with these asset sales, certain debt repayments were made that are more fully described in Note 5. In accordance with ASC 2014-08, the disposals were not considered a discontinued operation. Any holding costs associated with homes being sold are reflected within held for sale expenses and are classified as other expense in the consolidated statements of operations and comprehensive loss.
During the year ended December 31, 2014 and 2013, the Company sold certain properties for an aggregate sales price of $5,979 and $5,939, respectively, resulting in an aggregate net gain of $174 and $114, respectively.
Note 4. Income Taxes
For the years ended December 31, 2015, 2014 and 2013, the Company believes that it qualified to be taxed as a REIT under the Code for U.S. federal income tax purposes. As long as the Company qualifies as a REIT, the Company generally will not be subject to U.S. federal income taxes on its taxable income to the extent it annually distributes its net taxable income to stockholders, does not engage in prohibited transactions, and maintains its intended qualification as a REIT. The majority of states also recognize the Company’s REIT status, and as such, the Company has generally only incurred certain state franchise taxes. The TRS entities are subject to all applicable federal, state and local income, excise and franchise taxes. The Company’s TRS entities file separate tax returns and are fully taxed as standalone U.S. corporations. Certain activities the Company performs may produce income which will not be qualifying income for REIT purposes. The Company has designated the TRS entities to engage in these activities to mitigate any negative impact on the Company’s REIT status.
76
SILVER BAY REALTY TRUST CORP.
NOTES TO THE CONSOLIDATED FINANCIAL STATEMENTS
(amounts in thousands, except share data and property counts)
The following table summarizes the tax (benefit) provision recorded at the taxable subsidiary level for the years ended December 31, 2015, 2014 and 2013.
Year Ended December 31, | |||||||||||
2015 | 2014 | 2013 | |||||||||
Current tax (benefit) provision: | |||||||||||
Federal | $ | 19 | $ | — | $ | — | |||||
State and local | 184 | — | — | ||||||||
Total current tax (benefit) provision | 203 | — | — | ||||||||
Deferred tax (benefit) expense (1) | (246 | ) | (201 | ) | (864 | ) | |||||
Valuation allowance | (715 | ) | 201 | 864 | |||||||
Income tax (benefit) expense | $ | (758 | ) | $ | — | $ | — | ||||
_______________
(1) | In addition to the deferred tax benefit generated for the year ended December 31, 2014, the Company acquired $486 of deferred tax assets in connection with the Internalization transaction. |
The following is a reconciliation of the Company’s statutory federal and state rates to the effective rates, for the years ended December 31, 2015, 2014 and 2013.
Year Ended December 31, | |||||||||||
2015 | 2014 | 2013 | |||||||||
Amount | Amount | Amount | |||||||||
Computed income tax (benefit) expense at federal rate | $ | (3,749 | ) | $ | (19,277 | ) | $ | (8,346 | ) | ||
State and local tax, net of federal expense (benefit) | 101 | (21 | ) | (20 | ) | ||||||
Permanent differences in taxable income from GAAP income | 60 | 7 | — | ||||||||
Valuation allowance | (628 | ) | 120 | 110 | |||||||
Tax at statutory rate on earnings not subject to federal income tax | 3,458 | 19,171 | 8,256 | ||||||||
(Benefit) expense from income taxes | $ | (758 | ) | $ | — | $ | — | ||||
The Company’s consolidated balance sheets as of December 31, 2015 and 2014 contained the following current and deferred tax assets and liabilities, which are included in other assets and are recorded at the taxable subsidiary level.
December 31, 2015 | December 31, 2014 | ||||||
Current tax (payable) receivable | |||||||
Federal income tax payable | $ | (19 | ) | $ | — | ||
State and local income tax payable | (3 | ) | — | ||||
Current tax (payable) receivable, net | (22 | ) | — | ||||
Deferred tax assets (liabilities) | |||||||
Deferred tax asset | 1,923 | 1,551 | |||||
Deferred tax liability | (126 | ) | — | ||||
Deferred tax asset, net | 1,797 | 1,551 | |||||
Valuation allowance | (836 | ) | (1,551 | ) | |||
Total tax asset, net | $ | 939 | $ | — | |||
The cost basis of land and depreciable property, net of accumulated depreciation, for federal income tax purposes as of December 31, 2015 and 2014 was $1,141,531 and $931,770, respectively (unaudited).
Deferred tax assets and liabilities applicable to the TRS entities are recognized for future tax consequences attributable to differences between the financial statement carrying amounts of existing assets and liabilities and their respective tax bases.
77
SILVER BAY REALTY TRUST CORP.
NOTES TO THE CONSOLIDATED FINANCIAL STATEMENTS
(amounts in thousands, except share data and property counts)
These assets and liabilities are measured using enacted tax rates for which the temporary differences are expected to be recovered or settled. The effects of changes in tax rates on deferred tax assets and liabilities are recognized in earnings in the period enacted. Similarly, deferred income tax assets and liabilities are recorded at the date of contribution to the TRS entities to reflect the tax benefit/detriment on the movement of assets from the non-taxed REIT to the taxable TRS entities. The TRS entities deferred tax assets and liabilities are generally the result of differing basis on capitalized assets, the timing of expense recognition for certain accrued liabilities, real estate asset impairments and net operating losses. In addition, during calendar year 2014, the Company recognized deferred tax assets assumed in the Internalization, which relate to net operating losses and differences in GAAP and tax treatment of assets acquired from the third-party property manager in Tampa (refer to Note 10 for descriptions of these transactions). As of December 31, 2015 and 2014, the TRS entities have recorded net deferred tax assets of $1,797 and $1,551, respectively. Certain TRS entities have a history of operating losses and as a result, historically resulted in a full valuation allowance for their deferred tax assets. As of December 31, 2015, the Company determined it was more likely than not that certain deferred tax assets, including certain net operating loss carryforwards, would be realized. In making this determination, the Company analyzed, among other things, its recent history of earnings from certain sales of depreciable property and forecasts of future taxable earnings. The reversal of the deferred tax asset valuation resulted in an income tax benefit of $964 during the year ended December 31, 2015, which is reported as income tax benefit, net on the consolidated statement of operations and comprehensive loss and an offsetting asset of the same amount is included in other assets on the consolidated balance sheets.
The Company’s TRS entities have approximately $3,900 and $2,700, respectively, of net operating loss carry-forwards available as of December 31, 2015 and 2014 that will expire between December 31, 2032 and December 31, 2035.
Based on the Company’s evaluation, it has concluded that there are no significant uncertain tax positions requiring recognition in the Company’s financial statements of a contingent tax liability for uncertain tax positions. None of the Company’s consolidated entities are currently under federal or state audit for the years ended December 31, 2015, 2014 and 2013, but these years remain subject to examination by the applicable tax jurisdictions. Additionally, there were no amounts accrued for penalties or interest as of or during the periods presented in the consolidated financial statements.
During the years ended December 31, 2015, 2014 and 2013 the Company’s tax treatment of dividends and distributions per share were as follows:
Year Ended December 31, | |||||||||||
2015 | 2014 | 2013 | |||||||||
Tax treatment of dividends and distributions: | |||||||||||
Ordinary dividends | $ | — | $ | — | $ | — | |||||
Long-term capital gains | — | — | — | ||||||||
Nondividend distributions (return of capital) | 0.46 | 0.16 | 0.04 | ||||||||
Dividends and distributions declared per common share/unit outstanding | $ | 0.46 | $ | 0.16 | $ | 0.04 | |||||
Note 5. Debt
Securitization Loan
On August 12, 2014, the Company completed a securitization transaction (the "Securitization Transaction") in which it received gross proceeds of $311,164, net of an original issue discount of $1,503 and before issuance costs and reserves. The Securitization Transaction involved the issuance and sale of six classes of single-family rental pass-through certificates (the "Certificates") that represent beneficial ownership interests in a loan secured by 3,084 single-family properties (the "Securitization Properties") sold to one of the Company's affiliates from its portfolio. In the Securitization Transaction, the Company sold $312,667 of Certificates, with a blended effective interest rate of the London Interbank Offered Rate ("LIBOR") plus 1.92%, inclusive of the amortization of the original issue discount (described below), plus monthly servicing fees of 0.1355% per tranche. The original issue discount will be accreted and recognized to interest expense through the fully extended maturity date of September 9, 2019. As described further below, the Company entered into an interest rate cap agreement for the initial two-year term of the loan and a separate forward-starting interest rate cap agreement for the three, 12-month extension options.
78
SILVER BAY REALTY TRUST CORP.
NOTES TO THE CONSOLIDATED FINANCIAL STATEMENTS
(amounts in thousands, except share data and property counts)
As part of the Securitization Transaction, a newly-formed special purpose entity (the "Borrower") entered into a loan agreement (the "Securitization Loan"). The Borrower is wholly owned by another special purpose entity (the "Equity Owner") and the Equity Owner is wholly owned by the Operating Partnership. The Securitization Loan was subsequently deposited into a trust in exchange for the Certificates. The Certificates represent the entire beneficial interest in the trust and were sold in a private offering through the placement agent retained for the transaction. The certificates were offered and sold under Rule 144A and Regulation S under the Securities Act of 1933, as amended.
The Securitization Loan has an initial term of two years, with three, 12-month extension options, resulting in a fully extended maturity date of September 9, 2019. The Borrower may execute the extension options provided there is no event of default under the Securitization Loan, the Borrower obtains a replacement interest rate cap agreement in a form reasonably acceptable to the lender and the Borrower complies with the other terms set forth in the loan agreement.
At closing, the Company transferred the Securitization Properties to the Borrower. The Securitization Properties are substantially similar to the other properties owned by the Company and were leased to residents underwritten on substantially the same basis as the Company's other properties. During the duration of the Securitization Loan, the Company can substitute properties only if a property owned by the Borrower becomes a disqualified property under the terms of the Securitization Loan. The lender immediately transferred the Securitization Loan, upon closing, to a subsidiary of the Company and then to a trust in exchange for the Certificates. The Company accounted for the transfer of the Securitization Loan from its subsidiary to the trust as a sale under Codification Topic, Transfers and Servicing ("ASC 860"), with no resulting gain or loss as the Securitization Loan was both originated by the lender and immediately transferred at the same fair market value. The Company has also evaluated and not identified any variable interests in the trust.
The Company used $235,160 of the Securitization Loan proceeds to pay down the full balance of the Company's revolving credit facility at closing and the remaining proceeds were used for working capital and other corporate purposes, including the acquisition, financing and renovation of properties and the repurchase of common stock. Simultaneously, the Company reduced the size of the revolving credit facility from $350,000 to $200,000. As a result, the Company wrote off $1,058 of deferred financing fees and reclassified $480 from accumulated other comprehensive loss to ineffectiveness of interest rate cap agreements due to hedge ineffectiveness in the associated interest rate cap agreements during 2014.
During the year ended December 31, 2015, the Company paid down $7,085 on the Securitization Loan to effect the release of certain properties from the first priority mortgages securing the Securitization Loan, including those properties in the Houston portfolio as described in Note 3. As of December 31, 2015, the Securitization Loan was secured by 3,011 properties.
The Securitization Loan requires monthly payments of interest and is comprised of six floating rate components computed based on one month LIBOR for each interest period plus a fixed component spread for each of the six components, resulting in a blended effective interest rate of LIBOR plus 1.94% at December 31, 2015, inclusive of the amortization of the original issue discount, plus monthly servicing fees of 0.1355%. The change in the blended effective interest rate at December 31, 2015 as compared to the date of issuance is as a result of the pay down noted above. The principal amount of each component of the loan corresponds to the respective class of the Certificates. In connection with entering into the loan, the Company recorded $311,164 as securitization loan in the accompanying consolidated balance sheets. The original issue discount (the difference between the $312,667 balance of certificates sold and the gross proceeds of $311,164) will be accreted and recognized to interest expense through the fully extended maturity date of September 9, 2019. In the years ended December 31, 2015 and 2014, the Company incurred gross interest expense of $6,791 and $2,594, excluding amortization of the discount, deferred financing costs and other fees and before the effect of capitalizing interest related to property renovations. As of December 31, 2015 and 2014, the loan had a weighted-average interest rate of 2.30% and 2.11%, respectively, which is inclusive of the monthly servicing fees, but excludes amortization of the original issue discount and deferred financing costs.
All amounts outstanding under the Securitization Loan are secured by first priority mortgages on the Securitization Properties in addition to the equity interests in, and certain assets of, the Borrower. The amounts outstanding under the Securitization Loan and certain obligations contained therein are guaranteed by the Operating Partnership only in the case of certain bad acts (including bankruptcy) as outlined in the transaction documents. The Borrower and Equity Owner are separate legal entities, but continue to be reported in the Company’s consolidated financial statements. As long as the Securitization Loan is outstanding, the assets of the Borrower and Equity Owner are not available to satisfy the debts and obligations of the Company or its other consolidated subsidiaries and the liabilities of the Borrower and Equity Owner are not liabilities of the Company (excluding, for this purpose, the Borrower and Equity Owner) or its other consolidated subsidiaries. The Company is
79
SILVER BAY REALTY TRUST CORP.
NOTES TO THE CONSOLIDATED FINANCIAL STATEMENTS
(amounts in thousands, except share data and property counts)
permitted to receive distributions from the Borrower out of unrestricted cash as long as the Borrower is current with all payments and in compliance with all other obligations under the Securitization Loan.
The Securitization Loan provides for the restriction of cash whereby the Company must set aside funds for payment of property taxes, capital expenditures and other reserves associated with the Securitization Properties. As of December 31, 2015 and 2014, the Company had $2,281 and $4,635 included in escrow deposits associated with the required reserves. The Securitization Loan does not contractually restrict the Company's ability to pay dividends but certain covenants contained therein may limit the amount of cash available for distribution. The Securitization Loan documents require the Company to maintain certain covenants, including a minimum debt yield on the Securitization Properties, and contain customary events of default for a loan of this type, including payment defaults, covenant defaults, breaches of representations and warranties, bankruptcy and insolvency, judgments and cross-default with certain other indebtedness. In the event of default, the lender may apply funds, as the lender elects, from a cash management account controlled by the lender for the collection of all rents and cash generated by the Borrower's properties, foreclose on its security interests, appoint a new property manager, and in limited circumstances, enforce the Company's guaranty. As of December 31, 2015 and 2014, the cash management account had a balance of $2,858 and $3,542 classified as escrow deposits on the consolidated balance sheets. As of December 31, 2015 and 2014, the Company believes it was in compliance with all financial covenants.
Revolving Credit Facility
Certain of the Company's subsidiaries have a revolving credit facility (the"revolving credit facility") with a syndicate of banks. On January 16, 2014, the revolving credit facility was amended to increase the borrowing capacity to $350,000 from $200,000. As noted above, in connection with the closing of the Securitization Transaction on August 12, 2014, the borrowing capacity of the revolving credit facility was reduced to $200,000 as of such date. On February 18, 2015, the Company amended and restated the revolving credit facility to increase the borrowing capacity to $400,000 from $200,000 and subsequently amended the revolving credit facility to address certain interest calculation mechanics. As amended, the revolving credit facility bears interest at a varying rate of LIBOR plus 300 basis points with a LIBOR floor of 0.0%. Prior to the amendment, the revolving credit facility bore interest at varying rates of LIBOR plus 3.5% subject to a LIBOR floor of 0.5%, payable monthly. The Company is also required to pay a monthly fee on the unused portion of the revolving credit facility at a rate of 0.5% per annum, when the balance outstanding is less than $200,000, or 0.3% per annum when the balance outstanding is equal to or greater than $200,000. As part of the amendment, the term of the revolving credit facility was extended to February 18, 2018 and the advance rate for borrowings was increased to 65% from 55%. The advance rate is based on the aggregate value of the eligible properties which value is calculated as the lesser of (a) the third-party broker price opinion value or (b) the original purchase price plus certain renovation and other capitalized costs of the properties. The Company used proceeds from the revolving credit facility to fund the Portfolio Acquisition. The remaining proceeds were used for working capital and other corporate purposes, including the acquisition, financing and renovation of properties.
As of December 31, 2015 and 2014, $326,472 and $67,096, respectively, was outstanding under the revolving credit facility. During the year ended December 31, 2015, the Company paid down $22,587 on the revolving credit facility, in part to effect the release of certain properties, including those properties in the Houston portfolio as described in Note 3. As of December 31, 2015 and 2014, the interest rate on the revolving credit facility was 3.6% and 4.0%, respectively. In the years ended December 31, 2015, 2014 and 2013, the Company incurred $9,843, $6,073 and $3,164, respectively, in gross interest expense on the revolving credit facility, excluding amortization of deferred financing costs and before the effect of capitalizing interest related to property renovations.
All amounts outstanding under the revolving credit facility are collateralized by the equity interests and assets of certain of the Company’s subsidiaries ("Pledged Subsidiaries"), which exclude the owners of the Securitization Properties. The amounts outstanding under the revolving credit facility and certain obligations contained therein are guaranteed by the Company and the Operating Partnership only in the case of certain bad acts (including bankruptcy) and up to $20,000 for completion of certain property renovations, as outlined in the credit documents. As of December 31, 2015, there were 5,894 properties pledged as collateral under the revolving credit facility.
The Pledged Subsidiaries are separate legal entities, but continue to be reported in the Company’s consolidated financial statements. As long as the revolving credit facility is outstanding, the assets of the Pledged Subsidiaries are not available to satisfy the other debts and obligations of the other Pledged Subsidiaries or the Company. However, the Company is permitted to receive distributions from the Pledged Subsidiaries as long as the Company and the Pledged Subsidiaries are current with all payments and in compliance with all other obligations under the revolving credit facility.
80
SILVER BAY REALTY TRUST CORP.
NOTES TO THE CONSOLIDATED FINANCIAL STATEMENTS
(amounts in thousands, except share data and property counts)
The revolving credit facility does not contractually restrict the Company’s ability to pay dividends but certain covenants contained therein may limit the amount of cash available for distribution. For example, in the final year of the revolving credit facility, all cash generated by the properties in the Pledged Subsidiaries must be used to pay down the principal amount outstanding under the revolving credit facility. The revolving credit facility requires the Company to meet certain quarterly financial tests pertaining to net worth, total liquidity, debt yield and debt service coverage ratios, as defined by the agreement. The Company must maintain, as defined by the agreement, total liquidity of $25,000 and a net worth of at least $125,000, as determined in accordance with the revolving credit facility agreement. The Company believes it was in compliance with all financial covenants under the revolving credit facility as of December 31, 2015 and 2014. The revolving credit facility also provides for the restriction of cash whereby the Company must set aside funds for payment of insurance, property taxes and certain property operating and maintenance expenses associated with properties in the Pledged Subsidiaries' portfolios. As of December 31, 2015 and 2014, the Company had $10,101 and $6,457, respectively, included in escrow deposits associated with the required reserves. The revolving credit facility also contains customary events of default for a facility of this type, including payment defaults, covenant defaults, breaches of representations and warranties, bankruptcy and insolvency, judgments, change of control and cross-default with certain other indebtedness.
Total Borrowings
As of December 31, 2015, the Company had total outstanding borrowings of $630,352, of which borrowings under the Securitization Loan were $303,880 and borrowings under the revolving credit facility was $326,472.
The following table summarizes the Company's contractual maturities of debt as of December 31, 2015 (in thousands):
2016 | $ | — | |
2017 | — | ||
2018 | 326,472 | ||
2019 | 303,880 | ||
2020 | — | ||
Thereafter | — | ||
Total | $ | 630,352 | |
The revolving credit facility was amended and restated on February 18, 2015 and has a new maturity date of February 18, 2018. The Securitization Loan has an initial maturity date of September 9, 2016 and three, 12-month extension options resulting in a fully extended maturity date of September 9, 2019; this table assumes the exercise of the three extension options, which is the Company's intent.
Deferred Financing Costs
Costs incurred in the placement of the Company’s debt are being amortized using the straight-line method, which approximates the effective interest method, over the terms of the related debt. Amortization of deferred financing costs is recorded as interest expense in the accompanying consolidated statements of operations and comprehensive loss.
In connection with its Securitization Loan, the Company incurred deferred financing costs of $460 and $11,040 for the years ended December 31, 2015 and 2014, respectively. The costs are being amortized through September 9, 2019, the fully extended maturity date of the Securitization Loan. Amortization of the deferred financing costs was $2,321 and $865 for the years ended December 31, 2015 and 2014, respectively. In conjunction with the paydown of the Securitization Loan related to the sale of the Houston portfolio, the Company wrote off $174 in deferred financing costs for the year ended December 31, 2015, which has been included in net gain on disposition of real estate in the consolidated statements of operations and comprehensive loss.
In connection with its revolving credit facility, the Company incurred deferred financing costs of $5,323 and $1,852, respectively, for the years ended December 31, 2015 and 2014. Amortization of the deferred financing costs was $2,141, $1,691 and $815, respectively, for the years ended December 31, 2015, 2014 and 2013.
81
SILVER BAY REALTY TRUST CORP.
NOTES TO THE CONSOLIDATED FINANCIAL STATEMENTS
(amounts in thousands, except share data and property counts)
Interest Rate Cap Agreements
The variable rate of interest on the Company's debt exposes the Company to interest rate risk. The Company seeks to manage this risk through the use of interest rate cap agreements.
As of December 31, 2014, the Company held four interest rate cap agreements, which included three interest rate cap agreements with an aggregate notional amount of $245,000, LIBOR caps of 3.00%, and termination dates of May 10, 2016 associated with the revolving credit facility, and one interest rate cap agreement with a notional amount of $312,667, a LIBOR cap of 3.1085%, and a termination date of September 15, 2016 associated with the Securitization Loan. The first two interest rate cap agreements, with an aggregate notional amount of $170,000, were purchased in the third quarter of 2013, at an aggregate purchase price of $533. On February 5, 2014, the Company entered into a third interest rate cap agreement with a notional amount of $75,000 at a purchase price of $100. On August 6, 2014, the Company entered into the interest rate cap agreement associated with the Securitization Loan at a purchase price of $293. Portions of the purchase prices of the interest rate cap agreements, representing the premiums paid to enter into the contracts, were capitalized as deferred financing costs and were being amortized using the straight-line method over the terms of the related agreements. The Company determined that the interest rate caps qualified for hedge accounting and, therefore, were designated as cash flow hedges with future changes in fair value recognized through other comprehensive loss (see Note 11). Ineffectiveness was calculated as the amount by which the change in fair value of the derivatives exceeds the change in the fair value of the anticipated cash flows related to the corresponding debt.
In connection with the pay-down of the revolving credit facility on August 12, 2014, the Company de-designated the interest rate cap agreements associated with the revolving credit facility as cash flow hedges and reclassified the balance of deferred losses, associated with the three interest rate cap agreements, in accumulated other comprehensive loss to earnings.
On January 28, 2015, the Company entered into a forward-starting interest rate cap agreement associated with the Securitization Loan at a purchase price of $1,383. The interest rate cap has an effective date of September 15, 2016, a termination date of September 15, 2019, a notional amount of $200,000, and a LIBOR cap rate of 3.1085%. The Company designated the new interest rate cap as a cash flow hedge as it is the Company's intent to exercise the renewal options of the Securitization Loan through the fully extended maturity date in September 2019.
In conjunction with the amendment to the revolving credit facility executed on February 18, 2015, the Company sold the existing interest rate cap agreements associated with such facility for an aggregate sales price of $4 and entered into a new interest rate cap agreement with a notional amount of $83,000, a LIBOR cap of 3.0% and a termination date of February 17, 2018, at a purchase price of $272.
On March 31, 2015, the Company entered into an interest rate cap associated with the revolving credit facility at a purchase price of $595. The interest rate cap has an effective date of March 31, 2015, a termination date of February 18, 2018, a notional amount of $266,100, and a LIBOR cap rate of 3.0%.
The Company determined that the interest rate caps purchased in the year ended ended December 31, 2015 qualify for hedge accounting and, therefore, designated the derivatives as cash flow hedges with future changes in fair value recognized through other comprehensive loss (see Note 11). Ineffectiveness is calculated as the amount by which the change in fair value of the derivatives exceeds the change in the fair value of the anticipated cash flows related to the corresponding debt and is recorded in ineffectiveness of interest rate cap agreements in the consolidated statements of operations and comprehensive loss.
As of December 31, 2015, the Company held one interest rate cap agreement with a notional amount of $312,667, a LIBOR cap of 3.1085%, and a termination date of September 15, 2016 associated with the Securitization Loan and one forward-starting interest rate cap agreement with a notional amount of $200,000, a LIBOR cap of 3.1085%, and a termination date of September 15, 2019.
As of December 31, 2015, the Company held two interest rate cap agreements with an aggregate notional amount of $349,100, LIBOR caps of 3.00%, and termination dates of February 17, 2018 and February 18, 2018, respectively, associated with the revolving credit facility.
82
SILVER BAY REALTY TRUST CORP.
NOTES TO THE CONSOLIDATED FINANCIAL STATEMENTS
(amounts in thousands, except share data and property counts)
Capitalized Interest
The Company capitalizes interest for properties undergoing renovation activities and purchased subsequent to the Company obtaining debt in May 2013. Capitalized interest totaled $311, $858 and $1,068, respectively, for the years ended December 31, 2015, 2014 and 2013.
Note 6. Equity Incentive Plan
Restricted Stock Awards
On December 4, 2012, the Company adopted an equity incentive plan which provides incentive compensation to attract and retain qualified directors, officers, advisors, consultants and other personnel of the Company.
The compensation committee of the Company’s board of directors has the full authority to administer and interpret the plan, to authorize the granting of awards, to determine the eligibility of directors, officers, advisors, consultants and other personnel of the Company to receive an award, to determine the number of shares of common stock to be covered by each award, to determine the terms, provisions and conditions of each award, to prescribe the form of instruments evidencing awards and to take any other actions and make all other determinations that it deems necessary or appropriate in connection with the equity incentive plan or the administration or interpretation thereof. In connection with this authority, the compensation committee may, among other things, establish performance goals that must be met in order for awards to be granted or to vest, or for the restrictions on any such awards to lapse.
The Company’s equity incentive plan provides for grants of restricted common stock, phantom shares, dividend equivalent rights and other equity-based awards, subject to a ceiling of 921,053 shares available for issuance under the plan. The plan allows for the Company’s board of directors to expand the types of awards available under the plan to include long-term incentive plan units in the future. To the extent the Company seeks awards to qualify as incentive compensation for purposes of section 162(m) of the Code, the maximum number of shares that may underlie awards in any one year to any eligible person may not exceed 92,100. If an award granted under the equity incentive plan expires or terminates, the shares subject to any portion of the award that expires or terminates without having been exercised or paid, as the case may be, will again become available for the issuance of future awards. Unless previously terminated by the Company’s board of directors, no new award may be granted under the equity incentive plan after the tenth anniversary of the date that such plan was initially approved by the Company’s board of directors. No award may be granted under the equity incentive plan to any person who, assuming payment of all awards held by such person, would own or be deemed to own more than 9.8% of the outstanding shares of the Company’s common stock.
Restricted shares that have been awarded to certain personnel of the Company through December 31, 2015 vest in three annual installments commencing on the date of the grant, as long as such individual is an employee on the vesting date. Restricted shares that have been awarded to certain officers of the Company vest in one year commencing on the date of the grant, as long as the individual is an employee on the vesting date. Restricted share awards to independent directors generally vest on the earlier of (i) the one year anniversary of the date of grant and (ii) the date immediately preceding the date of the annual meeting of the Company’s stockholders for the year following the year of grant for the award, as long as such director is serving as a board member on the vesting date.
The Company’s unvested restricted stockholders have the same voting rights as any other common stockholder. During the period of restriction, the Company’s unvested restricted stockholders receive quarterly dividend payments on their shares at the same rate and on the same date as any other common stockholder. For the years ended December 31, 2015, 2014 and 2013 inclusive of the impact of cash dividends, the Company recognized $2,274, $1,022 and $927, respectively, of stock compensation expense. Additionally, in 2013, the Company offset proceeds of $125 from its initial public offering as additional paid-in capital related to the shares issued to its independent directors for their additional work related to its initial public offering.
As of December 31, 2015, the total compensation cost related to nonvested awards not yet recognized was $1,169 and the weighted-average period over which such amount is expected to be recognized is 1.24 years.
83
SILVER BAY REALTY TRUST CORP.
NOTES TO THE CONSOLIDATED FINANCIAL STATEMENTS
(amounts in thousands, except share data and property counts)
The table below summarizes the award activity of the equity incentive plan for 2015, 2014 and 2013:
2015 | 2014 | 2013 | ||||||||||||||||||
Shares | Weighted Average Grant Date Fair Market Value | Shares | Weighted Average Grant Date Fair Market Value | Shares | Weighted Average Grant Date Fair Market Value | |||||||||||||||
Outstanding at beginning of period | 107,088 | $ | 16.68 | 82,463 | $ | 18.44 | 160,571 | $ | 18.50 | |||||||||||
Granted | 142,100 | 15.67 | 77,559 | 15.95 | 24,165 | 17.89 | ||||||||||||||
Vested | (63,157 | ) | (16.07 | ) | (43,437 | ) | (18.35 | ) | (54,757 | ) | (18.34 | ) | ||||||||
Forfeited | (9,168 | ) | (16.06 | ) | (9,497 | ) | (18.37 | ) | (47,516 | ) | (18.48 | ) | ||||||||
Outstanding at end of period | 176,863 | $ | 15.79 | 107,088 | $ | 16.68 | 82,463 | $ | 18.44 | |||||||||||
On February 9, 2016, the Company issued, in aggregate, 127,648 shares of restricted common stock to certain officers and employees of the Company. The estimated fair value of these awards was $12.97 per share, based upon the closing price of the Company’s stock on the date prior to the grant. These grants will vest in one year commencing on the date of the grant, as long as such individual is an employee on the vesting date, unless earlier acceleration pursuant to its terms.
Performance Stock Units
On February 12, 2015, the Company granted 165,000 performance stock units ("PSUs") to certain members of executive and senior management under its equity incentive plan. Each PSU represents the potential to receive Silver Bay common stock after the completion of three years of service from the date of grant. The number of shares of Silver Bay common stock to be earned as of the vesting date for each PSU increases and decreases based on Silver Bay's total stockholder return (stock price appreciation plus dividends) ("TSR"). The number of shares of common stock is determined by multiplying the target number of PSUs by the TSR multiplier, determined in accordance with the following table:
Annualized TSR | TSR Multiplier | |
6.5% | —% | |
8% | 50% | |
10% | 100% | |
12% | 150% | |
16% | 200% | |
To the extent the Company's annualized TSR falls between two discrete points, linear interpolation shall be used to determine the TSR multiplier. Additionally, each PSU contains one dividend equivalent right, which is equal to the cash dividend that would have been paid on the PSU had the PSU been an issued and outstanding common share on the record date for the dividend and is payable in additional shares if the market and service conditions are met.
84
SILVER BAY REALTY TRUST CORP.
NOTES TO THE CONSOLIDATED FINANCIAL STATEMENTS
(amounts in thousands, except share data and property counts)
The Company utilized a Monte-Carlo simulation to calculate the weighted-average grant date fair value of $7.00 per unit, using the following assumptions:
Expected volatility (1) | 17.55 | % | |
Dividend assumption (2) | — | % | |
Expected term in years | 3.00 | ||
Risk-free rate | 1.02 | % | |
Stock price (per share) (3) | $ | 15.72 | |
Beginning average stock price (per share) (4) | $ | 16.06 | |
(1) | Expected volatility is calculated as a 50.0% relative weighting of the Company's historical volatility of 15.54% (over the period from August 1, 2013 through the date of grant of the PSUs) and a 50.0% relative weighting on the implied volatility of 19.55%. |
(2) | An assumed dividend yield of 0% is the mathematical equivalent to the reinvestment of dividends, which is consistent with the TSR definition described above. |
(3) | Based on the closing price of the Company's common stock on February 12, 2015. |
(4) | Based on the 30 trading days ended on February 12, 2015. |
During the year ended December 31, 2015, the Company recognized non-cash performance-based stock unit expense of $339, which is included within share-based compensation in the consolidated statements of operations and comprehensive loss. Unrecognized compensation expense at December 31, 2015 was $816, and the weighted-average period over which such amount is expected to be recognized is 2.12 years.
Note 7. Preferred Stock
The Company issued 1,000 shares of its 10% cumulative redeemable preferred stock to a subsidiary of Two Harbors as consideration in the Formation Transactions, which subsequently sold the shares, as discussed in Note 10. This preferred stock ranks, with respect to dividend rights and rights upon the Company's liquidation, dissolution or winding up, senior to the rights of holders of the Company’s common stock. The Company may issue other classes or series of capital stock in the future, including classes or series of preferred stock, and expressly designate such classes or series as ranking junior to, on parity with or senior to the 10% cumulative redeemable preferred stock. The Company may not, however, issue capital stock ranking as to dividends or rights upon the Company's liquidation, dissolution or winding up, senior to the 10% cumulative redeemable preferred stock, without the affirmative vote or consent of two-thirds of the issued and outstanding shares of 10% cumulative redeemable preferred stock. Dividends shall accrue on a daily basis and be cumulative from the initial issue date. Dividends, if authorized by the board of directors, will be payable annually in arrears on June 30 of each year, or more frequently as determined by the board of directors. The Company has the option at any time after five years from the initial issue date to redeem the 10% cumulative redeemable preferred stock at a redemption price of $1 per share, plus all accrued and unpaid dividends. At any time, beginning on the sixth anniversary of the initial issue date, a preferred stockholder, with adequate notice, may put their shares back to the Company, at a redemption price of $1 per share, plus all accrued and unpaid dividends.
As of December 31, 2015 and 2014, there was $21 and $25, respectively, in preferred stock dividends included in accounts payable and accrued expenses on the consolidated balance sheets.
85
SILVER BAY REALTY TRUST CORP.
NOTES TO THE CONSOLIDATED FINANCIAL STATEMENTS
(amounts in thousands, except share data and property counts)
Note 8. Stockholders’ Equity
Common stock
As of December 31, 2015, the Company had 36,063,187 shares of common stock outstanding. The following table presents the changes in the Company’s issued and outstanding common shares for the years ended December 31, 2015, 2014 and 2013:
Number of Common Shares | ||
Common shares outstanding, January 1, 2013 | 37,328,213 | |
Issuance of common stock | 1,987,500 | |
Restricted stock grants, net | (23,351 | ) |
Repurchase of common stock | (758,353 | ) |
Conversion of Operating Partnership units | 27,459 | |
Common shares outstanding, December 31, 2013 | 38,561,468 | |
Restricted stock grants, net | 68,062 | |
Repurchase of common stock | (1,917,836 | ) |
Common shares outstanding, December 31, 2014 | 36,711,694 | |
Restricted stock grants, net | 132,932 | |
Repurchase of common stock | (781,439 | ) |
Common shares outstanding, December 31, 2015 | 36,063,187 | |
On July 1, 2013, the Company’s board of directors authorized the Company to repurchase up to 2,500,000 shares of its common stock through a share repurchase program. On November 25, 2014, the Company's board of directors authorized an increase of 2,500,000 shares to the previously authorized share repurchase program for a total of 5,000,000 shares. Shares may be repurchased from time to time through privately negotiated transactions or open market transactions, pursuant to a trading plan in accordance with Rules 10b5-1 and 10b-18 under the Securities Exchange Act of 1934, as amended, or by any combination of such methods. The manner, price, number and timing of share repurchases will be subject to a variety of factors, including market conditions and applicable U.S. Securities and Exchange Commission rules.
In the years ended December 31, 2015, 2014 and 2013, the Company repurchased and retired 770,417, 1,912,139 and 750,768 common shares, respectively, under the program for a total cost of $12,260, $31,396 and $11,639, respectively, at an average purchase price of $15.91, $16.42 and $15.50, respectively, inclusive of commission.
In the years ended December 31, 2015, 2014 and 2013, respectively, the Company repurchased and retired 11,022, 5,697 and 7,585 common shares, respectively, outside of the repurchase program for a total cost of $174, $93 and $121, respectively, at an average purchase price of $15.74, $16.28 and $15.93, respectively. The shares were repurchased from certain employees and certain personnel of the Former Manager and the Former Manager's operating subsidiary to cover the minimum statutory tax withholding obligations related to the vesting of restricted common stock.
On September 30, 2014, the Company issued 2,231,511 common units of the Operating Partnership to acquire the Former Manager (see Note 10).
On December 31, 2013, the Company redeemed all outstanding noncontrolling interest holders representing 27,459 common units in exchange for Company common shares, having a value of $487 (based on the value of the noncontrolling interests on such date).
86
SILVER BAY REALTY TRUST CORP.
NOTES TO THE CONSOLIDATED FINANCIAL STATEMENTS
(amounts in thousands, except share data and property counts)
Common Stock Dividends
The following table presents cash dividends declared by the Company on its common stock since its formation:
Declaration Date | Record Date | Payment Date | Cash Dividend per Share | |||||
December 17, 2015 | December 28, 2015 | January 8, 2016 | $ | 0.13 | ||||
September 25, 2015 | October 6, 2015 | October 16, 2015 | 0.12 | |||||
June 17, 2015 | June 29, 2015 | July 10, 2015 | 0.12 | |||||
March 25, 2015 | April 6, 2015 | April 17, 2015 | 0.09 | |||||
December 18, 2014 | December 29, 2014 | January 9, 2015 | 0.06 | |||||
September 4, 2014 | September 22, 2014 | October 3, 2014 | 0.04 | |||||
June 19, 2014 | June 30, 2014 | July 11, 2014 | 0.03 | |||||
March 13, 2014 | March 24, 2014 | April 4, 2014 | 0.03 | |||||
December 19, 2013 | December 30, 2013 | January 10, 2014 | 0.01 | |||||
September 19, 2013 | October 1, 2013 | October 11, 2013 | 0.01 | |||||
June 20, 2013 | July 1, 2013 | July 12, 2013 | 0.01 | |||||
March 21, 2013 | April 1, 2013 | April 12, 2013 | 0.01 | |||||
Preferred Stock Dividends
The following table presents cash dividends declared by the Company on its 10% cumulative redeemable preferred stock since its formation:
Declaration Date | Payment Date | Cash Dividend per Share | ||||
January 8, 2016 | January 8, 2016 | $ | 22.78 | |||
September 29, 2015 | October 16, 2015 | 26.67 | ||||
June 17, 2015 | June 30, 2015 | 23.06 | ||||
March 25, 2015 | April 17, 2015 | 27.22 | ||||
January 9, 2015 | January 9, 2015 | 26.67 | ||||
October 3, 2014 | October 3, 2014 | 22.78 | ||||
June 25, 2014 | June 30, 2014 | 26.94 | ||||
April 2, 2014 | April 4, 2014 | 23.33 | ||||
January 1, 2014 | January 10, 2014 | 24.72 | ||||
September 19, 2013 | October 11, 2013 | 24.72 | ||||
June 26, 2013 | June 28, 2013 | 25.00 | ||||
March 21, 2013 | April 12, 2013 | 31.39 | ||||
The March 21, 2013 dividend declaration included amounts relating to the period from the date of the Formation Transactions through April 12, 2013.
87
SILVER BAY REALTY TRUST CORP.
NOTES TO THE CONSOLIDATED FINANCIAL STATEMENTS
(amounts in thousands, except share data and property counts)
Note 9. Earnings (Loss) Per Share
The following table presents a reconciliation of net loss attributable to common stockholders and shares used in calculating basic and diluted earnings (loss) per share ("EPS") for the years ended December 31, 2015, 2014 and 2013:
Year Ended December 31, 2015 | Year Ended December 31, 2014 | Year Ended December 31, 2013 | |||||||||
Net loss attributable to controlling interests | $ | (9,375 | ) | $ | (56,554 | ) | $ | (24,533 | ) | ||
Preferred distributions | (100 | ) | (100 | ) | (100 | ) | |||||
Net loss attributable to common stockholders | $ | (9,475 | ) | $ | (56,654 | ) | $ | (24,633 | ) | ||
Basic and diluted weighted average common shares outstanding | 36,209,999 | 38,119,971 | 39,073,994 | ||||||||
Net loss per common share - Basic and Diluted | $ | (0.26 | ) | $ | (1.49 | ) | $ | (0.63 | ) | ||
A total of 2,231,511 common units were outstanding from September 30, 2014 through December 31, 2015 and a total of 27,459 common units were outstanding from the date of the Formation Transactions through December 31, 2013, all of which have been excluded from the calculations of diluted EPS as their inclusion would not be dilutive. A total of 165,000 PSUs were outstanding from February 12, 2015 through December 31, 2015, but have been excluded from the calculations of diluted EPS as their inclusion would not be dilutive.
Note 10. Related Party Transactions
Formation Transactions
On December 19, 2012, the Company completed the Offering and raised approximately $228,517 in net proceeds through the issuance of 13,250,000 common shares. On January 7, 2013, the Company sold an additional 1,987,500 common shares and received net proceeds of approximately $34,388, inclusive of the May 2013 $125 stock award to the Company’s independent directors, which off-set the proceeds.
Concurrently with the Offering, the Company also completed certain merger and formations transactions, which included the contribution of the ownership interest of the Predecessor by Two Harbors. For accounting purposes, the Predecessor was considered the acquiring or surviving entity, meaning the Predecessor's historical assets and liabilities included in the consolidated balance sheets were recorded at the Predecessor's historical carryover cost basis.
The Company acquired the Provident Entities, which owned 881 single-family residential real properties through a series of merger and contribution transactions as part of the Formation Transactions. The contribution of the Provident Entities was considered an acquisition for accounting purposes, resulting in the assets and liabilities of the Provident Entities being recorded at their fair value of $118,492. In consideration for these transactions, the prior members of the Provident Entities’ received 6,092,995 shares of the newly formed entity’s common stock, valued at $18.50 per share, $5,263 in cash (a use of net proceeds from the Offering) and 27,459 common units in the Operating Partnership, valued at $18.50 per unit (the same price per share in the Offering) because the common units were redeemable for cash or, at the Company’s election, shares of Company common stock on a one-for-one basis, subject to applicable adjustments. The allocations of the purchase price for the Provident Entities were made in accordance with the Company’s allocation policies. There was no allocation of fair value for above or below market in-place leases based on the short-term nature of the leases and stated rates approximating current rental rates. As described in Note 8, on December 31, 2013, the Company redeemed the 27,459 common units in the Operating Partnership in exchange for an equal amount of shares of Company common stock.
Working capital adjustments related to the Formation Transactions had been finalized and paid prior to December 31, 2013 and, as such, there were no working capital payables or receivables in the consolidated balance sheets as of such date. In the fourth quarter of 2013, the Company made aggregate payments of $873 to the prior members of the Provident Entities to settle the working capital payable with said parties.
In addition, the Company was required to make payments of cash to both Two Harbors and the prior members of the Provident Entities as additional purchase price consideration in the Formation Transactions. The total amount paid to Two Harbors and prior members of the Provident Entities was equal to 50% of the advisory management fee payable to the Former Manager, as described below, during the first year after the Offering (before adjustment for any property management fees
88
SILVER BAY REALTY TRUST CORP.
NOTES TO THE CONSOLIDATED FINANCIAL STATEMENTS
(amounts in thousands, except share data and property counts)
received by the Former Manager’s operating subsidiary), subject to an aggregate amount payable to Two Harbors of no more than $4,024. These payments reduced the amount owed to the Former Manager on a dollar-for-dollar basis and thus had no net impact on expenditures of the Company. The amounts individually paid to Two Harbors and the prior members of the Provident Entities were based upon the relative values they each provided as part of the Formation Transactions, which were approximately 73.6% and 26.4%, respectively. The Company incurred $3,861 and $1,384, respectively, in additional purchase price consideration related to Two Harbors and the prior members of the Provident Entities in the one year period following the date of the Formation Transactions. The component of the fee payable to the prior members of the Provident Entities has been recorded as additional basis to the single-family residential real properties acquired from the Provident Entities and recognized as additional paid-in capital. The final amounts due to Two Harbors and the prior members of the Provident Entities were $734 and $264, respectively, and were included on the consolidated balance sheets within amounts due to previous owners as of December 31, 2013. The final cash payments were made in the first quarter of 2014. See below for detail on the advisory management fees incurred by the Company during the years ended December 31, 2014 and 2013.
Management Internalization Transaction
On September 30, 2014, the Company closed the Internalization after receiving the required stockholder approval for the transaction. The Internalization was completed under the terms of a contribution agreement (the "Contribution Agreement") among the Company, Pine River Domestic Management L.P., Provident, the Former Manager, and the Operating Partnership, pursuant to which the Company acquired the Former Manager in exchange for 2,231,511 common units of the Operating Partnership. These common units are redeemable for cash or, at the Company's election, the Company's common shares on a one-for-one basis.
The Contribution Agreement included a net worth adjustment, payable in cash, in the event that the closing net worth of the Former Manager was greater or less than $0 after making an adjustment to exclude any liabilities for accrued bonus compensation payable to the Chief Executive Officer and personnel providing data analytics directly supporting the investment function of the Company. The Company settled the net worth adjustment on September 30, 2014 based on estimated amounts. The Company finalized the net worth adjustment in the fourth quarter of 2014 and the settlement was de minimis. As a result of this transaction, as of September 30, 2014, the Company no longer pays fees or expense reimbursements to the Former Manager or the Former Manager's operating subsidiary.
The Company recognized $39,373 in the third and fourth quarters of 2014 in connection with the Internalization, which is recorded as management internalization expense in the accompanying consolidated statements of operations and comprehensive loss. The Internalization expense primarily consists of the issuance of the 2,231,511 common units of the Operating Partnership with a fair value of $36,173, based on the stock price on the date of closing of $16.21. The issuance of the common units was recognized as an expense as it represented the cost of terminating the advisory management fee agreement. The remaining amounts in management internalization were attributable to transaction fees and expenses, and the assumption of certain liabilities in connection with the transaction. The Company acquired cash of $2,069 and other net liabilities of $2,067 in the transaction.
Upon Internalization, the Company assumed net operating losses and a deferred tax asset of the Former Manager's operating subsidiary. The Company has elected to have this new entity be treated for tax purposes as a TRS. See Note 4 for further detail on income taxes.
Advisory Management Agreement
Prior to the Internalization, the Company and the Former Manager maintained an advisory management agreement whereby the Former Manager designed and implemented the Company’s business strategy and administered its business activities and day-to-day operations, subject to oversight by the Company’s board of directors. In exchange for these services, the Former Manager earned a fee equal to 1.5% per annum, or 0.375% per quarter, of the Company’s daily average fully diluted market capitalization, as defined by the agreement, calculated and payable quarterly in arrears. The fee was reduced for the 5% property management fee (described below) received by the Former Manager’s operating subsidiary or its affiliates under the property management and acquisition services agreement. The Company also reimbursed the Former Manager for all expenses incurred on its behalf or otherwise in connection with the operation of its business, other than compensation for the Chief Executive Officer and personnel providing data analytics directly supporting the investment function.
89
SILVER BAY REALTY TRUST CORP.
NOTES TO THE CONSOLIDATED FINANCIAL STATEMENTS
(amounts in thousands, except share data and property counts)
During the year ended December 31, 2014, the Company expensed $6,621 in advisory management fees, net of the reduction for the 5% property management fee described below. During the year ended December 31, 2013, the Company expensed $9,775 in advisory management fees, of which $4,715, $3,725 and $1,335 were payable to the Former Manager, Two Harbors and the prior members of the Provident Entities, respectively.
As of December 31, 2014, the Company had settled the final advisory management fee payable and had $0 outstanding related to the advisory management fee.
The Company also reimbursed the Former Manager for certain general and administrative expenses, primarily related to employee compensation and certain office costs. Direct and allocated costs incurred by the Former Manager on behalf of the Company, totaled approximately $0, $5,476 and $4,036 for the years ended December 31, 2015, 2014 and 2013, respectively. As of December 31, 2015 and 2014, the Company did not have an outstanding balance due to the Former Manager and affiliates on the consolidated balance sheets.
Property Management and Acquisition Services Agreement
Prior to the Internalization, the Company and the Former Manager's operating subsidiary maintained a property management and acquisition services agreement pursuant to which the Former Manager's operating subsidiary acquired and managed single-family properties on the Company's behalf. For these services, the Company reimbursed the Former Manager’s operating subsidiary for all direct expenses incurred in the operation of its business, including the compensation of its employees. The Former Manager’s operating subsidiary also received a property management fee equal to 5% of certain costs and expenses incurred by it in the operation of its business that were reimbursed by the Company. Prior to the Internalization, this 5% property management fee reduced the advisory management fee paid to the Former Manager on a dollar-for-dollar basis. Upon Internalization, the Former Manager's operating subsidiary performing these services was acquired.
Prior to the Internalization, through the nine months ended September 30, 2014, the Company incurred property management expense of $7,569, which included direct expense reimbursements of $5,120 and the 5% property management fee of $288. The remaining $2,161 of property management fees incurred prior to the Internalization was incurred to reimburse the Former Manager's operating subsidiary for direct property management type expenses and payments due directly to third-party property managers. In addition, the Company incurred charges with the Former Manager's operating subsidiary of $608 in acquisitions and renovation fees, which the Company capitalized as part of property acquisition and renovation costs and $11 for leasing services, which are reflected as other assets and are being amortized over the life of the leases (typically one year or less). Following the Internalization, the Company incurred property management expense of $1,832 for total 2014 expense of $9,401.
During the year ended December 31, 2013, the Company incurred property management expense of $11,683. This included direct expenses and reimbursements of $9,014 and the 5% property management fee of $645, respectively. The remaining amounts in property management fees of $2,024, were incurred to reimburse the Former Manager’s operating subsidiary for expenses payable to third-party property managers or as payments due directly to third-party property managers or direct property management type expenses. In addition, for the year ended December 31, 2013, the Company incurred charges with the Former Manager’s operating subsidiary of $4,093 in acquisitions and renovation fees which were capitalized as part of property acquisition and renovation costs, and $212 for leasing services, which are reflected as other assets and are being amortized over the life of the leases.
As of December 31, 2015 and 2014, the Company did not have an outstanding balance due to the Former Manager and affiliates on the consolidated balance sheets for property management and acquisition services.
In June 2014, the Former Manager's operating subsidiary acquired the Company's third-party property manager in Tampa, who provided services exclusively to the Company, for $775. No significant assets or liabilities were acquired or assumed as part of the transaction and the payment was recorded as a one-time general and administrative expense.
90
SILVER BAY REALTY TRUST CORP.
NOTES TO THE CONSOLIDATED FINANCIAL STATEMENTS
(amounts in thousands, except share data and property counts)
Note 11. Derivative and Other Fair Value Instruments
ASC 820 established a three level valuation hierarchy for disclosure of fair value measurements. The valuation hierarchy is based upon the transparency of inputs to the valuation of an asset or liability as of the measurement date. A financial instrument’s categorization within the valuation hierarchy is based upon the lowest level of input that is significant to the fair value measurement. The three levels are defined as follows:
Level 1 — Inputs to the valuation methodology are quoted prices (unadjusted) for identical assets or liabilities in active markets.
Level 2 — Inputs to the valuation methodology include quoted prices for similar assets and liabilities in active markets, and inputs that are observable for the asset or liability, either directly or indirectly, for substantially the full term of the financial instrument.
Level 3 — Inputs to the valuation methodology are unobservable and significant to the fair value measurement.
Recurring Fair Value
The Company uses interest rate cap agreements to manage its exposure to interest rate risk (refer to Note 5). The interest rate cap agreements are valued using models developed by the respective counterparty that use as their basis readily observable market parameters (such as forward yield curves).
The following table provides a summary of the aggregate fair value measurements for the interest rate cap agreements and the location within the consolidated balance sheets at December 31, 2015 and 2014, respectively:
Fair Value Measurements at Reporting Date Using | ||||||||||||||||||
Description | Balance Sheet Location | December 31, 2015 | Quoted Prices (Unadjusted) for Identical Assets/Liabilities (Level 1) | Quoted Prices for Similar Assets and Liabilities in Active Markets (Level 2) | Significant Unobservable Inputs (Level 3) | |||||||||||||
Interest Rate Caps (cash flow hedges) | Other Assets | $ | 712 | $ | — | $ | 712 | $ | — | |||||||||
Interest Rate Caps (not designated as hedging instruments) | Other Assets | 9 | — | 9 | — | |||||||||||||
Total | $ | 721 | $ | — | $ | 721 | $ | — | ||||||||||
Fair Value Measurements at Reporting Date Using | ||||||||||||||||||
Description | Balance Sheet Location | December 31, 2014 | Quoted Prices (Unadjusted) for Identical Assets/Liabilities (Level 1) | Quoted Prices for Similar Assets and Liabilities in Active Markets (Level 2) | Significant Unobservable Inputs (Level 3) | |||||||||||||
Interest Rate Caps (cash flow hedges) | Other Assets | $ | 58 | $ | — | $ | 58 | $ | — | |||||||||
Interest Rate Caps (not designated as hedging instruments) | Other Assets | 13 | — | 13 | ||||||||||||||
Total | $ | 71 | $ | — | $ | 71 | $ | — | ||||||||||
91
SILVER BAY REALTY TRUST CORP.
NOTES TO THE CONSOLIDATED FINANCIAL STATEMENTS
(amounts in thousands, except share data and property counts)
The following table provides a summary of the effect of cash flow hedges on the Company’s consolidated statements of operations and comprehensive loss for the year ended December 31, 2015:
Effective Portion | Ineffective Portion | |||||||||||||||
Type of Cash Flow Hedge | Amount of Gain/(Loss) Recognized in Other Comprehensive Loss on Derivative | Location of Gain/(Loss) Reclassified from Accumulated Other Comprehensive Loss into Income | Amount of Gain/(Loss) Reclassified from Accumulated Other Comprehensive Loss into Income | Location of Gain/(Loss) Recognized in Income on Derivative | Amount of Gain/(Loss) Reclassified from Accumulated Other Comprehensive Loss into Income | |||||||||||
Interest Rate Caps | $ | (1,587 | ) | Interest Expense | $ | (9 | ) | Ineffectiveness of Interest Rate Cap Agreements | $ | (51 | ) | |||||
The following table provides a summary of the effect of cash flow hedges on the Company’s consolidated statements of operations and comprehensive loss for the year ended December 31, 2014:
Effective Portion | Ineffective Portion | |||||||||||||||
Type of Cash Flow Hedge | Amount of Gain/(Loss) Recognized in Other Comprehensive Loss on Derivative | Location of Gain/(Loss) Reclassified from Accumulated Other Comprehensive Loss into Income | Amount of Gain/(Loss) Reclassified from Accumulated Other Comprehensive Loss into Income | Location of Gain/(Loss) Recognized in Income on Derivative | Amount of Gain/(Loss) Reclassified from Accumulated Other Comprehensive Loss into Income | |||||||||||
Interest Rate Caps | $ | (291 | ) | Interest Expense | $ | (1 | ) | Ineffectiveness of Interest Rate Cap Agreements | $ | (480 | ) | |||||
The following table provides a summary of the effect of cash flow hedges on the Company’s consolidated statements of operations and comprehensive loss for the year ended December 31, 2013:
Effective Portion | Ineffective Portion | |||||||||||||||
Type of Cash Flow Hedge | Amount of Gain/(Loss) Recognized in Other Comprehensive Loss on Derivative | Location of Gain/(Loss) Reclassified from Accumulated Other Comprehensive Loss into Income | Amount of Gain/(Loss) Reclassified from Accumulated Other Comprehensive Loss into Income | Location of Gain/(Loss) Recognized in Income on Derivative | Amount of Gain/(Loss) Reclassified from Accumulated Other Comprehensive Loss into Income | |||||||||||
Interest Rate Caps | $ | (276 | ) | Interest Expense | $ | — | N/A | $ | — | |||||||
As of December 31, 2015 and 2014, there were approximately $1,613 and $86, respectively, in deferred losses in accumulated other comprehensive loss related to interest rate cap agreements. The Company expects to recognize approximately $236 in interest expense during the year ending December 31, 2016, pertaining to the interest rate cap agreements, which will be reclassified out of accumulated other comprehensive loss, in accordance with the amortization schedules established upon designation of the interest rate caps as cash flow hedges.
In association with the pay down of the revolving credit facility in the third quarter of 2014, the Company de-designated the three interest rate caps associated with the revolving credit facility. All deferred losses in accumulated other comprehensive loss pertaining to the three interest rate caps were recognized in income and future gains and losses on these interest rate caps were recorded as ineffectiveness of interest rate cap agreements on the consolidated statements of operations and comprehensive loss. During the year ended December 31, 2014, the Company recorded $49 in losses as ineffectiveness in interest rate cap agreements following the de-designation of the three interest rate caps associated with the revolving credit facility.
In conjunction with the paydown of the revolving credit facility in the fourth quarter of 2015, the Company recorded a portion of the $266,100 interest rate cap agreement as ineffective. Current and future gains and losses associated with the ineffective portion of this interest rate cap agreement will be recorded as ineffectiveness of interest rate cap agreements on the consolidated statements of operations and comprehensive loss. During the year ended December 31, 2015, the Company recorded $51 in losses as ineffectiveness in interest rate cap agreements associated with the revolving credit facility.
92
SILVER BAY REALTY TRUST CORP.
NOTES TO THE CONSOLIDATED FINANCIAL STATEMENTS
(amounts in thousands, except share data and property counts)
Nonrecurring Fair Value
For long-lived assets to be disposed of, an impairment loss is recognized when the estimated fair value of the asset, less the estimated cost to sell, is less than the carrying amount of the asset at the time the Company has determined to sell the asset. Assets held for sale are valued based on comparable sales data, less estimates of third-party broker commissions, which are gathered from the markets (see Note 2). These impairment measurements constitute nonrecurring fair value measures under ASC 820 and the inputs are characterized as Level 2.
Fair Value of Other Financial Instruments
In accordance with ASC 820, the Company is required to disclose the fair value of financial instruments, both assets and liabilities recognized and not recognized in the consolidated balance sheets, for which fair value can be estimated. The following describes the Company’s methods for estimating the fair value for financial instruments. Descriptions are not provided for those items that have zero balances as of December 31, 2015 and 2014.
• | Cash, escrow deposits, resident prepaid rent and security deposits, resident rent receivable (included in other assets), accounts payable, and accrued expenses have carrying values which approximate fair value because of the short-term nature of these instruments. The Company categorizes the fair value measurement of these assets and liabilities as Level 1. |
• | The Company’s revolving credit facility has a floating interest rate based on an index plus a spread and the credit spread is consistent with those demanded in the market for facilities with similar risk and maturities. Accordingly, the interest rate on this borrowing is at market and thus the carrying value of the debt approximated fair value as of December 31, 2015 and 2014. The Company categorizes the fair value measurement of this liability as Level 2. |
• | The fair value of the Company's Securitization Loan was $293,536 and $305,253 as of December 31, 2015 and 2014, respectively, based on an average of market quotations. The Company categorizes the fair value measurement of this liability as Level 2. |
• | The Company’s 10% cumulative redeemable preferred stock had a fair value which approximates its liquidation value at December 31, 2015 and 2014. The Company categorizes the fair value measurement of this instrument as Level 2. |
Note 12. Commitments and Contingencies
Concentrations
As of December 31, 2015, approximately 58% of the Company’s properties were located in Phoenix, AZ, Tampa, FL, and Atlanta, GA, which exposes the Company to greater economic risks than if the Company owned a more geographically dispersed portfolio.
Resident security deposits
As of December 31, 2015, the Company had $12,521 in resident security deposits. Security deposits are refundable, net of any outstanding charges and fees, upon expiration of the underlying lease.
Operating leases
Upon Internalization, the Company assumed certain commitments that were previously those of the Former Manager or the Former Manager’s operating subsidiary. The Company leases certain office facilities under operating leases, some of which include rent payment escalation clauses, with lease terms ranging from one to five years and thereafter. In addition to minimum lease payments, some of the Company's office facility leases require payment of a proportionate share of fees and taxes and building operating expenses.
In the years ended December 31, 2015, 2014 and 2013 the Company incurred $837, $104 and $0, respectively, in rental expense on operating leases.
93
SILVER BAY REALTY TRUST CORP.
NOTES TO THE CONSOLIDATED FINANCIAL STATEMENTS
(amounts in thousands, except share data and property counts)
A schedule of future minimum lease payments under non-cancelable operating leases for the following years is as follows:
2016 | $ | 538 | |
2017 | 418 | ||
2018 | 369 | ||
2019 | 283 | ||
2020 | 216 | ||
Thereafter | 183 | ||
Total | $ | 2,007 | |
Legal and regulatory
From time to time, the Company is subject to potential liability under laws and government regulations and various claims and legal actions arising in the ordinary course of the Company’s business. Liabilities are established for legal claims when payments associated with the claims become probable and the costs can be reasonably estimated. The actual costs of resolving legal claims may be substantially higher or lower than the amounts established for those claims. Based on information currently available, management is not aware of any legal or regulatory claims that would have a material adverse effect on the Company’s consolidated financial statements and, therefore, no accrual has been recorded as of December 31, 2015.
Note 13. Quarterly Financial Data (Unaudited)
Following is quarterly financial data for 2015 and 2014:
2015 Quarter Ended | |||||||||||||||
March 31 | June 30 | September 30 | December 31 | ||||||||||||
Total revenues | $ | 22,252 | $ | 30,184 | $ | 30,617 | $ | 30,641 | |||||||
Net loss | (3,841 | ) | (3,886 | ) | (1,427 | ) | (798 | ) | |||||||
Net loss attributable to common stockholders | (3,644 | ) | (3,686 | ) | (1,368 | ) | (777 | ) | |||||||
Loss per share - basic and diluted | (0.10 | ) | (0.10 | ) | (0.04 | ) | (0.02 | ) | |||||||
2014 Quarter Ended | |||||||||||||||
March 31 | June 30 | September 30 | December 31 | ||||||||||||
Total revenues | $ | 18,131 | $ | 19,152 | $ | 19,974 | $ | 20,673 | |||||||
Net loss | (4,365 | ) | (4,970 | ) | (44,870 | ) | (2,492 | ) | |||||||
Net loss attributable to common stockholders | (4,390 | ) | (4,995 | ) | (44,895 | ) | (2,374 | ) | |||||||
Loss per share - basic and diluted | (0.11 | ) | (0.13 | ) | (1.17 | ) | (0.08 | ) | |||||||
During the fourth quarter of 2015, the Company recorded a tax benefit of $964 related to the reversal of a deferred tax valuation allowance for the portion of the Company’s deferred tax assets that the Company believes meets the “more-likely than not” realizability test as described in Note 4.
94
Silver Bay Realty Trust Corp.
Schedule III — Real Estate and Accumulated Depreciation
As of December 31, 2015
(dollars in thousands)
Encumbrances | Initial Cost to Company | Costs Capitalized Subsequent to Acquisitions | Total Cost | |||||||||||||||||||||||||||||||||||||||||||
Market Location | Number of Owned Properties | Number of Encumbered Properties (1) | Encumbrances (1) | Land | Building | Land Improvements | Building Improvements | Land and Land Improvements | Building and Improvements | Total (2) | Accumulated Depreciation (3) | Date of Construction Range | Date Acquired | |||||||||||||||||||||||||||||||||
Atlanta, GA | 2,723 | 2,698 | $ | 165,844 | $ | 62,981 | $ | 219,890 | $ | 10 | $ | 33,406 | $ | 62,991 | $ | 253,296 | $ | 316,287 | $ | 14,421 | 1900-2012 | 2012-2015 | ||||||||||||||||||||||||
Phoenix, AZ | 1,424 | 1,424 | 136,957 | 34,126 | 136,715 | 8 | 31,962 | 34,134 | 168,677 | 202,811 | 17,408 | 1944-2010 | 2012-2013 | |||||||||||||||||||||||||||||||||
Tampa, FL | 1,113 | 1,074 | 90,961 | 29,978 | 101,810 | 68 | 27,570 | 30,046 | 129,380 | 159,426 | 11,688 | 1941-2008 | 2012-2015 | |||||||||||||||||||||||||||||||||
Charlotte, NC | 686 | 673 | 26,945 | 15,892 | 62,916 | — | 5,789 | 15,892 | 68,705 | 84,597 | 2,801 | 1941-2013 | 2012-2015 | |||||||||||||||||||||||||||||||||
Dallas, TX | 504 | 494 | 28,946 | 11,461 | 44,115 | 21 | 12,051 | 11,482 | 56,166 | 67,648 | 3,593 | 1958-2010 | 2012-2015 | |||||||||||||||||||||||||||||||||
Orlando, FL | 496 | 464 | 25,087 | 11,393 | 45,091 | — | 9,638 | 11,393 | 54,729 | 66,122 | 3,562 | 1949-2007 | 2012-2015 | |||||||||||||||||||||||||||||||||
Jacksonville, FL | 452 | 418 | 25,568 | 11,964 | 35,093 | — | 12,595 | 11,964 | 47,688 | 59,652 | 2,620 | 1944-2009 | 2013-2015 | |||||||||||||||||||||||||||||||||
Southeast FL | 384 | 368 | 26,913 | 15,759 | 41,223 | 6 | 19,601 | 15,765 | 60,824 | 76,589 | 3,602 | 1948-2007 | 2013-2015 | |||||||||||||||||||||||||||||||||
Northern CA | 382 | 382 | 35,858 | 14,973 | 47,738 | 41 | 9,910 | 15,014 | 57,648 | 72,662 | 6,087 | 1909-2006 | 2012-2013 | |||||||||||||||||||||||||||||||||
Las Vegas, NV | 290 | 290 | 28,562 | 2,064 | 32,916 | — | 6,290 | 2,064 | 39,206 | 41,270 | 4,197 | 1970-2009 | 2012-2014 | |||||||||||||||||||||||||||||||||
Columbus, OH | 284 | 284 | 17,992 | 4,468 | 18,033 | — | 10,635 | 4,468 | 28,668 | 33,136 | 2,238 | 1947-2009 | 2013-2014 | |||||||||||||||||||||||||||||||||
Tucson, AZ | 209 | 208 | 12,847 | 2,673 | 10,266 | — | 4,546 | 2,673 | 14,812 | 17,485 | 1,661 | 1940-2008 | 2012-2013 | |||||||||||||||||||||||||||||||||
Southern CA | 75 | 75 | 5,201 | 2,224 | 6,315 | — | 3,460 | 2,224 | 9,775 | 11,999 | 1,029 | 1928-2007 | 2012-2013 | |||||||||||||||||||||||||||||||||
9,022 | 8,852 | $ | 627,681 | $ | 219,956 | $ | 802,121 | $ | 154 | $ | 187,453 | $ | 220,110 | $ | 989,574 | $ | 1,209,684 | $ | 74,907 | |||||||||||||||||||||||||||
_______________
(1) | Encumbrances include the number of properties pledged under the revolving credit facility and the number of properties secured by first priority mortgages under the Securitization Loan, as well as the aggregate value of outstanding debt attributable to such properties, excluding the original issue discount. There are 53 properties in various markets classified as assets held for sale as of December 31, 2015 that are encumbered under the Company's revolving credit facility for an aggregate total of $2.7 million that have been excluded from Schedule III. |
(2) | The gross aggregate cost of total real estate for federal income tax purposes was approximately $1,218,707 at December 31, 2015 (unaudited). |
(3) | Depreciation of building and improvements is computed on the straight-line basis over the estimated useful life of 3 to 27.5 years, with no salvage value. |
95
The changes in investments in real estate for the years ended December 31, 2015, 2014 and 2013 are as follows:
2015 | 2014 | 2013 | ||||||||||
Balance, beginning of year | $ | 948,370 | $ | 776,304 | $ | 420,562 | ||||||
Acquisition of real estate | 273,266 | 136,045 | 261,950 | |||||||||
Improvements | 24,299 | 38,188 | 100,173 | |||||||||
Dispositions and other (1) | (36,251 | ) | (2,167 | ) | (6,381 | ) | ||||||
Balance, end of year | $ | 1,209,684 | $ | 948,370 | $ | 776,304 | ||||||
The changes in accumulated depreciation for the years ended December 31, 2015, 2014 and 2013 are as follows:
2015 | 2014 | 2013 | ||||||||||
Balance, beginning of year | $ | 43,150 | $ | 18,897 | $ | 1,869 | ||||||
Depreciation expense | 33,617 | 24,281 | 17,222 | |||||||||
Dispositions and other (1) | (1,860 | ) | (28 | ) | (194 | ) | ||||||
Balance, end of year | $ | 74,907 | $ | 43,150 | $ | 18,897 | ||||||
_______________
(1) | Includes assets transferred to held for sale. |
96
Item 9. Changes in and Disagreements with Accountants on Accounting and Financial Disclosure.
None.
Item 9A. Controls and Procedures.
Evaluation of Disclosure Controls and Procedures
Our management, with the participation of our interim Chief Executive Officer and Chief Financial Officer, has evaluated the effectiveness of our disclosure controls and procedures (as such term is defined in Rules 13a-15(e) and 15d-15(e) under the Exchange Act) as of December 31, 2015. Based on such evaluation, our interim Chief Executive Officer and Chief Financial Officer have concluded that, as of the end of such period, our disclosure controls and procedures were effective to ensure that information required to be disclosed by the Company in the reports it files or submits under the Exchange Act is recorded, processed, summarized and reported within the time periods specified in the SEC’s rules and forms. We continue to review and document our disclosure controls and procedures, including our internal controls over financial reporting, and may from time to time make changes aimed at enhancing their effectiveness and to ensure that our systems evolve with our business.
Management’s Report on Internal Control over Financial Reporting
Our management is responsible for establishing and maintaining adequate internal control over financial reporting for the Company. Internal control over financial reporting is a process to provide reasonable assurance regarding the reliability of our financial reporting for external purposes in accordance with accounting principles generally accepted in the United States of America. Internal control over financial reporting includes maintaining records that in reasonable detail accurately and fairly reflect our transactions; providing reasonable assurance that transactions are recorded as necessary for preparation of our financial statements; providing reasonable assurance that receipts and expenditures of Company assets are made in accordance with management authorization; and providing reasonable assurance that unauthorized acquisition, use or disposition of Company assets that could have a material effect on our financial statements would be prevented or detected on a timely basis. Because of its inherent limitations, internal control over financial reporting is not intended to provide absolute assurance that a misstatement of our financial statements would be prevented or detected.
Management conducted an evaluation of the effectiveness of our internal control over financial reporting based on the 2013 Internal Control — Integrated Framework issued by the Committee of Sponsoring Organizations of the Treadway Commission. Based on this evaluation, management concluded that the Company’s internal control over financial reporting was effective as of December 31, 2015.
Changes in Internal Control over Financial Reporting
There were no changes in our internal control over financial reporting (as such term is defined in Rules 13a-15(f) and 15d-15(f) under the Exchange Act) during the fiscal quarter ended December 31, 2015 that have materially affected, or are reasonably likely to materially affect, our internal control over financial reporting.
Item 9B. Other Information.
On February 25, 2016, the Board adopted an amendment to its Amended and Restated Bylaws (the "Bylaws") to add a new Article XV, “Exclusive Forum for Certain Litigation”, which provides that, unless the Company consents in writing to the selection of an alternative forum, the Circuit Court for Baltimore City, Maryland (or, if such court does not have jurisdiction, the United States Court for the District of Maryland, Baltimore Division) shall be the sole and exclusive forum for (a) any derivative action or proceeding brought in the right or on behalf of the Company, (b) any action asserting a claim of breach of any duty owed by any director, officer or other employee or agent of the Company to the Company or to the stockholders of the Company, (c) any action asserting a claim against the Company or any director, officer or other employee or agent of the Company arising pursuant to any provision of the MGCL, the Company's charter or the Bylaws, or (d) any action asserting a claim against the Company or any director, officer or other employee or agent of the Company that is governed by the internal affairs doctrine.
On February 22, 2016, the Company entered into an Indemnification Agreement with Lawrence B. Shapiro, using the Company's standard form for such agreement. Under this agreement, the Company has agreed to indemnify Mr. Shapiro for costs and expenses arising from claims, suits or proceedings that may arise as a result of his service to the Company to the maximum extent permitted by Maryland law.
97
PART III
Item 10. Directors, Executive Officers and Corporate Governance.
The information called for by this Item is incorporated herein by reference from the Company’s definitive Proxy Statement for its 2015 Annual Meeting of Stockholders under the captions "Election of Directors," "Corporate Governance and Board Matters," "Section 16(a) Beneficial Ownership Reporting Compliance" and "Executive Officers," which will be filed with the SEC pursuant to Regulation 14A not later than 120 days after December 31, 2015.
Item 11. Executive Compensation.
The information called for by this Item is incorporated herein by reference from the Company’s definitive Proxy Statement for its 2016 Annual Meeting of Stockholders under the captions "Executive Officers - Executive Compensation," "Director Compensation" and "Corporate Governance and Board Matters," which will be filed with the SEC pursuant to Regulation 14A not later than 120 days after December 31, 2015.
Item 12. Security Ownership of Certain Beneficial Owners and Management and Related Stockholder Matters.
For information regarding securities authorized for issuance under our equity compensation plan, see Part II, Item 5 of this report. Other than such information, the information called for by this Item is incorporated herein by reference from the Company’s definitive Proxy Statement for its 2016 Annual Meeting of Stockholders under the caption "Security Ownership of Management and Certain Beneficial Owners," which will be filed with the SEC pursuant to Regulation 14A not later than 120 days after December 31, 2015.
Item 13. Certain Relationships and Related Transactions, and Director Independence.
The information called for by this Item is incorporated herein by reference from the Company’s definitive Proxy Statement for its 2016 Annual Meeting of Stockholders under the captions "Corporate Governance and Board Matters" and "Related Party Transactions," which will be filed with the SEC pursuant to Regulation 14A not later than 120 days after December 31, 2015.
Item 14. Principal Accounting Fees and Services.
The information called for by this Item is incorporated herein by reference from the Company’s definitive Proxy Statement for its 2016 Annual Meeting of Stockholders under the caption "Ratification of Selection of Independent Registered Public Accounting Firm - Auditor Fees," which will be filed with the SEC pursuant to Regulation 14A not later than 120 days after December 31, 2015.
98
PART IV
Item 15. Exhibits, Financial Statement Schedules.
(a)(1) Financial Statements: The following financial statements are included in Item 8 herein:
(a)(2) Financial Statement Schedules: The following financial statement schedule is included in Item 8 herein:
All other schedules are omitted because they are either not required, are not applicable, or the information is included in the consolidated financial statements and notes thereto.
(a)(3) Exhibits:
The exhibits listed on the accompanying Exhibit Index are filed or incorporated by reference as part of this Annual Report on Form 10-K.
99
SIGNATURES
Pursuant to the requirements of Section 13 or 15(d) of the Securities Exchange Act of 1934, the registrant has duly caused this report to be signed on its behalf by the undersigned, thereunto duly authorized.
SILVER BAY REALTY TRUST CORP. | ||||
Date: | February 25, 2016 | By: | /s/ Thomas W. Brock | |
Thomas W. Brock | ||||
Interim President and Chief Executive Officer | ||||
Pursuant to the requirements of the Securities Exchange Act of 1934, this report has been signed below by the following persons on behalf of the registrant and in the capacities and on the dates indicated.
Signature | Title | Date | ||
/s/ Thomas W. Brock | Interim President, Chief Executive Officer and Director | February 25, 2016 | ||
Thomas W. Brock | (Principal Executive Officer) | |||
/s/ Christine Battist | Chief Financial Officer and Treasurer | February 25, 2016 | ||
Christine Battist | (Principal Financial Officer) | |||
/s/ Julie M. Ellis | Chief Accounting Officer | February 25, 2016 | ||
Julie M. Ellis | (Principal Accounting Officer) | |||
/s/ Irvin R. Kessler | Chairman of the Board of Directors | February 22, 2016 | ||
Irvin R. Kessler | ||||
/s/ Daryl J. Carter | Director | February 23, 2016 | ||
Daryl J. Carter | ||||
/s/ Tanuja M. Dehne | Director | February 22, 2016 | ||
Tanuja M. Dehne | ||||
/s/ Stephen G. Kasnet | Director | February 22, 2016 | ||
Stephen G. Kasnet | ||||
/s/ Thomas Siering | Director | February 22, 2016 | ||
Thomas Siering | ||||
/s/ Ronald N. Weiser | Director | February 25, 2016 | ||
Ronald N. Weiser | ||||
100
EXHIBIT INDEX
Exhibit Number | Incorporated by Reference | |||||||||
Description | Form | File No. | Exhibit | Filing Date | ||||||
2.1* | Contribution Agreement by and among Silver Bay Realty Trust Corp., Silver Bay Operating Partnership L.P., and Two Harbors Operating Company LLC, dated December 4, 2012. | S-11/A | 333-183838 | 2.1 | December 12, 2012 | |||||
2.2* | Contribution Agreement by and among Silver Bay Realty Trust Corp., Silver Bay Operating Partnership L.P. and the members of Polar Cactus LLC, dated December 4, 2012. | S-11/A | 333-183838 | 2.2 | December 12, 2012 | |||||
2.3* | Contribution Agreement by and among Silver Bay Realty Trust Corp., Silver Bay Operating Partnership L.P. and the members of Polar Cactus II LLC, dated December 4, 2012. | S-11/A | 333-183838 | 2.3 | December 12, 2012 | |||||
2.4* | Contribution Agreement by and among Silver Bay Realty Trust Corp., Silver Bay Operating Partnership L.P. and the members of Cool Willow LLC, dated December 4, 2012. | S-11/A | 333-183838 | 2.4 | December 12, 2012 | |||||
2.5* | Agreement and Plan of Merger by and among Silver Bay Realty Trust Corp., Silver Bay Operating Partnership L.P., SB RESI I Merger Sub LLC and Provident Residential Real Estate Fund LLC, dated December 4, 2012. | S-11/A | 333-183838 | 2.5 | December 12, 2012 | |||||
2.6* | Agreement and Plan of Merger by and among Silver Bay Realty Trust Corp., Silver Bay Operating Partnership L.P., SB RESI II Merger Sub LLC and Resi II LLC. | S-11/A | 333-183838 | 2.6 | December 12, 2012 | |||||
2.7* | Representation, Warranty and Indemnification Agreement by and among Silver Bay Realty Trust Corp., Silver Bay Operating Partnership L.P. and Provident Real Estate Advisors LLC, dated December 4, 2012. | S-11/A | 333-183838 | 2.7 | December 12, 2012 | |||||
2.8* | Contribution Agreement dated as of August 3, 2014 among Silver Bay Realty Trust Corp., Silver Bay Operating Partnership L.P., Pine River Domestic Management L.P., Provident Real Estate Advisors LLC, and PRCM Real Estate Advisers LLC. | 8-K | 001-35760 | 2.1 | August 4, 2014 | |||||
2.9* | Real Estate Sales Contract, dated as of February 18, 2015, between The American Home Real Estate Investment Trust, Inc. and 2015A Property Owner LLC | 10-Q | 001-35760 | 2.2 | May 7, 2015 | |||||
2.10* | Amendment dated June 1, 2015 to Real Estate Sales Contract dated as of February 18, 2015 with The American Home Real Estate Investment Trust, Inc. | 10-Q | 001-35760 | 2.3 | August 6, 2015 | |||||
2.11* | Amendment dated July 1, 2015 to Real Estate Sales Contract dated as of February 18, 2015 with The American Home Real Estate Investment Trust, Inc. | 10-Q | 001-35760 | 2.4 | November 5, 2015 | |||||
2.12* | Amendment dated September 1, 2015 to Real Estate Sales Contract dated as of February 18, 2015 with The American Home Real Estate Investment Trust, Inc. | 10-Q | 001-35760 | 2.5 | November 5, 2015 | |||||
2.13* | Amendment dated October 1, 2015 to Real Estate Sales Contract dated as of February 18, 2015 with The American Home Real Estate Investment Trust, Inc. | 10-Q | 001-35760 | 2.6 | November 5, 2015 | |||||
2.14* | Amendment dated December 15, 2015 to Real Estate Sales Contract dated as of February 18, 2015 with The American Home Real Estate Investment Trust, Inc. | |||||||||
3.1 | Articles of Amendment and Restatement of Silver Bay Realty Trust Corp. | 10-K | 001-35760 | 3.1 | March 1, 2013 | |||||
101
3.2 | Amended and Restated Bylaws of Silver Bay Realty Trust Corp. | |||||||||
3.3 | Articles Supplementary for Cumulative Redeemable Preferred Stock of Silver Bay Trust Corp. | 10-K | 001-35760 | 3.3 | March 1, 2013 | |||||
4.1 | Specimen Common Stock Certificate of Silver Bay Realty Trust Corp. | S-11/A | 333-183838 | 4.1 | November 23, 2012 | |||||
4.2 | Registration Rights Agreement by and among Silver Bay Realty Trust Corp. and certain holders of common units in Silver Bay Operating Partnership L.P., dated September 30, 2014. | 10-K | 001-35760 | 4.5 | February 26, 2015 | |||||
10.1 | Amended and Restated Limited Partnership Agreement of Silver Bay Operating Partnership L.P. | 10-K | 001-35760 | 10.1 | March 1, 2013 | |||||
10.2 | Amendment to Limited Partnership Agreement and Continuation of Business between Silver Bay Operating Partnership L.P., Silver Bay Management LLC and Silver Bay Realty Trust Corp. | 10-Q | 001-35760 | 10.4 | August 7, 2014 | |||||
10.3** | Silver Bay Realty Trust Corp. 2012 Equity Incentive Plan. | S-11/A | 333-183838 | 10.8 | December 4, 2012 | |||||
10.4** | Form of Restricted Stock Agreement under the 2012 Equity Incentive Plan. | 10-K | 001-35760 | 10.8 | March 1, 2013 | |||||
10.5** | Form of Performance-Based Share Unit Agreement under the 2012 Equity Incentive Plan. | 8-K | 001-35760 | 10.1 | February 19, 2015 | |||||
10.6 | Form of Indemnification Agreement by and between Silver Bay Realty Trust Corp. and certain officers and directors. | S-11/A | 333-183838 | 10.10 | November 23, 2012 | |||||
10.7 | Silver Bay Realty Trust Corp. Amended and Restated Director Compensation Policy. | 10-Q | 001-35760 | 10.6 | August 8, 2013 | |||||
10.8 | Amended and Restated Revolving Credit Agreement, dated as of February 18, 2015, among Silver Bay Operating Partnership L.P., several property owners party thereto, SB Financing Trust Owner LLC, U.S. Bank National Association, Bank of America, National Association, JPMorgan Chase Bank, National Association and the lenders party thereto. | 10-Q | 001-35760 | 10.1 | May 7, 2015 | |||||
10.9 | Joinder Agreement dated as of April 1, 2015 adding new borrowers to the Amended and Restated Revolving Credit Agreement dated as of February 18, 2015. | 10-Q | 001-35760 | 10.1 | August 6, 2015 | |||||
10.10 | First Amendment dated as of October 20, 2015 to the Amended and Restated Revolving Credit Agreement dated as of February 18, 2015. | 10-Q | 001-35760 | 10.1 | November 5, 2015 | |||||
10.11 | Loan Agreement dated as of August 12, 2014 between SBY 2014-1 Borrower LLC, as Borrower, and JPMorgan Chase Bank, National Association, as Lender. | 8-K | 001-35760 | 10.1 | August 18, 2014 | |||||
21.1 | List of Subsidiaries. | |||||||||
23.1 | Consent of Ernst & Young LLP. | |||||||||
31.1 | Certification of Chief Executive Officer pursuant to Rule 13a-14(a)/15d-14(a) of the Securities Exchange Act of 1934. | |||||||||
31.2 | Certification of Chief Financial Officer pursuant to Rule 13a-14(a)/15d-14(a) of the Securities Exchange Act of 1934. | |||||||||
32.1 | Certification of Chief Executive Officer pursuant to 18 U.S.C. Section 1350, as adopted pursuant to Section 906 of the Sarbanes-Oxley Act of 2002. | |||||||||
32.2 | Certification of Chief Financial Officer pursuant to 18 U.S.C. Section 1350, as adopted pursuant to Section 906 of the Sarbanes-Oxley Act of 2002. | |||||||||
101.INS XBRL Instance Document | ||||||||||
102
101.SCH XBRL Taxonomy Extension Schema Document | ||||||||||
101.CAL XBRL Taxonomy Extension Calculation Linkbase Document | ||||||||||
101.DEF XBRL Taxonomy Extension Definition Linkbase Document | ||||||||||
101.LAB XBRL Taxonomy Extension Label Linkbase Document | ||||||||||
101.PRE XBRL Taxonomy Extension Presentation Linkbase Document | ||||||||||
_______________
* | The schedules and exhibits to this agreement have been omitted from this filing. The Company will furnish supplementally a copy of any such omitted schedules or exhibits to the SEC upon request. |
** | Indicates a management contract or compensatory plan. |
103