Attached files
| file | filename |
|---|---|
| EX-23 - EX-23 - XPO Logistics, Inc. | xpo201410-kexx23.htm |
| EX-21 - EX-21 - XPO Logistics, Inc. | xpo201410-kexx21.htm |
| EX-31.1 - EX-31.1 - XPO Logistics, Inc. | xpo201410-kexx311.htm |
| EX-32.2 - EX-32.2 - XPO Logistics, Inc. | xpo201410-kexx322.htm |
| EX-32.1 - EX-32.1 - XPO Logistics, Inc. | xpo201410-kexx321.htm |
| EX-31.2 - EX-31.2 - XPO Logistics, Inc. | xpo201410-kexx312.htm |
| EXCEL - IDEA: XBRL DOCUMENT - XPO Logistics, Inc. | Financial_Report.xls |
UNITED STATES
SECURITIES AND EXCHANGE COMMISSION
Washington, D.C. 20549
Form 10-K
(Mark One)
ý | ANNUAL REPORT PURSUANT TO SECTION 13 OR 15(d) OF THE SECURITIES EXCHANGE ACT OF 1934 |
For the Fiscal Year Ended December 31, 2014
OR
¨ | TRANSITION REPORT PURSUANT TO SECTION 13 OR 15(d) OF THE SECURITIES EXCHANGE ACT OF 1934 |
For the transition period from to
Commission File Number: 001-32172
XPO Logistics, Inc.
(Exact name of registrant as specified in its charter)
Delaware | 03-0450326 | |
(State or other jurisdiction of incorporation or organization) | (I.R.S. Employer Identification No.) | |
Five Greenwich Office Park
Greenwich, Connecticut 06831
(Address of principal executive offices)
(855) 976-4636
(Registrant’s telephone number, including area code)
Securities registered under Section 12(b) of the Act:
Title of Each Class: | Name of Each Exchange on Which Registered: | |
Common Stock, par value $.001 per share | New York Stock Exchange | |
Securities registered pursuant to Section 12(g) of the Act:
None
__________________________________
Indicate by check mark if the registrant is a well-known seasoned issuer, as defined in Rule 405 of the Securities Act. Yes ý No ¨
Indicate by check mark if the registrant is not required to file reports pursuant to Section 13 or Section 15(d) of the Exchange Act. Yes ¨ No ý
Indicate by check mark whether the registrant (1) has filed all reports required to be filed by Section 13 or 15(d) of the Securities Exchange Act of 1934 during the preceding 12 months (or for such shorter period that the registrant was required to file such reports), and (2) has been subject to such filing requirements for the past 90 days. Yes ý No ¨
Indicate by check mark whether the registrant has submitted electronically and posted on its corporate website, if any, every Interactive Data File required to be submitted and posted pursuant to Rule 405 of Regulation S-T (§232.405 of this chapter) during the preceding 12 months (or for such shorter period that the registrant was required to submit and post such files). Yes ý No ¨
Indicate by check mark if disclosure of delinquent filers pursuant to Item 405 of Regulation S-K (§229.405 of this chapter) is not contained herein, and will not be contained, to the best of registrant’s knowledge, in definitive proxy or information statements incorporated by reference in Part III of this Form 10-K or any amendment to this Form 10-K. ý
Indicate by check mark whether the registrant is a large accelerated filer, an accelerated filer, a non-accelerated filer, or a smaller reporting company. See the definitions of “large accelerated filer,” “accelerated filer” and “smaller reporting company” in Rule 12b-2 of the Exchange Act. (Check one):
Large accelerated filer | ý | Accelerated filer | ¨ | |||
Non-accelerated filer | ¨ (Do not check if a smaller reporting company) | Smaller reporting company | ¨ | |||
Indicate by check mark whether the registrant is a shell company (as defined in Rule 12b-2 of the Act): Yes ¨ No ý
The aggregate market value of the registrant’s common stock, par value $0.001 per share, held by non-affiliates of the registrant was $1,505,183,527 as of June 30, 2014, the last business day of the registrant’s most recently completed second fiscal quarter, based upon the closing price of $28.62 per share on the NYSE on that date.
As of February 20, 2015, there were 79,367,271 shares of the registrant’s common stock, par value $0.001 per share, outstanding.
DOCUMENTS INCORPORATED BY REFERENCE
Specified portions of the registrant’s proxy statement, which will be filed with the Securities and Exchange Commission pursuant to Regulation 14A in connection with the registrant’s 2015 Annual Meeting of Stockholders (the “Proxy Statement”), are incorporated by reference into Part III of this Annual Report on Form 10-K. Except with respect to information specifically incorporated by reference in this Annual Report, the Proxy Statement is not deemed to be filed as part hereof.
XPO LOGISTICS, INC.
FORM 10-K—FOR THE YEAR ENDED DECEMBER 31, 2014
TABLE OF CONTENTS
PART I | Page No. | |
Item 1 | ||
Item 1A | ||
Item 1B | ||
Item 2 | ||
Item 3 | ||
Item 4 | ||
PART II | ||
Item 5 | ||
Item 6 | ||
Item 7 | ||
Item 7A | ||
Item 8 | ||
Item 9 | ||
Item 9A | ||
Item 9B | ||
PART III | ||
Item 10 | ||
Item 11 | ||
Item 12 | ||
Item 13 | ||
Item 14 | ||
PART IV | ||
Item 15 | ||
Exhibit Index
This Annual Report on Form 10-K is for the year ended December 31, 2014. The Securities and Exchange Commission (the “SEC”) allows us to incorporate by reference information that we file with the SEC, which means that we can disclose important information to you by referring you directly to those documents. Information incorporated by reference is considered to be part of this Annual Report. In addition, information that we file with the SEC in the future will automatically update and supersede information contained in this Annual Report.
1
PART I
ITEM 1. BUSINESS
General
XPO Logistics, Inc., a Delaware corporation, together with its subsidiaries (“XPO” or the “Company”), is a leading asset-light provider of third-party logistics services. Shippers and carriers outsource their transportation logistics to us, and we facilitate supply chain solutions.
As a third-party, asset-light logistics provider, we utilize our relationships with subcontracted transportation providers—typically independent contract motor carriers, railroads and charter aircraft owners for domestic loads, and air and ocean carriers for international shipments. As of December 31, 2014, we had approximately 4,100 trucks under contract to our intermodal, expedited and last mile business units. We have access to additional transportation capacity through our relationships with over 30,000 other carriers.
In September 2011, following the equity investment in the Company led by Jacobs Private Equity, LLC, we began implementing our strategy to leverage our strengths, with the goals of significant growth and value creation. Through the disciplined execution of our strategy, we have built leading positions in some of the fastest-growing sectors of transportation logistics in North America. As of December 31, 2014, we were:
• | The third largest freight brokerage firm and a Top 50 logistics company; |
• | The largest provider of last mile logistics for heavy goods and a leading last mile provider to the e-commerce industry; |
• | The largest manager of expedited shipments through our expedited ground, air charter and web-based managed transportation services; |
• | The third largest provider of intermodal services; and |
• | A leading provider of highly engineered, technology-enabled contract logistics services for large manufacturers and service companies. |
We believe that our broad service offerings give us a competitive advantage, as many customers, particularly large shippers, increasingly seek to do business with fewer, larger third-party logistics providers that offer deep capacity across a wide range of services. Our services are provided by a well-trained employee base that understands the importance of providing world-class service. We currently have more than 10,000 employees, all non-union.
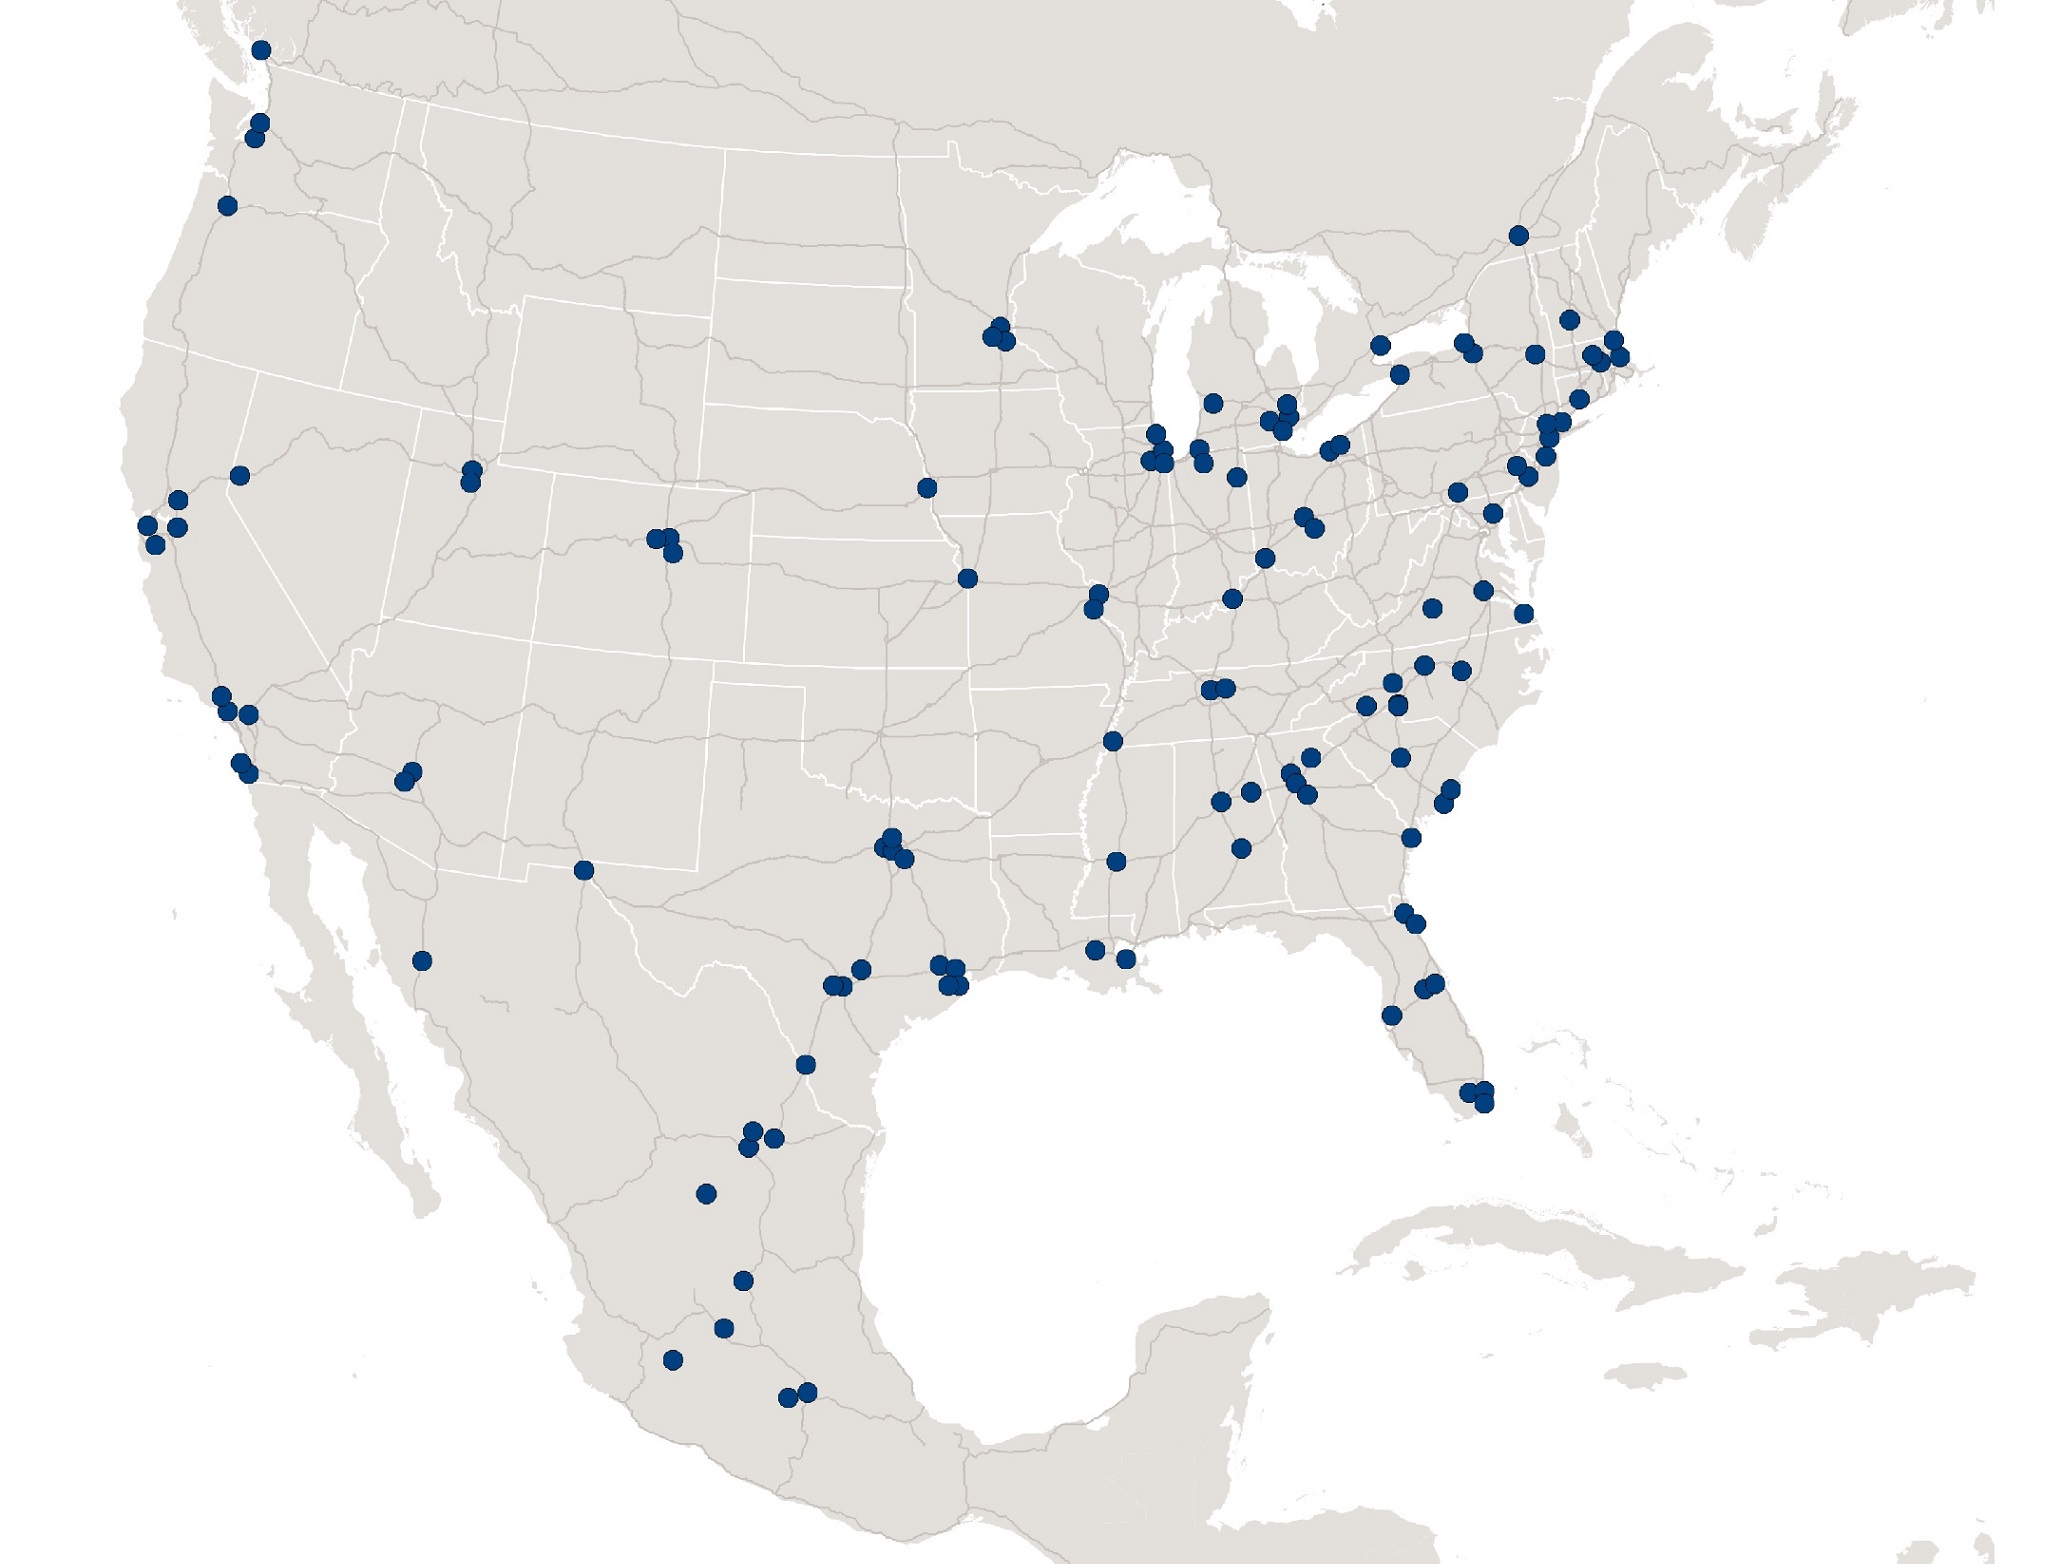
As of December 31, 2014, our Transportation and Logistics segments operated from 197 locations in North America, Europe and Asia including: 178 Company-owned branches and 19 independent agent offices. See below for a map of our locations over North America.
2
XPO Logistics Footprint in North America as of December 31, 2014
Our Business Units
As of December 31, 2014, our activities consisted of two business segments. Our Transportation segment consists of our truck brokerage, intermodal, last mile, expedited transportation and freight forwarding businesses. Our Logistics segment consists of our contract logistics business. We provide financial information for our segments in Note 16 to our Consolidated Financial Statements. The differences in our operating and reportable segments from our last annual report are related to an internal management reorganization and acquisitions during the year ended December 31, 2014. Our previous Freight Brokerage, Expedited Transportation and Freight Forwarding reportable segments have been consolidated into the Transportation operating and reportable segment while our acquisition of New Breed (previously the Contract Logistics reportable segment) represents the Logistics operating and reportable segment.
Transportation
Our Transportation segment provides transportation brokerage services to large multi-national, medium-sized and small business customers where the Company manages all aspects of the services offered including selecting qualified carriers/vessels, negotiating rates, tracking shipments, billing and resolving disputes. Transportation offers a comprehensive suite of services with the common goal of facilitating the movement of goods using proprietary transportation management technology and third-party carriers. Transportation includes our truck brokerage, intermodal, last mile, expedited transportation and freight forwarding operations as further described below.
Truck Brokerage
Our XPO Logistics truck brokerage business is a non-asset business that places shippers’ freight with qualified carriers, primarily trucking companies. This freight is typically classified as truckload (“TL”) or less than-truckload (“LTL”) shipments. Customers offer loads to us via telephone, fax, email, electronic data interchange and the Internet on a daily basis. The majority of these services are priced on a transactional or spot market basis for both customers and carriers. In some cases, we contractually agree to handle a significant portion of a customer’s freight at pre-determined rates for specific origin and destination parameters. We collect payments from our customers and pay the carriers for transporting customer loads.
From 2011 to 2014, we grew our truck brokerage business from a single location to the third largest truck brokerage firm based on net revenues in North America in 2014. We have continued to grow our truck brokerage operations, and during 2011
3
through 2014, we made six brokerage acquisitions and established 13 cold-start sales office locations. We believe that we have a substantial opportunity to continue to scale up the business given that, based on our revenue for the quarter ended December 31, 2014, we currently serve less than 1.5% of the estimated addressable truck brokerage market.
Intermodal
Our XPO Logistics intermodal business is asset-light; it provides container capacity, rail brokerage, local drayage (also called cartage), on-site operational services and door-to-door shipment management. We contract with railroads to provide the long-haul portion of the shipment of freight in containers, and we contract with trucking companies for the local pick-up and delivery legs of the intermodal freight movement. We also provide customized electronic tracking and analysis of market prices and negotiated rail, truck and intermodal rates, in order to determine the optimal transportation routes.
Since our March 2014 acquisition of Pacer International, Inc. and its subsidiaries (“Pacer”), we have offered door-to-door intermodal services to a wide range of customers in North America, including large industrial and retail shippers, transportation intermediaries such as intermodal marketing companies, and steamship lines. The Pacer acquisition made us the third largest provider of intermodal services in North America, and a leading provider of intermodal services in the fast-growing cross-border Mexico sector.
Last Mile
Our XPO Last Mile business is a leading non-asset provider of last mile logistics in North America and the largest facilitator of last mile deliveries for heavy goods. Last mile delivery comprises the final stage of the delivery from a local distribution center or retail store to the end-consumer’s home or business. This is a fast growing sector of transportation logistics that serves blue chip retailers, e-commerce companies and smaller retailers with limited in-house trucking capabilities.
Important aspects of last mile service are responsiveness to seasonal demand, economies of scale, and an ability to maintain a consistently high quality of customer experience. In addition, the last mile process often requires incremental services, including pre-scheduled delivery times, unpacking, assembly, utility connection, installation or removal of an old product. These additional services are commonly referred to as white-glove services. We use our proprietary technology platforms to collect customer feedback, monitor carrier performance, manage capacity and communicate during narrow windows of service to ensure an end-consumer experience that protects the brand equity of our customers.
In August 2013, we acquired 3PD Holding, Inc. (“3PD”), which made us a leader in the heavy goods sector of last mile logistics. In November 2013, we expanded our last mile capabilities with the acquisition of Optima Service Solutions, LLC (“Optima”), which uses a contractual network of independent carriers and technicians to facilitate last mile delivery and installation of large appliances and electronics. In June 2014, we rebranded our last mile delivery logistics business to XPO Last Mile. In July 2014, we further expanded our last mile operations with the acquisition of Simply Logistics Inc d/b/a Atlantic Central Logistics (“ACL”), which focuses on serving the e-commerce channel through 14 East Coast locations. In February 2015, we further expanded our last mile logistics operations through the acquisition of UX Specialized Logistics (“UX”), a North American provider of last mile logistics services for major retail chains and e-commerce companies.
Expedited Transportation
Our expedited transportation group is predominantly a non-asset based service provider—substantially all of the transportation equipment used in its operations is provided by independent owner-operators who own one piece of equipment, or by independent owners of multiple pieces of equipment who employ multiple drivers, commonly referred to as fleet owners. We are focused on developing strong, long-term relationships with these fleet owners and incentivizing them to furnish their capacity to us on an exclusive basis.
Our expedited transportation group operates as XPO Express, XPO NLM and XPO Air Charter, and is the largest manager of expedited shipments in North America. Expedited transportation services can be characterized as time-critical, time-sensitive or high priority freight shipments, many of which have special handling needs. These urgent needs typically arise due to tight supply chain tolerances, interruptions or changes in the supply chain or the failure of another mode of transportation within the supply chain.
Expedited shipments are predominantly direct transit movements offering door-to-door service within tightly prescribed time parameters. Customers request our services typically on a per-load transaction basis, with only a small percentage of loads being scheduled for future delivery dates. We operate an ISO 9001:2008 certified 24-hour, seven-day-a-week call center that gives our customers on-demand communications and status updates relating to their shipments.
XPO Express facilitates the over-the-road movement of urgent freight and is the largest component of our expedited transportation group. XPO Air Charter arranges point-to-point air charter services and combines them with ground transportation to achieve the most expedient delivery time. In the year ended December 31, 2014, XPO NLM’s proprietary
4
online bid technology managed more than $750 million of gross transportation expenditures. Our expedited services are supported by our freight forwarding business, which can arrange shipments on demand as part of multi-modal freight movements.
Freight Forwarding
Our XPO Global Logistics freight forwarding business operates as a non-asset based logistics provider for domestic and international shipments. We provide time-critical, time-sensitive and cost-sensitive services for global freight movements, domestic U.S. and cross-border North America movements, as well as value-added and customized services such as asset retrieval.
XPO Global Logistics provides its services through a network of relationships with ground, air and ocean carriers and a network of Company-owned and agent-owned locations. Our freight forwarding capabilities are not restricted by size, weight, mode or location, and therefore are potentially attractive to a wide market base.
Our subsidiary, Ocean World Lines, Inc. (“OWL”), operates as a non-vessel operating common carrier (“NVOCC”) and transports our customers’ freight by contracting with the actual vessel operator. We consolidate the freight bound for a particular destination from a common shipping point, prepare required shipping documents, arrange for any inland transportation, deliver the freight to the vessel operator and arrange transportation to the final destination. At the destination port, acting directly or through our agent, we deliver the freight to the receivers of the goods, which may include customs clearance and inland freight transportation to the final destination.
As a customs broker, we are licensed by the U.S. Customs and Border Protection Service to act on behalf of importers in handling customs formalities and other details critical to the importation of goods. We prepare and file formal documentation required for clearance through customs agencies, obtain customs bonds, facilitate the payment of import duties on behalf of the importer, arrange for the payment of collect freight charges, assist with determining and obtaining the best commodity classifications for shipments and assist with qualifying for duty drawback refunds. We provide customs brokerage services to direct domestic importers in connection with many of the shipments that we handle as an NVOCC, as well as shipments arranged by other freight forwarders, NVOCCs or vessel operating common carriers.
Logistics
On September 2, 2014, the Company acquired New Breed Holding Company (“New Breed”), a preeminent U.S. provider of asset-light based, complex, technology-enabled contract logistics for large multi-national and medium-sized corporations and government agencies.
New Breed’s customers primarily operate in industries with high-growth outsourcing opportunities, such as technology, telecom, e-commerce, aerospace and defense, medical equipment and select areas of manufacturing. These customers have demanding requirements for quality standards, real-time data visibility, customer service, handling of high-value products, high transaction volumes with large numbers of SKUs, and/or time-assured deliveries.
With our acquisition of New Breed, we design, implement, operate and optimize mission-critical outsourced supply chains for leading corporations. Through New Breed’s supply chain technology and operational expertise, we offer services solving complex supply chain challenges and create and implement transformative solutions for customers, while reducing their operating costs and inventory levels and improving their customer service. We believe that the combination of New Breed’s information technology (“IT”) workforce with our own—resulting in over 600 dedicated IT professionals focused on customer-facing innovations—advances our competitive advantage across all our lines of business.
Our Strategy
Our strategy has three main components:
• | Acquisitions. We take a disciplined approach to acquisitions: we look for companies that are highly scalable and are a good strategic fit with our core competencies. When we acquire a company, we seek to integrate it with our operations by moving the acquired operations onto our technology platform that connects our broader organization. We gain more carriers, customers, lane histories and pricing histories with each acquisition, and some acquisitions add complementary services. We use these resources company-wide to buy transportation more efficiently and to cross-sell a more complete supply chain solution to customers. In 2012, we completed the acquisition of four non-asset, third-party logistics companies. We acquired another six companies in 2013, including 3PD, the largest non-asset, third-party provider of last mile logistics for heavy goods in North America, and National Logistics Management (“NLM”), the largest provider of web-based expedited transportation management in North America. On March 31, 2014, we acquired Pacer, the third largest provider of intermodal transportation services in North America. On July 28, 2014, we acquired last mile logistics company ACL. We |
5
completed our acquisition of contract logistics company New Breed on September 2, 2014. On February 9, 2015, we acquired substantially all of the assets of last mile logistics company UX Specialized Logistics (“UX”). We have an active pipeline of key targets, and we plan to continue acquiring quality companies that fit our strategy for growth.
• | Cold-starts. We believe that cold-starts can generate high returns on invested capital because of the relatively low amount of start-up capital—generally one million dollars or less for a brokerage coldstart—and the large component of variable-based incentive compensation. Given this model, cold-starts of any size can generate high returns on invested capital. We plan to continue to open cold-start locations where we see the potential for strong returns. |
• | Optimization of operations. We are continuing to optimize our existing operations by growing our sales force, implementing advanced information technology, cross-selling our services and leveraging our shared capacity. We have a disciplined framework of processes in place for the recruiting, training and mentoring of newly hired employees, and for marketing to the hundreds of thousands of prospective customers who can use our services. Our network is supported by our proprietary information technology that includes robust sales, service, carrier procurement and customer experience management capabilities, as well as benchmarking and analysis. Most important to our growth, we are developing a culture of passionate, world-class service for customers. |
Information Systems and Intellectual Property
One of the ways we empower our employees to deliver world-class service is through our information technology. We believe that technology is a big differentiator in our industry. We have an IT team of over 600 talented professionals that focuses solely on driving innovation and the effectiveness of our systems.
In our Transportation segment, we have been making a significant investment in information technology. In our truck brokerage business, we have developed a proprietary software solution that provides actionable pricing information as well as cost effective, timely and reliable access to carrier capacity, which we believe gives us an advantage versus our competitors. In our last mile business, our proprietary software provides real-time workflow visibility and customer experience management for superior satisfaction ratings. Our XPO NLM business manages more than $750 million of gross transportation spend using our proprietary online bidding software where carriers bid on loads that are awarded electronically. In our expedited transportation business, we utilize satellite tracking and communication units on our independently-contracted vehicles, which provides our customers with real-time electronic updates.
We have over 200 IT projects currently planned for launch in 2015, including the planned release of our proprietary Rail Optimizer system for our intermodal business, currently in beta test. This software is designed to optimize all aspects of the intermodal network, including shipment management, capacity flow and asset management, market-based pricing and shipment execution with our rail providers.
In 2014, our acquisition of New Breed included proprietary technology that enables sophisticated contract logistics solutions for large multi-national and medium-sized corporations and government agencies with complex supply chain requirements. This software supports services such as omni-channel distribution, reverse logistics, transportation management, freight bill audit and payment, lean manufacturing support, aftermarket support and supply chain optimization.
Technology represents one of our Company’s largest categories of investment within our annual capital expenditure budget, reflecting our belief that the continual enhancement of our technology platforms is critical to our success. By continuing to develop our technology solutions, we plan to improve our productivity through automation and process optimization, and to be in position to effectively integrate our anticipated acquisitions and leverage our scale across XPO.
We rely on a combination of trademarks, copyrights, trade secrets, and nondisclosure and non-competition agreements to establish and protect our intellectual property and proprietary technology. Additionally, we have numerous registered trademarks, trade names, and logos in the United States and international locations.
Customers, Sales and Marketing
Our Company provides services to a variety of customers ranging in size from small, entrepreneurial organizations to Fortune 500 companies. During 2014, our business units served more than 15,000 different customers. Approximately 16.1% of revenue for the year ended December 31, 2014 was attributable to our top five clients for such period, with our largest customer accounting for approximately 5.1% of our revenue during such period.
Our customers are engaged in a wide range of industries, including manufacturing, industrial, retail, technology, aerospace, commercial, life sciences and government sectors. In addition, we serve third-party logistics providers, who themselves serve a multitude of customers and industries. Our third-party logistics provider customers vary in size from small, independent, single-facility organizations to global logistics companies. Our truck brokerage, last mile, intermodal, and expedited services are marketed to the United States, Canada and Mexico while our freight forwarding business serves these
6
same North American markets, as well as global markets. Our contract logistics services are marketed primarily in the United States.
To serve our customers, we maintain a significant staff of sales representatives and related support personnel. In addition to our own sales staff and locations, our network of independent agents manages sales relationships within their exclusive markets in our freight forwarding business.
Our sales strategy is twofold: we seek to establish long-term relationships with new accounts and to increase the amount of business generated from our existing customer base. These objectives are served by our position as one of the largest third-party logistics providers in North America and by our ability to cross-sell a range of services. We believe that these attributes are competitive advantages in the transportation logistics industry. We are focused on raising our profile in front of every prospective customer in this sector by deploying a highly experienced, dedicated team that sells to the 2,000 largest shippers, which we have identified as strategic accounts, and the next largest 1,600 shippers, identified as national accounts. Additionally, our branch sales teams pursue the hundreds of thousands of small to medium-sized shippers operating in North America. See Note 16 to the Consolidated Financial Statements for further geographic information.
Competition
The transportation logistics industry is intensely competitive with thousands of transportation companies competing in the domestic and international markets. Our competitors include local, regional, national and international companies with the same services that our business units provide. Due in part to the fragmented nature of the industry, our business units do not operate from a position of dominance, and therefore must strive daily to retain existing business relationships and forge new relationships.
We compete on service, reliability, scope of operations, information technology capabilities and price. Some competitors have larger customer bases, significantly more resources and more experience than we do. The health of the transportation logistics industry will continue to be a function of domestic and global economic growth. However, we believe we will benefit from a long-term outsourcing trend that should continue to enable certain sectors of transportation logistics, particularly the freight brokerage sector, to grow at rates that outpace growth in the macro-environment.
Regulation
Our operations are regulated and licensed by various governmental agencies in the United States and in the other countries where we operate. Such regulations impact us directly and indirectly by regulating third-party transportation providers we use to transport freight for our customers.
Regulation affecting Motor Carriers, Owner Operators and Transportation Brokers. Our subsidiaries that operate as motor carriers have licenses to operate as motor carriers from the Federal Motor Carrier Safety Administration (“FMCSA”) of the U.S. Department of Transportation (“DOT”). Our subsidiaries acting as property brokers have property broker licenses from the FMCSA. Our motor carrier subsidiaries and the third-party motor carriers we engage in the United States must comply with the safety and fitness regulations of the DOT, including those relating to drug- and alcohol-testing, hours-of-service, records retention, vehicle inspection, driver qualification and minimum insurance requirements. Weight and equipment dimensions also are subject to government regulations. We also may become subject to new or more restrictive regulations relating to emissions, drivers’ hours-of-service, independent contractor eligibility requirements, onboard reporting of operations, air cargo security and other matters affecting safety or operating methods. Other agencies, such as the U.S. Environmental Protection Agency (“EPA”), the Food and Drug Administration, the California Air Resources Board, and U.S. Department of Homeland Security (“DHS”), also regulate our equipment, operations and independent contractor drivers. We and the third-party carriers we use are also subject to a variety of state vehicle registration and licensing requirements.
The FMCSA has introduced the Compliance Safety Accountability program (“CSA”), which uses a Safety Management System (“SMS”) to rank motor carriers on seven categories of safety-related data, known as Behavioral Analysis and Safety Improvement Categories, or “BASICs,” which data, it is anticipated, will eventually be used for determining a carrier’s DOT safety rating under revisions to existing Safety Fitness Determination (“SFD”) regulations. As a result, our fleet could be ranked poorly as compared to our competitors, and the safety ratings of our motor carrier operations could be adversely impacted. Our network of third-party transportation providers may experience a similar result. A reduction in safety and fitness ratings may result in difficulty attracting and retaining qualified independent contractors and could cause our customers to direct their business away from us and to carriers with more favorable CSA scores, which would adversely affect our results of operations.
In the past, the subsidiaries through which we operate our expedited and intermodal drayage operations have exceeded the established intervention threshold in certain of the BASICs, and we may exceed those thresholds in the future. Depending on our ratings, we may be prioritized for an intervention action or roadside inspection, either of which could adversely affect our results of operations, or customers may be less likely to assign loads to us. We cannot predict the extent to which CSA
7
requirements or safety and fitness ratings under SMS or SFD could adversely affect our business, operations or ability to retain compliant drivers, or those of our subsidiaries, independent contractors or third-party transportation providers.
The FMCSA has proposed new rules that would require nearly all carriers, including us, to install and use electronic logging devices (“ELD”). The proposed regulations provide for the installation and use of ELDs to be required two years after publication of the final regulations. ELD installation will increase costs for, and may not be well-received by, independent contractors.
Our operations serving ports and rail yards are subject to various regulatory initiatives such as the Ports of Los Angeles and Long Beach clean truck program effective in 2009, California Air Resources Board (“CARB”) drayage truck regulation effective in 2010 and the Port of Oakland truck ban effective in 2010, each of which banned trucks that did not meet certain emissions standards. To comply with these requirements, our motor carrier subsidiaries providing intermodal drayage services in California have implemented programs to source truck capacity from independent owner operators that meet these emissions requirements. The State of California also has required diesel tractors as well as 53-foot long and other trailers operated in the state to satisfy certain fuel efficiency and other performance requirements by compliance target dates occurring between 2011 and 2023. Compliance with California’s and ports’ regulations has increased rates payable to owner operators operating in California and new tractor costs, might increase the costs of new trailers operated in California, might require the retrofitting of pre-2011 model year trailers operated in California, and could diminish equipment productivity and increase operating expenses.
Regulations affecting our Subsidiaries Providing Ocean and Air Transportation. RF International, Ltd., a Pacer subsidiary (“RFI”), is licensed as a customs broker by U.S. Customs and Border Protection (“CBP”) of DHS in each United States customs district in which it does business. All United States customs brokers are required to maintain prescribed records and are subject to periodic audits by CBP. In other jurisdictions in which we perform customs brokerage services, our operations are licensed, where necessary, by the appropriate governmental authority.
Our subsidiaries offering expedited air charter transportation are subject to regulation by the Transportation Security Administration (“TSA”) of DHS regarding air cargo security for all loads, regardless of origin and destination. XPO Global Logistics (“XGL”), RFI and XPO Air Charter also are regulated as “indirect air carriers” by the DHS and TSA. These agencies provide requirements, guidance and, in some cases, administer licensing requirements and processes applicable to the freight forwarding industry. We must actively monitor our compliance with such agency requirements to ensure that we have satisfactorily completed the security requirements and qualifications and implemented the required policies and procedures. These agencies generally require companies to fulfill these qualifications prior to transacting various types of business. Failure to do so could result in penalties and fines. The air cargo industry is also subject to regulatory and legislative actions that could affect the economic conditions within the industry by requiring changes in operating practices or influencing the demand for and the costs of providing services to clients. We cannot predict the extent to which any such regulatory or legislative actions could adversely affect our business and operations, but we strive to comply with and satisfy agency requirements.
For our international operations, XGL and RFI are members of the International Air Transportation Association (“IATA”), a voluntary association of airlines and forwarders that outlines operating procedures for freight forwarders acting as agents or third-party intermediaries for its members. A substantial portion of our international air freight business is completed with other IATA members.
For our international oceanic freight forwarding business, XGL, RFI and OWL, are registered as an Ocean Transportation Intermediary (“OTI”) by the U.S. Federal Maritime Commission (“FMC”), which establishes the qualifications, regulations and bonding requirements to operate as an OTI for businesses originating and terminating in the United States. XGL and OWL are also licensed NVOCCs and ocean freight forwarders.
Our international freight forwarder operations subject us to regulations of the U.S. Department of State, U.S. Department of Commerce and the U.S. Department of Treasury and to various laws and regulations of the other countries where we operate. Regulations cover matters such as what commodities may be shipped to what destination and to what end-user, unfair international trade practices, and limitations on entities with which we may conduct business.
Classification of Independent Contractors. Tax and other federal and state regulatory authorities as well as private litigants continue to assert that independent contractor drivers in the trucking industry are employees rather than independent contractors. Federal legislators have introduced legislation in the past to make it easier for tax and other authorities to reclassify independent contractors as employees, including legislation to increase the recordkeeping requirements for employers of independent contractors and to heighten the penalties of employers who misclassify their employees and are found to have violated employees’ overtime and/or wage requirements. Additionally, federal legislators have sought to abolish the current safe harbor allowing taxpayers meeting certain criteria to treat individuals as independent contractors if they are following a long-standing, recognized practice. Federal legislators also sought to expand the Fair Labor Standards Act to cover “non-employees” who perform labor or services for businesses, even if the “non-employees” are properly classified as independent contractors;
8
require taxpayers to provide written notice to workers based upon their classification as either an “employee” or a “non-employee”; and impose penalties and fines for violations of the notice requirements or “employee” or “non-employee” misclassifications. Some states have put initiatives in place to increase their revenues from items such as unemployment, workers’ compensation and income taxes, and a reclassification of independent contractors as employees would help states with this initiative. Taxing and other regulatory authorities and courts apply a variety of standards in their determination of independent contractor status. If our independent contractor drivers are determined to be our employees, we would incur additional exposure under some or all of the following: federal and state tax, workers’ compensation, unemployment benefits, labor, employment and tort laws, including for prior periods, as well as potential liability for employee benefits and tax withholdings.
Environmental Regulations. Our facilities and operations and our independent contractors are subject to various environmental laws and regulations dealing with the hauling, handling and disposal of hazardous materials, emissions from vehicles, engine-idling, fuel spillage and seepage, discharge and retention of storm water, and other environmental matters that involve inherent environmental risks. We have instituted programs to monitor and control environmental risks and maintain compliance with applicable environmental laws and regulations. We may be responsible for the cleanup of any spill or other release involving hazardous materials caused by our operations or business. In the past, we have been responsible for the costs of cleanup of diesel fuel spills caused by traffic accidents or other events, and none of these incidents materially affected our business or operations. We generally transport only hazardous materials rated as low-to-medium-risk, and a small percentage of our total shipments contain hazardous materials. We believe that our operations are in substantial compliance with current laws and regulations and do not know of any existing environmental condition that would reasonably be expected to have a material adverse effect on our business or operating results. We also do not expect to incur material capital expenditures for environmental controls in 2015. Future changes in environmental regulations or liabilities from newly discovered environmental conditions or violations (and any associated fines and penalties) could have a material adverse effect on our business, competitive position, results of operations, financial condition or cash flows. Federal and state governments have also proposed environmental legislation that could, among other things, potentially limit carbon, exhaust and greenhouse gas emissions. If enacted, such legislation could also result in higher new tractor and trailer costs, reduced productivity and efficiency, and increased operating expenses, all of which could adversely affect our results of operations.
Risk Management and Insurance
We generally require carriers that we engage to have at least $1 million of automobile liability insurance and $100,000 of cargo insurance, or up to $250,000 in the case of our last-mile and intermodal contract carriers. We require motor carriers we engage to enter into a written agreement with us and to meet safety and performance qualification standards. We also require motor carriers to have workers compensation and other insurance as required by law in connection with the specific tasks they are undertaking. Railroads, which are largely self-insured, provide limited common carrier cargo liability protection, generally up to $250,000 per container.
In our truck and intermodal brokerage operations, we generally are not liable for damage to our customers’ cargo or in connection with damage arising from the provision of transportation services. However, in some instances, we agree to assume cargo and other liability. While we endeavor to limit this exposure to matters arising due to our negligence or misconduct, or to cap our exposure at a stated maximum dollar amount, we are not always able to do so.
With respect to our expedited transportation and intermodal drayage operations where we perform services as a licensed motor carrier and in our freight forwarding and last-mile delivery logistics businesses, we have primary liability to our customer for cargo loss and damage and for certain liabilities caused by our independent contractors and contracted carriers. Accordingly, liability claims may be asserted against us for the actions of transportation providers we engage and their employees or independent contractor drivers, or for our actions in retaining them. Claims against us may exceed the amount of our insurance coverage or may not be covered by insurance at all.
We maintain liability insurance policies to protect us against losses that may not be recovered from the responsible contracted carrier. Our last-mile delivery logistics operations may involve installation of appliances in customers’ homes involving water, gas or electric connections. We maintain commercial general liability insurance coverage to protect us from claims related to these services. Our warehouse operations maintain legal liability insurance to protect us against claims arising from damage or loss to goods stored in our warehouses. We also maintain property damage insurance to protect us against damage to our property. Our terms of carriage on international and ocean shipments limit our liability consistent with industry standards. We offer our NVOCC and freight forwarding customers the option to purchase all risk cargo insurance for their shipments. We also maintain insurance for commercial automobile liability, truckers’ commercial automobile liability, commercial general liability, employers’ liability and umbrella and excess umbrella liability, with coverage limits and subject to self-insured retention levels that we believe are reasonable given the varying historical frequency, severity and timing of claims. However, we cannot provide assurance that our insurance coverage will effectively protect us in the event of claims made against us.
9
Seasonality
Our revenues and profitability are typically lower for the first quarter of the calendar year relative to our other quarters. We believe this is due in part to the post- holiday reduction in demand experienced by many of our customers, which leads to more capacity in the non- expedited and service-critical markets and, in turn, less demand for expedited and premium shipping services. In addition, the productivity of our independent contractors and transportation providers generally decreases during the winter season because inclement weather impedes operations. It is not possible to predict whether the historical revenue and profitability trends will occur in future periods.
Employees
As of December 31, 2014, we had approximately 10,000 full-time and part-time employees, none of whom were covered by a collective bargaining agreement. We recognize our trained staff of employees as one of our most critical resources and acknowledge the recruitment, training and retention of qualified employees as essential to our ongoing success. We believe that we have good relations with our employees.
Executive Officers of the Registrant
We provide below information regarding each of our executive officers.
Name | Age | Position | |||
Bradley S. Jacobs | 58 | Chairman of the Board and Chief Executive Officer | |||
Troy A. Cooper | 45 | Chief Operating Officer | |||
John J. Hardig | 50 | Chief Financial Officer | |||
Gordon E. Devens | 46 | Senior Vice President and General Counsel | |||
Scott B. Malat | 38 | Chief Strategy Officer | |||
Mario A. Harik | 34 | Chief Information Officer | |||
Bradley Jacobs has served as our Chief Executive Officer and Chairman of the board of directors since September 2011. Mr. Jacobs is also the managing director of Jacobs Private Equity, LLC, which is our largest stockholder. He has led two public companies: United Rentals, Inc. (NYSE: URI), which he co-founded in 1997, and United Waste Systems, Inc., founded in 1989. Mr. Jacobs served as chairman and chief executive officer of United Rentals for its first six years and as executive chairman for an additional four years. He served eight years as chairman and chief executive officer of United Waste Systems. Previously, Mr. Jacobs founded Hamilton Resources (UK) Ltd. and served as its chairman and chief operating officer. This followed the co-founding of his first venture, Amerex Oil Associates, Inc., where he was chief executive officer.
Troy Cooper has served as our Chief Operating Officer since May 2014. Mr. Cooper joined our company in September 2011 as Vice President—Finance, and has held positions of increasing responsibility since then. Mr. Cooper is responsible for the day-to-day operations and profit and loss performance of the Company. Mr. Cooper was most recently with United Rentals, Inc., where he served as vice president—group controller responsible for field finance functions. Previously, he held controller positions with United Waste Systems, Inc. and OSI Specialties, Inc. (formerly a division of Union Carbide, Inc.). Mr. Cooper began his career in public accounting with Arthur Andersen and Co. and has a degree in accounting from Marietta College.
John Hardig has served as our Chief Financial Officer since February 2012. Mr. Hardig most recently served as managing director for the Transportation & Logistics investment banking group of Stifel Nicolaus Weisel from 2003 until joining our company. Prior to that, Mr. Hardig was an investment banker in the Transportation and Telecom groups at Alex. Brown & Sons (now Deutsche Bank). Mr. Hardig holds a master of business administration degree from the University of Michigan Business School and a bachelor’s degree from the U.S. Naval Academy.
Gordon Devens has served as our Senior Vice President and General Counsel since November 2011. Mr. Devens was most recently vice president—corporate development with AutoNation, Inc., where he was previously vice president—associate general counsel. Earlier, he was an associate at the law firm of Skadden, Arps, Slate, Meagher & Flom LLP, where he specialized in mergers and acquisitions and securities law. Mr. Devens holds a doctorate of jurisprudence and a bachelor’s degree in business administration from the University of Michigan.
Scott Malat has served as our Chief Strategy Officer since July 2012. Mr. Malat served as our Senior Vice President—Strategic Planning from the time he joined us in October 2011 until July 2012. Prior to joining XPO Logistics, Mr. Malat was with Goldman Sachs Group, Inc., where he served as senior equity research analyst covering the air, rail, trucking and shipping sectors. Earlier, Mr. Malat was an equity research analyst with UBS, and a strategy manager with JPMorgan Chase & Co. He serves on the board of directors of the non-profit PSC Partners Seeking a Cure. He is a CFA® charterholder and has a degree in statistics with a concentration in business management from Cornell University.
10
Mario Harik has served as our Chief Information Officer since November 2011. Mr. Harik has built comprehensive IT organizations and overseen the implementation of proprietary platforms for a variety of firms and has consulted to members of the Fortune 100. His prior positions include chief information officer and senior vice president—research and development with Oakleaf Waste Management; chief technology officer with Tallan, Inc.; co-founder of G3 Analyst, where he served as chief architect of web and voice applications; and architect and consultant with Adea Solutions. Mr. Harik holds a master of engineering degree in information technology from Massachusetts Institute of Technology, and a degree in engineering, computer and communications from the American University of Beirut, Lebanon.
Corporate Information and Availability of Reports
XPO Logistics, Inc. was incorporated in Delaware on May 8, 2000. Our executive office is located at Five Greenwich Office Park, Greenwich, Connecticut 06831. Our telephone number is (855) 976-4636. Our stock is listed on the New York Stock Exchange (“NYSE”) under the symbol “XPO”.
Our corporate website is www.xpo.com. We make available on this website, free of charge, access to our Annual Reports on Form 10-K, Quarterly Reports on Form 10-Q, Current Reports on Form 8-K, Proxy Statements on Schedule 14A and amendments to those materials filed or furnished pursuant to Section 13(a) or 15(d) of the Securities Exchange Act of 1934, as amended (the “Exchange Act”), as soon as reasonably practicable after we electronically submit such material to the SEC. We also make available on our website copies of materials regarding our corporate governance policies and practices, including the XPO Logistics, Inc. Corporate Governance Guidelines, our Senior Officer Code of Business Conduct and Ethics and the charters relating to the committees of our board of directors. You also may obtain a printed copy of the foregoing materials by sending a written request to: Investor Relations, XPO Logistics, Inc., Five Greenwich Office Park, Greenwich, Connecticut 06831. The public may read and copy any materials that we file with the SEC at the SEC’s Public Reference Room at 100 F Street, NE, Washington, DC 20549. The public may obtain information on the operation of the Public Reference Room by calling the SEC at 1-800-SEC-0330. In addition, the SEC’s website is www.sec.gov. The SEC makes available on this website, free of charge, reports, proxy and information statements and other information regarding issuers, such as us, that file electronically with the SEC. Information on our website or the SEC’s website is not part of this document. We are currently classified as a “large accelerated filer” for purposes of filings with the SEC.
Item 1A. Risk Factors
Cautionary Statement Regarding Forward-Looking Statements
This Annual Report on Form 10-K and other written reports and oral statements we make from time to time contain forward-looking statements within the meaning of Section 27A of the Securities Act of 1933, as amended (the “Securities Act”), and Section 21E of the Exchange Act. All statements other than statements of historical fact are, or may be deemed to be, forward-looking statements. In some cases, forward-looking statements can be identified by the use of forward-looking terms such as “anticipate,” “estimate,” “believe,” “continue,” “could,” “intend,” “may,” “plan,” “potential,” “predict,” “should,” “will,” “expect,” “objective,” “projection,” “forecast,” “goal,” “guidance,” “outlook,” “effort,” “target” or the negative of these terms or other comparable terms. However, the absence of these words does not mean that the statements are not forward-looking. These forward-looking statements are based on certain assumptions and analyses made by the Company in light of its experience and its perception of historical trends, current conditions and expected future developments, as well as other factors it believes are appropriate in the circumstances. These forward-looking statements are subject to known and unknown risks, uncertainties and assumptions that may cause actual results, levels of activity, performance or achievements to be materially different from any future results, levels of activity, performance or achievements expressed or implied by such forward-looking statements. Factors that might cause or contribute to a material difference include, but are not limited to, those discussed below and the risks discussed in the Company’s other filings with the SEC. All forward-looking statements set forth in this Annual Report are qualified by these cautionary statements and there can be no assurance that the actual results or developments anticipated by the Company will be realized or, even if substantially realized, that they will have the expected consequence to or effects on the Company or its business or operations. The following discussion should be read in conjunction with the Company’s audited Consolidated Financial Statements and related Notes thereto included elsewhere in this Annual Report. Forward-looking statements set forth in this Annual Report speak only as of the date hereof, and we do not undertake any obligation to update forward-looking statements to reflect subsequent events or circumstances, changes in expectations or the occurrence of unanticipated events, except as required by law.
Economic recessions and other factors that reduce freight volumes could have a material adverse impact on our business.
The transportation industry historically has experienced cyclical fluctuations in financial results due to economic recession, downturns in business cycles of our customers, increases in prices charged by third-party carriers, interest rate fluctuations and other U.S. and global economic factors beyond our control. The recession beginning in 2008 and continuing throughout 2009 impacted the availability of services from our rail, truck, ocean and air transportation providers and our customers’ demands for our services. Although conditions have improved since 2009, the future pace of recovery and even the
11
continuation thereof cannot be predicted. During economic downturns, reduced overall demand for transportation services will likely reduce demand for our services and exert downward pressures on rates and margins. In periods of strong economic growth, demand for limited transportation resources can result in increased network congestion and resulting operating inefficiencies. In addition, deterioration in the economic environment subjects our business to various risks that may have a material impact on our operating results and cause us to not reach our long-term growth goals. These risks may include the following:
• | A reduction in overall freight volumes in the marketplace reduces our opportunities for growth. In addition, if a downturn in our customers’ business cycles causes a reduction in the volume of freight shipped by those customers, our operating results could be adversely affected. |
• | Some of our customers may face economic difficulties and may not be able to pay us, and some may go out of business. In addition, some customers may not pay us as quickly as they have in the past, causing our working capital needs to increase. |
• | A significant number of our transportation providers may go out of business and we may be unable to secure sufficient equipment or other transportation services to meet our commitments to our customers. |
• | We may not be able to appropriately adjust our expenses to changing market demands. In order to maintain high variability in our business model, it is necessary to adjust staffing levels to changing market demands. In periods of rapid change, it is more difficult to match our staffing level to our business needs. In addition, we have other primarily variable expenses that are fixed for a period of time, and we may not be able to adequately adjust them in a period of rapid change in market demand. |
We operate in a highly competitive industry and, if we are unable to adequately address factors that may adversely affect our revenue and costs, our business could suffer.
Competition in the transportation services industry is intense. Increased competition may lead to revenue reductions, reduced profit margins, or a loss of market share, any one of which could harm our business. There are many factors that could impair our profitability, including the following:
• | competition with other transportation services companies, some of which have a broader coverage network, a wider range of services, more fully developed information technology systems and greater capital resources than we do; |
• | reduction by our competitors of their rates to gain business, especially during times of declining growth rates in the economy, which reductions may limit our ability to maintain or increase rates, maintain our operating margins or maintain significant growth in our business; |
• | a shift in the business of shippers to asset-based trucking companies that also offer brokerage services in order to secure access to those companies’ trucking capacity, particularly in times of tight industry wide capacity; |
• | solicitation by shippers of bids from multiple transportation providers for their shipping needs and the resulting depression of freight rates or loss of business to competitors; |
• | establishment by our competitors of cooperative relationships to increase their ability to address shipper needs; and |
• | competition, particularly in our intermodal business, with companies affiliated with our key rail transportation providers, which may receive preferential terms and conditions as compared to those available to us. |
We may not be able to successfully execute our acquisition strategy.
We intend to expand substantially through acquisitions to take advantage of market opportunities we perceive in our current markets (transportation and logistics) as well as new markets that we may enter. However, we can provide no assurance that future acquisitions will be completed in the time frame we anticipate, if at all. In addition, we may experience delays in making acquisitions or be unable to make the acquisitions we desire for a number of reasons. Suitable acquisition candidates may not be available at purchase prices that are attractive to us or on terms that are acceptable to us. In pursuing acquisition opportunities, we will compete with other companies, some of which have greater financial and other resources than we do.
We are unable to predict the size, timing and number of acquisitions we may complete. In addition, we may incur expenses associated with sourcing, evaluating and negotiating acquisitions (including those that are not completed), and we also may pay fees and expenses associated with obtaining financing for acquisitions and with investment banks and others finding acquisitions for us. Any of these amounts may be substantial, and together with the size, timing and number of acquisitions we pursue, may negatively impact us and cause significant volatility in our financial results.
Any acquisitions that we undertake could be difficult to integrate, disrupt our business, dilute stockholder value and adversely affect our results of operations.
Acquisitions involve numerous risks, including the following:
• | failure of the acquired company to achieve anticipated revenues, earnings or cash flows; |
• | assumption of liabilities that were not disclosed to us or that exceed our estimates; |
12
• | inability to negotiate effective indemnification protection from the seller, or inability to collect in the event of an indemnity claim; |
• | problems integrating the purchased operations with our own, which could result in substantial costs and delays or other operational, technical or financial problems; |
• | potential compliance issues with regard to acquired companies that did not have adequate internal controls; |
• | diversion of management’s attention or other resources from our existing business; |
• | risks associated with entering markets, such as rail intermodal, air freight forwarding, ocean cargo, and last-mile logistics and contract logistics, in which we have limited prior experience; |
• | increases in working capital and capital expenditure investment to fund the growth of acquired operations; |
• | potential loss of key employees and customers of the acquired companies; and |
• | future write-offs of intangible and other assets if the acquired operations fail to generate sufficient cash flows. |
We may not successfully manage our growth.
We intend to grow rapidly and substantially, including by expanding our internal resources, making acquisitions and entering into new markets. We may experience difficulties and higher-than-expected expenses in executing this strategy as a result of unfamiliarity with new markets, change in revenue and business models and entering into new geographic areas.
Our growth will place a significant strain on our management, operational and financial resources. We will need to continually improve existing procedures and controls as well as implement new transaction processing, operational and financial systems, and procedures and controls to expand, train and manage our employee base. Our working capital needs will increase substantially as our operations grow. Failure to manage growth effectively, or obtain necessary working capital, could have a material adverse effect on our business, results of operations, cash flows, stock price and financial condition.
The execution of our strategy depends on our ability to raise capital in the future, and our inability to do so could prevent us from achieving our growth objectives.
We may in the future be required to raise capital through public or private financing or other arrangements in order to pursue our growth strategy or operate our businesses. Such financing may not be available on acceptable terms, or at all, and our failure to raise capital when needed could harm our business or ability to execute our strategy. Further debt financing may involve restrictive covenants and could reduce our profitability. If we cannot raise funds on acceptable terms, we may not be able to grow our business or respond to competitive pressures.
Sales or issuances of a substantial number of shares of our common stock may adversely affect the market price of our common stock.
We anticipate that we will fund future acquisitions or our capital requirements from time to time, in whole or part, through sales or issuances of our common stock or equity-based securities, subject to prevailing market conditions and our financing needs. Future equity financing will dilute the interests of our then-existing stockholders, and future sales or issuances of a substantial number of shares of our common stock or other equity-related securities may adversely affect the market price of our common stock.
Our success is dependent on our Chief Executive Officer and other key personnel.
Our success depends on the continuing services of our Chief Executive Officer, Mr. Bradley S. Jacobs. We believe that Mr. Jacobs possesses valuable knowledge and skills that are crucial to our success and would be very difficult to replicate.
Over time, our success will depend on attracting and retaining qualified personnel, including our senior management team. Competition for senior management is intense, and we may not be able to retain our management team or attract additional qualified personnel. The loss of a member of senior management would require our remaining senior officers to divert immediate and substantial attention to fulfilling the duties of the departing executive and to seeking a replacement. The inability to adequately fill vacancies in our senior executive positions on a timely basis could negatively affect our ability to implement our business strategy, which could adversely impact our results of operations and prospects.
Our business will be seriously harmed if we fail to develop, implement, maintain, upgrade, enhance, protect and integrate information technology systems.
We rely heavily on our information technology systems to efficiently run our business, and they are a key component of our growth strategy. To keep pace with changing technologies and customer demands, we must correctly interpret and address market trends and enhance the features and functionality of our proprietary technology platform in response to these trends, which may lead to significant ongoing software development costs. We may be unable to accurately determine the needs of our
13
customers and the trends in the transportation services industry or to design and implement the appropriate features and functionality of our technology platform in a timely and cost-effective manner, which could result in decreased demand for our services and a corresponding decrease in our revenues. Despite testing, external and internal risks, such as malware, insecure coding, “Acts of God,” data leakage and human error pose a direct threat to our information technology systems and operations. We may also be subject to cybersecurity attacks and other intentional hacking. Any failure to identify and address such defects or errors or prevent a cyber-attack could result in service interruptions, operational difficulties, loss of revenues or market share, liability to customers or others, diversion of resources, injury to our reputation and increased service and maintenance costs. Addressing such issues could prove to be impossible or very costly and responding to resulting claims or liability could similarly involve substantial cost. We must maintain and enhance the reliability and speed of our information technology systems to remain competitive and effectively handle higher volumes of freight through our network and the various service modes we offer. If our information technology systems are unable to manage additional volume for our operations as our business grows, or if such systems are not suited to manage the various service modes we offer, our service levels and operating efficiency could decline. We expect customers to continue to demand more sophisticated, fully integrated information systems from their transportation providers. If we fail to hire and retain qualified personnel to implement, protect and maintain our information technology systems or if we fail to upgrade our systems to meet our customers’ demands, our business and results of operations could be seriously harmed. This could result in a loss of customers or a decline in the volume of freight we receive from customers.
We license an operating system that we are developing into an integrated information technology system for all of our business segments. This new system may not be successful or may not achieve the desired results. We may require additional training or different personnel to successfully implement this system, all of which may result in additional expense, delays in obtaining results or disruptions to our operations. In addition, acquired companies will need to be on-boarded onto this new integrated information technology system, which may cause additional training or licensing cost and disruption. In such event, our revenue, financial results and ability to operate profitably could be negatively impacted. The challenges associated with integration of our acquisitions may increase these risks.
We depend on third-parties in the operation of our business.
In our freight forwarding and freight brokerage operations, we do not own or control the transportation assets that deliver our customers’ freight, and we do not employ the people directly involved in delivering the freight. In our expedited transportation and freight brokerage businesses (particularly our last mile delivery logistics operations, our over-the-road expedite operations and our intermodal drayage operations), we engage independent contractors who own and operate their own equipment. Accordingly, we are dependent on third-parties to provide truck, rail, ocean, air and other transportation services and to report certain events to us, including delivery information and cargo claims. This reliance could cause delays in reporting certain events, including recognizing revenue and claims. Our inability to maintain positive relationships with independent transportation providers could significantly limit our ability to serve our customers on competitive terms. If we are unable to secure sufficient equipment or other transportation services to meet our commitments to our customers or provide our services on competitive terms, our operating results could be materially and adversely affected and our customers could switch to our competitors temporarily or permanently. Many of these risks are beyond our control, including the following:
• | equipment shortages in the transportation industry, particularly among contracted truckload carriers and railroads; |
• | interruptions in service or stoppages in transportation as a result of labor disputes, seaport strikes, network congestion, weather-related issues, Acts of God, or acts of terrorism; |
• | changes in regulations impacting transportation; |
• | increases in operating expenses for carriers, such as fuel costs, insurance premiums and licensing expenses, that result in a reduction in available carriers; and |
• | changes in transportation rates. |
Increases in independent contractor driver compensation or other difficulties attracting and retaining qualified independent contractor drivers could adversely affect our profitability and ability to maintain or grow our independent contractor driver fleet.
Our expedited transportation and intermodal drayage businesses operate through fleets of vehicles that are owned and operated by independent contractors. Our last mile delivery logistics business also operates through a fleet of independent contract carriers that supply their own vehicles, drivers and helpers. These independent contractors are responsible for maintaining and operating their own equipment and paying their own fuel, insurance, licenses and other operating costs. Turnover and bankruptcy among independent contractor drivers often limit the pool of qualified independent contractor drivers and increase competition for their services. In addition, regulations such as the FMCSA Compliance Safety Accountability program may further reduce the pool of qualified independent contractor drivers. Thus, our continued reliance on independent contractor drivers could limit our ability to grow our ground transportation fleet.
14
We are currently experiencing, and expect to continue to experience from time to time in the future, difficulty in attracting and retaining sufficient numbers of qualified independent contractor drivers. Additionally, our agreements with independent contractor drivers are terminable by either party upon short notice and without penalty. Consequently, we regularly need to recruit qualified independent contractor drivers to replace those who have left our fleet. If we are unable to retain our existing independent contractor drivers or recruit new independent contractor drivers, our business and results of operations could be adversely affected.
The compensation we offer our independent contractor drivers is subject to market conditions and we may find it necessary to continue to increase independent contractor drivers’ compensation in future periods, which may be more likely to the extent economic conditions continue to improve. If we are unable to continue to attract and retain a sufficient number of independent contractor drivers, we could be required to increase our mileage rates and accessorial pay or operate with fewer trucks and face difficulty meeting shipper demands, all of which would adversely affect our profitability and ability to maintain our size or to pursue our growth strategy.
Certain of our businesses rely on owner-operators and contract carriers to conduct their operations, and the status of these parties as independent contractors, rather than employees, is being challenged.
We are involved in numerous lawsuits, including purported class action and multi-plaintiff litigations, and state tax and other administrative proceedings that claim that the Company’s contract carriers or owner-operators or their drivers should be treated as our employees, rather than independent contractors. We incur certain costs, including legal fees, in defending the status of these parties as independent contractors. While we believe that our contract carriers and owner-operators and their drivers are properly classified as independent contractors rather than as employees, adverse decisions have been rendered recently in certain cases pending against us, including with respect to class certification of certain contract carriers and determinations that certain of our contract carriers and owner-operators are improperly classified. Certain of these decisions are subject to appeal, but we cannot provide assurance that we will determine to pursue any appeal or that any such appeal will be successful. Adverse final outcomes in these matters could, among other things, entitle certain of our contract carriers and owner-operators and their drivers to reimbursement with respect to certain expenses and to the benefit of wage-and-hour laws and result in employment and withholding tax and benefit liability for us, and could result in changes to the independent contractor status of our contract carriers and owner-operators. Changes to state laws governing the definition of independent contractors could also impact the status of our contract carriers and owner-operators. Adverse final outcomes in these matters or changes to state laws could cause us to change our business model, which could have a material adverse effect on our business strategies, financial condition, results of operations or cash flows. These claims involve potentially significant classes that could involve thousands of claimants and, accordingly, significant potential damages and litigation costs, and could lead others to bring similar claims.
The independent contractor misclassification matters in which we are currently engaged involve companies that we acquired, including XPO Last Mile and Pacer. Pursuant to the purchase agreements by which we acquired certain private companies, the former owners have agreed to indemnify us for costs and liabilities related to such class action and individual lawsuits, subject to certain limits, and we have retained purchase price holdbacks as security for such indemnification. Other than with respect to acquisitions for which our acquisition accounting process remains open (including, as discussed below, the Pacer acquisition), we believe that we have adequate purchase price holdbacks with respect to the potential impact of loss contingencies involving classification matters that are probable and reasonably estimable. However, such holdbacks may be insufficient to protect us against the full amount of the indemnified liability, in which case we would need to fund any losses from our available liquidity sources. To the extent that we do not have indemnification rights with respect to any such liabilities, or we are unable to collect under any such indemnification agreements, any payments will require utilization of our funds and establishment of reserves.
We do not currently expect any of these matters or these matters in the aggregate to have a material adverse effect on our results of operations, financial condition or cash flows. However, the results of these matters cannot be predicted with certainty and an unfavorable resolution of one or more of these matters, or our failure to recover, in full or in part, under the indemnity provisions noted above, could have a material adverse effect on our financial condition, results of operations or cash flows.
Pacer Classification Claims
Our Pacer subsidiary, which was acquired on March 31, 2014, received notices from the California Labor Commissioner, Division of Labor Standards Enforcement (the “DLSE”), that a total of 153 owner operators contracted with certain Pacer subsidiaries have filed claims with the DLSE in which they assert that they should be classified as employees, as opposed to independent contractors. These claims seek reimbursement for the owner operators’ business expenses, including fuel, tractor maintenance and tractor lease payments. Seven of these claims were heard by a DLSE hearing officer, who awarded a total of $2.2 million to the seven claimants. We appealed these awards to California Superior Court, San Diego, where a de novo trial was held on the merits of those claims. On January 28, 2015, the court issued a tentative statement of decision in which it indicated its intent to find that the seven claimants were employees rather than independent contractors, and to award an
15
aggregate of $2.0 million to the claimants. Under the court’s tentative statement of decision, either the claimants or we may file objections or comments by February 17, 2015, after which the court will render its final decision. The court’s final decision is subject to appeal, but we cannot provide assurance that we will determine to pursue an appeal or that an appeal will be successful. The remaining DLSE claims have been transferred to California Superior Court in three separate actions involving 175 claimants. These matters are in the initial procedural stages.
Pacer also is a party to a putative class action litigation brought by Edwin Molina in the U.S. District Court, Southern District of California. Mr. Molina asserts that he should be classified as an employee, as opposed to an independent contractor, and seeks damages for alleged violation of various California wage and hour laws.
The plaintiff seeks to have the litigation certified as a class action involving all owner-operators contracted with Pacer Cartage at any time from August 2009 to the present, which could involve as many as 600 claimants. Certain of these potential claimants also may have claims under the actions pending in California Superior Court as described above. This matter is in the initial stages of discovery and the court has not yet determined whether to certify the matter as a class action. We have reached a tentative agreement to settle this litigation with the claimants, subject to court approval and acceptance by a minimum percentage of members of the purported class. We cannot assure you that the settlement agreement will be finalized and executed, that the court will approve any such settlement agreement or that it will be accepted by the requisite members of the purported class.
During the fourth quarter of 2014, in connection with our Pacer acquisition accounting process, we established a reserve for the estimated probable loss with respect to certain of the cases described above, as required pursuant to applicable accounting standards. This amount was not material to our total liabilities or goodwill. We continue to evaluate these and other claims in light of the recent adverse decisions and other factors. We believe there is a reasonable possibility that a loss may be incurred in excess of the reserve amount; however, we cannot estimate the possible loss or range of such possible losses at this time. We cannot assure you that the amount of any actual loss we incur in connection with these matters will not materially exceed any reserve that we establish.
We are involved in several lawsuits and are subject to various claims that could result in significant expenditures and impact our operations.
The nature of our business exposes us to the potential for various types of claims and litigation. In addition to the matters described in the risk factor “Certain of our businesses rely on owner-operators and contract carriers to conduct their operations, and the status of these parties as independent contractors, rather than employees, is being challenged,” we are subject to claims and litigation related to labor and employment, personal injury, traffic accidents, cargo and other property damage, business practices, environmental liability and other matters, including with respect to claims asserted under various theories of agency and employer liability notwithstanding our independent contractor relationships with our transportation providers. Claims against us may exceed the amount of insurance coverage, or may not be covered by insurance at all. Businesses that we acquire also increase our exposure to litigation. A material increase in the frequency or severity of accidents, liability claims, or workers’ compensation claims, or unfavorable resolutions of claims, or our failure to recover, in full or in part, under indemnity provisions with transportation providers could materially and adversely affect our operating results. In addition, significant increases in insurance costs or the inability to purchase insurance as a result of these claims could reduce our profitability.
Changes in our relationships with our significant customers, including the loss or reduction in business from one or more of them, could have an adverse impact on us.
No single customer accounts for 10% or more of our consolidated revenue. We do not believe the loss of any single customer would materially impair our overall financial condition or results of operations; however, collectively, some of these large customers might account for a relatively significant portion of the growth in revenue and margins in a particular quarter or year. Our contractual relationships with customers generally are terminable at will by the customers on short notice and do not require the customer to provide any minimum commitment. Our customers could choose to divert all or a portion of their business with us to one of our competitors, demand rate reductions for our services, require us to assume greater liability that increases our costs, or develop their own logistics capabilities. Failure to retain our existing customers or enter into relationships with new customers could materially impact the growth in our business and the ability to meet our current and long-term financial forecasts.
Our intermodal business may be affected by any adverse change to relationships with railroad service providers upon the expiration or renewal of such contracts.
The rail contracts supporting our intermodal operations, which have varied expiration dates, contain specific contract rates and other negotiated provisions that enable us to provide competitive transportation rates and services to our customers. A loss of one or more of these rail contracts, or failure to enter into renewal or replacement contracts with comparably favorable terms upon expiration of the current contracts, could materially adversely affect our business, results of operations and cash flows.
16
While we expect to be able to continue to obtain competitive terms and conditions from our railroad vendors, no assurance can be given that such terms and conditions will be comparable to those in our current rail contracts.
In addition, Union Pacific is the primary supplier and servicer of the 53-foot containers used in our business, as well as the chassis used on the Union Pacific network. We have the ability under our arrangements with Union Pacific to increase or decrease our equipment fleet periodically. The refusal or failure of Union Pacific to provide us with additional containers and chassis when required, or to allow us to return excess equipment when requested, or our failure to adequately and timely service the containers or chassis we use, could have an adverse effect on our business and results of operations.
Our cross-border agreement with Union Pacific contemplates a transition in our business model for the cross-border US-Mexico automotive business, which may adversely affect our operating income over time.
Under a multi-year agreement entered into with Union Pacific in October 2012 (the “2012 UP Agreement”), we act as Union Pacific’s network logistics manager for cross-border shipments and provide rail container and chassis management services on a wholesale basis for Union Pacific in Mexico. We are compensated on a fee basis for such services and the use of our equipment. Revenues and margins from the US-Mexico wholesale intermodal automotive business are primarily dependent on (1) the volume of US-Mexico automotive parts shipments via the network that we manage under the 2012 UP Agreement; (2) the volume of our equipment used via the network that we manage versus rail or other equipment; and (3) the amount of sales, general and administrative costs we incur to run this business. The 2012 UP Agreement provides for the step-down, and ultimately the termination as of December 31, 2015, of our role in the US-Mexico wholesale intermodal automotive business, and contemplates that our business model with respect to US-Mexico automotive business will transition to a direct retail model. Accordingly, our revenue and margin for the services and equipment we provide under the 2012 UP Agreement will decline unless we are successful in increasing our direct retail US-Mexico automotive business. We have limited experience operating a retail model in these lanes and can provide no assurance that we will generate sufficient retail business to replace the wholesale intermodal cross-border automotive business. If there are unfavorable changes in any of the aforementioned factors, or if we are unsuccessful in replacing the wholesale business with new direct retail US-Mexico automotive business, our revenues, results of operations and cash flows could be materially and adversely affected and may result in a material goodwill impairment.
Network changes, lane closures, carrier consolidation, and other reductions or deterioration in rail services could increase costs, decrease demand for our intermodal services and adversely affect our operating results.
Most of the intermodal transportation services that we provide depend on the major railroads in the United States and Mexico, which in many markets is limited to a few railroads or even a single railroad. As a result, any reduction, suspension, interruption or elimination of rail service to a particular market may limit our ability to serve some of our customers. Furthermore, reductions in service by the railroads are likely to increase the cost of the rail-based services that we provide and potentially reduce the reliability, timeliness, and overall attractiveness of our intermodal product. Increases in the cost of rail service reduce some of the advantages of intermodal transportation compared to truck and other transportation modes, which may reduce demand for our intermodal services. Rail consolidations in the past have caused service disruptions and would further reduce service choices and bargaining power for rail customers. Further consolidation among railroads might adversely affect intermodal transportation and our results of operations.
From time to time, our railroad suppliers have experienced train resource shortages, operating inefficiencies, and high demand for rail transportation that resulted in increased transit times, terminal congestion, and decreased equipment velocity, all of which increase our costs, decrease equipment capacity, impact customer service, and create a challenging operating environment. To the extent that we rely on rail carriers that experience poor service performance, demand for our intermodal services may be adversely affected.
Our business may be materially adversely affected by labor disputes, including those currently affecting West Coast seaports.
Our business in the past has been and in the future could be adversely affected by strikes and labor renegotiations affecting seaports, labor disputes between railroads and their union employees, or by a work stoppage at one or more railroads or local trucking companies servicing rail or port terminals, including work disruptions involving owner operators under contract with our local trucking operations. Currently, due to ongoing work slowdowns by the longshore workers union, port operators have closed West Coast ports for six days (generally weekends and holidays) in February 2015. Our local drayage operations, other intermodal lines of business, and our NVOCC and international freight forwarding operations have been adversely impacted by recent West Coast port congestion and shutdowns. We cannot predict when these labor issues and shutdowns affecting West Coast ports will be resolved. These recent port shutdowns and similar disruptions to major points in the transportation network, most of which are beyond our control, result in terminal embargoes, disrupt equipment and freight flows, depress volumes and revenues, increase costs and have other negative effects on our operations and financial results.
17
Our substantial indebtedness could adversely affect our financial condition.
As of February 20, 2015, we had approximately $1.0 billion of total indebtedness and unused commitments of $415 million under our Amended Credit Agreement (less $14 million of outstanding letters of credit), the availability of which is subject to certain conditions including its borrowing base availability. We incurred this substantial indebtedness in connection with the New Breed acquisition, for general corporate purposes and in anticipation of executing our acquisition strategy. We currently have cash and cash equivalents of $1.1 billion, which results in us currently having a negative net debt position. However, in the event that we complete acquisitions in the future that decrease our cash position, we would have substantial outstanding indebtedness. Our debt level could:
• | negatively affect our ability to pay principal and interest on our debt or dividends on our Series A Preferred Stock; |
• | increase our vulnerability to general adverse economic and industry conditions; |
• | limit our ability to fund future capital expenditures and working capital, to engage in future acquisitions or development activities, or to otherwise realize the value of our assets and opportunities fully because of the need to dedicate a substantial portion of our cash flow from operations to payments of interest and principal or to comply with any restrictive terms of our debt; |
• | limit our flexibility in planning for, or reacting to, changes in our business and the industry in which it operates; |
• | impair our ability to obtain additional financing or to refinance our indebtedness in the future; and |
• | place the Company at a competitive disadvantage compared to our competitors that may have proportionately less debt. |
Our inability to generate sufficient cash flows to satisfy our debt obligations, or to refinance our indebtedness on commercially reasonable terms or at all, could materially and adversely affect our financial position and results of operations. Further, failure to comply with the covenants under our indebtedness may have a material adverse impact on our operations. If we fail to comply with the covenants under any of our indebtedness, and are unable to obtain a waiver or amendment, such failure may result in an event of default under our indebtedness. We cannot assure you that we would have sufficient liquidity to repay or refinance our indebtedness if such indebtedness were accelerated upon an event of default.
Under the terms of our outstanding indebtedness, we may be able to incur substantial additional indebtedness in the future, which could further exacerbate the risks described above.
Fluctuations in the price or availability of fuel may change our operations structure and resulting profitability.
Fuel expense constitutes one of the greatest costs to our fleet of independent contractor drivers and third-party transportation providers who complete the physical movement of freight we arrange. Fuel prices are highly volatile with the price and availability of all petroleum products subject to economic, political and other market forces beyond our control. As is customary in our industry, most of our customer contracts include fuel surcharge provisions to mitigate the effect of the fuel price increase over base amounts established in the contract. However, these fuel surcharge mechanisms usually do not capture the entire amount of the increase in fuel prices, and they also feature a lag between the payment for fuel and collection of the surcharge revenue. Market pressures may limit our ability to assess fuel surcharges in the future. Significant increases in fuel prices would increase our need for working capital to fund payments to our independent contractor drivers and third-party transportation providers. Decreases in fuel prices reduce the cost of transportation services and accordingly, will reduce our revenues and may reduce margins for certain significant lines of business. Significant changes in the price or availability of fuel in future periods, or significant changes in our ability to mitigate fuel price increases through the use of fuel surcharges, could have a material adverse impact on our operations, fleet capacity and ability to generate both revenues and profits.
We are subject to changes in markets and our business plans that have resulted, and may in the future result, in write-downs of the carrying value of our assets, potentially in significant amounts, thereby reducing our net income.
Our regular review of the carrying value of our assets has resulted, from time to time, in impairments, and we may in the future be required to recognize additional impairment charges, potentially in significant amounts. Changes in business strategy, rebranding efforts, government regulations, economic or market conditions, or our operating performance have resulted and may result in further substantial impairments of intangible, fixed or other assets at any time in the future, including with respect to our acquired businesses. While such impairment charges would not impact our cash position, such charges could significant reduce our net income.
18
Events affecting customer manufacturing plants, such as labor disputes or plant closures, could have a material effect on our performance.
Our Logistics segment derives a substantial portion of revenue from the operation and management of operating facilities, which are often located in close proximity to a client’s manufacturing plant and are integrated into the client’s production line process. We may experience significant revenue loss and shut-down costs, including costs related to early termination of leases, causing our business to suffer if clients suffer strikes or other labor disputes, close their plants or significantly modify their capacity or supply chains at a plant that our Logistics segment services. In such a situation, our operations may be unable to recoup all or any of the related costs that we have incurred. Similarly, a labor dispute or plant closure involving a supplier to our Logistics segment’s clients that results in a slowdown or closure of our clients’ plants could also have a material adverse effect on our business.
Our warehouse lease costs are fixed for a certain period of time, even if customer demand for shipping services in the areas where these warehouses are located decreases.
We lease the warehouses in which we operate pursuant to operating leases of various durations. These leases provide for rent and other expenses that are essentially fixed in nature for a period of time, which may limit our ability to react promptly to a decline in demand by our customers for shipping services in the areas where our warehouses are located. Our inability to respond promptly to changes in customer demand may have an adverse effect on our financial condition and results of operations. In addition, we may be unable to terminate these leases or find suitable subtenants in the event of a rapid reduction in market demand without a material adverse effect on our business, results of operations and financial condition.
A majority of our Logistics segment’s business (through our September 2014 acquisition of New Breed) revenues are generated on a per unit basis. If the amount or level of services that New Breed performs is reduced, it would have a direct negative impact on our results of operations.
The clients of our Logistics segment operations may materially reduce or eliminate a portion of the work that we have historically provided to them because our contracts generally do not have minimum volume or purchase obligations or requirements. Moreover, many of our Logistics segment contracts are subject to competitive bidding. Revenue in our Logistics segment would materially decline if any of our clients’ businesses decline or if a client cancels a significant project or a significant number of projects, and our Logistics segment operations is unable to replace them with similar projects. However, our Logistics operations’ contracts have cancellation provisions that typically require the client to pay a termination fee if the client terminates the contract without cause. Under most of our Logistics segment’s contractual arrangements with our clients, all or a portion of our pricing is based on certain assumptions regarding the scope of services, production or order volumes, operational efficiencies, the mix of fixed versus variable costs, productivity and other factors. If these assumptions prove to be invalid or, as a result of subsequent changes in our Logistics segment’s client’s business needs or market forces that are outside of our control, these assumptions are rendered obsolete, our Logistics segment operations would likely have lower margins than anticipated, or our Logistics segment’s contracts could prove unprofitable. In such events, there is no assurance that our Logistics segment operations will be successful in obtaining the price adjustments necessary to maintain our revenues.
A relatively small modification to the manner in which our Logistics segment’s clients do business could have a large effect on the services we provide and could materially increase our costs.
The nature of our Logistics segment’s operations requires us to align the services that we provide with the policies and practices of our clients. A minor change in such policies and practices may have a material impact on our Logistics segment’s operations. A minor modification to, for example, the terms of the return policy of one of our clients could require our operations to modify the service model that we have developed for such client. This could require our Logistics segment’s operations to, without limitation, hire additional labor, develop new technology, open additional facilities, adopt more stringent standards or otherwise incur additional costs. Such special arrangements may be expensive, and we may not be able to recoup the additional costs posed by the necessary modifications to its service model. In certain cases, changes to our Logistics segment’s clients’ policies and practices could reduce their need for our services generally. If our Logistics segment is unable to successfully address the service requirements of our existing and future clients, or if our clients’ need for its services is reduced, our business and prospects will be materially and adversely affected.
Our Logistics segment’s business (through our September 2014 acquisition of New Breed) typically faces a long selling cycle to secure a new engagement and a long implementation period that require a significant commitment of resources, before we can recognize revenue.
Our Logistics segment, which is the New Breed business we acquired in September 2014, typically faces a long selling cycle to secure a new client engagement, during which period it incurs significant costs and devotes substantial management time. Our operations may not succeed in winning the new business, in which case it would not receive any revenue or reimbursement for such expenses.
19
Even if our Logistics segment is successful in obtaining a new engagement, that is often followed by an implementation period in which the services are planned in detail, necessary resources are deployed and workers are hired. During this time a binding contract is also negotiated and agreed. Until our Logistics segment signs a binding contract for the engagement, the client may still change its mind and decide to retain the work in-house or choose a competitor. Our clients may also experience delays in obtaining internal approvals or delays associated with technology or system implementations, further lengthening the implementation cycle.
The long selling cycle and implementation phase for its services and the limited number of new engagements it pursues at any time make it difficult for us to predict with any accuracy the timing of revenues from new engagements as well as our related costs.
Issues related to the intellectual property rights on which our business depends, whether related to our failure to enforce our own rights or infringement claims brought by others, could have a material adverse effect on our business, financial condition and results of operations.
We use both internally developed and purchased technology in conducting our business. Whether internally developed or purchased, it is possible that the user of these technologies could be claimed to infringe upon or violate the intellectual property rights of third parties. In the event that a claim is made against us by a third party for the infringement of intellectual property rights, any settlement or adverse judgment against us either in the form of increased costs of licensing or a cease and desist order in using the technology could have an adverse effect on us and our results of operation.
We also rely on a combination of intellectual property rights, including copyrights, trademarks, domain names, trade secrets, intellectual property licenses and other contractual rights, to establish and protect our intellectual property and technology. Any of our owned or licensed intellectual property rights could be challenged, invalidated, circumvented, infringed or misappropriated; our trade secrets and other confidential information could be disclosed in an unauthorized manner to third-parties or we may fail to secure the rights to intellectual property developed by our employees, contractors and others. Efforts to enforce our intellectual property rights may be time consuming and costly, distract management’s attention and resources and ultimately be unsuccessful. Moreover, our failure to develop and properly manage new intellectual property could adversely affect our market positions and business opportunities.
Our failure to obtain, maintain and enforce its intellectual property rights could therefore have a material adverse effect on our business, financial condition and results of operations.
A significant labor dispute involving one or more of our customers, or a labor dispute that otherwise affects our operations, could reduce our revenues and harm our profitability.
Labor disputes involving our customers could affect our operations. If our customers are unable to negotiate new labor contracts and our clients’ plants experience slowdowns or closures as a result, our revenue and profitability, particularly in our Logistics segment’s operations that are closely tied to clients’ plants, could be negatively impacted. A labor dispute involving a supplier to our Logistics segment’s clients that results in a slowdown or closure of our clients’ plants to which our Logistics segment provides services could also have a material adverse effect on its business. The employees of our customers, suppliers and other service providers may be, or may in the future be, unionized and there may be strikes, lock outs or material labor disputes with respect to our customers or their suppliers in the future that materially affects our performance.
Our overseas operations subject us to various operational and financial risks which could adversely affect our business.
The services we provide outside of the United States subject us to risks resulting from changes in tariffs, trade restrictions, trade agreements, tax policies, difficulties in managing or overseeing foreign operations and agents, different liability standards, issues related to compliance with anti-corruption laws such as the Foreign Corrupt Practices Act and the U.K. Bribery Act, and intellectual property laws of countries which do not protect our rights in our intellectual property, including our proprietary information systems, to the same extent as the laws of the United States. The occurrence or consequences of any of these factors may restrict our ability to operate in the affected region and/or decrease the profitability of our operations in that region. As we expand our business in foreign countries, we will also be exposed to increased risk of loss from foreign currency fluctuations and exchange controls.
If we are unable to expand the number of our sales representatives and independent station agents, or if a significant number of our existing sales representatives and independent station agents leave us, our ability to increase our revenue could be negatively impacted.
Our ability to expand our business will depend, in part, on our ability to attract and retain sales representatives and the independent station agents through which we conduct a portion of our freight forwarding operations. Competition for qualified sales representatives and brokerage agents can be intense. We may be unable to attract such persons or retain those that are already associated with us. Any difficulties we experience in expanding or retaining our sales representatives and independent
20
station agents could have a negative impact on our ability to expand our customer base, increase our revenue and continue our growth. Further, a significant increase in the turnover rate among our current sales representatives and independent station agents could also increase our recruiting costs and decrease our operating efficiency.
We are subject to regulation, which could negatively impact our business.
Our operations are regulated and licensed by various governmental agencies in the United States and in foreign countries in which we operate. These regulatory agencies have authority and oversight of domestic and international transportation services and related activities, licensure, motor carrier operations, safety and security and other matters. We must comply with various insurance and surety bond requirements to act in the capacities for which we are licensed. Our subsidiaries and independent contractors must also comply with applicable regulations and requirements of such agencies. Through our subsidiaries and business units, we hold various licenses required to carry out our domestic and international services. These licenses permit us to provide services as a motor carrier, property broker, indirect air carrier, OTI, NVOCC, freight forwarder, air freight forwarder, and ocean freight forwarder. We also are subject to regulations and requirements promulgated by, among others, the DOT, FMCSA, DHS, CBP, TSA, FMC, IATA, the Canada Border Services Agency and various other international, domestic, state, and local agencies and port authorities. Our failure to maintain our required licenses, or to comply with applicable regulations, could have a material adverse impact on our business and results of operations. See the “Regulation” section of this Annual Report on Form 10-K under the caption entitled “Business” for more information.
Future laws and regulations may be more stringent and require changes in our operating practices that influence the demand for transportation services or require us to incur significant additional costs. We are unable to predict the impact that recently enacted and future regulations may have on our businesses. Higher costs incurred by us, or incurred by our independent contractors or third-party transportation providers who pass the increased costs on to us, as a result of future new regulations could adversely affect our results of operations to the extent we are unable to obtain a corresponding increase in price from our customers.
Seasonality affects our operations and profitability.
The transportation industry experiences seasonal fluctuations. Our results of operations are typically lower for the first quarter of the calendar year relative to our other quarters. We believe this is due in part to the post- holiday reduction in demand experienced by many of our customers, which leads to more capacity in the non-expedited and service-critical markets and, in turn, less demand for expedited and premium shipping services. In addition, the productivity of our independent contractors and transportation providers generally decreases during the winter season because inclement weather impedes operations.
Terrorist attacks, anti-terrorism measures and war could have broad detrimental effects on our business operations.
As a result of the potential for terrorist attacks, federal, state and municipal authorities have implemented and continue to follow various security measures, including checkpoints and travel restrictions on trucking and rail routes and security screenings of air cargo on passenger aircraft and international containers. Such measures may reduce the productivity of our independent contractors and transportation providers or increase the costs associated with their operations, which we could be forced to bear. War, risk of war or a terrorist attack also may have an adverse effect on the economy. A decline in economic activity could adversely affect our revenues or restrict our future growth. Instability in the financial markets as a result of terrorism or war also could impact our ability to raise capital. In addition, the insurance premiums charged for some or all of the coverage currently maintained by us could increase dramatically or such coverage could be unavailable in the future.
Our Chairman and Chief Executive Officer controls a large portion of our stock and has substantial control over us, which could limit other stockholders’ ability to influence the outcome of key transactions, including changes of control.
Our Chairman and Chief Executive Officer, Mr. Bradley S. Jacobs, controls, as the managing member of Jacobs Private Equity, LLC (“JPE”), (i) 67,500 shares of our Series A Convertible Perpetual Preferred Stock, which are initially convertible into an aggregate of 9,642,857 shares of our common stock, and (ii) 9,642,857 warrants initially exercisable for an aggregate of 9,642,857 shares of our common stock at an exercise price of $7.00 per share. Mr. Jacobs also directly owns 81,761 shares of our common stock and has employee stock options and restricted stock units convertible into an additional 484,593 shares of our common stock. Under applicable SEC rules, Mr. Jacobs beneficially owns approximately 20% of our outstanding common stock. This concentration of share ownership may adversely affect the trading price for our common stock because investors may perceive disadvantages in owning stock in companies with concentrated stockholders. Our preferred stock votes together with our common stock on an “as-converted” basis on all matters, except as otherwise required by law, and separately as a class with respect to certain matters implicating the rights of holders of shares of the preferred stock. Accordingly, Mr. Jacobs can exert substantial influence over our management and affairs and matters requiring stockholder approval, including the election of directors and the approval of significant corporate transactions, such as mergers, consolidations or the sale of substantially all of our assets. Consequently, this concentration of ownership may have the effect of delaying or preventing a change of control, including a merger, consolidation, or other business combination involving us, or discouraging a potential acquirer from making
21
a tender offer or otherwise attempting to obtain control, even if that change of control would benefit our other stockholders. Additionally, significant fluctuations in the levels of ownership of our largest stockholders, including JPE, could impact the volume of trading, liquidity and market price of our common stock.
ITEM 1B. UNRESOLVED STAFF COMMENTS
None.
ITEM 2. PROPERTIES
We lease our current executive office at Five Greenwich Office Park, Greenwich, Connecticut, as well as our national operations centers in Charlotte, North Carolina and Dublin, Ohio. We own the facility at which we conduct a portion of our expedited transportation operations in Buchanan, Michigan. As of February 2015, we also lease numerous other facilities relating to our operations under each of our operating segments, generally ranging from 1,000 to approximately 500,000 square feet of space. These facilities are located in all 48 states of the contiguous United States, District of Columbia, three Canadian provinces: British Columbia, Ontario and Quebec, Mexico, Germany and China. We believe that our facilities are sufficient for our current needs and are in good condition in all material respects.
ITEM 3. LEGAL PROCEEDINGS
We are involved, and will continue to be involved, in numerous legal proceedings arising out of the conduct of our business. These proceedings may include, among other matters, claims for property damage or personal injury incurred in connection with the transportation of freight and employment-related claims, including claims involving asserted breaches of employee restrictive covenants and tortious interference with contract. These proceedings also include numerous purported class-action lawsuits, multi-plaintiff and individual lawsuits and state tax and other administrative proceedings that claim that our owner operators or contract carriers should be treated as employees, rather than independent contractors. We are currently engaged in several alleged independent contractor misclassification claims involving certain companies that we have acquired, including XPO Last Mile and Pacer. These lawsuits and proceedings may seek substantial monetary damages (including claims for unpaid wages, overtime, failure to provide meal and rest periods, unreimbursed business expenses and other items), injunctive relief, or both. For additional information about these matters, please refer to Note 5 to our audited Consolidated Financial Statements.
We do not believe that the ultimate resolution of any matters to which we are presently party will have a material adverse effect on our results of operations, financial condition or cash flows. However, the results of these matters cannot be predicted with certainty, and an unfavorable resolution of one or more of these matters could have a material adverse effect on our financial condition, results of operations or cash flows.
ITEM 4. MINE SAFETY DISCLOSURES
Not applicable.
22
PART II
ITEM 5. MARKET FOR REGISTRANT’S COMMON EQUITY, RELATED STOCKHOLDER MATTERS AND ISSUER PURCHASES OF EQUITY SECURITIES
Price Range of Common Stock
Our common stock is traded on NYSE under the symbol “XPO.” The table below sets forth the high and low closing sales prices for our common stock for the quarters included within 2013 and 2014.
High | Low | ||||||
2013 | |||||||
1st quarter | $ | 18.59 | $ | 16.60 | |||
2nd quarter | 18.25 | 15.82 | |||||
3rd quarter | 25.41 | 17.96 | |||||
4th quarter | 26.45 | 19.50 | |||||
2014 | |||||||
1st quarter | $ | 32.51 | $ | 23.90 | |||
2nd quarter | 30.50 | 23.24 | |||||
3rd quarter | 39.72 | 26.03 | |||||
4th quarter | 42.48 | 31.85 | |||||
As of December 31, 2014, there were approximately 420 record holders of our common stock, based upon data available to us from our transfer agent. We have never paid, and have no immediate plans to pay, cash dividends on our common stock. We currently plan to retain future earnings and cash flows for use in the development of our business and to enhance stockholder value through growth and continued focus on improving profitability rather than for paying dividends on our common stock. In addition, our current credit agreement imposes, and we expect that any future credit agreement we enter into will impose, restrictions on our ability to pay cash dividends on our common stock. Accordingly, we do not anticipate paying any cash dividends on our common stock in the near future. Future payment of dividends on our common stock would depend on our earnings, capital requirements, expansion plans, financial condition and other relevant factors.
The graph below compares the cumulative 5-year total return of holders of our common stock with the cumulative total returns of the Russell 2000 Index, and the Dow Jones Transportation Average Index. The graph tracks the performance of a $100 investment in our common stock and in each index from December 31, 2009 to December 31, 2014.
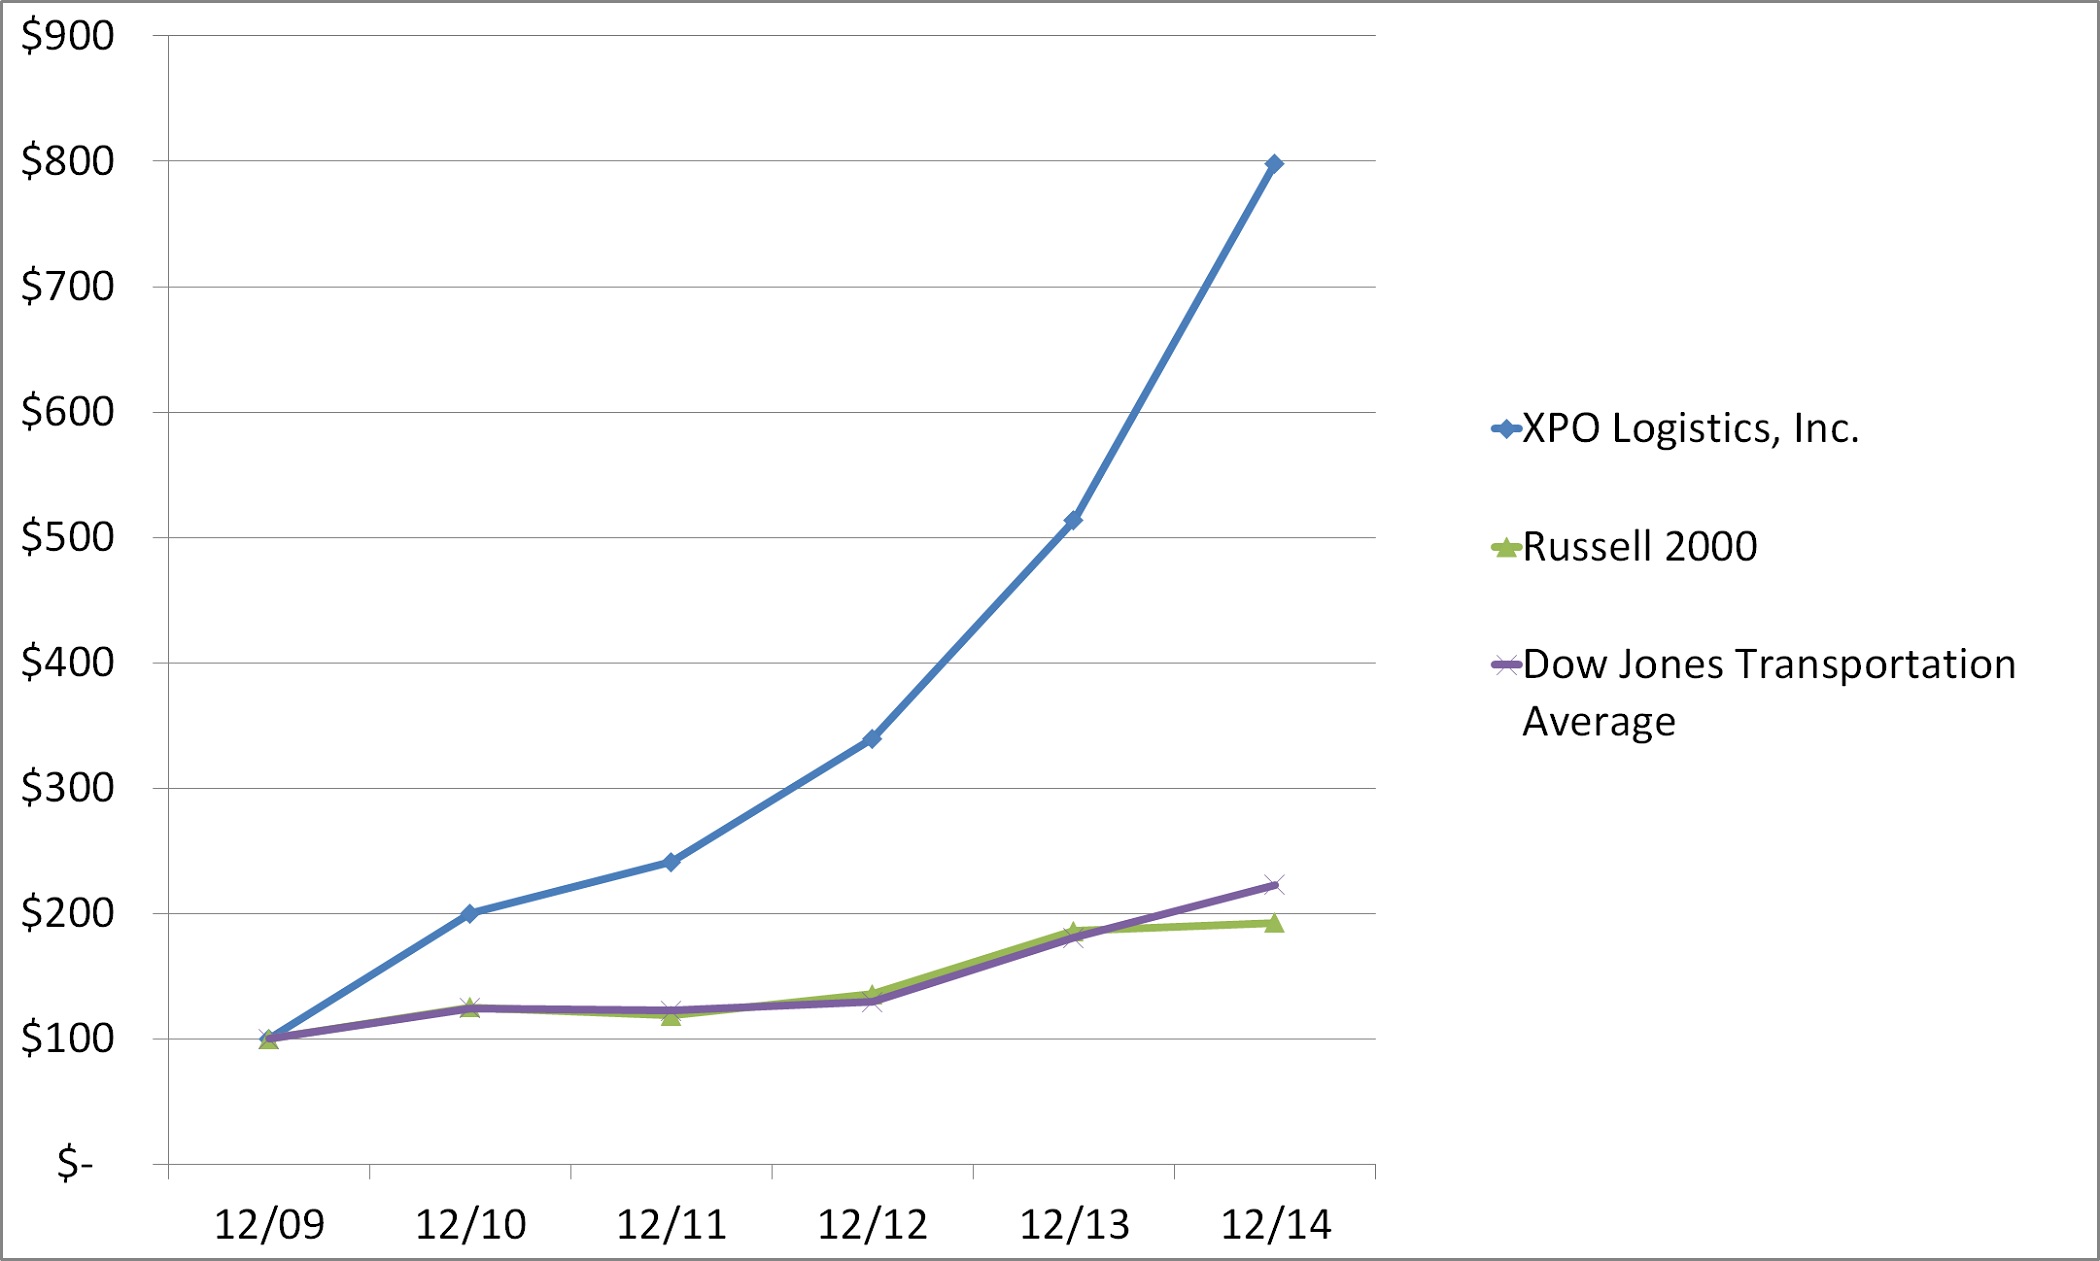
12/09 | 12/10 | 12/11 | 12/12 | 12/13 | 12/14 | ||||||||||||||||||
XPO Logistics, Inc. | $ | 100 | $ | 200 | $ | 241 | $ | 339 | $ | 513 | $ | 798 | |||||||||||
Russell 2000 | $ | 100 | $ | 125 | $ | 118 | $ | 136 | $ | 186 | $ | 193 | |||||||||||
Dow Jones Transportation Average | $ | 100 | $ | 125 | $ | 122 | $ | 129 | $ | 181 | $ | 223 | |||||||||||
23
Equity Compensation Plan
Certain information with respect to our equity compensation plans is set forth in Item 12 of this Annual Report on Form 10-K.
Unregistered Sales of Equity Securities and Use of Proceeds
On January 13, 2015 and February 17, 2015, the Company issued an aggregate of 1,859,231 shares of its common stock, par value $0.001 per share, to certain holders of the Company’s 4.50% Convertible Senior Notes due 2017, CUSIP 983793100 (the “Convertible Notes”) in connection with the conversion of $30.6 million aggregate principal amount of the Convertible Notes. The number of shares of our common stock issued in the foregoing transactions equals the number of shares of our common stock presently issuable to holders of the Convertible Notes upon conversion under the original terms of the Convertible Notes. The issuance of shares of our common stock pursuant to the foregoing transactions was made in reliance on Section 4(a)(2) of the Securities Act of 1933, as amended (the "Securities Act"), as a transaction by an issuer not involving a public offering.
During the year ended December 31, 2014, the Company issued 141,976 unregistered shares of its common stock as a result of the exercise of warrants by certain shareholders. The issuance of these shares was exempt from the registration requirements of the Securities Act of 1933, as amended, in accordance with Section 4(a)(2) thereof, as a transaction by an issuer not involving any public offering.
24
ITEM 6. SELECTED FINANCIAL DATA
This table includes selected financial data for the last five years. This financial data should be read together with our Consolidated Financial Statements and related notes, Management’s Discussion and Analysis of Financial Condition and Results of Operations, and other financial data appearing elsewhere in this Annual Report.
XPO Logistics, Inc.
(In millions, except per share data)
Year Ended December 31, | |||||||||||||||||||
2014 | 2013 | 2012 | 2011 | 2010 | |||||||||||||||
Consolidated Statements of Operations Data: | |||||||||||||||||||
Revenue | $ | 2,356.6 | $ | 702.3 | $ | 278.6 | $ | 177.1 | $ | 158.0 | |||||||||
Net revenue | 654.8 | 123.6 | 40.8 | 29.8 | 27.4 | ||||||||||||||
Net (loss) income | (63.6 | ) | (48.5 | ) | (20.3 | ) | 0.8 | 4.9 | |||||||||||
Preferred stock beneficial conversion charge | (40.9 | ) | — | — | (44.2 | ) | — | ||||||||||||
Cumulative preferred dividends | (2.9 | ) | (3.0 | ) | (3.0 | ) | (1.1 | ) | — | ||||||||||
Net (loss) income available to common stockholders | $ | (107.4 | ) | $ | (51.5 | ) | $ | (23.3 | ) | $ | (44.6 | ) | $ | 4.9 | |||||
(Loss) earnings per share | |||||||||||||||||||
Basic | $ | (2.00 | ) | $ | (2.26 | ) | $ | (1.49 | ) | $ | (5.41 | ) | $ | 0.61 | |||||
Diluted | (2.00 | ) | (2.26 | ) | (1.49 | ) | (5.41 | ) | 0.59 | ||||||||||
Weighted average common shares outstanding | |||||||||||||||||||
Basic | 53,630 | 22,752 | 15,694 | 8,247 | 8,060 | ||||||||||||||
Diluted | 53,630 | 22,752 | 15,694 | 8,247 | 8,279 | ||||||||||||||
Consolidated Balance Sheet Data: | |||||||||||||||||||
Working capital | $ | 852.0 | $ | 70.7 | $ | 271.9 | $ | 83.1 | $ | 12.3 | |||||||||
Total assets | $ | 2,761.2 | $ | 780.2 | $ | 413.2 | $ | 127.6 | $ | 56.7 | |||||||||
Current maturities of long-term debt | $ | 1.8 | $ | 2.0 | $ | 0.5 | $ | 1.7 | $ | 1.7 | |||||||||
Senior notes due 2019 | $ | 500.0 | $ | — | $ | — | $ | — | $ | — | |||||||||
Convertible senior notes | $ | 91.9 | $ | 106.3 | $ | 108.3 | $ | — | $ | — | |||||||||
Revolving credit facility and other long-term debt, net of current maturities | $ | 0.2 | $ | 75.4 | $ | 0.7 | $ | 0.5 | $ | 4.8 | |||||||||
Total long-term debt | $ | 592.1 | $ | 181.7 | $ | 109.0 | $ | 0.5 | $ | 4.8 | |||||||||
Preferred stock | $ | 42.2 | $ | 42.7 | $ | 42.8 | $ | 42.8 | $ | — | |||||||||
Stockholder’s equity | $ | 1,655.1 | $ | 455.9 | $ | 245.1 | $ | 108.4 | $ | 34.0 | |||||||||
Results for the fiscal years ended December 31, 2014 and December 31, 2011 reflect beneficial conversion charges of $40.9 million on the Series B Preferred Stock and $44.2 million on the Series A Preferred Stock, respectively, that were recorded as deemed distributions during the fourth quarter of 2014 and the third quarter of 2011, respectively.
25
Item 7. MANAGEMENT’S DISCUSSION AND ANALYSIS OF FINANCIAL CONDITION AND RESULTS OF OPERATIONS
You should read the following discussion in conjunction with Part I, including matters set forth under Item 1A, “Risk Factors”, of this Annual Report, and our Consolidated Financial Statements and Notes thereto included elsewhere in this Annual Report. The following discussion contains forward-looking statements. You should refer to the “Cautionary Statement Regarding Forward-Looking Statements” set forth in Part I, Item 1A of this Annual Report.
Executive Summary
XPO Logistics, Inc. is one of the largest asset-light providers of transportation logistics services and a leading provider of highly engineered, technology-enabled contract logistics in North America. We provide premium transportation logistics services to shippers and carriers that outsource their freight needs to us as an asset-light, third-party logistics provider.
On September 2, 2014, we closed the acquisition of New Breed and entered into the contract logistics business. Our acquisition of New Breed allows us to design, implement, operate and optimize mission-critical and requirement-intensive outsourced supply chains for some of the world’s leading organizations. Through New Breed’s supply chain technology and operational expertise, we solve complex supply chain problems and create and implement transformative solutions for our clients, while reducing their operating costs and inventory levels and improving their customer service. New Breed provides supply chain solutions primarily to leading corporations that operate in five key industries—telecommunications, aerospace and defense, medical equipment, retail and industrials—that have demanding requirements for quality standards, real-time data visibility, customer service, handling of high-value products, high transaction volumes, large number of SKUs and/or time-assured deliveries.
As of December 31, 2014, we operated at 197 locations: 178 Company-owned branches and 19 agent-owned offices.
We offer our services through two segments. Our Transportation segment includes freight brokerage services in which we place shippers’ freight with qualified carriers, primarily trucking companies and rail carriers, expedited transportation services in which we facilitate urgent shipments via independent over-the-road contractors and air charter carriers, and freight forwarding services in which we arrange domestic and international shipments using ground, air and ocean transport through a network of agent-owned and Company-owned locations. Our Logistics segment provides contract logistics services, including value-added warehousing and distribution, reverse logistics, transportation management, freight bill audit and payment, lean manufacturing support, aftermarket support and supply chain optimization for our clients. The differences in our operating and reportable segments from our last annual report are related to an internal management reorganization and acquisitions during the year ended December 31, 2014. Our previous Freight Brokerage, Expedited Transportation and Freight Forwarding reportable segments have been consolidated into the Transportation operating and reportable segment while our acquisition of New Breed (previously the Contract Logistics reportable segment) represents the Logistics operating and reportable segment. For additional information refer to Note 16—Segment Reporting and Geographic Information of the Consolidated Financial Statements included within.
In September 2011, following the equity investment in the Company led by Jacobs Private Equity, LLC, we began to implement a strategy to leverage our strengths—including management expertise, operational scale and capital resources—with the goals of significant growth and value creation.
By executing our strategy, we have built leading positions in some of the fastest-growing sectors of transportation logistics. In North America, we are the third largest provider of freight brokerage services, which, driven by an outsourcing trend, is growing at two to three times the rate of Gross Domestic Product (“GDP”). Our acquisitions of 3PD and Optima in 2013 and ACL in 2014 made us the largest provider of heavy goods last-mile delivery logistics in North America, a $13 billion sector which, driven by outsourcing by big-box retailers and e-commerce, is growing at five to six times the rate of GDP. In part due to our acquisition of NLM in December of 2013, we now manage more expedited shipments than any other company in North America and have established a foothold in managed transportation. Expediting is growing due to a trend toward just-in-time inventories in manufacturing. Following the acquisition of Pacer in March of 2014, we are the third largest provider of intermodal services in North America and a leading provider of cross-border Mexico intermodal services, a sector that, driven by the efficiencies of long-haul rail and the growth of near-shoring of manufacturing in Mexico, is growing at three to five times the rate of GDP. Due to the acquisition of New Breed in September 2014, we became a leading provider of highly engineered, technology-enabled contract logistics services for large manufacturers and service companies. We believe our broad service offering gives us a competitive advantage as many customers, particularly large shippers, focus their relationships on fewer, larger third-party logistics providers with deep capacity across a wide range of services.
Our strategy has three main components:
• | Acquisitions. We take a disciplined approach to acquisitions: we look for companies that are highly scalable and are a good strategic fit with our core competencies. When we acquire a company, we seek to integrate it with our operations by moving the acquired operations onto our technology platform that connects our broader organization. We gain more carriers, customers, lane histories and pricing histories with each acquisition, and some acquisitions add |
26
complementary services. We use these resources company-wide to buy transportation more efficiently and to cross-sell a more complete supply chain solution to customers. In 2012, we completed the acquisition of four non-asset, third-party logistics companies. We acquired another six companies in 2013, including 3PD, the largest non-asset, third-party provider of last mile logistics for heavy goods in North America, and NLM, the largest provider of web-based expedited transportation management in North America. On March 31, 2014, we acquired Pacer, the third largest provider of intermodal transportation services in North America. On July 28, 2014, we acquired last mile logistics company ACL. We completed our acquisition of contract logistics company New Breed on September 2, 2014. We have an active pipeline of key targets, and we plan to continue acquiring quality companies that fit our strategy for growth.
• | Cold-starts. We believe that cold-starts can generate high returns on invested capital because of the relatively low amount of start-up capital—generally one million dollars or less for a brokerage cold-start—and the large component of variable-based incentive compensation. We are currently ramping up 24 cold-starts in our Transportation segment: 12 in truck brokerage, 11 in freight forwarding and one in expedited transportation. Given this model, cold-starts of any size can generate high returns on invested capital. We plan to continue to open cold-start locations where we see the potential for strong returns. |
• | Optimization of operations. We are continuing to optimize our existing operations by growing our sales force, implementing advanced information technology, cross-selling our services and leveraging our shared capacity. We have a disciplined framework of processes in place for the recruiting, training and mentoring of newly hired employees, and for marketing to the hundreds of thousands of prospective customers who can use our services. Our network is supported by our proprietary information technology that includes robust sales, service, carrier procurement and customer experience management capabilities, as well as benchmarking and analysis. Most important to our growth, we are developing a culture of passionate, world-class service for customers. |
Senior Notes due 2019
On August 25, 2014, we completed a private placement of $500.0 million aggregate principal amount of 7.875% senior notes due September 1, 2019 (the “Senior Notes due 2019”) to qualified institutional buyers. The Senior Notes due 2019 were not registered under the Securities Act or any state securities laws and may not be offered or sold in the United States absent an effective registration statement or an applicable exemption from registration requirements or a transaction not subject to the registration requirements of the Securities Act or any state securities laws. The Senior Notes due 2019 bear interest at a rate of 7.875% per annum payable semiannually, in cash in arrears, on March 1 and September 1 of each year, commencing March 1, 2015 and maturing on September 1, 2019. The Senior Notes due 2019 are guaranteed by each of our direct and indirect wholly-owned restricted subsidiaries (other than certain excluded subsidiaries) that are obligors under, or guarantee obligations under, our existing credit agreement (or certain replacements thereof) or guarantee certain capital markets indebtedness of the Company or any guarantor of the Senior Notes due 2019. The Senior Notes due 2019 and the guarantees thereof are unsecured, unsubordinated indebtedness of the Company and the guarantors. For additional information refer to Note 6—Debt of the Consolidated Financial Statements included within.
On February 13, 2015, we completed an additional private placement of $400.0 million aggregate principal amount of 7.875% Senior Notes due 2019 to qualified institutional buyers. The terms of the additional private placement were identical to the original issuance of Senior Notes due 2019. For additional information refer to Note 18—Subsequent Events of the Consolidated Financial Statements included within.
Investment in Common Stock and Preferred Stock
On September 11, 2014, we entered into an Investment Agreement (the “Investment Agreement”) with Public Sector Pension Investment Board (“PSP Investments”), GIC Private Limited (“GIC”) (an affiliate of Singapore’s sovereign wealth fund), and Ontario Teachers’ Pension Plan Board (“OTPP”). Pursuant to the Investment Agreement, on September 17, 2014, we issued and sold 10,702,934 shares in the aggregate of common stock (“Purchased Common Stock”) and 371,848 shares in the aggregate of our Series B Convertible Perpetual Preferred Stock (“Purchased Preferred Stock”) in a private placement. The purchase price per share of Purchased Common Stock was $30.66 (resulting in aggregate gross proceeds to the Company of approximately $328.0 million), and the purchase price per share of Purchased Preferred Stock was $1,000 (resulting in aggregate gross proceeds to the Company of approximately $372.0 million). The Company received net proceeds of $684.2 million after equity issuance costs. The Purchased Preferred Stock was mandatorily convertible into an aggregate of 12,128,115 additional shares of Company common stock subject to the approval of the Company’s stockholders. The Company held a special meeting of stockholders of the Company on December 23, 2014 in which the Company’s stockholders approved the issuance of shares of Company common stock upon the conversion of the Purchased Preferred Stock. Immediately following the special meeting, the Purchased Preferred Stock was automatically converted into 12,128,115 shares of the Company common stock. No additional consideration was received by the Company in connection with the conversion of the Purchased Preferred Stock into Company common stock.
27
The Purchased Preferred Stock was issued with an initial conversion price of $30.66, which represented a 5% discount to the then-current trailing 20-day volume weighted average price. As of September 11, 2014, our common stock price was $34.05. As a result, the conversion feature was issued “in-the-money” and we allocated the intrinsic value of the conversion feature of $40.9 million to additional paid-in capital. The beneficial conversion feature was contingent upon receiving the approval of our stockholders and was therefore recognized in net income/(loss) available to common stockholders upon receiving stockholder approval. For additional information refer to Note 10—Stockholder’s Equity of the Consolidated Financial Statements included within.
Rebranding of Express-1 and 3PD
During the quarter ended June 30, 2014, the Company rebranded its Express-1 business to XPO Express and its last mile delivery logistics business to XPO Last Mile. As a result of these actions, the Company accelerated the amortization of $3.3 million of indefinite-lived intangible assets related to the Express-1 trade name based on the reduction in its remaining useful life. The full $3.3 million of accelerated amortization was recorded during the quarter ended June 30, 2014 and represented the full value of the Express-1 trade name intangible asset. The impact of rebranding the last mile business was a shortening of the useful life of the 3PD trade name definite-lived intangible asset. The last mile rebranding did not have a material impact on results for the year.
Restructuring
On March 31, 2014, we initiated a facility rationalization and severance program to close facilities and reduce employment in order to improve efficiency and profitability in conjunction with our acquisition of Pacer. The program includes facility exit activities and employment reduction initiatives. During the year ended December 31, 2014, we incurred $11.4 million of restructuring costs related to the program. For additional information refer to Note 4—Restructuring Charges of the Consolidated Financial Statements included within.
Amended Revolving Loan Credit Agreement
On April 1, 2014, we and certain of our wholly-owned subsidiaries entered into a $415 million multicurrency secured revolving loan facility with a commitment termination date of October 17, 2018. The principal amount of the commitments under the amended credit facility may be increased by an aggregate amount of up to $100 million, subject to certain terms and conditions specified in the Amended Credit Agreement. The Amended Credit Agreement replaces and supersedes in its entirety the $125 million multicurrency secured Credit Agreement that we entered into on October 18, 2013. We can use the proceeds of the Amended Credit Agreement for ongoing working capital needs and other general corporate purposes, including strategic acquisitions. At December 31, 2014, the Company had no amount drawn under the Amended Credit Agreement.
On August 8, 2014, we amended our revolving loan facility to permit, among other things, the acquisition of New Breed and the related transactions and the offering of the Senior Notes due 2019.
For additional information refer to Note 6—Debt of the Consolidated Financial Statements included within.
Convertible Debt Offering and Conversions
On September 26, 2012, we completed a registered underwritten public offering of 4.50% Convertible Senior Notes due October 1, 2017 (the “Convertible Notes”), in an aggregate principal amount of $125.0 million. On October 17, 2012, the underwriters exercised the overallotment option to purchase $18.8 million additional principal amount of the Convertible Notes. We received $138.5 million in net proceeds after underwriting discounts, commissions and expenses were paid. The Convertible Notes were allocated to long-term debt and equity in the amounts of $106.8 million and $31.7 million, respectively. These amounts are net of debt issuance costs of $4.1 million for debt and $1.2 million for equity.
We are obligated to pay holders of the Convertible Notes interest semiannually in arrears on April 1 and October 1 of each year which began on April 1, 2013. The Convertible Notes will mature on October 1, 2017 unless earlier converted or repurchased. The conversion rate was initially 60.8467 shares of common stock per $1,000 principal amount of notes (equivalent to an initial conversion price of approximately $16.43 per share of common stock) and is subject to adjustment in some events but will not be adjusted for any accrued and unpaid interest.
Through December 31, 2014, we have entered into transactions pursuant to which we have issued an aggregate of 2,249,860 shares of our common stock to certain holders of the Convertible Notes in connection with the conversion of $37.0 million aggregate principal amount of the Convertible Notes. Certain of these transactions included induced conversions pursuant to which we paid the holder a market-based premium in cash. The negotiated market-based premiums, in addition to the difference between the current fair value and the book value of the Convertible Notes, are reflected in interest expense. The number of shares of common stock issued in the foregoing transactions equals the number of shares of common stock presently issuable to holders of the Convertible Notes upon conversion under the original terms of the Convertible Notes.
28
Common Stock Offerings
On February 5, 2014, we closed a registered underwritten public offering of 15,000,000 shares of common stock, and on February 11, 2014 we closed as part of the same public offering the sale of an additional 2,250,000 shares as a result of the full exercise of the underwriters’ overallotment option, in each case at a price of $25.00 per share (together, the “February 2014 Offering”). We received $413.2 million in net proceeds from the February 2014 Offering after underwriting discounts and expenses.
On August 13, 2013, we closed a registered underwritten public offering of 9,694,027 shares of common stock, and on August 16, 2013 we closed as part of the same public offering the sale of an additional 1,454,104 shares as a result of the full exercise of the underwriters’ overallotment option, in each case at a price of $22.75 per share (together, the “August 2013 Offering”). We received $239.5 million in net proceeds from the August 2013 Offering after underwriting discounts and expenses.
On March 20, 2012, we closed a registered underwritten public offering of 9,200,000 shares of common stock (the “2012 Offering”), including 1,200,000 shares issued and sold as a result of the full exercise of the underwriters’ overallotment option, at a price of $15.75 per share. We received $137.0 million in net proceeds from the 2012 Offering after underwriting discounts and estimated expenses.
Statement of Operations Presentation
Certain prior period statement of operations line items have been conformed to the 2014 presentation, including the retitling of direct expense to cost of purchased transportation and services and the addition of the direct operating expense category. The conformed line items had no impact on previously reported income.
Other Reporting Disclosures
The following section describes some of our revenue and expense categories and is provided to facilitate investors’ understanding of the discussion of our financial results below.
Revenue
Revenue is generated through the rates, fuel surcharges and other fees we charge our customers for our portfolio of freight transportation services as well as through contracts for services provided to certain customers and is impacted by changes in volume, product mix, length of haul, route changes and contracted services provided. The freight transportation and logistics services we provide include truckload, less-than-truckload, and intermodal brokerage, last-mile delivery logistics services, time-critical, urgent shipment solutions, freight forwarding, and contract logistics services.
Cost of purchased transportation and services
Cost of purchased transportation and services, which is only incurred in our Transportation segment, is primarily attributable to the cost of procuring freight transportation services for our customers, commissions paid to independent station owners in our freight forwarding business, and insurance and truck leasing expense in our expedited business. Our non-asset operating model provides transportation capacity through variable cost third-party transportation arrangements, therefore enabling us to be flexible to adapt to changes in economic or industry conditions. Our primary means of providing capacity are through our base of independent owner operators and contract carriers for ground transportation and air charter services in our expedited business and our network of independent truck, rail, ocean and air carriers in our freight brokerage and freight forwarding businesses.
Net revenue
Net revenue is total revenue less the cost of purchased transportation and services. This discussion and analysis refers from time to time to net revenue margin. We use the term net revenue margin to refer to the quotient, expressed as a percentage, of net revenue divided by revenue.
Direct operating expense
Direct operating expenses are both fixed and variable expenses directly relating to our intermodal, last mile and contract logistics operations and consist of intermodal equipment lease expense, depreciation expense, maintenance and repair costs, and property taxes; fixed terminal and cargo handling expenses; operating costs of our local drayage and last mile warehousing facilities; and operating costs related to our contract logistics facilities. Intermodal equipment maintenance and repair costs consist of the costs related to the upkeep of the intermodal equipment fleet. Fixed terminal and cargo handling costs primarily relate to the fixed rent and storage expense charged by terminal operators. Operating costs of our local drayage and last mile warehousing facilities consist mainly of labor, rent, maintenance, utilities and other facility related costs. Operating costs of our
29
contract logistics facilities consist mainly of personnel costs, facility and equipment expenses, materials and supplies, information technology expenses, depreciation expense and other operating expenses related to our contract logistics facilities.
Sales, general and administrative expense
Sales, general and administrative expense (“SG&A”) consists of costs relating to customer acquisition, carrier procurement, billing, customer service, salaries and related expenses of the executive and administrative staff, acquisition-related costs, office expenses, technology services, professional fees and other purchased services relating to the aforementioned functions, and depreciation (excluding railcar, container and chassis depreciation related to our intermodal business and depreciation related to our contract logistics facilities and equipment) and amortization expense. The purchased services category includes professional and consulting fees, legal fees and other services purchased from third-parties. The other SG&A expense category includes expense related to supplies, travel, communications, facilities, insurance, the provision for allowance for doubtful accounts, equity-based compensation and other administrative costs.
XPO Logistics, Inc.
Consolidated Statement of Operations
For the Year Ended December 31,
(In millions)
Percent of Revenue | ||||||||||||||||||||
2014 | 2013 | 2012 | 2014 | 2013 | 2012 | |||||||||||||||
Revenue | $ | 2,356.6 | $ | 702.3 | $ | 278.6 | 100.0 | % | 100.0 | % | 100.0 | % | ||||||||
Cost of purchased transportation and services | 1,701.8 | 578.7 | 237.8 | 72.2 | % | 82.4 | % | 85.4 | % | |||||||||||
Net revenue | 654.8 | 123.6 | 40.8 | 27.8 | % | 17.6 | % | 14.6 | % | |||||||||||
Direct operating expense | 273.2 | 6.4 | — | 11.6 | % | 0.9 | % | — | % | |||||||||||
SG&A expense | ||||||||||||||||||||
Salaries & benefits | 213.8 | 100.3 | 39.3 | 9.1 | % | 14.3 | % | 14.1 | % | |||||||||||
Other SG&A expense | 72.0 | 25.3 | 11.6 | 3.1 | % | 3.6 | % | 4.2 | % | |||||||||||
Purchased services | 50.1 | 23.3 | 15.4 | 2.1 | % | 3.3 | % | 5.5 | % | |||||||||||
Depreciation & amortization | 86.6 | 20.6 | 2.5 | 3.7 | % | 2.9 | % | 0.9 | % | |||||||||||
Total SG&A expense | 422.5 | 169.5 | 68.8 | 18.0 | % | 24.1 | % | 24.7 | % | |||||||||||
Operating loss | (40.9 | ) | (52.3 | ) | (28.0 | ) | (1.8 | )% | (7.4 | )% | (10.1 | )% | ||||||||
Other expense | 0.8 | 0.5 | 0.3 | — | % | 0.1 | % | 0.1 | % | |||||||||||
Interest expense | 48.0 | 18.2 | 3.2 | 2.0 | % | 2.6 | % | 1.1 | % | |||||||||||
Loss before income tax benefit | (89.7 | ) | (71.0 | ) | (31.5 | ) | (3.8 | )% | (10.1 | )% | (11.3 | )% | ||||||||
Income tax benefit | (26.1 | ) | (22.5 | ) | (11.2 | ) | (1.1 | )% | (3.2 | )% | (4.0 | )% | ||||||||
Net loss | $ | (63.6 | ) | $ | (48.5 | ) | $ | (20.3 | ) | (2.7 | )% | (6.9 | )% | (7.3 | )% | |||||
Consolidated Results
Year Ended December 31, 2014 Compared to Year Ended December 31, 2013
Our consolidated revenue for 2014 increased 235.6% to $2,356.6 million from $702.3 million in 2013. This increase was driven largely by the acquisitions of Pacer, 3PD, New Breed and NLM as well as the organic growth of our freight brokerage cold-start locations.
Total net revenue for 2014 increased 429.8% to $654.8 million from $123.6 million in 2013. Net revenue margin was 27.8% in 2014 as compared to 17.6% in 2013. The increase in net revenue margin primarily relates to the acquisitions of New Breed, Pacer, 3PD and NLM as well as organic improvement to net revenue margin at our freight brokerage locations. Revenue associated with NLM is recorded on a net basis. Total gross and net revenue attributable to New Breed and NLM is recorded in net revenue.
Direct operating expense for 2014 was $273.2 million, or 11.6% as a percentage of revenue, compared to $6.4 million, or 0.9% as a percentage of revenue, for 2013. Direct operating expense, which includes the expense of certain intermodal, drayage and warehousing operations, increased due to the acquisitions of New Breed, Pacer and 3PD. Prior to the acquisitions of New
30
Breed, Pacer and 3PD, we had no such operations. The direct operating expense for 2013 represented 3PD’s expense for the post-acquisition period only.
SG&A expense increased by $253.0 million in 2014 compared to 2013. As a percentage of revenue, SG&A expense decreased to 18.0% in 2014 as compared to 24.1% in 2013. SG&A expense increased due to acquisitions; increased sales force recruitment costs; investments in information technology; and costs associated with expanding new and existing freight brokerage offices. SG&A expense also included restructuring, integration and transaction costs related to the acquisitions of New Breed, Pacer and ACL as well as $48.4 million of increased intangible asset amortization related to acquisitions.
Interest expense for 2014 increased 163.7% to $48.0 million from $18.2 million in 2013. Interest expense included $14.4 million of debt commitment fees in relation to our acquisitions of New Breed and Pacer as well as $5.5 million of expense related to the conversion of our Convertible Notes. The remainder of interest expense was related to our Senior Notes due 2019, Convertible Notes and other debt facilities.
Our effective income tax rates in 2014 and 2013 were 29.1% and 31.7%, respectively. We recognized a tax benefit in both 2014 and 2013 due to the net operating losses incurred. Our effective tax rate was reduced by various non-deductible costs (including those related to the Company’s acquisitions, interest related to conversions of our convertible debt and change in valuation allowance) and the mix of income among the various jurisdictions in which the Company does business.
The increase in net loss was due primarily to higher SG&A expenses associated with acquisitions; sales force recruitment; information technology costs; costs associated with our new and existing freight brokerage offices; transaction and integration costs; an increase in intangible asset amortization; and higher interest expense.
Year Ended December 31, 2013 Compared to Year Ended December 31, 2012
Our consolidated revenue for 2013 increased 152.1% to $702.3 million from $278.6 million in 2012. This increase was driven largely by the acquisitions of Turbo Logistics, Inc. and Turbo Dedicated, Inc. (collectively, “Turbo”), 3PD, Covered Logistics, Inc. (“Covered”), Interide Logistics, LC (“Interide”), East Coast Air Charter, and Optima, and the organic growth of our freight brokerage cold-start locations. Turbo was acquired on October 24, 2012.
Total net revenue for 2013 increased 202.9% to $123.6 million from $40.8 million in 2012. As a percentage of revenue, net revenue was 17.6% in 2013 as compared to 14.6% in 2012. The increase in net revenue as a percentage of revenue is primarily attributable to higher net revenue margins in our Transportation segment, primarily as a result of increased net revenue margins in our truck brokerage business.
Direct operating expense, which includes the expense of certain warehousing operations, for 2013 was $6.4 million, or 0.9% as a percentage of revenue. Direct operating expense increased due to the acquisition of 3PD in 2013. Prior to the acquisition of 3PD, we had no such operations.
SG&A expense as a percentage of revenue was 24.1% in 2013, as compared to 24.7% in 2012. SG&A expense increased by $100.7 million in 2013 compared to 2012, primarily due to significant growth initiatives, including six acquisitions; costs associated with our new freight brokerage offices; and an increase in Corporate SG&A.
Interest expense for 2013 increased 468.8% to $18.2 million from $3.2 million in 2012. The increase in interest expense is primarily attributable to a $9.1 million year over year increase in interest on our Convertible Notes, a debt commitment fee of $3.0 million related to our acquisition of 3PD and interest expense of $2.4 million related to the conversion of our Convertible Notes.
Our effective income tax rates were 31.7% and 35.6% for 2013 and 2012, respectively. We recognized a tax benefit in both 2013 and 2012 due to the net operating losses incurred. The difference in the income tax rate for 2013 relates to the recording of tax expense in certain state and foreign jurisdictions, the non-deductible interest expense on convertible debt, and the change in the provision for uncertain tax positions.
The increase in net loss was due primarily to higher SG&A expenses associated with significant growth initiatives, costs associated with our new freight brokerage offices, and an increase in Corporate costs. Additionally, the Company incurred higher interest expense and recorded the accelerated amortization of the Concert Group Logistics trade name indefinite-lived intangible assets.
31
Transportation
Statement of Operations Data
For the Year Ended December 31,
(In millions)
Percent of Revenue | ||||||||||||||||||||
2014 | 2013 | 2012 | 2014 | 2013 | 2012 | |||||||||||||||
Revenue | $ | 2,140.0 | $ | 702.3 | $ | 278.6 | 100.0 | % | 100.0 | % | 100.0 | % | ||||||||
Cost of purchased transportation and services | 1,701.8 | 578.7 | 237.8 | 79.5 | % | 82.4 | % | 85.4 | % | |||||||||||
Net revenue | 438.2 | 123.6 | 40.8 | 20.5 | % | 17.6 | % | 14.6 | % | |||||||||||
Direct operating expense | 90.0 | 6.4 | — | 4.2 | % | 0.9 | % | — | % | |||||||||||
SG&A expense | ||||||||||||||||||||
Salaries & benefits | 175.0 | 78.3 | 25.8 | 8.2 | % | 11.1 | % | 9.3 | % | |||||||||||
Other SG&A expense | 56.4 | 19.6 | 7.2 | 2.6 | % | 2.8 | % | 2.6 | % | |||||||||||
Purchased services | 20.4 | 6.9 | 3.3 | 1.0 | % | 1.0 | % | 1.2 | % | |||||||||||
Depreciation & amortization | 77.5 | 19.6 | 2.1 | 3.6 | % | 2.8 | % | 0.8 | % | |||||||||||
Total SG&A expense | 329.3 | 124.4 | 38.4 | 15.4 | % | 17.7 | % | 13.9 | % | |||||||||||
Operating income (loss) | $ | 18.9 | $ | (7.2 | ) | $ | 2.4 | 0.9 | % | (1.0 | )% | 0.7 | % | |||||||
Transportation
Year Ended December 31, 2014 Compared to Year Ended December 31, 2013
Revenue in our Transportation segment increased by 204.7% to $2,140.0 million in 2014 compared to $702.3 million in 2013. This increase was driven largely by the acquisitions of Pacer, 3PD and NLM as well as the organic growth of our freight brokerage locations.
Total net revenue for 2014 increased 254.5% to $438.2 million from $123.6 million in 2013. Net revenue margin was 20.5% in 2014 as compared to 17.6% in 2013. The increase in net revenue margin primarily relates to the acquisitions of Pacer, 3PD and NLM as well as improvement in net revenue margin at our freight brokerage locations. Revenue associated with NLM is recorded on a net basis.
Direct operating expense for 2014 was $90.0 million, or 4.2% as a percentage of revenue, compared to $6.4 million, or 0.9% as a percentage of revenue, for 2013. Direct operating expense, which includes the expense of certain intermodal, drayage and warehousing operations, increased due to the acquisitions of Pacer and 3PD. Prior to the acquisitions of Pacer and 3PD, we had no such operations. The direct operating expense for 2013 represented 3PD’s expense for the post-acquisition period only.
SG&A expense increased by 164.7% to $329.3 million in 2014 from $124.4 million in 2013. As a percentage of revenue, SG&A expense decreased to 15.4% in 2014 as compared to 17.7% in 2013. The increase in SG&A expense was due to acquisitions, sales force expansion costs, technology and training costs, as well as $42.7 million of increased intangible asset amortization related to acquisitions.
Our Transportation segment generated operating income of $18.9 million in 2014 compared to an operating loss of $7.2 million in 2013. The increase in operating income was primarily attributable to our acquisitions of Pacer and 3PD and the organic growth of our existing freight brokerage locations.
Management’s growth strategy for the Transportation segment is to:
• | Acquire complementary, non-asset based transportation businesses that would benefit from our scale and potential access to capital; |
• | Market our broader multi-modal offering to customers of all sizes, both new business and existing accounts; |
• | Expand our footprint by opening new sales offices; |
• | Recruit sales and service representatives and improve employee productivity with state-of-the-art training and information technology; |
• | Focus on carrier recruitment and retention, as well as improved utilization of the current carrier fleet; |
• | Build leadership positions in the fastest-growing areas of transportation; |
• | Integrate industry best practices, with specific focus on better leveraging our scale and lowering administrative overhead; and |
32
• | Continue to integrate our information technology platform. |
Year Ended December 31, 2013 Compared to Year Ended December 31, 2012
Our Transportation segment revenue for 2013 increased 152.1% to $702.3 million from $278.6 million in 2012. This increase was driven largely by the acquisitions of Turbo, 3PD, Covered, Interide, East Coast Air Charter, and Optima, as well as the organic growth of our freight brokerage cold-start locations.
Total net revenue for 2013 increased 202.9% to $123.6 million from $40.8 million in 2012. As a percentage of revenue, net revenue was 17.6% in 2013 as compared to 14.6% in 2012. The increase in net revenue as a percentage of revenue is attributable to higher net revenues in our freight brokerage and freight forwarding operations. Freight brokerage net revenues improved due to prior acquisitions and higher net revenue percentage at our cold start locations. In freight forwarding, the increase in net revenue margin was primarily driven by branch conversions from independent ownership to Company ownership.
Direct operating expense for 2013 was $6.4 million, or 0.9% as a percentage of revenue. Direct operating expense, which includes the expense of certain warehousing operations, increased due to the acquisition of 3PD. Prior to the acquisition of 3PD, we had no such operations.
SG&A expense as a percentage of revenue was 17.7% in 2013, as compared to 13.9% in 2012. SG&A expense increased by $86.0 million in 2013 compared to 2012, due to significant growth initiatives, including six acquisitions, and costs associated with our new freight brokerage offices.
Our Transportation segment generated an operating loss of $7.2 million in 2013 compared to operating income of $2.4 million in 2012. The decrease in operating income was attributable to the increase in SG&A expense as described above.
Logistics
Statement of Operations Data
For the Year Ended December 31,
(In millions)
Percent of Revenue | ||||||
2014 | 2014 | |||||
Net revenue | $ | 216.6 | 100.0 | % | ||
Direct operating expense | 183.2 | 84.6 | % | |||
SG&A expense | ||||||
Salaries & benefits | 6.3 | 2.9 | % | |||
Other SG&A expense | 1.8 | 0.8 | % | |||
Purchased services | 1.1 | 0.5 | % | |||
Depreciation & amortization | 6.6 | 3.0 | % | |||
Total SG&A expense | 15.8 | 7.2 | % | |||
Operating income | $ | 17.6 | 8.2 | % | ||
Logistics
Year Ended December 31, 2014 Compared to Year Ended December 31, 2013
We established our Logistics segment through the acquisition of New Breed in September 2014. New Breed is a preeminent U.S. provider of asset-light based, complex, technology-enabled contract logistics for large multi-national and medium-sized corporations and government agencies.
Net revenue in our Logistics segment was $216.6 million in 2014. Direct operating expense for 2014 was $183.2 million, or 84.6% as a percentage of revenue. SG&A expense was $15.8 million in 2014, or 7.2% as a percentage of revenue. Operating income was $17.6 million for 2014.
Management’s growth strategy for Logistics is to:
• | Focus sales and marketing investments to capture additional business in the technology/telecom, retail/e-commerce, aerospace, medical equipment and manufacturing sectors by leveraging the segment’s proprietary technology, network of facilities and industry-specific experience; |
33
• | Increase share of spend with existing contract logistics customers who may outsource more of this business to XPO, and who have broader transportation needs we can service; |
• | Pursue selective acquisitions of complementary contract logistics operations; and |
• | Cross-sell technology-enabled contract logistics and managed transportation services to large customers of our other business segment. |
XPO Corporate
Summary of Sales, General and Administrative Expense
For the Year Ended December 31,
(In millions)
Percent of Consolidated Revenue | ||||||||||||||||||||
2014 | 2013 | 2012 | 2014 | 2013 | 2012 | |||||||||||||||
SG&A expense | ||||||||||||||||||||
Salaries & benefits | 32.5 | 22.0 | 13.5 | 1.4 | % | 3.1 | % | 4.8 | % | |||||||||||
Other SG&A expense | 13.8 | 5.7 | 4.4 | 0.6 | % | 0.8 | % | 1.6 | % | |||||||||||
Purchased services | 28.6 | 16.4 | 12.1 | 1.2 | % | 2.3 | % | 4.3 | % | |||||||||||
Depreciation and amortization | 2.5 | 1.0 | 0.4 | 0.1 | % | 0.1 | % | 0.1 | % | |||||||||||
Total SG&A expense | $ | 77.4 | $ | 45.1 | $ | 30.4 | 3.3 | % | 6.3 | % | 10.8 | % | ||||||||
Corporate
Year Ended December 31, 2014 Compared to Year Ended December 31, 2013
Corporate SG&A expense in 2014 increased by $32.3 million compared to 2013. Salaries and benefits increased due to the costs of restructuring at Pacer and an increase in headcount in IT and corporate shared services. Purchased services increased in 2014 due largely to acquisition-related transaction costs. Other SG&A expense increased largely due to the costs of restructuring facility leases at Pacer.
Corporate SG&A for 2014 included: $14.3 million of acquisition-related transaction costs; $11.4 million of restructuring charges related to the acquisition of Pacer, including $0.8 million of non-cash share based compensation; $5.7 million of additional shared services costs related to the acquisition of Pacer; $5.9 million of litigation-related legal costs; and $6.7 million of other non-cash share based compensation.
Year Ended December 31, 2013 Compared to Year Ended December 31, 2012
Corporate SG&A expense in 2013 increased by $14.7 million compared to 2012. Salaries and benefits increase was driven by a year-over-year increase in headcount in corporate shared services. Purchased services increased in 2013 due largely to $6.5 million of acquisition-related transaction costs. Corporate SG&A for 2013 also included $4.9 million of litigation-related legal costs and $4.7 million of non-cash share based compensation.
Liquidity and Capital Resources
General
As of December 31, 2014, we had working capital of $852.0 million, including cash of $644.1 million, compared to working capital of $70.7 million, including cash of $21.5 million, as of December 31, 2013. This increase of $781.3 million in working capital during the year was mainly due to our issuance of $700.0 million of preferred and common stock in September 2014.
We continually evaluate our liquidity requirements, capital needs and availability of capital resources based on our operating needs and our planned growth initiatives. In addition to our existing cash balances and net cash provided by operating activities, in certain circumstances we may also use debt financings and issuances of equity or equity-related securities to fund our operating needs and growth initiatives. See the discussion below in the Debt Facilities section regarding our amended $415 million multicurrency secured revolving loan credit facility.
We believe that our existing cash balances and availability under our amended revolving credit facility will be sufficient to finance our existing operations.
34
Cash Flow
During 2014, $21.3 million was used in cash from operations compared to $66.3 million used for 2013 and $24.3 million used for 2012. The primary use of cash for 2014, 2013 and 2012 was payment of transportation services, direct operating expenses and various SG&A expenses.
Cash generated from revenue equaled $2,212.8 million for 2014 as compared to $665.3 million for 2013 and $264.8 million for 2012 and correlates directly with the revenue increase between the periods. Cash flow increases are related primarily to volume increases between the periods ended December 31, 2014, 2013 and 2012.
Cash used for payment of transportation services and direct operating expenses in 2014 equaled $1,929.9 million as compared to $585.1 million for 2013 and $223.0 million for 2012. The increase in cash outflows between the periods also directly correlates to the increase in revenues between the periods ended December 31, 2014, 2013 and 2012.
Other operating uses of cash included SG&A items, which equaled $299.7 million, $134.4 million and $67.2 million for the years ended December 31, 2014, 2013 and 2012, respectively. Payroll represents the most significant SG&A item. For 2014, cash used for payroll equaled $138.3 million as compared to $74.9 million for 2013 and $31.3 million for 2012.
Investing activities used $858.3 million for 2014 compared to a use of $470.3 million and $64.2 million from these activities for 2013 and 2012, respectively. During 2014, $814.0 million was used in acquisitions and $44.6 million was used to purchase fixed assets while $0.3 million was provided by other investing activities. During 2013, $458.8 million was used for acquisitions and $11.6 million was used to purchase fixed assets while $0.1 million was provided by other investing activities. During 2012, $57.2 million was used for acquisitions and $7.0 million was used to purchase fixed assets.
Financing activities generated $1,502.2 million for 2014 compared to $305.7 million and $266.8 million generated for 2013 and 2012, respectively. Our main sources of cash from financing activities during 2014 were the $733.8 million of net proceeds from the issuance of common stock, $489.6 million of net proceeds from the issuance of the Senior Notes due 2019, $363.6 million of net proceeds from the issuance of preferred stock and $130.0 million borrowed against our revolving credit facility. Our primary uses of cash were the $205.0 million used to repay borrowings on the revolving credit facility, dividends paid to preferred stockholders of $2.9 million, $3.4 million used to pay tax withholdings on restricted shares and $3.5 million used for other financing activities. During 2013, our main sources of cash from financing activities were the $239.5 million of net proceeds from the issuance of common stock and the $73.3 million of net proceeds from borrowing on our revolving credit facility while our primary uses of cash were the dividends paid to preferred stockholders of $3.0 million, $1.6 million used to pay tax withholdings on restricted shares and $2.5 million related to other financing activities. During 2012, our main sources of cash were $138.5 million of net proceeds from the issuance of the Convertible Notes and $137.0 million of net proceeds from the issuance of common stock while our primary use of cash was the dividend paid to preferred stockholders of $3.0 million, $1.2 million used to pay tax withholdings on restricted shares and $4.5 million related to other financing activities.
Debt Facilities
On April 1, 2014, we and certain of our wholly-owned subsidiaries, as borrowers, entered into the $415 million multicurrency secured Amended Credit Agreement with the lender parties thereto and Morgan Stanley Senior Funding, Inc., as administrative agent for such lenders, with a commitment termination date of October 1, 2018. The principal amount of the commitments under the Amended Credit Agreement may be increased by an aggregate amount of up to $100 million, subject to certain terms and conditions specified in the Amended Credit Agreement. The Amended Credit Agreement replaces and supersedes in its entirety the $125 million multicurrency secured Revolving Loan Credit Agreement that we entered into on October 18, 2013. On August 8, 2014, we amended our revolving loan facility to permit, among other things, the acquisition of New Breed and the related transactions and the offering of the Senior Notes due 2019.
The proceeds of the Amended Credit Agreement may be used by us and our subsidiaries for ongoing working capital needs, other general corporate purposes, including strategic acquisitions, and fees and expenses in connection with the transaction. At December 31, 2014, the Company had no amount drawn under the Amended Credit Agreement. The Company was in compliance, in all material respects, with all covenants related to the Amended Credit Agreement as of December 31, 2014. Borrowings under the Amended Credit Agreement bear interest at a per annum rate equal to, at our option, the one, two, three or six month (or such other period less than one month or greater than six months as the lenders may agree) LIBOR rate plus a margin of 1.75% to 2.25%, or a base rate plus a margin of 0.75% to 1.25%. The borrowers are required to pay an undrawn commitment fee equal to 0.25% or 0.375% of the quarterly average undrawn portion of the commitments under the Amended Credit Agreement, as well as customary letter of credit fees. The margin added to LIBOR, or base rate, will depend on our quarterly average availability of the commitments under the Amended Credit Agreement.
All obligations under the Amended Credit Agreement are secured by substantially all of our assets and unconditionally guaranteed by certain of our subsidiaries, provided that no foreign subsidiary guarantees, and no assets of any foreign subsidiary secure, any obligations of any domestic borrower. The Amended Credit Agreement contains representations,
35
warranties and covenants that are customary for agreements of this type. Among other things, the covenants in the Amended Credit Agreement limit our ability to, with certain exceptions: incur indebtedness; grant liens; engage in certain mergers, consolidations, acquisitions and dispositions; make certain investments and restricted payments; and enter into certain transactions with affiliates. In certain circumstances, the Amended Credit Agreement also requires us to maintain minimum EBITDA or, at our election, maintain a Fixed Charge Coverage Ratio (as defined in the Amended Credit Agreement) of not less than 1.00 to 1.00. If an event of default under the Amended Credit Agreement occurs and is continuing, the commitments thereunder may be terminated and the principal amount outstanding thereunder, together with all accrued unpaid interest and other amounts owed thereunder, may be declared immediately due and payable. Certain subsidiaries acquired by us in the future may be excluded from the restrictions contained in certain of the foregoing covenants. We do not believe that the covenants contained in the Amended Credit Agreement will impair our ability to execute our strategy.
Contractual Obligations
The following table reflects our contractual obligations as of December 31, 2014 (in millions):
Payments Due by Period | |||||||||||||||||||
Contractual Obligations | Total | Less than 1 Year | 1 to 3 Years | 3 to 5 Years | More than 5 Years | ||||||||||||||
Capital leases payable | $ | 0.2 | $ | 0.1 | $ | 0.1 | $ | — | $ | — | |||||||||
Notes payable | 1.8 | 1.7 | 0.1 | — | — | ||||||||||||||
Operating leases | 342.1 | 123.7 | 129.6 | 67.5 | 21.3 | ||||||||||||||
Purchase commitments | 8.3 | 6.4 | 1.9 | — | — | ||||||||||||||
Employment contracts | 17.6 | 8.4 | 8.7 | 0.5 | — | ||||||||||||||
Severance | 2.3 | 2.1 | 0.2 | ||||||||||||||||
Convertible senior notes | 120.0 | 4.8 | 115.2 | — | — | ||||||||||||||
Senior notes due 2019 | 683.8 | 39.4 | 78.8 | 565.6 | |||||||||||||||
Total contractual cash obligations | $ | 1,176.1 | $ | 186.6 | $ | 334.6 | $ | 633.6 | $ | 21.3 | |||||||||
In addition to the obligations in the table above, we are contractually obligated to pay up to $21.1 million of purchase price holdbacks retained in connection with acquisitions, subject to resolution of, and set-off with respect to, any indemnifiable claims. The timing of such payments depends on the resolution of the underlying indemnifiable claims, and we cannot predict when such payments may be due. We do not have any other material commitments that have not been disclosed elsewhere.
CRITICAL ACCOUNTING ESTIMATES
We prepare our Consolidated Financial Statements in conformity with accounting principles generally accepted in the United States of America. These principles require management to make estimates and assumptions that impact the reported amounts of assets and liabilities and disclosure of contingent assets and liabilities at the date of the Consolidated Financial Statements and the reported amounts of revenues and expenses during the reporting period.
We review our estimates, including but not limited to: recognition of revenue, costs of purchased transportation and services, direct operating expenses, recoverability of long-lived assets, estimated legal accruals, estimated restructuring accruals, valuation allowances for deferred taxes, reserve for uncertain tax positions, and allowance for doubtful accounts, on a regular basis and make adjustments based on historical experiences and existing and expected future conditions. These evaluations are performed and adjustments are made as information is available. Management believes that these estimates are reasonable and has discussed them with the audit committee of our board of directors. However, actual results could differ from these estimates. Note 2 to our Consolidated Financial Statements includes a summary of the significant accounting policies and methods used in the preparation of our Consolidated Financial Statements. There were no significant changes to our critical accounting policies in 2014. The following is a brief discussion of our critical accounting policies and estimates.
Revenue Recognition
We recognize revenue at the point in time when delivery is completed and the shipping terms of the contract have been satisfied, or in the case of our contract logistics business, based on specific, objective criteria within the provisions of each contract as described below. Related costs of delivery and service are accrued and expensed in the same period the associated revenue is recognized. Revenue is recognized once the following criteria have been satisfied:
• | Persuasive evidence of an arrangement exists; |
• | Services have been rendered; |
• | The sales price is fixed and determinable; and |
36
• | Collectability is reasonably assured. |
Our Logistics segment recognizes a significant portion of its revenue based on objective criteria that do not require significant estimates or uncertainties. Revenues on cost-reimbursable contracts are recognized by applying a factor to costs as incurred, such factor being determined by the contract provisions. Revenues on unit-price contracts are recognized at the contractual selling prices of work completed. Revenues on time and material contracts are recognized at the contractual rates as the labor hours and direct expenses are incurred. Revenues from fixed-price contracts are recognized as services are provided, unless revenues are earned and obligations fulfilled in a different pattern. Generally, the contracts contain provisions for adjustments to future pricing based upon changes in volumes, services and other market conditions, such as inflation. Revenues relating to such incentive or contingency payments are recorded when the contingency is satisfied, and we conclude the amounts are earned.
We evaluate all agreements for multiple elements and aggregation of individual agreements into a multiple element agreements. Within our intermodal business, we have entered into certain agreements that represent multiple-deliverable arrangements. Deliverables under the arrangements represent separate units of accounting that have stand-alone value and no customer-negotiated refunds or return rights exist for the delivered services. These deliverables consist of network management fees, equipment use fees, ocean carrier intermodal services and drayage services. Revenue is allocated to each deliverable based on the relative selling price method. The relative selling price method is based on a hierarchy consisting of vendor-specific objective evidence (VSOE), if available, third-party evidence (TPE), if VSOE is not available, or estimated selling prices (ESP), if neither VSOE nor TPE is available. For the ocean carrier intermodal and drayage services, revenue is allocated based on VSOE. VSOE is not available for either the network management fees or the equipment fees. TPE was established for the equipment fees by evaluating similar and interchangeable competitor services in stand-alone sales. TPE could not be established for the network management fees. Therefore, we determined ESP for the network management fees by considering several external and internal factors including, but not limited to, pricing practices, similar product offerings, margin objectives and internal costs. ESP for each deliverable is updated, when appropriate, to ensure that it reflects recent pricing experience. Revenue is recognized for each of the deliverables when the revenue recognition conditions discussed above are met. No other multiple element arrangements have been identified.
For all subsidiaries (other than XPO NLM and New Breed with respect to those transactions where New Breed is serving as the customer’s agent in arranging purchased transportation), we report revenue on a gross basis in accordance with the Financial Accounting Standards Board’s (“FASB”) Accounting Standard Codification (“ASC”) Topic 605, “Reporting Revenue Gross as Principal Versus Net as an Agent.” We believe presentation on a gross basis is appropriate under ASC Topic 605 in light of the following factors:
• | We are the primary obligor and are responsible for providing the service desired by the customer. |
• | The customer holds us responsible for fulfillment, including the acceptability of the service (requirements may include, for example, on-time delivery, handling freight loss and damage claims, establishing pick-up and delivery times, tracing shipments in transit, and providing contract-specific services). |
• | For our expedited, truck brokerage, last mile and intermodal businesses, we have complete discretion to select contractors or other transportation providers (collectively, “service providers”). For our freight forwarding business, we enter into agreements with significant service providers that specify the cost of services, among other things, and have ultimate authority in providing approval for all service providers that can be used by our independently-owned stations. Independently-owned stations may further negotiate the cost of services with approved service providers for individual customer shipments. |
• | We have complete discretion to establish sales and contract pricing. Independently-owned stations within our freight forwarding business have the discretion to establish sales prices. |
• | We bear credit risk for all receivables. In the case of freight forwarding, the independently-owned stations reimburse us for a portion (typically 70-80%) of credit losses. We retain the risk that the independent station owners will not meet this obligation. |
For our subsidiaries XPO NLM and New Breed with respect to those transactions where New Breed is serving as the customer’s agent in arranging purchased transportation, revenue is recognized on a net basis in accordance with ASC Topic 605. We do not serve as the primary obligor. XPO NLM receives a fixed management fee for its services while New Breed receives a variable fee after deducting the cost of purchased transportation. Neither entity assumes credit risk in these transactions. In certain instances with XPO NLM, we also do not have discretion to select service providers.
Valuations for Accounts Receivable
Our allowance for doubtful accounts is calculated based upon the aging of our receivables, our historical experience of uncollectible accounts, and any specific customer collection issues that we have identified. The allowance of $9.8 million as of December 31, 2014 increased compared to the allowance of $3.5 million as of December 31, 2013. We believe that the recorded allowance is sufficient and appropriate based on our customer aging trends, the exposures we have identified and our historical
37
loss experience. A 10% deviation from our estimated allowance for doubtful accounts would have resulted in an increase or decrease of SG&A expense by approximately $1.0 million.
Stock-Based Compensation
We account for share-based compensation based on the equity instrument’s grant date fair value in accordance with ASC Topic 718, “Compensation—Stock Compensation”. The fair value of each share-based payment award is established on the date of grant. For grants of restricted stock units (“RSUs”) subject to service or performance-based vesting conditions only, the fair value is established based on the market price on the date of the grant. For grants of RSUs subject to market-based vesting conditions, the fair value is established using the Monte Carlo simulation lattice model. For grants of options, we use the Black-Scholes option pricing model to estimate the fair value of share-based payment awards. The determination of the fair value of share-based awards is affected by our stock price and a number of assumptions, including expected volatility, expected life, risk-free interest rate and expected dividends.
The weighted-average fair value of each stock option recorded in expense for the years ended December 31, 2014, 2013 and 2012 was estimated on the date of grant using the Black-Scholes option pricing model and is amortized over the requisite service period of the option. We have used one grouping for the assumptions, as our option grants have similar characteristics. The expected term of options granted has been derived based upon our history of actual exercise behavior and represents the period of time that options granted are expected to be outstanding. Historical data was also used to estimate option exercises and employee terminations. Estimated volatility is based upon our historical market price at consistent points in a period equal to the expected life of the options. The risk-free interest rate is based on the U.S. Treasury yield curve in effect at the time of grant and the expected dividend yield is zero.
For our performance-based restricted stock units (“PRSUs”), we recognize expense on a straight line basis over the awards’ requisite service period based on the number of awards expected to vest according to actual and expected financial results of the individual performance periods compared to set performance targets for those periods. If achievement of the performance targets for a PRSU award is not considered to be probable, then no expense will be recognized until achievement of such targets becomes probable. As of December 31, 2014, achievement of the performance targets for the outstanding PRSUs was not considered probable.
Income Taxes
Our annual effective tax rate is based on our income, statutory tax rates and tax planning opportunities available to us in the various jurisdictions in which we operate. Tax laws are complex and subject to different interpretations by the taxpayer and respective governmental taxing authorities. Significant judgment is required in determining our tax expense and in evaluating our tax positions, including evaluating uncertainties. We review our tax positions quarterly and adjust the balances as new information becomes available. Our income tax rate is affected by the tax rate on our foreign operations as well as the mix of income between our domestic and foreign operations. In addition to local country tax laws and regulations, this rate depends on the extent earnings are indefinitely reinvested outside the United States. Indefinite reinvestment is determined by management’s judgment about and intentions concerning the future operations of the Company. In general, it is our practice and intention to reinvest the earnings of our non-U.S. subsidiaries in those operations. As of December 31, 2014, the Company has not made a provision for U.S. or additional foreign withholding taxes for financial reporting over the tax basis of investments in foreign subsidiaries that are essentially permanent in duration, if any exists. Generally, such amounts become subject to U.S. taxation upon the remittance of dividends and under certain other circumstances. It is not practicable to estimate the amount of deferred tax liability related to investments in these foreign subsidiaries. Deferred income tax assets represent amounts available to reduce income taxes payable on taxable income in future years. Such assets arise because of temporary differences between the financial reporting and tax bases of assets and liabilities, as well as from net operating loss and tax credit carryforwards. We evaluate the recoverability of these future tax deductions and credits by assessing all available evidence, including the reversal of the deferred tax liabilities, carrybacks available and historical and projected pre-tax profits generated by our operations. We also considered tax planning strategies that are prudent and can be reasonably implemented in our evaluation. These sources of income rely heavily on estimates. The reversal of deferred tax liabilities prior to expiration of the deferred tax assets was the most significant factor in our determination of the valuation allowance under the “more likely than not” criteria. To the extent we do not consider it more likely than not that a deferred tax asset will be recovered, a valuation allowance is established.
Goodwill
Goodwill consists of the excess of cost over the fair value of net assets acquired in business combinations. We follow the provisions of ASC Topic 350, “Intangibles—Goodwill and Other”, which requires an annual impairment test for goodwill. We perform the annual impairment testing as of August 31 each year unless events or circumstances indicate impairment of the goodwill may have occurred before that time. We determine fair values for each of the reporting units using an income approach. For purposes of the income approach, fair value is determined based on the present value of estimated future cash flows, discounted at an appropriate risk-adjusted rate. We use our internal forecasts to estimate future cash flows and include an estimate of long-term future growth rates based on our most recent views of the long-term outlook for our business. Actual
38
results may differ from those assumed in our forecasts. We derive our discount rates using a capital asset pricing model and analyzing public company market data for our industry to estimate the weighted average cost of capital. We use discount rates that are commensurate with the risks and uncertainty inherent in the respective businesses and in our internally developed forecasts. Discount rates used in our reporting unit valuations approximated 10.5%. Required rates of return, along with uncertainty inherent in the forecasts of future cash flows, are reflected in the selection of the discount rate. For the periods presented, we did not recognize any goodwill impairment as the estimated fair value of our reporting units with goodwill exceeded the book value of these reporting units.
Estimating the fair value of reporting units requires the use of estimates and significant judgments that are based on a number of factors including actual operating results. If current conditions persist longer or deteriorate further than expected, it is reasonably possible that the judgments and estimates described above could change in future periods.
Intangible Assets with Definite Lives
We follow the provisions of ASC Topic 360, “Property, Plant and Equipment”, which establishes accounting standards for the impairment of long-lived assets such as property, plant and equipment and intangible assets subject to amortization. We review long-lived assets to be held-and-used for impairment whenever events or changes in circumstances indicate that the carrying amount of the assets may not be recoverable. Fair value is determined based on the present value of estimated future cash flows of the asset, discounted at an appropriate risk-adjusted rate. We use our internal forecasts to estimate future cash flows and include an estimate of long-term future growth rates based on our most recent views of the long-term outlook for our business. Actual results may differ from those assumed in our forecasts. We derive our discount rates using a capital asset pricing model and analyzing public company market data for our industry to estimate the weighted average cost of capital. We use discount rates that are commensurate with the risks and uncertainty associated with the recovery of the asset. Required rates of return, along with uncertainty inherent in the forecasts of future cash flows, are reflected in the selection of the discount rate. Determining whether an impairment loss has occurred requires comparing the carrying amount to the sum of undiscounted cash flows expected to be generated by the asset. If the sum of the undiscounted expected future cash flows over the remaining useful life of a long-lived asset group is less than its carrying amount, the asset is considered to be impaired. Impairment losses are measured as the amount by which the carrying amount of the asset group exceeds the fair value of the asset. During 2014, 2013 and 2012, there was no impairment of the intangible assets with definite lives.
Our intangible assets subject to amortization consist of customer lists and relationships, carrier relationships, trade names, non-compete agreements, and other intangibles. Customer lists and relationships and trade names are amortized on an accelerated basis over the period of economic benefit based on the estimated cash flows attributable to the related intangible assets. Non-compete agreements, carrier relationships and other intangibles are amortized on a straight-line basis over the estimated useful lives of the related intangible asset.
Off-balance Sheet Arrangements
We are not a party to any transactions that would be considered “off-balance sheet arrangements” under Item 303(a)(4) of Regulation S-K.
NEW PRONOUNCEMENTS
In July 2013, the FASB issued ASU 2013-11, Income Taxes (Topic 740): Presentation of an Unrecognized Tax Benefit When a Net Operating Loss Carryforward, a Similar Tax Loss, or a Tax Credit Carryforward Exists. ASU 2013-11 requires an unrecognized tax benefit, or a portion of an unrecognized tax benefit, to be presented in the financial statements as a reduction to a deferred tax asset for a net operating loss carryforward, a similar tax loss, or a tax credit carryforward. ASU 2013-11 is effective for fiscal years, and interim periods within those years, beginning after December 15, 2014. The new standard is to be applied prospectively but retrospective application is permitted. We will implement the provisions of ASU 2013-11 as of January 1, 2015.
In May 2014, the FASB issued ASU No. 2014-09, Revenue from Contracts with Customers, which requires an entity to recognize the amount of revenue to which it expects to be entitled for the transfer of promised goods or services to customers. An entity should also disclose sufficient quantitative and qualitative information to enable users of financial statements to understand the nature, amount, timing, and uncertainty of revenue and cash flows arising from contracts with customers. The ASU will replace most existing revenue recognition guidance in U.S. GAAP when it becomes effective. The new standard is effective for us on January 1, 2017. Early application is not permitted. The standard permits the use of either the retrospective or cumulative effect transition method. We are evaluating the effect that ASU 2014-09 will have on our consolidated financial statements and related disclosures. We have not yet selected a transition method nor have we determined the effect of the standard on our ongoing financial reporting.
39
ITEM 7A. QUANTITATIVE AND QUALITATIVE DISCLOSURES ABOUT MARKET RISK
The following discussion about our market risk disclosures involves forward-looking statements. Actual results could differ materially from those projected in the forward-looking statements. We are exposed to market risk related to changes in interest rates and foreign currency exchange rates.
Interest Rate Risk. As of December 31, 2014, we held $653.2 million of cash and restricted cash in cash depository and money market funds held in depository accounts at 18 financial institutions. The primary market risk associated with these investments is liquidity risk. We have exposure to changes in interest rates on our revolving credit facility. The interest rates on our revolving credit facility fluctuate based on LIBOR or a base rate plus an applicable margin. Assuming our $415.0 million revolving credit facility was fully drawn at December 31, 2014, a hypothetical 100-basis-point change in the interest rate would increase our annual interest expense by $4.2 million. We do not use derivative financial instruments to manage interest rate risk or to speculate on future changes in interest rates.
Convertible Debt Outstanding. The fair market value of our outstanding issue of Convertible Notes is subject to interest rate and market price risk due to the convertible feature of the notes and other factors. Generally the fair market value of fixed interest rate debt will increase as interest rates fall and decrease as interest rates rise. The fair market value of the notes may also increase as the market price of our stock rises and decrease as the market price of our stock falls. Interest rate and market value changes affect the fair market value of the Convertible Notes, and may affect the prices at which we would be able to repurchase such convertible senior notes were we to do so. These changes do not impact our financial position, cash flows or results of operations. For additional information on the fair value of our outstanding Convertible Notes, refer to Note 2—Basis of Presentation and Significant Accounting Policies of the Consolidated Financial Statements included within.
Senior Notes due 2019 Outstanding. The fair market value of our outstanding issue of Senior Notes due 2019 is subject to interest rate risk. Generally the fair market value of fixed interest rate debt will increase as interest rates fall and decrease as interest rates rise. Interest rate changes affect the fair market value of the Senior Notes due 2019, and may affect the prices at which we would be able to repurchase such notes were we to do so. These changes do not impact our financial position, cash flows or results of operations. For additional information on the fair value of our outstanding Senior Notes due 2019, refer to Note 2—Basis of Presentation and Significant Accounting Policies of the Consolidated Financial Statements included within.
Foreign Currency Exchange Risk. Our Canadian-based businesses and results of operations are exposed to movements in the U.S. dollar to Canadian dollar foreign currency exchange rate. A portion of our revenue is denominated in Canadian dollars. If the U.S. dollar strengthens against the Canadian dollar, our revenues reported in U.S. dollars would decline. With regard to operating expense, our primary exposure to foreign currency exchange risk relates to operating expense incurred in Canadian dollars. If the Canadian dollar strengthens, costs reported in U.S. dollars will increase. Movements in the U.S. dollar to Canadian dollar foreign currency exchange rate did not have a material effect on our revenue during the year ending December 31, 2014. A hypothetical ten percent change in average exchange rates versus the U.S. dollar would not have resulted in a material change to our earnings. Exchange risk related to other foreign currencies in which we do business is not material.
From time to time, we use foreign currency forward contracts to reduce part of the variability in certain forecasted Canadian dollar denominated cash flows. Generally, these instruments are for maturities of six months or less. We consider several factors when evaluating hedges of our forecasted foreign currency exposures, such as significance of the exposure, offsetting economic exposures and potential costs of hedging. We do not enter into derivative transactions for purposes other than hedging economic exposures. At December 31, 2014, we had no outstanding forward contracts to reduce the variability in our Canadian dollar denominated revenues and operating expenses.
ITEM 8. FINANCIAL STATEMENTS AND SUPPLEMENTARY DATA
The Consolidated Financial Statements and supplementary data of the Company required by this Item are included at pages 47-85 of this Annual Report on Form 10-K and are incorporated herein by reference.
ITEM 9. CHANGES IN AND DISAGREEMENTS WITH ACCOUNTANTS ON ACCOUNTING AND FINANCIAL DISCLOSURE
None.
40
ITEM 9A. CONTROLS AND PROCEDURES
Conclusion Regarding the Effectiveness of Disclosure Controls and Procedures
We carried out an evaluation, as required by paragraph (b) of Rule 13a-15 and 15d-15 of the Exchange Act under the supervision and with the participation of our management, including our Chief Executive Officer and Chief Financial Officer, of the effectiveness of our disclosure controls and procedures, as defined in Rules 13a-15(e) and 15d-15(e) under the Exchange Act, as of December 31, 2014. Based upon that evaluation, our Chief Executive Officer and Chief Financial Officer concluded that our disclosure controls and procedures were effective as of December 31, 2014.
Management’s Annual Report on Internal Control over Financial Reporting
We are responsible for establishing and maintaining adequate internal control over financial reporting. Internal control over financial reporting is defined in Rule 13a-15(f) and Rule 15d-15(f) promulgated under the Exchange Act as a process designed by, or under the supervision of, our Chief Executive Officer (our principal executive officer) and Chief Financial Officer (our principal financial officer), and effected by our board of directors, management and other personnel, to provide reasonable assurance regarding the reliability of financial reporting and the preparation of financial statements for external purposes in accordance with generally accepted accounting principles. Our internal control over financial reporting includes those policies and procedures that:
• | Pertain to the maintenance of records that, in reasonable detail, accurately and fairly reflect the transactions and dispositions of our assets; |
• | Provide reasonable assurance that transactions are recorded as necessary to permit preparation of financial statements in accordance with generally accepted accounting principles, and that our receipts and expenditures are being made only in accordance with authorizations of our management and our directors; and |
• | Provide reasonable assurance regarding prevention or timely detection of unauthorized acquisition, use or disposition of our assets that could have a material effect on the financial statements. |
Our internal control system was designed to provide reasonable assurance to our management and board of directors regarding the preparation and fair presentation of our published financial statements. Because of its inherent limitations, internal control over financial reporting may not prevent or detect misstatements. Also, projections of any evaluation of effectiveness to future periods are subject to the risk that controls may become inadequate because of changes in conditions, or that the degree of compliance with the policies or procedures may deteriorate.
Our management assessed the effectiveness of our internal control over financial reporting as of December 31, 2014. In making this assessment, management used the criteria set forth in the Internal Control—Integrated Framework (1992) issued by the Committee of Sponsoring Organizations of the Treadway Commission (COSO). Based on management’s assessment, we believe that, as of December 31, 2014, our internal control over financial reporting is effective.
We completed the acquisitions of Pacer, ACL and New Breed during 2014. Due to the proximity of certain acquisitions to year-end, we excluded from our assessment of the effectiveness of our internal control over financial reporting as of December 31, 2014, ACL’s and New Breed’s internal control over financial reporting associated with total assets of $864,064,211 and total revenues of $258,587,775 included in the Consolidated Financial Statements of XPO Logistics, Inc. and subsidiaries as of and for the year ended December 31, 2014. For additional information on the ACL and New Breed acquisitions, see Note 3 to our audited Consolidated Financial Statements.
KPMG LLP, the independent registered public accounting firm that audited the consolidated financial statements included in this Form 10-K, has issued a report on our internal control over financial reporting as of December 31, 2014. Such report is included on page 46 of this Form 10-K.
Changes in Internal Control Over Financial Reporting
Except as described below, there have not been any changes in the Company’s internal control over financial reporting during the quarter ended December 31, 2014 that have materially affected, or are reasonably likely to materially affect, its internal control over financial reporting. On March 31, 2014, July 28, 2014, and September 2, 2014, the Company completed its acquisitions of Pacer, ACL and New Breed, respectively, and is in the process of integrating the acquired businesses into the Company’s overall internal controls over financial reporting process. For additional information on the acquisitions of Pacer, ACL and New Breed, see Note 3 to Consolidated Financial Statements.
ITEM 9B. OTHER INFORMATION
Not applicable.
41
PART III
ITEM 10. DIRECTORS, EXECUTIVE OFFICERS AND CORPORATE GOVERNANCE
The information required by Item 10 of Part III of Form 10-K (other than certain information required by Item 401 of Regulation S-K with respect to our executive officers, which is set forth under Item 1 of Part I of this Annual Report on Form 10-K) will be set forth in our Proxy Statement relating to the 2015 Annual Meeting of Stockholders and is incorporated herein by reference.
We have adopted a Senior Officer Code of Business Conduct and Ethics (the “Code”), which is applicable to our principal executive officer, principal financial officer, principal accounting officer and other senior officers. The Code is available on our website at www.xpo.com. In the event that we amend or waive any of the provisions of the Code that relate to any element of the code of ethics definition enumerated in Item 406(b) of Regulation S-K, we intend to disclose the same on our website.
ITEM 11. EXECUTIVE COMPENSATION
The information required by Item 11 of Part III of Form 10-K will be set forth in our Proxy Statement relating to the 2015 Annual Meeting of Stockholders and is incorporated herein by reference.
ITEM 12. SECURITY OWNERSHIP OF CERTAIN BENEFICIAL OWNERS AND MANAGEMENT AND RELATED STOCKHOLDER MATTERS
The information required by Item 12 of Part III of Form 10-K (other than certain information required by Item 201(d) of Regulation S-K with respect to equity compensation plans, which is set forth below) will be set forth in our Proxy Statement relating to the 2015 Annual Meeting of Stockholders and is incorporated herein by reference.
Equity Compensation Plan
The following table sets forth information, as of December 31, 2014, with respect to the Company’s compensation plans under which equity securities are authorized for issuance.
Equity Compensation Plan Information | |||||||||
Plan category | Number of securities to be issued upon exercise of outstanding options, warrants and rights (a) | Weighted-average exercise price of outstanding options, warrants and rights (b) | Number of securities remaining available for future issuance under equity compensation plans (excluding securities reflected in column (a)) (c) | ||||||
Equity compensation plans approved by security holders (1) | 1,294,795 | $ | 11.61 | 960,795 | |||||
Equity compensation plans not approved by security holders (2) | 50,000 | 14.09 | — | ||||||
Total | 1,344,795 | $ | 11.70 | 960,795 | |||||
(1) | These securities include 1,294,795 stock options. The securities are issuable under the XPO Logistics, Inc. Amended and Restated 2011 Omnibus Incentive Compensation Plan and a predecessor plan, the Segmentz, Inc. 2001 Stock Option Plan. |
(2) | These securities were granted to our Chief Financial Officer in February 2012 outside the security holder-approved plan as an employment inducement grant. These securities represent 50,000 stock options. |
Additionally, the Company is holding 764 shares of the Company’s common stock in an employee stock ownership plan on behalf of qualifying employees. The employee stock ownership plan was terminated effective as of December 31, 2012, and the Company is in the process of liquidating the plan’s assets.
ITEM 13. CERTAIN RELATIONSHIPS AND RELATED TRANSACTIONS AND DIRECTOR INDEPENDENCE
The information required by Item 13 of Part III of Form 10-K will be set forth in our Proxy Statement relating to the 2015 Annual Meeting of Stockholders and is incorporated herein by reference.
ITEM 14. PRINCIPAL ACCOUNTANT FEES AND SERVICES
The information required by Item 14 of Part III of Form 10-K will be set forth in our Proxy Statement relating to the 2015 Annual Meeting of Stockholders and is incorporated herein by reference.
42
PART IV
Item 15. EXHIBITS, FINANCIAL STATEMENT SCHEDULES
Financial Statements and Financial Statement Schedules
The list of Consolidated Financial Statements set forth in the accompanying Index to Consolidated Financial Statements is incorporated herein by reference. Such Consolidated Financial Statements are filed as part of this Annual Report on Form 10-K. All financial statement schedules are omitted because the required information is not applicable, or because the information required is included in the Consolidated Financial Statements and notes thereto.
Exhibits
The exhibits listed on the accompanying Exhibit Index starting on page 86 of this Annual Report on Form 10-K are filed or incorporated by reference as part of this Annual Report on Form 10-K and such Exhibit Index is incorporated herein by reference.
Certain of the agreements listed as exhibits to this Annual Report on Form 10-K (including the exhibits to such agreements), which have been filed to provide investors with information regarding their terms, contain various representations, warranties and covenants of XPO Logistics, Inc. and the other parties thereto. They are not intended to provide factual information about any of the parties thereto or any subsidiaries of the parties thereto. The assertions embodied in those representations, warranties and covenants were made for purposes of each of the agreements, solely for the benefit of the parties thereto. In addition, certain representations and warranties were made as of a specific date, may be subject to a contractual standard of materiality different from what a security holder might view as material, or may have been made for purposes of allocating contractual risk among the parties rather than establishing matters as facts. Investors should not view the representations, warranties, and covenants in the agreements (or any description thereof) as disclosures with respect to the actual state of facts concerning the business, operations, or condition of any of the parties to the agreements (or their subsidiaries) and should not rely on them as such. In addition, information in any such representations, warranties or covenants may change after the dates covered by such provisions, which subsequent information may or may not be fully reflected in the public disclosures of the parties. In any event, investors should read the agreements together with the other information concerning XPO Logistics, Inc. contained in reports and statements that we file with the SEC.
43
SIGNATURES
Pursuant to the requirements of Section 13 or 15(d) of the Securities Exchange Act of 1934, the registrant has duly caused this report to be signed on its behalf by the undersigned, thereunto duly authorized.
February 23, 2015
XPO LOGISTICS, INC. | |||
By: | /s/ Bradley S. Jacobs | ||
Bradley S. Jacobs | |||
(Chairman of the Board of Directors and Chief Executive Officer) | |||
By: | /s/ John J. Hardig | ||
John J. Hardig | |||
(Chief Financial Officer) | |||
Pursuant to the requirements of the Securities Exchange Act of 1934, this report has been signed below by the following persons on behalf of the registrant and in the capacities on the dates indicated.
Signature | Title | Date | ||
/s/ Bradley S. Jacobs | Chairman of the Board of Directors and Chief Executive Officer (Principal Executive Officer) | February 23, 2015 | ||
Bradley S. Jacobs | ||||
/s/ John J. Hardig | Chief Financial Officer (Principal Financial Officer) | February 23, 2015 | ||
John J. Hardig | ||||
/s/ Kent R. Renner | Senior Vice President—Chief Accounting Officer (Principal Accounting Officer) | February 23, 2015 | ||
Kent R. Renner | ||||
/s/ G. Chris Andersen | Director | February 23, 2015 | ||
G. Chris Andersen | ||||
/s/ Michael G. Jesselson | Director | February 23, 2015 | ||
Michael G. Jesselson | ||||
/s/ Adrian P. Kingshott | Director | February 23, 2015 | ||
Adrian P. Kingshott | ||||
/s/ James J. Martell | Director | February 23, 2015 | ||
James J. Martell | ||||
/s/ Jason D. Papastavrou | Director | February 23, 2015 | ||
Jason D. Papastavrou | ||||
/s/ Oren G. Shaffer | Director | February 23, 2015 | ||
Oren G. Shaffer | ||||
44
Page No. | |
45
Report of Independent Registered Public Accounting Firm
The Board of Directors and Stockholders
XPO Logistics, Inc.:
We have audited the accompanying consolidated balance sheets of XPO Logistics, Inc. and subsidiaries (the Company) as of December 31, 2014 and 2013, and the related consolidated statements of operations, changes in stockholders’ equity, and cash flows for each of the years in the three-year period ended December 31, 2014. We also have audited the Company’s internal control over financial reporting as of December 31, 2014, based on criteria established in Internal Control - Integrated Framework (1992) issued by the Committee of Sponsoring Organizations of the Treadway Commission (COSO). The Company’s management is responsible for these consolidated financial statements, for maintaining effective internal control over financial reporting, and for its assessment of the effectiveness of internal control over financial reporting, included in the accompanying Management’s Annual Report on Internal Control over Financial Reporting. Our responsibility is to express an opinion on these consolidated financial statements and an opinion on the Company’s internal control over financial reporting based on our audits.
We conducted our audits in accordance with the standards of the Public Company Accounting Oversight Board (United States). Those standards require that we plan and perform the audits to obtain reasonable assurance about whether the financial statements are free of material misstatement and whether effective internal control over financial reporting was maintained in all material respects. Our audits of the consolidated financial statements included examining, on a test basis, evidence supporting the amounts and disclosures in the financial statements, assessing the accounting principles used and significant estimates made by management, and evaluating the overall financial statement presentation. Our audit of internal control over financial reporting included obtaining an understanding of internal control over financial reporting, assessing the risk that a material weakness exists, and testing and evaluating the design and operating effectiveness of internal control based on the assessed risk. Our audits also included performing such other procedures as we considered necessary in the circumstances. We believe that our audits provide a reasonable basis for our opinions.
A company’s internal control over financial reporting is a process designed to provide reasonable assurance regarding the reliability of financial reporting and the preparation of financial statements for external purposes in accordance with generally accepted accounting principles. A company’s internal control over financial reporting includes those policies and procedures that (1) pertain to the maintenance of records that, in reasonable detail, accurately and fairly reflect the transactions and dispositions of the assets of the company; (2) provide reasonable assurance that transactions are recorded as necessary to permit preparation of financial statements in accordance with generally accepted accounting principles, and that receipts and expenditures of the company are being made only in accordance with authorizations of management and directors of the company; and (3) provide reasonable assurance regarding prevention or timely detection of unauthorized acquisition, use, or disposition of the company’s assets that could have a material effect on the financial statements.
Because of its inherent limitations, internal control over financial reporting may not prevent or detect misstatements. Also, projections of any evaluation of effectiveness to future periods are subject to the risk that controls may become inadequate because of changes in conditions, or that the degree of compliance with the policies or procedures may deteriorate.
In our opinion, the consolidated financial statements referred to above present fairly, in all material respects, the financial position of XPO Logistics, Inc. and subsidiaries as of December 31, 2014 and 2013, and the results of its operations and its cash flows for each of the years in the three-year period ended December 31, 2014, in conformity with U.S. generally accepted accounting principles. Also in our opinion, XPO Logistics, Inc. maintained, in all material respects, effective internal control over financial reporting as of December 31, 2014, based on criteria established in Internal Control - Integrated Framework (1992) issued by the Committee of Sponsoring Organizations of the Treadway Commission (COSO).
XPO Logistics, Inc. acquired Simply Logistics Inc. d/b/a Atlantic Central Logistics (ACL), and New Breed Holding Company (New Breed) during 2014, and management excluded from its assessment of the effectiveness of the Company’s internal control over financial reporting as of December 31, 2014, ACL’s and New Breed’s internal control over financial reporting associated with total assets of $864,064,211 and total revenues of $258,587,775, included in the consolidated financial statements of XPO Logistics, Inc. and subsidiaries as of and for the year ended December 31, 2014. Our audit of internal control over financial reporting of XPO Logistics, Inc. also excluded an evaluation of the internal control over financial reporting of ACL and New Breed.
(signed) KPMG LLP
Chicago, IL
February 23, 2015
46
XPO Logistics, Inc.
Consolidated Balance Sheets
(In millions, except share data)
December 31, 2014 | December 31, 2013 | ||||||
ASSETS | |||||||
Current assets: | |||||||
Cash and cash equivalents | $ | 644.1 | $ | 21.5 | |||
Accounts receivable, net of allowances of $9.8 and $3.5, respectively | 543.8 | 134.2 | |||||
Prepaid expenses | 13.2 | 3.9 | |||||
Deferred tax asset, current | 9.2 | 3.0 | |||||
Income tax receivable | 15.4 | — | |||||
Other current assets | 7.4 | 7.4 | |||||
Total current assets | 1,233.1 | 170.0 | |||||
Property and equipment, net of $47.3 and $11.8 in accumulated depreciation, respectively | 221.9 | 56.6 | |||||
Goodwill | 929.3 | 363.4 | |||||
Identifiable intangible assets, net of $74.6 and $15.4 in accumulated amortization, respectively | 341.5 | 185.2 | |||||
Restricted cash | 9.1 | 2.1 | |||||
Other long-term assets | 26.3 | 2.9 | |||||
Total long-term assets | 1,528.1 | 610.2 | |||||
Total assets | $ | 2,761.2 | $ | 780.2 | |||
LIABILITIES AND STOCKHOLDERS’ EQUITY | |||||||
Current liabilities: | |||||||
Accounts payable | $ | 252.7 | $ | 71.4 | |||
Accrued salaries and wages | 50.1 | 11.7 | |||||
Accrued expenses, other | 69.8 | 9.5 | |||||
Current maturities of long-term debt | 1.8 | 2.0 | |||||
Other current liabilities | 6.7 | 4.7 | |||||
Total current liabilities | 381.1 | 99.3 | |||||
Senior notes due 2019 | 500.0 | — | |||||
Convertible senior notes | 91.9 | 106.3 | |||||
Revolving credit facility and other long-term debt, net of current maturities | 0.2 | 75.4 | |||||
Deferred tax liability, long term | 74.5 | 15.2 | |||||
Other long-term liabilities | 58.4 | 28.1 | |||||
Total long-term liabilities | 725.0 | 225.0 | |||||
Commitments and contingencies | |||||||
Stockholders’ equity: | |||||||
Series A convertible perpetual preferred stock, $.001 par value; 10,000,000 shares; 73,335 and 74,175 shares issued and outstanding at December 31, 2014 and December 31, 2013, respectively | 42.2 | 42.7 | |||||
Common stock, $.001 par value; 150,000,000 shares authorized; 77,421,683 shares issued and outstanding at December 31, 2014 and 30,583,073 and 30,538,073 shares issued and outstanding, respectively, at December 31, 2013 | 0.1 | — | |||||
Additional paid-in capital | 1,831.9 | 525.0 | |||||
Treasury stock, at cost, 0 and 45,000 shares held at December 31, 2014 and December 31, 2013, respectively | — | (0.1 | ) | ||||
Accumulated deficit | (219.1 | ) | (111.7 | ) | |||
Total stockholders’ equity | 1,655.1 | 455.9 | |||||
Total liabilities and stockholders’ equity | $ | 2,761.2 | $ | 780.2 | |||
47
XPO Logistics, Inc.
Consolidated Statements of Operations
(In millions, except per share data)
Year Ended December 31, | |||||||||||
2014 | 2013 | 2012 | |||||||||
Revenue | $ | 2,356.6 | $ | 702.3 | $ | 278.6 | |||||
Operating expenses | |||||||||||
Cost of purchased transportation and services | 1,701.8 | 578.7 | 237.8 | ||||||||
Direct operating expense | 273.2 | 6.4 | — | ||||||||
Sales, general and administrative expense | 422.5 | 169.5 | 68.8 | ||||||||
Total operating expenses | 2,397.5 | 754.6 | 306.6 | ||||||||
Operating loss | (40.9 | ) | (52.3 | ) | (28.0 | ) | |||||
Other expense | 0.8 | 0.5 | 0.3 | ||||||||
Interest expense | 48.0 | 18.2 | 3.2 | ||||||||
Loss before income tax benefit | (89.7 | ) | (71.0 | ) | (31.5 | ) | |||||
Income tax benefit | (26.1 | ) | (22.5 | ) | (11.2 | ) | |||||
Net loss | (63.6 | ) | (48.5 | ) | (20.3 | ) | |||||
Preferred stock beneficial conversion charge | (40.9 | ) | — | — | |||||||
Cumulative preferred dividends | (2.9 | ) | (3.0 | ) | (3.0 | ) | |||||
Net loss available to common stockholders | $ | (107.4 | ) | $ | (51.5 | ) | $ | (23.3 | ) | ||
Basic loss per share | |||||||||||
Net loss | $ | (2.00 | ) | $ | (2.26 | ) | $ | (1.49 | ) | ||
Diluted loss per share | |||||||||||
Net loss | $ | (2.00 | ) | $ | (2.26 | ) | $ | (1.49 | ) | ||
Weighted average common shares outstanding | |||||||||||
Basic weighted average common shares outstanding | 53.6 | 22.8 | 15.7 | ||||||||
Diluted weighted average common shares outstanding | 53.6 | 22.8 | 15.7 | ||||||||
See accompanying notes to consolidated financial statements.
48
XPO Logistics, Inc.
Consolidated Statements of Cash Flows
(In millions)
Year Ended December 31, | |||||||||||
2014 | 2013 | 2012 | |||||||||
Operating activities | |||||||||||
Net loss | $ | (63.6 | ) | $ | (48.5 | ) | $ | (20.3 | ) | ||
Adjustments to reconcile net loss to net cash from operating activities | |||||||||||
Provisions for allowance for doubtful accounts | 6.9 | 2.6 | 0.9 | ||||||||
Depreciation and amortization | 98.3 | 20.8 | 2.7 | ||||||||
Stock compensation expense | 7.5 | 4.7 | 4.4 | ||||||||
Accretion of debt | 7.3 | 6.0 | 1.5 | ||||||||
Deferred tax expense | (30.0 | ) | (22.7 | ) | (8.3 | ) | |||||
Other | 4.3 | 1.3 | — | ||||||||
Changes in assets and liabilities, net of effects of acquisitions: | |||||||||||
Accounts receivable | (143.9 | ) | (37.0 | ) | (13.8 | ) | |||||
Income tax receivable | 2.1 | 0.1 | (1.6 | ) | |||||||
Prepaid expense and other current assets | 8.1 | (3.0 | ) | 0.8 | |||||||
Other long-term assets | (1.0 | ) | — | (0.3 | ) | ||||||
Accounts payable | 53.9 | 5.2 | 10.9 | ||||||||
Accrued expenses and other liabilities | 28.8 | 4.2 | (1.2 | ) | |||||||
Cash flows used by operating activities | (21.3 | ) | (66.3 | ) | (24.3 | ) | |||||
Investing activities | |||||||||||
Acquisition of businesses, net of cash acquired | (814.0 | ) | (458.8 | ) | (57.2 | ) | |||||
Payment for purchases of property and equipment | (44.6 | ) | (11.6 | ) | (7.0 | ) | |||||
Other | 0.3 | 0.1 | — | ||||||||
Cash flows used by investing activities | (858.3 | ) | (470.3 | ) | (64.2 | ) | |||||
Financing activities | |||||||||||
Proceeds from common stock offerings, net | 733.8 | 239.5 | 137.0 | ||||||||
Proceeds from issuance of preferred stock, net | 363.6 | — | — | ||||||||
Proceeds from issuance of senior notes, net | 489.6 | — | — | ||||||||
Proceeds from issuance of convertible senior notes, net | — | — | 138.5 | ||||||||
Proceeds from borrowings on revolving credit facility | 130.0 | 73.3 | — | ||||||||
Repayment of borrowings on revolving credit facility | (205.0 | ) | — | — | |||||||
Dividends paid to preferred stockholders | (2.9 | ) | (3.0 | ) | (3.0 | ) | |||||
Payments of tax withholdings for restricted shares | (3.4 | ) | (1.6 | ) | (1.2 | ) | |||||
Other | (3.5 | ) | (2.5 | ) | (4.5 | ) | |||||
Cash flows provided by financing activities | 1,502.2 | 305.7 | 266.8 | ||||||||
Net increase (decrease) in cash | 622.6 | (230.9 | ) | 178.3 | |||||||
Cash and cash equivalents, beginning of period | 21.5 | 252.4 | 74.1 | ||||||||
Cash and cash equivalents, end of period | $ | 644.1 | $ | 21.5 | $ | 252.4 | |||||
Supplemental disclosure of cash flow information: | |||||||||||
Cash paid for interest | $ | 19.0 | $ | 12.4 | $ | — | |||||
Cash paid for income taxes, net of receipts | $ | 2.3 | $ | 0.2 | $ | 0.2 | |||||
Equity portion of acquisition purchase price | $ | 138.2 | $ | 10.4 | $ | — | |||||
See accompanying notes to consolidated financial statements.
49
XPO Logistics, Inc.
Consolidated Statements of Changes in Stockholders’ Equity
For the Three Years Ended December 31, 2014, 2013 and 2012
(In millions, except share data)
Series A Preferred Stock | Series B Preferred Stock | Common Stock | Treasury Stock | Paid-In Capital | Accumulated Deficit | Total | |||||||||||||||||||||||||||||||||
Shares | Amount | Shares | Amount | Shares | Amount | Shares | Amount | ||||||||||||||||||||||||||||||||
Balance at December 31, 2011 | 75 | $ | 42.8 | — | $ | — | 8,410 | $ | — | (45 | ) | $ | (0.1 | ) | $ | 102.6 | $ | (36.9 | ) | $ | 108.4 | ||||||||||||||||||
Net loss | — | — | — | — | — | — | — | — | — | (20.3 | ) | $ | (20.3 | ) | |||||||||||||||||||||||||
Issuance of common stock for exercises, net of withholdings | (1 | ) | — | — | — | 393 | — | — | — | (1.0 | ) | — | $ | (1.0 | ) | ||||||||||||||||||||||||
Proceeds from common stock offering, net of issuance costs | — | — | — | — | 9,200 | — | — | — | 137.0 | — | $ | 137.0 | |||||||||||||||||||||||||||
Dividend paid | — | — | — | — | — | — | — | — | — | (3.0 | ) | $ | (3.0 | ) | |||||||||||||||||||||||||
Stock compensation expense | — | — | — | — | — | — | — | — | 4.4 | — | $ | 4.4 | |||||||||||||||||||||||||||
Equity component of convertible debt offering, net of issuance costs and deferred taxes | — | — | — | — | — | — | — | — | 19.7 | — | $ | 19.7 | |||||||||||||||||||||||||||
Balance at December 31, 2012 | 74 | 42.8 | — | — | 18,003 | — | (45 | ) | (0.1 | ) | 262.7 | (60.2 | ) | 245.2 | |||||||||||||||||||||||||
Net loss | — | — | — | — | — | — | — | — | — | (48.5 | ) | $ | (48.5 | ) | |||||||||||||||||||||||||
Tax withholdings on restricted shares and other issuances of common stock | — | — | — | — | 192 | — | — | — | (1.8 | ) | — | $ | (1.8 | ) | |||||||||||||||||||||||||
Conversion of preferred stock to common stock | — | (0.1 | ) | — | — | 14 | — | — | — | 0.1 | — | $ | — | ||||||||||||||||||||||||||
Proceeds from common stock offering, net of issuance costs | — | — | — | — | 11,148 | — | — | — | 239.5 | — | $ | 239.5 | |||||||||||||||||||||||||||
Issuance of common stock for acquisitions | — | — | — | — | 617 | — | — | — | 10.4 | — | $ | 10.4 | |||||||||||||||||||||||||||
Issuance of common stock upon conversion of senior notes, net of tax | — | — | — | — | 609 | — | — | — | 9.4 | — | $ | 9.4 | |||||||||||||||||||||||||||
Dividend paid | — | — | — | — | — | — | — | — | — | (3.0 | ) | $ | (3.0 | ) | |||||||||||||||||||||||||
Stock compensation expense | — | — | — | — | — | — | — | — | 4.7 | — | $ | 4.7 | |||||||||||||||||||||||||||
Balance at December 31, 2013 | 74 | 42.7 | — | — | 30,583 | — | (45 | ) | (0.1 | ) | 525.0 | (111.7 | ) | 455.9 | |||||||||||||||||||||||||
Net loss | — | — | — | — | — | — | — | — | — | (63.6 | ) | $ | (63.6 | ) | |||||||||||||||||||||||||
Exercise of warrants and stock options and other | — | — | — | — | 293 | — | — | — | (4.5 | ) | — | $ | (4.5 | ) | |||||||||||||||||||||||||
Conversion of Series A preferred stock to common stock | (1 | ) | (0.5 | ) | — | — | 120 | — | — | — | 0.5 | — | $ | — | |||||||||||||||||||||||||
Proceeds from issuance of preferred stock, net of issuance costs | — | — | 400 | 363.6 | — | — | — | — | — | — | $ | 363.6 | |||||||||||||||||||||||||||
Conversion of Series B preferred stock to common stock | — | — | (400 | ) | (363.6 | ) | 12,128 | — | — | — | 363.6 | — | $ | — | |||||||||||||||||||||||||
Deemed distribution for recognition of beneficial conversion feature on preferred stock | — | — | — | — | — | — | — | — | 40.9 | (40.9 | ) | $ | — | ||||||||||||||||||||||||||
Proceeds from common stock offering, net of issuance costs | — | — | — | — | 27,953 | 0.1 | — | — | 733.7 | — | $ | 733.8 | |||||||||||||||||||||||||||
Issuance of common stock for acquisitions | — | — | — | — | 4,704 | — | 45 | 0.1 | 138.1 | — | $ | 138.2 | |||||||||||||||||||||||||||
Issuance of common stock upon conversion of convertible senior notes, net of tax | — | — | — | — | 1,641 | — | — | — | 27.1 | — | $ | 27.1 | |||||||||||||||||||||||||||
Dividend paid | — | — | — | — | — | — | — | — | — | (2.9 | ) | $ | (2.9 | ) | |||||||||||||||||||||||||
Stock compensation expense | — | — | — | — | — | — | — | — | 7.5 | — | $ | 7.5 | |||||||||||||||||||||||||||
Balance at December 31, 2014 | 73 | $ | 42.2 | — | $ | — | 77,422 | $ | 0.1 | — | $ | — | $ | 1,831.9 | $ | (219.1 | ) | $ | 1,655.1 | ||||||||||||||||||||
See accompanying notes to consolidated financial statements.
50
XPO Logistics, Inc.
Notes to Consolidated Financial Statements
Years ended December 31, 2014, 2013 and 2012
1. Organization
Nature of Business
XPO Logistics, Inc. (“XPO” or the “Company”)—provides premium transportation and logistics services to thousands of customers through our two reportable segments:
Transportation—provides transportation brokerage services to large multi-national, medium-sized and small business customers where the Company manages all aspects of the services offered including selecting qualified carriers/vessels, negotiating rates, tracking shipments, billing and resolving disputes. Transportation offers a comprehensive suite of services with the common goal of facilitating the movement of goods using proprietary transportation management technology and third-party carriers. Under the Company’s cross-selling initiative, all services are offered to all customers to fulfill their shipping requirements. Under the brands XPO Logistics, XPO Last Mile (formerly 3PD), and Pacer, the Company provides truckload, less-than truckload and intermodal brokerage, and last-mile delivery logistics services. Such services are arranged using relationships with subcontracted motor and rail carriers, as well as vehicles that are owned and operated by independent contract drivers. Under the brands XPO Express (formerly Express-1), XPO NLM and XPO Air Charter, the Company provides for the management of time-critical, urgent shipments, transacted through direct selling and through our web-based technology to customers in North America. Expedited ground services are provided through a fleet of exclusive-use vehicles that are owned and operated by independent contract drivers, referred to as owner operators, and through contracted third-party motor carriers. For shipments requiring air charter, service is arranged using our relationships with third-party air carriers. Under the brands XPO Global Logistics (formerly Concert Group Logistics) and Ocean World Lines (a Pacer brand), the Company provides freight forwarding and ocean transportation services to North America-based customers with domestic and global interests. These services are sold and arranged through a network of Company-owned and independently-owned offices in the United States, Canada, Europe and Asia.
Logistics—provides specialized logistics and comprehensive supply chain management solutions to large multi-national and medium-sized corporations and government agencies under the brand New Breed Logistics, which was acquired in September 2014. See Note 3—Acquisitions. New Breed Holding Company (“New Breed”) and its subsidiaries conduct operations principally in the United States. These services include value-added warehousing and distribution, reverse logistics, transportation management, freight bill audit and payment, lean manufacturing support, aftermarket support and supply chain optimization.
For specific financial information relating to the above segments, refer to Note 16—Segment Reporting and Geographic Information.
2. Basis of Presentation and Significant Accounting Policies
Basis of Presentation
The accompanying Consolidated Financial Statements of the Company have been prepared pursuant to the rules and regulations of the Securities and Exchange Commission (“SEC”) and in accordance with the instructions to Form 10-K. The Company believes that the disclosures contained herein are adequate to make the information presented not misleading.
These Consolidated Financial Statements reflect, in the opinion of the Company, all material adjustments (which include only normal recurring adjustments) necessary to fairly present the Company’s financial position as of December 31, 2014 and 2013, and results of operations for the years ended December 31, 2014, 2013 and 2012. The preparation of the Consolidated Financial Statements requires management to make estimates and judgments that affect the reported amounts of assets and liabilities and the disclosure of contingencies at the date of the financial statements as well as the reported amounts of revenue and expense during the reporting period. Estimates have been prepared on the basis of the most current and best available information, but actual results could differ materially from those estimates. Intercompany transactions have been eliminated in the Consolidated Financial Statements. Where the presentation of these intercompany eliminations differs between the consolidated and reportable segment financial statements, reconciliations of certain line items are provided.
Use of Estimates
The Company prepares its Consolidated Financial Statements in conformity with accounting principles generally accepted in the United States of America. These principles require management to make estimates and assumptions that impact the reported amounts of assets and liabilities and disclosure of contingent assets and liabilities at the date of the Consolidated Financial Statements and the reported amounts of revenue and expense during the reporting period. The Company reviews its estimates on a regular basis and makes adjustments based on historical experience and existing and expected future conditions. Estimates are made with respect to, among other matters, recognition of revenue, costs of purchased transportation and services,
51
direct operating expenses, recoverability of long-lived assets, estimated legal accruals, estimated restructuring accruals, valuation allowances for deferred taxes, reserve for uncertain tax positions, probability of achieving performance targets for vesting of performance-based restricted stock units, and allowance for doubtful accounts. These evaluations are performed and adjustments are made as information is available. Management believes that these estimates, which have been discussed with the audit committee of the Company’s board of directors, are reasonable; however, actual results could differ from these estimates.
Statements of Operations, Balance Sheet, and Statement of Cash Flows Presentation
Certain line items from the December 31, 2013 consolidated balance sheet and consolidated statement of cash flows for the years ended December 31, 2013 and 2012 have been conformed to the 2014 presentation. The carrier costs related to unbilled revenue are now included in accounts payable rather than accrued expenses, other. The conformed line items had no impact on previously reported results.
Certain line items from the consolidated statements of operations for the years ended December 31, 2013 and 2012 have been conformed to the 2014 presentation, including the retitling of direct expense to cost of purchased transportation and services and the addition of the direct operating expense category. The conformed line items had no impact on previously reported results.
Significant Accounting Policies
Revenue Recognition
The Company recognizes revenue at the point in time when delivery is completed and the shipping terms of the contract have been satisfied, or in the case of the Company’s contract logistics business, based on specific, objective criteria within the provisions of each contract as described below. Related costs of delivery and service are accrued and expensed in the same period the associated revenue is recognized. Revenue is recognized once the following criteria have been satisfied:
• | Persuasive evidence of an arrangement exists; |
• | Services have been rendered; |
• | The sales price is fixed and determinable; and |
• | Collectability is reasonably assured. |
The Company’s Logistics segment recognizes a significant portion of its revenue based on objective criteria that do not require significant estimates or uncertainties. Revenues on cost-reimbursable contracts are recognized by applying a factor to costs as incurred, such factor being determined by the contract provisions. Revenues on unit-price contracts are recognized at the contractual selling prices of work completed. Revenues on time and material contracts are recognized at the contractual rates as the labor hours and direct expenses are incurred. Revenues from fixed-price contracts are recognized as services are provided, unless revenues are earned and obligations fulfilled in a different pattern. Generally, the contracts contain provisions for adjustments to future pricing based upon changes in volumes, services and other market conditions, such as inflation. Revenues relating to such incentive or contingency payments are recorded when the contingency is satisfied and the Company concludes the amounts are earned.
The Company evaluates all agreements for multiple elements and aggregation of individual agreements into a multiple element agreements. Within its intermodal business, the Company has entered into certain agreements that represent multiple-deliverable arrangements. Deliverables under the arrangements represent separate units of accounting that have stand-alone value and no customer-negotiated refunds or return rights exist for the delivered services. These deliverables consist of network management fees, equipment use fees, ocean carrier intermodal services and drayage services. Revenue is allocated to each deliverable based on the relative selling price method. The relative selling price method is based on a hierarchy consisting of vendor-specific objective evidence (VSOE), if available, third-party evidence (TPE), if VSOE is not available, or estimated selling prices (ESP), if neither VSOE nor TPE is available. For the ocean carrier intermodal and drayage services, revenue is allocated based on VSOE. VSOE is not available for either the network management fees or the equipment fees. TPE was established for the equipment fees by evaluating similar and interchangeable competitor services in stand-alone sales. TPE could not be established for the network management fees. Therefore, the Company determined ESP for the network management fees by considering several external and internal factors including, but not limited to, pricing practices, similar product offerings, margin objectives and internal costs. ESP for each deliverable is updated, when appropriate, to ensure that it reflects recent pricing experience. Revenue is recognized for each of the deliverables when the revenue recognition conditions discussed above are met. No other multiple element arrangements have been identified.
For all subsidiaries (other than XPO NLM and New Breed with respect to those transactions where New Breed is serving as the customer’s agent in arranging purchased transportation), the Company reports revenue on a gross basis in accordance with the Financial Accounting Standards Board’s (“FASB”) Accounting Standard Codification (“ASC”) Topic 605, “Reporting Revenue Gross as Principal Versus Net as an Agent.” The Company believes presentation on a gross basis is appropriate under ASC Topic 605 in light of the following factors:
52
• | The Company is the primary obligor and is responsible for providing the service desired by the customer. |
• | The customer holds the Company responsible for fulfillment, including the acceptability of the service (requirements may include, for example, on-time delivery, handling freight loss and damage claims, establishing pick-up and delivery times, tracing shipments in transit, and providing contract-specific services). |
• | For the Company’s expedited, truck brokerage, last mile and intermodal businesses, the Company has complete discretion to select contractors or other transportation providers (collectively, “service providers”). For its freight forwarding business, the Company enters into agreements with significant service providers that specify the cost of services, among other things, and has ultimate authority in providing approval for all service providers that can be used by its independently-owned stations. Independently-owned stations may further negotiate the cost of services with approved service providers for individual customer shipments. |
• | The Company has complete discretion to establish sales and contract pricing. Independently-owned stations within its freight forwarding business have the discretion to establish sales prices. |
• | The Company bears credit risk for all receivables. In the case of freight forwarding, the independently-owned stations reimburse the Company for a portion (typically 70-80%) of credit losses. The Company retains the risk that the independent station owners will not meet this obligation. |
For the Company’s subsidiaries XPO NLM and New Breed with respect to those transactions where New Breed is serving as the customer’s agent in arranging purchased transportation, revenue is recognized on a net basis in accordance with ASC Topic 605. The Company does not serve as the primary obligor. XPO NLM receives a fixed management fee for its services while New Breed receives a variable fee after deducting the cost of purchased transportation. Neither entity assumes credit risk in these transactions. In certain instances with XPO NLM, the Company also does not have discretion to select its service providers.
The Company’s freight forwarding operations collect certain taxes and duties on behalf of their customers as part of the services offered and arranged for international shipments. The Company’s accounting policy is to present these collections on a gross basis with the revenue recognized of $23.3 million, $3.7 million and $2.4 million for the years ended December 31, 2014, 2013 and 2012, respectively.
Cash and Cash Equivalents
The Company considers all highly liquid investments with an original maturity of three months or less as of the date of purchase to be cash equivalents unless the investments are legally or contractually restricted for more than three months.
Accounts Receivable and Allowance for Doubtful Accounts
Accounts receivable are recorded at the invoice amount or in the case of unbilled amounts at the expected invoice amount. The Company records its allowance for doubtful accounts based upon its assessment of various factors. The Company considers historical experience, the age of the accounts receivable balances, credit quality of the Company’s customers, any specific customer collection issues that have been identified, current economic conditions, and other factors that may affect customers’ ability to pay. The Company writes off accounts receivable balances that have aged significantly once all collection efforts have been exhausted and the receivables are no longer deemed collectible from the customer. The rollforward of the allowance for doubtful accounts is as follows (in millions):
Year Ended December 31, | |||||||||||
2014 | 2013 | 2012 | |||||||||
Beginning balance | $ | 3.5 | $ | 0.6 | $ | 0.4 | |||||
Provision, charged to expense | 6.9 | 2.6 | 0.9 | ||||||||
Write-offs, less recoveries, and other adjustments | (0.6 | ) | 0.3 | (0.7 | ) | ||||||
Ending balance | $ | 9.8 | $ | 3.5 | $ | 0.6 | |||||
Prepaid Expenses and Other Current Assets
Prepaid expenses and other current assets include prepaid rent, software maintenance costs, insurance premiums, other prepaid operating expenses, prepaid railcar leases, certain inventories at XPO Last Mile and New Breed, and other miscellaneous receivables. Prepaid expenses are amortized into expense over the respective contract term or other applicable time period.
Property and Equipment
Property and equipment are generally recorded at cost or in the case of acquired property and equipment at fair value at the date of acquisition. Maintenance and repair expenditures are charged to expense as incurred. When assets are sold, the
53
applicable costs and accumulated depreciation are removed from the accounts, and any gain or loss is included in income. For internally-developed software, the Company has adopted the provisions of ASC Topic 350, “Intangibles—Goodwill and Other.” Accordingly, certain costs incurred in the planning and evaluation stage of internally-developed computer software are expensed as incurred. Costs incurred during the application development stage are capitalized and included in property and equipment. Capitalized internally-developed software also includes the fair value of acquired internally-developed technology. The net book value of capitalized internally-developed software totaled $70.1 million and $31.7 million as of December 31, 2014 and 2013, respectively.
Depreciation is computed on a straight-line basis over the estimated useful lives of the assets as follows:
Classification | Estimated Useful Life |
Buildings and leasehold improvements | Term of lease to 39 years |
Vehicles | 5 years |
Rail cars, container and chassis | 15 to 30 years |
Machinery and equipment | 5 to 10 years |
Office and warehouse equipment | 5 to 10 years |
Computer software and equipment | 3 to 5 years |
For additional information refer to Note 7—Property and Equipment.
Goodwill and Intangible Assets with Indefinite Lives
Goodwill consists of the excess of cost over the fair value of net assets acquired in business combinations. During June 2014, the Company rebranded its Express-1 business to XPO Express. As a result of this action, the Company accelerated the amortization of $3.3 million in indefinite-lived intangible assets related to the Express-1 trade name based on the reduction in its remaining useful life. The full $3.3 million of accelerated amortization was recorded during the quarter ended June 30, 2014 and represented the full value of the Express-1 trade name intangible asset.
The Company follows the provisions of ASC Topic 350, “Intangibles—Goodwill and Other,” which requires an annual impairment test for goodwill. The Company may first choose to perform a qualitative evaluation of the likelihood of goodwill impairment. If the Company determines a quantitative evaluation is necessary, the goodwill at the reporting unit is subject to a two-step impairment test. The first step compares the book value of a reporting unit, including goodwill, with its fair value. If the book value of a reporting unit exceeds its fair value, the Company completes the second step in order to determine the amount of goodwill impairment loss that should be recorded. In the second step, the Company determines an implied fair value of the reporting unit’s goodwill by allocating the fair value of the reporting unit to all of the assets and liabilities other than goodwill. The amount of impairment is equal to the excess of the book value of goodwill over the implied fair value of that goodwill. The Company performs the annual impairment testing as of August 31 each year unless events or circumstances indicate impairment of the goodwill may have occurred before that time. For goodwill impairment testing as of August 31, 2014, the Company elected to bypass the qualitative evaluation. The Company determines fair values for each of the reporting units using an income approach. For purposes of the income approach, fair value is determined based on the present value of estimated future cash flows, discounted at an appropriate risk-adjusted rate. The Company uses its internal forecasts to estimate future cash flows and includes an estimate of long-term future growth rates based on its most recent views of the long-term outlook for the business. Actual results may differ from those assumed in the Company’s forecasts. The Company derives its discount rates using a capital asset pricing model and analyzing public company market data for its industry to estimate the weighted average cost of capital. The Company uses discount rates that are commensurate with the risks and uncertainty inherent in the respective businesses and in its internally developed forecasts. Discount rates used in the Company’s reporting unit valuations approximated 10.5%. For the periods presented, the Company did not recognize any goodwill impairment as the estimated fair value of its reporting units with goodwill exceeded the book value of these reporting units. For each of the Company’s reporting units, the excess of the fair value over the book value ranged from 20% to over 600%. For additional information refer to Note 9—Goodwill.
Intangible Assets with Definite Lives
The Company follows the provisions of ASC Topic 360, “Property, Plant and Equipment,” which establishes accounting standards for the impairment of long-lived assets such as property, plant and equipment and intangible assets subject to amortization. The Company reviews long-lived assets to be held-and-used for impairment whenever events or changes in circumstances indicate that the carrying amount of the assets may not be recoverable. If the sum of the undiscounted expected future cash flows over the remaining useful life of a long-lived asset group is less than its carrying amount, the asset is considered to be impaired. Impairment losses are measured as the amount by which the carrying amount of the asset group exceeds the fair value of the asset. The Company estimates fair value using the expected future cash flows discounted at a rate
54
commensurate with the risks associated with the recovery of the asset. For the periods presented, the Company did not recognize any impairment of the identified intangible assets.
The Company’s intangible assets subject to amortization consist of customer lists and relationships, carrier relationships, trade names, non-compete agreements, and other intangibles. Customer lists and relationships and trade names are amortized on an accelerated basis over the period of economic benefit based on the estimated cash flows attributable to the related intangible assets. Non-compete agreements, carrier relationships and other intangibles are amortized on a straight-line basis over the estimated useful lives of the related intangible asset. The range of estimated useful lives and the weighted-average useful lives of the respective intangible assets by type are as follows:
Classification | Estimated Useful Life | Weighted-Average Amortization Period |
Customer lists and relationships | 3 to 14 years | 10.29 years |
Carrier relationships | 2 years | 2.00 years |
Trade names | 1 to 5 years | 2.21 years |
Non-compete agreements | Term of agreement | 6.12 years |
Other intangible assets | 3 months to 5 years | 4.24 years |
For additional information refer to Note 8—Intangible Assets.
Restricted Cash
Restricted cash primarily consists of cash held to fund healthcare claims for employees in our Logistics business who are covered by the McNamara-O’Hara Service Contract Act (SCA), cash held as collateral for letters of credit in conjunction with the acquisition of New Breed, and cash held as security under XPO Last Mile’s captive insurance contracts.
Other Long-Term Assets
Other long-term assets consist primarily of debt issuance costs related to the Company’s 7.875% senior notes due 2019 (the “Senior Notes due 2019”), revolving credit facility and 4.5% convertible senior notes due October 1, 2017 (the “Convertible Notes”), favorable leasehold interests (recorded as part of purchase accounting), balances representing deposits related to facility lease arrangements, notes receivable from various XPO Global Logistics independent station owners, and incentive payments to independent station owners within the XPO Global Logistics network. The debt issuance costs related to the revolving credit facility are amortized on a straight-line basis over the respective term while the debt issuance costs related to the Senior Notes due 2019 and Convertible Notes are amortized using the effective interest method. The favorable leasehold interest assets are amortized through rent expense on a straight-line basis over the remaining lease term. The incentive payments are made by XPO Global Logistics to certain station owners as an incentive to establish an independently-owned station and are amortized over the life of each independent station contract and the unamortized portion generally is recoverable in the event of default under the terms of the agreements.
The following table outlines the Company’s other long-term assets as of December 31, 2014 and 2013 (in millions):
As of December 31, 2014 | As of December 31, 2013 | ||||||
Debt issuance costs | $ | 15.0 | $ | 1.6 | |||
Long-term deposits | 4.8 | 1.2 | |||||
Favorable leasehold interests | 2.9 | — | |||||
Other | 3.6 | 0.1 | |||||
Total Other Long-Term Assets | $ | 26.3 | $ | 2.9 | |||
55
Accrued Expenses, Other
Accrued expenses, other consist primarily of accrued purchased services; accrued litigation and insurance claims; accrued interest on the Company’s outstanding debt; accrued equipment costs, including maintenance; accrued transportation and facility charges; deferred revenue; and other accrued expenses, including accrued property and other taxes and other miscellaneous accrued expenses. The following table outlines the Company’s accrued expenses, other as of December 31, 2014 and 2013 (in millions):
As of December 31, 2014 | As of December 31, 2013 | ||||||
Accrued purchased services | $ | 18.9 | $ | 7.3 | |||
Accrued litigation reserves and insurance claims | 17.3 | 0.4 | |||||
Accrued interest | 15.1 | 1.5 | |||||
Accrued equipment costs | 7.4 | — | |||||
Accrued transportation and facility charges | 4.9 | — | |||||
Deferred revenue | 2.1 | — | |||||
Other accrued expenses | 4.1 | 0.3 | |||||
Total Accrued Expenses, Other | $ | 69.8 | $ | 9.5 | |||
Other Long Term Liabilities
Other long-term liabilities consist primarily of the holdback of a portion of the purchase price in connection with acquisitions; asset retirement obligations; reserves for uncertain tax positions; deferred rent liabilities; unfavorable leasehold interests (recorded as part of purchase accounting); an unfavorable customer contract (recorded as part of purchase accounting); certain liability insurance reserves; and other long-term liabilities. The unfavorable leasehold interest liabilities are amortized through rent expense on a straight-line basis over the remaining lease term. The unfavorable customer contract is amortized on an accelerated basis over the period of economic benefit based on the estimated cash flows attributable to the intangible asset. The following table outlines the Company’s other long term liabilities as of December 31, 2014 and 2013 (in millions):
As of December 31, 2014 | As of December 31, 2013 | ||||||
Acquisition-related holdbacks | $ | 21.1 | $ | 22.5 | |||
Asset retirement obligations | 7.5 | — | |||||
Uncertain tax positions | 6.7 | 0.9 | |||||
Long-term portion of deferred rent liability | 5.3 | 4.4 | |||||
Unfavorable leasehold interests | 5.2 | 0.2 | |||||
Long-term portion of vacant rent liability | 3.9 | 0.1 | |||||
Unfavorable customer contract | 3.8 | — | |||||
Long-term workers compensation insurance claims | 3.7 | — | |||||
Other long-term liabilities | 1.2 | — | |||||
Total Other Long-Term Liabilities | $ | 58.4 | $ | 28.1 | |||
56
Asset Retirement Obligations
As part of the purchase accounting related to its acquisition of Pacer International, Inc. (“Pacer”), the Company accrued an asset retirement obligation for retirement costs related to its leased railcars. For additional information on the acquisition of Pacer refer to Note 3—Acquisitions. The costs consist of removing all Company-related and other markings from the railcars, transporting the railcars to return locations designated within the leases, and storing the railcars during the return process. The asset retirement obligation is recorded at its net present value in other long-term liabilities as noted above and the fair value of the underlying asset is zero. Accretion expense is classified as interest expense in the consolidated statements of operations.
The reconciliation of changes in the asset retirement obligation during the year ended December 31, 2014 is summarized below (in millions):
Balance at December 31, 2013 | $ | — | ||
Asset retirement obligation recorded in purchase accounting | 7.1 | |||
Accretion expense | 0.4 | |||
Liabilities settled | — | |||
Revisions in estimated cash flows | — | |||
Balance at December 31, 2014 | $ | 7.5 | ||
Income Taxes
Taxes on income are provided for in accordance with ASC Topic 740, “Income Taxes.” Deferred income tax assets and liabilities are recognized for the expected future tax consequences of events that have been reflected in the consolidated financial statements. Deferred tax assets and liabilities are determined based on the differences between the book value and the tax basis of particular assets and liabilities, and the tax effects of net operating loss and capital loss carry forwards. Deferred tax assets and liabilities are measured using enacted tax rates expected to apply to taxable income in the years in which those temporary differences are expected to be recovered or settled. The effect on deferred tax assets and liabilities of a change in the tax rate is recognized as income or expense in the period that included the enactment date. A valuation allowance is provided to offset net deferred tax assets if, based upon the available evidence, it is more likely than not that some or all of the deferred tax assets will not be realized. Management periodically assesses the likelihood that the Company will utilize its existing deferred tax assets and records a valuation allowance for deferred tax assets when it is more likely than not that such deferred tax assets will not be realized.
Accounting for uncertainty in income taxes is determined based on ASC Topic 740, which clarifies the accounting for uncertainty in income taxes recognized in a company’s financial statements and provides guidance on the financial statement recognition and measurement of a tax position taken or expected to be taken in a tax return. ASC Topic 740 also provides guidance on derecognition, classification, interest and penalties, accounting in interim periods, disclosures and transition. For additional information refer to Note 12—Income Taxes.
Foreign Currency
Exchange gains or losses incurred on transactions conducted by business units in a currency other than the business units’ functional currency are normally reflected in sales, general and administrative expense in the consolidated statements of operations. Revenues and expenses of foreign subsidiaries whose functional currencies are other than the U.S. dollar are translated into U.S. dollars using average exchange rates for the period while assets and liabilities are translated into U.S. dollars using exchange rates as of the balance sheet date. The effects of foreign currency translation adjustments are recorded in stockholders’ equity.
Fair Value Measurements
FASB ASC Topic 820, “Fair Value Measurements and Disclosures”, defines fair value as the price that would be received to sell an asset or paid to transfer a liability in an orderly transaction between market participants at the measurement date and classifies the inputs used to measure fair value into the following hierarchy:
• | Level 1—Quoted prices for identical instruments in active markets; |
• | Level 2—Quoted prices for similar instruments in active markets; quoted prices for identical or similar instruments in markets that are not active; and model-derived valuations in which all significant inputs are observable in active markets; and |
• | Level 3—Valuations based on inputs that are unobservable, generally utilizing pricing models or other valuation techniques that reflect management’s judgment and estimates. |
At December 31, 2014 and 2013, the Company’s financial assets that were accounted for at fair value on a recurring basis included $330.8 million and $1.6 million of money market funds, respectively.
57
Estimated Fair Value of Financial Instruments
The aggregate net fair value estimates are based upon certain market assumptions and pertinent information available to management. The respective carrying value of certain financial instruments approximated their fair values as of the periods ended December 31, 2014 and 2013. These financial instruments include cash, accounts receivable, notes receivable, accounts payable, accrued expense, notes payable and current maturities of long-term debt. Fair values approximate carrying values for these financial instruments since they are short-term in nature, and they are receivable or payable on demand. The fair value of the freight forwarding notes receivable from the owners of the independently-owned stations approximated their respective carrying values based on the interest rates associated with these instruments.
As of December 31, 2014, the Company had outstanding $500 million of Senior Notes due 2019, which the Company is obligated to repay at face value unless they are redeemed prior to the maturity date. Holders of the Senior Notes due 2019 are due interest semiannually in arrears on March 1 and September 1 of each year commencing March 1, 2015 and maturing on September 1, 2019. Prior to September 1, 2016, the Company may redeem some or all of the Senior Notes due 2019 at a price equal to 100% of the principal amount of the notes plus the applicable “make-whole” premium. Additionally, the Company may redeem some or all of the Senior Notes due 2019 beginning on September 1, 2016. The initial redemption price is 103.938% of their principal amount, plus accrued interest. The redemption price will decline each year after 2016 and will be 100% of their principal amount, plus accrued interest, beginning on September 1, 2018. In addition, on or prior to September 1, 2016, the Company may redeem up to 40% of the aggregate principal amount of Senior Notes due 2019 with the proceeds of certain equity offerings at 107.875% of their principal amount plus accrued interest. The fair value of the Senior Notes due 2019 was $527.5 million as of December 31, 2014 based on market data. For additional information refer to Note 6—Debt.
As of December 31, 2014, the Company had outstanding $106.8 million of Convertible Notes, which the Company is obligated to repay at face value unless the holder agrees to a lesser amount or elects to convert all or a portion of such notes into the Company’s common stock. Holders of the Convertible Notes are due interest semiannually in arrears on April 1 and October 1 of each year. The conversion rate is 60.8467 shares of common stock per $1,000 principal amount of notes (equivalent to an initial conversion price of approximately $16.43 per share of common stock) and is subject to adjustment in some events but will not be adjusted for any accrued and unpaid interest. The fair value of the Convertible Notes was $271.3 million as of December 31, 2014 based on market data. For additional information refer to Note 6—Debt.
Stock-Based Compensation
The Company accounts for share-based compensation based on the equity instrument’s grant date fair value in accordance with ASC Topic 718, “Compensation—Stock Compensation”. The fair value of each share-based payment award is established on the date of grant. For grants of restricted stock units (“RSUs”) subject to service or performance-based vesting conditions only, the fair value is established based on the market price on the date of the grant. For grants of RSUs subject to market-based vesting conditions, the fair value is established using the Monte Carlo simulation lattice model. For grants of options, the Company uses the Black-Scholes option pricing model to estimate the fair value of share-based payment awards. The determination of the fair value of share-based awards is affected by the Company’s stock price and a number of assumptions, including expected volatility, expected life, risk-free interest rate and expected dividends.
The weighted-average fair value of each stock option recorded in expense for the years ended December 31, 2014, 2013 and 2012 was estimated on the date of grant using the Black-Scholes option pricing model and is amortized over the requisite service period of the option. The Company has used one grouping for the assumptions, as its option grants have similar characteristics. The expected term of options granted has been derived based upon the Company’s history of actual exercise behavior and represents the period of time that options granted are expected to be outstanding. Historical data was also used to estimate option exercises and employee terminations. Estimated volatility is based upon the Company’s historical market price at consistent points in a period equal to the expected life of the options. The risk-free interest rate is based on the U.S. Treasury yield curve in effect at the time of grant and the expected dividend yield is zero. For options with graded vesting, it is the Company’s policy to recognize compensation cost on a straight-line basis over the requisite service period for the entire award; however, the amount of compensation cost recognized at any date will at least equal the portion of the grant date value of the award that is vested at that date.
For the Company’s performance-based restricted stock units (“PRSUs”), the Company recognizes expense on a straight line basis over the awards’ requisite service period based on the number of awards expected to vest according to actual and expected financial results of the individual performance periods compared to set performance targets for those periods. If achievement of the performance targets for a PRSU award is not considered to be probable, then no expense will be recognized until achievement of such targets becomes probable. For additional information refer to Note 11—Stock-Based Compensation.
58
Earnings per Share
Earnings per common share are computed in accordance with ASC Topic 260, “Earnings per Share”, which requires companies to present basic earnings per share and diluted earnings per share. For additional information refer to Note 13—Earnings per Share.
3. Acquisitions
2014 Acquisitions
New Breed Logistics
On July 29, 2014, the Company entered into a definitive Agreement and Plan of Merger (the “New Breed Merger Agreement”) with New Breed, providing for the Company to acquire all of New Breed (the “New Breed Transaction”). New Breed is a provider of highly engineered contract logistics solutions for multi-national and medium-sized corporations and government agencies in the United States. The closing of the transaction was effective on September 2, 2014. At the closing, the Company paid $615.9 million in cash including a $1.1 million estimate of the working capital adjustment.
In conjunction with the New Breed Merger Agreement, the Company entered into a subscription agreement with Louis DeJoy, the Chief Executive Officer of New Breed. Pursuant to the subscription agreement, Mr. DeJoy purchased $30.0 million of unregistered XPO common stock at a per share purchase price in cash equal to (1) the closing price of XPO common stock on the New York Stock Exchange on July 29, 2014 with respect to 50% of such purchase and (2) the closing price of XPO common stock on the New York Stock Exchange on the trading day immediately preceding September 2, 2014 with respect to the remaining 50% of such purchase. Due to the interrelationship between the New Breed Merger Agreement and the subscription agreement, the Company considers the substance of the consideration paid to be a combination of net cash and equity as described below.
The fair value of the total consideration paid under the New Breed Merger Agreement was $615.9 million and consisted of $585.8 million of net cash paid at the time of closing, including an estimate of the working capital adjustment, and $30.1 million of equity representing the fair value of 1,060,598 shares of the Company’s common stock at the closing market price of $32.45 per share on September 2, 2014 less a marketability discount on the shares issued due to a holding period restriction. The net cash paid at the time of closing consisted of $615.8 million less the $30.0 million paid by Louis DeJoy to purchase XPO common stock per the subscription agreement.
The New Breed Transaction was accounted for as a purchase business combination in accordance with ASC 805 “Business Combinations.” Assets acquired and liabilities assumed were recorded in the accompanying consolidated balance sheet at their estimated fair values as of September 2, 2014, with the remaining unallocated purchase price recorded as goodwill. Goodwill represents the expected synergies and cost rationalization from the merger of operations as well as intangible assets that do not qualify for separate recognition such as an assembled workforce. The following table outlines the consideration transferred and purchase price allocation at the respective estimated fair values as of September 2, 2014 (in millions):
59
Consideration | $ | 615.9 | |
Cash and cash equivalents | 1.8 | ||
Accounts receivable | 112.1 | ||
Prepaid and other current assets | 11.8 | ||
Income tax receivable | 17.9 | ||
Restricted cash | 8.5 | ||
Property and equipment | 113.8 | ||
Trademarks/trade names | 4.5 | ||
Contractual customer relationships asset | 115.1 | ||
Contractual customer relationships liability | (5.6 | ) | |
Non-contractual customer relationships | 15.2 | ||
Other long-term assets | 7.3 | ||
Accounts payable | (17.7 | ) | |
Accrued expenses | (33.4 | ) | |
Deferred tax liabilities, non-current | (78.1 | ) | |
Other long-term liabilities | (9.6 | ) | |
Goodwill | $ | 352.3 | |
As of December 31, 2014, the purchase price allocation is considered final, except for the fair value of taxes and assumed liabilities. All goodwill recorded in the acquisition relates to the Logistics reportable segment. The goodwill as a result of the acquisition is not deductible for income tax purposes. The working capital adjustments in connection with this acquisition have been finalized, and there was no material change in the purchase price as a result.
Atlantic Central Logistics
On July 28, 2014, the Company entered into a Stock Purchase Agreement with Perry Barbaruolo, Thomas G. Bartley, Robert Humes II, Jeffrey E. Patterson, Brian Ruane, The Bryn Mawr Trust Company of Delaware, as Trustee of the Perry Barbaruolo 2014 Delaware Trust, Thomas Bartley, as Trustee of the Janice C. Day 2014 Trust, Thomas Bartley, as Trustee of the Jessica M. Clark 2014 Trust, Thomas Bartley, as Trustee of the Jacqueline M. Patterson 2014 Trust, Thomas Bartley, as Trustee of the Patterson 2014 Grandchildren’s Trust, The Bryn Mawr Trust Company of Delaware as Trustee of the Brian Ruane 2014 Delaware Trust, and The Bryn Mawr Trust Company of Delaware, as Trustee of the Richard Roberts 2014 Trust to acquire all of the outstanding capital stock of Simply Logistics Inc d/b/a Atlantic Central Logistics (“ACL”) for $36.2 million in cash consideration and deferred payments. ACL provides e-commerce fulfillment services by facilitating the time-sensitive, local movement of goods between distribution centers and the end-consumer.
The ACL acquisition was accounted for as a purchase business combination in accordance with ASC Topic 805 “Business Combinations.” Assets acquired and liabilities assumed were recorded in the accompanying consolidated balance sheet at their estimated fair values as of July 28, 2014 with the remaining unallocated purchase price recorded as goodwill. As a result of the acquisition, the Company recorded goodwill of $25.5 million and intangible assets of $11.7 million. All goodwill recorded related to the acquisition relates to the Transportation reportable segment. The goodwill as a result of the acquisition is not deductible for income tax purposes. As of December 31, 2014, the purchase price is considered final except for the fair value of accounts receivable, intangible assets, taxes and assumed liabilities. The working capital adjustments in connection with this acquisition have been finalized, and there was no material change in the purchase price as a result.
Pacer International
On January 5, 2014, the Company entered into a definitive Agreement and Plan of Merger (the “Pacer Merger Agreement”) with Pacer, providing for the acquisition of Pacer by the Company (the “Pacer Transaction”). Pacer is an asset-light North American freight transportation and logistics services provider. The closing of the transaction was effective on March 31, 2014 (the “Effective Time”).
At the Effective Time, each share of Pacer’s common stock, par value $0.01 per share, issued and outstanding immediately prior to the Effective Time was converted into the right to receive (i) $6.00 in cash and (ii) 0.1017 of a share of XPO common stock, which amount is equal to $3.00 divided by the average of the volume-weighted average closing prices of XPO common stock for the ten trading days prior to the Effective Time (the “Pacer Merger Consideration”). Pursuant to the terms of the Pacer Merger Agreement, all vested and unvested Pacer options outstanding at the Effective Time were settled in cash based on the value of the Pacer Merger Consideration. In addition, all Pacer restricted stock, and all vested and unvested
60
Pacer restricted stock units and performance units outstanding at the Effective Time were converted into the right to receive the Pacer Merger Consideration. The fair value of the total consideration paid under the Pacer Merger Agreement was $331.5 million and consisted of $223.3 million of cash paid at the time of closing and $108.2 million of equity representing the fair value of 3,688,246 shares of the Company’s common stock at the closing market price of $29.41 per share on March 31, 2014 less a marketability discount on a portion of shares issued to certain former Pacer executives due to a holding period restriction. The marketability discount did not have a material impact on the fair value of the equity consideration provided.
The Pacer Transaction was accounted for as a purchase business combination in accordance with ASC 805 “Business Combinations.” Assets acquired and liabilities assumed were recorded in the accompanying consolidated balance sheet at their fair values as of March 31, 2014, with the remaining unallocated purchase price recorded as goodwill. Goodwill represents the expected synergies and cost rationalization from the merger of operations as well as intangible assets that do not qualify for separate recognition such as an assembled workforce. The following table outlines the consideration transferred and purchase price allocation at the respective fair values as of March 31, 2014 (in millions):
Consideration | $ | 331.5 | |
Cash and cash equivalents | 22.3 | ||
Accounts receivable | 118.8 | ||
Prepaid and other current assets | 9.4 | ||
Deferred tax assets, current | 5.7 | ||
Property and equipment | 43.5 | ||
Trademarks/trade names | 2.8 | ||
Non-compete agreements | 2.3 | ||
Contractual customer relationships | 66.3 | ||
Non-contractual customer relationships | 1.0 | ||
Other long-term assets | 6.8 | ||
Accounts payable | (71.0 | ) | |
Accrued salaries and wages | (3.1 | ) | |
Accrued expenses, other | (33.5 | ) | |
Other current liabilities | (2.0 | ) | |
Deferred tax liabilities, non-current | (14.6 | ) | |
Other long-term liabilities | (11.6 | ) | |
Goodwill | $ | 188.4 | |
As of December 31, 2014, the purchase price allocation is considered final, except for the fair value of taxes and assumed liabilities. All goodwill recorded related to the acquisition relates to the Transportation reportable segment. The carryover of the tax basis in goodwill is deductible for income tax purposes while the step-up in goodwill as a result of the acquisition is not deductible for income tax purposes. Total tax deductible goodwill was $323.2 million on the acquisition date of March 31, 2014. The difference between book and tax goodwill represents the tax basis in goodwill from acquisitions made by Pacer prior to the acquisition by XPO.
2013 Acquisitions
NLM
On December 10, 2013, the Company entered into a Stock Purchase Agreement with Landstar Supply Chain Solutions, Inc. and Landstar System Holdings, Inc. (the “NLM Stock Purchase Agreement”) to acquire all of the outstanding capital stock of Landstar Supply Chain Solutions, Inc. known as National Logistics Management (“NLM”) (the “NLM Transaction”). NLM is the largest provider of web-based expedited transportation management in North America. The closing of the transaction occurred on December 28, 2013. The fair value of the total consideration paid under the NLM Stock Purchase Agreement was $87.0 million, paid in cash, excluding any working capital adjustments.
The NLM acquisition was accounted for as a purchase business combination in accordance with ASC Topic 805 “Business Combinations.” Assets acquired and liabilities assumed were recorded in the accompanying consolidated balance sheet at their fair values as of December 28, 2013 with the remaining unallocated purchase price recorded as goodwill. Goodwill represents the expected synergies and cost rationalization from the joining of operations as well as intangible assets
61
that do not qualify for separate recognition such as an assembled workforce. The following table outlines the consideration transferred and purchase price allocation at the respective fair values as of December 28, 2013 (in millions):
Consideration | $ | 87.0 | |
Cash and cash equivalents | 7.4 | ||
Accounts receivable | 36.0 | ||
Prepaid and other assets | 1.1 | ||
Property and equipment | 13.6 | ||
Trademarks/trade names | 0.4 | ||
Non-compete agreements | 0.5 | ||
Customer relationships | 25.2 | ||
Accounts payable | (43.5 | ) | |
Other current liabilities | (0.6 | ) | |
Goodwill | $ | 46.9 | |
All goodwill recorded related to the acquisition relates to the Transportation reportable segment and is fully deductible for income tax purposes based on the Internal Revenue Code Section 338(h)(10) election made with respect to the NLM Transaction. The working capital adjustments in connection with this acquisition have been finalized, and there was no material change in the purchase price as a result.
Optima Service Solutions
On November 13, 2013, the Company entered into a Membership Interest Purchase Agreement with A-1 Home Services, Inc., Mr. Steve Gordon and Mr. Glenn Lebowitz to acquire all of the outstanding equity interests of Optima Service Solutions, LLC (“Optima”) for $26.6 million in cash consideration and deferred payments, excluding any working capital adjustments. Optima is a non-asset, third-party logistics service provider focusing on arranging in-home complex installation and residential delivery services for major retailers.
The Optima acquisition was accounted for as a purchase business combination in accordance with ASC Topic 805 “Business Combinations.” Assets acquired and liabilities assumed were recorded in the accompanying consolidated balance sheet at their estimated fair values as of November 13, 2013 with the remaining unallocated purchase price recorded as goodwill. As a result of the acquisition, the Company recorded goodwill of $14.1 million and intangible assets of $11.3 million. All goodwill recorded related to the acquisition relates to the Transportation reportable segment and is fully deductible for income tax purposes. In addition, the Company recorded an acquired technology asset of $0.9 million as property and equipment in the consolidated balance sheet. The working capital adjustment in connection with this acquisition has been finalized, and there was no material change in the purchase price as a result.
3PD
On July 12, 2013, the Company entered into a Stock Purchase Agreement with 3PD Holding, Inc. (“3PD”), Logistics Holding Company Limited, Mr. Karl Meyer, Karl Frederick Meyer 2008 Irrevocable Trust II, Mr. Randall Meyer, Mr. Daron Pair and Mr. James J. Martell (the “3PD Stock Purchase Agreement”) to acquire all of the outstanding capital stock of 3PD (the “3PD Transaction”). 3PD is a non-asset, third-party provider of heavy goods, last-mile logistics in North America. The closing of the transaction occurred on August 15, 2013. The fair value of the total consideration paid under the 3PD Stock Purchase Agreement was $364.3 million and consisted of $333.2 million of net cash payable at the time of closing, $22.5 million of deferred payments, $7.4 million representing the fair value of 407,479 restricted shares of the Company’s common stock at the closing market price of $21.99 per share on August 15, 2013 less a marketability discount of $1.6 million on shares issued to the sellers due to a holding period restriction, and the final working capital adjustment of $1.2 million. The majority of the shares issued are restricted until September 2, 2016.
The 3PD Transaction was accounted for as a purchase business combination in accordance with ASC 805 “Business Combinations.” Assets acquired and liabilities assumed were recorded in the accompanying consolidated balance sheet at their fair values as of August 15, 2013, with the remaining unallocated purchase price recorded as goodwill. Goodwill represents the expected synergies and cost rationalization from the joining of operations as well as intangible assets that do not qualify for separate recognition such as an assembled workforce. The following table outlines the consideration transferred and purchase price allocation at the respective fair values as of August 15, 2013 (in millions):
62
Consideration | $ | 364.3 | |
Cash and cash equivalents | 1.0 | ||
Accounts receivable | 30.3 | ||
Prepaid and other current assets | 1.7 | ||
Deferred tax assets, current | 0.6 | ||
Property and equipment | 23.0 | ||
Trademarks/trade names | 5.9 | ||
Non-compete agreements | 1.6 | ||
Customer relationships | 110.6 | ||
Carrier relationships | 12.1 | ||
Other long-term assets | 0.4 | ||
Accounts payable | (13.0 | ) | |
Accrued salaries and wages | (1.7 | ) | |
Accrued expenses, other | (4.2 | ) | |
Other current liabilities | (5.5 | ) | |
Deferred tax liabilities, non-current | (29.8 | ) | |
Goodwill | $ | 231.3 | |
All goodwill recorded related to the acquisition relates to the Transportation reportable segment. The carryover of the tax basis in goodwill is deductible for income tax purposes while the step-up in goodwill as a result of the acquisition is not deductible for income tax purposes. Total tax deductible goodwill was $27.1 million on the acquisition date of August 15, 2013. The difference between book and tax goodwill represents the tax basis in goodwill from acquisitions made by 3PD prior to the acquisition by XPO.
Interide Logistics
On May 6, 2013, pursuant to an asset purchase agreement, the Company acquired substantially all of the assets of Interide Logistics, LC (“Interide”) for $3.1 million in cash consideration and 36,878 restricted shares of the Company’s common stock with a value of $0.6 million, excluding any working capital adjustments, with no assumption of debt. Interide is a non-asset, third-party transportation logistics service provider focusing on freight brokerage with offices in Salt Lake City, UT, Louisville, KY and St. Paul, MN.
The Interide acquisition was accounted for as a purchase business combination in accordance with ASC Topic 805 “Business Combinations.” Assets acquired and liabilities assumed were recorded in the accompanying consolidated balance sheet at their fair values as of May 6, 2013 with the remaining unallocated purchase price recorded as goodwill. As a result of the acquisition, the Company recorded goodwill of $3.4 million and intangible assets of $1.7 million. All goodwill recorded related to the acquisition relates to the Transportation reportable segment and is fully deductible for income tax purposes. The working capital adjustment in connection with this acquisition has been finalized, and there was no material change in the purchase price as a result.
Covered Logistics & Transportation
On February 26, 2013, pursuant to an asset purchase agreement, the Company acquired substantially all of the assets of Covered Logistics & Transportation LLC (“Covered”) for $8.0 million in cash consideration and 173,712 restricted shares of the Company’s common stock with a value of $3.0 million, excluding any working capital adjustments, with no assumption of debt. Covered is a non-asset, third-party transportation logistics service provider focusing on freight brokerage with offices in Lake Forest, IL and Dallas, TX.
The Covered acquisition was accounted for as a purchase business combination in accordance with ASC Topic 805 “Business Combinations.” Assets acquired and liabilities assumed were recorded in the accompanying consolidated balance sheet at their fair values as of February 26, 2013 with the remaining unallocated purchase price recorded as goodwill. As a result of the acquisition, the Company recorded goodwill of $7.4 million and intangible assets of $2.8 million. All goodwill recorded related to the acquisition relates to the Transportation reportable segment and is fully deductible for income tax purposes. The working capital adjustment in connection with this acquisition has been finalized, and there was no material change in the purchase price as a result.
63
East Coast Air Charter
On February 8, 2013, pursuant to an asset purchase agreement, the Company purchased substantially all of the operating assets of East Coast Air Charter, Inc. and 9-1-1 Air Charter LLC (together, “ECAC” or “East Coast Air Charter”) for total cash consideration of $9.3 million, excluding any working capital adjustments, with no assumption of debt. ECAC is a non-asset, third-party logistics service provider specializing in expedited air charter brokerage in Statesville, NC.
The ECAC acquisition was accounted for as a purchase business combination in accordance with ASC Topic 805 “Business Combinations.” Assets acquired and liabilities assumed were recorded in the accompanying consolidated balance sheet at their fair values as of February 8, 2013 with the remaining unallocated purchase price recorded as goodwill. As a result of the acquisition, the Company recorded goodwill of $3.8 million and intangible assets of $4.8 million. All goodwill recorded related to the acquisition relates to the Transportation reportable segment and is fully deductible for income tax purposes. The working capital adjustment in connection with this acquisition has been finalized, and there was no material change in the purchase price as a result.
Pro Forma Financial Information
The following unaudited pro forma consolidated results of operations for the twelve-month periods ended December 31, 2014 and 2013 present consolidated information of the Company as if the acquisitions of New Breed, Pacer and 3PD had occurred as of January 1, 2013 (in millions, except per share data):
Pro Forma Year Ended December 31, 2014 | Pro Forma Year Ended December 31, 2013 | ||||||
Revenue | $ | 2,979.9 | $ | 2,484.3 | |||
Operating loss | $ | (24.0 | ) | $ | (24.7 | ) | |
Net loss | $ | (129.1 | ) | $ | (67.1 | ) | |
Loss per common share | |||||||
Basic | $ | (2.26 | ) | $ | (1.29 | ) | |
Diluted | $ | (2.26 | ) | $ | (1.29 | ) | |
The unaudited pro forma consolidated results for the twelve-month periods were prepared using the acquisition method of accounting and are based on the historical financial information of New Breed, Pacer, 3PD and the Company. The unaudited pro forma consolidated results incorporate historical financial information for all significant acquisitions since January 1, 2013. Pro forma information for ECAC, Covered, Interide, Optima, NLM and ACL has not been included as the impacts were not considered material to the pro forma disclosure. The historical financial information has been adjusted to give effect to pro forma adjustments that are: (i) directly attributable to the acquisition, (ii) factually supportable and (iii) expected to have a continuing impact on the combined results. The unaudited pro forma consolidated results are not necessarily indicative of what the Company’s consolidated results of operations actually would have been had it completed these acquisitions on January 1, 2013.
4. Restructuring Charges
On March 31, 2014, the Company initiated a facility rationalization and severance program to close facilities and reduce employment in order to improve efficiency and profitability in conjunction with its acquisition of Pacer. The program includes facility exit activities and employment reduction initiatives.
The amount of restructuring charges incurred during the year ended December 31, 2014 and included in the consolidated statements of operations as sales, general and administrative expense is summarized below (in millions). These charges are not allocated to our reportable segments. No amount of the restructuring liability was included in the purchase price allocation for Pacer as all activities were initiated by XPO to benefit the post-combination period.
Contract termination | Severance | Total | |||||||||
Reserve balance at December 31, 2013 | $ | — | $ | — | $ | — | |||||
Charges incurred | 6.0 | 5.4 | 11.4 | ||||||||
Payments | (2.2 | ) | (4.1 | ) | (6.3 | ) | |||||
Reserve balance at December 31, 2014 | $ | 3.8 | $ | 1.3 | $ | 5.1 | |||||
64
5. Commitments and Contingencies
Purchase Commitments
As of December 31, 2014, the Company had approximately $8.3 million in future minimum payments required under non-cancellable service agreements for ongoing services, maintenance and support to information technology providers. Remaining future minimum payments related to these agreements amount to approximately $6.4 million, $1.7 million and $0.2 million for the years ending December 31, 2015, 2016 and 2017, respectively.
During the year ended December 31, 2014, $6.0 million of expense was recognized related to these agreements. No expense was recognized in the years ended December 31, 2013 and 2012 related to these agreements.
Lease Commitments
As of December 31, 2014, the Company had approximately $342.1 million in future minimum payments required under operating leases for various real estate, double-stack railcars, containers, chassis, tractors, data processing equipment, transportation and office equipment leases that have an initial or remaining non-cancelable lease term in excess of one year. Remaining future minimum payments related to these operating leases amount to approximately $123.7 million, $76.5 million, $53.1 million, $39.5 million, and $49.3 million for the periods ending December 31, 2015, 2016, 2017, 2018, and 2019 and thereafter, respectively.
Rent expense was approximately $82.3 million, $6.9 million and $1.9 million for the years ended December 31, 2014, 2013 and 2012, respectively.
Litigation
The Company is involved, and will continue to be involved, in numerous legal proceedings arising out of the conduct of its business. These proceedings may include, among other matters, claims for property damage or personal injury incurred in connection with the transportation of freight and employment-related claims, including claims involving asserted breaches of employee restrictive covenants and tortious interference with contract. These proceedings also include numerous purported class-action lawsuits, multi-plaintiff and individual lawsuits and state tax and other administrative proceedings that claim that the Company’s owner operators or contract carriers should be treated as employees, rather than independent contractors. These lawsuits and proceedings may seek substantial monetary damages (including claims for unpaid wages, overtime, failure to provide meal and rest periods, unreimbursed business expenses and other items), injunctive relief, or both.
The Company establishes accruals for specific legal proceedings when it is considered probable that a loss has been incurred and the amount of the loss can be reasonably estimated. Accruals for loss contingencies are reviewed quarterly and adjusted as additional information becomes available. In connection with certain acquisitions of privately-held businesses, the Company has retained purchase price holdbacks to provide security for a negotiated duration with respect to damages incurred in connection with pre-acquisition claims and litigation matters. If a loss is not both probable and reasonably estimable, or if an exposure to loss exists in excess of the amount accrued therefor or the applicable purchase price holdback, the Company assesses whether there is at least a reasonable possibility that a loss, or additional loss, may have been incurred. If there is a reasonable possibility that a loss, or additional loss, may have been incurred, the Company discloses the estimate of the possible loss or range of loss if it is material and an estimate can be made, or states that such an estimate cannot be made. The evaluation as to whether a loss is reasonably possible or probable is based on the Company’s assessment, in conjunction with legal counsel, regarding the ultimate outcome of the matter.
The Company believes that it has adequately accrued for, or has adequate purchase price holdbacks with respect to, the potential impact of loss contingencies that are probable and reasonably estimable, and, except as noted below under “Pacer Classification Claims,” there was no indication of a reasonable possibility that a material loss, or additional material loss (including in excess of any applicable purchase price holdback), may have been incurred. The Company does not believe that the ultimate resolution of any matters to which the Company is presently party will have a material adverse effect on its results of operations, financial condition or cash flows. However, the results of these matters cannot be predicted with certainty, and an unfavorable resolution of one or more of these matters could have a material adverse effect on the Company’s financial condition, results of operations or cash flows. Legal costs incurred related to these matters are expensed as incurred.
The Company carries liability and excess umbrella insurance policies that it deems sufficient to cover potential legal claims arising in the normal course of conducting its operations as a transportation company. In the event the Company is required to satisfy a legal claim in excess of the coverage provided by this insurance, the Company’s financial condition, results of operations or cash flows could be negatively impacted.
Pacer Classification Claims
The Company’s Pacer subsidiary, which was acquired on March 31, 2014, received notices from the California Labor Commissioner, Division of Labor Standards Enforcement (the “DLSE”), that a total of 153 owner operators contracted with certain Pacer subsidiaries have filed claims with the DLSE in which they assert that they should be classified as employees, as
65
opposed to independent contractors. These claims seek reimbursement for the owner operators’ business expenses, including fuel, tractor maintenance and tractor lease payments. A decision has been rendered by a DLSE hearing officer in seven of these claims, who awarded a total of $2.2 million to the seven claimants. Pacer has appealed these awards to California Superior Court, San Diego, where a de novo trial was held on the merits of those claims. On January 28, 2015, the court issued a tentative statement of decision in which it indicated its intent to find that the seven claimants were employees rather than independent contractors, and to award an aggregate of $2.0 million to the claimants. Under the court’s tentative statement of decision, either the claimants or the Company may file objections or comments by February 17, 2015, after which the court will render its final decision. The court’s final decision is subject to appeal, but the Company cannot provide assurance that the Company will determine to pursue an appeal or that an appeal will be successful. The remaining DLSE claims have been transferred to California Superior Court in three separate actions involving 175 claimants. These matters are in the initial procedural stages.
Pacer also is a party to a putative class action litigation brought by Edwin Molina in the U.S. District Court, Southern District of California. Molina asserts that he should be classified as an employee, as opposed to an independent contractor, and seeks damages for alleged violation of various California wage and hour laws. Molina seeks to have the litigation certified as a class action involving all owner-operators contracted with Pacer Cartage at any time from August 2009 to the present, which could involve as many as 600 claimants. Certain of these potential claimants also may have claims under the actions pending in California Superior Court as described above. This matter is in the initial stages of discovery and the court has not yet determined whether to certify the matter as a class action. The Company has reached a tentative agreement to settle this litigation with the claimant, subject to court approval and acceptance by a minimum percentage of members of the purported class. There can be no assurance that the settlement agreement will be finalized and executed, that the court will approve any such settlement agreement or that it will be accepted by the requisite members of the purported class.
During the fourth quarter of 2014, in connection with its Pacer acquisition accounting process, the Company established a reserve for the estimated probable loss with respect to certain of the cases described above, as required pursuant to applicable accounting standards. This amount was not material to the Company’s total liabilities or goodwill. The Company continues to evaluate these and other claims in light of the recent adverse decisions and other factors. The Company believes there is a reasonable possibility that a loss may be incurred in excess of the reserve amount; however, the Company cannot estimate the possible loss or range of such possible losses at this time. There can be no assurance that the amount of any actual loss the Company incurs in connection with these matters would not materially exceed any reserve that may be established.
Pacer Acquisition Litigation
Between January 8 and January 16, 2014, five substantially identical putative class actions were filed in the Tennessee Chancery Court against the Company, Pacer and Pacer’s directors challenging the Company’s acquisition of Pacer. By stipulation and order dated February 18, 2014, the Chancery Court for Davidson County consolidated these cases under the caption In re Pacer International, Inc. Shareholder Litigation, No. 14-39-IV. The operative complaint in the consolidated case alleges, among other things, that the directors of Pacer breached their fiduciary duties to Pacer’s shareholders in connection with the proposed acquisition of Pacer by XPO by agreeing to the proposed merger at an allegedly unfair price pursuant to a purportedly flawed and conflicted sales process, by including certain allegedly preclusive deal-protection measures, and by misrepresenting and/or omitting certain allegedly material information in the proxy statement relating to the transaction. The parties have reached a settlement agreement that required certain additional disclosures which were made pursuant to a Current Report on Form 8-K filed with the SEC on March 18, 2014, and the Company’s payment of the plaintiff attorneys’ fees of $0.6 million. The settlement agreement has received final court approval and has been fully performed.
6. Debt
Senior Notes due 2019
On August 25, 2014, the Company completed a private placement of $500.0 million aggregate principal amount of 7.875% Senior Notes due 2019. Total unamortized debt issuance costs related to the Senior Notes due 2019 classified in other long-term assets at December 31, 2014 are $9.8 million.
The Senior Notes due 2019 were offered only to qualified institutional buyers in reliance on Rule 144A under the Securities Act of 1933, as amended (the “Securities Act”) and, outside the United States, only to non-U.S. investors pursuant to Regulation S. The Senior Notes due 2019 were not registered under the Securities Act or any state securities laws and may not be offered or sold in the United States absent an effective registration statement or an applicable exemption from registration requirements or a transaction not subject to the registration requirements of the Securities Act or any state securities laws. The Senior Notes due 2019 bear interest at a rate of 7.875% per annum payable semiannually, in cash in arrears, on March 1 and September 1 of each year, commencing March 1, 2015 and maturing on September 1, 2019. The Senior Notes due 2019 are guaranteed by each of the Company’s direct and indirect wholly-owned restricted subsidiaries (other than certain excluded subsidiaries) that are obligors under, or guarantee obligations under, the Company’s existing credit agreement (or certain replacements thereof) or guarantee certain capital markets indebtedness of the Company or any guarantor of the Senior Notes due 2019. The Senior Notes due 2019 and the guarantees thereof are unsecured, unsubordinated indebtedness of the Company
66
and the guarantors. Among other things, the covenants of the Senior Notes due 2019 limit the Company’s ability to, with certain exceptions: incur indebtedness or issue disqualified stock; grant liens; pay dividends or make distributions in respect of capital stock; make certain investments or other restricted payments; prepay or repurchase subordinated debt; sell or transfer assets; engage in certain mergers, consolidations, acquisitions and dispositions; and enter into certain transactions with affiliates.
Prior to September 1, 2016, the Company may redeem some or all of the Senior Notes due 2019 at a price equal to 100% of the principal amount of the notes plus the applicable “make-whole” premium. The “make-whole” premium equals the greater of 1% of the then outstanding principal amount of the note and the excess of (a) the present value at such redemption date of (i) the redemption price of the note, at September 1, 2016, plus (ii) all required interest payments due on the note through September 1, 2016 (excluding accrued but unpaid interest), computed using a discount rate equal to the treasury rate as of such redemption date, plus 50 basis points; over (b) the then outstanding principal amount of the note. On and after September 1, 2016, the Company may redeem some or all of the notes for a redemption price that declines each year. The initial redemption price is 103.938% of their principal amount, plus accrued interest. The redemption price will decline each year after 2016 and will be 100% of their principal amount, plus accrued interest, beginning on September 1, 2018. In addition, on or prior to September 1, 2016, the Company may redeem up to 40% of the aggregate principal amount of notes with the proceeds of certain equity offerings at 107.875% of their principal amount plus accrued interest. The Company may make such redemption only if, after any such redemption, at least 60% of the aggregate principal amount of notes originally issued remains outstanding.
See Note 18—Subsequent Events for information concerning the Company’s most recent issuance of debt.
Debt Facilities
The Company may from time to time use debt financing for acquisitions and business start-ups, among other things. The Company also enters into long-term debt and capital leases with various third-parties from time to time to finance certain operational equipment and other assets used in its business operations. Generally, these loans and capital leases bear interest at market rates, and are collateralized with accounts receivable, equipment and certain other assets of the Company.
As of December 31, 2014, the Company and certain of its wholly-owned subsidiaries, as borrowers, were parties to a $415 million multicurrency secured Amended and Restated Revolving Loan Credit Agreement (the “Amended Credit Agreement”) with the lender parties thereto and Morgan Stanley Senior Funding, Inc., as administrative agent for such lenders, with a commitment termination date of October 17, 2018. The principal amount of the commitments under the Amended Credit Agreement may be increased by an aggregate amount of up to $100 million, subject to certain terms and conditions specified in the Amended Credit Agreement. The Amended Credit Agreement replaces and supersedes in its entirety the $125 million multicurrency secured Revolving Loan Credit Agreement that the Company entered into on October 18, 2013. At December 31, 2014, the Company had outstanding letters of credit of $14.1 million. Of the $14.1 million of letters of credit outstanding, $4.9 million were fully cash collateralized by the Company. The collateral is included in restricted cash on the consolidated balance sheet as of December 31, 2014. The Company’s availability under the Amended Credit Agreement is not impacted by the cash collateralized outstanding letters of credit. Total unamortized debt issuance costs related to the Amended Credit Agreement classified in other long-term assets at December 31, 2014 are $3.1 million.
On August 8, 2014, the Company amended its revolving loan facility to permit, among other things, the acquisition of New Breed and the related transactions and the offering of the Senior Notes due 2019.
The proceeds of the Amended Credit Agreement may be used by the Company and its subsidiaries for ongoing working capital needs and other general corporate purposes, including strategic acquisitions, and fees and expenses in connection with the transaction. At December 31, 2014, the Company had no amount drawn under the Amended Credit Agreement. Borrowings under the Amended Credit Agreement bear interest at a per annum rate equal to, at the Company’s option, the one, two, three or six month (or such other period less than one month or greater than six months as the lenders may agree) LIBOR rate plus a margin of 1.75% to 2.25%, or a base rate plus a margin of 0.75% to 1.25%. The Company is required to pay an undrawn commitment fee equal to 0.25% or 0.375% of the quarterly average undrawn portion of the commitments under the Amended Credit Agreement, as well as customary letter of credit fees. The margin added to LIBOR, or base rate, will depend on the quarterly average availability of the commitments under the Amended Credit Agreement.
All obligations under the Amended Credit Agreement are secured by substantially all of the Company’s assets and unconditionally guaranteed by certain of its subsidiaries, provided that no foreign subsidiary guarantees, and no assets of any foreign subsidiary secures, any obligations of any of the Company’s domestic borrower subsidiaries. Within the meaning of Regulation S-X, Rule 3-10, XPO Logistics, Inc. (the parent company) has no independent assets or operations, the guarantees of its subsidiaries are full and unconditional and joint and several, and any subsidiaries other than the guarantor subsidiaries are minor. The Amended Credit Agreement contains representations, warranties and covenants that are customary for agreements of this type. Among other things, the covenants in the Amended Credit Agreement limit the Company’s ability to, with certain exceptions: incur indebtedness; grant liens; engage in certain mergers, consolidations, acquisitions and dispositions; make certain investments and restricted payments; and enter into certain transactions with affiliates. In certain circumstances, the Amended Credit Agreement also requires the Company to maintain minimum EBITDA or, at the Company’s election, maintain
67
a Fixed Charge Coverage Ratio (as defined in the Amended Credit Agreement) of not less than 1.00 to 1.00. If an event of default under the Amended Credit Agreement shall occur and be continuing, the commitments thereunder may be terminated and the principal amount outstanding thereunder, together with all accrued unpaid interest and other amounts owed thereunder, may be declared immediately due and payable. Certain subsidiaries acquired by the Company in the future may be excluded from the restrictions contained in certain of the foregoing covenants.
Convertible Senior Notes
At December 31, 2014, the Company had outstanding $106.8 million aggregate principal amount of 4.50% Convertible Senior Notes due October 1, 2017 (the “Convertible Notes”). Total unamortized debt issuance costs classified in other long-term assets at December 31, 2014 are $2.1 million. Interest is payable on the Convertible Notes on April 1 and October 1 of each year.
During the twelve months ended December 31, 2014, the Company issued an aggregate of 1,640,908 shares of the Company’s common stock to certain holders of the Notes in connection with the conversion of $27.0 million aggregate principal amount of the Convertible Notes. The conversions were allocated to long-term debt and equity in the amounts of $22.1 million and $27.1 million, respectively. Certain of these transactions represented induced conversions pursuant to which the Company paid the holder a market-based premium in cash. The negotiated market-based premiums, in addition to the difference between the current fair value and the book value of the Convertible Notes, were reflected in interest expense. The number of shares of common stock issued in the foregoing transactions equals the number of shares of common stock presently issuable to holders of the Convertible Notes upon conversion under the original terms of the Convertible Notes.
Under certain circumstances at the election of the holder, the Convertible Notes may be converted until the close of business on the business day immediately preceding April 1, 2017, into cash, shares of the Company’s common stock, or a combination of cash and shares of common stock, at the Company’s election, at the initial conversion rate of approximately 60.8467 shares of common stock per $1,000 in principal amount, which is equivalent to an initial conversion price of approximately $16.43 per share. In addition, following certain corporate events that occur prior to the maturity date, the Company will increase the conversion rate for a holder who elects to convert its Convertible Notes in connection with such corporate event in certain circumstances. On or after April 1, 2017, until the close of business on the business day immediately preceding the maturity date, holders may convert their Convertible Notes at any time.
The Convertible Notes may be redeemed by the Company on or after October 1, 2015 if the last reported sale price of the Company’s common stock has been at least 130% of the conversion price then in effect for at least 20 trading days (whether or not consecutive), including the trading day immediately preceding the date on which the Company provides notice of redemption, during any 30 consecutive trading day period ending on, and including, the trading day immediately preceding the date on which the Company provides notice of redemption. The Convertible Notes are currently redeemable under this provision. The Company may redeem the Convertible Notes in whole but not in part, at a redemption price in cash equal to 100% of the principal amount to be redeemed, plus accrued and unpaid interest, but excluding, the redemption date, plus a make-whole premium payment. The “make whole premium” payment or delivery will be made, as the case may be, in cash, shares of the Company’s common stock or a combination of cash and shares of the Company’s common stock, at the Company’s election, equal to the present values of the remaining scheduled payments of interest on the Convertible Notes to be redeemed through October 1, 2017 (excluding interest accrued to, but excluding, the redemption date), computed using a discount rate equal to 4.50%. The make-whole premium is paid to holders whether or not they convert the Convertible Notes following the Company’s issuance of a redemption notice.
The Convertible Notes do not contain any financial or operating covenants or restrictions on the payment of dividends, the incurrence of indebtedness or the issuance or repurchase of securities by the Company or any of its subsidiaries. If the Company undergoes a fundamental change, holders may, subject to certain conditions, require the Company to repurchase for cash all or part of their Convertible Notes at a repurchase price equal to 100% of the principal amount of the Convertible Notes to be repurchased, plus accrued and unpaid interest to, but excluding, the fundamental change repurchase date.
68
The following table outlines the Company’s debt obligations as of December 31, 2014 and 2013 (in millions):
Interest rates | Term (months) | As of December 31, 2014 | As of December 31, 2013 | |||||||||
Senior notes due 2019 | 7.88 | % | 60 | $ | 500.0 | $ | — | |||||
Convertible senior notes | 4.50 | % | 60 | 106.8 | 133.7 | |||||||
Revolving credit facility | 4.38 | % | 60 | — | 75.0 | |||||||
Notes payable | N/A | N/A | 1.8 | 2.2 | ||||||||
Capital leases for equipment | 14.22 | % | 59 | 0.2 | 0.2 | |||||||
Total debt | 608.8 | 211.1 | ||||||||||
Less: unamortized discount on convertible senior notes | (14.9 | ) | (27.4 | ) | ||||||||
Less: current maturities of long-term debt | (1.8 | ) | (2.0 | ) | ||||||||
Total long-term debt, net of current maturities | $ | 592.1 | $ | 181.7 | ||||||||
7. Property and Equipment
The following table sets forth the Company’s property and equipment as of December 31, 2014 and 2013 (in millions):
As of December 31, 2014 | As of December 31, 2013 | ||||||
Property and Equipment, at cost | |||||||
Buildings and leasehold improvements | $ | 33.2 | $ | 9.1 | |||
Vehicles | 4.4 | 2.7 | |||||
Rail cars, containers and chassis | 13.0 | — | |||||
Machinery and equipment | 44.4 | — | |||||
Office and warehouse equipment | 32.9 | 7.1 | |||||
Computer software and equipment | 141.3 | 49.5 | |||||
269.2 | 68.4 | ||||||
Less: Accumulated depreciation | (47.3 | ) | (11.8 | ) | |||
Total Property and Equipment, net | $ | 221.9 | $ | 56.6 | |||
Depreciation of property and equipment was $35.8 million, $6.7 million and $1.4 million for the years ended December 31, 2014, 2013 and 2012, respectively.
8. Intangible Assets
The following table sets forth the Company’s identifiable intangible assets as of December 31, 2014 and 2013 (in millions):
December 31, 2014 | December 31, 2013 | ||||||
Indefinite lived intangibles: | |||||||
Trade name | $ | — | $ | 3.3 | |||
Definite lived intangibles: | |||||||
Customer lists and relationships | 376.6 | 168.7 | |||||
Carrier relationships | 12.1 | 12.1 | |||||
Trade name | 15.4 | 8.0 | |||||
Non-compete agreements | 9.8 | 6.3 | |||||
Other intangible assets | 2.2 | 2.2 | |||||
416.1 | 197.3 | ||||||
Less: Accumulated amortization | (74.6 | ) | (15.4 | ) | |||
Intangible assets, net | $ | 341.5 | $ | 181.9 | |||
Total Identifiable Intangibles | $ | 341.5 | $ | 185.2 | |||
Estimated future amortization expense for amortizable intangible assets for the next five years is as follows (in millions):
69
2015 | 2016 | 2017 | 2018 | 2019 | |||||||||||||||
Estimated future amortization expense | $ | 66.0 | $ | 52.2 | $ | 41.3 | $ | 38.8 | $ | 37.1 | |||||||||
Actual amounts of amortization expense may differ from estimated amounts due to changes in foreign currency exchange rates, additional intangible asset acquisitions, impairment of intangible assets, accelerated amortization of intangible assets and other events.
Intangible asset amortization expense recorded in sales, general and administrative expense was $62.5 million, $14.1 million and $1.3 million for the years ended December 31, 2014, 2013 and 2012, respectively.
9. Goodwill
The following table is a roll-forward of goodwill from December 31, 2012 to December 31, 2014. The 2013 additions are the result of the goodwill recognized as excess purchase price in the acquisitions of ECAC, Covered, Interide, 3PD, Optima and NLM while the 2014 additions are the result of the goodwill recognized as the excess purchase price in the acquisitions of Pacer, ACL and New Breed (in millions):
Transportation | Logistics | Total | |||||||||
Goodwill at December 31, 2012 | $ | 55.9 | $ | — | $ | 55.9 | |||||
Acquisitions | 307.5 | — | 307.5 | ||||||||
Goodwill at December 31, 2013 | 363.4 | — | 363.4 | ||||||||
Acquisitions | 213.9 | 352.3 | 566.2 | ||||||||
Other adjustments | (0.3 | ) | — | (0.3 | ) | ||||||
Goodwill at December 31, 2014 | $ | 577.0 | $ | 352.3 | $ | 929.3 | |||||
10. Stockholder’s Equity
On September 11, 2014, the Company entered into an Investment Agreement (the “Investment Agreement”) with Public Sector Pension Investment Board (“PSP Investments”), GIC Private Limited (“GIC”) (an affiliate of Singapore’s sovereign wealth fund), and Ontario Teachers’ Pension Plan Board (“OTPP”). Pursuant to the Investment Agreement, on September 17, 2014, the Company issued and sold 10,702,934 shares (the “Purchased Common Shares”) in the aggregate of Company common stock, par value $0.001 per share (the “Company Common Stock”), and 371,848 shares (the “Purchased Preferred Stock” and, together with the Purchased Common Shares, the “Purchased Securities”) in the aggregate of the Company’s Series B Convertible Perpetual Preferred Stock, par value $0.001 per share, in a private placement. The purchase price per Purchased Common Share was $30.66 (resulting in aggregate gross proceeds to the Company of approximately $328.0 million), and the purchase price per share of Purchased Preferred Stock was $1,000 (resulting in aggregate gross proceeds to the Company of approximately $372.0 million). The Company received net proceeds of $684.2 million after equity issuance costs which was initially allocated between common and preferred stock based on the relative fair values of each instrument. The Purchased Preferred Stock was mandatorily convertible into an aggregate of 12,128,115 additional shares of Company Common Stock subject to the approval of the Company’s stockholders. The Company held a special meeting of stockholders of the Company on December 23, 2014 in which the Company’s stockholders approved the issuance of shares of Company Common Stock upon the conversion of the Purchased Preferred Stock. Immediately following the special meeting, the Purchased Preferred Stock was automatically converted into 12,128,115 shares of Company Common Stock. No additional consideration was received by the Company in connection with the conversion of the Purchased Preferred Stock into Company Common Stock.
The issuance and sale of the Purchased Securities pursuant to the Investment Agreement and the conversion of the Purchased Preferred Stock are exempt from registration under the Securities Act, pursuant to Section 4(a)(2) of the Securities Act, or any state securities laws.
The Purchased Preferred Stock was issued with an initial conversion price of $30.66, which represented a 5% discount to the then-current trailing 20-day volume weighted average price. As of September 11, 2014, the Company’s common stock price was $34.05. As a result, the conversion feature was issued “in-the-money” and the Company allocated the intrinsic value of the conversion feature of $40.9 million to additional paid-in capital. The beneficial conversion feature was contingent upon receiving the approval of the Company’s stockholders and was therefore recognized in net loss available to common stockholders upon receiving stockholder approval.
On February 5, 2014, the Company closed a registered underwritten public offering of 15,000,000 shares of common stock, and on February 11, 2014, the Company closed as part of the same public offering the sale of an additional 2,250,000 shares as a result of the full exercise of the underwriters’ overallotment option, in each case at a price of $25.00 per share (together, the “February 2014 Offering”). The Company received $413.2 million in net proceeds from the February 2014 Offering after underwriting discounts and expenses.
70
On August 13, 2013, the Company closed a registered underwritten public offering of 9,694,027 shares of common stock, and on August 16, 2013, the Company closed as part of the same public offering the sale of an additional 1,454,104 shares as a result of the full exercise of the underwriters’ overallotment option, in each case at a price of $22.75 per share (together, the “August 2013 Offering”). The Company received $239.5 million in net proceeds from the August 2013 Offering after underwriting discounts and expenses.
On March 20, 2012, the Company closed a registered underwritten public offering of 9,200,000 shares of common stock (the “March 2012 Offering”), including 1,200,000 shares issued and sold as a result of the full exercise of the underwriters’ overallotment option, at a price of $15.75 per share. The Company received $137.0 million in net proceeds from the March 2012 Offering after underwriting discounts and expenses.
11. Stock-Based Compensation
On May 31, 2012, the stockholders of the Company approved the XPO Logistics, Inc. Amended and Restated 2011 Omnibus Incentive Compensation Plan (the “2011 Plan”). The 2011 Plan provides for grants or awards to directors, officers and key employees of stock options, stock appreciation rights, restricted stock, restricted stock units, deferred share units, performance compensation awards, performance units, cash incentive awards and other equity-based or equity-related awards (collectively, “Awards”) that the Compensation Committee of the Board of Directors (the “Committee”) determines are consistent with the purpose of the 2011 Plan and interests of the Company.
The maximum aggregate number of shares of common stock that may be delivered pursuant to Awards under the 2011 Plan is 4,000,000 million shares plus shares remaining available for awards under the prior plan as of May 31, 2012 and any shares with respect to awards granted under the predecessor plans that are forfeited after May 31, 2012. In the event of any extraordinary dividend or other extraordinary distribution, recapitalization, rights offering, stock split, reverse stock split, split-up or spin-off, the Committee shall equitably adjust any or all of the number of shares of the Company with respect to which Awards may be granted, including 2011 Plan share limits, the terms of any outstanding Award, the number of shares subject to outstanding Awards, and the exercise price of any Award, if applicable. Any shares delivered pursuant to an Award may consist, in whole or in part, of authorized and unissued shares or of treasury shares.
The 2011 Plan will continue in effect until May 31, 2022, unless terminated earlier by the Board of Directors. As of December 31, 2014, there were 1.0 million shares available for issuance under the 2011 Plan.
During the years ended December 31, 2014, 2013 and 2012, the Company recognized the following stock-based compensation expense in sales, general and administrative expense.
2014 | 2013 | 2012 | |||||||||
Stock-based compensation expense | $ | 7.5 | $ | 4.7 | $ | 4.4 | |||||
The Company did not realize any excess tax benefit for tax deductions from any of the stock-based compensation plans in 2014, 2013 and 2012.
Stock Options
During the years ended December 31, 2014, 2013 and 2012, the Company granted stock options to certain key employees, officers and directors of the Company. For employees and officers, the options typically vest over three to five years after the grant date, have a ten year life, and an exercise price equal to the Company’s stock price on the grant date while for directors, the options vest one year after the grant date, have a ten year life, and an exercise price equal to the Company’s stock price on the grant date. The fair value of all options granted in 2014, 2013 and 2012 was estimated using the Black-Scholes valuation model and the assumptions noted in the following table.
Black-Scholes option-pricing model assumptions: | ||||||||
2014 | 2013 | 2012 | ||||||
Weighted average risk-free interest rate | 1.9 | % | 1.6 | % | 1.0 | % | ||
Weighted average volatility | 50.5 | % | 51.0 | % | 51.7 | % | ||
Weighted average dividend yield | 0.0% | 0.0% | 0.0% | |||||
Weighted average expected option term (in years) | 6.44 | 6.44 | 6.47 | |||||
For stock options with an exercise price equal to the Company’s stock price on the date of grant, the expected term of options granted has been derived based upon the Company’s history of actual exercise behavior and represents the period of time that options granted are expected to be outstanding. The expected volatility is based upon the Company’s historical market
71
price at consistent points in a period equal to the expected life of the options. The risk-free interest rate is based on the U.S. Treasury yield curve with a term equal to the expected term of the option in effect at the time of grant.
A summary of stock option award activity for the years ended December 31, 2014, 2013 and 2012 is presented below:
Stock Options | ||||||||||||||
Weighted Average Exercise Price | Weighted Average Grant Date Fair Value | Weighted Average Remaining Term | ||||||||||||
Stock | Exercise | |||||||||||||
Options | Price Range | |||||||||||||
Outstanding at December 31, 2011 | 1,381,958 | $ | 8.53 | $2.28 - $18.07 | $ | 4.81 | 9.00 | |||||||
Granted | 296,000 | 15.10 | $11.46 - $18.07 | 7.45 | ||||||||||
Exercised | (185,139 | ) | 5.15 | $2.96 - $10.56 | 6.71 | |||||||||
Forfeited | (109,487 | ) | 12.63 | $3.48 - $16.92 | 6.20 | |||||||||
Outstanding at December 31, 2012 | 1,383,332 | $ | 10.06 | $2.28 - $18.07 | $ | 5.50 | 8.29 | |||||||
Granted | 111,000 | 20.18 | $16.57 - $23.19 | 10.13 | ||||||||||
Exercised | (57,464 | ) | 4.59 | $2.96 - $6.08 | 11.62 | |||||||||
Forfeited | (15,348 | ) | 14.25 | $6.08 - $16.57 | 6.99 | |||||||||
Outstanding at December 31, 2013 | 1,421,520 | $ | 11.02 | $2.28 - $23.19 | $ | 6.01 | 6.93 | |||||||
Granted | 50,000 | 27.48 | $23.31 - $31.28 | 14.37 | ||||||||||
Exercised | (74,531 | ) | 6.83 | $2.96 - $17.10 | 18.43 | |||||||||
Forfeited | (52,194 | ) | 15.21 | $10.53 - $31.28 | 7.50 | |||||||||
Outstanding at December 31, 2014 | 1,344,795 | $ | 11.70 | $2.68 - $27.87 | $ | 6.04 | 6.84 | |||||||
Options exercisable at December 31, 2014 | 839,145 | $ | 10.17 | $2.68 - $22.03 | $ | 5.42 | 6.39 | |||||||
As of December 31, 2014, the Company had 839,145 options vested and exercisable and $2.5 million of unrecognized compensation cost related to stock options. The intrinsic value of options vested and exercisable at December 31, 2014 was $25.8 million. The remaining estimated compensation expense related to the existing stock options for the periods ended December 31, 2015, 2016, 2017, 2018 and 2019 is as follows:
2015 | 2016 | 2017 | 2018 | 2019 | |||||||||||||||
Remaining estimated compensation expense related to existing stock options | $ | 1.2 | $ | 0.9 | $ | 0.2 | $ | 0.1 | $ | 0.1 | |||||||||
The total intrinsic value of options exercised during 2014, 2013 and 2012 was $1.7 million, $0.8 million and $0.6 million, respectively.
Restricted Stock Units and Performance-based Restricted Stock Units
During the years ended December 31, 2014, 2013 and 2012, the Company granted RSUs and PRSUs to certain key employees, officers and directors of the Company under the 2011 Plan with various vesting requirements as established by the Compensation Committee of the Board of Directors. The RSUs granted vest based on the passage of time. The vesting of certain RSU awards also is subject to the price of the Company’s common stock exceeding a specified per share price for a designated period of time and continued employment at the Company by the grantee as of the vesting date. The PRSUs granted will vest based on the achievement of certain targets with respect to the Company’s overall financial performance for specified periods. The vesting of certain PRSU awards also is subject to the price of the Company’s common stock exceeding a specified per share price for a designated period of time and generally require continued employment at the Company by the grantee as of the vesting date.
In connection with the New Breed Transaction, the Company granted certain members of the New Breed management team an aggregate of 367,705 PRSU awards under the 2011 Plan. Pursuant to the PRSU award agreements, grantees are eligible to earn up to 367,705 PRSUs in the aggregate which will vest based on the achievement of certain targets with respect to New Breed’s financial performance during 2015, 2016 and 2017. The vesting of all such PRSUs also is subject to the price of the Company’s common stock exceeding a specified per share price for a designated period of time and continued employment at the Company by the grantee as of the vesting date.
In connection with the Pacer Transaction, certain members of the Pacer senior management team signed employment agreements with the Company that became effective upon completion of the acquisition. As part of their employment agreements, the Company granted the Pacer management team members an aggregate of 122,569 time-based RSU awards
72
under the 2011 Plan. Certain of these awards vested 25% on the acquisition date of March 31, 2014 while the remaining 75% of the awards vest ratably on each of December 31, 2014, 2015 and 2016, subject to the employee’s continued employment with the Company through each such date. Other RSUs awarded to the Pacer senior management team provided for vesting of 33.4% of the award on March 31, 2015, 33.3% on March 31, 2016 and 33.3% on March 31, 2017, subject to the employee’s continued employment with the Company through each such date.
In connection with the 3PD Transaction, each member of the 3PD senior management team signed an employment agreement with the Company that became effective upon completion of the acquisition. Additionally, in order to incentivize 3PD’s management, the Company granted the 3PD management team time-based RSUs and performance-based PRSUs under the 2011 Plan. Pursuant to the award agreements, members of the 3PD management team are eligible to earn up to 600,000 RSUs and PRSUs in the aggregate, of which 150,000 RSUs will vest in equal tranches on each of December 31, 2014, 2015 and 2016 based on the passage of time and 450,000 PRSUs will vest based on the achievement of certain targets with respect to 3PD’s financial performance during 2016 and 2017 as part of the combined company. The vesting of all such RSUs and PRSUs also is subject to the price of the Company’s common stock exceeding a specified per share price for a designated period of time and continued employment at the Company by the grantee as of the vesting date.
The RSUs and PRSUs may vest in whole or in part before the applicable vesting date if the grantee’s employment is terminated by the Company without cause or by the grantee with good reason (as defined in the grant agreement), upon death or disability of the grantee or in the event of a change in control of the Company. Upon vesting, the RSUs and PRSUs result in the issuance of shares of XPO common stock after required minimum tax withholdings. The holders of the RSUs and PRSUs do not have the rights of a stockholder and do not have voting rights until certificates representing shares are issued and delivered in settlement of the awards.
For grants of RSUs and PRSUs subject to service or performance-based vesting conditions only, the fair value is established based on the market price of XPO common stock on the date of the grant. For grants of RSUs and PRSUs subject to market-based vesting conditions, the fair value is established using the Monte Carlo simulation lattice model. The actual number of PRSUs earned will be based on the Company’s overall financial performance or the respective business unit’s financial performance, as applicable, over the applicable performance periods. The fair value of RSUs is recognized as expense on a straight line basis over the awards’ requisite service period. The fair value of PRSUs is recognized as expense on a straight line basis over the awards’ requisite service period based on the number of awards expected to vest according to actual and expected financial results of the individual performance periods compared to set performance targets for those periods. If achievement of the performance targets for a PRSU award is not considered to be probable, then no expense will be recognized until achievement of such targets becomes probable.
The fair value of all grants of RSUs and PRSUs subject to market-based vesting conditions in 2014 and 2013 was estimated using the Monte Carlo simulation lattice model and the assumptions noted in the following table. No RSU grants in 2012 contained a market condition.
Monte Carlo model assumptions: | |||||
2014 | 2013 | ||||
Weighted average risk-free interest rate | 1.2 | % | 1.0 | % | |
Weighted average volatility | 44.3 | % | 50.0 | % | |
Weighted average dividend yield | — | — | |||
Weighted average term (in years) | 3.59 | 3.78 | |||
73
A summary of RSU and PRSU award activity for the years ended December 31, 2014, 2013 and 2012 is presented below:
Restricted Stock Units | Performance-based Restricted Stock Units | ||||||||||||
Weighted Average Grant Date Fair Value | Performance-based Restricted Stock Units | Weighted Average Grant Date Fair Value | |||||||||||
Restricted | |||||||||||||
Stock Units | |||||||||||||
Outstanding at December 31, 2011 | 695,000 | $ | 10.33 | — | $ | — | |||||||
Granted | 420,691 | 12.78 | — | — | |||||||||
Vested | (231,875 | ) | 11.04 | — | — | ||||||||
Forfeited | — | — | — | — | |||||||||
Outstanding at December 31, 2012 | 883,816 | $ | 11.31 | — | $ | — | |||||||
Granted | 305,714 | 14.38 | 450,000 | 15.15 | |||||||||
Vested | (219,875 | ) | 11.64 | — | — | ||||||||
Forfeited | (68,000 | ) | 10.65 | — | — | ||||||||
Outstanding at December 31, 2013 | 901,655 | $ | 13.26 | 450,000 | $ | 13.26 | |||||||
Granted | 175,773 | 29.81 | 1,114,951 | 23.19 | |||||||||
Vested | (295,600 | ) | 14.98 | — | — | ||||||||
Forfeited | (89,005 | ) | 14.94 | (1,000 | ) | 27.61 | |||||||
Outstanding at December 31, 2014 | 692,823 | $ | 15.23 | 1,563,951 | $ | 20.86 | |||||||
The stock-based compensation expense for outstanding RSUs was $5.8 million, $3.2 million and $3.3 million for the years ended December 31, 2014, 2013 and 2012, respectively. The total fair value of RSUs vested during 2014, 2013 and 2012 was $9.9 million, $5.1 million and $3.4 million, respectively. Of the 692,823 outstanding RSUs, 452,109 vest subject to service conditions and 240,714 vest subject to service and market conditions.
No PRSUs vested during and no stock-based compensation expense was recognized for outstanding PRSUs for the years ended December 31, 2014, 2013 or 2012, respectively. Of the 1,563,951 outstanding PRSUs, 1,455,370 vest subject to service and a combination of market and performance conditions and 108,581 vest subject to service and performance conditions.
As of December 31, 2014, the Company had approximately $9.0 million of unrecognized compensation cost related to non-vested RSU compensation that is anticipated to be recognized over a weighted-average period of approximately 1.92 years. Remaining estimated compensation expense related to outstanding RSUs for the years ending December 31, 2015, 2016, 2017, 2018 and 2019 is as follows:
2015 | 2016 | 2017 | 2018 | 2019 | |||||||||||||||
Remaining estimated compensation expense related to outstanding RSUs | $ | 5.2 | $ | 3.2 | $ | 0.4 | $ | 0.2 | $ | — | |||||||||
The remaining estimated compensation expense excludes the impact of PRSUs not deemed probable as of December 31, 2014. The unrecognized compensation cost related to PRSUs not deemed probable as of December 31, 2014 is $29.4 million.
12. Income Taxes
A summary of income (loss) before taxes related to U.S. and non U.S. operations are as follows (in millions):
Year Ended December 31, | |||||||||||
2014 | 2013 | 2012 | |||||||||
Operations | |||||||||||
U.S. domestic | $ | (87.2 | ) | $ | (69.2 | ) | $ | (29.4 | ) | ||
Foreign | (2.5 | ) | (1.8 | ) | (2.1 | ) | |||||
Total pre-tax loss | $ | (89.7 | ) | $ | (71.0 | ) | $ | (31.5 | ) | ||
74
The components of the income tax provision consist of the following (in millions):
Year Ended December 31, | |||||||||||
2014 | 2013 | 2012 | |||||||||
Current | |||||||||||
Federal | $ | — | $ | — | $ | (2.2 | ) | ||||
State | 3.4 | 0.3 | 0.1 | ||||||||
Foreign | 0.5 | (0.1 | ) | (0.8 | ) | ||||||
3.9 | 0.2 | (2.9 | ) | ||||||||
Deferred | |||||||||||
Federal | (27.8 | ) | (22.1 | ) | (7.5 | ) | |||||
State | (2.7 | ) | (0.6 | ) | (0.9 | ) | |||||
Foreign | 0.5 | — | 0.1 | ||||||||
(30.0 | ) | (22.7 | ) | (8.3 | ) | ||||||
Total income tax provision | $ | (26.1 | ) | $ | (22.5 | ) | $ | (11.2 | ) | ||
The provision for income taxes is different from that which would be obtained by applying the statutory federal income tax rate to income before income taxes. The items causing this difference are as follows:
Year Ended December 31, | ||||||||
2014 | 2013 | 2012 | ||||||
U.S. Federal statutory tax rate | 35.0 | % | 34.0 | % | 34.0 | % | ||
State and local taxes, net | 0.7 | % | 0.6 | % | 3.6 | % | ||
Transaction expense | (1.7 | )% | (1.1 | )% | (0.7 | )% | ||
Loss on convertible debt | (2.1 | )% | (1.1 | )% | — | % | ||
Change in valuation allowance | (1.4 | )% | (0.6 | )% | (1.6 | )% | ||
Change in uncertain tax position provision | 0.4 | % | 0.3 | % | 1.1 | % | ||
All other non-deductible items | (1.3 | )% | (0.2 | )% | (0.5 | )% | ||
Foreign tax rate differences | (0.5 | )% | (0.2 | )% | (0.3 | )% | ||
Net effective tax rate | 29.1 | % | 31.7 | % | 35.6 | % | ||
The Company’s 2014 consolidated effective tax rate was 29.1%, as compared to 31.7% in 2013 and 35.6% in 2012. The 2014 effective income tax rate varied from the statutory rate of 35% due primarily to state income taxes, the tax treatment of certain transaction related expenses, loss on convertible debt, and changes in the valuation allowance.
75
The tax effects of temporary differences that give rise to significant portions of the current deferred tax asset and non-current deferred tax liability at December 31, 2014 and 2013 are as follows (in millions):
Year Ended December 31, | |||||||
2014 | 2013 | ||||||
Deferred tax assets | |||||||
Net operating loss carryforward | $ | 74.3 | $ | 37.1 | |||
Accrued expenses | 13.2 | 3.7 | |||||
Other | 13.4 | 4.9 | |||||
Total deferred tax asset | 100.9 | 45.7 | |||||
Valuation allowance | (7.1 | ) | (2.6 | ) | |||
Total deferred tax asset, net | 93.8 | 43.1 | |||||
Deferred tax liabilities | |||||||
Intangible assets | (110.5 | ) | (39.6 | ) | |||
Property & equipment | (41.9 | ) | (6.3 | ) | |||
Other | (6.7 | ) | (9.3 | ) | |||
Total deferred tax liability | (159.1 | ) | (55.2 | ) | |||
Net deferred tax liability | $ | (65.3 | ) | $ | (12.1 | ) | |
At December 31, 2014 and 2013, the Company had federal net operating losses of $195.4 million and $104.9 million, respectively, expiring at various times between 2028 and 2034. At December 31, 2014 and 2013, the tax effect (before federal benefit) of the Company’s state net operating losses was $13.4 million and $4.8 million, respectively, expiring at various times between 2015 and 2034. Included in the federal and state net operating losses to be carried forward are $15.7 million of gross windfall tax benefits for stock compensation that has not been recognized as a deferred tax asset and will be recorded as an adjustment to additional paid-in-capital when recognized.
At December 31, 2014 and 2013, the Company had federal tax credit carryforwards of $1.8 million and $0.3 million expiring at various times starting in 2029 with certain credits having an unlimited carryforward period. At December 31, 2014, the Company had state tax credit carryforwards of $1.5 million expiring at various times between 2015 and 2027. At December 31, 2013, the Company had no state tax credit carryforwards.
At December 31, 2014 and 2013, the tax effect of the Company’s foreign net operating losses that are available to offset future taxable income were $2.4 million and $1.3 million, respectively. These foreign loss carryforwards will expire at various times between 2026 and 2034.
The Company believes it is more likely than not that future earnings and reversal of existing deferred tax liabilities will be sufficient to fully utilize the net operating loss deferred tax assets within the carryforward period. Although currently not anticipated, the Company’s ability to use its federal and state net operating loss carryforwards may become subject to restrictions attributable to equity transactions in the future resulting from changes in ownership as defined under Internal Revenue Code Section 382.
As a result of the acquisition of New Breed in 2014, the Company recognized tax benefits related to New Breed’s final pre-acquisition period net operating losses of $61.7 million and will file in early 2015 a U.S. Federal net operating loss carryback refund claim for $14.7 million. The Company anticipates receiving the refund in early 2015. This amount has been recorded as a current receivable.
In general, it is the practice and intention of the Company to reinvest the earnings of its non-U.S. subsidiaries in those operations. As of December 31, 2014, the Company has not made a provision for U.S. or additional foreign withholding taxes for financial reporting over the tax basis of investments in foreign subsidiaries that are essentially permanent in duration, if any exists. Generally, such amounts become subject to U.S. taxation upon the remittance of dividends and under certain other circumstances. It is not practicable to estimate the amount of deferred tax liability related to investments in these foreign subsidiaries.
During the year ended December 31, 2014, the Company reassessed its U.S. and foreign valuation allowance requirements. The Company evaluated all available evidence in its analysis, including reversal of the deferred tax liabilities, carrybacks available and historical and projected pre-tax profits generated by the Company’s U.S. operations. The Company also considered tax planning strategies that are prudent and can be reasonably implemented. The reversal of deferred tax liabilities prior to expiration of the deferred tax assets was the most significant factor in the Company’s determination of the valuation allowance under the “more likely than not” criteria. The Company’s valuation allowance as of December 31, 2014
76
was $4.8 million for domestic deferred tax assets and $2.3 million for foreign jurisdictions where it is not “more likely than not” that the deferred tax assets will be utilized. At December 31, 2013, the Company had a valuation allowance of $1.6 million on its domestic deferred tax assets and $1.0 million on its foreign deferred tax assets. The change in the Company’s valuation allowance of $4.5 million is a result of the assessment of deferred tax assets as established at the acquisition of Pacer and through the Company’s determination that certain state and foreign deferred tax assets do not meet the “more likely than not” criteria during the period.
A reconciliation of the beginning and ending amount of unrecognized tax benefits, excluding interest and penalties, is as follows (in millions):
Year Ended December 31, | |||||||
2014 | 2013 | ||||||
Uncertain tax positions, beginning of the year | $ | 0.8 | $ | 0.6 | |||
Additions for tax positions of prior years | — | 0.4 | |||||
Additions for tax positions from acquisitions | 5.8 | — | |||||
Reductions due to the statute of limitations | (0.4 | ) | (0.2 | ) | |||
Uncertain tax positions, end of the year | $ | 6.2 | $ | 0.8 | |||
The Company recognizes interest and penalties accrued related to uncertain tax positions in the provision for income taxes. For the years ended December 31, 2014 and 2013, $2.0 million and $0.8 million of the unrecognized tax benefits of $6.2 million and $0.8 million, respectively, if resolved favorably, would impact our effective tax rates. The release of the remaining $3.6 million of unrecognized tax benefits would not affect the tax rate upon favorable resolution as the liability would be settled through a holdback provision of an acquisition agreement.
The Company and its U.S. subsidiaries, file a consolidated Federal income tax return. The Company also files unitary or separate returns in various state and local jurisdictions based on state and local filing requirements. As a matter of course, various taxing authorities, including the IRS, regularly audit the Company. These audits may result in proposed assessments where the ultimate resolution may result in the Company owing additional taxes. Currently, the Company’s 2010 tax year is under examination by the IRS. While there are no other Federal, state or local examinations currently in progress, generally, the Federal returns after 2010 and state and local returns after 2007 are open under relevant statute of limitations and therefore subject to potential adjustment. All federal, state and local income tax returns for the Company are filed through 2013. The Company believes that its tax positions comply with applicable tax law and that it has adequately provided for these matters.
13. Earnings per Share
Basic earnings per common share are computed by dividing net income available to common stockholders by the weighted average number of shares of common stock outstanding during the period. Diluted earnings per common share are computed by dividing net income available to common stockholders by the combined weighted average number of shares of common stock outstanding and the potential dilution of stock options, warrants, RSUs, PRSUs, Convertible Notes and the Company’s Series A Convertible Perpetual Preferred Stock, par value $0.001 per share, outstanding during the period, if dilutive. The weighted average of potentially dilutive securities excluded from the computation of diluted earnings per share for the three years ended December 31, 2014 is shown per the table below.
Year Ended December 31, | ||||||||
2014 | 2013 | 2012 | ||||||
Basic common stock outstanding | 53,629,962 | 22,752,320 | 15,694,430 | |||||
Potentially Dilutive Securities: | ||||||||
Shares underlying the conversion of preferred stock to common stock | 10,483,052 | 10,607,309 | 10,695,326 | |||||
Shares underlying the conversion of the convertible senior notes | 7,342,864 | 8,623,331 | 2,238,758 | |||||
Shares underlying warrants to purchase common stock | 8,202,468 | 6,900,642 | 5,717,284 | |||||
Shares underlying stock options to purchase common stock | 555,977 | 356,815 | 473,421 | |||||
Shares underlying restricted stock units and performance-based restricted stock units | 797,026 | 367,183 | 249,139 | |||||
27,381,387 | 26,855,280 | 19,373,928 | ||||||
Diluted weighted shares outstanding | 81,011,349 | 49,607,600 | 35,068,358 | |||||
The impact of this dilution was not reflected in the earnings per share calculations in the consolidated statements of operations because the impact was anti-dilutive. The treasury method was used to determine the shares underlying warrants,
77
stock options, RSUs and PRSUs for potential dilution with an average market price of $31.30 per share, $19.69 per share and $15.01 per share for the years ended December 31, 2014, 2013 and 2012, respectively.
14. Related Party Transactions
During the year ended December 31, 2014, the Company leased office space from two entities partially owned and controlled by Louis DeJoy, the former Chief Executive Officer of New Breed, who became an employee upon the Company’s acquisition of New Breed. The non-cancellable lease agreements expire at various dates in 2019, subject to renewal options. The Company recorded payments associated with these lease agreements in the amount of $0.7 million for the year ended December 31, 2014. See Note 3—Acquisitions for further discussion on the common stock issued to Mr. DeJoy as part of the acquisition of New Breed.
On August 15, 2013, the Company completed its acquisition of 3PD, pursuant to the 3PD Stock Purchase Agreement to which Mr. James J. Martell was a party. Mr. Martell is a member of the board of directors of the Company and also was an investor in, and member of the board of directors of, 3PD. Mr. Martell recused himself from, and did not participate in, deliberations of the Company’s board of directors with respect to the acquisition of 3PD. Other than his interest in the purchase price paid pursuant to the 3PD Stock Purchase Agreement, Mr. Martell did not receive compensation in connection with the acquisition of 3PD. On July 12, 2013, Mr. Martell entered into a subscription agreement with the Company pursuant to which, on August 15, 2013, he invested $0.7 million of the after-tax proceeds he received in the transaction in restricted shares of the Company’s common stock.
15. Quarterly Financial Data (Unaudited)
The Company’s unaudited results of operations for each of the quarters in the years ended December 31, 2014, 2013 and 2012 are summarized below (in millions, except per share data):
XPO Logistics, Inc.
Quarterly Financial Data
(In millions)
March 31, 2014 | June 30, 2014 | September 30, 2014 | December 31, 2014 | ||||||||||||
Revenue | $ | 282.4 | $ | 581.0 | $ | 662.5 | $ | 830.7 | |||||||
Operating expenses | |||||||||||||||
Cost of purchased transportation and services | 224.0 | 459.1 | 487.4 | 531.3 | |||||||||||
Direct operating expense | 4.0 | 27.2 | 71.0 | 171.0 | |||||||||||
Sales, general and administrative expense | 75.8 | 106.6 | 117.7 | 122.4 | |||||||||||
Total operating expenses | 303.8 | 592.9 | 676.1 | 824.7 | |||||||||||
Operating (loss) income | (21.4 | ) | (11.9 | ) | (13.6 | ) | 6.0 | ||||||||
Other expense | 0.1 | 0.3 | 0.3 | 0.1 | |||||||||||
Interest expense | 10.1 | 3.4 | 17.8 | 16.7 | |||||||||||
Loss before income tax benefit | (31.6 | ) | (15.6 | ) | (31.7 | ) | (10.8 | ) | |||||||
Income tax benefit | (3.3 | ) | (1.8 | ) | (20.1 | ) | (0.9 | ) | |||||||
Net loss | (28.3 | ) | (13.8 | ) | (11.6 | ) | (9.9 | ) | |||||||
Preferred stock beneficial conversion charge | — | — | — | (40.9 | ) | ||||||||||
Cumulative preferred dividends | (0.8 | ) | (0.7 | ) | (0.7 | ) | (0.7 | ) | |||||||
Net loss available to common stockholders | $ | (29.1 | ) | $ | (14.5 | ) | $ | (12.3 | ) | $ | (51.5 | ) | |||
Basic loss per share | |||||||||||||||
Net loss | $ | (0.70 | ) | $ | (0.28 | ) | $ | (0.23 | ) | $ | (0.77 | ) | |||
Diluted loss per share | |||||||||||||||
Net loss | $ | (0.70 | ) | $ | (0.28 | ) | $ | (0.23 | ) | $ | (0.77 | ) | |||
78
March 31, 2013 | June 30, 2013 | September 30, 2013 | December 31, 2013 | ||||||||||||
Revenue | $ | 114.0 | $ | 137.1 | $ | 194.0 | $ | 257.2 | |||||||
Operating expenses | |||||||||||||||
Cost of purchased transportation and services | 97.7 | 117.8 | 159.1 | 204.1 | |||||||||||
Direct operating expense | — | — | 2.1 | 4.3 | |||||||||||
Sales, general and administrative expense | 27.6 | 33.4 | 51.2 | 57.3 | |||||||||||
Total operating expenses | 125.3 | 151.2 | 212.4 | 265.7 | |||||||||||
Operating loss | (11.3 | ) | (14.1 | ) | (18.4 | ) | (8.5 | ) | |||||||
Other expense | 0.1 | 0.2 | — | 0.2 | |||||||||||
Interest expense | 3.1 | 3.1 | 6.4 | 5.6 | |||||||||||
Loss before income tax provision | (14.5 | ) | (17.4 | ) | (24.8 | ) | (14.3 | ) | |||||||
Income tax benefit | 0.2 | 0.1 | (19.1 | ) | (3.7 | ) | |||||||||
Net loss | (14.7 | ) | (17.5 | ) | (5.7 | ) | (10.6 | ) | |||||||
Cumulative preferred dividends | (0.8 | ) | (0.8 | ) | (0.7 | ) | (0.7 | ) | |||||||
Net loss available to common stockholders | $ | (15.5 | ) | $ | (18.3 | ) | $ | (6.4 | ) | $ | (11.3 | ) | |||
Basic loss per share | |||||||||||||||
Net loss | $ | (0.85 | ) | $ | (1.00 | ) | $ | (0.28 | ) | $ | (0.37 | ) | |||
Diluted loss per share | |||||||||||||||
Net loss | $ | (0.85 | ) | $ | (1.00 | ) | $ | (0.28 | ) | $ | (0.37 | ) | |||
March 31, 2012 | June 30, 2012 | September 30, 2012 | December 31, 2012 | ||||||||||||
Revenue | $ | 44.6 | $ | 54.5 | $ | 71.0 | $ | 108.5 | |||||||
Operating expenses | |||||||||||||||
Cost of purchased transportation and services | 37.8 | 46.1 | 61.1 | 92.8 | |||||||||||
Direct operating expense | — | — | — | — | |||||||||||
Sales, general and administrative expense | 11.0 | 11.8 | 19.2 | 26.8 | |||||||||||
Total operating expenses | 48.8 | 57.9 | 80.3 | 119.6 | |||||||||||
Operating loss | (4.2 | ) | (3.4 | ) | (9.3 | ) | (11.1 | ) | |||||||
Other expense | — | — | 0.3 | — | |||||||||||
Interest expense | — | — | — | 3.2 | |||||||||||
Loss before income tax provision | (4.2 | ) | (3.4 | ) | (9.6 | ) | (14.3 | ) | |||||||
Income tax benefit | (1.5 | ) | 1.8 | (6.5 | ) | (5.0 | ) | ||||||||
Net loss | (2.7 | ) | (5.2 | ) | (3.1 | ) | (9.3 | ) | |||||||
Cumulative preferred dividends | (0.8 | ) | (0.8 | ) | (0.7 | ) | (0.7 | ) | |||||||
Net loss available to common stockholders | $ | (3.5 | ) | $ | (6.0 | ) | $ | (3.8 | ) | $ | (10.0 | ) | |||
Basic loss per share | |||||||||||||||
Net loss | $ | (0.36 | ) | $ | (0.34 | ) | $ | (0.22 | ) | $ | (0.57 | ) | |||
Diluted loss per share | |||||||||||||||
Net loss | $ | (0.36 | ) | $ | (0.34 | ) | $ | (0.22 | ) | $ | (0.57 | ) | |||
16. Segment Reporting and Geographic Information
The Company determines its operating segments based on the information utilized by the chief operating decision maker, the Company’s Chief Executive Officer, to allocate resources and assess performance. Based on this information, the Company has determined that it has two operating segments and two reportable segments. The Company’s operating segments are Transportation and Logistics. The differences in the Company’s operating and reportable segments from the Company’s last annual report are related to an internal management reorganization and its acquisitions during the year ended December 31, 2014. The Company’s previous Freight Brokerage, Expedited Transportation and Freight Forwarding reportable segments have
79
been consolidated into the Transportation operating and reportable segment while the Company’s acquisition of New Breed (previously the Contract Logistics reportable segment) represents the Logistics operating and reportable segment. See Note 1 of the Consolidated Financial Statements for further information and Note 17 for prior period quarterly segment data conformed to the new reportable segment structure. Prior period amounts have been adjusted retrospectively to reflect these reportable segment changes.
These reportable segments are strategic business units through which the Company offers different services. The Company evaluates the performance of the segments primarily based on their respective net operating margin and also evaluates revenues, net revenue margin and operating income. Accordingly, interest expense and other non-operating items are not reported in segment results. In addition, the Company has disclosed a corporate segment, which is not an operating segment and includes the costs of the Company’s executive and shared service teams, professional services such as legal and consulting, board of directors, and certain other corporate costs associated with operating as a public company. The Company allocates charges to the reportable segments for IT services, depreciation of IT fixed assets as well as centralized recruiting and training resources. Intercompany transactions have been eliminated in the consolidated balance sheets and results of operations. Intra-segment transactions have been eliminated in the reportable segment results of operations whereas inter-segment transactions represent a reconciling item to consolidated results as shown below.
The accounting policies of the reportable segments are the same as those described in the summary of significant accounting policies. The Company evaluates performance based on various financial measures of the respective business segments. The chief operating decision maker does not review assets by segment for purposes of allocating resources and therefore assets by segment are not disclosed. The following schedule identifies select financial data for each of the Company’s reportable segments for the years ended December 31, 2014, 2013 and 2012, respectively (in millions):
XPO Logistics, Inc.
Segment Data
(In millions)
Transportation | Logistics | Corporate | Eliminations | Total | |||||||||||||||
Year Ended December 31, 2014 | |||||||||||||||||||
Revenue | $ | 2,140.0 | $ | 216.6 | $ | — | $ | — | $ | 2,356.6 | |||||||||
Operating income (loss) | 18.9 | 17.6 | (77.4 | ) | — | (40.9 | ) | ||||||||||||
Depreciation and amortization | 79.5 | 16.3 | 2.5 | — | 98.3 | ||||||||||||||
Interest expense | 0.5 | — | 47.5 | — | 48.0 | ||||||||||||||
Tax provision (benefit) | 0.8 | — | (26.9 | ) | — | (26.1 | ) | ||||||||||||
Goodwill | 577.0 | 352.3 | — | — | 929.3 | ||||||||||||||
Capital expenditures | 13.4 | 24.0 | 7.2 | — | 44.6 | ||||||||||||||
Year Ended December 31, 2013 | |||||||||||||||||||
Revenue | $ | 702.3 | $ | — | $ | — | $ | — | $ | 702.3 | |||||||||
Operating loss | (7.2 | ) | — | (45.1 | ) | — | (52.3 | ) | |||||||||||
Depreciation and amortization | 19.7 | — | 1.1 | — | 20.8 | ||||||||||||||
Interest expense | — | — | 18.2 | — | 18.2 | ||||||||||||||
Tax benefit | (2.4 | ) | — | (20.1 | ) | — | (22.5 | ) | |||||||||||
Goodwill | 363.4 | — | — | — | 363.4 | ||||||||||||||
Capital expenditures | 5.3 | — | 6.3 | — | 11.6 | ||||||||||||||
Year Ended December 31, 2012 | |||||||||||||||||||
Revenue | $ | 278.6 | $ | — | $ | — | $ | — | $ | 278.6 | |||||||||
Operating income (loss) | 2.4 | — | (30.4 | ) | — | (28.0 | ) | ||||||||||||
Depreciation and amortization | 2.3 | — | 0.4 | — | 2.7 | ||||||||||||||
Interest expense | — | — | 3.2 | — | 3.2 | ||||||||||||||
Tax benefit | (0.6 | ) | — | (10.6 | ) | — | (11.2 | ) | |||||||||||
Goodwill | 55.9 | — | — | — | 55.9 | ||||||||||||||
Capital expenditures | 3.0 | — | 4.0 | — | 7.0 | ||||||||||||||
80
For segment reporting purposes by geographic region, revenues are attributed to the sales office location. The following table presents revenues generated by geographical area for the years ended December 31, 2014, 2013 and 2012, respectively (in millions):
Year Ended December 31, | |||||||||||
2014 | 2013 | 2012 | |||||||||
Revenue | |||||||||||
United States | $ | 2,141.4 | $ | 628.0 | $ | 247.9 | |||||
North America (excluding United States) | 132.0 | 74.3 | 30.7 | ||||||||
Asia | 66.3 | — | — | ||||||||
Other | 16.9 | — | — | ||||||||
Total | $ | 2,356.6 | $ | 702.3 | $ | 278.6 | |||||
All material assets are located in the United States of America.
81
17. Conformed Historical Quarterly Segment Data (Unaudited)
The Company’s conformed unaudited segment financial data for each of the quarters in the years ended December 31, 2014, 2013 and 2012 are summarized below (in millions):
XPO Logistics, Inc.
Conformed Historical Quarterly Segment Data
(In millions)
Transportation | Logistics | Corporate | Eliminations | Total | |||||||||||||||
Three Months Ended March 31, 2014 | |||||||||||||||||||
Revenue | $ | 282.4 | $ | — | $ | — | $ | — | $ | 282.4 | |||||||||
Operating income (loss) | 0.1 | — | (21.5 | ) | — | (21.4 | ) | ||||||||||||
Depreciation and amortization | 10.7 | — | 0.6 | — | 11.3 | ||||||||||||||
Interest expense | — | — | 10.1 | — | 10.1 | ||||||||||||||
Tax provision (benefit) | 0.6 | — | (3.9 | ) | — | (3.3 | ) | ||||||||||||
Goodwill | 539.1 | — | — | — | 539.1 | ||||||||||||||
Three Months Ended June 30, 2014 | |||||||||||||||||||
Revenue | $ | 581.0 | $ | — | $ | — | $ | — | $ | 581.0 | |||||||||
Operating income (loss) | 3.2 | — | (15.1 | ) | — | (11.9 | ) | ||||||||||||
Depreciation and amortization | 24.7 | — | 0.5 | — | 25.2 | ||||||||||||||
Interest expense | — | — | 3.4 | — | 3.4 | ||||||||||||||
Tax benefit | — | — | (1.8 | ) | — | (1.8 | ) | ||||||||||||
Goodwill | 540.7 | — | — | — | 540.7 | ||||||||||||||
Three Months Ended September 30, 2014 | |||||||||||||||||||
Revenue | $ | 612.4 | $ | 50.1 | $ | — | $ | — | $ | 662.5 | |||||||||
Operating income (loss) | 4.9 | 4.6 | (23.1 | ) | — | (13.6 | ) | ||||||||||||
Depreciation and amortization | 23.2 | 3.4 | 0.6 | — | 27.2 | ||||||||||||||
Interest expense | 0.3 | — | 17.5 | — | 17.8 | ||||||||||||||
Tax benefit | 0.1 | — | (20.2 | ) | — | (20.1 | ) | ||||||||||||
Goodwill | 566.3 | 352.2 | — | — | 918.5 | ||||||||||||||
Three Months Ended December 31, 2014 | |||||||||||||||||||
Revenue | $ | 664.2 | $ | 166.5 | $ | — | $ | — | $ | 830.7 | |||||||||
Operating income (loss) | 10.7 | 13.0 | (17.7 | ) | — | 6.0 | |||||||||||||
Depreciation and amortization | 20.9 | 12.9 | 0.8 | — | 34.6 | ||||||||||||||
Interest expense | 0.2 | — | 16.5 | — | 16.7 | ||||||||||||||
Tax benefit | 0.1 | — | (1.0 | ) | — | (0.9 | ) | ||||||||||||
Goodwill | 577.0 | 352.3 | — | — | 929.3 | ||||||||||||||
82
Transportation | Logistics | Corporate | Eliminations | Total | |||||||||||||||
Three Months Ended March 31, 2013 | |||||||||||||||||||
Revenue | $ | 114.0 | $ | — | $ | — | $ | — | $ | 114.0 | |||||||||
Operating loss | (2.7 | ) | — | (8.6 | ) | — | (11.3 | ) | |||||||||||
Depreciation and amortization | 1.3 | — | 0.2 | — | 1.5 | ||||||||||||||
Interest expense | — | — | 3.1 | — | 3.1 | ||||||||||||||
Tax provision (benefit) | — | — | 0.2 | — | 0.2 | ||||||||||||||
Goodwill | 66.9 | — | — | — | 66.9 | ||||||||||||||
Three Months Ended June 30, 2013 | |||||||||||||||||||
Revenue | $ | 137.1 | $ | — | $ | — | $ | — | $ | 137.1 | |||||||||
Operating loss | (3.3 | ) | — | (10.8 | ) | — | (14.1 | ) | |||||||||||
Depreciation and amortization | 1.6 | — | 0.2 | — | 1.8 | ||||||||||||||
Interest expense | — | — | 3.1 | — | 3.1 | ||||||||||||||
Tax benefit | — | — | 0.1 | — | 0.1 | ||||||||||||||
Goodwill | 69.9 | — | — | — | 69.9 | ||||||||||||||
Three Months Ended September 30, 2013 | |||||||||||||||||||
Revenue | $ | 194.0 | $ | — | $ | — | $ | — | $ | 194.0 | |||||||||
Operating loss | (4.3 | ) | — | (14.1 | ) | — | (18.4 | ) | |||||||||||
Depreciation and amortization | 8.1 | — | 0.3 | — | 8.4 | ||||||||||||||
Interest expense | — | — | 6.4 | — | 6.4 | ||||||||||||||
Tax benefit | 0.3 | — | (19.4 | ) | — | (19.1 | ) | ||||||||||||
Goodwill | 302.8 | — | — | — | 302.8 | ||||||||||||||
Three Months Ended December 31, 2013 | |||||||||||||||||||
Revenue | $ | 257.2 | $ | — | $ | — | $ | — | $ | 257.2 | |||||||||
Operating income (loss) | 3.1 | — | (11.6 | ) | — | (8.5 | ) | ||||||||||||
Depreciation and amortization | 8.7 | — | 0.4 | — | 9.1 | ||||||||||||||
Interest expense | — | — | 5.6 | — | 5.6 | ||||||||||||||
Tax benefit | (2.7 | ) | — | (1.0 | ) | — | (3.7 | ) | |||||||||||
Goodwill | 363.4 | — | — | — | 363.4 | ||||||||||||||
83
Transportation | Logistics | Corporate | Eliminations | Total | |||||||||||||||
Three Months Ended March 31, 2012 | |||||||||||||||||||
Revenue | $ | 44.6 | $ | — | $ | — | $ | — | $ | 44.6 | |||||||||
Operating income (loss) | 1.9 | — | (6.1 | ) | — | (4.2 | ) | ||||||||||||
Depreciation and amortization | 0.2 | — | — | — | 0.2 | ||||||||||||||
Interest expense | — | — | — | — | — | ||||||||||||||
Tax provision (benefit) | — | — | (1.5 | ) | — | (1.5 | ) | ||||||||||||
Goodwill | 17.0 | — | — | — | 17.0 | ||||||||||||||
Three Months Ended June 30, 2012 | |||||||||||||||||||
Revenue | $ | 54.5 | $ | — | $ | — | $ | — | $ | 54.5 | |||||||||
Operating income (loss) | 2.0 | — | (5.4 | ) | — | (3.4 | ) | ||||||||||||
Depreciation and amortization | 0.4 | — | 0.1 | — | 0.5 | ||||||||||||||
Interest expense | — | — | — | — | — | ||||||||||||||
Tax benefit | — | — | 1.8 | — | 1.8 | ||||||||||||||
Goodwill | 19.1 | — | — | — | 19.1 | ||||||||||||||
Three Months Ended September 30, 2012 | |||||||||||||||||||
Revenue | $ | 71.0 | $ | — | $ | — | $ | — | $ | 71.0 | |||||||||
Operating loss | (0.6 | ) | — | (8.7 | ) | — | (9.3 | ) | |||||||||||
Depreciation and amortization | 0.6 | — | 0.1 | — | 0.7 | ||||||||||||||
Interest expense | — | — | — | — | — | ||||||||||||||
Tax benefit | (0.4 | ) | — | (6.1 | ) | — | (6.5 | ) | |||||||||||
Goodwill | 22.5 | — | — | — | 22.5 | ||||||||||||||
Three Months Ended December 31, 2012 | |||||||||||||||||||
Revenue | $ | 108.5 | $ | — | $ | — | $ | — | $ | 108.5 | |||||||||
Operating loss | (0.9 | ) | — | (10.2 | ) | — | (11.1 | ) | |||||||||||
Depreciation and amortization | 1.1 | — | 0.2 | — | 1.3 | ||||||||||||||
Interest expense | — | — | 3.2 | — | 3.2 | ||||||||||||||
Tax benefit | (0.2 | ) | — | (4.8 | ) | — | (5.0 | ) | |||||||||||
Goodwill | 55.9 | — | — | — | 55.9 | ||||||||||||||
18. Subsequent Events
Preferred Stock Dividend
On December 11, 2014, the Company’s board of directors approved the declaration of a dividend payable to holders of the Series A convertible perpetual preferred stock. The declared dividend equaled $10 per share of preferred stock as specified in the Certificate of Designation of the preferred stock. The total declared dividend equaled $0.7 million and was paid on January 15, 2015.
Convertible Debt Conversion
On January 13, 2015 and February 17, 2015, the Company entered into three privately negotiated agreements pursuant to which the Company agreed to issue a total of 1,859,231 shares of common stock to holders of the Company’s Convertible Notes in connection with the conversion of $30.6 million aggregate principal amount of the Convertible Notes. Two such transactions closed on January 16, 2015 and the third closed on February 20, 2015. These transactions included induced conversions pursuant to which the Company paid the holders a market-based premium in cash. The negotiated market-based premium, in addition to the difference between the current fair value and the book value of the Convertible Notes, will be reflected in interest expense in the first quarter of 2015. The number of shares of common stock issued in the foregoing transactions equals the number of shares of common stock presently issuable to holders of the Convertible Notes upon conversion under the original terms of the Convertible Notes.
Issuance of Additional Senior Notes due 2019
On February 13, 2015, the Company completed an additional private placement of $400 million aggregate principal amount of senior notes due 2019 (the “Additional Senior Notes”). The Additional Senior Notes were offered to qualified
84
institutional buyers in reliance on Rule 144A under the Securities Act. The sales of the Additional Senior Notes was not registered under the Securities Act. Unless so registered, the Additional Senior Notes may not be offered or sold in the United States except pursuant to an exemption from, or in a transaction not subject to, the registration requirements of the Securities Act and applicable state securities laws. The terms of the Additional Senior Notes are identical to the original issuance of Senior Notes due 2019.
Acquisition of UX Specialized Logistics
On February 9, 2015, the Company acquired substantially all of the assets of UX Specialized Logistics (“UX”), a North American provider of last mile logistics services for major retail chains and e-commerce companies. The purchase price for the UX transaction was $59.0 million in cash consideration, excluding any working capital adjustments, with no assumption of debt.
85
EXHIBIT INDEX
Exhibit Number | Description | |
2.1 * | Investment Agreement, dated as of June 13, 2011, by and among Jacobs Private Equity, LLC (“JPE”), each of the other investors party thereto and the registrant (incorporated herein by reference to Exhibit 2.1 to the registrant’s Current Report on Form 8-K dated June 14, 2011). | |
2.2 * | Stock Purchase Agreement, dated July 12, 2013, by and among 3PD Holding, Inc., Logistics Holding Company Limited, Mr. Karl Meyer, Karl Frederick Meyer 2008 Irrevocable Trust II, Mr. Randall Meyer, Mr. Daron Pair, Mr. James J. Martell and XPO Logistics, Inc. (incorporated herein by reference to Exhibit 2.1 to the registrant’s Current Report on Form 8-K dated July 12, 2013). | |
2.3 * | Amendment No. 1 dated August 14, 2013 to Stock Purchase Agreement dated July 12, 2013 by and among the Company, 3PD, Logistics Holding Company Limited, Mr. Karl Meyer, Karl Frederick Meyer 2008 Irrevocable Trust II, Mr. Randall Meyer, Mr. Daron Pair and Mr. James J. Martell (incorporated herein by reference to Exhibit 2.1 to the registrant’s Current Report on Form 8-K dated August 15, 2013). | |
2.4 * | Agreement and Plan of Merger, dated as of January 5, 2014, by and among Pacer International, Inc., XPO Logistics, Inc. and Acquisition Sub, Inc. (incorporated by reference to Exhibit 2.1 to XPO’s Current Report on Form 8-K filed with the SEC on January 6, 2014). | |
2.5 * | Agreement and Plan of Merger, dated as of July 29, 2014, by and among New Breed Holding Company, XPO Logistics, Inc., Nexus Merger Sub, Inc. and NB Representative, LLC, in its capacity as the Representative (incorporated by reference to Exhibit 2.1 to XPO’s Current Report on Form 8-K filed with the SEC on July 30, 2014). | |
2.6 * | Share Purchase Agreement dated August 3, 2012 among XPO Logistics Canada Inc., 1272387 Ontario Inc. and 1272393 Ontario Inc., and Keith Matthews and Geoff Bennett (incorporated herein by reference to Exhibit 2.1 to the registrant’s Quarterly Report on Form 10-Q for the quarter ended September 30, 2012). | |
2.7 * | Asset Purchase Agreement dated August 3, 2012 among XPO Logistics, LLC, Kelron Distribution Systems (Cleveland) LLC, and Keith Matthews and Geoff Bennett (incorporated herein by reference to Exhibit 2.2 to the registrant’s Quarterly Report on Form 10-Q for the quarter ended September 30, 2012). | |
2.8 * | Asset Purchase Agreement, dated October 24, 2012, by and among XPO Logistics, Inc., XPO Logistics, LLC, Turbo Logistics, Inc., Turbo Dedicated, Inc., Ozburn-Hessey Logistics, LLC, and OHH Acquisition Corporation (incorporated herein by reference to Exhibit 2.1 to the registrant’s Current Report on Form 8-K dated October 24, 2012). | |
3.1 * | Amended and Restated Certificate of Incorporation of the registrant, dated May 17, 2005 (incorporated herein by reference to Exhibit 3.1 to the registrant’s Annual Report on Form 10-K for the fiscal year ended December 31, 2007). | |
3.2 * | Certificate of Amendment to the Amended and Restated Certificate of Incorporation of the registrant, dated May 31, 2006 (incorporated herein by reference to Exhibit 3 to the registrant’s Current Report on Form 8-K dated June 7, 2006). | |
3.3 * | Certificate of Amendment to the Amended and Restated Certificate of Incorporation of the registrant, dated June 20, 2007 (incorporated herein by reference to Exhibit 3.1 to the registrant’s Quarterly Report on Form 10-Q for the quarter ended June 30, 2007 (the “June 2007 Form 10-Q”)). | |
3.4 * | Certificate of Amendment to the Amended and Restated Certificate of Incorporation of the registrant, dated September 1, 2011 (incorporated herein by reference to Exhibit 3.1 to the registrant’s Current Report on Form 8-K dated September 6, 2011 (the “September 2011 Form 8-K”)). | |
3.5 * | 2nd Amended and Restated Bylaws of the registrant, dated August 30, 2007 (incorporated herein by reference to Exhibit 3.2 to the registrant’s Current Report on Form 8-K/A dated September 14, 2007). | |
4.1 * | Certificate of Designation of Series A Convertible Perpetual Preferred Stock of the registrant (incorporated herein by reference to Exhibit 4.1 of the September 2011 Form 8-K). | |
4.2 * | Form of Warrant Certificate (incorporated herein by reference to Exhibit 4.2 of the September 2011 Form 8-K). | |
4.3 * | Registration Rights Agreement, dated as of September 2, 2011, by and among JPE, each of the other holders and designated secured lenders party thereto and the registrant (incorporated herein by reference to Exhibit 4.3 of the September 2011 Form 8-K). | |
4.4 * | Senior Indenture dated as of September 26, 2012 between XPO Logistics, Inc. and The Bank of New York Mellon Trust Company, N.A., as trustee (incorporated herein by reference to Exhibit 4.1 of the registrant’s Current Report on Form 8-K dated September 26, 2012 (the “September 2012 Form 8-K”). | |
86
Exhibit Number | Description | |
4.5 * | First Supplemental Indenture dated as of September 26, 2012 between XPO Logistics, Inc. and The Bank of New York Mellon Trust Company, N.A., as trustee, supplementing the Senior Indenture dated as of September 26, 2012 (incorporated herein by reference to Exhibit 4.2 of the September 2012 Form 8-K). | |
4.6 * | Form of Indenture for Senior Debt Securities between the Company and one or more banking institutions to be qualified as Trustee pursuant to Section 305(b)(2) of the Trust Indenture Act of 1939 (incorporated herein by reference to Exhibit 4.6 to the registrant’s Registration Statement on Form S-3, registration statement no. 333-188848, filed with the Securities and Exchange Commission on May 24, 2013 (the “May 2013 Form S-3”)). | |
4.7 * | Form of Indenture for subordinated Debt Securities between the Company and one or more banking institutions to be qualified as Trustee pursuant to Section 305(b)(2) of the Trust Indenture Act of 1939 (incorporated herein by reference to Exhibit 4.8 to the registrant’s May 2013 Form S-3). | |
4.8 * | Indenture, dated as of August 25, 2014, between XPO Logistics, Inc. and The Bank of New York Mellon Trust Company, N.A., as Trustee (incorporated by reference to Exhibit 4.1 to XPO’s Current Report on Form 8-K filed with the SEC on August 26, 2014). | |
4.9 * | Investment Agreement, dated as of September 11, 2014, by and among XPO Logistics, Inc. and the Purchasers set forth on Schedule I thereto (incorporated by reference to Exhibit 4.1 to XPO’s Current Report on Form 8-K filed with the SEC on September 15, 2014). | |
4.10 * | Certificate of Designation of Series B Convertible Perpetual Preferred Stock of XPO Logistics, Inc., dated as of September 17, 2014 (incorporated by reference to Exhibit 4.1 to XPO’s Current Report on Form 8-K filed with the SEC on September 18, 2014). | |
10.1 +* | Amended and Restated 2011 Omnibus Incentive Compensation Plan (incorporated by reference to Exhibit A to XPO Logistics, Inc.’s definitive proxy statement on Schedule 14A filed with the Securities and Exchange Commission on April 27, 2012). | |
10.2 +* | 2001 Amended and Restated Stock Option Plan (incorporated herein by reference to Exhibit 4.1 to the registrant’s Registration Statement on Form S-8 dated May 20, 2010). | |
10.3 +* | Form of Restricted Stock Unit Award Agreement (Service-Vesting) (2011 Omnibus Incentive Compensation Plan) (incorporated herein by reference to Exhibit 10.18 to the registrant’s Annual Report on Form 10-K for the fiscal year ended December 31, 2011). | |
10.4 +* | Form of Performance-Based Restricted Stock Unit Award Agreement (2011 Omnibus Incentive Compensation Plan) (incorporated herein by reference to Exhibit 10.19 to the registrant’s Annual Report on Form 10-K for the fiscal year ended December 31, 2011). | |
10.5 +* | Form of Option Award Agreement (2011 Omnibus Incentive Compensation Plan) (incorporated herein by reference to Exhibit 10.20 to the registrant’s Annual Report on Form 10-K for the fiscal year ended December 31, 2011). | |
10.6 +* | Form of Restricted Stock Unit Award Agreement for Non-Employee Directors (2011 Omnibus Incentive Compensation Plan) (incorporated herein by reference to Exhibit 10.21 to the registrant’s Annual Report on Form 10-K for the fiscal year ended December 31, 2011). | |
10.7 +* | Form of Option Award Agreement for Non-Employee Directors (2011 Omnibus Incentive Compensation Plan) (incorporated herein by reference to Exhibit 10.22 to the registrant’s Annual Report on Form 10-K for the fiscal year ended December 31, 2011). | |
10.8 +* | Form of Option Award Agreement (2001 Amended and Restated Stock Option Plan) (grants from June 2011 through September 2011) (incorporated herein by reference to Exhibit 10.23 to the registrant’s Annual Report on Form 10-K for the fiscal year ended December 31, 2011). | |
10.9 +* | Form of Option Award Agreement (2001 Amended and Restated Stock Option Plan) (grants through May 2011) (incorporated herein by reference to Exhibit 10.24 to the registrant’s Annual Report on Form 10-K for the fiscal year ended December 31, 2011). | |
10.10 +* | Form of Performance-Based Restricted Stock Unit Award Agreement (incorporated by reference to Exhibit 10.1 to XPO’s Current Report on Form 8-K filed with the SEC on March 20, 2014). | |
10.11 +* | Form of Restricted Stock Unit Award Agreement (incorporated by reference to Exhibit 10.2 to XPO’s Current Report on Form 8-K filed with the SEC on March 20, 2014). | |
10.12 +* | Employment Agreement between the registrant and Bradley S. Jacobs, dated November 21, 2011 (incorporated herein by reference to Exhibit 10.1 to the registrant’s Current Report on Form 8-K dated November 21, 2011). | |
87
Exhibit Number | Description | |
10.13 +* | Employment Agreement between the registrant and John J. Hardig, dated February 3, 2012 (incorporated herein by reference to Exhibit 10.1 to the registrant’s Current Report on Form 8-K dated on February 7, 2012). | |
10.14 +* | Employment Agreement between the registrant and Scott B. Malat, dated September 20, 2011 (incorporated herein by reference to Exhibit 10.4 to the registrant’s Quarterly Report on Form 10-Q for the quarter ended September 30, 2011 (the “September 2011 Form 10-Q”)). | |
10.15 +* | Amended and Restated Employment Agreement, dated as of March 14, 2014, between the registrant and Gordon E. Devens (incorporated by reference to Exhibit 10.3 to XPO’s Current Report on Form 8-K filed with the SEC on March 20, 2014). | |
10.16 +* | Amended and Restated Employment Agreement, dated as of March 14, 2014, between the registrant and Mario A. Harik (incorporated by reference to Exhibit 10.5 to XPO’s Quarterly Report on Form 10-Q for the quarter ended March 31, 2014). | |
10.17 +* | Amended and Restated Employment Agreement, dated March 14, 2014, between the registrant and Troy A. Cooper (incorporated by reference to Exhibit 10.1 to XPO’s Current Report on Form 8-K filed with the SEC on May 20, 2014). | |
10.18 +* | Amended and Restated Revolving Loan Credit Agreement, dated as of April 1, 2014, by and among XPO Logistics, Inc. and certain subsidiaries, Morgan Stanley Bank, N.A., Morgan Stanley Senior Funding, Inc., Credit Suisse AG, Cayman Islands Branch, Deutsche Bank AG New York Branch, JPMorgan Chase Bank, N.A., Citibank N.A. and KeyBank National Association as Lenders, and Morgan Stanley Senior Funding, Inc., as Administrative Agent (incorporated by reference to Exhibit 10.1 to XPO’s Current Report on Form 8-K filed with the SEC on April 4, 2014) | |
10.19 +* | Amendment to Amended and Restated Revolving Loan Credit dated as of August 8, 2014 (incorporated by reference to Exhibit 10.1 to XPO’s Current Report on Form 8-K filed with the SEC on August 11, 2014). | |
14 * | Senior Officer Code of Business Conduct and Ethics (incorporated herein by reference to Exhibit 14.1 to the registrant’s Current Report on Form 8-K dated January 20, 2012). | |
21 | Subsidiaries of the registrant. | |
23 | Consent of KPMG LLP, Independent Registered Public Accounting Firm. | |
31.1 | Certification of the Principal Executive Officer pursuant to Section 302 of the Sarbanes-Oxley Act of 2002, with respect to the registrant’s Annual Report on Form 10-K for the fiscal year ended December 31, 2014. | |
31.2 | Certification of the Principal Financial Officer pursuant to Section 302 of the Sarbanes-Oxley Act of 2002, with respect to the registrant’s Annual Report on Form 10-K for the fiscal year ended December 31, 2014. | |
32.1 | Certification of the Principal Executive Officer Pursuant to Section 906 of the Sarbanes-Oxley Act of 2002, with respect to the registrant’s Annual Report on Form 10-K for the fiscal year ended December 31, 2014. | |
32.2 | Certification of the Principal Financial Officer Pursuant to Section 906 of the Sarbanes-Oxley Act of 2002, with respect to the registrant’s Annual Report on Form 10-K for the fiscal year ended December 31, 2014. | |
101.INS † | XBRL Instance Document. | |
101.SCH † | XBRL Taxonomy Extension Schema. | |
101.CAL † | XBRL Taxonomy Extension Calculation Linkbase. | |
101.DEF † | XBRL Taxonomy Extension Definition Linkbase. | |
101.LAB † | XBRL Taxonomy Extension Label Linkbase. | |
101.PRE † | XBRL Taxonomy Extension Presentation Linkbase. | |
* | Incorporated by reference. |
+ | This exhibit is a management contract or compensatory plan or arrangement. |
88
This exhibit will not be deemed “filed” for purposes of Section 18 of the Exchange Act (15 U.S.C. 78r), or otherwise subject to the liability of that section. Such exhibit will not be deemed to be incorporated by reference into any filing under the Securities Act of 1933, as amended, or the Securities and Exchange Act of 1934, as amended, except to the extent that the registrant specifically incorporates it by reference. | |
† | Pursuant to Rule 406T of Regulation S-T, these interactive data files are deemed not filed or part of a registration statement or prospectus for purposes of Sections 11 or 12 of the Securities Act of 1933, are deemed not filed for purposes of Section 18 of the Securities Act of 1934 and otherwise are not subject liability under those sections. |
89