Attached files
| file | filename |
|---|---|
| EX-31.1 - EXHIBIT 31.1 - XPO Logistics, Inc. | xpo201710-kexx311.htm |
| EX-31.2 - EXHIBIT 31.2 - XPO Logistics, Inc. | xpo201710-kexx312.htm |
| EX-32.2 - EXHIBIT 32.2 - XPO Logistics, Inc. | xpo201710-kexx322.htm |
| EX-32.1 - EXHIBIT 32.1 - XPO Logistics, Inc. | xpo201710-kexx321.htm |
| EX-23 - EXHIBIT 23 - XPO Logistics, Inc. | xpo201710-kexx23.htm |
| EX-21 - EXHIBIT 21 - XPO Logistics, Inc. | xpo201710-kexx21.htm |
UNITED STATES
SECURITIES AND EXCHANGE COMMISSION
Washington, D.C. 20549
Form 10-K
(Mark One)
ý | ANNUAL REPORT PURSUANT TO SECTION 13 OR 15(d) OF THE SECURITIES EXCHANGE ACT OF 1934 |
For the Fiscal Year Ended December 31, 2017
OR
¨ | TRANSITION REPORT PURSUANT TO SECTION 13 OR 15(d) OF THE SECURITIES EXCHANGE ACT OF 1934 |
For the transition period from to
Commission File Number: 001-32172
XPO Logistics, Inc.
(Exact name of registrant as specified in its charter)
Delaware | 03-0450326 | |
(State or other jurisdiction of incorporation or organization) | (I.R.S. Employer Identification No.) | |
Five American Lane
Greenwich, Connecticut 06831
(Address of principal executive offices)
(855) 976-6951
(Registrant’s telephone number, including area code)
Securities registered pursuant to Section 12(b) of the Act:
Title of Each Class: | Name of Each Exchange on Which Registered: | |
Common Stock, par value $.001 per share | New York Stock Exchange | |
Securities registered pursuant to Section 12(g) of the Act:
None
__________________________________
Indicate by check mark if the registrant is a well-known seasoned issuer, as defined in Rule 405 of the Securities Act. Yes ý No ¨
Indicate by check mark if the registrant is not required to file reports pursuant to Section 13 or Section 15(d) of the Act. Yes ¨ No ý
Indicate by check mark whether the registrant (1) has filed all reports required to be filed by Section 13 or 15(d) of the Securities Exchange Act of 1934 during the preceding 12 months (or for such shorter period that the registrant was required to file such reports), and (2) has been subject to such filing requirements for the past 90 days. Yes ý No ¨
Indicate by check mark whether the registrant has submitted electronically and posted on its corporate website, if any, every Interactive Data File required to be submitted and posted pursuant to Rule 405 of Regulation S-T (§232.405 of this chapter) during the preceding 12 months (or for such shorter period that the registrant was required to submit and post such files). Yes ý No ¨
Indicate by check mark if disclosure of delinquent filers pursuant to Item 405 of Regulation S-K (§229.405 of this chapter) is not contained herein, and will not be contained, to the best of registrant’s knowledge, in definitive proxy or information statements incorporated by reference in Part III of this Form 10-K or any amendment to this Form 10-K. ý
Indicate by check mark whether the registrant is a large accelerated filer, an accelerated filer, a non-accelerated filer, a smaller reporting company, or emerging growth company. See the definitions of “large accelerated filer,” “accelerated filer,” “smaller reporting company,” and “emerging growth company” in Rule 12b-2 of the Exchange Act.
Large accelerated filer | ý | Accelerated filer | ¨ | |||
Non-accelerated filer | ¨ (Do not check if a smaller reporting company) | Smaller reporting company | ¨ | |||
Emerging growth company | ¨ | |||||
If an emerging growth company, indicate by check mark if the registrant has elected not to use the extended transition period for complying with any new or revised financial accounting standards provided pursuant to Section 13(a) of the Exchange Act. ¨
Indicate by check mark whether the registrant is a shell company (as defined in Rule 12b-2 of the Act). Yes ¨ No ý
The aggregate market value of the registrant’s common stock held by non-affiliates of the registrant was $7.2 billion as of June 30, 2017, based upon the closing price of the common stock on that date.
As of February 7, 2018, there were 119,933,200 shares of the registrant’s common stock, par value $0.001 per share, outstanding.
DOCUMENTS INCORPORATED BY REFERENCE
Specified portions of the registrant’s proxy statement, which will be filed with the Securities and Exchange Commission pursuant to Regulation 14A in connection with the registrant’s 2018 Annual Meeting of Stockholders (the “Proxy Statement”), are incorporated by reference into Part III of this Annual Report on Form 10-K. Except with respect to information specifically incorporated by reference in this Annual Report, the Proxy Statement is not deemed to be filed as part hereof.
XPO LOGISTICS, INC.
FORM 10-K—FOR THE YEAR ENDED DECEMBER 31, 2017
TABLE OF CONTENTS
PART I | Page No. | |
Item 1 | ||
Item 1A | ||
Item 1B | ||
Item 2 | ||
Item 3 | ||
Item 4 | ||
PART II | ||
Item 5 | ||
Item 6 | ||
Item 7 | ||
Item 7A | ||
Item 8 | ||
Item 9 | ||
Item 9A | ||
Item 9B | ||
PART III | ||
Item 10 | ||
Item 11 | ||
Item 12 | ||
Item 13 | ||
Item 14 | ||
PART IV | ||
Item 15 | ||
Item 16 | ||
1
PART I
Cautionary Statement Regarding Forward-Looking Statements
This Annual Report on Form 10-K and other written reports and oral statements we make from time to time contain forward-looking statements within the meaning of Section 27A of the Securities Act of 1933, as amended (the “Securities Act”), and Section 21E of the Securities Exchange Act of 1934, as amended (the “Exchange Act”). All statements other than statements of historical fact are, or may be deemed to be, forward-looking statements. In some cases, forward-looking statements can be identified by the use of forward-looking terms such as “anticipate,” “estimate,” “believe,” “continue,” “could,” “intend,” “may,” “plan,” “potential,” “predict,” “should,” “will,” “expect,” “objective,” “projection,” “forecast,” “goal,” “guidance,” “outlook,” “effort,” “target” or the negative of these terms or other comparable terms. However, the absence of these words does not mean that the statements are not forward-looking. These forward-looking statements are based on certain assumptions and analyses made by the Company in light of its experience and its perception of historical trends, current conditions and expected future developments, as well as other factors it believes are appropriate in the circumstances. These forward-looking statements are subject to known and unknown risks, uncertainties and assumptions that may cause actual results, levels of activity, performance or achievements to be materially different from any future results, levels of activity, performance or achievements expressed or implied by such forward-looking statements. Factors that might cause or contribute to a material difference include, but are not limited to, those discussed below and the risks discussed in the Company’s other filings with the Securities and Exchange Commission (the “SEC”). All forward-looking statements set forth in this Annual Report are qualified by these cautionary statements and there can be no assurance that the actual results or developments anticipated by the Company will be realized or, even if substantially realized, that they will have the expected consequence to or effects on the Company or its business or operations. The following discussion should be read in conjunction with the Company’s audited Consolidated Financial Statements and related Notes thereto included elsewhere in this Annual Report. Forward-looking statements set forth in this Annual Report speak only as of the date hereof, and we do not undertake any obligation to update forward-looking statements to reflect subsequent events or circumstances, changes in expectations or the occurrence of unanticipated events, except as required by law.
ITEM 1. BUSINESS
Company Overview
XPO Logistics, Inc., a Delaware corporation, together with its subsidiaries (“XPO,” the “Company,” “we” or “our”), is a top ten global provider of cutting-edge supply chain solutions to the most successful companies in the world. The Company operates as a highly integrated network of people, technology and physical assets. We use our network to help our customers manage their goods more efficiently throughout their supply chains. As of December 31, 2017, we served more than 50,000 customers and operated with over 95,000 employees and 1,455 locations in 32 countries. For full year 2017, our global revenue profile was approximately 60% United States, 13% France, 12% United Kingdom, 4% Spain and 11% other geographies, primarily across Europe and Asia.
We run our business on a global basis, with two segments: Transportation and Logistics. Within each segment, we have built robust service offerings that are positioned to capitalize on fast-growing areas of customer demand. Substantially all of our businesses operate under the single brand of XPO Logistics.
Transportation Segment
We offer customers an unmatched network of multiple modes, flexible capacity and route density that transports freight quickly and cost effectively from origin to destination. Our scale is a significant advantage — both for XPO, as a competitive advantage, and for our customers, who depend on us to provide reliable capacity under all market conditions. We are the second largest freight brokerage provider globally, and we hold industry-leading positions in North America and Europe. In North America, we are the largest provider of last mile logistics for heavy goods; the largest manager of expedite shipments; the second largest provider of less-than-truckload (“LTL”) transportation; and the third largest provider of intermodal services, including a national drayage network; as well as a global freight forwarder with a large network of ocean, air, ground and cross-border services.
2
In Europe, we have the largest owned road transportation fleet. We offer full truckload transportation in Europe as dedicated, non-dedicated and brokered services; last mile logistics services; and LTL transportation through one of the largest LTL networks in Western Europe. Our total lane density in Europe covers the regions that produce approximately 90% of the eurozone’s gross domestic product.
Our Transportation segment uses a blended model of owned, contracted and brokered capacity. This gives us the flexibility to provide solutions that best serve the interests of our customers and the Company. As of December 31, 2017, globally, we had approximately 11,000 independent owner operators under contract to provide drayage, expedite, last mile and LTL services to our customers, and more than 50,000 independent brokered carriers representing over 1,000,000 trucks on the road.
We employ professional drivers that transport goods for customers using our fleet of owned and leased trucks and trailers. Globally, our road fleet encompasses approximately 16,000 tractors and 39,000 trailers, primarily related to our LTL and full truckload operations. These assets also provide capacity for our freight brokerage operations as needed. Our company overall is asset-light, with the revenue generated by activities directly associated with our owned assets accounting for just under a third of our revenue in 2017.
Logistics Segment
In our Logistics segment, which we sometimes refer to as supply chain or contract logistics, we provide a range of differentiated and data-intensive services, including highly engineered and customized solutions, value-added warehousing and distribution, cold chain distribution and other inventory management solutions. We perform e-commerce fulfillment, reverse logistics, recycling, storage, factory support, aftermarket support, manufacturing, distribution, packaging and labeling, and a range of customized solutions such as order personalization. In addition, we provide supply chain optimization services such as production flow management and transportation management. Once we secure a logistics contract, the average tenure is approximately five years and the relationship can lead to a wider use of our services, such as inbound and outbound logistics.
Globally, XPO operates approximately 170 million square feet (15.8 million square meters) of contract logistics facility space, making us the second largest contract logistics provider worldwide. Approximately 83.7 million square feet (7.8 million square meters) of that space is in the United States, where we are a market leader in logistics capacity. This expansive, global footprint makes XPO particularly attractive to large customers with multinational operations. Our logistics customers include the preeminent names in retail and e-commerce, food and beverage, technology, aerospace, wireless, industrial and manufacturing, chemical, agribusiness, life sciences and healthcare.
We also benefit from a strong presence in the high-growth e-commerce sector. E-commerce is predicted to continue to grow globally at a double-digit rate through at least 2020 and, increasingly, order fulfillment is being outsourced. Demand in the e-commerce sector is characterized by strong seasonal surges in activity; typically, the fourth quarter peak is the most dramatic, when holiday orders are placed online.
We are the largest outsourced e-fulfillment provider in Europe, and we have a major platform for e-fulfillment in North America, where we provide highly customized solutions that include reverse logistics and omnichannel services. Our experience with fast-growing e-commerce categories such as mobile electronics makes us a valuable partner to our customers in areas such as product returns, testing, refurbishment, warranty management, order personalization and other value-added services. These global capabilities, together with our last mile leadership in heavy goods in North America, provide our e-commerce customers with superior in-house control, flexible warehousing options and labor pools, advanced automation, and a national network of home delivery hubs — shortening the time between sourcing and doorstep and generating industry-leading consumer satisfaction levels.
Operating Philosophy
We believe that our ability to provide customers with integrated, end-to-end supply chain solutions gives us a competitive advantage. Many customers, particularly large companies, are moving to large, single-source relationships with multi-modal providers to handle their supply chain requirements. We have built XPO to capitalize on this trend, as well as the trend toward outsourcing in transportation and logistics, the boom in e-commerce, and the adoption of just-in-time inventory practices.
Two hallmarks of our operations worldwide are technology and sustainability.
3
We place massive importance on innovation because we believe that great technology in the hands of well-trained employees is the ultimate competitive advantage in our industry. We view our technology as being critical to continuously improving customer service, controlling costs and leveraging our scale. Our annual investment in technology of more than $450 million is among the highest in our industry.
We concentrate our efforts in the following areas of innovation: automation and robotics; big data; visibility and customer service; and digital freight marketplace. We have built a highly scalable and integrated system on a cloud-based platform that speeds up both the development process and the time-to-launch. Our global team of approximately 1,700 technology professionals can deploy proprietary software very rapidly.
Our focus is on developing proprietary innovations that differentiate our services and create tangible value for our customers and investors. For example, we have the ability to share data with our customers in real time, including visibility of orders moving through fulfillment and shipments in transit, on-demand availability of full truckload. Internally, our technology gives us a birds-eye view of real-time market conditions and pricing for truckload, intermodal and LTL, and facilitates load assignments with our independent contractors, all of which greatly enhances customer service.
In addition, XPO has a strong, global commitment to sustainability. We own the largest natural gas truck fleet in Europe, and we launched government-approved mega-trucks in Spain, both of which reduce our carbon footprint. Our Company has been awarded the label “Objectif CO2” for outstanding environmental performance of transport operations in Europe by the French Ministry of the Environment and the French Environment and Energy Agency.
Many of our logistics facilities globally are ISO 14001-certified, which ensures environmental and other regulatory compliances. We monitor fuel emissions from forklifts, with protocols in place to take immediate corrective action if needed. Company packaging engineers ensure that the optimal carton size is used for each product slated for distribution and, as a byproduct of reverse logistics, we recycle millions of electronic components and batteries each year. These are just a few of the many initiatives that reflect our commitment to operating in a progressive and environmentally sound manner, with the greatest efficiency and least waste possible.
Transportation Services
The Company’s Transportation segment includes five service lines: freight brokerage, last mile, LTL, full truckload and global forwarding. These service lines are led by highly experienced operators that know how to deliver results.
Freight Brokerage
Our freight brokerage operations encompass truck brokerage globally, as well as intermodal, drayage and expedite services in North America.
Our truck brokerage operations are non-asset-based: we place shippers’ freight with qualified carriers, primarily trucking companies. Customers offer loads to us via electronic data interchange, email, telephone and the internet on a daily basis. These services are priced on either a spot market or contract basis for shippers. We collect payments from our customers and pay the carriers for transporting customer loads. Our proprietary, cloud-based brokerage platform, Freight Optimizer, gives us real-time visibility into truckload supply and demand.
Our intermodal operations are asset-light: we provide customers with container capacity, brokered rail transportation, drayage transportation via independent contractors, and on-site operational services. We lease or own approximately 10,000 53-ft. containers and 5,000 chassis, and we use this equipment to fill some of our customers’ capacity requirements.
We have sophisticated infrastructure in place to work with the railroads in providing the long-haul portion of freight shipments in containers, and we contract with trucking companies for local pickup and delivery. We also provide customized electronic tracking and analysis of market prices and negotiated rail, truck and intermodal rates through our proprietary intermodal technology, Rail Optimizer, which enables us to determine the optimal configurations.
We offer our door-to-door intermodal services to a wide range of customers in North America, including large industrial and retail shippers, transportation intermediaries such as intermodal marketing companies, and steamship lines. As of December 31, 2017, XPO was the third largest provider of intermodal services in North America, with
4
one of the largest U.S. drayage networks, and a leading provider of intermodal services in the cross-border Mexico sector.
Our expedite operations are predominantly non-asset-based: substantially all of the ground transportation equipment is provided by third-party truck carriers. In addition, we facilitate expedite air charter service for customer freight using the Company’s relationships with third-party air carriers and our proprietary, web-based sourcing technology.
Our expedite services can be characterized as time-critical, time-sensitive or high priority freight shipments, many of which have special handling needs. Urgent needs for expedited transportation typically arise due to tight tolerances in a customer’s supply chain, or an interruption or a failure in the supply chain.
Expedite customers most often request our services on a per-load transactional basis through our offices or via our proprietary online portals. Only a small percentage of loads are scheduled for future delivery dates. We operate an ISO 9001:2008-certified call center that gives our customers on-demand status updates related to their expedited shipments. As of December 31, 2017, XPO was the largest manager of expedited freight shipments in North America.
Last Mile Logistics
Our last mile services are predominantly asset-light: we utilize independent contractors to perform transportation and over-the-threshold deliveries and installations. In North America, these services are facilitated through a large network of XPO last mile hubs. As of December 31, 2017, we had 55 hubs operating in North America. By year-end 2018, we expect to grow this network to 85 hubs, extending our footprint to within 90% of the U.S. population and further reducing transit times for our customers.
Last mile comprises the final stage of the delivery from a local distribution center or retail store to the end-consumer’s home or business, where additional services are often required. It is a fast-growing industry sector that serves blue chip retailers, e-commerce companies and smaller retailers with limited in-house capabilities for deliveries and installations. Important aspects of last mile service are responsiveness to seasonal demand, economies of scale and an ability to maintain a consistently high quality of customer experience.
The last mile process often requires incremental services such as pre-scheduled delivery times, unpacking, assembly, utility connection, installation and testing, as well as the removal of an old product. These additional services are commonly referred to as white-glove services. We use our proprietary technology platform to collect customer feedback, monitor carrier performance, manage capacity and communicate during narrow windows of service to ensure consumer satisfaction and protect the brands of our customers.
Our last mile operations in North America and Europe specialize in heavy goods, including appliances, furniture, large electronics and other goods that are larger-than-parcel. As of December 31, 2017, XPO was the largest provider of last mile services for heavy goods in North America.
Less-Than-Truckload (LTL)
In North America, our LTL operations are asset-based: we utilize employee drivers, our own fleet of tractors and trailers for line-haul, pick-up and delivery, and a network of terminals. We provide our customers with critical density and day-definite regional, inter-regional and transcontinental LTL freight services. As of December 31, 2017, XPO was the second largest provider of LTL services in North America, offering more than 75,000 next-day and two-day lanes. Our coverage area in North America encompasses approximately 99% of all U.S. zip codes, with service in Canada.
In Europe, our LTL operations utilize a blend of asset-based and asset-light capacity — both company fleet and contracted carriers, with a network of terminals. We provide LTL services domestically in France, the United Kingdom and Spain. We also offer international LTL distribution throughout Europe.
Full Truckload
Our full truckload operations are asset-based and operate almost entirely in Europe. For many customers, we operate as a dedicated contract carrier, providing truckload capacity by utilizing our fleet of tractors and trailers. In addition, we provide transactional transportation of packaged goods, high cube products and bulk goods. We provide full truckload services domestically in France, the United Kingdom, Spain, Poland, Romania, Italy, Portugal and
5
Slovakia, and internationally throughout Europe. As of December 31, 2017, XPO was a leading provider of full truckload transportation in Europe.
Global Forwarding
Our global forwarding operations are asset-light: we provide logistics services for domestic, cross-border and international shipments through our relationships with ground, air and ocean carriers and a network of Company and agent-owned offices. Our freight forwarding capabilities are not restricted by size, weight, mode or location, and therefore are potentially attractive to a wide market base.
As part of our global forwarding network, we operate a subsidiary as a non-vessel-operating common carrier (“NVOCC”) to transport our customers’ freight by contracting with vessel operators. We are also a customs broker licensed by the U.S. Customs and Border Protection Service. This enables us to provide customs brokerage services to direct domestic importers, other freight forwarders and NVOCCs, and vessel-operating common carriers.
Logistics Services
The Company’s Logistics segment, which we also refer to as supply chain or contract logistics, encompasses a range of services, including highly engineered and customized solutions, temperature-controlled warehousing, omnichannel logistics e-fulfillment and transportation management. The segment is led by seasoned executives in North America and Europe that collaborate on multinational opportunities. As of December 31, 2017, XPO was the second largest global provider of contract logistics based on square footage, with one of the largest e-fulfillment platforms in Europe.
We provide our logistics customers with integrated services such as dedicated and shared warehousing, e-fulfillment order processing and personalization, reverse logistics, storage, factory support, aftermarket support, manufacturing, packaging, labeling and distribution. In addition, we utilize our technology and expertise to solve complex supply chain challenges and create transformative solutions for our customers, while reducing their operating costs and improving production flow management.
Our logistics customers primarily operate in industries with high-growth outsourcing opportunities, such as retail and e-commerce, food and beverage, technology, aerospace, wireless, industrial and manufacturing, chemical, agribusiness, life sciences and healthcare. These customers have demanding requirements for quality standards, real-time data visibility, special handling, security, the management of large numbers of stock-keeping units (“SKUs”), time-assured deliveries and volume fluctuations, with seasonal surges in certain sectors such as retail and e-commerce.
The Company is a top five global provider of managed transportation based on the value of freight under management. Our managed transportation offering includes a range of services provided to shippers who want to outsource some or all of their transportation modes, together with associated activities. These activities can include freight handling such as consolidation and deconsolidation, labor planning, the facilitation of inbound and outbound shipments, cross-border management, claims processing, and third-party supplier management, as well as other services.
Our Strategy
Our strategy is to use our highly integrated network of people, technology and physical assets to help customers manage their goods more efficiently throughout their supply chains. We deliver value to customers in the form of cost and risk reductions, process efficiencies, consistently reliable outcomes, technological innovations and customer service that is both highly responsive and proactive.
We continue to optimize our existing operations by growing our sales force, implementing advanced information technology, cross-selling our services and leveraging our Company-wide capacity. In addition, we maintain a disciplined and comprehensive set of processes related to the recruiting, training and mentoring of employees, and for marketing to the hundreds of thousands of prospective customers that can use our services. Most important to our growth, we have instilled a culture of collaboration that focuses our efforts on delivering the results that matter to our customers and the Company.
6
We will continue to grow the business in a disciplined manner, and with a compelling value proposition: XPO can provide integrated, innovative solutions for any company, of any size, with any combination of supply chain needs.
Management’s growth and optimization strategy for the Transportation segment is to:
• | Market our diversified, multi-modal offering to customers of all sizes, both new and existing accounts; |
• | Cross-sell our Transportation segment solutions to customers of our Logistics segment; |
• | Provide world-class service and solutions that satisfy our customers’ transportation-related supply chain goals; |
• | Recruit and retain quality drivers, and best utilize our driver and equipment capacities; |
• | Attract and retain quality independent owner-operators and independent brokered carriers for our carrier network; |
• | Recruit and retain quality sales and customer service representatives, and continuously improve employee productivity with state-of-the-art training and technology; |
• | Continue to develop cutting-edge transportation applications for our proprietary technology platform; and |
• | Integrate industry-best practices with a focus on utilizing our advantages of scale to serve our customers efficiently and lower our administrative overhead. |
Management’s growth and optimization strategy for the Logistics segment is to:
• | Develop additional business in verticals where the Company already has deep logistics expertise and a strong track record of successful relationships; |
• | Capture more share of spend with existing customers that potentially could use XPO for more of their logistics and/or broader supply chain needs; |
• | Expand our relationships with existing customers that have business interests in both North America, Europe and Asia; |
• | Cross-sell contract logistics and managed transportation solutions to customers of our Transportation segment; |
• | Market the advantages of XPO’s proprietary technology and global network of logistics facilities; |
• | Provide world-class service and solutions that satisfy our customers’ logistics-related supply chain goals; and |
• | Integrate industry-best practices with a focus on utilizing our advantages of scale to serve our customers efficiently and lower our administrative overhead. |
Technology and Intellectual Property
One of the ways in which we empower our employees to deliver superior service is through our information technology. We believe that technology is a compelling differentiator in our industry. Technology represents one of the Company’s largest categories of capital investment, reflecting our belief that the continual enhancement of our cloud-based platform is critical to our success. We have a world-class technology team that focuses on innovating customer service and advancing the effectiveness of our software.
In our Transportation segment, our proprietary Freight Optimizer software for truck brokerage provides dynamic pricing information, automated carrier matching and digital track and trace capabilities. Our DriveXPO mobile application interacts with Freight Optimizer to create a digital brokerage marketplace by automating key brokerage functions for carriers. Carriers use this app to bid on loads and reduce empty miles. It also serves as a geo-locator and supports voice-to-text communications.
Our proprietary Rail Optimizer software manages all aspects of intermodal operations, including shipment tracking, capacity flow and asset management, market-based pricing, and the contracting of transportation services with rail
7
providers. Rail Optimizer has enabled us to raise intermodal service levels, reduce empty miles and increase visibility across the network.
In expedite, we utilize satellite tracking and communication units on the independently contracted vehicles that transport goods for our customers, thus enabling real-time electronic updates. A significant component of our expedite operations is our proprietary bidding platform, which awards loads electronically based on carriers’ online bids and manages the transportation process almost entirely through technology.
In last mile logistics, our proprietary, web-based technology has been instrumental in ensuring superior consumer satisfaction ratings by gathering actionable, real-time feedback post-delivery to help our customers build loyalty. In addition, our software supports tighter delivery windows, facilitates complex home installations, and gives consumers digital tools to track their order in real time, set personalized alerts and reschedule delivery times electronically.
In our LTL operations, we rolled out 14,000 handhelds and inspection tablets for drivers and dockworkers to enhance productivity and revenue collection from accessorials and ancillary services. We also developed new RFP and pricing systems for LTL, with robust algorithms and profitability monitoring. These have improved the business intelligence we use for LTL pricing, workforce planning and network optimization.
In our Logistics segment, we have developed proprietary technology for the design and implementation of sophisticated contract logistics solutions for our customers. These solutions are most often utilized by large, multinational and medium-sized corporations and by government agencies with complex supply chain requirements. Our warehouses are becoming high-tech hubs: we have robots working side-by-side with our people, and drones helping out with inventory management. We use smart glasses for order picking, and numerous other technologies, some of which are purpose-built for individual customers.
The logistics space is wide open for the development of exciting technologies. For example, we have developed predictive analytics that use machine learning to forecast demand — we use this information to collaborate with our customers and allocate resources for changes in volumes. By predicting the flow of goods and future returns, we are able to help our customers plan for inventory, capacity and labor levels. These capabilities are particularly valuable to e-commerce customers.
Our position as the industry’s leading champion of technology continues to lead to important new benefits for our customers. In early 2018, we plan to roll out our next-generation, proprietary warehouse management system. This system can dramatically reduce ramp-up time on customer projects. It operates on tablets and other mobile devices and integrates very quickly with other technologies, such as robotics, through a state-of-the-art interface.
XPO relies on a combination of trademarks, copyrights, trade secrets, nondisclosure agreements and non-competition agreements to establish and protect its intellectual property and proprietary technology. We have numerous registered trademarks, trade names and logos in the United States and international jurisdictions.
Customers, Sales and Marketing
Our Company provides services to a variety of customers, ranging in size from small, entrepreneurial organizations to Fortune 500 companies and global industry leaders. We have a diversified customer base that minimizes our concentration risk: in 2017, approximately 10% of our revenue was attributable to our top five customers.
Our customers are engaged in a wide range of industries, including retail, e-commerce, food and beverage, manufacturing, technology and telecommunications, aerospace and defense, life sciences, healthcare, medical equipment, and agriculture. In 2017, retail and e-commerce accounted for the largest portion of our global revenue at 29%, compared with 26% in 2016; followed by food and beverage at 16% in 2017, compared with 14% in 2016.
XPO is not reliant on the economy of any one country, region or industry. Our transportation services are primarily marketed in North America and Europe, whereas our logistics and global forwarding networks serve global markets with concentrations in North America, Europe and Asia.
Competition
The transportation and logistics industry is highly competitive, with thousands of companies competing in domestic and international markets. XPO competes on service, reliability, scope and scale of operations, technological
8
capabilities and price. Our competitors include local, regional, national and international companies that offer the same services we provide — some with larger customer bases, significantly more resources and more experience than we have. In some cases, our customers have internal resources that can handle some of the same services we offer. Due in part to the fragmented nature of the industry, we must strive daily to retain existing business relationships and forge new relationships.
The health of the transportation and logistics industry will continue to be a function of domestic and global economic growth. However, we believe that we have positioned the Company to derive additional benefits from the growth of e-commerce, and from a long-term outsourcing trend that should continue to help a number of our service sectors grow faster than the macro environment.
Regulation
Our operations are regulated and licensed by various governmental agencies in the United States and in the other countries where we conduct business. These regulations impact us directly and indirectly by regulating third-party transportation providers we use to transport freight for our customers.
Regulation Affecting Motor Carriers, Owner Operators and Transportation Brokers. In the United States, our subsidiaries that operate as motor carriers have licenses to operate as motor carriers issued by the Federal Motor Carrier Safety Administration (“FMCSA”) of the U.S. Department of Transportation (“DOT”). In addition, our subsidiaries acting as property brokers have property broker licenses issued by the FMCSA. Our motor carrier subsidiaries and the third-party motor carriers we engage in the United States must comply with the safety and fitness regulations of the DOT, including those relating to drug- and alcohol-testing, hours-of-service, records retention, vehicle inspection, driver qualification and minimum insurance requirements. Weight and equipment dimensions also are subject to government regulations. We also may become subject to new or more restrictive regulations relating to emissions, drivers’ hours-of-service, independent contractor eligibility requirements, onboard reporting of operations, air cargo security and other matters affecting safety or operating methods. Other agencies, such as the U.S. Environmental Protection Agency (“EPA”), the Food and Drug Administration (“FDA”), the California Air Resources Board, and the U.S. Department of Homeland Security (“DHS”), also regulate our equipment, operations and independent contractor drivers. Like our third-party support carriers, we are also subject to a variety of vehicle registration and licensing requirements in various states and local jurisdictions where we operate. In other foreign jurisdictions in which we operate, our operations are regulated, where necessary, by the appropriate governmental authorities.
In 2010, the FMCSA introduced the Compliance Safety Accountability program (“CSA”), which uses a Safety Management System (“SMS”) to rank motor carriers on seven categories of safety-related data, known as Behavioral Analysis and Safety Improvement Categories, or “BASICs,” which data, it is anticipated, will eventually be used for determining a carrier’s DOT safety rating under revisions to existing Safety Fitness Determination (“SFD”) regulations. In December 2015, the Fixing America’s Surface Transportation Act (“FAST Act”) was signed into law, and requires the FMCSA to review the CSA program to ensure that it provides the most reliable analysis possible. During this review period, the FAST Act requires the FMCSA to remove a property carrier’s CSA scores from public view.
Although the CSA scores are not currently publicly available, this development is likely to be temporary. As a result, once the program has been revamped, our fleet could be ranked worse or better than our competitors, and the safety ratings of our motor carrier operations could be impacted. Our network of third-party transportation providers may experience a similar result. A reduction in safety and fitness ratings may result in difficulty attracting and retaining qualified independent contractors and could cause our customers to direct their business away from XPO and to carriers with more favorable CSA scores, which would adversely affect our results of operations.
In the past, the subsidiaries through which we operate our expedited and intermodal drayage operations have exceeded the established intervention threshold in certain of the BASICs, and we may exceed those thresholds in the future. Depending on our ratings, we may be prioritized for an intervention action or roadside inspection, either of which could adversely affect our results of operations, or customers may be less likely to assign loads to us. We cannot predict the extent to which CSA requirements or safety and fitness ratings under SMS or SFD could adversely affect our business, operations or ability to retain compliant drivers, or those of our subsidiaries, independent contractors or third-party transportation providers.
9
New regulations effective December 2017 require nearly all carriers and drivers that are required to maintain records of duty status, including certain of XPO’s motor carrier subsidiaries and drivers, to install and use electronic logging devices (“ELDs”). ELD installation and use may increase costs for independent contractors and other third-party support carriers who provide services to XPO, and may impact driver recruitment.
Regulations Affecting our Subsidiaries Providing Ocean and Air Transportation. XPO Customs Clearance Solutions, Inc. (“XCCS”) and XPO GF America, Inc. (“XGFA”), two of the Company’s subsidiaries, are licensed as customs brokers by U.S. Customs and Border Protection (“CBP”) of DHS in each United States customs district in which they do business. All United States customs brokers are required to maintain prescribed records and are subject to periodic audits by CBP. In other jurisdictions in which we perform customs brokerage services, our operations are licensed, where necessary, by the appropriate governmental authority.
Our subsidiaries offering expedited air charter transportation are subject to regulation by the Transportation Security Administration (“TSA”) of DHS regarding air cargo security for all loads, regardless of origin and destination. XPO Global Forwarding, Inc. (“XGF”), XGFA and XPO Air Charter also are regulated as “indirect air carriers” by the DHS and TSA. These agencies provide requirements, guidance and, in some cases, administer licensing requirements and processes applicable to the freight forwarding industry. We must actively monitor our compliance with such agency requirements to ensure that we have satisfactorily completed the security requirements and qualifications and implemented the required policies and procedures. These agencies generally require companies to fulfill these qualifications prior to transacting various types of business. Failure to do so could result in penalties and fines. The air cargo industry is also subject to regulatory and legislative actions that could affect economic conditions within the industry by requiring changes to operating practices or by influencing the demand for and the costs of providing services to customers. We cannot predict the extent to which any such regulatory or legislative actions could adversely affect our business, but we strive to comply with all agency requirements.
Regarding our international operations, XGF, XGFA and XCCS are members of the International Air Transportation Association (“IATA”), a voluntary association of airlines and freight forwarders that outlines operating procedures for forwarders acting as agents or third-party intermediaries for IATA members. A substantial portion of XPO’s international air freight business is transacted with other IATA members.
Additionally, XGF, XGFA and XPO Ocean Lines, Inc. (“XOL”) are each registered as an Ocean Transportation Intermediary (“OTI”) by the U.S. Federal Maritime Commission (“FMC”), which establishes the qualifications, regulations and bonding requirements to operate as an OTI for businesses originating and terminating in the United States. XGL and XOL are also licensed NVOCCs and ocean freight forwarders.
Our international freight forwarding operations make us subject to regulations of the U.S. Department of State, the U.S. Department of Commerce and the U.S. Department of Treasury, and to various laws and regulations of the other countries where we operate. These regulations cover matters such as what commodities may be shipped to what destinations and to what end-users, unfair international trade practices, and limitations on entities with which we may conduct business.
Other Regulations. The Company is subject to a variety of other U.S. and foreign laws and regulations, including but not limited to, the Foreign Corrupt Practices Act and other similar anti-bribery and anti-corruption statutes.
Classification of Independent Contractors. Tax and other federal and state regulatory authorities, as well as private litigants, continue to assert that independent contractor drivers in the trucking industry are employees rather than independent contractors. Federal legislators have introduced legislation in the past to make it easier for tax and other authorities to reclassify independent contractors as employees, including legislation to increase the recordkeeping requirements and heighten the penalties for companies who misclassify workers and are found to have violated overtime and/or wage requirements. Additionally, federal legislators have sought to abolish the current safe harbor allowing taxpayers that meet certain criteria to treat individuals as independent contractors if they are following a longstanding, recognized practice. Federal legislators also sought to expand the Fair Labor Standards Act to cover “non-employees” who perform labor or services for businesses, even if the “non-employees” are properly classified as independent contractors; require taxpayers to provide written notice to workers based upon their classification as either an “employee” or a “non-employee”; and impose penalties and fines for violations of the notice requirements or “employee” or “non-employee” misclassifications. Some states have launched initiatives to increase revenues from items such as unemployment, workers’ compensation and income taxes, and the reclassification of independent
10
contractors as employees could help states with those initiatives. Taxing and other regulatory authorities and courts apply a variety of standards in their determinations of independent contractor status. If XPO’s independent contractor drivers are determined to be employees, we would incur additional exposure under some or all of the following: federal and state tax, workers’ compensation, unemployment benefits, and labor, employment and tort laws, including for prior periods, as well as potential liability for employee benefits and tax withholdings.
Environmental Regulations. Our facilities and operations and our independent contractors are subject to various environmental laws and regulations dealing with the hauling, handling and disposal of hazardous materials, emissions from vehicles, engine-idling, fuel tanks and related fuel spillage and seepage, discharge and retention of storm water, and other environmental matters that involve inherent environmental risks. Similar laws and regulations may apply in many of the foreign jurisdictions in which we operate. We have instituted programs to monitor and control environmental risks and maintain compliance with applicable environmental laws and regulations. We may be responsible for the cleanup of any spill or other incident involving hazardous materials caused by our operations or business. In the past, we have been responsible for the costs of cleanup of diesel fuel spills caused by traffic accidents or other events, and none of these incidents materially affected our business or operations. We generally transport only hazardous materials rated as low-to-medium-risk, and a small percentage of our total shipments contain hazardous materials. We believe that our operations are in substantial compliance with current laws and regulations and we do not know of any existing environmental condition that reasonably would be expected to have a material adverse effect on our business or operating results. We also do not expect to incur material capital expenditures for environmental controls in 2018. Future changes in environmental regulations or liabilities from newly discovered environmental conditions or violations (and any associated fines and penalties) could have a material adverse effect on our business, competitive position, results of operations, financial condition or cash flows. U.S. federal and state governments, as well as governments in certain foreign jurisdictions where we operate, have also proposed environmental legislation that could, among other things, potentially limit carbon, exhaust and greenhouse gas emissions. If enacted, such legislation could result in higher new tractor and trailer costs, reduced productivity and efficiency, and increased operating expenses, all of which could adversely affect our results of operations.
Risk Management and Insurance
We maintain insurance for commercial automobile liability, truckers’ commercial automobile liability, commercial general liability, cargo/warehouse legal liability, workers’ compensation and employers’ liability, and umbrella and excess umbrella liability, with coverage limits, deductibles and self-insured retention levels that we believe are reasonable given the varying historical frequency, severity and timing of claims. Certain actuarial assumptions and management judgments are made for insurance reserves and are subject to a high degree of variability.
Seasonality
Our revenue and profitability are typically lower for the first quarter of the calendar year relative to the other quarters. We believe this is due in part to the post-holiday reduction in demand experienced by many of our customers, which leads to more capacity in the non-expedited and service-critical markets and, in turn, less demand for expedited and premium shipping services. In addition, the productivity of our tractors and trailers, independent contractors and transportation providers generally decreases during the winter season because inclement weather impedes operations. It is not possible to predict whether the Company’s historical revenue and profitability trends will continue to occur in future periods.
Employees
As of December 31, 2017, we had approximately 95,000 full-time and part-time employees. Our employee base is one of our most critical resources, and we view the recruitment, training and retention of qualified employees as being essential to our ongoing success. We believe that we have good relations with our employees, with strong programs in place for communication and professional development.
11
Executive Officers of the Registrant
We provide below information regarding each of our executive officers.
Name | Age | Position | ||
Bradley S. Jacobs | 61 | Chairman of the Board and Chief Executive Officer | ||
Troy A. Cooper | 48 | Chief Operating Officer | ||
John J. Hardig | 53 | Chief Financial Officer | ||
Scott B. Malat | 41 | Chief Strategy Officer | ||
Mario A. Harik | 37 | Chief Information Officer | ||
Bradley Jacobs has served as XPO’s chief executive officer and chairman of the board of directors since September 2011. Mr. Jacobs is also the managing director of Jacobs Private Equity, LLC, which is the Company’s second largest stockholder. Prior to XPO, he led two public companies: United Rentals, Inc. (NYSE: URI), which he co-founded in 1997, and United Waste Systems, Inc., which he founded in 1989. Mr. Jacobs served as chairman and chief executive officer of United Rentals for its first six years, and as executive chairman for an additional four years. With United Waste Systems, he served eight years as chairman and chief executive officer. Previously, Mr. Jacobs founded Hamilton Resources (UK) Ltd. and served as its chairman and chief operating officer. This followed the co-founding of his first venture, Amerex Oil Associates, Inc., where he was chief executive officer.
Troy Cooper has served as XPO’s chief operating officer since May 2014. From September 2015 until September 2017 he also served as chief executive officer and chairman of XPO Logistics Europe. Mr. Cooper joined the Company in September 2011 as vice president of finance. Prior to XPO, Mr. Cooper served as vice president-group controller with United Rentals, Inc., where he was responsible for field finance functions and helped to integrate over 200 acquisitions in the United States, Canada and Mexico. Earlier, he held controller positions with United Waste Systems, Inc. and OSI Specialties, Inc. (formerly a division of Union Carbide, Inc.). He began his career in public accounting with Arthur Andersen and Co. and has a degree in accounting from Marietta College.
John Hardig has served as XPO’s chief financial officer since February 2012. Prior to XPO, Mr. Hardig served as managing director for the Transportation & Logistics investment banking group of Stifel Nicolaus Weisel from 2003 to 2012. Previously, Mr. Hardig was an investment banker in the Transportation and Telecom groups at Alex. Brown & Sons (now Deutsche Bank), and earlier worked as a design engineer with Ford Motor Company. Mr. Hardig holds a master’s degree in business administration from the University of Michigan Business School and a bachelor’s degree from the U.S. Naval Academy.
Scott Malat has served as XPO’s chief strategy officer since July 2012, after joining the Company in October 2011 as senior vice president of strategic planning. Prior to XPO, Mr. Malat was a senior equity research analyst covering the air, rail, trucking and shipping sectors for Goldman Sachs Group, Inc. Earlier, he served as an equity research analyst with UBS and a strategy manager with JPMorgan Chase & Co. Mr. Malat is a CFA® charterholder and has a degree in statistics with a concentration in business management from Cornell University.
Mario Harik has served as XPO’s chief information officer since November 2011 with responsibility for the Company’s global technology ecosystem. Mr. Harik has built comprehensive IT organizations, overseen the implementation of extensive proprietary platforms, and consulted to Fortune 100 companies. His prior positions include chief information officer and senior vice president of research and development with Oakleaf Waste Management; chief technology officer with Tallan, Inc.; co-founder of G3 Analyst, where he served as chief architect of web and voice applications; and architect and consultant with Adea Solutions. Mr. Harik holds a master’s of engineering degree in information technology from Massachusetts Institute of Technology, and a degree in engineering, computer and communications from the American University of Beirut, Lebanon.
Corporate Information and Availability of Reports
XPO Logistics, Inc. was incorporated in Delaware on May 8, 2000. Our executive office is located in the United States at Five American Lane, Greenwich, Connecticut 06831. Our telephone number is (855) 976-6951. Our stock is listed on the New York Stock Exchange (“NYSE”) under the symbol XPO.
12
Our corporate website is www.xpo.com. We make available on this website, free of charge, access to our Annual Reports on Form 10-K, Quarterly Reports on Form 10-Q, Current Reports on Form 8-K, Proxy Statements on Schedule 14A and amendments to those materials filed or furnished pursuant to Section 13(a) or 15(d) of the Securities Exchange Act of 1934, as amended (the “Exchange Act”), as soon as reasonably practicable after we electronically submit such material to the SEC. We also make available on our website copies of materials regarding our corporate governance policies and practices, including the XPO Logistics, Inc. Corporate Governance Guidelines, Code of Business Ethics and the charters relating to the committees of our board of directors. You also may obtain a printed copy of the foregoing materials by sending a written request to: Investor Relations, XPO Logistics, Inc., Five American Lane, Greenwich, Connecticut 06831. The public may read and copy any materials that we file with the SEC at the SEC’s Public Reference Room at 100 F Street, NE, Washington, DC 20549. The public may obtain information on the operation of the Public Reference Room by calling the SEC at (800) SEC-0330. In addition, the SEC’s website is www.sec.gov. The SEC makes available on this website, free of charge, reports, proxy and information statements and other information regarding issuers, such as us, that file electronically with the SEC. Information on our website or the SEC’s website is not part of this document. We are currently classified as a “large accelerated filer” for purposes of filings with the SEC.
Item 1A. Risk Factors
The following are important factors that could affect our financial performance and could cause actual results for future periods to differ materially from our anticipated results or other expectations, including those expressed in any forward-looking statements made in this Annual Report on Form 10-K or our other filings with the SEC or in oral presentations such as telephone conferences and webcasts open to the public. You should carefully consider the following factors and consider these in conjunction with “Management’s Discussion and Analysis of Financial Condition and Results of Operations” in Item 7 and our Consolidated Financial Statements and related Notes in Item 8.
Economic recessions and other factors that reduce freight volumes, both in North America and Europe, could have a material adverse impact on our business.
The transportation industry in North America and Europe historically has experienced cyclical fluctuations in financial results due to economic recession, downturns in the business cycles of our customers, increases in the prices charged by third-party carriers, interest rate fluctuations and other U.S. and global economic factors beyond our control. During economic downturns, reduced overall demand for transportation services will likely reduce demand for our services and exert downward pressures on our rates and margins. In periods of strong economic growth, demand for limited transportation resources can result in increased network congestion and operating inefficiencies. In addition, any deterioration in the economic environment subjects our business to various risks that may have a material impact on our operating results and future prospects. These risks may include the following:
• | A reduction in overall freight volumes reduces our opportunities for growth. In addition, if a downturn in our customers’ business cycles causes a reduction in the volume of freight shipped by those customers, our operating results could be adversely affected. |
• | Some of our customers may face economic difficulties and may not be able to pay us, and some may go out of business. In addition, some customers may not pay us as quickly as they have in the past, causing our working capital needs to increase. |
• | A significant number of our transportation providers may go out of business and we may be unable to secure sufficient equipment or other transportation services to meet our commitments to our customers. |
• | We may not be able to appropriately adjust our expenses to changing market demands. In order to maintain high variability in our business model, it is necessary to adjust staffing levels to changing market demands. In periods of rapid change, it is more difficult to match our staffing levels to our business needs. In addition, we have other primarily variable expenses that are fixed for a period of time and certain significant fixed expenses, and we may not be able to adequately adjust them in a period of rapid change in market demand. |
13
We operate in a highly competitive industry and, if we are unable to adequately address factors that may adversely affect our revenue and costs, our business could suffer.
Competition in the transportation services industry is intense. Increased competition may lead to a reduction in revenues, reduced profit margins, or a loss of market share, any one of which could harm our business. There are many factors that could impair our profitability, including the following:
• | Competition from other transportation services companies, some of which offer different services or have a broader coverage network, more fully developed information technology systems and greater capital resources than we do. |
• | A reduction in the rates charged by our competitors to gain business, especially during times of declining economic growth. Such reductions may limit our ability to maintain or increase our rates, maintain our operating margins or achieve significant growth in our business. |
• | Shippers soliciting bids from multiple transportation providers for their shipping needs, which may result in the depression of freight rates or loss of business to competitors. |
• | The establishment by our competitors of cooperative relationships to increase their ability to address shipper needs. |
• | Our current or prospective customers may decide to develop or expand internal capabilities for some of the services that we provide. |
• | The development of new technologies or business models, which could result in our disintermediation in certain businesses, such as freight brokerage. |
Our profitability may be materially adversely impacted if our investments in equipment, service centers and warehouses do not match customer demand for these resources or if there is a decline in the availability of funding sources for these investments.
Our LTL and full truckload operations require significant investments in equipment and freight service centers. The amount and timing of our capital investments depend on various factors, including anticipated freight volume levels and the price and availability of appropriate property for service centers and newly-manufactured tractors. If our anticipated service center and/or fleet requirements differ materially from actual usage, our capital-intensive business units, specifically LTL and full truckload, may have too much or too little capacity. We attempt to mitigate the risk associated with too much or too little capacity by adjusting our capital expenditures and by utilizing short-term equipment rentals and sub-contracted operators in order to match capacity with business volumes. Our investments in equipment and service centers depend on our ability to generate cash flow from operations and our access to credit, debt and equity capital markets. A decline in the availability of these funding sources could adversely affect us.
Our contract logistics operations can require a significant commitment of capital in the form of shelving, racking and other warehousing systems that may be required to implement warehouse-management services for our customers. In the event that we are not able to fully amortize the associated cost of capital across the term of the related customer agreement, or to the extent that the customer defaults on its obligations under the agreement, we could be forced to take a significant loss on the unrecovered portion of this capital cost.
Anticipated synergies from any acquisitions that we have undertaken may not materialize in the expected timeframe or at all.
Our financial targets are dependent on our ability to realize significant ongoing synergies with respect to our acquisitions, in particular the Norbert Dentressangle SA (“ND”) and Con-way Inc. (“Con-way”) acquisitions we completed in 2015. In addition, we anticipate creating value through synergy opportunities in future acquisitions that we may undertake. We may not realize all synergies we anticipate from past and potential future acquisitions. Among the synergies that we currently expect are cross-selling opportunities to our existing customers, network synergies and other operational synergies. Our estimated synergies from the acquisitions that we have undertaken are, and synergies we may announce related to potential future acquisitions, if any, will be subject to a number of assumptions about the timing, execution and costs associated with realizing such synergies as well as the capacity of
14
our information technology systems and other infrastructure to accommodate the demands of our new acquisitions. Such assumptions are inherently uncertain and are subject to a wide variety of significant business, economic, competition and execution risks and uncertainties. There can be no assurance that such assumptions will turn out to be correct and, as a result, the amount of synergies that we will actually realize and/or the timing of any such realization may differ significantly (and may be significantly lower) from the ones that we estimate, and we may incur significant costs in reaching the estimated synergies.
Our past acquisitions, as well as any acquisitions that we may complete in the future, may be unsuccessful or result in other risks or developments that adversely affect our financial condition and results.
While we intend for our acquisitions to improve our competitiveness and profitability, we cannot be certain that our past or future acquisitions will be accretive to earnings or otherwise meet our operational or strategic expectations. Acquisitions involve special risks, including accounting, regulatory, compliance, information technology or human resources issues that could arise in connection with, or as a result of, the acquisition of the acquired company, the assumption of unanticipated liabilities and contingencies, difficulties in integrating acquired businesses, possible management distraction, and the inability of acquired businesses to achieve the levels of revenue, profit, productivity or synergies we anticipate or otherwise perform as we expect on the timeline contemplated. We are unable to predict all of the risks that could arise as a result of our acquisitions.
If the performance of our reporting units or an acquired business varies from our projections or assumptions, or estimates about the future profitability of our reporting units or an acquired business change, our revenues, earnings or other aspects of our financial condition could be adversely affected. We may also experience difficulties in connection with integrating any acquired companies into our existing businesses and operations, including our existing infrastructure and information technology systems. The infrastructure and information technology systems of acquired businesses could present issues which we were not able to identify prior to the acquisition that could adversely affect our financial condition and results, and we have experienced challenges of this nature relating to the infrastructure and systems of our businesses that we recently acquired. Any of these events could adversely affect our financial condition and results of operations.
We may not successfully manage our growth.
We have grown rapidly and substantially over prior years, including by expanding our internal resources, making acquisitions, in particular in 2015, and entering into new markets, and we intend to continue to focus on rapid growth, including organic growth and additional acquisitions. We may experience difficulties and higher-than-expected expenses in executing this strategy as a result of unfamiliarity with new markets, changes in revenue and business models, entering into new geographic areas and increased pressure on our existing infrastructure and information technology systems.
Our growth will place a significant strain on our management, operational, financial and information technology resources. We will need to continually improve existing procedures and controls as well as implement new transaction processing, operational and financial systems, and procedures and controls to expand, train and manage our employee base. Our working capital needs will continue to increase as our operations grow. Failure to manage our growth effectively, or obtain necessary working capital, could have a material adverse effect on our business, results of operations, cash flows, stock price and financial condition.
Our business will be seriously harmed if we fail to develop, implement, maintain, upgrade, enhance, protect and integrate our information technology systems, including those systems of any businesses that we acquire.
We rely heavily on our information technology systems to efficiently run our business, and they are a key component of our customer-facing and internal growth strategy. In general, we expect our customers to continue to demand more sophisticated, fully integrated information systems from their transportation and logistics providers. To keep pace with changing technologies and customer demands, we must correctly interpret and address market trends and enhance the features and functionality of our proprietary technology platform in response to these trends. This process of continuous enhancement may lead to significant ongoing software development costs which will continue to increase if we pursue new acquisitions of companies and their current systems. In addition, we may fail to accurately determine the needs of our customers or trends in the transportation services and logistics industries or we may fail to design and implement the appropriate responsive features and functionality for our technology
15
platform in a timely and cost-effective manner. Any such failures could result in decreased demand for our services and a corresponding decrease in our revenues.
We must maintain and enhance the reliability and speed of our information technology systems to remain competitive and effectively handle higher volumes of freight through our network and the various service modes we offer. If our information technology systems are unable to manage additional volume for our operations as our business grows, or if such systems are not suited to manage the various service modes we offer, our service levels and operating efficiency could decline. In addition, if we fail to hire and retain qualified personnel to implement, protect and maintain our information technology systems or if we fail to upgrade our systems to meet our customers’ demands, our business and results of operations could be seriously harmed. This could result in a loss of customers or a decline in the volume of freight we receive from customers.
We are developing proprietary information technology for all of our business segments. Our technology may not be successful or may not achieve the desired results and we may require additional training or different personnel to successfully implement this technology. Our technology development process may be subject to cost overruns or delays in obtaining the expected results, which may result in disruptions to our operations.
A failure of our information technology infrastructure or a breach of our information security systems, networks or processes may materially adversely affect our business.
The efficient operation of our business depends on our information technology systems. We rely on our information technology systems to effectively manage our sales and marketing, accounting and financial and legal and compliance functions, engineering and product development tasks, research and development data, communications, supply chain, order entry and fulfillment and other business processes. We also rely on third parties and virtualized infrastructure to operate and support our information technology systems. Despite testing, external and internal risks, such as malware, insecure coding, “Acts of God,” data leakage and human error pose a direct threat to the stability or effectiveness of our information technology systems and operations. The failure of our information technology systems to perform as we anticipate has in the past, and could in the future, adversely affect our business through transaction errors, billing and invoicing errors, internal recordkeeping and reporting errors, processing inefficiencies and loss of sales, receivables collection and customers, in each case, which could result in harm to our reputation and have an ongoing adverse impact on our business, results of operations and financial condition, including after the underlying failures have been remedied.
We may also be subject to cybersecurity attacks and other intentional hacking. Any failure to identify and address such defects or errors or prevent a cyber-attack could result in service interruptions, operational difficulties, loss of revenues or market share, liability to our customers or others, the diversion of corporate resources, injury to our reputation and increased service and maintenance costs. Addressing such issues could prove to be impossible or very costly and responding to resulting claims or liability could similarly involve substantial cost. In addition, recently, there has also been heightened regulatory and enforcement focus on data protection in the U.S. and abroad (particularly in the European Union), and failure to comply with applicable U.S. or foreign data protection regulations or other data protection standards may expose us to litigation, fines, sanctions or other penalties, which could harm our reputation and adversely impact our business, results of operations and financial condition.
Our substantial indebtedness could adversely affect our financial condition.
We have substantial outstanding indebtedness, which could:
• | negatively affect our ability to pay principal and interest on our debt or dividends on our Series A Preferred Stock; |
• | increase our vulnerability to general adverse economic and industry conditions; |
• | limit our ability to fund future capital expenditures and working capital, to engage in future acquisitions or development activities, or to otherwise realize the value of our assets and opportunities fully because of the need to dedicate a substantial portion of our cash flow from operations to payments of interest and principal or to comply with any restrictive terms of our debt; |
• | limit our flexibility in planning for, or reacting to, changes in our business and the industry in which we operate; |
16
• | impair our ability to obtain additional financing or to refinance our indebtedness in the future; and |
• | place us at a competitive disadvantage compared to our competitors that may have proportionately less debt. |
Our inability to generate sufficient cash flows to satisfy our debt obligations, or to refinance our indebtedness on commercially reasonable terms or at all, could materially and adversely affect our financial position and results of operations. Further, failure to comply with the covenants under our indebtedness may have a material adverse impact on our operations. If we fail to comply with the covenants under any of our indebtedness, and are unable to obtain a waiver or amendment, such failure may result in an event of default under our indebtedness. We may not have sufficient liquidity to repay or refinance our indebtedness if such indebtedness were accelerated upon an event of default.
Under the terms of our outstanding indebtedness, we may not be able to incur substantial additional indebtedness in the future, which could further exacerbate the risks described above.
The execution of our strategy could depend on our ability to raise capital in the future, and our inability to do so could prevent us from achieving our growth objectives.
We may in the future be required to raise capital through public or private financing or other arrangements in order to pursue our growth strategy or operate our businesses. Such financing may not be available on acceptable terms, or at all, and our failure to raise capital when needed could harm our business or ability to execute our strategy. Further debt financing may involve restrictive covenants and could reduce our profitability. If we cannot raise funds on acceptable terms, we may not be able to grow our business or respond to competitive pressures.
We depend on third-parties in the operation of our business.
In our global forwarding, last mile, intermodal and freight brokerage operations, we do not own or control the transportation assets that deliver our customers’ freight, and we do not employ the people directly involved in delivering this freight. In addition, in our freight brokerage businesses (particularly our last mile delivery logistics operations, our over-the-road expedite operations and our intermodal drayage operations), we engage independent contractors who own and operate their own equipment. Accordingly, we are dependent on third-parties to provide truck, rail, ocean, air and other transportation services and to report certain events to us, including delivery information and cargo claims. This reliance on third-parties could cause delays in reporting certain events, including our ability to recognize revenue and claims in a timely manner.
Our inability to maintain positive relationships with independent transportation providers could significantly limit our ability to serve our customers on competitive terms. If we are unable to secure sufficient equipment or other transportation services to meet our commitments to our customers or provide our services on competitive terms, our operating results could be materially and adversely affected and our customers could shift their business to our competitors temporarily or permanently. Our ability to secure sufficient equipment or other transportation services to meet our commitments to our customers or provide our services on competitive terms is subject to inherent risks, many of which are beyond our control, including the following:
• | Equipment shortages in the transportation industry, particularly among contracted truckload carriers and railroads; |
• | Interruptions in service or stoppages in transportation as a result of labor disputes, seaport strikes, network congestion, weather-related issues, “Acts of God,” or acts of terrorism; |
• | Changes in regulations impacting transportation; |
• | Increases in operating expenses for carriers, such as fuel costs, insurance premiums and licensing expenses, that result in a reduction in available carriers; and |
• | Changes in transportation rates. |
17
Increases in driver compensation and difficulties attracting and retaining drivers could adversely affect our revenues and profitability.
Our LTL and full truckload operations are conducted primarily with employee drivers. Recently, there has been intense competition for qualified drivers in the transportation industry due to a shortage of drivers. The availability of qualified drivers may be affected from time to time by changing workforce demographics, competition from other transportation companies and industries for employees, the availability and affordability of driver training schools, changing industry regulations, and the demand for drivers in the labor market. If the industry-wide shortage of qualified drivers continues, these business lines will likely continue to experience difficulty in attracting and retaining enough qualified drivers to fully satisfy customer demands. As a result of the current highly-competitive labor market for drivers, our LTL and full truckload operations may be required to increase driver compensation and benefits in the future, or face difficulty meeting customer demands, all of which could adversely affect our profitability. Additionally, a shortage of drivers could result in the underutilization of our truck fleet, lost revenue, increased costs for purchased transportation or increased costs for driver recruitment.
Increases in independent contractor driver compensation or other difficulties attracting and retaining qualified independent contractor drivers could adversely affect our profitability and ability to maintain or grow our independent contractor driver fleet.
Our freight brokerage and intermodal businesses operate through fleets of vehicles that are owned and operated by independent contractors. Our last mile business also operates through a fleet of independent contract carriers that supply their own vehicles, drivers and helpers. These independent contractors are responsible for maintaining and operating their own equipment and paying their own fuel, insurance, licenses and other operating costs. Turnover and bankruptcy among independent contractor drivers often limit the pool of qualified independent contractor drivers and increase competition for their services. In addition, regulations such as the FMCSA Compliance Safety Accountability program may further reduce the pool of qualified independent contractor drivers. Thus, our continued reliance on independent contractor drivers could limit our ability to grow our ground transportation fleet.
We are currently experiencing, and expect to continue to experience from time to time in the future, difficulty in attracting and retaining sufficient numbers of qualified independent contractor drivers. Additionally, our agreements with independent contractor drivers are terminable by either party upon short notice and without penalty. Consequently, we regularly need to recruit new qualified independent contractor drivers to replace those who have left our fleet. If we are unable to retain our existing independent contractor drivers or recruit new independent contractor drivers, our business and results of operations could be adversely affected.
The compensation we offer our independent contractor drivers is subject to market conditions and we may find it necessary to continue to increase independent contractor drivers’ compensation in future periods. If we are unable to continue to attract and retain a sufficient number of independent contractor drivers, we could be required to increase our mileage rates and accessorial pay or operate with fewer trucks and face difficulty meeting shipper demands, all of which would adversely affect our profitability and ability to maintain our size or to pursue our growth strategy.
Our business may be materially adversely affected by labor disputes.
Our business in the past has been and in the future could be adversely affected by strikes and labor negotiations affecting seaports, labor disputes between railroads and their union employees, or by a work stoppage at one or more railroads or local trucking companies servicing rail or port terminals, including work disruptions involving owner operators under contract with our local trucking operations. Port shutdowns and similar disruptions to major points in national or international transportation networks, most of which are beyond our control, could result in terminal embargoes, disrupt equipment and freight flows, depress volumes and revenues, increase costs and have other negative effects on our operations and financial results.
Labor disputes involving our customers could affect our operations. If our customers are unable to negotiate new labor contracts and our clients’ plants experience slowdowns or closures as a result, our revenue and profitability could be negatively impacted. In particular, our Logistics segment derives a substantial portion of its revenue from the operation and management of operating facilities, which are often located in close proximity to a client’s manufacturing plant and are integrated into the client’s production line process. We may experience significant revenue loss and shut-down costs, including costs related to early termination of leases, causing our business to
18
suffer if clients are affected by strikes or other labor disputes, close their plants or significantly modify their capacity or supply chains at a plant that our Logistics segment services.
XPO Logistics Europe’s business activities require a significant amount of labor, which represents one of its most significant costs, and it is essential that we maintain good relations with employees, trade unions and other staff representative institutions. A deteriorating economic environment may result in tensions in industrial relations, which may lead to industrial action within our European operations that could have a direct impact on our business operations. Generally, any deterioration in industrial relations in our European operations could have an adverse effect on our revenues, earnings, financial position, and outlook.
Efforts by labor organizations to organize employees at certain locations in North America, if successful, may result in increased costs and decreased efficiencies at those locations.
Since 2014, in the United States, the International Brotherhood of Teamsters (“Teamsters”) has attempted to organize employees at several of the Company’s LTL locations and one supply chain location. Additionally, the International Association of Machinists (“Machinists”) has attempted to organize a small number of mechanics at two LTL maintenance shops. The majority of employees involved in those organizing efforts rejected union representation. As of January 31, 2018, approximately 135 employees at three LTL locations have voted for Teamsters representation and the results of those three elections have been certified by the National Labor Relations Board. At one LTL location, the parties have been in negotiations for an initial contract since February 2015. At the remaining two locations, the parties began negotiations during the course of 2017. In addition, as of January 31, 2018, an aggregate of approximately 77 employees at three additional LTL locations have voted for Teamsters representation, and approximately 8 employees at one LTL location have voted for Machinists representation. We are contesting the results of these four elections. Also, in October 2017, a majority of the employees of the Company’s supply chain location that had previously voted for Teamsters representation petitioned the Company to withdraw recognition of the Teamsters as the employees’ representative and the Company withdrew this recognition. We cannot predict with certainty whether further organizing efforts may result in the unionization of any additional locations domestically. If successful, these efforts may result in increased costs and decreased efficiencies at the specific locations where representation is elected. We do not expect the impact, if any, to extend to our larger organization or the service of our customer base.
Certain of our businesses rely on owner-operators and contract carriers to conduct their operations, and the status of these parties as independent contractors, rather than employees, is being challenged.
We are involved in numerous lawsuits, including putative class action lawsuits, multi-plaintiff and individual lawsuits, and state tax and other administrative proceedings that claim that our contract carriers or owner-operators or their drivers should be treated as our employees, rather than independent contractors, or that certain of our drivers were not paid for all compensable time or were not provided with required meal or rest breaks. These lawsuits and proceedings may seek substantial monetary damages (including claims for unpaid wages, overtime, failure to provide meal and rest periods, unreimbursed business expenses and other items), injunctive relief, or both. In addition, we incur certain costs, including legal fees, in defending the status of these parties as independent contractors.
While we believe that our contract carriers and owner-operators and their drivers are properly classified as independent contractors rather than as employees, adverse decisions have been rendered recently in certain cases pending against us, including with respect to class certification of certain contract carriers and determinations that certain of our contract carriers and owner-operators are improperly classified. Certain of these decisions are subject to appeal, but we cannot provide assurance that we will determine to pursue any appeal or that any such appeal will be successful. Adverse final outcomes in these matters could, among other things, entitle certain of our contract carriers and owner-operators and their drivers to reimbursement with respect to certain expenses and to the benefit of wage-and-hour laws and result in employment and withholding tax and benefit liability for us, and could result in changes to the independent contractor status of our contract carriers and owner-operators. Changes to state laws governing the definition of independent contractors could also impact the status of our contract carriers and owner-operators. Adverse final outcomes in these matters or changes to state laws could cause us to change our business model, which could have a material adverse effect on our business strategies, financial condition, results of operations or cash flows. These claims involve potentially significant classes that could involve thousands of
19
claimants and, accordingly, significant potential damages and litigation costs, and could lead others to bring similar claims.
The results of these matters cannot be predicted with certainty and an unfavorable resolution of one or more of these matters could have a material adverse effect on our financial condition, results of operations or cash flows.
Our overseas operations subject us to various operational and financial risks which could adversely affect our business.
The services we provide outside of the United States subject us to risks resulting from changes in tariffs, trade restrictions, trade agreements, tax policies, difficulties in managing or overseeing foreign operations and agents, different liability standards, issues related to compliance with anti-corruption laws such as the Foreign Corrupt Practices Act and the U.K. Bribery Act, data protection, trade compliance, and intellectual property laws of countries which do not protect our rights in our intellectual property, including our proprietary information systems, to the same extent as the laws of the United States. The occurrence or consequences of any of these factors may restrict our ability to operate in the affected region and/or decrease the profitability of our operations in that region. As we expand our business in foreign countries, we will also be exposed to increased risk of loss from foreign currency fluctuations and exchange controls.
Our European business heavily relies on subcontracting and we use a large number of temporary employees in these operations. Any failure to properly manage our subcontractors or temporary employees in Europe could have a material adverse impact on XPO Logistics Europe’s revenues, earnings, financial position and outlook.
We operate in Europe through our majority-owned subsidiary, XPO Logistics Europe SA. Subcontracting plays a key role in our European operations and we subcontract approximately 40% of our transport operations in the region. As a result, we are exposed to various risks related to managing our subcontractors, such as the risk that they do not fulfill their assignments in a satisfactory manner or within the specified deadlines. Such failures could compromise our ability to fulfill our commitments to our customers, comply with applicable regulations or otherwise meet our customers’ expectations. In some situations, the poor execution of services by our subcontractors could result in a customer terminating a contract. Such failures by our subcontractors could harm our reputation and ability to win new business and could lead to our being liable for contractual damages. Furthermore, in the event of a failure by our subcontractors to fulfill their assignments in a satisfactory manner, we could be required to perform unplanned work or additional services in line with the contracted service, without receiving any additional compensation. Lastly, some of our subcontractors in Europe may not be insured, or may not have sufficient resources available to handle any claims from customers resulting from potential damage and losses relating to their performance of services on our behalf. As a result, the non-compliance by our subcontractors with their contractual or legal obligations may have a material adverse effect on our business and financial condition.
XPO Logistics Europe also makes significant use of temporary staff. We cannot guarantee that temporary employees are as well-trained as our other employees. Specifically, we may be exposed to the risk that temporary employees may not perform their assignments in a satisfactory manner or may not comply with our safety rules in an appropriate manner, whether as a result of their lack of experience or otherwise. If such risks materialize, they could have a material adverse effect on our business and financial condition.
We are involved in multiple lawsuits and are subject to various claims that could result in significant expenditures and impact our operations.
The nature of our business exposes us to the potential for various types of claims and litigation. In addition to the matters described in the risk factor “Certain of our businesses rely on owner-operators and contract carriers to conduct their operations, and the status of these parties as independent contractors, rather than employees, is being challenged,” we are subject to claims and litigation related to labor and employment, personal injury, traffic accidents, cargo and other property damage, business practices, environmental liability and other matters, including with respect to claims asserted under various theories of agency and employer liability notwithstanding our independent contractor relationships with our transportation providers. Claims against us may exceed the amount of insurance coverage that we have, or may not be covered by insurance at all. Businesses that we acquire also increase our exposure to litigation. A material increase in the frequency or severity of accidents, liability claims, or workers’ compensation claims, or the unfavorable resolution of claims, or our failure to recover, in full or in part, under
20
indemnity provisions with transportation providers could materially and adversely affect our operating results. In addition, significant increases in insurance costs or the inability to purchase insurance as a result of these claims could reduce our profitability.
An increase in the number and/or severity of self-insured claims or an increase in insurance premiums could have an adverse effect on us.
We use a combination of self-insurance programs and large-deductible purchased insurance to provide for the costs of employee medical, vehicular, cargo and workers’ compensation claims. Our estimated liability for self-retained insurance claims reflects certain actuarial assumptions and judgments, which are subject to a high degree of variability. We periodically evaluate the level of insurance coverage and adjust insurance levels based on targeted risk tolerance and premium expense. An increase in the number and/or severity of self-insured claims or an increase in insurance premiums could have an adverse effect on us. In addition, the cost of providing benefits under our medical plans is dependent on a variety of factors, including governmental laws and regulations, health care cost trends, claims experience and health care decisions by plan participants. As a result, we are unable to predict how the cost of providing benefits under medical plans will affect our financial condition, results of operations or cash flows.
We are subject to risks associated with defined benefit plans for our current and former employees, which could have a material adverse effect on our earnings and financial position.
Following our acquisitions of ND and Con-way, we now maintain defined benefit pension plans and a postretirement medical plan. Our defined benefit pension plans include funded and unfunded plans in the United States and the United Kingdom. A decline in interest rates and/or lower returns on funded plan assets may cause increases in the expense and funding requirements for these defined benefit pension plans and for our postretirement medical plan. Despite past amendments that froze our defined benefit pension plans to new participants and curtailed benefits, these pension plans remain subject to volatility associated with interest rates, inflation, returns on plan assets, other actuarial assumptions and statutory funding requirements. In addition to being subject to volatility associated with interest rates, our postretirement medical plan remains subject to volatility associated with actuarial assumptions and trends in healthcare costs. Any of the aforementioned factors could lead to a significant increase in the expense of these plans and a deterioration in the solvency of these plans, which could significantly increase the Company’s contribution requirements. As a result, we are unable to predict the effect on our financial statements associated with our defined benefit pension plans and our postretirement medical plan.
Because of our floating rate credit facilities, we may be adversely affected by interest rate changes.
Both the Second Amended and Restated Revolving Loan Credit Agreement, as amended (the “ABL Facility”), and the senior secured term loan credit agreement, as amended (the “Term Loan Facility”), provide for an interest rate based on London Interbank Offered Rate (“LIBOR”) or a Base Rate, as defined in the agreements, plus an applicable margin. Our European trade receivables securitization program (the “Receivables Securitization Program”) provides for an interest rate at lenders’ cost of funds plus an applicable margin. Our financial position may be affected by fluctuations in interest rates since the ABL Facility, Term Loan Facility and Receivables Securitization Program are subject to floating interest rates. Refer to Item 7A. Quantitative and Qualitative Disclosures about Market Risk for the impact on interest expense of a hypothetical 100 basis point increase in the interest rate. Interest rates are highly sensitive to many factors, including governmental monetary policies, domestic and international economic and political conditions and other factors beyond our control. A significant increase in interest rates could have an adverse effect on our financial position and results of operations.
We are exposed to currency exchange rate fluctuations because a significant proportion of our assets, liabilities and earnings are denominated in foreign currencies.
We present our financial statements in U.S. dollars but we have a significant proportion of our net assets and income in non-U.S. dollar currencies, primarily the euro and pounds sterling (“GBP”). Consequently, a depreciation of non-U.S. dollar currencies relative to the U.S. dollar could have an adverse impact on our financial results as further discussed below under Item 7A. Quantitative and Qualitative Disclosures about Market Risk.
21
The economic uncertainties relating to eurozone monetary policies may cause the value of the euro to fluctuate against other currencies. Currency volatility contributes to variations in our sales of products and services in impacted jurisdictions. For example, in the event that one or more European countries were to replace the euro with another currency, our sales into such countries, or in Europe generally, would likely be adversely affected until stable exchange rates are established. Accordingly, fluctuations in currency exchange rates could adversely affect our business and financial condition and the business of the combined company.
The United Kingdom’s expected exit from the European Union could have a material adverse effect on our business and results of operations.
Following a referendum in June 2016 in which voters in the United Kingdom (“U.K.”) approved an exit from the European Union (“EU”), the U.K. government has initiated a process to leave the EU (often referred to as “Brexit”) and has begun negotiating the terms of the U.K.’s future relationship with the EU. The likely exit of the U.K. from the EU will have uncertain impacts on our transportation and logistics operations in Europe. In 2017, we derived approximately 37% of our revenue in Europe, including 12% in the U.K. Any adverse consequences of Brexit, such as a deterioration in the U.K.’s and/or EU’s economic condition, currency exchange rates, bilateral trade agreements or regulation of trade, including the potential imposition of tariffs, could reduce demand for our services in the U.K. and/or the EU, or otherwise have a negative impact on our operations, financial condition and results of operations.
We may not be able to successfully execute our growth strategy through acquisitions.
We intend to continue to expand through acquisitions to take advantage of market opportunities we perceive in the transportation and logistics industries, as well as new markets that we may enter. While we intend to make acquisitions in the future, we may experience delays or be unable to make the acquisitions we desire for a number of reasons. Suitable acquisition candidates may not be available at purchase prices that are attractive to us or on terms that are acceptable to us. In pursuing acquisition opportunities, we will compete with other companies, some of which have greater financial and other resources than we do.
We are unable to predict the size, timing and number of acquisitions we may complete and may not complete any acquisitions at all. In addition, we may incur expenses associated with sourcing, evaluating and negotiating acquisitions (including those that are not completed), and we also may pay fees and expenses associated with obtaining financing for acquisitions and with investment banks and others finding acquisitions for us. Any of these amounts may be substantial, and together with the size, timing and number of acquisitions we pursue, may negatively impact us and cause significant volatility in our financial results.
Sales or issuances of a substantial number of shares of our common stock may adversely affect the market price of our common stock.
We may fund any future acquisitions or our capital requirements from time to time, in whole or part, through sales or issuances of our common stock or equity-based securities, subject to prevailing market conditions and our financing needs. Future equity financing will dilute the interests of our then-existing stockholders, and future sales or issuances of a substantial number of shares of our common stock or other equity-related securities may adversely affect the market price of our common stock.
We do not own, and may not acquire, all of the outstanding shares of XPO Logistics Europe SA, the majority-owned subsidiary through which we conduct our European operations.
We currently own 86.25% of the outstanding shares of XPO Logistics Europe, the majority-owned subsidiary through which we conduct our European operations. We may not acquire the remaining shares of XPO Logistics Europe. French law only permits “squeeze out” mergers when a holder owns more than 95% of the outstanding shares. If we do not wholly-own XPO Logistics Europe, we will not have access to all of its cash flow to service our debt, as we will only receive a prorated portion of any dividend based on our ownership percentage. In addition, we will be subject to limitations on our ability to enter into transactions with XPO Logistics Europe that are not on arms-length terms, which could limit synergies that we could otherwise achieve between our North American and European operations. We also may not be able to consolidate XPO Logistics Europe with XPO Logistics France SAS, XPO’s 100% owned French holding company, for tax purposes. Moreover, XPO Logistics Europe would be forced to continue as a listed public company in France, thereby incurring certain recurring costs.
22
Volatility in fuel prices impacts our fuel surcharge revenues and may impact our profitability.
We are subject to risks associated with the availability and price of fuel, which are subject to political, economic and market factors that are outside of our control.
Fuel expense constitutes one of the greatest costs to our LTL and full truckload carrier operations, as well as to our fleet of independent contractor drivers and third-party transportation providers who complete the physical movement of freight arranged by our other business operations. Accordingly, we may be adversely affected by the timing and degree of fluctuations and volatility in fuel prices. As is customary in our industry, most of our customer contracts include fuel-surcharge revenue programs or cost-recovery mechanisms to mitigate the effect of the fuel price increase over base amounts established in the contract. However, these fuel surcharge mechanisms may not capture the entire amount of the increase in fuel prices, and they also feature a lag between the payment for fuel and collection of the surcharge revenue. Market pressures may limit our ability to assess fuel surcharges in the future. The extent to which we are able to recover in full for fuel cost changes may also vary depending on the degree to which we are not compensated due to empty and out-of-route miles or from engine idling during cold or warm weather.
Decreases in fuel prices reduce the cost of transportation services and accordingly, will reduce our revenues and may reduce margins for certain lines of business. Significant changes in the price or availability of fuel in future periods, or significant changes in our ability to mitigate fuel price increases through the use of fuel surcharges, could have a material adverse impact on our operations, fleet capacity and ability to generate both revenues and profits.
Extreme or unusual weather conditions can disrupt our operations, impact freight volumes, and increase our costs, all of which could have a material adverse effect on our business results.
Certain weather conditions such as floods, ice and snow can disrupt our operations. Increases in the cost of our operations, such as snow removal at our locations, towing and other maintenance activities, frequently occur during the winter months. Natural disasters such as hurricanes and flooding can also impact freight volumes and increase our costs.
Issues related to the intellectual property rights on which our business depends, whether related to our failure to enforce our own rights or infringement claims brought by others, could have a material adverse effect on our business, financial condition and results of operations.
We use both internally developed and purchased technology in conducting our business. Whether internally developed or purchased, it is possible that the user of these technologies could be claimed to infringe upon or violate the intellectual property rights of third parties. In the event that a claim is made against us by a third party for the infringement of intellectual property rights, any settlement or adverse judgment against us either in the form of increased costs of licensing or a cease and desist order in using the technology could have an adverse effect on us and our results of operations.
We also rely on a combination of intellectual property rights, including copyrights, trademarks, domain names, trade secrets, intellectual property licenses and other contractual rights, to establish and protect our intellectual property and technology. Any of our owned or licensed intellectual property rights could be challenged, invalidated, circumvented, infringed or misappropriated; our trade secrets and other confidential information could be disclosed in an unauthorized manner to third-parties or we may fail to secure the rights to intellectual property developed by our employees, contractors and others. Efforts to enforce our intellectual property rights may be time consuming and costly, distract management’s attention and resources and ultimately be unsuccessful. Moreover, our failure to develop and properly manage new intellectual property could adversely affect our market positions and business opportunities.
Our failure to obtain, maintain and enforce our intellectual property rights could therefore have a material adverse effect on our business, financial condition and results of operations.
We are subject to regulation, which could negatively impact our business.
Our operations are regulated and licensed by various governmental agencies in the United States and in foreign countries in which we operate. These regulatory agencies have authority and oversight of domestic and international transportation services and related activities, licensure, motor carrier operations, safety and security and other
23
matters. We must comply with various insurance and surety bond requirements to act in the capacities for which we are licensed. Our subsidiaries and independent contractors must also comply with applicable regulations and requirements of various agencies. Through our subsidiaries and business units, we hold various licenses required to carry out our domestic and international services. These licenses permit us to provide services as a motor carrier, property broker, indirect air carrier, OTI, NVOCC, freight forwarder, air freight forwarder, and ocean freight forwarder. We also are subject to regulations and requirements promulgated by, among others, the DOT, FMCSA, DHS, CBP, TSA, FMC, IATA, the Canada Border Services Agency and various other international, domestic, state, and local agencies and port authorities. Certain of our businesses engage in the transportation of hazardous materials, which subjects us to regulations with respect to transportation of such materials and environmental regulations in the case of any accidents that occur during the transportation of materials and result in discharge of such materials. Our failure to maintain our required licenses, or to comply with applicable regulations, could have a material adverse impact on our business and results of operations. See the “Regulation” section of this Annual Report on Form 10-K under the caption titled “Business” for more information.
In December 2010, the FMSCA established the CSA motor carrier oversight program under which drivers and fleets are evaluated based on certain safety-related standards. Carriers’ safety and fitness ratings under CSA include the on-road safety performance of the carriers’ drivers. The FMSCA has also implemented changes to the hours of service regulations which govern the work hours of commercial drivers and recently adopted a rule that requires commercial drivers who currently use paper log books to maintain hours-of-service records with ELDs by December 2017 and commercial drivers who use automatic on-board recording devices to adopt ELDs by December 2019. In addition, FMCSA has issued a final rule that mandates the use of ELDs in certain over-the-road commercial motor vehicles effective December 18, 2017. It is difficult to predict which and in what form CSA, the ELD mandate or any other FMCSA regulations may be modified or enforced and what impact any such regulation may have on motor carrier operations or the aggregate number of trucks that provide hauling capacity to the Company.
Future laws and regulations may be more stringent and require changes in our operating practices that influence the demand for transportation services or require us to incur significant additional costs. We are unable to predict the impact that recently enacted and future regulations may have on our businesses. Higher costs incurred by us, or incurred by our independent contractors or third-party transportation providers who pass the increased costs on to us, as a result of future new regulations could adversely affect our results of operations to the extent we are unable to obtain a corresponding increase in price from our customers.
Failure to comply with trade compliance laws and regulations applicable to our operations may subject us to liability and result in mandatory or voluntary disclosures to government agencies of transactions or dealings involving sanctioned countries, entities or individuals.
As a result of our acquisition activities, we acquired companies with business operations outside the U.S., some of which were not previously subject to certain U.S. laws and regulations, including trade sanctions administered by the U.S. Department of Treasury, Office of Foreign Assets Control (“OFAC”). In the course of implementing our compliance processes with respect to the operations of these acquired companies, we have identified a number of transactions or dealings involving countries and entities that are subject to U.S. economic sanctions. As disclosed in our reports filed with the SEC, we filed initial voluntary disclosure of such matters with OFAC in August 2016. We are continuing to investigate and intend to cooperate with regulatory authorities regarding these matters. We may, in the future, identify additional transactions or dealings involving sanctioned countries, entities, or individuals. The transactions or dealings that we have identified to date, or other transactions or dealings that we may identify in the future, could result in negative consequences to us, including government investigations, penalties and reputational harm.
Our Chairman and Chief Executive Officer controls a large portion of our stock and has substantial control over us, which could limit other stockholders’ ability to influence the outcome of key transactions, including changes of control.
Under applicable SEC rules, our Chairman and Chief Executive Officer, Mr. Bradley S. Jacobs, beneficially owns approximately 15% of our outstanding common stock as of December 31, 2017. This concentration of share ownership may adversely affect the trading price for our common stock because investors may perceive disadvantages in owning stock in companies with concentrated stockholders. Our preferred stock votes together with
24
our common stock on an “as-converted” basis on all matters, except as otherwise required by law, and separately as a class with respect to certain matters implicating the rights of holders of shares of the preferred stock. Accordingly, Mr. Jacobs can exert substantial influence over our management and affairs and matters requiring stockholder approval, including the election of directors and the approval of significant corporate transactions, such as mergers, consolidations or the sale of substantially all of our assets. Consequently, this concentration of ownership may have the effect of delaying or preventing a change of control, including a merger, consolidation, or other business combination involving us, or discouraging a potential acquirer from making a tender offer or otherwise attempting to obtain control, even if that change of control would benefit our other stockholders. Additionally, significant fluctuations in the levels of ownership of our largest stockholders, including shares beneficially owned by Mr. Jacobs, could impact the volume of trading, liquidity and market price of our common stock.
ITEM 1B. UNRESOLVED STAFF COMMENTS
None.
ITEM 2. PROPERTIES
As of December 31, 2017, XPO and its subsidiaries operated approximately 1,455 locations, primarily in North America and Europe, including approximately 200 locations owned or leased by our customers. These facilities are located in all 48 states of the contiguous United States as well as globally.
We lease our current executive office located in Greenwich, Connecticut, as well as our national operations center in Charlotte, North Carolina. As of December 31, 2017, we owned a shared-services center in Portland, Oregon and the facility at which we conduct a portion of our expedited transportation operations in Buchanan, Michigan. In addition, we owned 142 freight service centers for our LTL business and 42 properties throughout Europe. We believe that our facilities are sufficient for our current needs and are in good condition in all material respects.
ITEM 3. LEGAL PROCEEDINGS
We are involved, and will continue to be involved, in numerous legal proceedings arising out of the conduct of our business. These proceedings may include, among other matters, claims for property damage or personal injury incurred in connection with the transportation of freight, claims regarding anti-competitive practices, and employment-related claims, including claims involving asserted breaches of employee restrictive covenants and tortious interference with contract. These proceedings also include numerous purported class-action lawsuits, multi-plaintiff and individual lawsuits and state tax and other administrative proceedings that claim either that our owner operators or contract carriers should be treated as employees, rather than independent contractors, or that certain of our drivers were not paid for all compensable time or were not provided with required meal or rest breaks. We are currently engaged in several alleged independent contractor misclassification claims or other wage and hour claims involving certain companies that we have acquired in our last mile, LTL, and intermodal businesses. These lawsuits and proceedings may seek substantial monetary damages (including claims for unpaid wages, overtime, failure to provide meal and rest periods, unreimbursed business expenses and other items), injunctive relief, or both. For additional information about these matters, please refer to Note 16—Commitments and Contingencies of Item 8, “Financial Statements and Supplementary Data.”
We do not believe that the ultimate resolution of any matters to which we are presently party will have a material adverse effect on our results of operations, financial condition or cash flows. However, the results of these matters cannot be predicted with certainty, and an unfavorable resolution of one or more of these matters could have a material adverse effect on our financial condition, results of operations or cash flows.
ITEM 4. MINE SAFETY DISCLOSURES
Not applicable.
25
PART II
ITEM 5. MARKET FOR REGISTRANT’S COMMON EQUITY, RELATED STOCKHOLDER MATTERS AND ISSUER PURCHASES OF EQUITY SECURITIES
Price Range of Common Stock
Our common stock is listed on the NYSE under the symbol “XPO.” The table below provides the high and low closing sales prices for our common stock for the quarters included within 2017 and 2016.
2017 | |||||||||||||||
First | Second | Third | Fourth | ||||||||||||
High | $ | 52.54 | $ | 64.76 | $ | 67.78 | $ | 92.17 | |||||||
Low | 42.71 | 44.99 | 54.99 | 64.64 | |||||||||||
2016 | |||||||||||||||
First | Second | Third | Fourth | ||||||||||||
High | $ | 32.01 | $ | 33.89 | $ | 37.22 | $ | 49.35 | |||||||
Low | 19.56 | 23.30 | 24.43 | 32.17 | |||||||||||
As of February 7, 2018, there were approximately 201 record holders of our common stock, based upon data available to us from our transfer agent. We have never paid, and have no immediate plans to pay, cash dividends on our common stock. We currently plan to retain future earnings, if any, for use in the development of our business and to enhance stockholder value through growth and continued focus on improving profitability. In addition, our current credit agreement imposes, and we expect that any future credit agreement we enter into will impose, restrictions on our ability to pay cash dividends on our common stock. Accordingly, we do not anticipate paying any cash dividends on our common stock in the near future.
26
Stock Performance Graph
The graph below compares the cumulative 5-year total return of holders of our common stock with the cumulative total returns, including reinvestment of any dividends, of the Russell 2000 Index and the Dow Jones Transportation Average Index. The graph tracks the performance of a $100 investment in our common stock and in each index from December 31, 2012 to December 31, 2017.
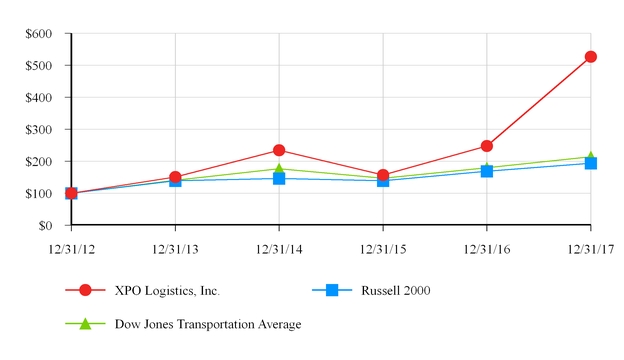
12/31/12 | 12/31/13 | 12/31/14 | 12/31/15 | 12/31/16 | 12/31/17 | ||||||||||||||||||
XPO Logistics, Inc. | $ | 100.00 | $ | 151.27 | $ | 235.21 | $ | 156.79 | $ | 248.33 | $ | 526.99 | |||||||||||
Russell 2000 | $ | 100.00 | $ | 138.82 | $ | 145.62 | $ | 139.19 | $ | 168.85 | $ | 193.58 | |||||||||||
Dow Jones Transportation Average | $ | 100.00 | $ | 141.38 | $ | 176.82 | $ | 147.19 | $ | 180.05 | $ | 214.30 | |||||||||||
Unregistered Sales of Equity Securities and Use of Proceeds
The Company did not have any unregistered sales of equity securities during the year ended December 31, 2017, except as previously disclosed in its Quarterly Reports on Form 10-Q.
27
ITEM 6. SELECTED FINANCIAL DATA
The following tables set forth our selected historical and quarterly consolidated financial data. During the periods presented, we made a number of acquisitions, including the 2015 acquisitions of Con-way and ND, and have included the results of operations of the acquired businesses from the date of acquisition. Additionally, we divested our North American Truckload operations in the fourth quarter of 2016. As a result, our period to period results of operations vary depending on the dates and sizes of these acquisitions and divestitures. Accordingly, this selected financial data is not necessarily comparable or indicative of our future results. This financial data should be read together with our Consolidated Financial Statements and related notes, Management’s Discussion and Analysis of Financial Condition and Results of Operations, and other financial data appearing elsewhere in this Annual Report.
As of or For the Years Ended December 31, | |||||||||||||||||||
(In millions, except per share data) | 2017 | 2016 | 2015 | 2014 | 2013 | ||||||||||||||
Operating Results: | |||||||||||||||||||
Revenue | $ | 15,380.8 | $ | 14,619.4 | $ | 7,623.2 | $ | 2,356.6 | $ | 702.3 | |||||||||
Operating income (loss) | 623.2 | 488.1 | (28.6 | ) | (40.9 | ) | (52.3 | ) | |||||||||||
Income (loss) before income taxes | 260.7 | 106.8 | (282.5 | ) | (89.7 | ) | (71.0 | ) | |||||||||||
Net income (loss)(1) | 360.2 | 84.5 | (191.6 | ) | (63.6 | ) | (48.5 | ) | |||||||||||
Net income (loss) attributable to common shareholders(2) | 312.4 | 63.1 | (245.9 | ) | (107.4 | ) | (51.5 | ) | |||||||||||
Per Share Data: | |||||||||||||||||||
Basic earnings (loss) per share | $ | 2.72 | $ | 0.57 | $ | (2.65 | ) | $ | (2.00 | ) | $ | (2.26 | ) | ||||||
Diluted earnings (loss) per share | 2.45 | 0.53 | (2.65 | ) | (2.00 | ) | (2.26 | ) | |||||||||||
Weighted-average common shares outstanding | |||||||||||||||||||
Basic | 114.9 | 110.2 | 92.8 | 53.6 | 22.8 | ||||||||||||||
Diluted | 127.8 | 122.8 | 92.8 | 53.6 | 22.8 | ||||||||||||||
Financial Position: | |||||||||||||||||||
Total assets | $ | 12,601.6 | $ | 11,698.4 | $ | 12,643.2 | $ | 2,749.4 | $ | 777.1 | |||||||||
Long-term debt, less current portion | 4,417.5 | 4,731.5 | 5,272.6 | 580.3 | 178.6 | ||||||||||||||
Preferred stock | 41.2 | 41.6 | 42.0 | 42.2 | 42.7 | ||||||||||||||
Total equity | 4,010.0 | 3,037.6 | 3,060.8 | 1,655.1 | 455.9 | ||||||||||||||
(1) | As discussed further in Item 7 “Management’s Discussion and Analysis of Financial Condition and Results of Operations,” our net income for 2017 included a $173.1 million benefit related to the revaluation of our net deferred tax liabilities as a result of the “H.R.1”, formally known as the Tax Cuts and Jobs Act (the “Act”). |
(2) | Net loss attributable to common shareholders for the years ended December 31, 2015 and December 31, 2014 reflect beneficial conversion charges of $52.0 million on the Series C Preferred Stock and $40.9 million on the Series B Preferred Stock, respectively, that were recorded as deemed distributions during the third quarter of 2015 and the fourth quarter of 2014, respectively. |
28
The Company’s unaudited results of operations for each of the quarters in the years ended December 31, 2017 and 2016 are summarized below:
(In millions, except per share data) | First Quarter | Second Quarter | Third Quarter | Fourth Quarter(2)(3) | ||||||||||||
2017 | ||||||||||||||||
Revenue | $ | 3,539.5 | $ | 3,760.3 | $ | 3,887.1 | $ | 4,193.9 | ||||||||
Operating income | 113.6 | 185.0 | 186.8 | 137.8 | ||||||||||||
Net income | 24.9 | 57.2 | 71.0 | 207.1 | ||||||||||||
Net income attributable to common shareholders(1) | 19.5 | 47.6 | 57.5 | 188.5 | ||||||||||||
Basic earnings per share(1) | 0.18 | 0.43 | 0.49 | 1.57 | ||||||||||||
Diluted earnings per share(1) | 0.16 | 0.38 | 0.44 | 1.42 | ||||||||||||
2016 | ||||||||||||||||
Revenue | $ | 3,545.7 | $ | 3,683.3 | $ | 3,713.8 | $ | 3,676.6 | ||||||||
Operating income | 62.4 | 170.3 | 168.8 | 86.6 | ||||||||||||
Net income (loss) | (19.3 | ) | 50.4 | 21.3 | 32.1 | |||||||||||
Net income (loss) attributable to common shareholders(1) | (23.2 | ) | 42.6 | 13.8 | 27.3 | |||||||||||
Basic earnings (loss) per share(1) | (0.21 | ) | 0.39 | 0.13 | 0.25 | |||||||||||
Diluted earnings (loss) per share(1) | (0.21 | ) | 0.35 | 0.11 | 0.22 | |||||||||||
(1) | The sum of the quarterly Net income (loss) attributable to common shareholders and earnings per share may not equal annual amounts due to differences in the weighted-average number of shares outstanding during the respective periods and the impact of the two-class method of calculating earnings per share. |
(2) | The fourth quarter of 2017 included a debt extinguishment loss of $22.4 million and a tax benefit of $173.1 million resulting from the enactment of the Act. |
(3) | The fourth quarter of 2016 included a debt extinguishment loss of $16.5 million. |
29
ITEM 7. | MANAGEMENT’S DISCUSSION AND ANALYSIS OF FINANCIAL CONDITION AND RESULTS OF OPERATIONS |
The Company is organized into two reportable segments: Transportation and Logistics. The Transportation segment provides freight brokerage, last mile, less-than-truckload (“LTL”), full truckload, and global forwarding services. The Logistics segment provides a range of contract logistics services, including highly engineered and customized solutions, value-added warehousing and distribution, cold chain logistics and other inventory solutions.
The Company’s chief executive officer, who is the chief operating decision maker (“CODM”), regularly reviews financial information at the reporting segment level in order to make decisions about resources to be allocated to the segments and to assess their performance. Segment results that are reported to the CODM include items directly attributable to a segment as well as those that can be allocated on a reasonable basis.
XPO Logistics, Inc.
Consolidated Summary Financial Table
For the Years Ended December 31,
Percent of Revenue | |||||||||||||||||||||
(Dollars in millions) | 2017 | 2016 | 2015 | 2017 | 2016 | 2015 | |||||||||||||||
Revenue | $ | 15,380.8 | $ | 14,619.4 | $ | 7,623.2 | 100.0 | % | 100.0 | % | 100.0 | % | |||||||||
Cost of transportation and services | 8,128.8 | 7,886.0 | 4,171.4 | 52.9 | % | 53.9 | % | 54.7 | % | ||||||||||||
Direct operating expense | 4,972.3 | 4,594.1 | 2,367.0 | 32.3 | % | 31.4 | % | 31.0 | % | ||||||||||||
SG&A expense | 1,656.5 | 1,651.2 | 1,113.4 | 10.8 | % | 11.3 | % | 14.6 | % | ||||||||||||
Operating income (loss) | 623.2 | 488.1 | (28.6 | ) | 4.0 | % | 3.4 | % | (0.3 | )% | |||||||||||
Other expense (income) | (15.4 | ) | (9.2 | ) | (7.6 | ) | (0.1 | )% | (0.1 | )% | (0.1 | )% | |||||||||
Foreign currency loss (gain) | 57.6 | (40.3 | ) | 44.8 | 0.4 | % | (0.3 | )% | 0.6 | % | |||||||||||
Debt extinguishment loss | 36.0 | 69.7 | — | 0.2 | % | 0.5 | % | — | % | ||||||||||||
Interest expense | 284.3 | 361.1 | 216.7 | 1.8 | % | 2.5 | % | 2.8 | % | ||||||||||||
Income (loss) before income tax provision (benefit) | 260.7 | 106.8 | (282.5 | ) | 1.7 | % | 0.8 | % | (3.6 | )% | |||||||||||
Income tax provision (benefit) | (99.5 | ) | 22.3 | (90.9 | ) | (0.6 | )% | 0.2 | % | (1.2 | )% | ||||||||||
Net income (loss) | $ | 360.2 | $ | 84.5 | $ | (191.6 | ) | 2.3 | % | 0.6 | % | (2.4 | )% | ||||||||
Consolidated Results
Year Ended December 31, 2017 Compared to Year Ended December 31, 2016
Our consolidated revenue for 2017 increased 5.2% to $15,380.8 million from $14,619.4 million in 2016. This increase was primarily driven by growth in our European contract logistics business, improvement in LTL weight per day, and growth in North American truck brokerage and Last Mile operations. These items were partially offset by the October 2016 divestiture of our North American truckload operation, which had revenue of $431.9 million in 2016.
The cost of transportation and services increased by 3.1% in 2017 to $8,128.8 million from $7,886.0 million in 2016. As a percentage of revenue, cost of transportation and services decreased to 52.9% in 2017 compared to 53.9% in 2016. The reduction as a percentage of revenue was primarily driven by a lower mix of managed transportation revenue in North American Supply Chain as well as a higher mix of contract logistics revenue in Europe, partially offset by higher third-party transportation costs in freight brokerage and Last Mile operations. Cost of transportation and services includes the cost of providing or procuring freight transportation services for XPO customers, salaries paid to employee drivers in our full truckload and LTL businesses, and commissions paid to independent station owners in our global forwarding business.
30
Direct operating expense for 2017 was $4,972.3 million, or 32.3% of revenue, compared to $4,594.1 million, or 31.4% of revenue, for 2016. The increase as a percentage of revenue was primarily driven by higher payroll and temporary labor expense to support growth in our contract logistics business as well as the sale of the truckload business. This was partially offset by the implementation of cost savings initiatives and improved dock efficiency in our U.S. LTL business. Direct operating expenses are both fixed and variable expenses and consist of operating costs related to our contract logistics facilities, last mile warehousing facilities, LTL service centers and European LTL network. Direct operating costs consist mainly of personnel costs, facility and equipment expenses such as rent, equipment maintenance and repair expenses, costs of materials and supplies, information technology expenses, depreciation expense and utilities and other facility related costs.
Sales, general and administrative expense (“SG&A”) was $1,656.5 million in 2017, or 10.8% of revenue, compared to $1,651.2 million, or 11.3% of revenue, in 2016. The improvement in SG&A as a percentage of revenue for 2017 primarily reflects savings from shared services, centralized procurement initiatives, lower professional services and consulting costs, and technology-enabled labor efficiencies in our North American brokerage and intermodal operations. SG&A consists of costs relating to customer acquisition, carrier procurement, billing, customer service, salaries and related expenses of the executive and administrative staff, acquisition-related costs, office expenses, technology services, professional fees and other purchased services relating to the aforementioned functions, and depreciation and amortization expense.
Foreign currency loss was $57.6 million in 2017 compared to foreign currency gain of $40.3 million in 2016. The loss in 2017 was primarily due to a $49.4 million loss on unrealized foreign currency option and forward contracts due to the strengthening of the Euro and the British Pound relative to the U.S. dollar. The gain in 2016 was primarily due to a $39.7 million gain on unrealized foreign currency option and forward contracts.
The debt extinguishment loss was $36.0 million in 2017 compared to $69.7 million in 2016. The loss in 2017 includes $8.3 million for the refinancing of the Company’s Term Loan facility, $22.4 million for the redemption of the Senior Notes due 2021 and $5.3 million for the redemption of the Senior Notes due 2018. The loss in 2016 includes $35.2 million from the redemption of the Senior Notes due 2019, $18.0 million from the refinancing of the Term Loan, and $16.5 million from the repurchase of Term Loan debt.
Interest expense for 2017 decreased 21.3% to $284.3 million from $361.1 million in 2016. The decrease in interest expense reflects the reduction in average total indebtedness and the lower rates attributable to our recent refinancings. The reduction in average total indebtedness reflects the benefit of utilizing the proceeds from the sale of our North American Truckload operation in October 2016 to repurchase $555.0 million of outstanding indebtedness.
The Company’s consolidated income before income tax for 2017 was $260.7 million, compared to $106.8 million for 2016. The increase compared to the prior year was driven by significantly higher operating income at both our Transportation and our Logistics segments, primarily due to revenue growth, cost saving initiatives and technology-enabled labor efficiencies, and reduced interest expense, partially offset by foreign currency losses. With respect to our U.S. operations, income before taxes increased by $348.0 million in comparison to the prior year reflecting a $126.9 million increase in foreign exchange gains, a $109.7 million decrease in borrowing costs, a $100.5 million increase in operating income, and a $10.9 million increase in other income. The income before tax of non-U.S. operations decreased by $194.1 million reflecting a $207.8 million increase in foreign exchange losses, which were partially offset by the gains in the U.S. due to our hedging strategies and naturally offsetting positions of intercompany loans between the U.S. and non-U.S. entities. The significant difference between U.S. income before tax of $278.2 million and non-U.S. loss before tax of $17.5 million reflects the fact that foreign exchange movements benefited our U.S. operations and negatively impacted our non-U.S. operations in 2017, however, the net effects to the total company were partially negated.
Our effective income tax rates in 2017 and 2016 were (38.2)% and 20.9%, respectively. The 2017 effective tax rate was impacted primarily by a $173.1 million tax benefit related to the Act, $17.5 million tax benefit due to differences between foreign tax rates and the U.S. tax rate, $13.3 million of incremental tax expense due to changes in uncertain tax positions, $9.8 million tax benefit due to the revaluation of deferred tax liabilities resulting from enacted tax law changes in France and Belgium that lowered the statutory tax rates, and $8.6 million of excess tax benefit from stock-based compensation. The 2016 effective tax rate was impacted primarily by a $13.1 million tax
31
benefit due to the revaluation of deferred tax liabilities resulting from an enacted tax law change in France that lowered the statutory tax rate and a $5.0 million tax benefit from stock-based compensation.
On December 22, 2017, the Act was signed and enacted into law. The Act provides for significant changes to the U.S. Internal Revenue Code of 1986, as amended (the “IRC”). The Act is generally applicable to corporations beginning January 1, 2018.
While the Company anticipates further regulatory guidance to be issued that may require additional detailed analysis to assess the actual impact of the Act, the Company has evaluated and analyzed the impact of various provisions in the Act on its operations and financial statements and has reached the following preliminary conclusions:
• | The reduction in the U.S. corporate federal statutory tax rate from 35% to 21% requires a one-time revaluation of our net deferred tax liabilities to reflect the benefit of the lower tax rate. |
• | The Company expects the benefit from applying the lower federal statutory tax rate to future U.S. earnings to be a material improvement to earnings per share and cash flow. |
• | The Act requires a one-time tax on the “mandatory deemed repatriation” of accumulated foreign earnings as of December 31, 2017. The Company does not expect to incur a tax liability on the mandatory repatriation. |
• | The Company does not expect to incur material U.S. tax liabilities from other Act provisions related to future foreign earnings such as the Base Erosion and Anti-Abuse Tax (“BEAT”) or the Global Intangible Low-Taxed Income (“GILTI”) provisions. |
• | The Act repealed the corporate alternative minimum tax (“AMT”) and allows a refund of existing AMT carryovers during the years 2018 through 2021. The Company has $6.2 million of AMT carryover of which $5.1 million is expected to be utilized against future regular income tax liabilities and the remaining $1.1 million is expected to be refunded. |
• | The Company expects to benefit from the provision in the Act that allows 100% expensing of qualified personal tangible property acquired through the year 2022. |
• | The Act contains many other complex provisions, such as limitations on the deductibility of interest expense and certain executive compensation. The Company does not expect these provisions to materially impact its financial results. |
The ultimate impact of the Act may differ from these preliminary conclusions due to changes in interpretations and assumptions made by the Company as well as additional regulatory guidance that may be issued. At this time, the Company believes all preliminary conclusions reported are reasonably estimated but may adjust them over time as more information becomes available. Future adjustments, if any, will be disclosed in its financial statements.
Year Ended December 31, 2016 Compared to Year Ended December 31, 2015
Our consolidated revenue for 2016 increased 91.8% to $14,619.4 million from $7,623.2 million in 2015. This increase was driven by the 2015 acquisitions of ND, Con-way, Bridge Terminal Transport Services, Inc. (“BTT”) and UX Specialized Logistics, LLC (“UX”), as well as organic growth. On October 30, 2015, XPO acquired Con-way, a leading provider of LTL and logistics services in the U.S., Europe and Asia. On June 8, 2015, XPO acquired a majority interest in ND, a leading provider of transportation and logistics services in Western Europe.
The increase in cost of transportation and services of 89.0% from 2015 to 2016 was primarily the result of the acquisitions of ND, Con-way and BTT. As a percentage of revenue, cost of transportation and services decreased to 53.9% in 2016 compared to 54.7% in 2015, primarily as a result of a shift in the mix of our business with a more significant component of our revenue being attributable to the LTL and European transportation service offerings following the acquisitions of ND and Con-way.
Direct operating expense for 2016 was $4,594.1 million, or 31.4% as a percentage of revenue, compared to $2,367.0 million, or 31.0% as a percentage of revenue, for 2015. Direct operating expense increased primarily due to the acquisitions of ND and Con-way and growth to support the last mile business.
32
SG&A increased to $1,651.2 million in 2016 from $1,113.4 million in 2015 primarily due to SG&A associated with acquisitions. SG&A as a percentage of revenue decreased to 11.3% in 2016 as compared to 14.6% in 2015. The decrease is attributable to a reduction in acquisition-related costs, a change in the mix of the Company’s business operations resulting from the acquisition of Con-way, and the cost saving measures being implemented as part of the integration of acquired businesses, particularly in our LTL service offering.
Foreign currency gain was $40.3 million in 2016 compared to foreign currency loss of $44.8 million in 2015. The gain in 2016 was primarily due to a $39.7 million gain on unrealized foreign currency option and forward contracts. The loss in 2015 was primarily due to $31.7 million foreign currency transaction and remeasurement losses on the cash held to purchase ND and a $9.7 million loss on the forward contract related to the ND acquisition.
The debt extinguishment loss of $69.7 million in 2016 includes $35.2 million from the redemption of the Senior Notes due 2019, $18.0 million from the refinancing of the Term Loan, and $16.5 million from the repurchase of Term Loan debt.
Interest expense for 2016 increased 66.6% to $361.1 million from $216.7 million in 2015. The increase in interest expense was primarily attributable to the increased indebtedness incurred by the Company in order to fund the 2015 acquisitions of Con-way and ND. Average total indebtedness increased approximately 72% from 2015 to 2016, consistent with the increase in interest expense.
The Company’s consolidated income before income tax provision for 2016 was income of $106.8 million, compared to a loss of $282.5 million for 2015. The increase compared to the prior year was driven by significantly higher operating income at both our Transportation and our Logistics segments, primarily due to our 2015 acquisitions of ND in June 2015 and Con-way in October 2015 and foreign currency gains, partially offset by higher interest expense and the 2016 debt extinguishment loss. With respect to our U.S. operations, loss before taxes decreased by $235.9 million in comparison to the prior year reflecting the full year impact of our acquisition of Con-way, partially offset by increased interest expense due to higher average debt balances. Our non-U.S. operations’ income before tax increased by $153.4 million reflecting the full year impact of our acquisition of ND. The significant difference between our U.S. loss before tax of $69.8 million and non-U.S. income before income tax of $176.6 million reflects the fact that substantially all of the financing costs associated with debt we have issued to finance our operations and fund acquisitions is reflected within our U.S. results.
Our effective income tax rates in 2016 and 2015 were 20.9% and 32.2%, respectively. The 2016 effective tax rate was impacted primarily by a revaluation of deferred tax liabilities resulting from an enacted tax law change in France that lowered the statutory tax rate and tax benefits from stock-based compensation. The 2015 effective tax rate was impacted primarily by a pretax book loss and changes in the geographic earnings mix. For both periods, the effective income tax rates reflect the Company’s intention to permanently reinvest earnings of its foreign subsidiaries.
Transportation
Summary Financial Table
For the Years Ended December 31,
Percent of Revenue | |||||||||||||||||||||
(Dollars in millions) | 2017 | 2016 | 2015 | 2017 | 2016 | 2015 | |||||||||||||||
Revenue | $ | 9,820.5 | $ | 9,457.3 | $ | 4,924.4 | 100.0 | % | 100.0 | % | 100.0 | % | |||||||||
Operating income | 538.8 | 438.0 | 51.6 | 5.5 | % | 4.6 | % | 1.1 | % | ||||||||||||
Note: Total depreciation and amortization for the Transportation segment included in cost of transportation and services, direct operating expense and SG&A was $439.4 million, $449.1 million and $226.5 million for the years ended December 31, 2017, 2016, and 2015, respectively.
33
Transportation
Year Ended December 31, 2017 Compared to Year Ended December 31, 2016
Revenue in our Transportation segment increased by 3.8% to $9,820.5 million in 2017 compared to $9,457.3 million in 2016. The increase was primarily driven by 16.6% revenue growth in our U.S. last mile service offering; 16.8% growth in U.S. freight brokerage; and a 5.1% increase in weight per day within our U.S. LTL business. The impact of these items was partially offset by the divestiture of our North American truckload operations, which had revenue of $431.9 million in 2016, and lower revenue in global forwarding.
Operating income increased in 2017 to $538.8 million, compared to $438.0 million in 2016. The improvement was driven primarily by: strong revenue growth; a reduction in direct operating expenses due to the implementation of cost savings initiatives and improved dock efficiency in the U.S. LTL business; and lower SG&A from centralized support functions in the European transportation business and technology-enabled labor efficiencies in our North American brokerage and intermodal operations. This was partially offset by the sale of the North American truckload operations.
Year Ended December 31, 2016 Compared to Year Ended December 31, 2015
Revenue in our Transportation segment increased by 92.0% to $9,457.3 million in 2016 compared to $4,924.4 million in 2015. This increase was driven largely by the acquisitions of ND, Con-way, BTT and UX, as well as organic growth led by the last mile business.
Operating income increased in 2016 to $438.0 million, compared to $51.6 million in 2015. The improvement was driven by revenue growth, partially offset by an increase in direct operating expense due to acquisitions and growth to support the last mile business and an increase in SG&A associated with new acquisitions and transaction and integration costs.
Logistics
Summary Financial Table
For the Years Ended December 31,
Percent of Revenue | |||||||||||||||||||||
(Dollars in millions) | 2017 | 2016 | 2015 | 2017 | 2016 | 2015 | |||||||||||||||
Revenue | $ | 5,722.7 | $ | 5,323.9 | $ | 2,768.4 | 100.0 | % | 100.0 | % | 100.0 | % | |||||||||
Operating income | 249.2 | 209.5 | 81.6 | 4.5 | % | 4.0 | % | 3.0 | % | ||||||||||||
Note: Total depreciation and amortization for the Logistics segment included in cost of transportation and services, direct operating expense and SG&A was $211.0 million, $192.3 million and $136.9 million for the years ended December 31, 2017, 2016 and 2015, respectively.
Logistics
Year Ended December 31, 2017 Compared to Year Ended December 31, 2016
Revenue in our Logistics segment increased by 7.5% to $5,722.7 million in 2017 compared to $5,323.9 million in 2016. The increase in revenue was driven by strong demand for contract logistics in both Europe and North America, partially offset by a decline in managed transportation revenue. European logistics revenue growth reflected a significant benefit from new contract starts with e-commerce and cold chain customers in the United Kingdom, Italy and the Netherlands. In North America, the largest gains came from the e-commerce, industrial, and consumer packaged goods sectors.
Operating income increased in 2017 to $249.2 million, compared to $209.5 million in 2016. The improvement was driven by strong revenue growth, partially offset by an increase in direct operating expense and SG&A driven by new contract startups that resulted in higher temporary labor costs and payroll expenses.
34
Year Ended December 31, 2016 Compared to Year Ended December 31, 2015
Revenue in our Logistics segment increased by 92.3% to $5,323.9 million in 2016 compared to $2,768.4 million in 2015. This increase was driven by the acquisitions of ND and Con-way.
Operating income increased in 2016 to $209.5 million, compared to $81.6 million in 2015. The improvement was driven by revenue growth, partially offset by increases in direct operating expense and SG&A due to acquisitions.
Liquidity and Capital Resources
Our principal existing sources of cash are cash generated from operations and borrowings available under the Second Amended and Restated Revolving Loan Credit Agreement (the “ABL Facility”). Availability under the ABL Facility is based on a borrowing base of $1.0 billion, taking into account outstanding letters of credit of $244.6 million. As of December 31, 2017, we had availability under the ABL Facility of $655.4 million. As of December 31, 2017, we had $590.8 million of working capital, including cash and cash equivalents of $396.9 million, compared to working capital of $342.0 million, including cash and cash equivalents of $373.4 million, as of December 31, 2016. This increase of $248.8 million in working capital during the period was mainly due to higher sales that resulted in increased accounts receivable, partially offset by an increase in accrued expenses largely related to higher performance-based compensation.
We continually evaluate our liquidity requirements, capital needs and the availability of capital resources based on our operating needs and our planned growth initiatives. We believe that our existing sources of cash will be sufficient to support our existing operations over the next 12 months.
Redemption of Senior Notes due 2021
In December 2017, the Company redeemed all of its outstanding senior notes due June 2021 (the “2021 Notes”) that were originally issued in 2015. The redemption price for the 2021 Notes was 102.875% of the principal amount of the 2021 Notes, plus accrued and unpaid interest to, but excluding, the date of redemption. The redemption was funded using cash on hand at the date of the redemption. The loss on debt extinguishment was $22.4 million.
European Trade Securitization Program
In October 2017, XPO Logistics Europe SA (“XPO Logistics Europe”), in which the Company holds an 86.25% controlling interest, entered into a European trade receivables securitization program for an aggregate maximum amount of €270 million (approximately $324 million as of December 31, 2017) for a term of three years co-arranged by Crédit Agricole and HSBC. Under the terms of the program, XPO Logistics Europe, or one of its wholly-owned subsidiaries in the United Kingdom or France, sells trade receivables to XPO Collections Designated Activity Company Limited (“XCDAL”), a wholly-owned bankruptcy remote special purpose entity of XPO Logistics Europe. The receivables are funded by senior variable funding notes denominated in the same currency as the corresponding receivables. XCDAL is considered a variable interest entity and is consolidated by XPO Logistics Europe based on its control of the entity’s activities. The receivable balances under this program is reported as accounts receivable on the Company’s consolidated balance sheet and the obligation to return the cash it receives is included in the Company’s long-term debt. At December 31, 2017, the remaining borrowing capacity was €17.7 million (approximately $21.2 million) and the weighted-average interest rate was 1.06%. In the first quarter of 2018, the aggregate maximum amount under the program was increased to €350 million (approximately $420 million).
The receivables securitization program provides additional liquidity to fund XPO Logistics Europe’s operations. Borrowings under the program will bear interest at lenders’ cost of funds plus a margin of 1.05%. The receivables securitization program contains representations and warranties, affirmative and negative covenants, termination events, events of default, indemnities and other obligations on the part of XPO Logistics Europe, certain of its subsidiaries, and XCDAL which are customary for transactions of this nature.
Redemption of Senior Notes due 2018
In August 2017, the Company redeemed all of its outstanding 7.25% senior notes due January 2018 (the “2018 Notes”). The 2018 Notes were assumed in connection with the Company’s acquisition on Con-way. The redemption price for the 2018 Notes was 102.168% of the principal amount of the 2018 Notes, plus accrued and unpaid interest
35
to, but excluding, the date of redemption. The redemption was funded using cash on hand at the date of the redemption. The loss on debt extinguishment was approximately $5.3 million.
Equity Offering
In July 2017, the Company completed a registered underwritten offering of 11 million shares of its common stock at a public offering price of $60.50 (the “Offering”). Of the 11 million shares of common stock, 5 million shares were offered directly by the Company and 6 million shares were offered in connection with forward sale agreements (the “Forward Sale Agreements”) described below. The Offering closed on July 25, 2017.
In connection with the Offering, the Company entered into separate Forward Sale Agreements with Morgan Stanley & Co. LLC and JPMorgan Chase Bank, National Association, London Branch (the “Forward Counterparties”) pursuant to which the Company has agreed to sell, and each Forward Counterparty agreed to purchase, 3 million shares of the Company’s common stock (or 6 million shares of the Company’s common stock in the aggregate) subject to the terms and conditions of the Forward Sale Agreements, including the Company’s right to elect cash settlement or net share settlement. The initial forward price under each of the Forward Sale Agreements is $58.08 per share (which was the public offering price of our common stock, less the underwriting discount) and is subject to certain adjustments pursuant to the terms of the Forward Sale Agreements. Settlement of each of the Forward Sale Agreements must occur no later than one year after the closing of the Offering but may occur earlier at the option of the Company or, in certain circumstances described in the Forward Sale Agreements, at the option of the relevant Forward Counterparty. A Forward Counterparty’s decision to exercise its right to accelerate the Forward Sale Agreements entered into with it and to require the Company to settle the Forward Sale Agreements will be made irrespective of the Company’s interests, including the Company’s need for capital. The Company could be required to issue and deliver the Company’s common stock under the terms of the physical settlement provisions of the Forward Sale Agreements irrespective of the Company’s capital needs, which would result in dilution to the Company’s earnings per share and return on equity.
The Company received proceeds of $290.4 million ($287.6 million net of fees and expenses) from the sale of 5 million shares of common stock in the Offering. The Company has not received any proceeds from the sale of shares of its common stock by the Forward Counterparties pursuant to the Forward Sale Agreements. The Company used the net proceeds of the shares issued and sold by the Company in the Offering and expects to use any net proceeds received upon the settlement of the Forward Sale Agreements for general corporate purposes, which may include strategic acquisitions and the repayment or refinancing of outstanding indebtedness.
Refinancing of Existing Term Loan
In March 2017, the Company entered into a Refinancing Amendment (Amendment No. 2 to Credit Agreement) (the “Second Amendment”), by and among XPO, its subsidiaries signatory thereto, as guarantors, the lenders party thereto and Morgan Stanley Senior Funding, Inc., in its capacity as administrative agent (the “Administrative Agent”), amending that certain Senior Secured Term Loan Credit Agreement, dated as of October 30, 2015 (as amended, amended and restated, supplemented or otherwise modified, including by that certain Incremental and Refinancing Amendment (Amendment No. 1 to Credit Agreement) (the “First Amendment”), dated as of August 25, 2016, the “Term Loan Credit Agreement”).
Pursuant to the Second Amendment, the outstanding $1,481.9 million principal amount of term loans under the Term Loan Credit Agreement (the “Existing Term Loans”) were replaced with $1,494.0 million in aggregate principal amount of new term loans (the “Current Term Loans”) having substantially similar terms as the Existing Term Loans, other than with respect to the applicable interest rate and prepayment premiums in respect of certain voluntary prepayments. Proceeds from the Current Term Loans were used primarily to refinance the Existing Term Loans and to pay interest, fees and expenses in connection therewith.
The interest rate margin applicable to the Current Term Loans was reduced from 2.25% to 1.25%, in the case of base rate loans, and from 3.25% to 2.25%, in the case of LIBOR loans and the LIBOR floor was reduced from 1.0% to 0%. The interest rate on the Current Term Loans was 3.60% at December 31, 2017. The Current Term Loans maturity date remains October 30, 2021. The refinancing resulted in a debt extinguishment charge of $8.3 million during the twelve months ended December 31, 2017.
36
In August 2016, the Company entered into the First Amendment, pursuant to which the outstanding $1,592.0 million principal amount of term loans under the Term Loan Credit Agreement (the “Old Term Loans”) were replaced with a like aggregate principal amount of new term loans (the “New Term Loans”) having substantially similar terms as the Old Term Loans, other than with respect to the applicable interest rate and prepayment premiums in respect of certain voluntary prepayments. Of the $1,592.0 million of term loans which were refinanced, $1,197.2 million were exchanged and represent a non-cash financing activity. The interest rate margin applicable to the New Term Loans was reduced from 3.50% to 2.25%, in the case of base rate loans, and from 4.50% to 3.25%, in the case of LIBOR loans. The interest rate at December 31, 2016 was 4.25%. Debt extinguishment costs related to various lenders exiting the syndicate were $18.0 million.
In addition, pursuant to the First Amendment, the Company borrowed an additional $400.0 million of Incremental Term B-1 Loans (the “Incremental Term B-1 Loans”) and an additional $50.0 million of Incremental Term B-2 Loans (the “Incremental Term B-2 Loans”). The New Term Loans, Incremental Term B-1 Loans and Incremental Term B-2 Loans have identical terms, other than with respect to original issue discount, and will mature on October 30, 2021.
North American Truckload Operations
In October 2016, pursuant to a Stock Purchase Agreement between the Company and a subsidiary of TransForce Inc. (“TransForce”), the Company divested its North American Truckload operations (formerly known as Con-way Truckload) for approximately $558.0 million cash consideration, subject to certain adjustments. As the proceeds from the sale equaled the carrying value (inclusive of goodwill), there was no gain or loss recognized in connection with this divestiture. In November 2016, the Company used the proceeds from sale of the North American Truckload operations to repurchase $555.0 million of Term Loan debt at par. The repurchase of debt resulted in a non-cash debt extinguishment charge of $16.5 million in the fourth quarter of 2016.
Redemption of Senior Notes due 2019
In September 2016, XPO redeemed all of its outstanding 7.875% Senior Notes due 2019. The redemption price for the Senior Notes due 2019 was 103.938% of the principal amount of the Senior Notes due 2019, plus accrued and unpaid interest to, but excluding, the date of redemption. Debt extinguishment costs were $35.2 million.
Issuance of Senior Notes Due 2023
In August 2016, the Company completed a private placement of $535.0 million aggregate principal amount of 6.125% senior notes due September 1, 2023 (“Senior Notes due 2023”). The Senior Notes due 2023 bear interest payable semiannually, in cash in arrears and mature on September 1, 2023.
Loan Covenants and Compliance
As of December 31, 2017, we were in compliance with the covenants and other provisions of our debt agreements. Any failure to be in compliance with any material provision or covenant of these agreements could have a material adverse effect on our liquidity and operations.
Sources and Uses of Cash
During 2017, we: (i) generated cash from operating activities of $798.6 million, (ii) generated proceeds from sales of assets of $79.1 million, (iii) received proceeds from our common stock offering of $287.6 million and (iv) received proceeds, net of repayments, on our ABL facility of $70.0 million. We used cash during this period principally to (i) purchase property and equipment of $503.8 million, (ii) make repurchases, net of proceeds, of $567.4 million on our debt, (iii) make payments on long-term debt and capital leases of $106.4 million, (iv) make payments for debt issuance costs in connection with the refinancing of our Term Loan facility and issuance of senior variable funding notes in connection with the European trade securitization program of $16.8 million and (v) make payments for tax withholdings on restricted shares of $16.6 million.
During 2016, we: (i) generated cash from operating activities of $625.4 million, (ii) generated proceeds from sales of a business and assets of $616.6 million and (iii) received proceeds, net of repayments, on our ABL facility of $30.0 million. We used cash during this period principally to (i) purchase property and equipment of $483.4 million, (ii) make repurchases, net of proceeds, of $511.4 million on our debt, (iii) make payments on long-term debt and
37
capital leases of $151.4 million, (iv) make payments for debt issuance costs of $25.8 million and (v) make payments for tax withholdings on restricted shares of $11.1 million.
Cash flows from operating activities for 2017 increased by $173.2 million compared to the prior year due to higher cash-related net income of $240.6 million, partially offset by net movements in operating assets and liabilities of $67.4 million. The increase in cash-related net income was primarily due to higher revenues in our transportation and logistics segments. The changes in the balances of operating assets and liabilities in 2017 compared to 2016 primarily resulted from higher revenues, which led to a higher accounts receivable position on a year-over-year basis, partially offset by the timing of working capital payments. Additionally, cash flows from operating activities was favorably impacted by lower cash paid for interest of $88.9 million compared to the prior year due to lower average debt balances and more favorable interest rates in 2017, primarily from the redemption of our Senior Notes due 2019 and debt refinancings.
Cash flows from operating activities for 2016 increased by $534.6 million compared to the prior year due to higher cash-related net income of $689.8 million, partially offset by net movements in operating assets and liabilities of $155.2 million. The increase in cash-related net income was primarily a result of the full year impact of the ND and Con-way acquisitions that were completed in 2015. The changes in the balances of operating assets and liabilities in 2016 compared to the prior year was significantly impacted by both the post-acquisition growth of the acquired companies and organic growth of our legacy business, driving higher revenues and leading to a higher accounts receivable position on a year-over-year basis. Additionally, cash flows from operating activities was adversely impacted by higher cash paid for interest of $194.9 million due to increased indebtedness to fund the 2015 acquisitions of Con-way and ND.
Investing activities used $424.7 million of cash in 2017 compared to $142.0 million generated in 2016 and $4,085.4 million used in 2015. During 2017, the Company used $503.8 million of cash to purchase fixed assets and received $79.1 million from the sale of assets. During 2016, the Company received $547.7 million from the sale of its North American Truckload operations, used $483.4 million of cash to purchase fixed assets and received $68.9 million from the sale of assets. During 2015, the Company used $3,887.0 million of cash in acquisitions (net of cash acquired), $249.0 million to purchase fixed assets and received $60.3 million from the sale of assets.
Financing activities used $366.4 million in 2017 compared to $680.8 million used in 2016 and $3,644.9 million generated in 2015. The primary use of cash in 2017 was the $1,386.6 million repurchase of debt, consisting of the refinancing of the term loan and redemptions of the Senior Notes due 2021 and 2018, and the $106.4 million repayment of debt and capital leases. The main source of cash from financing activities in 2017 was the $802.4 million of net proceeds from the issuance of long-term debt, consisting of the refinancing of the term loan and amounts received under the senior variable funding notes in connection with our European trade securitization program, and $287.6 million net proceeds from the issuance of common stock. In 2016, our primary use of cash was the $1,889.2 million repurchase of debt and the $151.4 million repayment of debt and capital leases. The main source of cash from financing activities in 2016 was the $1,352.0 million of net proceeds from the issuance of long-term debt. In 2015, our primary source of cash was the $4,108.9 million of net proceeds from the issuance of long-term debt and $1,228.1 million of net proceeds from the issuance of preferred and common stock. The primary uses of cash from financing activities were the repayment of $1,215.6 million of debt and the purchase of the noncontrolling interest in ND of $459.7 million.
Defined Benefit Pension Plans
We maintain defined benefit plans for certain employees in the U.S. as well as internationally. The largest of these plans include the funded U.S. plan, the unfunded U.S. plan and the funded U.K. plan, which we refer to as defined benefit pension plans. We have historically realized income, rather than expense, from these plans. We generated aggregate income from our U.S. and U.K. plans of $44.4 million in 2017, $27.5 million in 2016 and $8.2 million in 2015. The plans have been generating income due to their funded status and since they do not allow for new plan participants or additional benefit accruals.
Defined benefit pension plan amounts are calculated using various actuarial assumptions and methodologies. Assumptions include discount rates, inflation rates, expected long-term rate of return on plan assets, mortality rates, and other factors. The assumptions used in recording the projected benefit obligation and fair value of plan assets represent our best estimates based on information available regarding historical experience and factors that may
38
cause future expectations to differ. Differences in actual experience or changes in assumptions could materially impact our obligation and future expense or income.
Discount Rate
In determining the appropriate discount rate, we are assisted by actuaries who utilize a yield-curve model based on a universe of high-grade corporate bonds (rated AA or better by Moody’s, S&P or Fitch rating services). The model determines a single equivalent discount rate by applying the yield curve to expected future benefit payments.
The discount rates used in determining the net periodic benefit costs and benefit obligations are as follows:
U.S. Qualified Plans | U.S. Non-Qualified Plans | U.K. Plan | |||||||||||||||
2017 | 2016 | 2017 | 2016 | 2017 | 2016 | ||||||||||||
Discount rate - net periodic benefit costs | 3.83% - 4.35% | 4.65 | % | 4.35 | % | 4.65 | % | 2.70 | % | 3.75 | % | ||||||
Discount rate - benefit obligations | 3.55% - 3.71% | 4.35 | % | 3.21% - 3.60% | 4.35 | % | 2.53 | % | 2.70 | % | |||||||
A 25 basis point increase or decrease in the discount rate would increase or decrease the Company’s 2017 pre-tax pension income by approximately $2 million each for the U.S. plans and U.K. plan, respectively.
In 2018, the Company will change how it estimates the interest cost component of net periodic cost for its U.S. and U.K. pension benefit plans. Previously, the Company estimated the interest cost component utilizing a single weighted-average discount rate derived from the yield curve used to measure the benefit obligation. The new estimate utilizes a full yield curve approach in the estimation of this component by applying the specific spot rates along the yield curve used in the determination of the benefit obligation to each of the underlying projected cash flows based on time until payment. The new estimate provides a more precise measurement of interest costs by improving the correlation between projected benefit cash flows and their corresponding spot rates. The change does not affect the measurement of the Company’s U.S. and U.K. pension benefit obligation and it is accounted for as a change in accounting estimate, which will be applied prospectively.
Rate of Return on Plan Assets
We estimate the expected return on plan assets using current market expectations as well as historical returns. The expected return on plan assets is based on estimates of long-term expected returns and considers the plans’ anticipated asset allocation over the course of the next year. The plan assets are managed pursuant to a long-term allocation strategy that seeks to mitigate the plans’ funded status volatility by increasing the plans’ investment in fixed-income investments over time. This strategy was developed by analyzing a variety of diversified asset-class combinations in conjunction with the projected liabilities of the plans. For the year ended December 31, 2017, our expected return on plan assets was $93.2 million for U.S. Plans and $59.9 million for the U.K. Plan, compared to the actual return on plan assets of $268.6 million for U.S. Plans and $108.9 million for the U.K. Plan. The actual annualized return on plan assets for the U.S. Plans for the year ended December 31, 2017 was approximately 16%, which was above the expected return on asset assumption for the year as a result of strong performance of the fixed income portfolio, which made up over three-fourths of total plan assets during the year, as well as strong equity performance in the balance of the portfolio. The actual annualized return on plan assets for the U.K. Plan for the year ended December 31, 2017 was approximately 9%, which was above the expected return on asset assumption for the year as a result of strong performance across all asset classes. A 25 basis point increase or decrease in the expected return on plan assets would decrease or increase the Company’s 2017 pre-tax pension income by approximately $4 million for the U.S. plans and $3 million for the U.K. plan.
Actuarial Gains and Losses
Changes in the discount rate and/or differences between the expected and actual rate of return on plan assets results in unrecognized actuarial gains or losses. For our defined benefit pension plans, accumulated unrecognized actuarial gains were $4.5 million for the U.S. Plans and $44.3 million for the U.K. Plan at December 31, 2017. The portion of the unrecognized actuarial gain/loss that exceeds 10% of the greater of the projected benefit obligation or the fair value of plan assets at the beginning of the year is amortized and recognized as income/expense over the estimated average remaining life expectancy of plan participants. We do not expect to recognize any amortization of actuarial gain or loss in our net periodic benefit expense (income) for 2018.
39
Lump Sum Payout
During 2017, the Company offered eligible former employees, who had not yet commenced receiving their pension benefit, an opportunity to receive a lump sum payout of their vested pension benefit. On December 1, 2017, in connection with this offer, one of the Company’s pension plans paid $142.3 million from pension plan assets to those who accepted this offer, thereby reducing its pension benefit obligations. The transaction had no cash impact on the Company but did result in a non-cash pre-tax pension settlement gain of $0.8 million. As a result of the lump sum payout, the Company re-measured the funded status of its pension plan as of the settlement date. To calculate this pension settlement charge, the Company utilized a discount rate of 4.35% through the measurement date and 3.83% thereafter.
Effect on Operating Results
The effects of the defined benefit pension plans on our operating results consist primarily of the net effect of the interest cost on plan obligations for the U.S. Plans and the U.K. Plan, and the expected return on plan assets. We estimate that the defined benefit pension plans will contribute annual pre-tax income in 2018 of $32.4 million for the U.S. Plans and $41.4 million for the U.K. Plan.
Funding
In determining the amount and timing of pension contributions for the U.S. Plans, we consider our cash position, the funded status as measured by the Pension Protection Act of 2006 and generally accepted accounting principles, and the tax deductibility of contributions, among other factors. We made $5.2 million of contributions to the U.S. Non-Qualified Plans in 2017 and $5.4 million in 2016. We estimate that we will make $5.4 million of contributions to the U.S. Non-Qualified Plans in 2018. We made no contributions to the U.S. Qualified Plans in 2017 and 2016. We do not anticipate making any contributions to the U.S. Qualified Plans in 2018.
For the U.K. Plan, the amount and timing of pension contributions is determined in accordance with U.K. pension codes and trustee negotiations. We made contributions of $13.3 million and $14.2 million to the U.K. Plan in 2017 and 2016, respectively. We estimate that we will make $13.2 million of contributions to the U.K. Plan in 2018.
For additional information, refer to Note 11—Employee Benefit Plans of Item 8, “Financial Statements and Supplementary Data.”
Contractual Obligations
The following table reflects our contractual obligations as of December 31, 2017:
Payments Due by Period | ||||||||||||||||||||
(In millions) | Total | 2018 | 2019-2020 | 2021-2022 | Thereafter | |||||||||||||||
Contractual Obligations | ||||||||||||||||||||
Capital leases payable | $ | 263.5 | $ | 50.0 | $ | 85.9 | $ | 74.2 | $ | 53.4 | ||||||||||
Operating leases | 1,978.5 | 517.9 | 676.3 | 388.5 | 395.8 | |||||||||||||||
Purchase commitments | 89.0 | 47.5 | 32.5 | 9.0 | — | |||||||||||||||
Long-term debt | 4,436.0 | 61.0 | 443.6 | 3,095.2 | 836.2 | |||||||||||||||
Interest on long-term debt | 1,207.3 | 212.7 | 428.0 | 302.6 | 264.0 | |||||||||||||||
Total contractual cash obligations | $ | 7,974.3 | $ | 889.1 | $ | 1,666.3 | $ | 3,869.5 | $ | 1,549.4 | ||||||||||
At December 31, 2017, our Consolidated Balance Sheet reflects a long-term liability of $418.8 million for deferred taxes and approximately $25 million for unrecognized tax benefits reserve. As the timing of future cash outflows for these liabilities is uncertain, they are excluded from the above table. Actual amounts of contractual cash obligations may differ from estimated amounts due to changes in foreign currency exchange rates. We anticipate net capital expenditures to be between $450 million and $475 million in 2018.
40
Off-Balance Sheet Arrangements
The Company guarantees the lease payments of certain tractor and trailer equipment utilized by subcontractor carriers. These guarantees continue through the end of the lease of the equipment, which is typically four years. The maximum amount of the guarantee is limited to the amount of unpaid principal and interest. As of December 31, 2017, the maximum amount of these guarantees was approximately $15.4 million.
Critical Accounting Policies
We prepare our consolidated financial statements in accordance with U.S. generally accepted accounting principles. A summary of our significant accounting policies is contained in Note 2—Basis of Presentation and Significant Accounting Policies to our consolidated financial statements. In applying many accounting principles, we make assumptions, estimates and/or judgments. These assumptions, estimates and/or judgments are often subjective and may change based on changing circumstances or changes in our analysis. Material changes in these assumptions, estimates and/or judgments have the potential to materially alter our results of operations. We have identified below our accounting policies that we believe could potentially produce materially different results if we were to change underlying assumptions, estimates and/or judgments. Although actual results may differ from those estimates, we believe the estimates are reasonable and appropriate.
Evaluation of Goodwill
Goodwill consists of the excess of cost over the fair value of net assets acquired in business combinations. Goodwill is tested for impairment annually or more frequently if an event or circumstance indicates that an impairment loss may have been incurred. Application of the goodwill impairment test requires judgment, including: the identification of reporting units; assignment of assets and liabilities to reporting units; assignment of goodwill to reporting units; and a determination of the fair value of each reporting unit.
As more fully described in Note 2—Basis of Presentation and Significant Accounting Policies, the Company adopted Accounting Standards Update (“ASU”) 2017-04, Intangibles - Goodwill and Other (Topic 350): “Simplifying the Accounting for Goodwill Impairment” in connection with its annual impairment test as of August 31, 2017. ASU 2017-04 removes the requirement to perform a hypothetical purchase price allocation to measure goodwill impairment (often referred to as “Step 2”). Goodwill impairment, if any, would be measured at the amount by which a reporting unit’s carrying amount exceeds its fair value, not to exceed the carrying amount of goodwill.
Prior to the adoption of ASU 2017-04, we reviewed goodwill for impairment utilizing a two-step process. The first step of the impairment test required a comparison of the fair value of each of our reporting units’ net assets to the respective carrying value of net assets, consistent with the method described below. If the carrying amount of a reporting unit’s net assets was higher than its fair value, there is an indication that an impairment may exist and a second step must be performed. In the second step, if the carrying amount of the reporting unit’s goodwill was greater than the implied fair value of its goodwill (as if purchase accounting were performed on the testing date), an impairment loss must be recognized for the excess and charged to operations.
Both prior and subsequent to the adoption of ASU 2017-04, we estimate the fair value of our reporting units using an income approach based on the present value of estimated future cash flows, discounted at an appropriate risk-adjusted rate. The discount rates reflect management’s judgment and are based on a risk adjusted weighted-average cost of capital utilizing industry market data of businesses similar to the reporting units. Inherent in our preparation of cash flow projections are assumptions and estimates derived from a review of our operating results, business plans, expected growth rates, cost of capital and tax rates. We also make certain forecasts about future economic conditions, interest rates and other market data. Many of the factors used in assessing fair value are outside the control of management, and these assumptions and estimates may change in future periods. Changes in assumptions or estimates could materially affect the estimate of the fair value of a reporting unit, and therefore could affect the likelihood and amount of potential impairment.
Accounting guidance allows entities to perform a qualitative assessment (a “step-zero” test) before performing a quantitative analysis. If an entity determines that it is not more-likely-than-not that the fair value of a reporting unit is less than its carry amount, the entity would not need to perform the quantitative analysis described above. The qualitative assessment includes review of macroeconomic conditions, industry and market considerations, internal
41
cost factors, and overall financial performance, among other areas.
For our 2017 goodwill assessment, we performed a step-zero qualitative analysis for five of our six reporting units. Based on that qualitative assessment, we concluded that it is not more likely than not that the fair value of those reporting units was less their carrying amounts and therefore, further quantitative analysis was not performed. For one reporting unit, we elected to proceed directly to the step one quantitative analysis. Based on the analysis prepared, the fair value of the reporting unit substantially exceeded the carrying value at the testing date.
Self-Insurance Accruals
The Company uses a combination of self-insurance programs and large-deductible purchased insurance to provide for the costs of medical, vehicular, cargo and workers’ compensation claims. The Company periodically evaluates the level of insurance coverage and adjusts insurance levels based on risk tolerance and premium expense. The measurement and classification of self-insured costs requires the consideration of historical cost experience, demographic and severity factors, and judgments about current and expected levels of cost per claim and retention levels. These methods provide estimates of the undiscounted liability associated with claims incurred as of the balance sheet date, including estimates of claims incurred but not reported. The Company believes the actuarial methods are appropriate for measuring these self-insurance accruals. However, based on the number of claims and the length of time from incurrence of the claims to ultimate settlement, the use of any estimation method is sensitive to the assumptions and factors described above. Accordingly, changes in these assumptions and factors can affect the estimated liability and those amounts may be different than the actual costs paid to settle the claims.
Income Taxes
Our annual effective tax rate is based on our income and statutory tax rates in the various jurisdictions in which we operate. Judgment and estimates are required in determining our tax expense and in evaluating our tax positions, including evaluating uncertainties. We review our tax positions quarterly and as new information becomes available. Our effective tax rate in any financial statement period may be materially impacted by changes in the mix and/or level of earnings by taxing jurisdiction.
Deferred income tax assets represent amounts available to reduce income taxes payable in future years. Such assets arise because of temporary differences between the financial reporting and tax bases of assets and liabilities, as well as from net operating losses and tax credit carryforwards. We evaluate the recoverability of these future tax deductions and credits by assessing all available evidence, including the reversal of deferred tax liabilities, carrybacks available, and historical and projected pre-tax profits generated by operations. Valuation allowances are established when, in management’s judgment, it is more likely than not that its deferred tax assets will not be realized. In assessing the need for a valuation allowance, management weighs the available positive and negative evidence, including limitations on the use of tax losses and other carryforwards due to changes in ownership, historic information, and projections of future sources of taxable income that include and exclude future reversals of taxable temporary differences.
ITEM 7A. QUANTITATIVE AND QUALITATIVE DISCLOSURES ABOUT MARKET RISK
The following discussion about our market risk disclosures involves forward-looking statements. Actual results could differ materially from those projected in such forward-looking statements. We are exposed to market risk related to changes in interest rates, foreign currency exchange rates and commodity price risk.
Interest Rate Risk
Term Loan Facility. At December 31, 2017, we had outstanding $1,494.0 million aggregate principal amount on our Term Loan Facility. The interest rate fluctuates based on LIBOR or a Base Rate, as defined in the agreement, plus an applicable margin of 2.25%, in the case of LIBOR loans, and 1.25%, in the case of Base Rate loans. A hypothetical 1% increase in the interest rate would increase our annual interest expense by approximately $15 million.
ABL Facility. We have exposure to changes in interest rates on our ABL Facility. The interest rates on our ABL Facility fluctuate based on LIBOR or a Base Rate plus an applicable margin. Assuming our $1.0 billion ABL Facility was fully drawn at December 31, 2017, a hypothetical 1% change in the interest rate would have increased our annual interest expense by approximately $10 million.
42
Asset Financing. At December 31, 2017, we had outstanding $90.0 million aggregate principal amount of Asset Financing. While most of the Asset Financing has floating interest rates that subjects us to risk resulting from changes in short-term (primarily Euribor) interest rates, historically we have used interest rate swaps (exchanging a variable rate for a fixed rate) to manage the fixed and floating interest rate mix of our Asset Financing and limit our exposure to interest rate risk, however, at December 31, 2017, no interest rate swaps were outstanding.
Foreign Currency Exchange Risk
We have a significant proportion of our net assets and income in non-U.S. dollar (“USD”) currencies, primarily the Euro (“EUR”) and British Pound Sterling (“GBP”). We are exposed to currency risk from the potential changes in functional currency values of our foreign currency denominated assets, liabilities and cash flows. Consequently, a depreciation of the EUR and GBP relative to the USD could have an adverse impact on our financial results.
In connection with the issuance of the Senior Notes due 2022, we entered into certain cross-currency swap agreements to partially manage the related foreign currency exchange risk by effectively converting a portion of the fixed-rate USD-denominated Senior Notes due 2022, including the semi-annual interest payments, to fixed-rate, EUR-denominated debt. The risk management objective is to manage a portion of the foreign currency risk relating to net investments in subsidiaries denominated in foreign currencies.
In order to mitigate against the risk of a reduction in the value of foreign currency earnings before interest, taxes, depreciation and amortization (“EBITDA”) from the Company’s international operations with the EUR and GBP as the functional currency, the Company uses foreign currency option and forward contracts.
As of December 31, 2017, a uniform 10% strengthening in the value of the USD relative to the EUR would have resulted in a decrease in net assets of approximately $9.1 million. As of December 31, 2017, a uniform 10% strengthening in the value of the USD relative to the GBP would have resulted in a decrease in net assets of approximately $48.0 million. These theoretical calculations assume that an instantaneous, parallel shift in exchange rates occurs, which is not consistent with our actual experience in foreign currency transactions. Fluctuations in exchange rates also affect the volume of sales or the foreign currency sales price as competitors’ services become more or less attractive. The sensitivity analysis of the impact of changes in foreign currency exchange rates does not factor in a potential change in sales levels or local currency prices.
Commodity Price Risk
We are exposed to the impact of market fluctuations in the price of diesel fuel purchased for use in Company-owned vehicles. During the year ended December 31, 2017, diesel prices varied by 16.1% in France, 11.0% in the United Kingdom, and 20.6% in the United States. However, the Company includes price adjustment clauses or cost-recovery mechanisms in many of its customer contracts in the event of a change in the fuel purchase price. The clauses mean that substantially all fluctuations in the purchase price of diesel, except for short-term economic fluctuations, can be passed on to customers in the sales price. Therefore, a hypothetical 10% change in the price of diesel would not be expected to materially alter our financial performance over the long term.
ITEM 8. FINANCIAL STATEMENTS AND SUPPLEMENTARY DATA
The Consolidated Financial Statements and supplementary data of the Company required by this Item are included at Part IV, Item 15 of this Annual Report on Form 10-K and are incorporated herein by reference.
ITEM 9. CHANGES IN AND DISAGREEMENTS WITH ACCOUNTANTS ON ACCOUNTING AND FINANCIAL DISCLOSURE
None.
ITEM 9A. CONTROLS AND PROCEDURES
Conclusion Regarding the Effectiveness of Disclosure Controls and Procedures
As of December 31, 2017, our management, including our Chief Executive Officer (“CEO”) and Chief Financial Officer (“CFO”), have conducted an evaluation of the effectiveness of the design and operation of our disclosure
43
controls and procedures pursuant to Rule 13a-15(e) and Rule 15d-15(e) under the Securities Exchange Act of 1934, as amended. Based on that evaluation, our CEO and CFO concluded that our disclosure controls and procedures as of December 31, 2017 were effective.
Management’s Annual Report on Internal Control over Financial Reporting
Our management is responsible for establishing and maintaining adequate internal control over financial reporting, as such term is defined in Rule 13a-15(f) under the Securities Exchange Act of 1934, as amended. Under the supervision and with the participation of our management, including our principal executive officer and principal financial officer, we conducted an evaluation of the effectiveness of our internal control over financial reporting as of December 31, 2017 based on the framework in Internal Control - Integrated Framework (2013), issued by the Committee of Sponsoring Organizations of the Treadway Commission (“COSO”). Based on our evaluation, we concluded that our internal control over financial reporting was effective as of December 31, 2017.
KPMG LLP, the independent registered public accounting firm that audited the financial statements included in this Annual Report on Form 10-K, has issued an audit report, which is included elsewhere within this Form 10-K, on the effectiveness of our internal control over financial reporting.
Changes in Internal Control Over Financial Reporting
There have not been any changes in the Company’s internal control over financial reporting during the quarter ended December 31, 2017 that have materially affected, or are reasonably likely to materially affect, its internal control over financial reporting.
ITEM 9B. OTHER INFORMATION
Not applicable.
44
PART III
ITEM 10. DIRECTORS, EXECUTIVE OFFICERS AND CORPORATE GOVERNANCE
The information required by Item 10 of Part III of Form 10-K (other than certain information required by Item 401 of Regulation S-K with respect to our executive officers, which is provided under Item 1 of Part I of this Annual Report on Form 10-K) will be set forth in our definitive Proxy Statement for the 2018 Annual Meeting of Stockholders and is incorporated herein by reference.
We have adopted a Code of Business Ethics (the “Code”), which is applicable to our principal executive officer, principal financial officer, principal accounting officer and other senior officers. The Code is available on our website at www.xpo.com, under the heading “Corporate Governance” within the “Investors” tab. In the event that we amend or waive any of the provisions of the Code that relate to any element of the code of ethics definition enumerated in Item 406(b) of Regulation S-K, we intend to disclose the same on our website at the web address specified above.
ITEM 11. EXECUTIVE COMPENSATION
The information required by Item 11 of Part III of Form 10-K will be set forth in our Proxy Statement for the 2018 Annual Meeting of Stockholders and is incorporated herein by reference.
ITEM 12. SECURITY OWNERSHIP OF CERTAIN BENEFICIAL OWNERS AND MANAGEMENT AND RELATED STOCKHOLDER MATTERS
The information required by Item 12 of Part III of Form 10-K, including information regarding security ownership of certain beneficial owners and management and information regarding securities authorized for issuance under equity compensation plans, will be set forth in our Proxy Statement for the 2018 Annual Meeting of Stockholders and is incorporated herein by reference.
ITEM 13. CERTAIN RELATIONSHIPS AND RELATED TRANSACTIONS AND DIRECTOR INDEPENDENCE
The information required by Item 13 of Part III of Form 10-K will be set forth in our Proxy Statement for the 2018 Annual Meeting of Stockholders and is incorporated herein by reference.
ITEM 14. PRINCIPAL ACCOUNTANT FEES AND SERVICES
The information required by Item 14 of Part III of Form 10-K will be set forth in our Proxy Statement for the 2018 Annual Meeting of Stockholders and is incorporated herein by reference.
45
PART IV
Item 15. EXHIBITS, FINANCIAL STATEMENT SCHEDULES
Financial Statements and Financial Statement Schedules
The list of Consolidated Financial Statements provided in the accompanying Index to Consolidated Financial Statements is incorporated herein by reference. Such Consolidated Financial Statements are filed as part of this Annual Report on Form 10-K. All financial statement schedules are omitted because the required information is not applicable, or because the information required is included in the Consolidated Financial Statements and notes thereto.
Exhibits
Exhibit Number | Description | |
2.1 | ||
2.2 | ||
2.3 | ||
2.4 | ||
2.5 | ||
2.6 | ||
2.7 | ||
2.8 | ||
3.1 | ||
3.2 | ||
46
Exhibit Number | Description | |
3.3 | ||
3.4 | ||
3.5 | ||
3.6 | ||
3.7 | ||
3.8 | ||
3.9 | ||
4.1 | ||
4.2 | ||
4.3 | ||
4.4 | ||
4.5 | ||
4.6 | ||
4.7 | ||
4.8 | ||
47
Exhibit Number | Description | |
4.9 | ||
4.10 | ||
4.11 | ||
4.12 | ||
4.13 | ||
10.1 + | ||
10.2 + | ||
10.3 + | ||
10.4 + | ||
10.5 + | ||
10.6 + | ||
10.7 + | ||
10.8 + | ||
10.9 + | ||
10.10 + | ||
10.11 + | ||
48
Exhibit Number | Description | |
10.12 + | ||
10.13 + | ||
10.14 + | ||
10.15 + | ||
10.16 + | ||
10.17 + | ||
10.18 + | ||
10.19 + | ||
10.20 + | ||
10.21 + | ||
10.22 + | ||
10.23 + | ||
10.24 + | ||
10.25 | ||
10.26 | ||
10.27 | ||
49
Exhibit Number | Description | |
10.28 | ||
10.29 | ||
10.30 | ||
10.31 | ||
10.32 + | ||
10.33 | ||
10.34 | ||
10.35 | ||
10.36 | ||
21 * | ||
23 * | ||
31.1 * | ||
31.2 * | ||
32.1** | ||
32.2** | ||
50
Exhibit Number | Description | |
101.INS * | XBRL Instance Document. | |
101.SCH * | XBRL Taxonomy Extension Schema. | |
101.CAL * | XBRL Taxonomy Extension Calculation Linkbase. | |
101.DEF * | XBRL Taxonomy Extension Definition Linkbase. | |
101.LAB * | XBRL Taxonomy Extension Label Linkbase. | |
101.PRE * | XBRL Taxonomy Extension Presentation Linkbase. | |
* | Filed herewith. |
** | Furnished herewith. |
+ | This exhibit is a management contract or compensatory plan or arrangement. |
Item 16. FORM 10-K SUMMARY
None.
51
SIGNATURES
Pursuant to the requirements of Section 13 or 15(d) of the Securities Exchange Act of 1934, the registrant has duly caused this report to be signed on its behalf by the undersigned, thereunto duly authorized.
February 12, 2018
XPO LOGISTICS, INC. | |||
By: | /s/ Bradley S. Jacobs | ||
Bradley S. Jacobs | |||
(Chairman of the Board of Directors and Chief Executive Officer) | |||
By: | /s/ John J. Hardig | ||
John J. Hardig | |||
(Chief Financial Officer) | |||
Pursuant to the requirements of the Securities Exchange Act of 1934, this report has been signed below by the following persons on behalf of the registrant and in the capacities on the dates indicated.
Signature | Title | Date | ||
/s/ Bradley S. Jacobs | Chairman of the Board of Directors and Chief Executive Officer (Principal Executive Officer) | February 12, 2018 | ||
Bradley S. Jacobs | ||||
/s/ John J. Hardig | Chief Financial Officer (Principal Financial Officer) | February 12, 2018 | ||
John J. Hardig | ||||
/s/ Lance A. Robinson | Chief Accounting Officer (Principal Accounting Officer) | February 12, 2018 | ||
Lance A. Robinson | ||||
/s/ Gena L. Ashe | Director | February 12, 2018 | ||
Gena L. Ashe | ||||
/s/ Louis DeJoy | Director | February 12, 2018 | ||
Louis DeJoy | ||||
/s/ AnnaMaria DeSalva | Director | February 12, 2018 | ||
AnnaMaria DeSalva | ||||
/s/ Michael G. Jesselson | Director | February 12, 2018 | ||
Michael G. Jesselson | ||||
/s/ Adrian P. Kingshott | Director | February 12, 2018 | ||
Adrian P. Kingshott | ||||
/s/ Jason D. Papastavrou | Director | February 12, 2018 | ||
Jason D. Papastavrou | ||||
/s/ Oren G. Shaffer | Director | February 12, 2018 | ||
Oren G. Shaffer | ||||
52
Index to Consolidated Financial Statements
Page No. | |
53
Report of Independent Registered Public Accounting Firm
To the shareholders and board of directors
XPO Logistics, Inc.:
Opinions on the Consolidated Financial Statements and Internal Control over Financial Reporting
We have audited the accompanying consolidated balance sheets of XPO Logistics, Inc. and subsidiaries (the “Company”) as of December 31, 2017 and 2016, and the related consolidated statements of operations, comprehensive income (loss), cash flows, and changes in equity for each of the years in the three-year period ended December 31, 2017, and the related notes (collectively, the consolidated financial statements). We also have audited the Company’s internal control over financial reporting as of December 31, 2017, based on criteria established in Internal Control - Integrated Framework (2013) issued by the Committee of Sponsoring Organizations of the Treadway Commission.
In our opinion, the consolidated financial statements referred to above present fairly, in all material respects, the financial position of the Company as of December 31, 2017 and 2016, and the results of its operations and its cash flows for each of the years in the three-year period ended December 31, 2017, in conformity with U.S. generally accepted accounting principles. Also in our opinion, the Company maintained, in all material respects, effective internal control over financial reporting as of December 31, 2017, based on criteria established in Internal Control - Integrated Framework (2013) issued by the Committee of Sponsoring Organizations of the Treadway Commission.
Basis for Opinion
The Company’s management is responsible for these consolidated financial statements, for maintaining effective internal control over financial reporting, and for its assessment of the effectiveness of internal control over financial reporting, included in the accompanying Management’s Annual Report on Internal Control over Financial Reporting. Our responsibility is to express an opinion on the Company’s consolidated financial statements and an opinion on the Company’s internal control over financial reporting based on our audits. We are a public accounting firm registered with the Public Company Accounting Oversight Board (United States) (PCAOB) and are required to be independent with respect to the Company in accordance with the U.S. federal securities laws and the applicable rules and regulations of the Securities and Exchange Commission and the PCAOB.
We conducted our audits in accordance with the standards of the PCAOB. Those standards require that we plan and perform the audits to obtain reasonable assurance about whether the consolidated financial statements are free of material misstatement, whether due to error or fraud, and whether effective internal control over financial reporting was maintained in all material respects.
Our audits of the consolidated financial statements included performing procedures to assess the risks of material misstatement of the consolidated financial statements, whether due to error or fraud, and performing procedures that respond to those risks. Such procedures included examining, on a test basis, evidence supporting the amounts and disclosures in the consolidated financial statements. Our audits also included evaluating the accounting principles used and significant estimates made by management, as well as evaluating the overall presentation of the consolidated financial statements. Our audit of internal control over financial reporting included obtaining an understanding of internal control over financial reporting, assessing the risk that a material weakness exists, and testing and evaluating the design and operating effectiveness of internal control based on the assessed risk. Our audits also included performing such other procedures as we considered necessary in the circumstances. We believe that our audits provide a reasonable basis for our opinions.
Definition and Limitations of Internal Control over Financial Reporting
A company’s internal control over financial reporting is a process designed to provide reasonable assurance regarding the reliability of financial reporting and the preparation of financial statements for external purposes in accordance with generally accepted accounting principles. A company’s internal control over financial reporting includes those policies and procedures that (1) pertain to the maintenance of records that, in reasonable detail, accurately and fairly reflect the transactions and dispositions of the assets of the company; (2) provide reasonable assurance that transactions
54
are recorded as necessary to permit preparation of financial statements in accordance with generally accepted accounting principles, and that receipts and expenditures of the company are being made only in accordance with authorizations of management and directors of the company; and (3) provide reasonable assurance regarding prevention or timely detection of unauthorized acquisition, use, or disposition of the company’s assets that could have a material effect on the financial statements.
Because of its inherent limitations, internal control over financial reporting may not prevent or detect misstatements. Also, projections of any evaluation of effectiveness to future periods are subject to the risk that controls may become inadequate because of changes in conditions, or that the degree of compliance with the policies or procedures may deteriorate.
/s/ KPMG LLP
We have served as the Company’s auditor since 2011.
Charlotte, North Carolina
February 12, 2018
55
XPO Logistics, Inc.
Consolidated Balance Sheets
December 31, | ||||||||
(In millions, except per share data) | 2017 | 2016 | ||||||
ASSETS | ||||||||
Current assets: | ||||||||
Cash and cash equivalents | $ | 396.9 | $ | 373.4 | ||||
Accounts receivable, net of allowances of $42.4 and $26.3, respectively | 2,725.3 | 2,313.3 | ||||||
Other current assets | 465.7 | 386.9 | ||||||
Total current assets | 3,587.9 | 3,073.6 | ||||||
Property and equipment, net of $1,109.5 and $589.9 in accumulated depreciation, respectively | 2,663.7 | 2,537.4 | ||||||
Goodwill | 4,563.6 | 4,325.8 | ||||||
Identifiable intangible assets, net of $559.5 and $377.1 in accumulated amortization, respectively | 1,435.3 | 1,534.7 | ||||||
Other long-term assets | 351.1 | 226.9 | ||||||
Total long-term assets | 9,013.7 | 8,624.8 | ||||||
Total assets | $ | 12,601.6 | $ | 11,698.4 | ||||
LIABILITIES AND STOCKHOLDERS’ EQUITY | ||||||||
Current liabilities: | ||||||||
Accounts payable | $ | 1,250.7 | $ | 1,056.3 | ||||
Accrued expenses | 1,525.8 | 1,382.1 | ||||||
Current maturities of long-term debt | 103.7 | 136.5 | ||||||
Other current liabilities | 116.9 | 156.7 | ||||||
Total current liabilities | 2,997.1 | 2,731.6 | ||||||
Long-term debt | 4,417.5 | 4,731.5 | ||||||
Deferred tax liability | 418.8 | 572.4 | ||||||
Employee benefit obligations | 162.1 | 251.4 | ||||||
Other long-term liabilities | 596.1 | 373.9 | ||||||
Total long-term liabilities | 5,594.5 | 5,929.2 | ||||||
Stockholders’ equity: | ||||||||
Convertible perpetual preferred stock, $.001 par value; 10.0 shares authorized; 0.07 of Series A shares issued and outstanding at December 31, 2017 and 2016, respectively | 41.2 | 41.6 | ||||||
Common stock, $.001 par value; 300.0 shares authorized; 119.9 and 111.1 shares issued and outstanding at December 31, 2017 and 2016, respectively | 0.1 | 0.1 | ||||||
Additional paid-in capital | 3,590.0 | 3,244.9 | ||||||
Accumulated deficit | (42.6 | ) | (392.9 | ) | ||||
Accumulated other comprehensive income (loss) | 15.7 | (193.7 | ) | |||||
Total stockholders’ equity before noncontrolling interests | 3,604.4 | 2,700.0 | ||||||
Noncontrolling interests | 405.6 | 337.6 | ||||||
Total equity | 4,010.0 | 3,037.6 | ||||||
Total liabilities and equity | $ | 12,601.6 | $ | 11,698.4 | ||||
See accompanying notes to consolidated financial statements.
56
XPO Logistics, Inc.
Consolidated Statements of Operations
Years Ended December 31, | ||||||||||||
(In millions, except per share data) | 2017 | 2016 | 2015 | |||||||||
Revenue | $ | 15,380.8 | $ | 14,619.4 | $ | 7,623.2 | ||||||
Operating expenses | ||||||||||||
Cost of transportation and services | 8,128.8 | 7,886.0 | 4,171.4 | |||||||||
Direct operating expense | 4,972.3 | 4,594.1 | 2,367.0 | |||||||||
Sales, general and administrative expense | 1,656.5 | 1,651.2 | 1,113.4 | |||||||||
Total operating expenses | 14,757.6 | 14,131.3 | 7,651.8 | |||||||||
Operating income (loss) | 623.2 | 488.1 | (28.6 | ) | ||||||||
Other expense (income) | (15.4 | ) | (9.2 | ) | (7.6 | ) | ||||||
Foreign currency loss (gain) | 57.6 | (40.3 | ) | 44.8 | ||||||||
Debt extinguishment loss | 36.0 | 69.7 | — | |||||||||
Interest expense | 284.3 | 361.1 | 216.7 | |||||||||
Income (loss) before income tax (benefit) provision | 260.7 | 106.8 | (282.5 | ) | ||||||||
Income tax (benefit) provision | (99.5 | ) | 22.3 | (90.9 | ) | |||||||
Net income (loss) | 360.2 | 84.5 | (191.6 | ) | ||||||||
Net (income) loss attributable to noncontrolling interests | (20.0 | ) | (15.5 | ) | 0.5 | |||||||
Net income (loss) attributable to XPO | $ | 340.2 | $ | 69.0 | $ | (191.1 | ) | |||||
Earnings per share data (Note 15): | ||||||||||||
Net income (loss) attributable to common shareholders | $ | 312.4 | $ | 63.1 | $ | (245.9 | ) | |||||
Basic earnings (loss) per share | $ | 2.72 | $ | 0.57 | $ | (2.65 | ) | |||||
Diluted earnings (loss) per share | $ | 2.45 | $ | 0.53 | $ | (2.65 | ) | |||||
Weighted-average common shares outstanding | ||||||||||||
Basic weighted-average common shares outstanding | 114.9 | 110.2 | 92.8 | |||||||||
Diluted weighted-average common shares outstanding | 127.8 | 122.8 | 92.8 | |||||||||
See accompanying notes to consolidated financial statements.
57
XPO Logistics, Inc.
Consolidated Statements of Comprehensive Income (Loss)
Years Ended December 31, | ||||||||||||
(In millions) | 2017 | 2016 | 2015 | |||||||||
Net income (loss) | $ | 360.2 | $ | 84.5 | $ | (191.6 | ) | |||||
Other comprehensive income (loss), net of tax | ||||||||||||
Foreign currency translation gains (losses), net of tax effect of $46.9, $- and $- | $ | 179.9 | $ | (137.7 | ) | $ | (68.5 | ) | ||||
Unrealized gains (losses) on financial assets/liabilities designated as hedging instruments, net of tax effect of $(0.8), $0.1 and $2.2 | 4.7 | (7.1 | ) | 6.9 | ||||||||
Defined benefit plans adjustment, net of tax benefit of $28.6, $3.7 and $9.8 | 89.8 | 4.7 | (17.0 | ) | ||||||||
Other comprehensive income (loss) | 274.4 | (140.1 | ) | (78.6 | ) | |||||||
Comprehensive income (loss) | $ | 634.6 | $ | (55.6 | ) | $ | (270.2 | ) | ||||
Less: Comprehensive (income) loss attributable to noncontrolling interests | (72.0 | ) | 3.2 | 6.8 | ||||||||
Comprehensive income (loss) attributable to XPO | $ | 562.6 | $ | (52.4 | ) | $ | (263.4 | ) | ||||
See accompanying notes to consolidated financial statements.
58
XPO Logistics, Inc.
Consolidated Statements of Cash Flows
Years Ended December 31, | ||||||||||||
(In millions) | 2017 | 2016 | 2015 | |||||||||
Operating activities | ||||||||||||
Net income (loss) | $ | 360.2 | $ | 84.5 | $ | (191.6 | ) | |||||
Adjustments to reconcile net income (loss) to net cash from operating activities | ||||||||||||
Depreciation and amortization | 658.4 | 643.4 | 364.9 | |||||||||
Stock compensation expense | 79.2 | 54.5 | 27.9 | |||||||||
Unrealized loss (gain) on foreign currency option and forward contracts | 49.3 | (39.7 | ) | 1.0 | ||||||||
Loss on extinguishment of debt | 36.1 | 69.7 | — | |||||||||
Accretion of debt | 19.4 | 17.0 | 6.4 | |||||||||
Deferred tax benefit | (157.7 | ) | (20.9 | ) | (91.9 | ) | ||||||
Other | 11.6 | 7.4 | 9.4 | |||||||||
Changes in assets and liabilities: | ||||||||||||
Accounts receivable | (320.1 | ) | (153.7 | ) | 7.8 | |||||||
Other assets | (78.7 | ) | 17.2 | (35.3 | ) | |||||||
Accounts payable | 140.1 | 1.7 | (51.3 | ) | ||||||||
Accrued expenses and other liabilities | 0.8 | (55.7 | ) | 43.5 | ||||||||
Net cash provided by operating activities | 798.6 | 625.4 | 90.8 | |||||||||
Investing activities | ||||||||||||
Payment for purchases of property and equipment | (503.8 | ) | (483.4 | ) | (249.0 | ) | ||||||
Proceeds from sale of assets | 79.1 | 68.9 | 60.3 | |||||||||
Proceeds from sale of business, net of $10.5 cash divested | — | 547.7 | — | |||||||||
Acquisition of businesses, net of cash acquired | — | — | (3,887.0 | ) | ||||||||
Loss on forward contract related to acquisition | — | — | (9.7 | ) | ||||||||
Other | — | 8.8 | — | |||||||||
Net cash (used in) provided by investing activities | (424.7 | ) | 142.0 | (4,085.4 | ) | |||||||
Financing activities | ||||||||||||
Repurchase of debt | (1,386.6 | ) | (1,889.2 | ) | — | |||||||
Proceeds from issuance of long-term debt | 819.2 | 1,377.8 | 4,151.8 | |||||||||
Repayment of long-term debt and capital leases | (106.4 | ) | (151.4 | ) | (1,215.6 | ) | ||||||
Proceeds from borrowings on ABL facility | 995.0 | 360.0 | — | |||||||||
Repayment of borrowings on ABL facility | (925.0 | ) | (330.0 | ) | — | |||||||
Payment of debt issuance costs | (16.8 | ) | (25.8 | ) | (42.9 | ) | ||||||
Payment for tax withholdings for restricted shares | (16.6 | ) | (11.1 | ) | — | |||||||
Dividends paid | (6.6 | ) | (5.4 | ) | (2.8 | ) | ||||||
Change in bank overdrafts | (2.8 | ) | (16.5 | ) | (12.3 | ) | ||||||
Proceeds from common stock and preferred stock offerings | 287.6 | — | 1,260.0 | |||||||||
Purchase of noncontrolling interests | — | (1.4 | ) | (459.7 | ) | |||||||
Payment for equity issuance costs | — | — | (31.9 | ) | ||||||||
Other | (7.4 | ) | 12.2 | (1.7 | ) | |||||||
Net cash (used in) provided by financing activities | (366.4 | ) | (680.8 | ) | 3,644.9 | |||||||
Effect of exchange rates on cash and cash equivalents | 16.0 | (3.0 | ) | (4.6 | ) | |||||||
Net increase (decrease) in cash and cash equivalents | 23.5 | 83.6 | (354.3 | ) | ||||||||
Cash and cash equivalents, beginning of year | 373.4 | 289.8 | 644.1 | |||||||||
Cash and cash equivalents, end of year | $ | 396.9 | $ | 373.4 | $ | 289.8 | ||||||
Supplemental disclosure of cash flow information: | ||||||||||||
Cash paid for interest | $ | 274.2 | $ | 363.1 | $ | 168.2 | ||||||
Cash paid for income taxes | $ | 78.5 | $ | 40.7 | $ | 14.5 | ||||||
See accompanying notes to consolidated financial statements.
59
XPO Logistics, Inc.
Consolidated Statements of Changes in Equity
For the Three Years Ended December 31, 2017, 2016 and 2015
Series A Preferred Stock | Series C Preferred Stock | Common Stock | |||||||||||||||||||||||||||||||||||||||||||
(Shares in thousands, dollars in millions) | Shares | Amount | Shares | Amount | Shares | Amount | Additional Paid-In Capital | Accumulated Deficit | Accumulated Other Comprehensive Income (Loss) | Total Stockholders’ Equity | Non-controlling Interests | Total Equity | |||||||||||||||||||||||||||||||||
Balance at December 31, 2014 | 73 | $ | 42.2 | — | $ | — | 77,422 | $ | 0.1 | $ | 1,831.9 | $ | (219.1 | ) | $ | — | $ | 1,655.1 | $ | — | $ | 1,655.1 | |||||||||||||||||||||||
Net loss | — | — | — | — | — | — | — | (191.1 | ) | — | (191.1 | ) | (0.5 | ) | (191.6 | ) | |||||||||||||||||||||||||||||
Other comprehensive loss | — | — | — | — | — | — | — | — | (72.3 | ) | (72.3 | ) | (6.3 | ) | (78.6 | ) | |||||||||||||||||||||||||||||
Transfer to noncontrolling interest from redeemable noncontrolling interest | — | — | — | — | — | — | 4.2 | — | — | 4.2 | 320.4 | 324.6 | |||||||||||||||||||||||||||||||||
Acquisition of noncontrolling interest | — | — | — | — | — | — | — | — | — | — | 30.1 | 30.1 | |||||||||||||||||||||||||||||||||
Exercise and vesting of stock compensation awards | — | — | — | — | 683 | — | 2.9 | — | — | 2.9 | — | 2.9 | |||||||||||||||||||||||||||||||||
Conversion of Series A preferred stock to common stock | — | (0.2 | ) | — | — | 64 | — | 0.2 | — | — | — | — | — | ||||||||||||||||||||||||||||||||
Proceeds from issuance of preferred stock, net of issuance costs | — | — | 563 | 548.5 | — | — | — | — | — | 548.5 | — | 548.5 | |||||||||||||||||||||||||||||||||
Conversion of Series C preferred stock to common stock | — | — | (563 | ) | (548.5 | ) | 12,501 | — | 548.5 | — | — | — | — | — | |||||||||||||||||||||||||||||||
Deemed distribution for recognition of beneficial conversion feature on preferred stock | — | — | — | — | — | — | 52.0 | (52.0 | ) | — | — | — | — | ||||||||||||||||||||||||||||||||
Proceeds from common stock offering, net of issuance costs | — | — | — | — | 15,499 | — | 679.6 | — | — | 679.6 | — | 679.6 | |||||||||||||||||||||||||||||||||
Issuance of common stock for acquisitions | — | — | — | — | 38 | — | 1.5 | — | — | 1.5 | — | 1.5 | |||||||||||||||||||||||||||||||||
Awards assumed in acquisition | — | — | — | — | — | — | 17.6 | — | — | 17.6 | — | 17.6 | |||||||||||||||||||||||||||||||||
Issuance of common stock upon conversion of convertible senior notes, net of tax | — | — | — | — | 3,316 | — | 55.6 | — | — | 55.6 | — | 55.6 | |||||||||||||||||||||||||||||||||
Dividend paid | — | — | — | — | — | — | — | (2.8 | ) | — | (2.8 | ) | — | (2.8 | ) | ||||||||||||||||||||||||||||||
Stock compensation expense | — | — | — | — | — | — | 18.3 | — | — | 18.3 | — | 18.3 | |||||||||||||||||||||||||||||||||
Balance at December 31, 2015 | 73 | $ | 42.0 | — | $ | — | 109,523 | $ | 0.1 | $ | 3,212.3 | $ | (465.0 | ) | $ | (72.3 | ) | $ | 2,717.1 | $ | 343.7 | $ | 3,060.8 | ||||||||||||||||||||||
Net income | — | — | — | — | — | — | — | 69.0 | — | 69.0 | 15.5 | 84.5 | |||||||||||||||||||||||||||||||||
Other comprehensive loss | — | — | — | — | — | — | — | — | (121.4 | ) | (121.4 | ) | (18.7 | ) | (140.1 | ) | |||||||||||||||||||||||||||||
Repurchase of noncontrolling interest | — | — | — | — | — | — | 2.6 | — | — | 2.6 | — | 2.6 | |||||||||||||||||||||||||||||||||
Exercise and vesting of stock compensation awards | — | — | — | — | 786 | — | 9.6 | — | — | 9.6 | — | 9.6 | |||||||||||||||||||||||||||||||||
Tax withholdings related to vesting of stock compensation | — | — | — | — | 512 | — | (11.1 | ) | — | — | (11.1 | ) | — | (11.1 | ) | ||||||||||||||||||||||||||||||
Conversion of Series A preferred stock to common stock | (1 | ) | (0.4 | ) | — | — | 93 | — | 0.4 | — | — | — | — | — | |||||||||||||||||||||||||||||||
Issuance of common stock upon conversion of convertible senior notes, net of tax | — | — | — | — | 173 | — | 2.8 | — | — | 2.8 | — | 2.8 | |||||||||||||||||||||||||||||||||
Dividend paid | — | — | — | — | — | — | — | (3.2 | ) | — | (3.2 | ) | (2.9 | ) | (6.1 | ) | |||||||||||||||||||||||||||||
Adoption of stock compensation standard | — | — | — | — | — | — | 1.3 | 6.3 | — | 7.6 | — | 7.6 | |||||||||||||||||||||||||||||||||
Stock compensation expense | — | — | — | — | — | — | 27.0 | — | — | 27.0 | — | 27.0 | |||||||||||||||||||||||||||||||||
Balance at December 31, 2016 | 72 | $ | 41.6 | — | $ | — | 111,087 | $ | 0.1 | $ | 3,244.9 | $ | (392.9 | ) | $ | (193.7 | ) | $ | 2,700.0 | $ | 337.6 | $ | 3,037.6 | ||||||||||||||||||||||
60
XPO Logistics, Inc.
Consolidated Statements of Changes in Equity (continued)
For the Three Years Ended December 31, 2017, 2016 and 2015
(Shares in thousands, dollars in millions) | Series A Preferred Stock | Common Stock | Additional Paid-In Capital | Accumulated Deficit | Accumulated Other Comprehensive Income (Loss) | Total Stockholders’ Equity | Non-controlling Interests | Total Equity | ||||||||||||||||||||||||||||||
Shares | Amount | Shares | Amount | |||||||||||||||||||||||||||||||||||
Balance at December 31, 2016 | 72 | $ | 41.6 | 111,087 | $ | 0.1 | $ | 3,244.9 | $ | (392.9 | ) | $ | (193.7 | ) | $ | 2,700.0 | $ | 337.6 | $ | 3,037.6 | ||||||||||||||||||
Net income | — | — | — | — | — | 340.2 | — | 340.2 | 20.0 | 360.2 | ||||||||||||||||||||||||||||
Other comprehensive income | — | — | — | — | — | — | 222.4 | 222.4 | 52.0 | 274.4 | ||||||||||||||||||||||||||||
Exercise and vesting of stock compensation awards | — | — | 219 | — | 1.4 | — | — | 1.4 | — | 1.4 | ||||||||||||||||||||||||||||
Tax withholdings related to vesting of stock compensation awards | — | — | 509 | — | (16.6 | ) | — | — | (16.6 | ) | — | (16.6 | ) | |||||||||||||||||||||||||
Issuance of common stock from offering | — | — | 5,000 | — | 287.6 | — | — | 287.6 | — | 287.6 | ||||||||||||||||||||||||||||
Conversion of Series A preferred stock to common stock | — | (0.4 | ) | 103 | — | 0.4 | — | — | — | — | — | |||||||||||||||||||||||||||
Issuance of common stock upon conversion of convertible senior notes, net of tax | — | — | 3,002 | — | 49.5 | — | — | 49.5 | — | 49.5 | ||||||||||||||||||||||||||||
Dividend paid | — | — | — | — | — | (2.9 | ) | — | (2.9 | ) | (4.0 | ) | (6.9 | ) | ||||||||||||||||||||||||
Impact of tax reform act | — | — | — | — | — | 13.0 | (13.0 | ) | — | — | — | |||||||||||||||||||||||||||
Stock compensation expense | — | — | — | — | 22.8 | — | — | 22.8 | — | 22.8 | ||||||||||||||||||||||||||||
Balance at December 31, 2017 | 72 | $ | 41.2 | 119,920 | $ | 0.1 | $ | 3,590.0 | $ | (42.6 | ) | $ | 15.7 | $ | 3,604.4 | $ | 405.6 | $ | 4,010.0 | |||||||||||||||||||
See accompanying notes to consolidated financial statements.
61
XPO Logistics, Inc.
Notes to Consolidated Financial Statements
Years Ended December 31, 2017, 2016 and 2015
1. Organization
Nature of Operations
XPO Logistics, Inc. and its subsidiaries (“XPO” or the “Company”) use an integrated network of people, technology and physical assets to help customers manage their goods more efficiently throughout their supply chains. The Company’s customers are multinational, national, mid-size and small enterprises. XPO runs its business on a global basis, with two reportable segments: Transportation and Logistics. See Note 4—Segment Reporting and Geographic Information for further information on the Company’s segments.
2. Basis of Presentation and Significant Accounting Policies
Basis of Presentation
The preparation of the consolidated financial statements in accordance with U.S. generally accepted accounting principles requires management to make estimates and assumptions that affect the reported amounts of assets and liabilities and the disclosure of contingencies at the date of the financial statements, as well as the reported amounts of revenue and expense during the reporting period. Estimates have been prepared on the basis of the most current and best available information, but actual results could differ materially from those estimates. The results of operations of acquired companies are included in the Company’s results from the closing date of the acquisition and forward.
Consolidation
The consolidated financial statements include the accounts of the Company and its majority-owned subsidiaries and variable interest entities (“VIEs”) for which the Company is the primary beneficiary. Intercompany accounts and transactions have been eliminated in the consolidated financial statements.
If the Company determines that it has a variable interest in a VIE, the Company then evaluates if it is the primary beneficiary of the VIE. The evaluation assesses whether the Company has the power to direct the activities that significantly affect the VIE’s economic performance, including having operational control over each VIE and operating the VIEs under the XPO brand or policies. When changes occur to the design of an entity, the Company reconsiders whether it is subject to the VIE model. The Company continuously evaluates whether it has a controlling financial interest in a VIE. Investors in these entities only have recourse to the assets owned by the entity and not to the Company’s general credit. The Company does not have implicit support arrangements with any VIE. Other than the special purpose entity which the Company consolidates related to the European Trade Securitization Program discussed in Note 10—Debt, assets and liabilities of VIEs for which the Company is the primary beneficiary are not significant to the Company’s consolidated financial statements.
The Company holds a controlling financial interest in other entities where it currently holds, directly or indirectly, more than 50% of the voting rights or where it exercises control through substantive participating rights or as a general partner. Where the Company is a general partner, it considers substantive removal rights held by other partners in determining if it holds a controlling financial interest. The Company reevaluates whether it has a controlling financial interest in these entities when its voting or substantive participating rights change. Income or loss attributable to noncontrolling interests is deducted from net income/loss to determine net income/loss attributable to XPO. The noncontrolling interest reflected in our consolidated financial statements primarily relates to the 13.75% minority interest of Norbert Dentressangle SA (“ND”).
62
Significant Accounting Policies
Revenue Recognition
In the Company’s Transportation segment, with the exception of the less-than-truckload (“LTL”) business, revenue is recognized at the point in time when delivery is complete and the shipping terms of the contract have been satisfied. Related costs of delivery and service are accrued and expensed in the same period the associated revenue is recognized. For the Company’s LTL business, revenue is recognized based on relative transit time and expenses are recognized as incurred.
In the Company’s Logistics segment, revenue is recognized based on specific, objective criteria which, as discussed below, are identified within the provisions of each contract. Related costs of delivery and service are accrued and expensed in the same period the associated revenue is recognized. Under certain supply chain contracts, billings in excess of revenue recognized are recorded as unearned revenue. Unearned revenue is recognized over the remaining contract period as services are provided. In addition, the Company has deferred certain recoverable direct and incremental costs related to the setup of logistics operations under long-term contracts. These deferred setup costs are recognized as expense over the contract term.
The Company’s Logistics segment recognizes a significant portion of its revenue based on objective criteria that do not require significant estimates or uncertainties. Revenue on cost-reimbursable contracts is recognized by applying a factor to costs as incurred, such factor being determined by the contract provisions. Revenue on unit-price contracts is recognized at the contractual selling prices or as work is completed. Revenue on time and material contracts is recognized at the contractual rates as the labor hours and direct expenses are incurred. Revenue from fixed-price contracts is recognized as services are provided, unless revenue is earned and obligations fulfilled in a different pattern. Certain contracts provide for labor handling charges to be billed for both incoming and outgoing handling of goods at the time the goods are received in a warehouse. For these contracts, revenue is recognized upon receipt for the amounts representing handling of incoming goods and deferred revenue is recorded for the performance of services related to the handling of outgoing goods, which is recognized once the related goods leave the warehouse. Storage revenue is recognized as it is earned based on the length of time the related product is stored in the warehouse. Generally, the contracts contain provisions for adjustments to future pricing based upon changes in volumes, services and other market conditions, such as inflation. Revenue relating to such incentive or contingency payments is recorded when the contingency is satisfied and the Company concludes the amounts are earned.
For all lines of business (other than the Company’s managed expedited freight business and the Company’s Logistics segment with respect to those transactions where its contract logistics business is serving as the customer’s agent in arranging purchased transportation), the Company reports revenue on a gross basis because XPO is the principal in the transaction. For those lines of business where the Company acts as an agent, revenue is recognized on a net basis.
The Company’s global forwarding operations collects certain taxes and duties on behalf of their customers as part of the services offered and arranged for international shipments. The Company presents these collections on a net basis.
Cash and Cash Equivalents
The Company considers all highly liquid investments with an original maturity of three months or less as of the date of purchase to be cash equivalents. Cash and cash equivalents at December 31, 2017 includes $53.3 million of cash collected on receivables which collateralize borrowings related to the European trade securitization program (see Note 10—Debt).
Accounts Receivable and Allowance for Doubtful Accounts
Accounts receivable are recorded at the contractual amount. The Company records its allowance for doubtful accounts based upon its assessment of various factors. The Company considers historical collection experience, the age of the accounts receivable balances, credit quality of the Company’s customers, any specific customer collection issues that have been identified, current economic conditions, and other factors that may affect the customers’ ability to pay. The Company writes off accounts receivable balances that have aged significantly once all collection efforts have been exhausted and the receivables are no longer deemed collectible from the customer.
63
The rollforward of the allowance for doubtful accounts is as follows:
Years Ended December 31, | ||||||||||||
(In millions) | 2017 | 2016 | 2015 | |||||||||
Beginning balance | $ | 26.3 | $ | 16.9 | $ | 9.8 | ||||||
Provision, charged to expense | 23.9 | 15.1 | 12.9 | |||||||||
Write-offs, less recoveries, and other adjustments | (7.8 | ) | (5.7 | ) | (5.8 | ) | ||||||
Ending balance | $ | 42.4 | $ | 26.3 | $ | 16.9 | ||||||
Property and Equipment
Property and equipment are generally recorded at cost, or in the case of acquired property and equipment, at fair value at the date of acquisition. Maintenance and repair expenditures are charged to expense as incurred. For internally-developed software, all costs incurred in the planning and evaluation stage of internally-developed computer software are expensed as incurred. Costs incurred during the application development stage are capitalized and included in property and equipment. Capitalized software also includes the fair value of acquired internally-developed technology.
Depreciation is computed on a straight-line basis over the estimated useful lives of the assets as follows:
Classification | Estimated Useful Life |
Buildings and leasehold improvements | Term of lease to 40 years |
Vehicles, containers, tractors, trailers and tankers | 3 to 14 years |
Rail cars and chassis | 15 to 30 years |
Machinery and equipment | 3 to 10 years |
Office and warehouse equipment | 3 to 10 years |
Computer software and equipment | 1 to 6 years |
Asset Retirement Obligations
A liability for an asset retirement obligation (“ARO”) is recorded in the period in which it is incurred. When an ARO liability is initially recorded, the Company capitalizes the cost by increasing the carrying amount of the related long-lived asset. For each subsequent period, the liability is increased for accretion expense and the capitalized cost is depreciated over the useful life of the related asset.
Goodwill
Goodwill consists of the excess of cost over the fair value of net assets acquired in business combinations. The Company performs an annual impairment test for goodwill as of August 31 unless events or circumstances indicate impairment of goodwill may have occurred before that time. The Company adopted Accounting Standards Update (“ASU”) 2017-04, Intangibles - Goodwill and Other (Topic 350): “Simplifying the Accounting for Goodwill Impairment” in connection with its annual impairment test as of August 31, 2017. ASU 2017-04 removes the requirement to perform a hypothetical purchase price allocation to measure goodwill impairment (often referred to as “Step 2”). Goodwill impairment, if any, would be measured at the amount by which a reporting unit’s carrying amount exceeds its fair value, not to exceed the carrying amount of goodwill.
Prior to the adoption of ASU 2017-04, the goodwill at the reporting units was subject to a two-step impairment test. The first step compared the book value of a reporting unit, including goodwill, with its fair value. If the book value of a reporting unit exceeds its fair value, the Company completed the second step in order to determine the amount of goodwill impairment loss that should be recorded. The Company determines fair values for each of the reporting units using an income approach. For purposes of the income approach, fair value is determined based on the present value of estimated future cash flows, discounted at an appropriate risk-adjusted rate. The Company uses its internal forecasts to estimate future cash flows and includes an estimate of long-term future growth rates based on its most recent views of the long-term outlook for the business.
64
Accounting guidance allows entities to perform a qualitative assessment (a “step-zero” test) before performing a quantitative analysis. If an entity determines that it is not more-likely-than-not that the fair value of a reporting unit is less than its carry amount, the entity would not need to perform the quantitative analysis described above. The qualitative assessment includes review of macroeconomic conditions, industry and market considerations, internal cost factors, and overall financial performance, among other areas.
For the 2017 goodwill assessment, the Company performed a step-zero qualitative analysis for six of its reporting units. Based on that qualitative assessment, the Company concluded that it is not more likely than not that the fair value of those reporting units was less than their carrying amounts and therefore, further quantitative analysis was not performed. For one reporting unit, the Company elected to proceed directly to the step one quantitative analysis. For the years ended December 31, 2017 and 2016, the Company did not recognize any goodwill impairment.
Intangible Assets
The Company’s intangible assets subject to amortization consist of customer relationships, trade names, and non-compete agreements. The Company reviews long-lived assets to be held-and-used for impairment whenever events or changes in circumstances indicate that the carrying amount of the assets may not be recoverable. If the sum of the undiscounted expected future cash flows over the remaining useful life of a long-lived asset group is less than its carrying amount, the asset is considered to be impaired. Impairment losses are measured as the amount by which the carrying amount of the asset group exceeds the fair value of the asset. The Company estimates fair value using the expected future cash flows discounted at a rate commensurate with the risks associated with the recovery of the asset. For the periods presented, the Company did not recognize any impairment of the identified intangible assets. Intangible assets are amortized on a straight-line basis or on a basis consistent with the pattern in which the economic benefits are realized. The range of estimated useful lives and the weighted-average useful lives of the respective intangible assets by type are as follows:
Classification | Estimated Useful Life | Weighted-Average Amortization Period |
Customer relationships | 5 to 16 years | 14 years |
Trade names | 3 years | 3 years |
Non-compete agreements | Term of agreement | 7 years |
Accrued Expenses
Accrued expenses is comprised of the following:
As of December 31, | ||||||||
(In millions) | 2017 | 2016 | ||||||
Accrued salaries and wages | $ | 580.6 | $ | 570.9 | ||||
Accrued transportation and facility charges | 437.7 | 266.9 | ||||||
Accrued value-added tax and other taxes | 176.2 | 145.5 | ||||||
Other accrued expenses | 331.3 | 398.8 | ||||||
Total Accrued Expenses | $ | 1,525.8 | $ | 1,382.1 | ||||
Self-Insurance
The Company uses a combination of self-insurance programs and large-deductible purchased insurance to provide for the costs of medical, casualty, liability, vehicular, cargo and workers’ compensation claims. The Company periodically evaluates the level of insurance coverage and adjusts insurance levels based on risk tolerance and premium expense.
The measurement and classification of self-insured costs requires the consideration of historical cost experience, demographic and severity factors, and judgments about current and expected levels of cost per claim and retention levels. These methods provide estimates of the undiscounted liability associated with claims incurred as of the balance sheet date, including estimates of claims incurred but not reported. Changes in these assumptions and factors can affect actual costs paid to settle the claims and those amounts may be different than estimates.
65
Advertising Costs
Advertising costs are expensed as incurred.
Accumulated Other Comprehensive Income
The components of accumulated other comprehensive income (“AOCI”), net of tax at December 31, 2017 and 2016, are as follows:
(In millions) | Foreign Currency Translation Adjustments | Derivative Hedges | Defined Benefit Plans Liability | Less: AOCI Attributable to Noncontrolling Interests | AOCI Attributable to the Company | |||||||||||||||
As of December 31, 2015 | $ | (68.5 | ) | $ | 6.9 | $ | (17.0 | ) | $ | 6.3 | $ | (72.3 | ) | |||||||
Other comprehensive (loss) income | (137.7 | ) | (7.1 | ) | 5.3 | 18.7 | (120.8 | ) | ||||||||||||
Amounts reclassified from AOCI | — | — | (0.6 | ) | — | (0.6 | ) | |||||||||||||
Net current period other comprehensive (loss) income | (137.7 | ) | (7.1 | ) | 4.7 | 18.7 | (121.4 | ) | ||||||||||||
As of December 31, 2016 | (206.2 | ) | $ | (0.2 | ) | (12.3 | ) | 25.0 | (193.7 | ) | ||||||||||
Other comprehensive income (loss) | 179.9 | 9.6 | 92.2 | (52.0 | ) | 229.7 | ||||||||||||||
Amounts reclassified from AOCI | — | (4.9 | ) | (2.4 | ) | — | (7.3 | ) | ||||||||||||
Net current period other comprehensive income (loss) | 179.9 | 4.7 | 89.8 | (52.0 | ) | 222.4 | ||||||||||||||
Impact of tax reform act | (16.9 | ) | 2.3 | 1.6 | — | (13.0 | ) | |||||||||||||
As of December 31, 2017 | $ | (43.2 | ) | $ | 6.8 | $ | 79.1 | $ | (27.0 | ) | $ | 15.7 | ||||||||
Income Taxes
The Company accounts for income taxes in accordance with Financial Accounting Standards Board (“FASB”) Accounting Standards Codification (“ASC”) Topic 740, “Income Taxes.” Income taxes and effective tax rates are calculated on a legal entity and jurisdictional basis relying on several factors, including pre-tax earnings, differences between tax laws and accounting rules, statutory tax rates, tax credits, uncertain tax positions, and valuation allowances. The Company uses judgment and estimates in evaluating its tax positions.
Under ASC 740, deferred income taxes arise from temporary differences between the tax basis of assets and liabilities and their reported amounts in the Consolidated Financial Statements. Valuation allowances are established when, in management’s judgment, it is more likely than not that its deferred tax assets will not be realized. In assessing the need for a valuation allowance, management weighs the available positive and negative evidence, including limitations on the use of tax losses and other carryforwards due to changes in ownership, historic information, and projections of future taxable income that include and exclude future reversals of taxable temporary differences.
The Company’s tax returns are subject to examination by U.S. Federal and state and foreign taxing jurisdictions. ASC 740 clarifies the accounting for uncertainty in income taxes recognized in a Company’s financial statements and prescribes a recognition threshold with measurement attributes for income tax positions taken or expected to be taken on a tax return. Under ASC 740, the impact of an uncertain tax position taken or expected to be taken on an income tax return must be recognized in the financial statements at the largest amount estimated to be sustained under the more likely than not principle. An uncertain income tax position will not be recognized in the financial statements if it does not meet this criteria. The Company adjusts these tax liabilities, including related interest and penalties, based on the current facts and circumstances. Recently enacted tax law changes, published rulings, court cases, and outcomes of tax audits are all considered. While the Company does not expect material changes, it is possible that its actual tax liability will differ from its established tax liabilities for unrecognized tax benefits which may impact its effective tax rate. While it is often difficult to predict the outcome of any particular tax position, the Company believes that its tax provisions reflect the more likely than not outcome of known tax contingencies. The Company reports tax-related interest and penalties as a component of income tax expense.
66
Foreign Currency Translation and Transactions
The assets and liabilities of foreign subsidiaries that use the local currency as their functional currency are translated to U.S. dollars (“USD”) using the exchange rate prevailing at each balance sheet date, with balance sheet currency translation adjustments recorded in AOCI on the Consolidated Balance Sheets. The assets and liabilities of foreign subsidiaries whose local currency is not their functional currency are remeasured from their local currency to their functional currency and then translated to USD. The results of operations of the Company’s foreign subsidiaries are translated to USD using average exchange rates prevailing for each period presented.
Foreign currency transactions recognized in the Consolidated Statements of Operations are converted to USD by applying the exchange rate prevailing on the date of the transaction. Gains and losses arising from foreign currency transactions and the effects of remeasuring monetary assets and liabilities are recorded in Foreign currency loss (gain) in the Consolidated Statements of Operations.
Foreign currency loss (gain) included in the Consolidated Statements of Operations consisted of the following:
Years ended December 31, | ||||||||||||
(In millions) | 2017 | 2016 | 2015 | |||||||||
Unrealized foreign currency option and forward contracts losses (gains) | $ | 49.4 | $ | (39.7 | ) | $ | 1.0 | |||||
Realized foreign currency option and forward contracts losses (gains) | 15.0 | (3.8 | ) | — | ||||||||
Foreign currency transaction and remeasurement (gains) losses | (6.8 | ) | 3.2 | 2.4 | ||||||||
Remeasurement loss on cash held to purchase ND | — | — | 31.7 | |||||||||
Loss on forward contract related to ND acquisition | — | — | 9.7 | |||||||||
Total foreign currency loss (gain) | $ | 57.6 | $ | (40.3 | ) | $ | 44.8 | |||||
Fair Value Measurements
ASC Topic 820, “Fair Value Measurements and Disclosures,” defines fair value as the price that would be received to sell an asset or paid to transfer a liability in an orderly transaction between market participants at the measurement date and classifies the inputs used to measure fair value into the following hierarchy:
• | Level 1—Quoted prices for identical instruments in active markets; |
• | Level 2—Quoted prices for similar instruments in active markets; quoted prices for identical or similar instruments in markets that are not active; and model-derived valuations in which all significant inputs are observable in active markets; and |
• | Level 3—Valuations based on inputs that are unobservable, generally utilizing pricing models or other valuation techniques that reflect management’s judgment and estimates. |
The fair value estimates are based upon certain market assumptions and information available to management. The carrying value of the following financial instruments approximated their fair values as of December 31, 2017 and 2016: cash and cash equivalents, accounts receivable, accounts payable, accrued expenses, and current maturities of long-term debt. Fair values approximate carrying values for these financial instruments as they are short-term in nature and are receivable or payable on demand. The Level 1 cash equivalents include money market funds valued using quoted prices in active markets. The Level 2 cash equivalents include short-term investments valued using published interest rates for instruments with similar terms and maturities. For information regarding the fair value hierarchy of the Company’s financial liabilities and derivative instruments, refer to Note 9—Derivative Instruments and Note 10—Debt, respectively.
67
The following table summarizes the fair value hierarchy of cash equivalents:
As of December 31, 2017 | ||||||||||||||||
(In millions) | Carrying Value | Fair Value | Level 1 | Level 2 | ||||||||||||
Cash equivalents | $ | 90.0 | $ | 90.0 | $ | 74.3 | $ | 15.7 | ||||||||
As of December 31, 2016 | ||||||||||||||||
(In millions) | Carrying Value | Fair Value | Level 1 | Level 2 | ||||||||||||
Cash equivalents | $ | 103.5 | $ | 103.5 | $ | 26.4 | $ | 77.1 | ||||||||
Derivative Instruments
The Company records all derivative instruments on the Consolidated Balance Sheets as assets or liabilities at fair value. The Company’s accounting treatment for changes in the fair value of derivative instruments depends on whether the instruments have been designated and qualify as part of a hedging relationship and, further, on the type of hedging relationship. For those derivative instruments that are designated and qualify as hedging instruments, the Company must designate the derivative based upon the exposure being hedged. The gain or loss resulting from fair value adjustments on cash flow hedges are recorded in AOCI on the Consolidated Balance Sheets until the hedged item is recognized in earnings and is presented in the same income statement line item as the earnings effect of the hedged item. The gains and losses on the net investment hedges are recorded as cumulative translation adjustments in AOCI to the extent that the instruments are effective in hedging the designated risk. Gains and losses on cash flow hedges and net investment hedges representing hedge components excluded from the assessment of effectiveness will be amortized into Interest expense in the Consolidated Statements of Operations in a systematic manner. Derivatives that are not designated as hedging instruments are adjusted to fair value through earnings and are recorded in Foreign currency loss (gain) in the Consolidated Statements of Operations, depending on the objective of the derivative.
Defined Benefit Pension Plans
Defined benefit pension plan obligations are calculated using various actuarial assumptions and methodologies. Assumptions include discount rates, inflation rates, expected long-term rate of return on plan assets, mortality rates, and other factors. The assumptions used in recording the projected benefit obligation and fair value of plan assets represent the Company’s best estimates based on information available regarding historical experience and factors that may cause future expectations to differ. Differences in actual experience or changes in assumptions could materially impact the Company’s obligation and future expense amounts.
The impact of plan amendments, actuarial gains and losses and prior-service costs are recorded in AOCI, and are generally amortized as a component of net periodic benefit cost over the remaining service period of the active employees covered by the defined benefit pension plans. Unamortized gains and losses are amortized only to the extent they exceed 10% of the higher of the fair value of plan assets or the projected benefit obligation of the respective plan.
Stock-Based Compensation
The Company accounts for stock-based compensation based on the equity instrument’s grant date fair value. For grants of restricted stock units (“RSUs”) subject to service- or performance-based vesting conditions only, the fair value is established based on the market price on the date of the grant. For grants of RSUs subject to market-based vesting conditions, the fair value is established using the Monte Carlo simulation lattice model. For grants of options and stock appreciation rights (“SARs”), the Company uses the Black-Scholes option pricing model to estimate the fair value of stock-based payment awards. The determination of the fair value of stock-based awards is affected by the Company’s stock price and a number of assumptions, including expected volatility, expected life, risk-free interest rate and expected dividends. The Company accounts for forfeitures as they occur.
The weighted-average fair value of each stock option is amortized over the requisite service period. For options with graded vesting, we recognize compensation cost on a straight-line basis over the requisite service period of the entire award; however, the amount of compensation cost recognized at any date will at least equal the portion of the grant
68
date value of the award that is vested as of that date. For the Company’s performance-based restricted stock units (“PRSUs”), the Company recognizes expense over the awards’ requisite service period based on the number of awards expected to vest with consideration to the actual and expected financial results. If achievement of the performance targets for a PRSU award is not considered to be probable, then no expense is recognized until achievement of such targets becomes probable.
New Accounting Standards
In May 2014, the FASB issued ASU 2014-09, Revenue (Topic 606): “Revenue from Contracts with Customers.” This new standard includes the required steps to achieve the core principle that an entity should recognize revenue to depict the transfer of promised goods or services to customers in an amount that reflects the consideration to which the entity expects to be entitled in exchange for those goods or services. The new standard will be effective for the Company’s annual and interim periods beginning January 1, 2018, and permits the use of either the retrospective or cumulative effect transition method. The Company will use the modified retrospective transition method. The main areas impacted by ASU 2014-09 include the recognition of revenue using proportionate delivery within the Company’s Transportation segment and gross versus net revenue presentation. On adoption, the Company will record an immaterial increase to total equity as of January 1, 2018 for the cumulative impact of adoption, primarily related to the recognition of in-transit revenue in the transportation business. The Company will provide expanded revenue recognition disclosures based on the new qualitative and quantitative disclosure requirements of the standard upon adoption.
In February 2016, the FASB issued ASU 2016-02, Leases (Topic 842). The core principle of this ASU is that a lessee should recognize the assets and liabilities that arise from leases, including operating leases. Under the new requirements, a lessee will recognize in the balance sheet a liability to make lease payments (the lease liability) and the right-of-use asset representing the right to the underlying asset for the lease term. For leases with a term of 12 months or less, the lessee is permitted to make an accounting policy election by class of underlying asset not to recognize lease assets and lease liabilities. The standard is effective for fiscal years beginning after December 15, 2018, including interim periods within those fiscal years. The Company is currently evaluating the effects this ASU will have on its consolidated financial statements and related disclosures. The Company currently discloses approximately $1,978.5 million in operating leases, refer to Note 16—Commitments and Contingencies, and will evaluate those contracts as well as other existing arrangements to determine if they qualify for lease accounting under the new standard. The Company does not plan to adopt the standard early.
In August 2016, the FASB issued ASU 2016-15, Statement of Cash Flows (Topic 230): “Classification of Certain Cash Receipts and Cash Payments (a consensus of the Emerging Issues Task Force).” This ASU addresses eight specific cash flow classification issues with the objective of reducing diversity in practice. Under the new standard, cash payments for debt prepayments or debt extinguishment costs should be classified as outflows for financing activities. Additional cash flow issues covered under the standard include: settlement of zero-coupon debt instruments or other debt instruments with coupon interest rates that are insignificant in relation to the effective interest rate of the borrowing, contingent consideration payments made after a business combination, proceeds from the settlement of insurance claims, proceeds from the settlement of corporate-owned life insurance policies, distributions received from equity method investees, beneficial interests in securitization transactions, and separately identifiable cash flows and application of the predominance principle. This ASU is effective for public entities for fiscal years beginning after December 15, 2017, including interim periods within that reporting period. The Company adopted this standard on January 1, 2018. Adoption was on a prospective basis and is not expected to have a material effect on the Company’s consolidated statement of cash flows.
In November 2016, the FASB issued ASU 2016-18, Statement of Cash Flows (Topic 230): “Restricted Cash.” This ASU requires that the statement of cash flows explain the change during the period in the total of cash, cash equivalents, and restricted cash. The standard is effective for the Company’s annual and interim periods beginning January 1, 2018 and requires retrospective adoption. The Company does not expect the adoption of this standard to have a material effect on its consolidated financial statements.
In March 2017, the FASB issued ASU 2017-07, Compensation - Retirement Benefits (Topic 715): “Improving the Presentation of Net Periodic Pension Cost and Net Periodic Postretirement Benefit Cost.” The ASU will change how employers that sponsor defined benefit pension and/or other postretirement benefit plans present the cost of the benefits in the statements of operations. This cost, commonly referred to as the “net periodic benefit cost,” is
69
comprised of several components that reflect different aspects of the arrangement with the employee, including the effect of the related funding. Currently, the Company aggregates the various components of the net periodic benefit cost (including interest cost and the expected return on plan assets) for presentation purposes and includes these costs within Operating income (loss) in the Consolidated Statements of Operations. Under the new guidance, these costs will be presented below Operating income (loss). This ASU is effective for fiscal years beginning after December 15, 2017, including interim periods within that reporting period. The Company will be adopting the standard for the year ending December 31, 2018. The adoption of the standard will have no impact on net income. In connection with the adoption of this new standard, prior periods will be recast to reflect the new presentation. The amount of net periodic benefit cost that will be reclassified below operating income for fiscal years 2017 and 2016 was approximately $42 million and $25 million of income, respectively.
In May 2017, the FASB issued ASU 2017-09, Compensation - Stock Compensation (Topic 718): “Scope of Modification Accounting.” This ASU provides guidance about which changes to the terms or conditions of a share-based payment award require an entity to apply modification accounting. Under the new standard, modification accounting applies unless all the following conditions are met: (i) the fair value of the modified award is the same as the fair value of the original award immediately before the modification, (ii) the vesting conditions of the modified award are the same as the vesting conditions of the original award immediately before the modification, and (iii) the classification of the modified award as an equity instrument or a liability instrument is the same as the classification the original award immediately before the original award is modified. Generally speaking, modification accounting requires an entity to calculate and recognize the incremental fair value of the modified award as compensation cost on the date of modification (for a vested award) or over the remaining service period (for an unvested award). This ASU is effective for fiscal years beginning after December 15, 2017, including interim periods within that reporting period; however, early adoption is permitted. The impact of this guidance, which was applied prospectively on January 1, 2018, is dependent on future modifications, if any, to the Company’s share-based payment awards.
In August 2017, the FASB issued ASU 2017-12, Derivatives and Hedging (Topic 815): “Targeted Improvements to Accounting for Hedging Activities.” This ASU is effective for fiscal years beginning after December 15, 2018, including interim periods within that reporting period; however, early adoption is permitted. The purpose of the amendments in this ASU is to better align an entity’s risk management activities and financial reporting for hedging relationships, simplify hedge accounting requirements, and improve the disclosures of hedging arrangements. The Company early-adopted the standard effective October 1, 2017. The adoption of the standard did not have a material impact on the Company’s consolidated financial statements. For additional information, refer to Note 9—Derivative Instruments.
3. Acquisitions and Divestitures
Con-way Inc.
In October 2015, XPO completed its acquisition of Con-way Inc. (“Con-way”), a transportation and logistics company. The fair value of the total consideration paid by XPO was $2,317.8 million, net of cash acquired of $437.3 million, consisting of $2,706.6 million of cash paid at the time of closing for the purchase of all of Con-way’s outstanding shares of common stock, par value $0.625 (the “Con-way Shares”), $17.6 million representing the portion of replacement equity awards attributable to pre-acquisition service, and a $30.9 million liability for the settlement of certain Con-way stock-based compensation awards.
(In millions) | ||||
Cash consideration | $ | 2,706.6 | ||
Liability for equity award settlement | 30.9 | |||
Portion of replacement equity awards attributable to pre-acquisition service | 17.6 | |||
Cash acquired | (437.3 | ) | ||
Total consideration | $ | 2,317.8 | ||
70
Norbert Dentressangle SA
In April 2015, XPO entered into (1) a Share Purchase Agreement (the “Share Purchase Agreement”) relating to ND, a French société anonyme and (2) a Tender Offer Agreement (the “Tender Offer Agreement” and, together with the Share Purchase Agreement, the “ND Transaction Agreements”) between XPO and ND. The ND Transaction Agreements provided for the acquisition of a majority stake in ND by XPO, followed by an all-cash simplified tender offer by XPO to acquire the remaining outstanding ND shares.
In June 2015, pursuant to the terms of the Share Purchase Agreement, XPO purchased approximately 67% of the share capital of ND and all of the outstanding share subscription warrants granted by ND to employees, directors or other officers of ND and its affiliates (together, the “Share Purchase”). Total cash consideration paid by XPO for the Share Purchase was €1,437.0 million, or $1,603.9 million, excluding acquired debt. This cash consideration reflected only that portion of the fair value of the warrants attributable to service performed by employees, officers, or directors of ND and its affiliates prior to the acquisition date. The remaining balance of the fair value of the warrants was recorded as compensation expense in the post-combination period. The Company also agreed to settle certain ND performance stock awards. Similar to the warrants, the consideration paid by XPO for these stock awards of €11.8 million, or $13.2 million, included only that portion of the fair value attributable to service performed prior to the acquisition date with the balance recorded as compensation expense in the post-combination period. The performance shares were settled in cash with 50% of the awards paid 18 months from the acquisition date and the remaining 50% paid 36 months from the acquisition date. Further, as a result of the acquisition, the Company repaid certain ND indebtedness and related interest rate swap liabilities totaling €628.5 million, or $705.0 million.
In June 2015, XPO launched a mandatory simplified cash offer (the “Tender Offer”) to purchase all of the outstanding ordinary shares of ND (other than the shares already owned by XPO). During the Tender Offer period, the minority shareholders had the right to sell their shares of ND to the Company and the Company had the obligation to purchase those shares at the Tender Offer price. Once the Tender Offer closed on July 17, 2015, the noncontrolling interest is classified as noncontrolling interest in equity in the consolidated balance sheet. The Company purchased 1,921,553 shares under the Tender Offer and acquired a total of approximately 86.25% of the share capital of ND. The total fair value of the consideration paid by XPO in connection with the Tender Offer was €702.5 million, or $784.2 million, which is based on the quoted market price of ND shares on the acquisition date. The total consideration paid by XPO for ND is summarized in the table below in Euros (“EUR”) and USD:
(In millions) | In EUR | In USD | ||||||
Cash consideration | € | 1,437.0 | $ | 1,603.9 | ||||
Liability for performance share settlement | 11.8 | 13.2 | ||||||
Repayment of indebtedness | 628.5 | 705.0 | ||||||
Noncontrolling interests | 702.5 | 784.2 | ||||||
Cash acquired | (134.6 | ) | (151.0 | ) | ||||
Total consideration | € | 2,645.2 | $ | 2,955.3 | ||||
Bridge Terminal Transport Services, Inc.
In May 2015, the Company acquired all of the outstanding capital stock of Bridge Terminal Transport Services, Inc. (“BTT”), a leading asset-light drayage provider in the United States. The fair value of the total consideration paid by XPO under the BTT Stock Purchase Agreement was $103.8 million and consisted of $103.1 million of cash paid at the time of closing, including an estimate of the working capital adjustment, and $0.7 million of equity.
UX Specialized Logistics
In February 2015, pursuant to an Asset Purchase Agreement between the Company and Earlybird Delivery Systems, LLC, the Company acquired certain assets of UX Specialized Logistics, LLC (“UX”). The fair value of the total consideration paid under the UX Asset Purchase Agreement was $58.9 million and consisted of $58.1 million of cash paid at the time of closing, including an estimate of the working capital adjustment, and $0.8 million of equity. UX provided last mile logistics and same day delivery services for major retail chains and e-commerce companies.
71
Pro Forma Financial Information (Unaudited)
The following unaudited pro forma consolidated results of operations for the year ended December 31, 2015 present consolidated information of the Company as if the acquisitions of Con-way and ND had occurred as of January 1, 2015:
Pro Forma Year Ended December 31, | ||||
(Dollars in millions, except per share data) | 2015 | |||
Revenue | $ | 14,833.5 | ||
Operating income | 233.3 | |||
Net loss | (174.5 | ) | ||
Basic loss per share | (2.11 | ) | ||
Diluted loss per share | (2.11 | ) | ||
The unaudited pro forma consolidated results for the year ended December 31, 2015 was prepared using the acquisition method of accounting and is based on the historical financial information of Con-way, ND, and the Company. The unaudited pro forma consolidated results incorporate historical financial information for all significant acquisitions, without effect to the sale of the North American Truckload operations noted below. The historical financial information has been adjusted to give effect to pro forma adjustments that are: (i) directly attributable to the acquisition, (ii) factually supportable and (iii) expected to have a continuing impact on the combined results. The unaudited pro forma consolidated results are not necessarily indicative of what the Company’s consolidated results of operations actually would have been had it completed these acquisitions on January 1, 2015.
Divestitures
North American Truckload Operations
In October 2016, pursuant to a Stock Purchase Agreement between the Company and a subsidiary of TransForce Inc. (“TransForce”), the Company divested its North American Truckload operations (formerly known as Con-way Truckload) for approximately $558.0 million cash consideration, subject to certain adjustments. The Company also agreed to provide certain specified transition services to TransForce following the transaction. For the period from January 1, 2016 through October 26, 2016, these North American Truckload operations generated revenue of $431.9 million and operating income of $31.9 million. These North American Truckload operations are included in the Company’s Transportation segment through the date of sale. As the proceeds from the sale equaled the carrying value (inclusive of goodwill), there was no gain or loss recognized in connection with this divestiture.
4. Segment Reporting and Geographic Information
The Company is organized into two reportable segments: Transportation Services and Logistics Services.
In the Transportation segment, the Company provides multiple services to facilitate the movement of raw materials, parts and finished goods. The Company accomplishes this by using its proprietary transportation technology, third-party carriers and Company-owned trucks and service centers. XPO’s transportation services include: freight brokerage, last mile, LTL, full truckload, and global forwarding services. Freight brokerage, last mile, and global forwarding are all non-asset or asset-light businesses. LTL and full truckload are asset-based.
In the Logistics segment, referred to as supply chain, the Company provides a range of contract logistics services, including highly engineered and customized solutions, value-added warehousing and distribution, cold chain solutions and other inventory management solutions. Additionally, the Company performs e-commerce fulfillment, order personalization, warehousing, reverse logistics, storage, factory support, aftermarket support, manufacturing, distribution, packaging and labeling, as well as supply chain optimization services such as production flow management.
Certain of the Company’s operating companies provide transportation and related services for other companies outside their reportable segment. Billings for such services are based on negotiated rates, which the Company
72
believes approximate fair value, and are reflected as revenues of the billing segment. These rates are adjusted from time to time based on market conditions. Such intersegment revenues and expenses are eliminated in the Company’s consolidated results and are not separately identified in the following segment information, because the amounts are not material.
Corporate includes corporate headquarters costs for executive officers and certain legal and financial functions, as well as certain other costs and credits not attributed to the Company’s core business. These costs are not allocated to the business segments.
The Company’s Chief Executive Officer, who is the chief operating decision maker (“CODM”), regularly reviews financial information at the reporting segment level in order to make decisions about resources to be allocated to the segments and to assess their performance. Segment results that are reported to the CODM include items directly attributable to a segment as well as those that can be allocated on a reasonable basis. Asset information by segment is not provided to the Company’s CODM as the majority of the Company’s assets are managed at the corporate level.
The Company evaluates performance based on the various financial measures of the respective business segments. The following table presents a reconciliation of reportable segment selected financial data to the consolidated financial statements totals for the years ended December 31, 2017, 2016 and 2015, respectively:
(In millions) | Transportation | Logistics | Corporate | Eliminations | Total | |||||||||||||||
Year Ended December 31, 2017 | ||||||||||||||||||||
Revenue | $ | 9,820.5 | $ | 5,722.7 | $ | — | $ | (162.4 | ) | $ | 15,380.8 | |||||||||
Operating income (loss) | 538.8 | 249.2 | (164.8 | ) | — | 623.2 | ||||||||||||||
Depreciation and amortization | 439.4 | 211.0 | 8.0 | — | 658.4 | |||||||||||||||
Year Ended December 31, 2016 | ||||||||||||||||||||
Revenue | $ | 9,457.3 | $ | 5,323.9 | $ | — | $ | (161.8 | ) | $ | 14,619.4 | |||||||||
Operating income (loss) | 438.0 | 209.5 | (159.4 | ) | — | 488.1 | ||||||||||||||
Depreciation and amortization | 449.1 | 192.3 | 2.0 | — | 643.4 | |||||||||||||||
Year Ended December 31, 2015 | ||||||||||||||||||||
Revenue | $ | 4,924.4 | $ | 2,768.4 | $ | — | $ | (69.6 | ) | $ | 7,623.2 | |||||||||
Operating income (loss) | 51.6 | 81.6 | (162.0 | ) | 0.2 | (28.6 | ) | |||||||||||||
Depreciation and amortization | 226.5 | 136.9 | 1.5 | — | 364.9 | |||||||||||||||
For segment reporting purposes by geographic region, revenues are attributed to the sales office location. The following table presents revenues generated by geographical area:
Years Ended December 31, | ||||||||||||
(In millions) | 2017 | 2016 | 2015 | |||||||||
Revenue | ||||||||||||
United States | $ | 9,162.6 | $ | 8,758.0 | $ | 4,278.5 | ||||||
North America (excluding United States) | 297.9 | 322.0 | 166.3 | |||||||||
France | 2,006.1 | 1,902.7 | 1,018.8 | |||||||||
United Kingdom | 1,798.9 | 1,700.9 | 1,063.5 | |||||||||
Europe (excluding France and United Kingdom) | 1,930.3 | 1,644.5 | 904.6 | |||||||||
Asia | 170.3 | 264.3 | 171.9 | |||||||||
Other | 14.7 | 27.0 | 19.6 | |||||||||
Total | $ | 15,380.8 | $ | 14,619.4 | $ | 7,623.2 | ||||||
73
As of December 31, 2017 and 2016, the Company held long-lived tangible and definite-lived intangible assets outside of the United States of $1,382.5 million and $1,213.3 million, respectively.
5. Restructuring Charges
In conjunction with various acquisitions, the Company has initiated a facility rationalization and severance program to close facilities and reduce employment. These initiatives are intended to improve the Company’s efficiency and profitability.
The restructuring charges incurred during the years ended December 31, 2017 and 2016, and included in the Company’s Consolidated Statements of Operations as Sales, general and administrative expense (“SG&A”), direct operating expense, and cost of transportation and services, are summarized below.
Year ended December 31, 2017 | ||||||||||||||||||||
(In millions) | Reserve Balance at December 31, 2016 | Charges Incurred | Payments | Foreign Exchange and Other | Reserve Balance at December 31, 2017 | |||||||||||||||
Transportation | ||||||||||||||||||||
Contract termination | $ | — | $ | 0.5 | $ | — | $ | — | $ | 0.5 | ||||||||||
Facilities | 1.4 | 0.2 | (1.3 | ) | — | 0.3 | ||||||||||||||
Severance | 5.8 | 23.3 | (16.2 | ) | 0.8 | 13.7 | ||||||||||||||
Total | 7.2 | 24.0 | (17.5 | ) | 0.8 | 14.5 | ||||||||||||||
Logistics | ||||||||||||||||||||
Contract termination | 0.7 | — | (0.4 | ) | (0.3 | ) | — | |||||||||||||
Facilities | 0.5 | — | (0.5 | ) | — | — | ||||||||||||||
Severance | 16.1 | 6.7 | (18.8 | ) | 1.1 | 5.1 | ||||||||||||||
Total | 17.3 | 6.7 | (19.7 | ) | 0.8 | 5.1 | ||||||||||||||
Corporate | ||||||||||||||||||||
Contract termination | 0.3 | — | (0.3 | ) | — | — | ||||||||||||||
Facilities | — | — | — | — | — | |||||||||||||||
Severance | 0.4 | 2.9 | (2.0 | ) | — | 1.3 | ||||||||||||||
Total | 0.7 | 2.9 | (2.3 | ) | — | 1.3 | ||||||||||||||
Total | $ | 25.2 | $ | 33.6 | $ | (39.5 | ) | $ | 1.6 | $ | 20.9 | |||||||||
74
Year ended December 31, 2016 | ||||||||||||||||||||
(In millions) | Reserve Balance at December 31, 2015 | Charges Incurred | Payments | Foreign Exchange and Other | Reserve Balance at December 31, 2016 | |||||||||||||||
Transportation | ||||||||||||||||||||
Contract termination | $ | 0.1 | $ | 1.8 | $ | (1.9 | ) | $ | — | $ | — | |||||||||
Facilities | 0.6 | 1.7 | (0.9 | ) | — | 1.4 | ||||||||||||||
Severance | 26.7 | 5.1 | (25.9 | ) | (0.1 | ) | 5.8 | |||||||||||||
Total | 27.4 | 8.6 | (28.7 | ) | (0.1 | ) | 7.2 | |||||||||||||
Logistics | ||||||||||||||||||||
Contract termination | 0.8 | 2.2 | (2.3 | ) | — | 0.7 | ||||||||||||||
Facilities | — | 0.7 | (0.2 | ) | — | 0.5 | ||||||||||||||
Severance | 25.5 | 14.7 | (23.5 | ) | (0.6 | ) | 16.1 | |||||||||||||
Total | 26.3 | 17.6 | (26.0 | ) | (0.6 | ) | 17.3 | |||||||||||||
Corporate | ||||||||||||||||||||
Contract termination | 4.0 | — | (3.7 | ) | — | 0.3 | ||||||||||||||
Facilities | — | 0.1 | (0.1 | ) | — | — | ||||||||||||||
Severance | 3.5 | 1.2 | (4.3 | ) | — | 0.4 | ||||||||||||||
Total | 7.5 | 1.3 | (8.1 | ) | — | 0.7 | ||||||||||||||
Total | $ | 61.2 | $ | 27.5 | $ | (62.8 | ) | $ | (0.7 | ) | $ | 25.2 | ||||||||
6. Property and Equipment
The following table outlines the Company’s property and equipment:
December 31, | ||||||||
(In millions) | 2017 | 2016 | ||||||
Property and Equipment | ||||||||
Land | $ | 410.1 | $ | 442.0 | ||||
Buildings and leasehold improvements | 557.6 | 503.8 | ||||||
Vehicles, tractors, trailers and tankers | 1,463.7 | 1,194.2 | ||||||
Machinery and equipment | 488.7 | 370.9 | ||||||
Office and warehouse equipment | 158.7 | 113.3 | ||||||
Computer software and equipment | 694.4 | 503.1 | ||||||
3,773.2 | 3,127.3 | |||||||
Less: Accumulated depreciation and amortization | (1,109.5 | ) | (589.9 | ) | ||||
Total Property and Equipment, net | $ | 2,663.7 | $ | 2,537.4 | ||||
Depreciation of property and equipment and amortization of computer software was $487.7 million, $466.0 million and $203.0 million for the years ended December 31, 2017, 2016 and 2015, respectively. Assets represented by capital leases, net of accumulated depreciation, were $243.8 million and $100.1 million at December 31, 2017 and 2016, respectively, and are included primarily in vehicles, tractors, trailers and tankers. Property and equipment acquired through capital leases was $145.1 million and $70.9 million in 2017 and 2016, respectively. The net book value of capitalized internally-developed software totaled $205.6 million and $132.1 million as of December 31, 2017 and 2016, respectively.
75
7. Goodwill
The following is a summary of the changes in the gross carrying amounts of goodwill by segment. The 2016 adjustments are the result of 2015 acquisitions for which the measurement period remained open, as well as the impact of foreign exchange translation.
(In millions) | Transportation | Logistics | Total | |||||||||
Goodwill at December 31, 2015 | $ | 2,504.7 | $ | 2,105.9 | $ | 4,610.6 | ||||||
Divestiture | (290.6 | ) | — | (290.6 | ) | |||||||
Property and equipment and intangible asset fair value adjustments | 95.8 | 40.0 | 135.8 | |||||||||
Other fair value adjustments | 140.5 | (54.6 | ) | 85.9 | ||||||||
Deferred tax and other tax adjustments | (53.1 | ) | (29.6 | ) | (82.7 | ) | ||||||
Impact of foreign exchange translation | (46.8 | ) | (86.4 | ) | (133.2 | ) | ||||||
Goodwill at December 31, 2016 | 2,350.5 | 1,975.3 | 4,325.8 | |||||||||
Impact of foreign exchange translation | 107.6 | 130.2 | 237.8 | |||||||||
Goodwill at December 31, 2017 | $ | 2,458.1 | $ | 2,105.5 | $ | 4,563.6 | ||||||
8. Intangible Assets
The following table outlines the Company’s identifiable intangible assets:
December 31, 2017 | December 31, 2016 | |||||||||||||||
(In millions) | Gross Carrying Amount | Accumulated Amortization | Gross Carrying Amount | Accumulated Amortization | ||||||||||||
Definite-lived intangibles | ||||||||||||||||
Customer relationships | $ | 1,924.1 | $ | 494.1 | $ | 1,848.3 | $ | 326.3 | ||||||||
Trade name | 54.1 | 51.8 | 47.5 | 39.9 | ||||||||||||
Non-compete agreements | 16.6 | 13.6 | 16.0 | 10.9 | ||||||||||||
$ | 1,994.8 | $ | 559.5 | $ | 1,911.8 | $ | 377.1 | |||||||||
Estimated future amortization expense for amortizable intangible assets for the next five years is as follows:
(In millions) | 2018 | 2019 | 2020 | 2021 | 2022 | Thereafter | ||||||||||||||||||
Estimated amortization expense | $ | 160.4 | $ | 154.0 | $ | 147.9 | $ | 140.3 | $ | 130.3 | $ | 702.4 | ||||||||||||
Actual amounts of amortization expense may differ from estimated amounts due to changes in foreign currency exchange rates, additional intangible asset acquisitions, impairment of intangible assets, accelerated amortization of intangible assets and other events.
Intangible asset amortization expense recorded in SG&A was $164.0 million, $174.4 million and $160.8 million for the years ended December 31, 2017, 2016 and 2015, respectively.
9. Derivative Instruments
In the normal course of business, the Company is exposed to certain risks arising from business operations and economic factors, including fluctuations in interest rates and foreign currencies. To manage the volatility related to this exposure to fluctuations in interest rates and foreign currencies, the Company uses derivative instruments. The objective of these derivative instruments is to reduce fluctuations in the Company’s earnings and cash flows associated with changes in foreign currency exchange rates and interest rates. These financial instruments are not used for trading or other speculative purposes. The Company has not historically incurred, and does not expect to incur in the future, any losses as a result of counterparty default.
76
The Company formally documents all relationships between hedging instruments and hedged items, as well as the risk management objective and strategy for undertaking various hedge transactions. This process includes linking cash flow hedges to specific forecasted transactions or variability of cash flow to be paid. The Company also formally assesses, both at the hedge’s inception and on an ongoing basis, whether the designated derivative instruments that are used in hedging transactions are highly effective in offsetting changes in cash flow of hedged items. When a derivative instrument is determined not to be highly effective as a hedge or the underlying hedged transaction is no longer probable, hedge accounting is discontinued prospectively.
The following table presents the account on the Consolidated Balance Sheets in which the Company’s derivative instruments have been recognized, the fair value hierarchy level applicable to each type of derivative instrument, and the related notional amounts and fair values:
December 31, 2017 | ||||||||||||||||
Derivative Assets | Derivative Liabilities | |||||||||||||||
(In millions) | Notional Amount | Balance Sheet Location | Fair Value | Balance Sheet Location | Fair Value | |||||||||||
Derivatives designated as hedges: | ||||||||||||||||
Cross-currency swap agreements | $ | 1,303.7 | Other long-term assets | $ | — | Other long-term liabilities | $ | (146.4 | ) | |||||||
Derivatives not designated as hedges: | ||||||||||||||||
Foreign currency option and forward contracts | 1,038.0 | Other current assets | 2.2 | Other current liabilities | (15.5 | ) | ||||||||||
Total | $ | 2.2 | $ | (161.9 | ) | |||||||||||
December 31, 2016 | ||||||||||||||||
Derivative Assets | Derivative Liabilities | |||||||||||||||
(In millions) | Notional Amount | Balance Sheet Location | Fair Value | Balance Sheet Location | Fair Value | |||||||||||
Derivatives designated as hedges: | ||||||||||||||||
Cross-currency swap agreements | $ | 730.9 | Other long-term assets | $ | 11.9 | Other long-term liabilities | $ | (6.9 | ) | |||||||
Cross-currency swap agreements | 3.3 | Other current assets | 0.1 | Other current liabilities | — | |||||||||||
Interest rate swaps | 105.4 | Other current assets | — | Other current liabilities | (2.3 | ) | ||||||||||
Derivatives not designated as hedges: | ||||||||||||||||
Foreign currency option and forward contracts | 552.2 | Other current assets | 18.8 | Other current liabilities | (1.0 | ) | ||||||||||
Foreign currency option and forward contracts | 742.6 | Other long-term assets | 26.7 | Other long-term liabilities | (5.8 | ) | ||||||||||
Total | $ | 57.5 | $ | (16.0 | ) | |||||||||||
The fair value of the derivatives is classified as Level 2 within the fair value hierarchy. The derivatives are valued using inputs other than quoted prices, such as foreign exchange rates and yield curves.
77
The effect of derivative instruments designated as hedges and nonderivatives designated as hedges in the Consolidated Statements of Operations for the years ended December 31, 2017, 2016, and 2015 are as follows:
Amount of Gain (Loss) Recognized in Other Comprehensive Income on Derivative | Amount of Gain (Loss) Reclassified from AOCI into Net Income | Amount of Gain (Loss) Recognized in Income on Derivative (Amount Excluded from Effectiveness Testing) | ||||||||||||||||||
(In millions) | 2017 | 2016 | 2015 | 2017 | 2017 | |||||||||||||||
Derivatives designated as cash flow hedges: | ||||||||||||||||||||
Cross-currency swap agreements | $ | (21.0 | ) | $ | — | $ | — | $ | (3.3 | ) | $ | 0.4 | ||||||||
Interest rate swaps | 2.4 | 4.4 | (1.4 | ) | — | — | ||||||||||||||
Derivatives designated as net investment hedges: | ||||||||||||||||||||
Cross-currency swap agreements | (99.8 | ) | 15.3 | 4.9 | — | 7.8 | ||||||||||||||
Nonderivatives designated as hedges: | ||||||||||||||||||||
Foreign currency denominated notes | 7.9 | (26.9 | ) | 4.7 | — | — | ||||||||||||||
Total | $ | (110.5 | ) | $ | (7.2 | ) | $ | 8.2 | $ | (3.3 | ) | $ | 8.2 | |||||||
There were no gains (losses) reclassified out of AOCI into net income for the years ended December 31, 2016 and 2015.
The pre-tax gain (loss) recognized in earnings in the Consolidated Statements of Operations for derivatives not designated as hedging instruments was as follows:
Years Ended December 31, | ||||||||||||
(In millions) | 2017 | 2016 | 2015 | |||||||||
Interest rate swaps (1) | $ | — | $ | 0.7 | $ | (1.0 | ) | |||||
Foreign currency option and forward contracts (2) | (64.3 | ) | 43.5 | (9.7 | ) | |||||||
Total | $ | (64.3 | ) | $ | 44.2 | $ | (10.7 | ) | ||||
(1) | Included in interest expense. |
(2) | Included in foreign currency (loss) gain. |
Cross-Currency Swap Agreements
In May 2017, the Company entered into certain cross-currency swap agreements to manage the related foreign currency exchange risk by effectively converting the fixed-rate USD-denominated Senior Notes due 2023 (see Note 10—Debt), including the semi-annual interest payments, to fixed-rate, EUR-denominated debt. The risk management objective of these transactions is to manage foreign currency risk relating to net investments in subsidiaries denominated in foreign currencies and reduce the variability in the functional currency equivalent cash flows of the Senior Notes due 2023.
During the term of the swap contracts, the Company will receive quarterly interest payments in March, June, September and December of each year from the counterparties based on USD fixed interest rates, and the Company will make quarterly interest payments in March, June, September and December of each year to the counterparties based on EUR fixed interest rates. At maturity, the Company will repay the original principal amount in EUR and receive the principal amount in USD.
In 2015, in connection with the issuance of the Senior Notes due 2022, the Company entered into certain cross-currency swap agreements to manage the related foreign currency exchange risk by effectively converting a portion of the fixed-rate USD-denominated Senior Notes due 2022, including the semi-annual interest payments, to fixed-rate, EUR-denominated debt. The risk management objective is to manage foreign currency risk relating to net
78
investments in subsidiaries denominated in foreign currencies and reduce the variability in the functional currency equivalent cash flows of a portion of the Senior Notes due 2022. During the term of the swap contracts, the Company will receive semi-annual interest payments in June and December of each year from the counterparties based on USD fixed interest rates, and the Company will make semi-annual interest payments in June and December of each year to the counterparties based on EUR fixed interest rates. At maturity, the Company will repay the original principal amount in EUR and receive the principal amount in USD.
The Company has designated the cross-currency swap agreements as qualifying hedging instruments and is accounting for these as net investment hedges. The gains and losses resulting from fair value adjustments to the cross-currency swap agreements are recorded as cumulative translation adjustments in AOCI to the extent that the cross-currency swaps are effective in hedging the designated risk. In the fourth quarter of 2017, and in accordance with the guidance in ASU 2017-12, the Company simplified its method of assessing the effectiveness of its net investment hedging relationships. Under this method, for each reporting period, the change in the fair value of the cross-currency swaps is initially recognized in AOCI. The effective portion of the change in the fair value due to foreign exchange remains in AOCI and the remaining ineffective portion will initially remain in AOCI and then get reclassified from AOCI to interest expense each period in a systematic manner. Cash flows related to the cross-currency swaps that are treated as net investment hedges are included in Operating activities on the Consolidated Statements of Cash Flows.
Additionally, subsequent to the adoption of ASU 2017-12, a portion of the cross currency swap that hedges the Senior Notes due 2023 was de-designated as a net investment hedge and re-designated with a larger notional amount as a cash flow hedge. This cash flow hedge was entered into to manage the related foreign currency exposure from intercompany loans. The amounts in AOCI related to the net investment hedge at the date of de-designation were recognized as cumulative translation adjustments and will remain in AOCI until the subsidiary is sold or substantially liquidated. For the new cash flow hedge, the Company will reclassify a portion of AOCI to earnings to offset the foreign exchange impact in earnings created by the intercompany loans. The Company will also amortize a portion of the AOCI to earnings related to the initial portion of the loss of $3.0 million excluded from the assessment of effectiveness of the cash flow hedge. Cash flows related to cash flow hedges containing an other than insignificant financing element are included in Financing activities on the Consolidated Statements of Cash Flows.
Hedge of Net Investments in Foreign Operations
In addition to the cross-currency swaps, the Company periodically uses foreign currency denominated notes as nonderivative hedging instruments of its net investments in foreign operations. In 2016 and 2015, the Company had designated the Senior Notes due 2021 as a net investment hedge and the gains and losses resulting from the exchange rate adjustments to the designated portion of the foreign currency denominated notes were recorded in AOCI to the extent that the foreign currency denominated notes are effective in hedging the designated risk. As of December 31, 2017, there is no amount of Long-term debt on the Consolidated Balance Sheets that is designated as a net investment hedge of its investments in international subsidiaries that use the EUR as their functional currency. The amount recognized in AOCI during the period that the Senior Notes due 2021 were designated as a net investment hedge remains in AOCI as of December 31, 2017 and will remain in AOCI until the subsidiary is sold or substantially liquidated. From the de-designation date through December 2017, when the 2021 Notes were redeemed, the gains and losses resulting from exchange rate adjustments to the foreign currency denominated notes were recorded in the statement of operations in Foreign currency loss (gain). The Company does not expect amounts that are currently deferred in AOCI to be reclassified to income over the next 12 months.
Interest Rate Hedging
In order to mitigate variability in forecasted interest payments on the Company’s EUR-denominated asset financings that are based on benchmark interest rates (e.g., Euribor), the Company entered into interest rate swaps. The objective was for the cash flows of the interest rate swaps to offset any changes in cash flows of the forecasted interest payments attributable to changes in the benchmark interest rate. The interest rate swaps converted floating rate interest payments into fixed rate interest payments. The Company designated the interest rate swaps as qualifying hedging instruments and accounted for these as cash flow hedges of the forecasted obligations. The gains and losses resulting from fair value adjustments to the designated portion of the interest rate swaps were recorded in AOCI and will be reclassified from AOCI to interest expense on the dates that interest payments accrue, or when the
79
hedged item becomes probable not to occur. The Company hedged its exposure to the variability in future cash flows for forecasted interest payments through the maturity date of the swap in December 2017. During the years ended December 31, 2017 and 2016, certain interest rate swaps were not designated as hedges. The gains and losses related to the interest rate swaps not designated as hedges were included in Interest expense in the Consolidated Statements of Operations. Cash flows related to the interest rate swaps were included in Operating activities on the Consolidated Statements of Cash Flows.
Foreign Currency Option and Forward Contracts
In order to mitigate the currency translation risk which results from converting the financial statements of the Company’s international operations, which primarily use the EUR and British Pound Sterling (“GBP”) as their functional currency, the Company uses foreign currency option and forward contracts. Additionally, the Company may use foreign currency forward contracts to mitigate the foreign currency exposure from intercompany loans. The foreign currency contracts were not designated as qualifying hedging instruments as of December 31, 2017 or 2016. The contracts are not speculative; rather, they are used to manage the Company’s exposure to foreign currency exchange rate fluctuations. The contracts expire in 12 months or less. Gains or losses on the contracts are recorded in Foreign currency loss (gain) in the Consolidated Statements of Operations. Cash flows related to the foreign currency contracts are included in Operating activities on the Consolidated Statements of Cash Flows, except for the cash flows resulting from forwards designated as hedges of intercompany loans which are included in Financing activities.
10. Debt
The following table summarizes the primary terms for components of debt:
December 31, 2017 | December 31, 2016 | |||||||||||||||
(In millions) | Principal Balance | Carrying Value | Principal Balance | Carrying Value | ||||||||||||
ABL Facility | $ | 100.0 | $ | 100.0 | $ | 30.0 | $ | 30.0 | ||||||||
Term loan facility | 1,494.0 | 1,455.6 | 1,481.9 | 1,439.2 | ||||||||||||
6.125% Senior Notes due 2023 | 535.0 | 528.0 | 535.0 | 527.1 | ||||||||||||
6.50% Senior Notes due 2022 | 1,600.0 | 1,583.0 | 1,600.0 | 1,579.9 | ||||||||||||
5.75% Senior Notes due 2021 | — | — | 527.1 | 520.7 | ||||||||||||
7.25% Senior Notes due 2018 | — | — | 265.8 | 267.1 | ||||||||||||
6.70% Senior Debentures due 2034 | 300.0 | 202.8 | 300.0 | 200.8 | ||||||||||||
4.50% Convertible senior notes | — | — | 49.4 | 47.1 | ||||||||||||
4.00% Euro private placement notes due 2020 | 14.4 | 15.3 | 12.6 | 13.7 | ||||||||||||
European Trade Securitization Program | 302.6 | 298.6 | — | — | ||||||||||||
Asset financing | 90.0 | 90.0 | 145.0 | 145.0 | ||||||||||||
Capital leases for equipment | 247.9 | 247.9 | 97.4 | 97.4 | ||||||||||||
Total debt | 4,683.9 | 4,521.2 | 5,044.2 | 4,868.0 | ||||||||||||
Current maturities of long-term debt | 103.7 | 103.7 | 138.9 | 136.5 | ||||||||||||
Long-term debt | $ | 4,580.2 | $ | 4,417.5 | $ | 4,905.3 | $ | 4,731.5 | ||||||||
The fair value of the debt at December 31, 2017 was $4,816.1 million, of which $2,647.4 million was classified as Level 1 and $2,168.7 million was classified as Level 2 in the fair value hierarchy. The fair value of the debt at December 31, 2016 was $5,234.7 million, of which $3,586.2 million was classified as Level 1 and $1,648.5 million was classified as Level 2. The Level 1 debt was valued using quoted prices in active markets. The Level 2 debt was valued using bid evaluation pricing models or quoted prices of securities with similar characteristics. The fair value
80
of the asset financing arrangements approximates carrying value since the debt is primarily issued at a floating rate, may be prepaid any time at par without penalty, and the remaining life is short-term in nature.
The following table outlines the Company’s principal payment obligations on debt (excluding capital leases) for the next five years:
(In millions) | 2018 | 2019 | 2020 | 2021 | 2022 | Thereafter | ||||||||||||||||||
Principal payments on debt | $ | 61.0 | $ | 22.7 | $ | 420.9 | $ | 1,494.6 | $ | 1,600.6 | $ | 836.2 | ||||||||||||
ABL Facility
In October 2015, the Company entered into the Second Amended and Restated Revolving Loan Credit Agreement (the “ABL Facility”) among XPO and certain of XPO’s U.S. and Canadian wholly owned subsidiaries (which include the U.S. subsidiaries of the former Con-way), as borrowers, the other credit parties from time to time party thereto, the lenders party thereto and Morgan Stanley Senior Funding, Inc. (“MSSF”), as agent for such lenders. The ABL Facility replaced XPO’s then existing Amended Credit Agreement, and, among other things, (i) increased the commitments under the ABL Facility to $1.0 billion, (ii) permitted the acquisition of Con-way, and the transactions relating thereto, (iii) reduced the margin on loans under the ABL Facility by 0.25% from that contained in the then existing Amended Credit Agreement and (iv) matures on October 30, 2020. Up to $350 million of the ABL Facility is available for issuance of letters of credit, and up to $50 million of the ABL Facility is available for swing line loans. Total unamortized debt issuance costs related to the ABL Facility classified in other long-term assets at December 31, 2017 and 2016 were $6.2 million and $8.1 million, respectively.
Availability on the ABL Facility is equal to the borrowing base less advances and outstanding letters of credit. The borrowing base includes a fixed percentage of (i) eligible U.S. and Canadian accounts receivable plus (ii) any eligible U.S. and Canadian rolling stock and equipment. At December 31, 2017, the Company had a borrowing base of $1.0 billion and availability under the ABL Facility of $655.4 million at December 31, 2017 after considering outstanding letters of credit on the ABL Facility of $244.6 million. XPO may from time to time increase base availability under the ABL Facility up to $1.0 billion less any then outstanding letters of credit by including into the borrowing additional rolling stock and equipment. A maximum of 20% of the borrowing base can be attributable to the equipment and rolling stock in the aggregate. As of December 31, 2017, the Company was in compliance with the ABL Facility’s financial covenants.
The ABL Facility is secured on a first lien basis by the assets of the credit parties which constitute ABL Facility priority collateral and on a second lien basis by certain other assets. ABL Facility priority collateral consists primarily of U.S. and Canadian accounts receivable as well as any U.S. and Canadian rolling stock and equipment included by XPO in the borrowing base. The Company’s borrowings under the ABL Facility will bear interest at a rate equal to the London Interbank Offered Rate (“LIBOR”) or a Base Rate, as defined in the agreement, plus an applicable margin of 1.50% to 2.00%, in the case of LIBOR loans, and 0.50% to 1.00%, in the case of Base Rate loans. The interest rate on outstanding borrowings at December 31, 2017 was 2.97%. The ABL Facility contains representations and warranties, affirmative and negative covenants and events of default customary for agreements of this nature.
Among other things, the covenants in the ABL Facility limit the Company’s ability to, with certain exceptions: incur indebtedness; grant liens; engage in certain mergers, consolidations, acquisitions and dispositions; make certain investments and restricted payments; and enter into certain transactions with affiliates. In certain circumstances, such as if availability is below certain thresholds, the ABL Facility also requires the Company to maintain a Fixed Charge Coverage Ratio (as defined in the ABL Facility) of not less than 1.00. As of December 31, 2017, the Company is in compliance with this financial covenant. If an event of default under the ABL Facility shall occur and be continuing, the commitments thereunder may be terminated and the principal amount outstanding thereunder, together with all accrued unpaid interest and other amounts owed thereunder, may be declared immediately due and payable. Certain subsidiaries acquired by the Company in the future may be excluded from the restrictions contained in certain of the foregoing covenants.
81
Term Loan Facility
In October 2015, XPO entered into a Senior Secured Term Loan Credit Agreement (the “Term Loan Credit Agreement”) that provided for a single borrowing of $1.6 billion. The Term Loan Credit Agreement was issued at an original issue discount of $32.0 million.
In March 2017, the Company entered into a Refinancing Amendment (Amendment No. 2 to Credit Agreement) (the “Second Amendment”), by and among XPO, its subsidiaries signatory thereto, as guarantors, the lenders party thereto and MSSF, in its capacity as administrative agent (the “Administrative Agent”), amending that certain Senior Secured Term Loan Credit Agreement, dated as of October 30, 2015 (as amended, amended and restated, supplemented or otherwise modified, including by that certain Incremental and Refinancing Amendment (Amendment No. 1 to Credit Agreement) (the “First Amendment”), dated as of August 25, 2016, the “Term Loan Credit Agreement”).
Pursuant to the Second Amendment, the outstanding $1,481.9 million principal amount of term loans under the Term Loan Credit Agreement (the “Existing Term Loans”) were replaced with $1,494.0 million in aggregate principal amount of new term loans (the “Current Term Loans”) having substantially similar terms as the Existing Term Loans, other than with respect to the applicable interest rate and prepayment premiums in respect of certain voluntary prepayments. Proceeds from the Current Term Loans were used primarily to refinance the Existing Term Loans and to pay interest, fees and expenses in connection therewith.
The interest rate margin applicable to the Current Term Loans was reduced from 2.25% to 1.25%, in the case of base rate loans, and from 3.25% to 2.25%, in the case of LIBOR loans and the LIBOR floor was reduced from 1.0% to 0%. The interest rate on the Current Term Loans was 3.60% at December 31, 2017. The Current Term Loans maturity date remains October 30, 2021. The refinancing resulted in a debt extinguishment charge of $8.3 million during the twelve months ended December 31, 2017.
In August 2016, the Company entered into the First Amendment, pursuant to which the outstanding $1,592.0 million principal amount of term loans under the Term Loan Credit Agreement (the “Old Term Loans”) were replaced with a like aggregate principal amount of new term loans (the “New Term Loans”) having substantially similar terms as the Old Term Loans, other than with respect to the applicable interest rate and prepayment premiums in respect of certain voluntary prepayments. Of the $1,592.0 million of term loans which were refinanced, $1,197.2 million were exchanged and represent a non-cash financing activity. The interest rate margin applicable to the New Term Loans was reduced from 3.50% to 2.25%, in the case of base rate loans, and from 4.50% to 3.25%, in the case of LIBOR loans. The interest rate at December 31, 2016 was 4.25%. Debt extinguishment costs related to various lenders exiting the syndicate were $18.0 million.
In addition, pursuant to the First Amendment, the Company borrowed an additional $400.0 million of Incremental Term B-1 Loans (the “Incremental Term B-1 Loans”) and an additional $50.0 million of Incremental Term B-2 Loans (the “Incremental Term B-2 Loans”). The New Term Loans, Incremental Term B-1 Loans and Incremental Term B-2 Loans have identical terms, other than with respect to original issue discount, and will mature on October 30, 2021.
On November 3, 2016, the Company used the proceeds from sale of the North American Truckload operations to repurchase $555.0 million of Term Loan debt at par. The repurchase of debt resulted in a non-cash debt extinguishment charge of $16.5 million in the fourth quarter of 2016.
Commencing with the fiscal year ending December 31, 2016, the Company must prepay an aggregate principal amount of the Term Loan Facility equal to (a) 50% of Excess Cash Flow, as defined in the agreement, if any, for the most recent fiscal year ended minus (b) the sum of (i) all voluntary prepayments of loans during such fiscal year and (ii) all voluntary prepayments of loans under the ABL Facility or any other revolving credit facilities during such fiscal year to the extent accompanied by a corresponding permanent reduction in the commitments under the credit agreement or any other revolving credit facilities in the case of each of the immediately preceding clauses (i) and (ii), to the extent such prepayments are funded with internally generated cash flow, as defined in the agreement; provided, further, that (x) the Excess Cash Flow percentage shall be 25% if the Consolidated Secured Net Leverage Ratio of Borrower, as defined in the agreement, for the fiscal year was less than or equal to 3.00:1.00 and greater than 2.50:1.00 and (y) the Excess Cash Flow percentage shall be 0% if the Consolidated Secured Net Leverage Ratio of Borrower for the fiscal year was less than or equal to 2.50:1.00. The remaining principal is due at
82
maturity. As of December 31, 2017, the Company’s Consolidated Secured Net Leverage Ratio was less than 2.50:1.00; therefore, no excess cash payment was required.
Senior Notes
In December 2017, the Company redeemed all of its outstanding senior notes due June 2021 (the “2021 Notes”) that were originally issued in 2015. The redemption price for the 2021 Notes was 102.875% of the principal amount of the 2021 Notes, plus accrued and unpaid interest to, but excluding, the date of redemption. The redemption was funded using cash on hand at the date of the redemption. The loss on debt extinguishment was $22.4 million.
In August 2017, the Company redeemed all of its outstanding 7.25% senior notes due January 2018 (the “2018 Notes”). The 2018 Notes has been assumed in connection with the Company’s acquisition on Con-way. The redemption price for the 2018 Notes was 102.168% of the principal amount of the Notes, plus accrued and unpaid interest to, but excluding, the date of redemption. The redemption was funded using cash on hand at the date of the redemption. The loss on debt extinguishment was approximately $5.3 million.
In September 2016, XPO redeemed all of its outstanding 7.875% Senior Notes due 2019. The redemption price for the Senior Notes due 2019 was 103.938% of the principal amount of the Senior Notes due 2019, plus accrued and unpaid interest to, but excluding, the date of redemption. Debt extinguishment costs were $35.2 million.
In August 2016, the Company completed a private placement of $535.0 million aggregate principal amount of 6.125% senior notes due September 1, 2023 (“Senior Notes due 2023”). In June 2015, the Company completed a private placement of $1,600.0 million aggregate principal amount of 6.50% Senior Notes due 2022.
The Senior Notes bear interest payable semiannually, in cash in arrears. The Senior Notes due 2023 mature on September 1, 2023. The Senior Notes due 2022 mature on June 15, 2022.
The Senior Notes are guaranteed by each of the Company’s direct and indirect wholly-owned restricted subsidiaries (other than certain excluded subsidiaries) that are obligors under, or guarantee obligations under, the Company’s ABL Facility (or certain replacements thereof) or guarantee certain capital markets indebtedness of the Company or any guarantor of the Senior Notes. The Senior Notes and the guarantees thereof are unsecured, unsubordinated indebtedness of the Company and the guarantors. Among other things, the covenants of the Senior Notes limit the Company’s ability to, with certain exceptions: incur indebtedness or issue disqualified stock; grant liens; pay dividends or make distributions in respect of capital stock; make certain investments or other restricted payments; prepay or repurchase subordinated debt; sell or transfer assets; engage in certain mergers, consolidations, acquisitions and dispositions; and enter into certain transactions with affiliates.
Senior Debentures
In conjunction with the Company’s acquisition of Con-way, the Company assumed Con-way’s 6.70% Senior Debentures due 2034 (the “Senior Debentures”) with an aggregate principal amount of $300.0 million. The Senior Debentures bear interest payable semiannually, in cash in arrears, and mature on May 1, 2034. In accordance with ASC 805 “Business Combinations,” the Senior Debentures were recorded at fair value on the Con-way acquisition date, resulting in a fair value discount of $101.3 million on October 30, 2015. Including amortization of the fair value adjustment, interest expense on the Senior Debentures is recognized at an annual effective interest rate of 10.96%.
Convertible Senior Notes
The Convertible Senior Notes bore interest payable semi-annually, in cash in arrears, and matured on October 1, 2017.
During the year ended December 31, 2017, the Company issued an aggregate of approximately 3.0 million shares of the Company’s common stock to certain holders of the Convertible Senior Notes in connection with the conversion of the Convertible Senior Notes. The Convertible Senior Notes and shares of common stock underlying the Convertible Senior Notes were registered pursuant to a registration statement on Form S-3. The conversions were allocated to long-term debt and equity in the amounts of $49.0 million and $49.5 million, respectively. A loss on conversion of $0.5 million was recorded as part of these transactions. Certain of these transactions represented induced conversions pursuant to which the Company paid the holder a market-based premium in cash. The
83
negotiated market-based premiums, in addition to the difference between the current fair value and the book value of the Convertible Senior Notes, were reflected in interest expense.
Euro Private Placement Notes
The Euro Private Placement Notes due 2020 have €12.0 million EUR-denominated aggregate principal amount outstanding as of December 31, 2017. The Euro Private Placement Notes due 2020 bear interest payable annually, in cash in arrears, and mature on December 20, 2020.
The Euro Private Placement Notes are subject to leverage ratio and indebtedness ratio financial covenants, as defined in the agreements. ND is required to maintain a leverage ratio of less than or equal to 4.50 and an indebtedness ratio of less than or equal to 2.00 as of each semi-annual testing date. As of December 31, 2017, the latest semi-annual testing date, ND is in compliance with the financial covenants.
Asset Financing
The asset financing arrangements are unsecured and are used to purchase trucks in Europe. The financing arrangements are denominated in USD, EUR, GBP and Romanian New Lei, with primarily floating interest rates. As of December 31, 2017, interest rates on asset financing range from 0.67% to 4.97%, with a weighted average interest rate of 1.23%, and initial terms range from three years to ten years.
European Trade Securitization Program
In October 2017, XPO Logistics Europe SA (“XPO Logistics Europe”), in which the Company holds an 86.25% controlling interest, entered into a European trade receivables securitization program for an aggregate maximum amount of €270 million (approximately $324 million as of December 31, 2017) for a term of three years co-arranged by Crédit Agricole and HSBC. Under the terms of the program, XPO Logistics Europe, or one of its wholly-owned subsidiaries in the United Kingdom or France, sells trade receivables to XPO Collections Designated Activity Company Limited (“XCDAL”), a wholly-owned bankruptcy remote special purpose entity of XPO Logistics Europe. The receivables are funded by senior variable funding notes denominated in the same currency as the corresponding receivables. XCDAL is considered a variable interest entity and is consolidated by XPO Logistics Europe based on its control of the entity’s activities. The receivable balances under this program is reported as accounts receivable on the Company’s consolidated balance sheet and the obligation to return the cash it receives is included in the Company’s long-term debt. At December 31, 2017, the remaining borrowing capacity was €17.7 million (approximately $21.2 million) and the weighted-average interest rate was 1.06%. In the first quarter of 2018, the aggregate maximum amount under the program was increased to €350 million (approximately $420 million).
The receivables securitization program provides additional liquidity to fund XPO Logistics Europe’s operations. Borrowings under the program will bear interest at lenders’ cost of funds plus a margin of 1.05%. The receivables securitization program contains representations and warranties, affirmative and negative covenants, termination events, events of default, indemnities and other obligations on the part of XPO Logistics Europe, certain of its subsidiaries, and XCDAL which are customary for transactions of this nature.
11. Employee Benefit Plans
Defined Benefit Pension Plans
The Company maintains defined benefit pension plans for certain employees in the United States. These pension plans include qualified plans (the “U.S. Qualified Plans”) that are eligible for certain beneficial treatment under the Internal Revenue Code (“IRC”), as well as non-qualified plans that do not meet the IRC criteria. The Company’s non-qualified defined benefit pension plans (collectively, the “U.S. Non-Qualified Pension Plans” and together with the U.S. Qualified Plans, the “U.S. Plans”) consist mostly of a primary non-qualified supplemental defined benefit pension plan and provide additional benefits for certain employees who are affected by IRC limitations on compensation eligible for benefits available under the qualified plans.
The Company maintained two separate defined benefit pension plans for certain employees in the United Kingdom. On November 1, 2016, the U.K. Plans were merged into one plan (the “U.K. Plan”) in order to reduce overhead and administrative costs, resulting in a $41.7 million prior service credit recognized in AOCI. The amount currently
84
recognized in AOCI is expected to be recognized as a component of net periodic benefit expense (income) over a period of approximately 26 years. In conjunction with the plan merger, a one-time settlement offer was made to certain U.K. Plan participants. On November 30, 2016, the settlement was completed, resulting in a payment of plan benefits of approximately $22.3 million and a reduction of the pension benefit obligation.
The Company also maintains defined benefit pension plans for certain of its foreign subsidiaries. These international defined benefit pension plans are excluded from the disclosures below due to their immateriality. Both the U.S. Plans and U.K. Plan do not allow for new plan participants or additional benefit accruals.
During 2017, the Company offered eligible former employees, who had not yet commenced receiving their pension benefit, an opportunity to receive a lump sum payout of their vested pension benefit. On December 1, 2017, in connection with this offer, one of the Company’s pension plans paid $142.3 million from pension plan assets to those who accepted this offer, thereby reducing its pension benefit obligations. The transaction had no cash impact on the Company but did result in a non-cash pre-tax pension settlement gain of $0.8 million. As a result of the lump sum payout, the Company re-measured the funded status of its pension plan as of the settlement date. To calculate this pension settlement charge, the Company utilized a discount rate of 4.35% through the measurement date and 3.83% thereafter.
Defined benefit pension plan obligations are measured based on the present value of projected future benefit payments for all participants for services rendered to date. The projected benefit obligation is a measure of benefits attributed to service to date assuming that the plan continues in effect and that estimated future events (including turnover and mortality) occur. The net periodic benefit costs are determined using assumptions regarding the projected benefit obligation and the fair value of plan assets as of the beginning of the year. Net periodic benefit costs are recorded in SG&A. The funded status of the defined benefit pension plans, which represents the difference between the projected benefit obligation and the fair value of plan assets, is calculated on a plan-by-plan basis.
Funded Status of Defined Benefit Pension Plans
The following tables provide a reconciliation of the changes in the plans’ projected benefit obligations as of December 31:
U.S. Qualified Plans | U.S. Non-Qualified Plans | U.K. Plan | ||||||||||||||||||||||
(In millions) | 2017 | 2016 | 2017 | 2016 | 2017 | 2016 | ||||||||||||||||||
Projected benefit obligation at beginning of year | $ | 1,745.0 | $ | 1,665.8 | $ | 73.9 | $ | 73.0 | $ | 1,235.2 | $ | 1,287.7 | ||||||||||||
Interest cost | 73.6 | 76.1 | 3.1 | 3.3 | 34.4 | 40.5 | ||||||||||||||||||
Plan amendment | — | — | — | — | — | (41.7 | ) | |||||||||||||||||
Actuarial loss (gain) | 128.5 | 63.7 | 5.8 | 3.0 | (23.1 | ) | 262.4 | |||||||||||||||||
Benefits paid | (62.1 | ) | (60.6 | ) | (5.2 | ) | (5.4 | ) | (60.2 | ) | (52.7 | ) | ||||||||||||
Settlement | (142.3 | ) | — | — | — | — | (22.3 | ) | ||||||||||||||||
Foreign currency exchange rate changes | — | — | — | — | 118.7 | (238.7 | ) | |||||||||||||||||
Projected benefit obligation at end of year (a) | $ | 1,742.7 | $ | 1,745.0 | $ | 77.6 | $ | 73.9 | $ | 1,305.0 | $ | 1,235.2 | ||||||||||||
(a) | At the end of each year presented, the accumulated benefit obligations for the plans are equal to the projected benefit obligations. |
85
The following tables provide a reconciliation of the changes in the plans’ fair value of plan assets as of December 31:
U.S. Qualified Plans | U.S. Non-Qualified Plans | U.K. Plan | ||||||||||||||||||||||
(In millions) | 2017 | 2016 | 2017 | 2016 | 2017 | 2016 | ||||||||||||||||||
Fair value of plan assets at beginning of year | $ | 1,700.1 | $ | 1,619.9 | $ | — | $ | — | $ | 1,206.8 | $ | 1,203.8 | ||||||||||||
Actual return on plan assets | 268.6 | 140.8 | — | — | 108.9 | 291.4 | ||||||||||||||||||
Employer contributions | — | — | 5.2 | 5.4 | 13.3 | 14.2 | ||||||||||||||||||
Benefits paid | (62.1 | ) | (60.6 | ) | (5.2 | ) | (5.4 | ) | (60.2 | ) | (52.7 | ) | ||||||||||||
Settlement | (142.3 | ) | — | — | — | — | (22.3 | ) | ||||||||||||||||
Foreign currency exchange rate changes | — | — | — | — | 121.1 | (227.6 | ) | |||||||||||||||||
Fair value of plan assets at end of year | $ | 1,764.3 | $ | 1,700.1 | $ | — | $ | — | $ | 1,389.9 | $ | 1,206.8 | ||||||||||||
The following table provides the funded status of the plans as of December 31:
U.S. Qualified Plans | U.S. Non-Qualified Plans | U.K. Plan | ||||||||||||||||||||||
(In millions) | 2017 | 2016 | 2017 | 2016 | 2017 | 2016 | ||||||||||||||||||
Funded Status: | ||||||||||||||||||||||||
Funded status at end of year | $ | 21.6 | $ | (44.9 | ) | $ | (77.6 | ) | $ | (73.9 | ) | $ | 84.9 | $ | (28.4 | ) | ||||||||
Funded Status Recognized in Balance Sheet: | ||||||||||||||||||||||||
Long-term assets | $ | 21.6 | $ | 18.1 | $ | — | $ | — | $ | 84.9 | $ | — | ||||||||||||
Current liabilities | — | — | (5.4 | ) | (5.4 | ) | — | — | ||||||||||||||||
Long-term liabilities | — | (63.0 | ) | (72.2 | ) | (68.5 | ) | — | (28.4 | ) | ||||||||||||||
Net amount recognized | $ | 21.6 | $ | (44.9 | ) | $ | (77.6 | ) | $ | (73.9 | ) | $ | 84.9 | $ | (28.4 | ) | ||||||||
Plans with projected and accumulated benefit obligation in excess of plan assets: | ||||||||||||||||||||||||
Projected and accumulated benefit obligation | $ | — | $ | 1,725.5 | $ | 77.6 | $ | 73.9 | $ | — | $ | 1,235.2 | ||||||||||||
Fair value of plan assets | — | 1,662.6 | — | — | — | 1,206.8 | ||||||||||||||||||
The following table provides amounts included in AOCI that have not yet been recognized in net periodic benefit expense as of December 31:
U.S. Qualified Plans | U.S. Non-Qualified Plans | U.K. Plan | ||||||||||||||||||||||
(In millions) | 2017 | 2016 | 2017 | 2016 | 2017 | 2016 | ||||||||||||||||||
Actuarial gain (loss) | $ | 12.6 | $ | (33.5 | ) | $ | (8.1 | ) | $ | (2.3 | ) | $ | 44.3 | $ | (28.9 | ) | ||||||||
Prior-service credit | — | — | — | — | 38.5 | 41.1 | ||||||||||||||||||
AOCI | $ | 12.6 | $ | (33.5 | ) | $ | (8.1 | ) | $ | (2.3 | ) | $ | 82.8 | $ | 12.2 | |||||||||
86
The following table sets forth the amount of net periodic benefit cost and amounts recognized in Other comprehensive income (loss) for the year ended December 31:
U.S. Qualified Plans | U.S. Non-Qualified Plans | U.K. Plan | ||||||||||||||||||||||||||||||||||
(In millions) | 2017 | 2016 | 2015 | 2017 | 2016 | 2015 | 2017 | 2016 | 2015 | |||||||||||||||||||||||||||
Net periodic benefit (income) expense: | ||||||||||||||||||||||||||||||||||||
Interest cost | $ | 73.6 | $ | 76.1 | $ | 12.7 | $ | 3.1 | $ | 3.3 | $ | 0.5 | $ | 34.4 | $ | 40.5 | $ | 28.6 | ||||||||||||||||||
Expected return on plan assets | (93.2 | ) | (88.4 | ) | (15.4 | ) | — | — | — | (59.9 | ) | (58.4 | ) | (34.6 | ) | |||||||||||||||||||||
Amortization of prior-service credit | — | — | — | — | — | — | (1.6 | ) | (0.5 | ) | — | |||||||||||||||||||||||||
Recognized AOCI loss due to settlements | (0.8 | ) | — | — | — | — | — | — | (0.1 | ) | — | |||||||||||||||||||||||||
Net periodic benefit (income) expense | $ | (20.4 | ) | $ | (12.3 | ) | $ | (2.7 | ) | $ | 3.1 | $ | 3.3 | $ | 0.5 | $ | (27.1 | ) | $ | (18.5 | ) | $ | (6.0 | ) | ||||||||||||
Amounts recognized in Other comprehensive income (loss) | ||||||||||||||||||||||||||||||||||||
Actuarial (gain) loss | $ | (46.9 | ) | $ | 11.3 | $ | 22.2 | $ | 5.8 | $ | 3.0 | $ | (0.7 | ) | $ | (72.2 | ) | $ | 29.4 | $ | (0.5 | ) | ||||||||||||||
Prior-service cost | — | — | — | — | — | — | — | (41.7 | ) | — | ||||||||||||||||||||||||||
Reclassification of recognized AOCI gain due to settlements | 0.8 | — | — | — | — | — | — | 0.1 | — | |||||||||||||||||||||||||||
Reclassification of prior-service credit to net periodic benefit (income) expense | — | — | — | — | — | — | 1.6 | 0.5 | — | |||||||||||||||||||||||||||
(Gain) loss recognized in Other comprehensive income (loss) | $ | (46.1 | ) | $ | 11.3 | $ | 22.2 | $ | 5.8 | $ | 3.0 | $ | (0.7 | ) | $ | (70.6 | ) | $ | (11.7 | ) | $ | (0.5 | ) | |||||||||||||
Approximately $1.6 million of the amount currently recognized in Other comprehensive income (loss) is expected to be recognized as a component of net periodic benefit expense (income) for the year ended December 31, 2018.
The following table outlines the weighted-average assumptions used to determine the net periodic benefit costs and benefit obligations at December 31:
U.S. Qualified Plans | U.S. Non-Qualified Plans | U.K. Plan | ||||||||||||||||||||||||
2017 | 2016 | 2015 | 2017 | 2016 | 2015 | 2017 | 2016 | 2015 | ||||||||||||||||||
Discount rate - net periodic benefit costs | 3.83% - 4.35% | 4.65 | % | 4.55 | % | 4.35 | % | 4.65 | % | 4.55 | % | 2.70 | % | 3.75 | % | 3.60 | % | |||||||||
Discount rate - benefit obligations | 3.55% - 3.71% | 4.35 | % | 4.65 | % | 3.21% - 3.60% | 4.35 | % | 4.65 | % | 2.53 | % | 2.70 | % | 3.75 | % | ||||||||||
Expected long-term rate of return on plan assets | 2.35% - 5.65% | 5.58 | % | 5.57 | % | N/A | N/A | N/A | 5.00 | % | 5.40 | % | 5.00 | % | ||||||||||||
No rate of compensation increase was assumed as the plans are frozen to additional participant benefit accruals. As of December 31, 2017, the impact of a 25 basis point decrease in the discount rate would increase the projected benefit obligation by approximately $59.0 million, $1.9 million and $55.8 million for the U.S. Qualified Plans, U.S. Non-Qualified Plans and U.K. Plan, respectively.
In 2018, the Company will change how it estimates the interest cost component of net periodic cost for its U.S. and U.K. pension benefit plans. Previously, the Company estimated the interest cost component utilizing a single weighted-average discount rate derived from the yield curve used to measure the benefit obligation. The new estimate utilizes a full yield curve approach in the estimation of this component by applying the specific spot rates along the yield curve used in the determination of the benefit obligation to each of the underlying projected cash flows based on time until payment. The new estimate provides a more precise measurement of interest costs by improving the correlation between projected benefit cash flows and their corresponding spot rates. The change does
87
not affect the measurement of the Company’s U.S. and U.K. pension benefit obligation and it is accounted for as a change in accounting estimate, which will be applied prospectively.
Expected benefit payments for the defined benefit pension plans are summarized below. These estimates are based on assumptions about future events. Actual benefit payments may vary from these estimates.
(In millions) | U.S. Qualified Plans | U.S. Non-Qualified Plans | U.K. Plan | |||||||||
Year ending December 31: | ||||||||||||
2018 | $ | 75.0 | $ | 5.4 | $ | 41.5 | ||||||
2019 | 78.8 | 5.4 | 43.0 | |||||||||
2020 | 82.5 | 5.4 | 44.3 | |||||||||
2021 | 85.7 | 5.3 | 46.0 | |||||||||
2022 | 89.0 | 5.3 | 47.9 | |||||||||
2023-2027 | 482.9 | 25.0 | 265.1 | |||||||||
Plan Assets
U.S. Qualified Plans
The U.S. Qualified Plans’ assets are segregated from those of the Company and are managed pursuant to a long-term liability driven asset allocation strategy that seeks to mitigate the funded status volatility by increasing exposure to fixed income investments over time. This strategy was developed by analyzing a variety of diversified asset-class combinations in conjunction with the projected liabilities.
The current investment strategy is to achieve a mix of approximately 80% in fixed income securities and 20% of investments in equity securities. The target allocations for fixed income securities includes 100% in domestic fixed income to match domestic projected liabilities. The target allocations for equity securities include 12% in U.S. companies and 8% in international companies. Investments in equity and fixed income securities consist of individual securities held in managed separate accounts as well as commingled investment funds. The investment strategy does not include a meaningful long-term investment allocation to cash and cash equivalents; however, the cash allocation may rise periodically in response to timing considerations regarding contributions, investments, and the payment of benefits and eligible plan expenses. The Company evaluates its defined benefit plans’ asset portfolios for the existence of significant concentrations of risk. Types of investment concentration risks that are evaluated include, but are not limited to, concentrations in a single entity, industry, foreign country and individual fund manager. As of December 31, 2017, there were no significant concentrations of risk in the Company’s defined benefit plan assets.
The investment policy does not allow investment managers to use market-timing strategies or financial derivative instruments for speculative purposes. However, financial derivative instruments are used to manage risk and achieve stated investment objectives regarding duration, yield curve, credit and equity exposures. Generally, the investment managers are prohibited from short selling, trading on margin, and trading commodities, warrants or other options, except when acquired as a result of the purchase of another security, or in the case of options, when sold as part of a covered position.
The assumption of between 2.35% and 5.65% for the overall expected long-term rate of return in 2017 was developed using asset allocation and return expectations. The return expectations are created using long-term historical returns and current market expectations for inflation, interest rates and economic growth.
U.K. Plan
The U.K. Plan’s assets are segregated from those of the Company and invested by trustees, which include Company representatives, with the goal of meeting the U.K. Plan’s projected future pension liabilities. The trustees’ investment objectives are to meet the performance target set in the deficit recovery plan of the U.K. Plan in a risk-controlled framework. The actual asset allocations of the U.K. Plan are in line with the target asset allocations. The implied target asset allocation of the U.K. Plan consists of 28% matching assets (U.K. gilts and cash) and 72%
88
growth assets (consisting of government and credit - commingled funds, illiquid credit, hedge funds, dynamic asset allocation, and risk parity). The target asset allocations of the U.K. Plan includes acceptable ranges for each asset class, which are typically +/- 10% from the target.
The risk parity and dynamic asset allocation categories include investments in multi-asset funds. These funds are designed to provide a diversified exposure to markets with less volatility than equities. Collateral assets consist of U.K. gilts and cash, which are used to back derivative positions that hedge the sensitivity of the liability to changes in interest rates and inflation. Approximately 90% of the actuarial liability sensitivities were hedged as of December 31, 2017. The derivative positions are also used to gain a synthetic exposure to equity markets. The expected return over 2017 was 5.00%. The approach to determine the expected long-term rate of return on plan assets is consistent with the one used for the U.S. Plans.
89
The following table sets forth the fair values of investments held in the pension plans by major asset category as of December 31, 2017 and 2016, as well as the percentage that each asset category comprises of total plan assets:
(Dollars in millions) | December 31, 2017 | ||||||||||||||||||
Asset Category (U.S. Qualified Plans) | Level 1 | Level 2 | Not Subject to Leveling | Total | Percentage of Plan Assets | ||||||||||||||
Cash and Cash Equivalents | |||||||||||||||||||
Short-term investment fund | $ | — | $ | — | $ | 24.9 | $ | 24.9 | 1.4 | % | |||||||||
Equity | |||||||||||||||||||
U.S. large companies | |||||||||||||||||||
S&P 500 futures | 45.9 | 48.5 | 100.7 | 195.1 | 11.1 | % | |||||||||||||
Growth | 75.9 | — | — | 75.9 | 4.3 | % | |||||||||||||
Value | 67.5 | — | — | 67.5 | 3.8 | % | |||||||||||||
U.S. Small Companies | |||||||||||||||||||
Value | 37.3 | — | — | 37.3 | 2.1 | % | |||||||||||||
International | |||||||||||||||||||
Growth | 0.4 | — | 80.3 | 80.7 | 4.6 | % | |||||||||||||
Value fund (a) | 78.9 | — | 1.5 | 80.4 | 4.5 | % | |||||||||||||
Fixed Income Securities | |||||||||||||||||||
Global long-term debt instruments (a) | 171.7 | 943.3 | 87.5 | 1,202.5 | 68.2 | % | |||||||||||||
Total U.S. Plan Assets | $ | 477.6 | $ | 991.8 | $ | 294.9 | $ | 1,764.3 | 100.0 | % | |||||||||
Asset Category (U.K. Plan) | |||||||||||||||||||
Cash and Cash Equivalents | $ | 64.5 | $ | — | $ | — | $ | 64.5 | 4.6 | % | |||||||||
Fixed Income Securities | |||||||||||||||||||
Government | — | 371.2 | — | 371.2 | 26.7 | % | |||||||||||||
Government and credit - commingled funds (a) | — | — | 292.5 | 292.5 | 21.1 | % | |||||||||||||
Derivatives | |||||||||||||||||||
Equity (a) | — | — | 54.4 | 54.4 | 3.9 | % | |||||||||||||
Interest rate | — | 13.1 | — | 13.1 | 1.0 | % | |||||||||||||
Hedge Funds (a) (b) | — | — | 41.8 | 41.8 | 3.0 | % | |||||||||||||
Diversified Multi-Asset Funds | |||||||||||||||||||
Risk parity (a) | — | — | 275.6 | 275.6 | 19.8 | % | |||||||||||||
Dynamic asset allocation (a) | — | — | 276.8 | 276.8 | 19.9 | % | |||||||||||||
Total U.K. Plan Assets | $ | 64.5 | $ | 384.3 | $ | 941.1 | $ | 1,389.9 | 100.0 | % | |||||||||
(a) | In accordance with ASU 2015-07, Fair Value Measurement (Topic 820), certain investments that are measured at fair value using the net asset value per share (or its equivalent) practical expedient have not been classified in the fair value hierarchy. The fair value amounts presented in this table are intended to permit reconciliation of the fair value hierarchy to the amounts presented for the total defined benefit pension plan assets. |
(b) | The fair value of the fund is based on the fair value of the underlying assets, substantially all of which is invested in the York Credit Opportunities Master Fund, L.P., an exempted limited partnership formed under the laws of the Cayman Islands. The fund offers very limited liquidity with redemption only allowed on anniversary of investment with 60 days‘ prior notice. |
90
(Dollars in millions) | December 31, 2016 | ||||||||||||||||||
Asset Category (U.S. Qualified Plans) | Level 1 | Level 2 | Not Subject to Leveling | Total | Percentage of Plan Assets | ||||||||||||||
Cash and Cash Equivalents | |||||||||||||||||||
Short-term investment fund | $ | — | $ | — | $ | 40.7 | $ | 40.7 | 2.3 | % | |||||||||
Equity | |||||||||||||||||||
U.S. large companies | |||||||||||||||||||
S&P 500 futures | (0.3 | ) | — | — | (0.3 | ) | — | % | |||||||||||
Growth | 75.0 | — | — | 75.0 | 4.4 | % | |||||||||||||
Value | 88.0 | — | — | 88.0 | 5.2 | % | |||||||||||||
U.S. Small Companies | |||||||||||||||||||
Value | 31.9 | — | — | 31.9 | 1.9 | % | |||||||||||||
International | |||||||||||||||||||
Growth | 60.7 | — | — | 60.7 | 3.6 | % | |||||||||||||
Value fund (a) | — | — | 65.8 | 65.8 | 3.9 | % | |||||||||||||
Fixed Income Securities | |||||||||||||||||||
Global long-term debt instruments (a) | 148.2 | 893.4 | 296.7 | 1,338.3 | 78.7 | % | |||||||||||||
Total U.S. Plan Assets | $ | 403.5 | $ | 893.4 | $ | 403.2 | $ | 1,700.1 | 100.0 | % | |||||||||
Asset Category (U.K. Plans) | |||||||||||||||||||
Cash and Cash Equivalents | $ | 63.1 | $ | — | $ | — | $ | 63.1 | 5.2 | % | |||||||||
Fixed Income Securities | |||||||||||||||||||
Government | — | 248.1 | — | 248.1 | 20.6 | % | |||||||||||||
Government and credit - commingled funds (a) | — | — | 247.2 | 247.2 | 20.5 | % | |||||||||||||
Illiquid credit (a) (b) | — | — | 33.7 | 33.7 | 2.8 | % | |||||||||||||
Derivatives | |||||||||||||||||||
Equity (a) | — | 13.3 | 21.3 | 34.6 | 2.9 | % | |||||||||||||
Interest rate | — | 78.3 | — | 78.3 | 6.5 | % | |||||||||||||
Currencies | — | (1.0 | ) | — | (1.0 | ) | (0.1 | )% | |||||||||||
Hedge Funds (a) (c) | — | — | 34.6 | 34.6 | 2.9 | % | |||||||||||||
Diversified Multi-Asset Funds | |||||||||||||||||||
Risk parity (a) | — | — | 224.2 | 224.2 | 18.5 | % | |||||||||||||
Dynamic asset allocation (a) | — | — | 244.0 | 244.0 | 20.2 | % | |||||||||||||
Total U.K. Plan Assets | $ | 63.1 | $ | 338.7 | $ | 805.0 | $ | 1,206.8 | 100.0 | % | |||||||||
(a) | In accordance with ASU 2015-07, Fair Value Measurement (Topic 820), certain investments that are measured at fair value using the net asset value per share (or its equivalent) practical expedient have not been classified in the fair value hierarchy. The fair value amounts presented in this table are intended to permit reconciliation of the fair value hierarchy to the amounts presented for the total defined benefit pension plan assets. |
(b) | The underlying investments in the fund consist primarily of commercial mortgage-backed securities and real estate loans. |
(c) | The fair value of the fund is based on the fair value of the underlying assets, substantially all of which is invested in the York Credit Opportunities Master Fund, L.P., an exempted limited partnership formed under |
91
the laws of the Cayman Islands. The fund offers very limited liquidity with redemption only allowed on anniversary of investment with 60 days‘ prior notice.
For the periods ended December 31, 2017 and 2016, the Company had no investments held in the pension plans within Level 3 of the fair value hierarchy. There was no XPO common stock held in plan assets as of December 31, 2017 or 2016. The U.S. Non-Qualified Pension Plans are unfunded.
Funding
The Company’s funding practice is to evaluate its tax and cash position, as well as the funded status of its plans, in determining its planned contributions. The Company estimates that it will contribute $5.4 million to its U.S. Non-Qualified Plans and $13.2 million to its U.K. Plan in 2018; however, this could change based on variations in interest rates, asset returns and other factors.
Defined Contribution Retirement Plans
The Company’s cost for defined contribution retirement plans was $61.7 million in 2017, $59.1 million in 2016 and $13.0 million in 2015.
Postretirement Medical Plan
The Company sponsors a postretirement medical plan that provides health benefits to certain non-contractual employees at least 55 years of age with at least 10 years of service (the “Postretirement Plan”). The Postretirement Plan does not provide employer-subsidized retiree medical benefits for employees hired on or after January 1, 1993.
Funded Status of Postretirement Medical Plan
The following sets forth the changes in the benefit obligation and the determination of the amounts recognized on the Consolidated Balance Sheets for the Postretirement Plan:
As of December 31, | ||||||||
(In millions) | 2017 | 2016 | ||||||
Projected benefit obligation at beginning of year | $ | 50.6 | $ | 54.0 | ||||
Service cost – benefits earned during the year | 0.5 | 0.5 | ||||||
Interest cost on projected benefit obligation | 1.9 | 2.2 | ||||||
Actuarial gain | (8.3 | ) | (2.9 | ) | ||||
Participant contributions | 1.7 | 1.9 | ||||||
Benefits paid | (6.0 | ) | (5.1 | ) | ||||
Projected and accumulated benefit obligation at end of year | $ | 40.4 | $ | 50.6 | ||||
Funded status of the plan | $ | (40.4 | ) | $ | (50.6 | ) | ||
Amounts recognized in the balance sheet consist of : | ||||||||
Current liabilities | $ | (3.2 | ) | $ | (3.9 | ) | ||
Long-term liabilities | (37.2 | ) | (46.7 | ) | ||||
Net amount recognized | $ | (40.4 | ) | $ | (50.6 | ) | ||
Discount rate assumption as of December 31 | 3.52 | % | 3.90 | % | ||||
The following table provides amounts included in AOCI that have not yet been recognized in net periodic benefit expense:
(In millions) | 2017 | 2016 | ||||||
Actuarial gain (loss) | $ | 8.0 | $ | (0.3 | ) | |||
$ | 8.0 | $ | (0.3 | ) | ||||
92
Net Periodic Benefit Expense for Postretirement Medical Plan
Net periodic benefit expense includes the following:
Years Ended December 31, | ||||||||||||
(In millions, except discount rate) | 2017 | 2016 | 2015 | |||||||||
Net periodic benefit expense: | ||||||||||||
Service cost - benefits earned during the year | $ | 0.5 | $ | 0.5 | $ | 0.1 | ||||||
Interest cost on projected benefit obligation | 1.9 | 2.2 | 0.3 | |||||||||
Net periodic benefit expense | $ | 2.4 | $ | 2.7 | $ | 0.4 | ||||||
Discount rate assumption used to calculate interest cost | 3.90 | % | 4.20 | % | 4.10 | % | ||||||
Expected benefit payments, which reflect expected future service, as appropriate, are summarized below. These estimates are based on assumptions about future events. Actual benefit payments may vary from these estimates.
(In millions) | Benefit Payments | |||
Year ending December 31: | ||||
2018 | $ | 3.2 | ||
2019 | 3.0 | |||
2020 | 3.1 | |||
2021 | 3.2 | |||
2022 | 3.2 | |||
2023-2027 | 15.4 | |||
The assumed health care cost trend rates used to determine the benefit obligation are as follows:
2017 | 2016 | |||||
Health care cost trend rate assumed for next year | 6.24 | % | 6.49 | % | ||
Rate to which the cost trend rate is assumed to decline (the ultimate trend rate) | 4.50 | % | 4.50 | % | ||
Year that the rate reaches the ultimate trend rate | 2038 | 2038 | ||||
Assumed health care cost trends affect the amounts recognized for the Company’s postretirement benefits. A one-percentage-point change in the assumed health care cost trend rate would not have a material effect on the service and interest cost components of net periodic benefit costs or on the accumulated postretirement benefit obligation.
12. Stockholders’ Equity
Pursuant to the Company’s Certificate of Incorporation, the Board of Directors may establish one or more series of preferred stock. Other than the Series A Convertible Perpetual Preferred Stock, par value $0.001 per share (the “Series A Preferred Stock”), no shares of preferred stock are currently outstanding
Series A Convertible Perpetual Preferred Stock and Warrants
In 2011, the Company issued to certain investors, for $75.0 million in cash: (i) an aggregate of 75,000 shares of the Series A Preferred Stock with an initial liquidation preference of $1,000 per share, which are convertible into shares of Company common stock at a conversion price of $7.00 per common share (subject to customary anti-dilution adjustments), and (ii) warrants exercisable for shares of Company common stock at an initial exercise price of $7.00 per common share (subject to customary anti-dilution adjustments) (the “Warrants”). As of December 31, 2017, the outstanding Series A Preferred Stock is convertible into 10.2 million shares of Company common stock and there are outstanding Warrants exercisable for an aggregate of 10.2 million shares of Company common stock. The Series A Preferred Stock ranks, with respect to dividend rights and rights upon liquidation, winding-up or dissolution of the
93
Company, senior to the Company’s common stock and to each other class or series of stock of the Company (including any series of preferred stock) the terms of which do not expressly provide that such class or series ranks senior to or pari passu with the Series A Preferred Stock. The Series A Preferred Stock pays quarterly cash dividends equal to the greater of (i) the “as-converted” dividends on the underlying Company common stock for the relevant quarter and (ii) 4% of the then-applicable liquidation preference per annum. The Series A Preferred Stock is not redeemable or subject to any required offer to purchase, and votes together with the Company’s common stock on an “as-converted” basis on all matters, except as otherwise required by law, and separately as a class with respect to certain matters implicating the rights of holders of shares of Series A Preferred Stock.
In July 2017, the Company completed a registered underwritten offering of 11 million shares of its common stock at a public offering price of $60.50 per share (the “Offering”). Of the 11 million shares of common stock, 5 million shares were offered directly by the Company and 6 million shares were offered in connection with forward sale agreements (the “Forward Sale Agreements”) described below. The Offering closed on July 25, 2017.
In connection with the Offering, the Company entered into separate Forward Sale Agreements with Morgan Stanley & Co. LLC and JPMorgan Chase Bank, National Association, London Branch (the “Forward Counterparties”) pursuant to which the Company has agreed to sell, and each Forward Counterparty agreed to purchase, 3 million shares of the Company’s common stock (or 6 million shares of the Company common stock in the aggregate) subject to the terms and conditions of the Forward Sale Agreements, including the Company’s right to elect cash settlement or net share settlement. The initial forward price under each of the Forward Sale Agreements is $58.08 per share (which is the public offering price of the Company’s common stock, less the underwriting discount) and is subject to certain adjustments pursuant to the terms of the Forward Sale Agreements. Settlement of each of the Forward Sale Agreements must occur no later than one year after the closing of the Offering but may occur earlier at the option of the Company or, in certain circumstances described in the Forward Sale Agreements, at the option of the relevant Forward Counterparty. A Forward Counterparty’s decision to exercise its right to accelerate the Forward Sale Agreements entered into with it and to require the Company to settle the Forward Sale Agreements will be made irrespective of the Company’s interests, including the Company’s need for capital. The Company could be required to issue and deliver the Company’s common stock under the terms of the physical settlement provisions of the Forward Sale Agreements irrespective of the Company’s capital needs, which would result in dilution to the Company’s earnings per share and return on equity. The Forward Sales Agreements are accounted for as equity instruments with subsequent changes in fair value not recognized as long as the contracts continue to be equity classified.
The Company received proceeds of $290.4 million ($287.6 million net of fees and expenses) from the sale of 5 million shares of common stock in the Offering. The Company has not received any proceeds from the sale of shares of its common stock by the Forward Counterparties pursuant to the Forward Sale Agreements. The Company used the net proceeds of the shares issued and sold by the Company in the Offering and expects to use any net proceeds received upon the settlement of the Forward Sale Agreements for general corporate purposes, which may include strategic acquisitions and the repayment or refinancing of outstanding indebtedness.
Series C Convertible Perpetual Preferred Stock and Common Stock
In May 2015, the Company issued and sold 15.5 million shares (the “2015 Purchased Common Shares”) in the aggregate of the Company’s common stock, par value $0.001 per share (the “Company Common Stock”), and 0.6 million shares (the “2015 Purchased Preferred Stock” and, together with the 2015 Purchased Common Shares, the “2015 Purchased Securities”) in the aggregate of the Company’s Series C Convertible Perpetual Preferred Stock, par value $0.001 per share, in a private placement. The purchase price per 2015 Purchased Common Share was $45.00 (resulting in aggregate gross proceeds to the Company of approximately $697.5 million), and the purchase price per share of 2015 Purchased Preferred Stock was $1,000 (resulting in aggregate gross proceeds to the Company of approximately $562.5 million). The Company received net proceeds of $1,228.1 million after equity issuance costs which was initially allocated between common and preferred stock based on the relative fair values of each instrument. In September 2015, the 2015 Purchased Preferred Stock was automatically converted into 12.5 million shares of Company common stock. As the fair value of the Company’s common stock was greater than the conversion price, the conversion feature was issued “in-the-money” and the Company allocated the beneficial conversion feature of $52.0 million to additional paid-in capital. The beneficial conversion feature was recognized in net loss attributable to common shareholders upon receiving stockholder approval in September 2015.
94
13. Stock-Based Compensation
On December 20, 2016, the Company’s stockholders approved the XPO Logistics, Inc. 2016 Omnibus Incentive Compensation Plan (the “2016 Plan”). The 2016 Plan replaces the XPO Logistics, Inc. Amended and Restated 2011 Omnibus Incentive Compensation Plan (the “2011 Plan”) and the Con-way Inc. 2012 Equity and Incentive Plan (the “Con-way Plan”), the latter of which was assumed by the Company in connection with the acquisition of Con-way. Any awards granted under the 2011 Plan and the Con-way Plan will remain in effect pursuant to their respective terms.
Under the terms of the 2016 Plan, the Company grants various types of stock-based compensation awards to directors, officers and key employees. The 2016 Plan provides for awards in the form of stock options, stock appreciation rights, restricted stock, restricted stock units, deferred share units, performance compensation awards, performance units, cash incentive awards and other equity-based or equity-related awards (collectively, “Awards”) that the Compensation Committee of the Board of Directors (the “Committee”) determines are consistent with the purpose of the 2016 Plan and interests of the Company.
The maximum aggregate number of shares of common stock that may be delivered pursuant to Awards under the 2016 Plan is 3.4 million shares. Awards that are settled in cash would not reduce the number of shares available for delivery under the 2016 Plan. In the event of any extraordinary dividend or other extraordinary distribution, recapitalization, rights offering, stock split, reverse stock split, split-up or spin-off, the Committee shall equitably adjust any or all of the number of shares of the Company with respect to which Awards may be granted, including 2011 Plan share limits, the terms of any outstanding Award, the number of shares subject to outstanding Awards, and the exercise price of any Award, if applicable. Any shares delivered pursuant to an Award may consist, in whole or in part, of authorized and unissued shares or of treasury shares.
The 2016 Plan will continue in effect until December 20, 2026, unless terminated earlier by the Board of Directors. As of December 31, 2017, there were 2.5 million shares available for issuance under the 2016 Plan.
On December 20, 2017, the Company’s stockholders approved the XPO Logistics, Inc. Employee Stock Purchase Plan (the “ESPP”). Under the terms of the ESPP, all eligible employees in the U.S. can purchase common stock through payroll deductions (which cannot exceed 10 percent of each employee’s compensation) at 5 percent below fair market value on the last trading day at the end of each six-month purchase period during two offering periods per year, beginning on April 1 and October 1. Under the ESPP, employees must hold the stock they purchase for a minimum of three months from the date of purchase. Subject to adjustment for changes in the Company’s capitalization, the number of shares to be granted under the ESPP is not to exceed 2 million shares. The first offering period will occur in 2018 and the ESPP will be in effect until October 2027, unless terminated earlier at the discretion of the Board of Directors. The plan is deemed non-compensatory and therefore, no stock-based compensation expense will be recognized. Executive officers and directors of the Company are not eligible to participate in the ESPP.
The Company recognized the following stock-based compensation expense in Direct operating expense and SG&A in the Consolidated Statements of Operations:
Years ended December 31, | ||||||||||||
(In millions) | 2017 | 2016 | 2015 | |||||||||
Stock options | $ | 0.5 | $ | 1.2 | $ | 1.9 | ||||||
Stock appreciation rights | 0.9 | 0.6 | 0.4 | |||||||||
Restricted stock units | 11.8 | 13.0 | 9.0 | |||||||||
Performance-based restricted stock units | 10.5 | 12.8 | 17.0 | |||||||||
Cash-settled performance-based restricted stock units | 55.5 | 26.9 | — | |||||||||
Warrants | — | — | 8.5 | |||||||||
Total stock-based compensation expense | $ | 79.2 | $ | 54.5 | $ | 36.8 | ||||||
Tax benefit on stock-based compensation | (7.9 | ) | (5.6 | ) | — | |||||||
95
The Company settled the outstanding warrants and certain performance stock awards of ND. The portion of the fair value of the warrants and performance shares not attributable to service performed prior to the acquisition date was recorded as stock-based compensation expense in 2015. The amount of stock-based compensation expense related to the settlement of ND stock awards included in the year ended December 31, 2015 was $18.5 million. The $8.5 million of stock-based compensation related to the warrants was settled in cash during the second quarter of 2015.
The Company settled all outstanding restricted stock awards as well as certain restricted stock units and performance-stock awards of Con-way. All remaining outstanding Con-way equity awards were assumed by the Company, as more fully discussed below. The portion of the fair value not attributable to service performed prior to the acquisition date was recorded as stock-based compensation expense in the post-combination period. The total value of the cash settlement of Con-way stock-based compensation awards in connection with the acquisition was $30.9 million, of which $17.8 million and $10.0 million was settled in cash during 2016 and 2015, respectively.
Stock Options
For employees and officers, stock options typically vest over three to five years after the grant date, have a ten year contractual term, and an exercise price equal to the Company’s stock price on the grant date. For grants to members of the Company’s Board of Directors, stock options vest one year after the grant date, have a ten year contractual term, and an exercise price equal to the Company’s stock price on the grant date.
In connection with the Con-way transaction, each outstanding Con-way stock option was converted into an equivalent intrinsic value of stock options with the same terms and conditions as were applicable prior to the acquisition, resulting in a total of 883,733 stock options assumed by the Company. All assumed stock options were fully vested as of the acquisition date.
The following is a summary of the weighted-average assumptions used to calculate the grant-date fair value using the Black-Scholes option pricing model. There were no stock options granted during 2017.
2016 | 2015 | |||||
Weighted-average risk-free interest rate | 1.8 | % | 1.6 | % | ||
Weighted-average volatility | 50.0 | % | 60.7 | % | ||
Weighted-average dividend yield | — | — | ||||
Weighted-average expected option term (in years) | 6.44 | 6.61 | ||||
The expected term of options granted has been derived based upon the Company’s history of actual exercise behavior and represents the period of time that options granted are expected to be outstanding. The expected volatility is based upon the Company’s historical market price at consistent points in a period equal to the expected life of the options. The risk-free interest rate is based on the U.S. Treasury yield curve with a term equal to the expected term of the option in effect at the time of grant.
A summary of stock option award activity for the year ended December 31, 2017 is presented below:
Stock Options | |||||||||
Number of Stock Options | Weighted-Average Exercise Price | Weighted-Average Remaining Term | |||||||
Outstanding at December 31, 2016 | 1,080,554 | $ | 13.32 | 5.21 | |||||
Granted | — | — | |||||||
Exercised | (219,961 | ) | 13.28 | ||||||
Forfeited | (9,020 | ) | 25.64 | ||||||
Outstanding at December 31, 2017 | 851,573 | $ | 13.21 | 4.44 | |||||
Options exercisable at December 31, 2017 | 815,022 | $ | 12.66 | 4.31 | |||||
The weighted-average grant date fair value of options granted during 2016 and 2015 was $11.37 and $15.71, respectively. The intrinsic value of options outstanding and exercisable at December 31, 2017 was $66.8 million and
96
$64.3 million, respectively. As of December 31, 2017, the Company had approximately $0.4 million of unrecognized compensation cost related to stock options which is expected to be recognized over a weighted-average period of one year.
The total intrinsic value of options exercised during 2017, 2016 and 2015 was $9.0 million, $11.7 million and $4.1 million, respectively. The total cash received from options exercised during 2017, 2016 and 2015 was $1.0 million, $13.2 million, and $5.2 million, respectively.
Restricted Stock Units and Performance-based Restricted Stock Units
The Company has granted RSUs and PRSUs to certain key employees, officers and directors of the Company with various vesting requirements as established by the Compensation Committee of the Board of Directors. The RSUs vest based on the passage of time. The vesting of certain RSU awards is also subject to the price of the Company’s common stock exceeding a specified per share price for a designated period of time and continued employment at the Company by the grantee as of the vesting date. The PRSUs granted will vest based on the achievement of certain targets with respect to the Company’s overall financial performance for specified periods. The vesting of certain PRSUs is also subject to the price of the Company’s common stock exceeding a specified per share price for a designated period of time and generally require continued employment at the Company by the grantee as of the vesting date.
The RSUs and PRSUs may vest in whole or in part before the applicable vesting date if the grantee’s employment is terminated by the Company without cause or by the grantee with good reason (as defined in the grant agreement), upon death or disability of the grantee or in the event of a change in control of the Company. Upon vesting, the RSUs and PRSUs result in the issuance of shares of XPO common stock after required minimum tax withholdings. The holders of the RSUs and PRSUs do not have the rights of a stockholder and do not have voting rights until certificates representing shares are issued and delivered in settlement of the awards. The fair value of all grants of RSUs and PRSUs subject to market-based vesting conditions was estimated using the Monte Carlo simulation lattice model.
A summary of RSU and PRSU award activity for the year ended December 31, 2017 is presented below:
RSUs | PRSUs | |||||||||||||
Number of RSUs | Weighted-Average Grant Date Fair Value | Number of PRSUs | Weighted-Average Grant Date Fair Value | |||||||||||
Outstanding at December 31, 2016 | 977,820 | $ | 26.60 | 2,266,556 | $ | 20.88 | ||||||||
Granted | 658,222 | 51.05 | 283,887 | 51.67 | ||||||||||
Vested | (449,583 | ) | 26.49 | (155,424 | ) | 21.40 | ||||||||
Forfeited and canceled | (144,905 | ) | 27.61 | (556,792 | ) | 27.70 | ||||||||
Outstanding at December 31, 2017 | 1,041,554 | $ | 41.96 | 1,838,227 | $ | 24.37 | ||||||||
The total fair value of RSUs vested during 2017, 2016 and 2015 was $23.0 million, $26.8 million and $14.3 million, respectively. Of the 1,041,554 outstanding RSUs, 1,029,840 vest subject to service conditions and 11,714 vest subject to service and market conditions.
The total fair value of PRSUs that vested during 2017, 2016 and 2015 was $8.4 million, $7.2 million and $0.7 million, respectively. Of the 1,838,227 outstanding PRSUs, 946,522 vest subject to service and a combination of market and performance conditions and 891,705 vest subject to service and performance conditions.
As of December 31, 2017, the Company had approximately $55.9 million of unrecognized compensation cost related to non-vested RSU and PRSU compensation that is anticipated to be recognized over a weighted-average period of approximately 2.21 years.
Cash-settled Performance-based Restricted Stock Units
In February 2016, the Company entered into employment agreements with its executive officers. Pursuant to these agreements, on February 9, 2016, the Company granted cash-settled PRSUs under the 2011 Plan to certain executive officers. Twenty-five percent of the PRSUs vest and are settled in cash on each of the first four anniversaries of the
97
grant, subject to the grantee’s continued employment through the applicable anniversary and achievement of certain performance targets for each tranche. Cash-settled PRSU awards are measured at fair value initially based on the closing price of the Company’s common stock at the date of grant and are required to be re-measured to fair value at each reporting date until settlement. Compensation expense for cash-settled PRSUs is recognized over the applicable performance periods based on the probability of achieving the performance conditions and the closing price of the Company’s common stock at each balance sheet date. The Company records as a liability (until settlement) the cost of a cash-settled PRSU award for which achievement of the performance condition is deemed probable. At December 31, 2017 and 2016, the Company had recognized accrued liabilities of $51.7 million and $26.9 million, respectively, using a fair value per PRSU of $91.59 and $43.16, respectively.
A summary of cash-settled PRSU award activity for the year ended December 31, 2017 is presented below:
Number of Cash-settled PRSUs | |||
Outstanding at December 31, 2016 | 2,447,017 | ||
Granted | — | ||
Vested | (622,733 | ) | |
Forfeited | (130,890 | ) | |
Outstanding at December 31, 2017 | 1,693,394 | ||
As of December 31, 2017, the Company had approximately $103.4 million of unrecognized compensation cost related to non-vested cash-settled PRSU compensation that is anticipated to be recognized over a weighted-average period of approximately 2.0 years and will vary based on changes in the Company’s common stock price and the probability of achieving performance targets in future periods.
14. Income Taxes
A summary of income (loss) before taxes related to U.S. and Foreign operations are as follows:
Years Ended December 31, | ||||||||||||
(In millions) | 2017 | 2016 | 2015 | |||||||||
U.S. | $ | 278.2 | $ | (69.8 | ) | $ | (305.7 | ) | ||||
Foreign | (17.5 | ) | 176.6 | 23.2 | ||||||||
Income (loss) before income tax (benefit) provision | $ | 260.7 | $ | 106.8 | $ | (282.5 | ) | |||||
98
The components of the income tax (benefit) provision consist of the following:
Years Ended December 31, | ||||||||||||
(In millions) | 2017 | 2016 | 2015 | |||||||||
Current: | ||||||||||||
U.S. Federal | $ | 2.2 | $ | (10.6 | ) | $ | (34.2 | ) | ||||
State | (2.9 | ) | 6.3 | 8.8 | ||||||||
Foreign | 58.9 | 47.5 | 26.4 | |||||||||
Total current income tax provision | $ | 58.2 | $ | 43.2 | $ | 1.0 | ||||||
Deferred: | ||||||||||||
U.S. Federal (1) | $ | (134.6 | ) | $ | 1.3 | $ | (58.1 | ) | ||||
State | (1.9 | ) | (2.5 | ) | (18.2 | ) | ||||||
Foreign (2) | (21.2 | ) | (19.7 | ) | (15.6 | ) | ||||||
Total deferred income tax (benefit) | (157.7 | ) | (20.9 | ) | (91.9 | ) | ||||||
Total income tax (benefit) provision | $ | (99.5 | ) | $ | 22.3 | $ | (90.9 | ) | ||||
(1) | On December 22, 2017, the “H.R.1”, formally known as the Tax Cuts and Jobs Act (the “Act”) was signed into law. The Act includes numerous changes to existing tax law, including a permanent reduction in the federal corporate income tax rate from 35% to 21%. The rate reduction is effective January 1, 2018. As a result, the Company recorded a tax benefit of $173.1 million in the fourth quarter of 2017 related to the revaluation of its net deferred tax liabilities. At this time, the Company has not made any adjustments related to potential Global Intangible Low-Taxed Income (“GILTI”) tax in its financial statements and has not made a policy decision regarding whether to record deferred taxes on GILTI. The Act also requires a one-time tax on the “mandatory deemed repatriation” of accumulated foreign earnings as of December 31, 2017. Based on provisional calculations, the Company does not expect to incur a tax liability on the mandatory repatriation. Based on a continued analysis of the estimates and further guidance on the application of the law, it is anticipated that additional revisions may occur throughout the allowable measurement period. |
(2) | On December 31, 2017, a law was published in France enacting a rate reduction from 34.43% to 25.83% to be phased in over five years starting in 2018. On December 29, 2017, a law was published in Belgium enacting a tax rate reduction from 33.99% to 25% to be phased in over three years starting in 2018. Consequently, the Company recorded a tax benefit of $9.8 million in the fourth quarter of 2017 related to the revaluation of its net deferred tax liabilities. |
99
The effective tax rate reconciliations are as follows:
Years Ended December 31, | |||||||||
2017 | 2016 | 2015 | |||||||
U.S. Federal statutory tax rate | 35.0 | % | 35.0 | % | 35.0 | % | |||
State taxes, net of U.S. Federal benefit | (1.2 | ) | 4.8 | 2.2 | |||||
Foreign rate differential | (6.7 | ) | (13.2 | ) | 1.9 | ||||
Foreign operations (1) | (0.1 | ) | 2.4 | (5.1 | ) | ||||
Valuation allowance | 0.8 | 11.2 | — | ||||||
Changes in uncertain tax positions | 5.1 | (0.1 | ) | 0.2 | |||||
Effect of law changes (2) | (70.2 | ) | (12.3 | ) | — | ||||
Stock-based compensation | (3.3 | ) | (4.7 | ) | — | ||||
Other | 2.4 | (2.2 | ) | (2.0 | ) | ||||
Effective tax rate | (38.2 | )% | 20.9 | % | 32.2 | % | |||
(1) | Foreign operations include the net impact of the changes to foreign valuation allowances, the cost of foreign inclusion net of foreign tax credits, and permanent items related to foreign operations. |
(2) | 2017 U.S., France, and Belgium tax rate changes; 2016 France tax rate change. |
Components of the Net Deferred Tax Asset or Liability
The tax effects of temporary differences that give rise to significant portions of the deferred tax asset and deferred tax liability are as follows:
Years Ended December 31, | ||||||||
(In millions) | 2017 | 2016 | ||||||
Deferred tax asset | ||||||||
Net operating loss and other tax attribute carryforwards | $ | 191.0 | $ | 235.1 | ||||
Accrued expenses | 65.4 | 115.8 | ||||||
Pension and other retirement obligations | 25.8 | 59.6 | ||||||
Other | 63.5 | 71.9 | ||||||
Total deferred tax asset | 345.7 | 482.4 | ||||||
Valuation allowance | (92.6 | ) | (83.1 | ) | ||||
Total deferred tax asset, net | 253.1 | 399.3 | ||||||
Deferred tax liability | ||||||||
Intangible assets | (371.3 | ) | (515.7 | ) | ||||
Property & equipment | (255.0 | ) | (392.7 | ) | ||||
Other | (37.9 | ) | (60.6 | ) | ||||
Total deferred tax liability | (664.2 | ) | (969.0 | ) | ||||
Net deferred tax liability | $ | (411.1 | ) | $ | (569.7 | ) | ||
100
The deferred tax asset and liability above are reflected in the Consolidated Balance Sheets as follows:
December 31, | ||||||||
(In millions) | 2017 | 2016 | ||||||
Deferred tax asset | $ | 7.7 | $ | 2.7 | ||||
Deferred tax liability | (418.8 | ) | (572.4 | ) | ||||
Net deferred tax liability | $ | (411.1 | ) | $ | (569.7 | ) | ||
Investments in Foreign Subsidiaries
The Act includes a mandatory one-time tax on accumulated earnings of foreign subsidiaries, and as a result, all previously unremitted earnings for which no U.S. deferred tax liability had been accrued have now been subject to U.S. tax. We intend to continue to invest all of these earnings, as well as our capital in these subsidiaries, indefinitely outside of the U.S. and do not expect to incur any significant taxes related to such amounts.
Operating Loss and Tax Credit Carryforwards
At December 31, 2017 and 2016, the Company had federal net operating losses for all U.S. operations (including those of minority owned subsidiaries) of $188.1 million and $284.4 million, respectively, expiring at various times between 2024 and 2037. At December 31, 2017 and 2016, the tax effect (before federal benefit) of the Company’s state net operating losses was $32.9 million and $38.2 million, respectively, expiring at various times between 2018 and 2038.
At December 31, 2017 and 2016, the Company had federal tax credit carryforwards of $34.4 million and $25.3 million, respectively, expiring at various times starting in 2032 with certain credits having an unlimited carryforward period. At December 31, 2017, the Company had state tax credit carryforwards of $9.6 million expiring at various times between 2018 and 2031. At December 31, 2016, the Company had state tax credit carryforwards of $4.2 million expiring at various times between 2017 and 2028.
At December 31, 2017 and 2016, the Company’s foreign net operating losses that are available to offset future taxable income were $332.3 million and $296.5 million, respectively. These foreign loss carryforwards will expire at various times beginning in 2018 with some losses having an unlimited carryforward period.
Valuation Allowance
The Company has evaluated the available positive and negative evidence and concluded, for some of its deferred tax assets, it is more likely than not that these assets will not be realized in the foreseeable future. Based on the Company’s assessment, as of December 31, 2017, total valuation allowances of $92.6 million were recorded against deferred tax assets. Although realization is not assured, the Company has concluded that it is more likely than not that the remaining deferred tax assets will be realized and as such no valuation allowance has been provided on these assets. The Company’s valuation allowance increased by $9.5 million during the year ended December 31, 2017.
The following table presents a rollforward of the valuation allowance for the years ended December 31, 2017, 2016, and 2015, respectively:
(In millions) | Balance at Beginning of Year | Additions | Reductions/Charges | Balance at End of Year | ||||||||||||
Valuation allowance | ||||||||||||||||
Year Ended December 31, 2017 | $ | 83.1 | $ | 29.0 | $ | (19.5 | ) | $ | 92.6 | |||||||
Year Ended December 31, 2016 | 67.6 | 15.5 | — | 83.1 | ||||||||||||
Year Ended December 31, 2015 | 7.1 | 60.5 | — | 67.6 | ||||||||||||
101
Unrecognized Tax Benefits (UTB)
A reconciliation of the beginning and ending amount of unrecognized tax benefits is as follows:
Years Ended December 31, | ||||||||||||
(In millions) | 2017 | 2016 | 2015 | |||||||||
Beginning balance | $ | 14.6 | $ | 11.5 | $ | 6.2 | ||||||
Additions for tax positions of prior years | 16.8 | 0.6 | 0.2 | |||||||||
Additions for tax positions from acquisitions | — | 10.3 | 6.1 | |||||||||
Additions for tax positions of the current period | 2.4 | 0.1 | 0.5 | |||||||||
Reductions due to the statute of limitations | (8.8 | ) | (7.9 | ) | (1.5 | ) | ||||||
Ending balance | $ | 25.0 | $ | 14.6 | $ | 11.5 | ||||||
Interest and penalties | 5.2 | 4.8 | 4.6 | |||||||||
Gross unrecognized tax benefits | $ | 30.2 | $ | 19.4 | $ | 16.1 | ||||||
Total UTB that, if recognized, would impact the effective income tax rate as of the end of the year | $ | 22.8 | $ | 11.4 | $ | 8.1 | ||||||
During the next twelve months, it is reasonably possible that the Company could reflect a reduction to unrecognized tax benefits of $3.2 million due to the statute of limitations lapsing on positions or because tax positions are sustained on audit.
The Company is subject to taxation in the United States, various states, and foreign jurisdictions. As of December 31, 2017, the Company has no tax years under examination by the IRS. The Company has various U.S. state and local examinations and non-U.S. examinations in process. The U.S. Federal returns after 2010, state and local returns after 2009, and non-U.S. returns after 2007 are open under relevant statutes of limitations and are subject to audit.
15. Earnings (Loss) per Share
Basic and diluted earnings (loss) per share are computed using the two-class method, which is an earnings allocation method that determines earnings (loss) per share for common shares and participating securities. The participating securities consist of the Company’s Series A Convertible Perpetual Preferred Stock. The undistributed earnings are allocated between common shares and participating securities as if all earnings had been distributed during the period. In periods of loss, no allocation is made to the preferred shares.
102
Years Ended December 31, | ||||||||||||
(In millions, except per share data) | 2017 | 2016 | 2015 | |||||||||
Basic earnings (loss) per common share | ||||||||||||
Net income (loss) attributable to XPO | $ | 340.2 | $ | 69.0 | $ | (191.1 | ) | |||||
Preferred stock beneficial conversion charge | — | — | (52.0 | ) | ||||||||
Convertible preferred dividends | (2.9 | ) | (2.9 | ) | (2.8 | ) | ||||||
Non-cash allocation of undistributed earnings | (24.9 | ) | (3.0 | ) | — | |||||||
Net income (loss) allocable to common shares, basic | $ | 312.4 | $ | 63.1 | $ | (245.9 | ) | |||||
Basic weighted-average common shares | 114.9 | 110.2 | 92.8 | |||||||||
Basic earnings (loss) per share | $ | 2.72 | $ | 0.57 | $ | (2.65 | ) | |||||
Diluted earnings (loss) per common share | ||||||||||||
Net income (loss) allocable to common shares, basic | $ | 312.4 | $ | 63.1 | $ | (245.9 | ) | |||||
Interest from Convertible Senior Notes | 1.0 | 1.4 | — | |||||||||
Net income (loss) allocable to common shares, diluted | $ | 313.4 | $ | 64.5 | $ | (245.9 | ) | |||||
Basic weighted-average common shares | 114.9 | 110.2 | 92.8 | |||||||||
Dilutive effect of Convertible Senior Notes | 2.0 | 3.1 | — | |||||||||
Dilutive effect of non-participating stock-based awards | 10.9 | 9.5 | — | |||||||||
Diluted weighted-average common shares | 127.8 | 122.8 | 92.8 | |||||||||
Diluted earnings (loss) per share | $ | 2.45 | $ | 0.53 | $ | (2.65 | ) | |||||
Potential common shares excluded | 10.2 | 11.8 | 25.7 | |||||||||
Certain shares were not included in the computation of diluted earnings per share because the effect was anti-dilutive.
16. Commitments and Contingencies
Lease Commitments
Under operating leases, the Company is required to make payments for various real estate, double-stack railcars, containers, chassis, tractors, data processing equipment, transportation and office equipment leases that have an initial or remaining non-cancelable lease term. Certain leases also contain provisions that allow the Company to extend the leases for various renewal periods.
Under certain capital lease agreements, the Company guarantees the residual value of tractors at the end of the lease term. The stated amounts of the residual-value guarantees have been included in the minimum lease payments below.
103
Future minimum lease payments with initial or remaining non-cancelable lease terms in excess of one year, at December 31, 2017, were as follows:
(In millions) | Capital Leases | Operating Leases | ||||||
Year ending December 31: | ||||||||
2018 | $ | 50.0 | $ | 517.9 | ||||
2019 | 44.0 | 385.0 | ||||||
2020 | 41.9 | 291.3 | ||||||
2021 | 39.3 | 220.3 | ||||||
2022 | 34.9 | 168.2 | ||||||
Thereafter | 53.4 | 395.8 | ||||||
Total minimum lease payments | $ | 263.5 | $ | 1,978.5 | ||||
Amount representing interest | (15.3 | ) | ||||||
Present value of minimum lease payments | $ | 248.2 | ||||||
Rent expense was approximately $716.3 million, $677.2 million and $412.1 million for the years ended December 31, 2017, 2016 and 2015, respectively.
Litigation
The Company is involved, and will continue to be involved, in numerous proceedings arising out of the conduct of its business. These proceedings may include, among other matters, claims for property damage or personal injury incurred in connection with the transportation of freight, claims regarding anti-competitive practices, and employment-related claims, including claims involving asserted breaches of employee restrictive covenants and tortious interference with contract. These proceedings also include numerous purported class action lawsuits, multi-plaintiff and individual lawsuits and state tax and other administrative proceedings that claim either that the Company’s owner operators or contract carriers should be treated as employees, rather than independent contractors, or that certain of the Company’s drivers were not paid for all compensable time or were not provided with required meal or rest breaks. These lawsuits and proceedings may seek substantial monetary damages (including claims for unpaid wages, overtime, failure to provide meal and rest periods, unreimbursed business expenses and other items), injunctive relief, or both.
The Company establishes accruals for specific legal proceedings when it is considered probable that a loss has been incurred and the amount of the loss can be reasonably estimated. Accruals for loss contingencies are reviewed quarterly and adjusted as additional information becomes available. In connection with certain acquisitions of privately-held businesses, the Company has retained purchase price holdbacks or escrows to provide security for a negotiated duration with respect to damages incurred in connection with pre-acquisition claims and litigation matters. If a loss is not both probable and reasonably estimable, or if an exposure to loss exists in excess of the amount accrued therefor or the applicable purchase price holdback or escrow, the Company assesses whether there is at least a reasonable possibility that a loss, or additional loss, may have been incurred. If there is a reasonable possibility that a loss, or additional loss, may have been incurred, the Company discloses the estimate of the possible loss or range of loss if it is material and an estimate can be made, or states that such an estimate cannot be made. The evaluation as to whether a loss is reasonably possible or probable is based on the Company’s assessment, in conjunction with legal counsel, regarding the ultimate outcome of the matter.
The Company believes that it has adequately accrued for, or has adequate purchase price holdbacks or escrows with respect to, the potential impact of loss contingencies that are probable and reasonably estimable. The Company does not believe that the ultimate resolution of any matters to which the Company is presently a party will have a material adverse effect on its results of operations, financial condition or cash flows. However, the results of these matters cannot be predicted with certainty, and an unfavorable resolution of one or more of these matters could have a material adverse effect on the Company’s financial condition, results of operations or cash flows. Legal costs incurred related to these matters are expensed as incurred.
104
The Company carries liability and excess umbrella insurance policies that it deems sufficient to cover potential legal claims arising in the normal course of conducting its operations as a transportation and logistics company. The liability and excess umbrella insurance policies generally do not cover the misclassification claims described in this Note. In the event the Company is required to satisfy a legal claim outside the scope of the coverage provided by insurance, the Company’s financial condition, results of operations or cash flows could be negatively impacted.
Intermodal Drayage Classification Claims
Certain of the Company’s intermodal drayage subsidiaries received notices from the California Labor Commissioner, Division of Labor Standards Enforcement (the “DLSE”), that a total of approximately 150 owner operators contracted with these subsidiaries filed claims in 2012 with the DLSE in which they assert that they should be classified as employees, rather than independent contractors. These claims seek reimbursement for the owner operators’ business expenses, including fuel, tractor maintenance and tractor lease payments. After a decision was rendered by a DLSE hearing officer in seven of these claims, in 2014, the Company appealed the decision to California Superior Court, San Diego, where a de novo trial was held on the merits of those claims. On July 17, 2015, the court issued a final statement of decision finding that the seven claimants were employees rather than independent contractors, and awarding an aggregate of $2.9 million plus post-judgment interest and attorneys’ fees to the claimants. The Company has exhausted its appeals in this matter and the Superior Court entered final judgment against the Company in January 2018. Separate decisions were rendered in June 2015 by a DLSE hearing officer in claims involving five additional plaintiffs, resulting in an award for the plaintiffs in an aggregate amount of approximately $0.9 million, following which the Company appealed the decisions in the U.S. District Court for the Central District of California. On May 16, 2017, the Court issued judgment finding that the five claimants were employees rather than independent contractors, and awarding an aggregate of approximately $1.0 million plus post-judgment interest and attorneys’ fees to the claimants. The Company has appealed this judgment, but cannot provide assurance that such appeal will be successful. In addition, separate decisions were rendered in April 2017 by a DLSE hearing officer in claims involving four additional plaintiffs, resulting in an award for the plaintiffs in an aggregate amount of approximately $0.9 million, which the Company has appealed to the California Superior Court, Long Beach. The remaining DLSE claims have been transferred to California Superior Court in three separate actions involving approximately 200 claimants, including the approximately 150 claimants mentioned above. The Company believes that it has adequately accrued for the potential impact of loss contingencies that are probable and reasonably estimable relating to the claims referenced above. The Company is unable at this time to estimate the amount of the possible loss or range of loss, if any, in excess of its accrued liability that it may incur as a result of these claims given, among other reasons, that the range of potential loss could be impacted substantially by future rulings by the courts involved, including on the merits of the claims.
Last Mile Logistics Classification Claims
Certain of the Company’s last mile logistics subsidiaries are party to several putative class action litigations brought by independent contract carriers who contracted with these subsidiaries in which the contract carriers assert that they should be classified as employees, rather than independent contractors. The particular claims asserted vary from case to case, but the claims generally allege unpaid wages, unpaid overtime, or failure to provide meal and rest periods, and seek reimbursement of the contract carriers’ business expenses. Putative class actions against the Company’s subsidiaries are pending, or have recently been settled, in California (Fernando Ruiz v. Affinity Logistics Corp., filed in May 2005, in the Federal District Court, Southern District of California - the Company has reached an agreement to settle this litigation, the court has granted final approval, and the Company has accrued the full amount of the settlement; and four related cases all pending in the Federal District Court, Northern District of California: Ron Carter, Juan Estrada, Jerry Green, Burl Malmgren, Bill McDonald and Joel Morales v. XPO Logistics, Inc., filed in March 2016; Ramon Garcia v. Macy’s and XPO Logistics Inc., filed in July 2016; Kevin Kramer v. XPO Logistics Inc., filed in September 2016; and Hector Ibanez v. XPO Last Mile, Inc., filed in May 2017); New Jersey (Leonardo Alegre v. Atlantic Central Logistics, Simply Logistics, Inc., filed in March 2015 in the Federal District Court, New Jersey and settled in November 2017); and Connecticut (Carlos Taveras v. XPO Last Mile, Inc., filed in November 2015 in the Federal District Court, Connecticut and settled in August 2017). The Company believes that it has adequately accrued for the potential impact of loss contingencies relating to the foregoing claims that are probable and reasonably estimable. The Company is unable at this time to estimate the amount of the possible loss or range of loss, if any, in excess of its accrued liability that it may incur as a result of these claims given, among other reasons,
105
that the number and identities of plaintiffs in these lawsuits are uncertain and the range of potential loss could be impacted substantially by future rulings by the courts involved, including on the merits of the claims.
Last Mile TCPA Claims
The Company is a party to a putative class action litigation (Leung v. XPO Logistics, Inc., filed in May 2015 in the U.S. District Court, Illinois) alleging violations of the Telephone Consumer Protection Act (“TCPA”) related to an automated customer call system used by a last mile logistics business that the Company acquired. The Company has reached an agreement to resolve the Leung case and awaits final court approval of the settlement. The Company has accrued the full amount of the proposed settlement.
Less-Than-Truckload Meal Break Claims
The Company’s LTL subsidiary has been a party to class action litigation alleging violations of the state of California’s wage and hour laws, including alleged failure to provide its driver employees with required meal breaks and rest breaks. The primary case is Jose Alberto Fonseca Pina, et al. v. Con-way Freight Inc., et al. and was initially filed in November 2009 in Monterey County Superior Court and then removed to the U.S. District Court of California, Northern District. The Pina case was settled in November 2017 and the matter is now resolved.
106