Attached files
| file | filename |
|---|---|
| EXCEL - IDEA: XBRL DOCUMENT - Great Basin Scientific, Inc. | Financial_Report.xls |
| EX-31.1 - EX-31.1 - Great Basin Scientific, Inc. | d861768dex311.htm |
| EX-32.2 - EX-32.2 - Great Basin Scientific, Inc. | d861768dex322.htm |
| EX-31.2 - EX-31.2 - Great Basin Scientific, Inc. | d861768dex312.htm |
| EX-32.1 - EX-32.1 - Great Basin Scientific, Inc. | d861768dex321.htm |
Table of Contents
UNITED STATES
SECURITIES AND EXCHANGE COMMISSION
Washington, D.C. 20549
FORM 10-K
(Mark One)
| x | ANNUAL REPORT PURSUANT TO SECTION 13 OR 15(d) OF THE SECURITIES EXCHANGE ACT OF 1934 |
For the fiscal year ended December 31, 2014
OR
| ¨ | TRANSITION REPORT PURSUANT TO SECTION 13 OR 15(d) OF THE SECURITIES EXCHANGE ACT OF 1934 |
For the transition period from to
Commission File Number 001-36662
GREAT BASIN SCIENTIFIC, INC.
(Exact name of Registrant as specified in its Charter)
| Delaware | 83-0361454 | |
| (State or other jurisdiction of incorporation or organization) |
(I.R.S. Employer Identification No.) | |
| 2441 South 3850 West Salt Lake City, UT |
84120 | |
| (Address of principal executive offices) | (Zip Code) | |
Registrant’s telephone number, including area code: (801) 990-1055
Securities registered pursuant to Section 12(b) of the Act: Common Stock, Par Value $0.001 Per Share; Common stock traded on the NASDAQ stock market
Securities registered pursuant to Section 12(g) of the Act: None
Indicate by check mark if the Registrant is a well-known seasoned issuer, as defined in Rule 405 of the Securities Act. YES ¨ NO x
Indicate by check mark if the Registrant is not required to file reports pursuant to Section 13 or 15(d) of the Act. YES ¨ NO x
Indicate by check mark whether the Registrant: (1) has filed all reports required to be filed by Section 13 or 15(d) of the Securities Exchange Act of 1934 during the preceding 12 months (or for such shorter period that the Registrant was required to file such reports), and (2) has been subject to such filing requirements for the past 90 days. YES x NO ¨
Indicate by check mark whether the Registrant has submitted electronically and posted on its corporate Web site, if any, every Interactive Data File required to be submitted and posted pursuant to Rule 405 of Regulation S-T (§232.405 of this chapter) during the preceding 12 months (or for such shorter period that the Registrant was required to submit and post such files). YES x NO ¨
Indicate by check mark if disclosure of delinquent filers pursuant to Item 405 of Regulation S-K (§229.405) is not contained herein, and will not be contained, to the best of Registrant’s knowledge, in definitive proxy or information statements incorporated by reference in Part III of this Form 10-K or any amendment to this Form 10-K. x
Indicate by check mark whether the Registrant is a large accelerated filer, an accelerated filer, a non-accelerated filer, or a smaller reporting company. See the definition of “large accelerated filer”, “accelerated filer”, and “smaller reporting company” in Rule 12b-2 of the Exchange Act. (Check one):
| Large accelerated filer | ¨ | Accelerated filer | ¨ | |||
| Non-accelerated filer | ¨ (Do not check if a small reporting company) | Small reporting company | x | |||
Indicate by check mark whether the Registrant is a shell company (as defined in Rule 12b-2 of the Exchange Act). YES ¨ NO x
The aggregate market value of the voting and non-voting common equity held by non-affiliates of the Registrant, based on the closing price of the shares of common stock on The NASDAQ Stock Market on February 13, 2015, was $3,903,770.
The number of shares of Registrant’s Common Stock outstanding as of February 13, 2015 was 5,086,458.
Portions of the Registrant’s definitive proxy statement to be filed pursuant to Regulation 14A under the Securities Act of 1934, in connection with the Registrant’s 2015 Annual Meeting of Stockholders, are incorporated by reference into Part III of this report.
Table of Contents
| Page | ||||||
| PART I |
||||||
| Item 1. |
2 | |||||
| Item 1A. |
22 | |||||
| Item 1B. |
42 | |||||
| Item 2. |
42 | |||||
| Item 3. |
42 | |||||
| Item 4. |
42 | |||||
| PART II |
||||||
| Item 5. |
43 | |||||
| Item 6. |
43 | |||||
| Item 7. |
Management’s Discussion and Analysis of Financial Condition and Results of Operations |
44 | ||||
| Item 7A. |
54 | |||||
| Item 8. |
54 | |||||
| Item 9. |
Changes in and Disagreements With Accountants on Accounting and Financial Disclosure |
55 | ||||
| Item 9A. |
55 | |||||
| Item 9B. |
55 | |||||
| PART III | ||||||
| Item 10. |
56 | |||||
| Item 11. |
56 | |||||
| Item 12. |
Security Ownership of Certain Beneficial Owners and Management and Related Stockholder Matters |
56 | ||||
| Item 13. |
Certain Relationships and Related Transactions, and Director Independence |
56 | ||||
| Item 14. |
56 | |||||
| PART IV | ||||||
| Item 15. |
57 | |||||
| 60 | ||||||
| F-1 | ||||||
i
Table of Contents
CAUTIONARY NOTE CONCERNING FORWARD-LOOKING STATEMENTS
This annual report on Form 10-K contains forward-looking statements regarding future events or our future financial and operational performance. Forward-looking statements include statements regarding markets for our products; trends in net sales, gross profits and estimated expense levels; liquidity and anticipated cash needs and availability; and any statement that contains the words “anticipate,” “believe,” “plan,” “forecast,” “foresee,” “estimate,” “project,” “expect,” “seek,” “target,” “intend,” “goal” and other similar expressions. The forward-looking statements included in this report reflect our current expectations and beliefs, and we do not undertake publicly to update or revise these statements, even if experience or future changes make it clear that any projected results expressed in this annual report or future quarterly reports to stockholders, press releases or company statements will not be realized. In addition, the inclusion of any statement in this report does not constitute an admission by us that the events or circumstances described in such statement are material. Furthermore, we wish to caution and advise readers that these statements are based on assumptions that may not materialize and may involve risks and uncertainties, many of which are beyond our control, that could cause actual events or performance to differ materially from those contained or implied in these forward-looking statements. These risks and uncertainties include the business and economic risks described in “Item 1A—Risk Factors”.
1
Table of Contents
PART I
Overview
We are a molecular diagnostic testing company focused on the development and commercialization of our patented, molecular diagnostic platform for testing for infectious disease, especially hospital-acquired infections. We believe our platform has the ability to transform molecular testing for infectious diseases at small to medium sized hospitals by providing an affordable solution that meets the rapidly evolving needs of patients and providers.
We believe there is a fast-growing market for molecular diagnostic platforms being purchased by hospital microbiology labs to replace culture and other legacy testing formats. We believe our platform is well positioned to meet this need. Our platform design enables us to develop molecular testing assays, that have the capability to provide results in 45 to 115 minutes depending on the assay. Molecular testing generally reduces test time from days to hours, and provides more accurate results, leading to shortened hospital stays and improved patient outcomes, all of which leads to reduced cost for hospitals that implement molecular testing in their labs.
Our platform is an automated molecular diagnostic system, consisting of an analyzer, an associated diagnostic test cartridge and our proprietary technology and know-how. Our platform utilizes a sample-to-result format, which means that once a patient specimen is received, it undergoes limited processing before it is placed in the analyzer where the test is run without further technician intervention. This reduces assay complexity and eliminates the need for highly trained and expensive molecular technicians to run the assays. Our platform is designed to enable us to develop simple, rapid and cost-effective analysis of multiple pathogens from a single clinical sample. While our customers include a variety of health care companies, we focus our marketing efforts on small to medium sized hospitals in the United States. Our system will enable those hospitals that traditionally could not afford more expensive or complex molecular diagnostic testing platforms to modernize their laboratory testing and provide better patient care at an affordable cost.
In November 2012, we launched our first FDA-cleared assay for C. diff, a bacteria that causes life-threatening gastro-intestinal distress in hospital patients. We currently sell our diagnostic cartridges in the United States through a direct sales force and in the European Union and New Zealand through distributors. As of January 31, 2015, we had 112 customers worldwide (90 in the United States and 22 in the rest of the world), who use an aggregate of 233 analyzers. Our easy to use system allows small to medium sized hospitals that we believe could not previously afford more expensive or complex molecular diagnostic testing platforms to modernize their laboratory testing and provide better patient care at an affordable cost.
In addition to our test for C. diff, we have developed a test for Group B Strep for which we filed a 510(k) submission to the FDA in the fourth quarter of 2014 and expect to receive the results of the FDA’s review during the second quarter of 2015. We also began a clinical trial for a Staph ID/R panel designed to identify blood infections caused by Staphylococcus bacteria in the fourth quarter of 2014. We expect to file a 510(k) submission for our Staph ID/R panel with the FDA in the third quarter of 2015 and we expect to receive the results of the FDA’s review during the fourth quarter of 2015 or the first quarter of 2016. We also started a clinical trial for our Shiga toxin producing E. coli test in the first quarter of 2015. Additionally, we have three other assays in active product development: (i) a pre-surgical screen for Staphylococcus aureus, or SA, (ii) a food borne pathogen panel, and (iii) a panel for candida blood infections.
For additional information about our products, see “—Our Assay Menu” below.
Our operations to date have been funded primarily through sales of capital stock, convertible notes, sale- leaseback transactions and cash from operations. We expect to incur increasing expenses over the next several years to develop additional diagnostic tests and to expand our sales and marketing infrastructure, our manufacturing capacity and our research and development activities.
2
Table of Contents
Our Strategy
Our goal is to become the leading provider of sample-to-result, multiplex and low-plex molecular diagnostic testing in infectious disease by leveraging the strengths of our affordable diagnostic testing platform. We intend to expand the use of our platform by targeting small to medium sized hospitals in the United States with fewer than 400 beds. We believe that our low-cost platform will be attractive to these hospitals in particular, which may not otherwise have sufficient resources to justify the purchase of a molecular diagnostic sample-to-result solution. To achieve this objective, we intend to do the following:
| • | Leverage our Low-Cost Platform to Quickly Penetrate the Small and Medium Sized Hospital Market. We provide our customers with our analyzer at no cost and sell them the disposable, single-use diagnostic cartridges. This allows us to avoid the long sales cycle inherent in selling capital equipment and expand into hospitals that previously could not afford to implement a molecular diagnostic platform. |
| • | Accelerate the Growth of our U.S. Customer Base. With the proceeds from this offering, we will expand our sales force to target small to medium hospitals in the United States. We anticipate that increasing our number of customers will drive sales of our diagnostic cartridges. We expect these sales will generate the majority of our revenue for the foreseeable future. |
| • | Expand our Menu of Molecular Diagnostic Assays. From January 2014 to December 2014, the average customer who had purchased our C. diff test for at least three months generated approximately $21,900 in annual revenue. We believe that by expanding our assay menu to include the six additional assays currently in development, we could increase our potential average annual revenue per customer to over $250,000 if customers reach projected usage levels and each of those customers used all seven of the tests we plan to include in our assay menu in the near term. There is no assurance that our expectations will be realized. There is no assurance that our expectations will be realized. To that end, we intend to develop a broad menu of molecular diagnostic assays for our platform that will satisfy growing medical needs and present attractive commercial opportunities. For example, we completed our clinical trial and filed our 510(k) application for our Group B Strep test and started our clinical trials for our Staph ID/R panel during the fourth quarter of 2014, and our Shiga toxin producing E. coli test during the first quarter of 2015. We also have a pipeline of assays in late stage product development, including pre-surgical screening, food-borne pathogens and candida. |
| • | Reduce our Cost of Sales through Automation and Volume Purchasing. We manufacture our proprietary diagnostic cartridges and analyzers at our headquarters in Salt Lake City, Utah. We currently hand-build our diagnostic cartridges and purchase materials at higher per unit cost due to low purchase volumes. We believe that investment in automation of portions of the manufacturing and assembly process and volume purchase pricing will significantly improve our gross margins and enhance our ability to provide a low cost solution to customers. |
3
Table of Contents
The Great Basin Platform
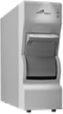
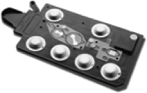
The platform, which employs a combination of proprietary and patented technology, consists of a bench top analyzer with a touch screen (or, in early models, laptop computer) into which our self-contained, single-use diagnostic cartridges are inserted. Our platform is user friendly, intuitive and provides the hospital with the ability to perform molecular diagnostic assays in an efficient and cost-effective manner.
| The Analyzer |
The Diagnostic Cartridge | The User Placing the Diagnostic Cartridge into the Analyzer | ||
|
|
|
|
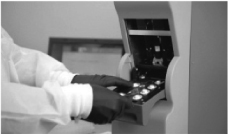
Once a patient specimen is received in the lab, a technician will typically perform no more than three to five steps of sample preparation before placing the sample in our disposable diagnostic cartridge and inserting it in the analyzer where the assay is run without further technician intervention. Our first FDA-cleared assay, which is a C. diff test, was rated by Clinical Laboratory Improvement Amendments of 1988, or CLIA, as moderately complex, which typically eliminates the need for highly-trained and expensive molecular technicians to run the assays, bringing additional cost benefit to our customers. We expect our future assays to be rated moderately complex or meet CLIA waiver criteria, which is reserved for assays that are simple and are judged by the FDA to present a low risk for erroneous results.
Our platform provides accurate results in 45 to 115 minutes depending on the assays. The speed of our assays allows for early diagnosis and treatment, which can lead to better patient outcomes and reduced cost to the hospital.
We believe that our platform and related assays offer small-to-medium sized hospitals the following benefits:
| • | Ease of Use. Our platform is a sample-to-result system. Sample preparation can be completed in three to five steps that typically take no more than five minutes. Once the diagnostic cartridge is placed in the analyzer, the technician does not need to monitor the assay and can complete other unrelated tasks. The assay is complete in 45 to 115 minutes depending on the assay. |
| • | Cost Savings. We believe that our pricing strategy makes it possible for many small-to-medium sized hospitals that have cost constraints to adopt molecular testing. We provide the customer the use of our analyzer for no upfront charge, while we retain ownership. We then sell our assays to the hospital at a cost that is similar to or less expensive than other molecular diagnostic solutions. This reduces the up-front cost for the customer, minimizes customer approval processes and accelerates adoption of our platform. |
| • | Versatile Platform with the Capability to Deliver a Broad Assay Menu. We believe our platform has broad application across a number of areas in molecular diagnostic testing for infectious disease, including the detection of pathogens from whole blood samples. The same analyzer can be utilized for all of our planned future assays. |
| • | Low-cost Low-plex tests. We believe our platform, including our low-cost chip detection and our single-use diagnostic cartridge, has a cost structure that will allow us to compete very effectively, and at very good margins, in the cost-sensitive market for low-plex tests with 1-3 answers like C. diff or |
4
Table of Contents
| Pre-surgical and MRSA screening. We believe this is currently the largest market for molecular infectious disease tests. We expect our low-plex tests like C. diff to drive system placements as hospitals convert from traditional testing methods. |
| • | Ability to Multiplex. Our platform has the ability to analyze up to 64 distinct targets in a single diagnostic panel, including controls, which we refer to this as a multi-plex panel. This will allow hospitals to test for multiple possible causes of an individual patient’s symptoms in a one-step detection process. This capability will reduce the time required for a laboratory to perform a diagnostic analysis that involves testing for multiple infectious disease pathogens. Without our platform, similar testing would require the hospital to run multiple, separate molecular or non-molecular diagnostic assays. Although our C. diff test currently detects a single pathogen, referred to as a low-plex test, two of our tests in development, Staph Identification and Resistance (ID/R) panel and the food borne pathogen panel, will utilize the multiplexing technology. We recently initiated the clinical trial for our Staph ID/R panel. |
The Molecular Testing Process
A clinician places a clinical specimen—processed or unprocessed—into the diagnostic cartridge (such as stool or blood), caps the cartridge and then places the diagnostic cartridge into the analyzer. The assay routine is initiated in the analyzer and starts a simple automated process. Within the instrument, mechanical valves are present to control the flow of fluid through the cartridge and to pierce the blister packs containing the required buffers, solutions and reagents to perform the selected assay. Low cost, reliable heaters are present for assay processing. Imaging occurs with a compact digital camera placed over a window in the cartridge above the chip. Proprietary software interprets the image and provides a clinical result to the laboratory.
The disposable diagnostic cartridge contains—in blister packs or freeze dried pellets—all of the reagents required to run the applicable assay. The three steps of a molecular assay (sample preparation, amplification, and detection) are performed in chambers present on the cartridge. All waste is collected in a chamber that is part of the diagnostic cartridge, significantly reducing the risk of lab contamination that is often cited as a concern of hospital labs trying to switch to molecular diagnostic testing. After the assay is completed and the result is obtained, the diagnostic cartridge is disposed of with the hospital’s other medical waste.
To simplify processing within the analyzer, fluids are moved within the diagnostic cartridge through relatively large channels by exploiting pressure differences. Proprietary features have been designed into the diagnostic cartridge to allow for bubble-free fluid movement and sensor design permits accurate and precise volumetric delivery.
Our Assay Menu
We have received FDA clearance and a CE mark for one assay, C. diff. We began marketing the C. diff test in Europe in the first quarter of 2012 and in the United States in the fourth quarter of 2012. We filed a 510(K) application for our Group B Strep and started the clinical trial for our Staph ID/R panel in the fourth quarter of 2014. We also initiated a clinical trial for Shiga toxin producing E. coli in the first quarter of 2015. We also have three other diagnostic assays in the late stages of product development: (i) a Staphylococcus aureus Pre-Surgical screening test, (ii) Food Borne Pathogens panel, and (iii) Candida Blood Infections panel. We also have a pipeline of assays in an early stage of development, including chlamydia/gonorrhea and other sexually transmitted diseases, respiratory testing, and sepsis (blood infection) panels.
Our Commercial Test: The C. diff Test
C. diff infections are often life-threatening and can create a significant financial burden for hospitals. As a hospital-acquired infection, costs associated with the care of patients with C. diff are not covered by insurance or Medicaid/Medicare. An independent peer reviewed paper, published in the American Journal of Infection Control in 2012, highlights a significant reduction in C. diff infection rates when a hospital switched from culture to molecular testing—reducing cost and improving patient outcomes.
5
Table of Contents
Our C. diff test is a rapid medical diagnostic test for the detection of C. diff, a gram-positive bacteria that causes severe diarrhea and other intestinal disorders. The test detects the presence of the C. diff toxin B gene, or tcdB gene, in the pathogenicity locus, or PaLOC region of C. diff, present in all known toxigenic strains, to diagnose the toxin in the stool. The test requires minimal sample preparation and can deliver results in under 90 minutes. A swab from a loose stool is placed into transfer solution and a portion of this solution is placed into the diagnostic cartridge. The diagnostic cartridge is then placed into the analyzer.
Our Assay Under Review by FDA
Group B Strep Test
Group B streptococcus, or Group B Strep, is a bacterium that colonizes in the warm moist areas of many humans. Harmless to healthy adults, it can be transmitted to a newborn during childbirth and is the single largest cause of meningitis in newborn infants. For this reason nearly every pregnant woman in the United States is tested for Group B Strep in the late third trimester. Historically this test was done by culture, but based on the recent introduction and sales of other Group B Strep molecular diagnostic tests, we believe labs are switching to molecular testing.
Our Group B Strep test is designed to detect Group B Strep from an anal/vaginal swab taken from a pregnant woman. If approved, hospitals will be able to use our test to identify Group B Strep colonization in pregnant women, who can then be treated with antibiotics to reduce the risk of transmission to the baby, reducing the risk of development of sepsis in the newborn. We filed a 510(k) application in November 2014, and we expect to receive the results of the FDA’s review of this test in the second quarter of 2015.
Our Assays In Clinical Trials
Staphylococcus Identification and Resistance Blood Infection Panel
Staphylococcus aureus is a major cause of hospital and community-acquired infections and is associated with high rates of morbidity and mortality. Methicillin-resistant Staphylococcus aureus, or MRSA, is a potentially life-threatening infection that most frequently occurs in the hospital setting. Rapid diagnosis of Staph blood infections has been shown, in a report published in Clinical Practice in 2010, to save up to approximately $7,000 per patient and shorten length of hospital stay by 6.2 days.
Our Staph ID/R panel will be designed to be a multiplex panel to (i) identify species of Staphylococcus infections based on the detection of highly discriminatory and specific DNA sequences within a bacterial replication gene, (ii) detect the mecA gene, which confers drug resistance, directly from positive blood cultures and (iii) provide information on the antibiotic resistance profile of the bacteria. This test will be designed to produce a result in less than one hour. Our Staph ID/R panel is designed to provide over 99% positive predictive value, or PPV, after only two blood draws, accelerating time to patient diagnosis and appropriate treatment.
With existing Staphylococcus tests, nearly one third of all positive blood cultures are not true infections, but due to contamination during the blood draw. On the other hand, in our study of 99 single-pathogen clinical samples, our test demonstrated 99% accuracy in identifying different Staphylococcus species. Our Staph ID/R panel’s increased ability to distinguish true infections from false positives is due to its ability to differentiate among seven species of Staphylococcus, and as a result, to distinguish between true infection and contaminants. Our Staph ID/R panel is currently in development and we began clinical trials in the fourth quarter of 2014.
Shiga Toxin Producing E.Coli (STEC) Test
Escherichia coli (E. coli) bacteria normally live in the intestines of healthy people and animals. Most varieties of E. coli are harmless or cause relatively brief diarrhea. But a few strains, such as E. coli O157:H7, can cause severe abdominal cramps, bloody diarrhea and vomiting.
6
Table of Contents
Our STEC Test will be a rapid test that identifies shiga toxin produced by E. coli, including E. coli O157:H7 which is the most serious type of E. coli contracted from contaminated food. We began the clinical trial in the first quarter of 2015.
Our Assays in Development
Staphyloccocus aureus Pre-Surgical Nasal Screen
Staphyloccocus aureus (SA) often colonizes the nasal passages and other warm moist areas in healthy humans. Harmless in most circumstances, the colonization represents real risk to patients undergoing surgery. In fact studies have shown the relative risk of post-surgical infection is up to nine times greater in carriers of SA than in non-carriers.
Our SA nasal screening test will be a rapid test for the presence of SA in the nasal passages of a pre-surgical patient. If approved, hospitals will be able to use our test to identify pre-surgical patients who are SA carriers and treat those patients with topical antibiotics, which has been shown in multiple peer-reviewed studies to significantly reduce the risk of post-surgical infection.
Food Borne Pathogens Panel
According to the Agency for Healthcare Research and Quality, there were nearly five million U.S. hospital visits in 2010 for gastrointestinal distress that suggested food-borne illness. In 2010, inpatient costs attributable to
patients suffering from gastrointestinal infections cost the healthcare system nearly $1.8 billion. One of the challenges faced by physicians assessing a patient with symptoms of gastrointestinal infection is determining the underlying cause.
Our Food Borne Pathogen panel will be designed to detect the main causes of food poisoning. If approved, hospitals will be able to use our panel to identify the causative pathogen of food poisoning and provide appropriate treatment quickly, improving patient outcomes. Additionally, the results may be used to aid public health agencies to track causes of food poisoning outbreaks.
Candida Blood Infections Panel
According to the United States Center for Disease Control there are 90,000 Candida blood infections annually in the U.S. Candida infections, while rare, have mortality rates as high as 40% if not diagnosed quickly. Our candida panel is a multiplex panel that will be designed to identify five species of Candida directly from positive blood cultures. We expect to complete product development and begin a clinical trial on our Candida panel in second half of 2015.
Our Technology
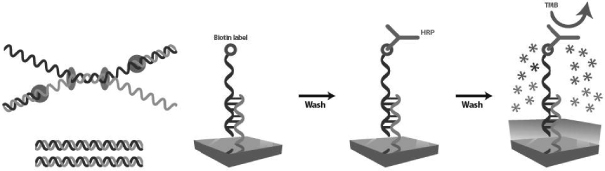
Our proprietary and patented technology is based on detection of DNA targets on a coated silicon chip with results visible to the naked eye. DNA naturally forms a double-stranded structure, with each strand binding with high affinity and selectivity to a complementary strand. Our technology can detect DNA target strands of interest by attaching complementary strands of DNA to the chip surface, called capture probes, using our proprietary technology and processes. The capture probe can thereby immobilize the DNA target of interest. In order for the DNA target to be detected, it is labeled with biotin, a small molecule which can be used to create a signal in the diagnostic test. Biotin, immobilized onto the chip surface via DNA target hybridization to the DNA probe will bind to a molecule which recognizes biotin and is conjugated to a signal generating enzyme, horseradish peroxidase, or HRP. Immobilized HRP can be reacted with a complex mixture to create a large colored product which deposits on the chip surface. This deposit causes the color of the chip surface to change. This color change is readily apparent to the naked eye as a dot in the vicinity of the DNA probe. In order to create tests with
7
Table of Contents
appropriate sensitivity for the given clinical indication, we can either amplify the quantity of DNA targets of interest or amplify the biotin-based signal. Each of these amplification approaches also serve to label DNA target(s) of interest with biotin.
Our Technology: Detection of On-chip Helicase Dependent Amplification (HDA) Reactions
Within the cartridge three distinct processes occur: sample processing, amplification, and detection. During sample processing, the specimen is treated to remove clinical matrices such as blood or feces that may interfere with assay results and is treated to break open cells to release potential DNA targets. Next, the sample is subjected to target amplification to create billions of copies of target DNA to improve assay sensitivity and to label each target with biotin. Finally, detection is triggered by hybridization of the biotin-labeled target DNA with capture probes on the chip surface. The chip is currently configured to hold as many as 64 probes, including controls, each of which can be configured to detect a different target DNA, enabling highly multiplexed testing. If signal amplification is used, a proprietary polymer is added to the detection reaction, which converts each target DNA associated biotin into 80 additional biotins to improve detection sensitivity. All waste generated from the assay is stored in a self-contained waste chamber which significantly reduces contamination risk.
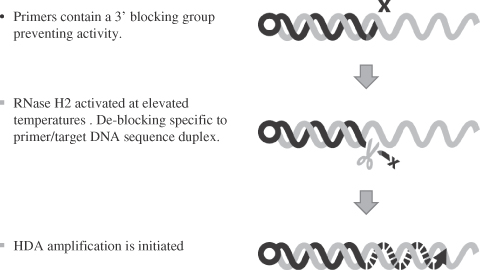
Target Amplification. Helicase-dependent amplification, or HDA, is a process that utilizes an enzyme, helicase, to unwind double-stranded DNA to create two single strands through isothermal, or single temperature, amplification. Once this DNA is single-stranded, complementary DNA primers, which are short pieces of DNA that are complementary to the DNA target, can hybridize. Through the action of an enzyme, DNA polymerase, the DNA primers grow, or extend, to create a complementary strand of the DNA target, creating double-stranded DNA again. This process can be repeated and the degree of copying, or amplification, is exponential, so that billions of copies can be created. HDA is a method already commercially available for detection of DNA targets, however, it is a mistake-prone process. DNA primers can incorrectly hybridize to non-target DNA at lower temperatures and be copied, creating so-called primer artifacts, which leads to tests that are slow and poorly sensitive.
Our patented target amplification approach, termed blocked primer-mediated, helicase-dependent amplification, or bpHDA, utilizes blocked primers to enhance test speed and sensitivity. Blocked primers are DNA primers that contain a block at lower temperatures, where most incorrect hybridization events occur, preventing extension of the DNA primers or copying of the DNA target. As the temperature is raised, incorrect hybridization events are not stable and fall apart, but hybridization of DNA primers to complementary DNA targets is still very strong and an enzyme, RNase H, becomes active which can remove the block in blocked primers hybridized to DNA targets only. As a result, the accuracy of the process is dramatically improved, leading to faster and more sensitive tests. In order to label the DNA target for detection, each DNA primer has a biotin molecule attached to one end.
Our platform is also capable of performing polymerase chain reaction, or PCR, which is a widely used method of DNA amplification. We are actively developing assays using PCR, including our Group B Strep test.
8
Table of Contents
Signal Amplification. Our patented signal amplification approach, which we refer to as AMPED, utilizes a bridging molecule to connect the biotin label on each DNA target to a polymer containing 80 biotins, thereby amplifying the signal up to 80 times in our diagnostic tests. The AMPED polymer works in the presence of blood, mucus, and feces typically present in clinical samples, thereby simplifying sample processing. The AMPED signal amplification process takes approximately 20 to 30 minutes and is a more rapid approach for detection of DNA targets than target DNA amplification, which typically takes 45 to 120 minutes. The patented AMPED polymer is highly water soluble and stable and displays low non-specific binding properties, which are critical requirements for highly specific signal amplification approaches.
Based on papers published in peer-reviewed journals, we believe our AMPED detector to be among the most sensitive in the industry with a proven limit of detection of 20,000 DNA molecules. And we believe this limit of detection will be more than adequate for us to develop assays focused on the nascent “direct from whole blood” market which we believe has the potential to be exceptionally disruptive by eliminating the need for culturing blood prior to testing. Currently patients suspected of having a blood infection (sepsis) have their blood drawn. That sample is then cultured for a day before testing. But published studies consistently show that treatment within 12 hours of symptoms has significant clinical benefit. Direct from whole blood testing has the potential to eliminate the need for culture, speeding diagnosis to under 12 hours, thus potentially improving patient morbidity and mortality.
Diagnostic Cartridges. Our patent-pending diagnostic cartridges are self-contained devices specifically configured for a given diagnostic assay. The diagnostic cartridge is injection molded and includes features such as reaction chambers, a waste chamber, and channels to direct the movement of fluids. The diagnostic cartridge also contains a coated silicon detection chip consisting of an array of up to 64 DNA probes, including controls. Integrated into the diagnostic cartridge are lance devices for the reagent blister packs and stirring devices. Reaction chambers and fluid channels are covered with a clear thermoplastic to form liquid-tight features. All of the reagents necessary to perform the assay are stored within blister packs affixed to the cartridge, other than the target amplification reagents, which are stored as a freeze-dried pellet. The diagnostic cartridge utilizes patent-pending methods for controlling the flow of fluid and managing air to prevent bubbles. The diagnostic cartridge also contains bar coded information related to the test, including the cartridge lot number and expiration date.
Analyzer. The analyzer is an on-demand system controlled by an external touch screen or laptop. Each analyzer contains a module into which individual diagnostic cartridges are placed. Once a diagnostic cartridge has been loaded with a clinical specimen, the cartridge is inserted into the analyzer. The cartridge is then advanced onto a platform allowing access from above and below. The analyzer has three main sub-platforms to execute the diagnostic test: reagent flow control, thermal control, and the optical imaging platforms. To control reagent flow and delivery, valve actuators, which control fluid movements, and lance actuators, which lance blister packs, are located below the cartridge. Motors for mixing reactions and stepper motors, which serve to flatten blister packs and drive fluid into reagent channels, are located above the cartridge. Optical sensors located adjacent to the fluidic paths in the cartridge are used to determine fluidic movements. Compression valves are used to isolate regions of the cartridge for individual steps of the diagnostic assay. Multiple resistive heaters with thermocouple feedback are used to control temperature for each of the steps of the process. Once the test is complete a digital camera captures the resulting visible features. Processing and filtering techniques and multiple custom algorithms are used to determine test results, which are displayed on the touch screen or printed automatically.
The touch screen controls each analyzer, provides power and analyzes and stores data. Technicians can load patient identification numbers and reagent lot codes by using the included bar code scanner or the touch screen.
Advantages of Our Technology
Low Cost Design. Our technology was designed with material and assembly costs in mind. Injection molded parts and filled blister packs can be produced in high volumes at low cost. Production of the coated silicon chip leverages well-established semi-conductor processes and capital equipment that have been optimized for low cost, high volume manufacturing. Isothermal target amplification requires only an inexpensive heater with no
9
Table of Contents
need to actively manage heat with coolers and fans. The use of a result that is visible to the naked eye allows for the use of a low cost digital camera to capture results. Our highly efficient proprietary DNA probe chemistry allows for low cost assay production. The electromechanical design of our analyzer, with limited moving parts and no active mechanism such as pumps, keeps component part costs low.
Easy to Perform On-demand Testing. Our technology is a sample-to-result approach. The customer simply loads a liquid clinical specimen into the diagnostic cartridge, closes it, inserts it into the analyzer and enters patient information to initiate each assay. The results are automatically generated with no user interpretation or intervention required. Hands-on time is less than 10 minutes for our C. diff test and we expect hands-on time to be generally less than 5 minutes for assays under development. Additionally, on-demand testing allows the technician to test samples as they come into the laboratory instead of waiting until there are sufficient numbers to warrant using a batch technique. Finally, the presence of comprehensive built-in controls means that the technician is not required to test external control samples to assure the quality of assay results. This allows laboratories to be more efficient with limited resources.
High Performance Assay Results. Our technology is capable of highly specific and sensitive detection of nucleic acids. For target DNA from multiple pathogen types, we can routinely detect fewer than three organisms using our bpHDA target amplification approach and have detected the identity of as few as 100 organisms using our AMPED signal amplification approach. Because the speed of bpHDA is only limited by the speed of the enzymes, we have demonstrated the ability to detect target DNA in less than 20 minutes of amplification time.
High Content Panels. Each of the 64 capture probes in our cartridge act independently to produce highly specific and sensitive detection for a given DNA target. The chip is optimized so that changes as small as a single base in DNA target sequence can be readily detected, allowing for detection of clinically meaningful mutations in DNA target samples. Our bpHDA technology is highly specific, allowing for simultaneous amplification of multiple DNA targets. The AMPED approach can be used to directly detect clinical specimens, thereby eliminating typical limitations of multiplexing. We expect the combination of highly multiplexed amplification and detection will allow for information-rich, multi-target panel results that allow clinicians to both rule-out and rule-in causes of disease. We believe this approach will lower testing costs and speed up the time to appropriate patient treatment, improving patient outcomes.
Rapid, Low Cost Development of New Assays. Early diagnostic test prototypes can be developed using standard 96 well plates capable of processing 96 samples in a single experiment, rather than processing individual samples in the analyzer. This allows for rapid early development and optimization of assays before transferring the design to the instrumented platform. Additionally, well-established software tools allow for rapid design and development of DNA probes and primers. The flexibility of the cartridge design allows for utilization of an efficient, low-cost approach for sample processing.
License Agreements
BioHelix. We hold non-exclusive licenses to key technologies from BioHelix related to isothermal amplification of nucleic acid targets, utilizing helicase-dependent amplification, or HDA. The term of this license agreement extends until the expiration of all the patents associated with the licensed patent rights, or until such time as we elect to terminate with 30 days’ notice. This license is limited to the fields of human diagnostic testing utilizing our solid chip surface detection and contains diligence and U.S. preference provisions. To date, these technologies have resulted in three issued U.S. patents, one issued European patent and one pending international patent family. In addition, these technologies may include related technologies that BioHelix may develop in the future. The BioHelix technologies are the basis of our nucleic acid amplification approach. In May of 2013, Quidel Corporation, a competitor of ours, purchased BioHelix. We pay a royalty fee for the licensing of this technology based on a percentage of our “Net Sales” of assays using these technologies (as defined in the license agreement).
IDT. In August 2010, we entered into a license agreement with Integrated DNA Technologies, or IDT, related to the use of blocked primers in combination with HDA. The term of this license agreement extends until the
10
Table of Contents
expiration of all the patents associated with the licensed patent rights, or until such time as we elect to terminate with 90 days’ notice. The license is exclusive to the fields of amplification utilizing HDA and detection of diagnostic targets in human in-vitro diagnostic testing, but is non-exclusive to all oncology and human papilloma virus targets or markers. These technologies have resulted in four pending U.S. patent applications and one issued European patent. We pay a royalty fee for the license of this technology based on a percentage of our “Net Sales” of products using these technologies (as defined in the license agreement).
Pursuant to the terms of these license agreements, we pay royalty fees in the aggregate equal to 14% of our worldwide “Net Sales” of those products that use these technologies (as defined and adjusted pursuant to the terms of the applicable license agreements).
Market Opportunity
We believe the global market for molecular diagnostic testing is approximately $5.0 billion per year and will experience a growth rate of approximately 12% per year over the course of the next several years based on research published by outside market research firms. We believe our proprietary sample-to-result platform is best suited to address a subset of this market, including hospital-acquired infections and other infectious diseases.
We believe that the total domestic market opportunity for the types of molecular diagnostic assays that we have currently available or are developing is approximately $1.3 to $1.6 billion, comprised of the following:
| • | C. diff. According to the Agency for Healthcare Research and Quality, there are 347,000 cases of C. diff annually in the United States. We estimate the potential total market opportunity for C. diff testing to be approximately $110 million to $120 million annually; |
| • | Group B Strep. According to the CDC, there were 3.95 million live births in the United States in 2012 and nearly every pregnant woman in the United States is tested for Group B Strep in the late third trimester. Based on these assumptions, we estimate the potential total market for Group B Strep testing is approximately $80 million to $120 million annually; |
| • | Staphylococcus Blood Infection Panel. According to a market survey, there are 4.2 million positive blood cultures each year in the United States. We believe that a significant portion of these positive blood cultures represent the market opportunity for a Staphylococcus species panel, and have estimated the market to be approximately $100-$150 million annually; |
| • | Shiga Toxin Producing E. Coli. According to the Agency for Healthcare Research and Quality, there were nearly five million U.S. Hospital visits in 2010 for gastrointestinal distress that suggested food-borne illness and each of these patients could potentially be tested for STEC. Based on these assumptions, we believe that the total market for gastrointestinal infection testing for STEC is approximately $100 to $150 million; |
| • | Staphylococcus Aureus Pre-Surgical Screening. According to the CDC there were 51.4 million in-patient surgeries in the United States in 2010. These surgeries represent the primary market for our SA Pre-Surgical Nasal Screen test, as every surgical patient could potentially be tested. Based on these assumptions, we believe the potential market for SA screening in the pre-surgical setting to be approximately $800 million to $900 million annually. |
| • | Food Borne Pathogens Panel. According to the Agency for Healthcare Research and Quality, there were nearly five million U.S. hospital visits in 2010 for gastrointestinal distress that suggested food-borne illness and each of these patients could potentially be tested for food borne pathogens. Based on these assumptions, we believe that the total market for gastrointestinal infection testing is approximately $150 million to $200 million. |
11
Table of Contents
We anticipate that the market for the molecular diagnostic assays on which we are focused will increase by more than 20% per year over the next several years. Many factors are driving growth of this market, particularly the accelerating adoption of molecular testing inside the hospital micro-biology lab. Based on published research we believe that fewer than half of all hospitals are currently using molecular testing for their infectious disease testing. More importantly, we believe that a far smaller fraction of all testing done in hospital labs is molecular. We believe that as molecular testing becomes more cost effective, its advantages of faster time to result and higher sensitivity relative to legacy testing methods will lead more and more hospitals to convert to molecular testing.
Our diagnostic tests are currently sold in the United States, Europe and New Zealand. We currently utilize a direct sales and support team in the United States and in certain key European countries and New Zealand utilize distributors, which we expect will be augmented by marketing partners and distributors in other strategic areas as we expand internationally.
According to the US Center for Disease Control, in 2011 there were approximately 5,700 hospitals in the United States in 2012, approximately 4,900 of which are under 400 beds and which we refer to as small to medium sized hospitals. According to outside research, fewer than half of those smaller hospitals have made the switch to molecular methods for diagnosing infectious disease. We believe these hospitals are excellent candidates for our molecular diagnostic systems. Based on our competitors’ public statements and published independent reports, we believe that 20% of small-to-medium sized hospitals have a sample to result molecular system. Our easy-to-use and cost-effective platform allows these hospitals—many of which could not previously afford more expensive or complex molecular diagnostic testing platforms—to modernize their laboratory testing and provide better patient care at an affordable cost.
Since our initial public offering we have used a portion of the proceeds to build analyzers and reinitiate our sales effort. As of January 31, 2015 we have 50 sites in evaluation or scheduled to begin an evaluation in the first quarter of 2015. During the evaluation period, potential customers utilize our platform alongside their current testing method (molecular or non-molecular) and at the end of the evaluation period determine if they are interested in switching to our platform, as evidenced by the purchase of our assays on a recurring basis, or by remaining with their current testing method. Our recent customer and evaluation history is as follows:
| U.S. Customers | Active Evaluations (1) |
Scheduled Evaluation |
||||||||||
| September 2014 |
80 | 4 | 1 | |||||||||
| October 2014 |
80 | 3 | 11 | |||||||||
| November 2014 |
81 | 8 | 17 | |||||||||
| December 2014 |
84 | 15 | 28 | |||||||||
| January 2015 |
90 | 16 | 34 | |||||||||
| (1) | In process during the month |
Research and Development
As of December 31, 2014, we had 20 employees focused on research and development. Our research and development expenditures were approximately $4.6 million, and $3.3 million for the twelve months ended December 31, 2014 and 2013, respectively. The increase in research and development expenses from 2013 to 2014 was primarily due to our focus on growing our diagnostic assay pipeline and the initiation of two clinical trials during the 2nd half of 2014. In the future we expect our research and development expenses to continue to increase as we allocate additional resources to developing and obtaining regulatory approval for assays under development. We will also allocate research and development resources to improve our product reliability and enhance our diagnostic cartridge manufacturing process.
12
Table of Contents
We believe our system is versatile and efficient to develop new assays. We therefore believe that we can achieve a rich menu of FDA cleared assays. In addition to the one assay we have cleared, the one assay under review with the FDA or the five assays in late stage development, we believe we will increase our assay menu in 2016 to 14 assays, in 2017 to 23 assays and by 2018 to 34 assays. Our product offerings will include low-plex tests, multi-plex panels and direct from whole blood tests or panels.
Our molecular assay for Group B Strep is a class II device requiring a 510(k) clearance. The molecular test detects Group B Strep from rectal/vaginal swabs obtained from pregnant women and incubated overnight in culture medium. The study was performed at three U.S. hospital laboratories: Indiana University School of Medicine; Medical College of Wisconsin; and Tricore Laboratories. Each site tested approximately 250 growth positive LIM broths (750-800 total samples). Each tested sample was compared to a Gold standard culture-based method. The study was completed and the 510(K) application was filed in the fourth quarter of 2014 and is currently under review by the FDA.
We anticipate that our molecular panel for Staphylococcus blood infections, Staph ID/R, will be a class II device requiring a 510(k) clearance. To support the submission we are running a multi-center study at three U.S. hospital laboratories, Tricore Laboratories, Indiana University Health, and Primary Children’s Medical Center, Salt Lake City. Each site will test approximately 250 blood cultures (750 to 800 total samples). Each sample will be compared to two culture reference methods as required by the FDA, an automated biochemical method for species identification and cefoxitin disk diffusion for mecA gene detection. The study will take approximately four to eight weeks at each site. The study design was reviewed by the FDA in their pre-Submission process.
We anticipate that our molecular assay for Shiga toxin-producing E. coli, STEC, will be a class II device requiring a 510(k) clearance. To support the submission we are running a multi-center study at three U.S. hospital laboratories, Tricore Laboratories, Medical College of Wisconsin, and Primary Children’s Medical Center, Salt Lake City. Each site will test approximately 350 samples (900 to 1100 total samples). Each sample will be compared to three different reference methods, an FDA approved broth/EIA test to detect Shiga toxin, a validated DNA sequencing method also to detect Shiga toxin, and a plate culture/latex agglutination test to detect serotype O157. The study will take approximately four to eight weeks at each site. The study design was reviewed by the FDA in their pre-Submission process.
Manufacturing
We manufacture our proprietary diagnostic cartridges and analyzers at our headquarters in Salt Lake City, Utah. We currently hand-build our diagnostic cartridges and purchase materials at higher per unit cost due to lower purchase volumes. We believe that investment in automation of portions of the manufacturing and assembly process and volume purchase pricing will significantly improve our gross margins and enhance our ability to provide a low cost solution to customers. We perform reagent formulation, diagnostic cartridge manufacturing and packaging of final components and diagnostic cartridges in accordance with applicable guidelines for medical device manufacturing. We currently lease approximately 33,000 square feet of office and manufacturing space, which we believe will be adequate to meet our manufacturing needs for the foreseeable future. The lease expires in April 2015. We are currently in negotiations to extend the lease. We also rely on third party suppliers, including sole source suppliers in certain instances, for certain reagents used in our products and much of the disposable component molding for our test cartridges.
We have implemented a quality management platform designed to comply with FDA regulations and ISO standards governing diagnostic medical device products. These regulations carefully control the design, manufacture, testing and release of diagnostic testing products, as well as raw material receipt and control. We also have controlled methods for the consistent manufacturing of our proprietary diagnostic cartridge, and analyzers at our facility.
13
Table of Contents
Sales and Marketing
Our current sales and marketing strategy is to expand the installed base and utilization of our platform and diagnostic assays. Our C. diff test is sold in the United States through a five person direct sales force and a technical specialist service organization of four, which is supported by a centralized team of marketing, customer support, and technical support personnel.
Our sales representatives typically have experience in molecular diagnostic testing and a network of hospital contacts within their respective territories. We utilize our representatives’ knowledge along with market research databases to target and qualify our customers. We execute a variety of sales campaigns and strategies to meet the buying criteria of the different customer segments we serve. To support our expanding molecular assay menu and the anticipated growth in our customer base, we continue to make investments in these customer facing organizations.
We believe our system competes largely on the basis of ease of use and low-cost. These and other advantages conferred by our technology are enabling us to provide superior molecular solutions at a price our customers can afford. We have been successful at obtaining customers that previously were not using a molecular method or using a competitive product that did not have the combination of low-cost and ease of use. In the United States, our sales cycle typically includes customer evaluations, a decision to use our platform and then validations of our platform and the C. diff test. Upon successful validation the evaluating entity becomes a customer. The analyzer is provided to the customer for their use with our assay but we retain ownership and control of the analyzer; we refer to our relationship with our customers as a vending machine model (or modified razor / razor blade). The customer buys our proprietary diagnostic cartridge from us and utilizes one disposable test cartridge each time they run an assay. Our revenues from U.S. customers is derived solely from the sales of assays.
We offer our C. diff test and our platform for sale in the European Union and New Zealand through a network of distributors. Unlike the U.S. market, we sell the platform and assay to the distributor, who then sells them directly to the customer.
Customers
In the twelve month period that ended on December 31, 2014 one customer, Vista Clinical Lab, represented 10.9% of our total revenue. In 2013, two customers, Baptist Health Louisville and Vista Clinical Lab, represented 10.4% and 13.4% respectively. In 2012, three customers, Baptist Health Louisville, University of Louisville Hospital and Pro-Lab Diagnostic, accounted for approximately 57.7% of our total revenue. No other customers accounted for more than 10% of our total revenue during these periods.
We define customers in terms of the number of customer sites actively reporting results using our platform. As of January 31, 2015 we had 112 customers worldwide (90 in the United States and 22 in the rest of the world). This compares to 88 customers worldwide (68 in the United States and 20 in the rest of the world) as of December 31, 2013 and 14 customers (three in the United States and 11 in the rest of the world) as of December 31, 2012. Our U.S. customers represented approximately 97% of our total revenue in 2014 and approximately 97% in 2013. We do not enter into sales agreements with our U.S. customers and sell our products using purchase orders. We enter into distribution agreements with distribution partners for sales outside the U.S.
Competition
We primarily face competition in the molecular diagnostic testing markets with testing products and platforms developed by public and private companies such as Cepheid, Meridian Bioscience, Inc., Nanosphere, Inc., Qiagen NV, Roche Diagnostics, Quidel Corporation, bioMerieux (which recently acquired Biofire Diagnostics, Inc.), T2 Biosystems, Becton, Dickinson and Company, GenMark Diagnostics, Inc., Hologic and others. We believe that our platform competes largely on the basis of its broad menu potential, ease-of-use leading to enhanced laboratory workflow, and return on investment for customers. If we are able to add more assays to our menu we believe that we will offer our customers a superior suite of products that will also create competitive advantage.
14
Table of Contents
Many of our competitors have substantially greater financial, technical, research and other resources and larger, more established marketing, sales and distribution organizations than we do. Many of our competitors also offer broader product lines and have greater brand recognition than we do. Moreover, our existing and new competitors may make rapid technological developments that may result in our technologies and products becoming obsolete before we recover the expenses incurred to develop them or before they generate significant revenue.
Intellectual Property, Proprietary Technology
We integrate capabilities in platform design, development, production and DNA amplification technologies, along with design, development and manufacture of primers, probes, dyes, quenchers and other individual reagent components. We have and are continuing to develop our own proprietary intellectual property along with licensing specific third-party technologies.
We have an issued patent covering bpHDA, which is used in our C. diff test. bpHDA, or Blocked Primer Helicase Dependent Amplification, is our patented technology creating “target-dependent hot start” functionality in HDA amplification reactions. bpHDA utilizes a blocked primer technology such that amplification is not activated until the target analyte of interest is bound to the blocked primer at an elevated temperature used for HDA amplification, wherein the block is removed by a highly specific enzyme, allowing for amplification to proceed. We believe this approach significantly improves assay speed and limits of sensitivity such that single cells present in clinical specimens may be amplified to detectable levels in as few as 17 minutes. Multiplex product development is also simplified, allowing for more complex assays in a single reaction with up to four unique primer sets demonstrated to work as of December 31, 2014.
(BP)-HDA: Great Basin Proprietary Hot Start Amplification Technology
We also have an issued patent for our amplification method in the presence of the coated silicon chip, a method which we intend to use in each of our assays. We also have an issued patent for the AMPED signal amplification method, which we intend to utilize in assays currently under development. The issued patents described above were issued in the United States and each expires in 2029. Our issued patents are pending in Europe and Canada as well. All current maintenance fees payable regarding these issued patents have been paid.
Our competitive success will be affected in part by our continued ability to obtain and maintain patent protection for our inventions, technologies and discoveries, including intellectual property that includes technologies that
15
Table of Contents
we license. We have patents covering technologies of our own and have licensed technologies from others. Our pending patent applications may lack priority over applications submitted by third parties or may not result in the issuance of patents. Even if issued, our patents may not be sufficiently broad to provide protection against competitors with similar technologies and may be challenged, invalidated or circumvented.
In addition to patents, we rely on a combination of trade secrets, copyright and trademark laws, nondisclosure agreements, licenses and other contractual provisions and technical measures to maintain and develop our competitive position with respect to intellectual property. Nevertheless, these measures may not be adequate to safeguard the technology underlying our products. For example, employees, consultants and others who participate in the development of our products may breach their agreements with us regarding our intellectual property, and we may not have adequate remedies for the breach. We also may not be able to effectively protect our intellectual property rights in some foreign countries, as many countries do not offer the same level of legal protection for intellectual property as the United States. Furthermore, for a variety of reasons, we may decide not to file for patent, copyright or trademark protection outside of the United States. Our trade secrets could become known through other unforeseen means. Notwithstanding our efforts to protect our intellectual property, our competitors may independently develop similar or alternative technologies or products that are equal or superior to our technology. Our competitors may also develop similar products without infringing on any of our intellectual property rights or design around our proprietary technologies. Furthermore, any efforts to enforce our proprietary rights could result in disputes and legal proceedings that could be costly and divert attention from our business. We could also be subject to third-party claims that we require additional licenses for our products, and such claims could interfere with our business. If our products infringe the intellectual property rights of others, we could face costly litigation, which could cause us to pay substantial damages and limit our ability to sell some or all of our products. Even if our products were determined not to infringe the intellectual property rights of others, we could incur substantial costs in defending any such claims.
We hold non-exclusive licenses to key technologies from BioHelix related to isothermal amplification of nucleic acid targets, utilizing helicase-dependent amplification, or HDA. This license is limited to the fields of human diagnostic testing utilizing our solid chip surface detection and contains diligence and U.S. preference provisions. To date, these technologies have resulted in three issued U.S. patents, one issued European patent and one pending international patent family. Additionally, these technologies may include related technologies that BioHelix may develop in the future. The BioHelix technologies are the basis of our DNA amplification approach. In August 2010, we entered into a license agreement with Integrated DNA Technologies, or IDT, related to the use of blocked primers. The license is exclusive to the fields of amplification utilizing HDA and detection of diagnostic targets in human in-vitro diagnostics, but is non-exclusive to all oncology and human papilloma virus targets or markers. These technologies have resulted in three pending U.S. patent applications and one issued European patent.
Government Regulation
The design, development, manufacture, testing and sale of our molecular diagnostic assays are subject to regulation by numerous governmental authorities, principally the FDA, and corresponding state and foreign regulatory agencies.
Regulation by the FDA
In the United States, the Federal Food, Drug, and Cosmetic Act, FDA regulations and other federal and state statutes and regulations govern, among other things, medical device design and development, preclinical and clinical testing, premarket clearance or approval, registration and listing, manufacturing, labeling, storage, advertising and promotion, sales and distribution, export and import, and post-market surveillance. The FDA regulates the design, manufacturing, servicing, sale and distribution of medical devices, including molecular diagnostic test kits and instrumentation platforms. Failure to comply with applicable U.S. requirements may
16
Table of Contents
subject a company to a variety of administrative or judicial sanctions, such as FDA refusal to approve pending applications, warning letters, product recalls, product seizures, total or partial suspension of production or distribution, injunctions, fines, civil penalties and criminal prosecution.
Unless an exemption applies, each medical device we wish to distribute commercially in the United States will require marketing authorization from the FDA prior to distribution. The two primary types of FDA marketing authorization required applicable to a device are premarket notification, also called 510(k) clearance, and premarket approval, also called PMA. The type of marketing authorization required is generally linked to the classification of the device. The FDA classifies medical devices into one of three classes (Class I, II or III) based on the degree of risk the FDA determines to be associated with a device and the level of regulatory control deemed necessary to ensure the device’s safety and effectiveness. Devices requiring fewer controls because they are deemed to pose lower risk are placed in Class I. Class I devices are deemed to pose the least risk and are subject only to general controls applicable to all devices, such as requirements for device labeling and adherence to the FDA’s current Good Manufacturing Practices and Quality Platform Requirements, as reflected in its QSR. Class II devices are intermediate risk devices that are subject to general controls and may also be subject to special controls such as performance standards, product-specific guidance documents, special labeling requirements, patient registries or post-market surveillance. Class III devices are high risk devices for which insufficient information exists to assure safety and effectiveness solely through general or special controls. Class III devices include life-sustaining, life-supporting or implantable devices, devices of substantial importance in preventing impairment of human health, or which present a potential, unreasonable risk of illness or injury.
Most Class I devices and some Class II devices are exempted by regulation from FDA’s premarket review requirement and can be commercialized without prior authorization from the FDA. Some Class I devices that have not been so exempted and most Class II devices are eligible for marketing through the 510(k) clearance process. By contrast, devices placed in Class III generally require PMA or 510(k) de novo clearance prior to commercial marketing. We anticipate that our molecular assays for Staphylococcus blood infections, Shiga toxin producing E. coli, Staph ID/R, and Group B Strep will each be a Class II device requiring a 510(k) clearance.
510(k) Clearance
To obtain 510(k) clearance for a medical device, an applicant must submit a premarket notification to the FDA demonstrating that the device is “substantially equivalent” to a device legally marketed in the United States that is not subject to PMA, commonly known as the “predicate device.” A device is substantially equivalent if, with respect to the predicate device, it has the same intended use and has either (i) the same technological characteristics or (ii) different technological characteristics and the information submitted demonstrates that the device is as safe and effective as a legally marketed device and does not raise different questions of safety or effectiveness. Demonstration of substantial equivalence may require clinical data. Although completion of the 510(k) review process is targeted for 90 days, these reviews typically take longer (e.g., up to 12 months or more) due to stoppage of the FDA review clock to address requests for additional information. Payment of a user fee is required for the FDA to initiate review of a 510(k) submission.
After a device has received 510(k) clearance for a specific intended use, any change or modification that significantly affects its safety or effectiveness, such as a significant change in the design, materials, method of manufacture or intended use, may require a new 510(k) clearance or PMA. The determination as to whether or not a modification could significantly affect the device’s safety or effectiveness is initially left to the manufacturer using available FDA guidance; however, the FDA may review this determination to evaluate the regulatory status of the modified product at any time and may require the manufacturer to cease marketing and recall the modified device until 510(k) clearance or PMA is obtained. The manufacturer may also be subject to significant regulatory fines or penalties.
Before submitting a medical device for 510(k) clearance, a series of studies (e.g., method comparison, precision, reproducibility, interference and stability studies) must be conducted to characterize the performance of the test.
17
Table of Contents
In addition, clinical studies may be required to validate these performance characteristics in a clinical setting as well as to ensure that the intended users can perform the test successfully.
Although clinical investigations of most devices are subject to the investigational device exemption, or IDE, requirements, clinical investigations of molecular diagnostic tests, including our assays and assays under development, are generally exempt from the IDE requirements. Thus, clinical investigations by intended users for intended uses of our assays generally do not require the FDA’s prior approval, provided the clinical evaluation testing is non-invasive, does not require an invasive sampling procedure that presents a significant risk, does not intentionally introduce energy into the subject and is not used as a diagnostic procedure without confirmation by another medically established test or procedure. In addition, products must be appropriately labeled per FDA regulations to reflect the intended use of the product (e.g., for research use only or for investigational use only) and distribution controls must be established to assure that such products are distributed for those specified purposes.
PMA Applications
PMA applications must be supported by valid scientific evidence, which typically requires extensive performance data, including technical, preclinical, clinical and stability data, to demonstrate the safety and effectiveness of the device. A PMA application must also include a complete description of the device and its components, a detailed description of the methods, facilities and controls used to manufacture the device, and the proposed labeling. Payment of a user fee is required for FDA to initiate review of a PMA application.
During the PMA application review period, the FDA may request additional information or clarification of information provided in the application. In addition, the FDA will conduct a pre-approval inspection of the manufacturing facility or facilities to ensure compliance with the QSR, which requires manufacturers to follow design, testing, control, documentation and other quality assurance procedures.
Although FDA review of an initial PMA application is required by statute to take between six to ten months, these reviews typically take longer (e.g., up to 2 years) due to stoppage of the FDA review clock to address requests for additional information. The FDA can delay, limit or deny approval of a PMA application for many reasons, including:
| • | if it is not demonstrated that there is reasonable assurance that the device is safe or effective under the conditions of use prescribed, recommended or suggested in the proposed labeling; |
| • | if the data from preclinical studies and clinical trials may be insufficient to support approval; and |
| • | if the manufacturing process, methods, controls or facilities used for the manufacture, processing, packing or installation of the device do not meet applicable requirements. |
If the FDA evaluations of both the PMA application and the manufacturing facilities are favorable, the FDA will either issue an approval letter or an approvable letter, which may contain conditions that must be met in order to secure final approval of the PMA application. If the FDA’s evaluation of the PMA application or manufacturing facilities is not favorable, the FDA will deny approval of the application or issue a “not approvable” letter. A “not approvable” letter will outline the deficiencies in the application and, where practical, will identify what is necessary to make the application approvable. The FDA may also determine that additional studies (pre-clinical and/or clinical studies) are necessary, in which case the PMA may be delayed for several months or years while these studies are conducted and the subsequent amendment to the PMA application is submitted. Once granted, approval of the PMA application may be withdrawn by the FDA if compliance with post-approval requirements, conditions of approval or other regulatory standards are not maintained or problems are identified following initial marketing.
18
Table of Contents
Post-approval modifications to the manufacturing process, labeling, device specifications, materials or design of a Class III device may require approval of a PMA supplement. PMA supplements require submission of technical data to support implementation of the proposed change to the Class III device. Payment of a user fee is required for FDA to initiate review of a PMA supplement.
Regulation after FDA Clearance or Approval
Any devices we manufacture or distribute pursuant to clearance or approval by the FDA are subject to comprehensive and continuing regulation by the FDA and certain state agencies. We are required to adhere to applicable regulations setting forth detailed GMP requirements, as set forth in the QSR, which includes testing, control and documentation requirements. Non-compliance with these standards can result in fines, injunctions, civil penalties, recalls or seizures of products, total or partial suspension of production, refusal of the government to grant 510(k) clearance or PMA of devices, withdrawal of marketing approvals and criminal prosecutions. We have designed and implemented quality platform processes within our manufacturing facilities in order to comply with FDA’s GMP requirements.
Because we are a medical device manufacturer, we must also comply with the FDA’s medical device reporting requirements whenever there is evidence that reasonably suggests that one of our products may have caused or contributed to a death or serious injury. We must also report any incident in which our product has malfunctioned if that malfunction would likely cause or contribute to a death or serious injury if it were to recur.
Labeling, advertising, and promotional activities are subject to scrutiny by the FDA and, in certain circumstances, by the Federal Trade Commission. Medical devices approved or cleared by the FDA may not be promoted for unapproved or uncleared uses, otherwise known as “off-label” promotion. The FDA and other agencies actively enforce the laws and regulations prohibiting the promotion of off-label uses, and a company that is found to have improperly promoted off-label uses may be subject to significant liability, including substantial monetary penalties and criminal prosecution. We have implemented quality platform processes and advertising/promotional policies designed to comply with these requirements.
Our facilities are also subject to periodic inspection by the FDA and foreign regulatory agencies for among other things, conformance to the FDA’s Quality System Regulation and current Good Manufacturing Practice requirements, as well as applicable foreign or international standards. The results of these inspections can include inspectional observations, which are recorded on FDA Form 483, regarding potential violations of the Food, Drug and Cosmetic Act and related laws, warning letters, or other forms of enforcement. On February 27, 2013, the FDA issued a Form 483 after inspecting our manufacturing facility in Salt Lake City, Utah. The Form 483 included 17 observations of non-compliance with FDA’s requirements. These observations included the material finding of the FDA’s inspection which were noted in the Form 483 were that we did not have appropriate environmental testing to ensure that our contamination controls were adequate and our design history file was not complete. The FDA’s observations listed on a Form 483 do not constitute a final determination that we were in violation of any law or regulation and in response to the Form 483 we took corrective actions to address all 17 observations, including revising manufacturing and quality procedures, training personnel, and reconfiguring our existing manufacturing facilities, and informed the FDA that all observations had been resolved in a final update letter on February 7, 2014. We received a letter from the FDA, dated July 22, 2014 informing us that the inspection is closed. We do not anticipate the FDA to take further action or provide further notice with regard to this matter.
Environmental Regulations
We are also subject to numerous federal, state and local laws relating to such matters as safe working conditions, manufacturing practices, environmental protection, fire hazard control and disposal of hazardous or potentially hazardous substances. Some of these laws require us to obtain licenses or permits to conduct our operations. We have numerous policies and quality platform procedures in place to ensure compliance with these laws and to
19
Table of Contents
minimize the risk of occupational exposure to hazardous materials. We do not expect the operations of our products to produce significant quantities of hazardous or toxic waste or radiation that would require the use of extraordinary disposal practices. Although the costs to comply with these applicable laws and regulations have not been material, we cannot predict the impact on our business of new or amended laws or regulations or any changes in the way existing and future laws and regulations are interpreted or enforced, nor can we ensure we will be able to obtain or maintain any required licenses or permits.
Export Regulations
Medical devices that are legally marketed in the United States may be exported anywhere in the world without prior FDA notification or approval. Devices that have not been approved or cleared in the United States must follow the export provisions of the FDCA. Depending on which section of the FDCA we may export under, we may need to request an export permit letter or export certificate, or we may need to submit a simple notification. Export certificates may be requested by foreign customers or foreign governments to provide proof of the products’ status as regulated by the FDA. The export certificate is prepared by FDA and contains information about a product’s regulatory or marketing status in the United States.
Clinical Laboratory Improvement Amendments of 1988
The use of our assays is also affected by CLIA, and related federal and state regulations, which provide for regulation of laboratory testing. Any customers using our assays for clinical use in the United States will be regulated under CLIA, which establishes quality standards for all laboratory testing to ensure the accuracy, reliability and timeliness of patient test results regardless of where the test was performed. In particular, these regulations mandate that clinical laboratories must be certified by the federal government or a federally approved accreditation agency, or must be located in a state that has been deemed exempt from CLIA requirements because the state has in effect laws that provide for requirements equal to or more stringent than CLIA requirements. Moreover, these laboratories must meet quality assurance, quality control and personnel standards, and they must undergo proficiency testing and inspections. The CLIA standards applicable to clinical laboratories are based on the complexity of the method of testing performed by the laboratory, which range from “waived” to “moderate complexity” to “high complexity.” We expect our future assays to all be rated moderately complex or meet the CLIA waiver criteria for tests that are simple and are judged by the FDA to process a low risk for erroneous results.
Foreign Government Regulation
Although it is not a current focus we intend to market our products in European and other select international markets in the future. The regulatory pre-market requirements for molecular devices vary from country to country. Some countries impose product standards, packaging requirements, labeling requirements and import restrictions on devices. Each country has its own tariff regulations, duties and tax requirements. Failure to comply with applicable foreign regulatory requirements may subject us to fines, suspension or withdrawal of regulatory approvals, product recalls, seizure of products, operating restrictions and criminal prosecution. For products sold in the European Economic Area, we have self- declared a Declaration of Conformity under the relevant sections of the applicable European Community standards and other normative documents.
Fraud and Abuse Regulations
We are subject to numerous federal and state health care anti-fraud laws, including the federal anti-kickback statute and False Claims Act that are intended to reduce waste, fraud and abuse in the health care industry. These laws are broad and subject to evolving interpretations. They prohibit many arrangements and practices that are lawful in industries other than health care, including certain payments for consulting and other personal services, some discounting arrangements, the provision of gifts and business courtesies, the furnishing of free supplies and services, and waivers of payments. In addition, many states have enacted or are considering laws that limit arrangements between medical device manufacturers and physicians and other health care providers and require
20
Table of Contents
significant public disclosure concerning permitted arrangements. These laws are vigorously enforced against medical device manufacturers and have resulted in manufacturers paying significant fines and penalties and being subject to stringent corrective action plans and reporting obligations. We must—and do—operate our business within the requirements of these laws and, if we are ever accused of violating them, we could be forced to expend significant resources on investigation, remediation and monetary penalties.
Patient Protection and Affordable Care Act
Our operations are affected by the federal Patient Protection and Affordable Care Act of 2010, as modified by the Health Care and Education Reconciliation Act of 2010, which we refer to as the Health Care Act. The Health Care Act imposes a 2.3% excise tax on sales of medical devices by manufacturers. Taxable devices include any medical device defined in section 201(h) of the FDCA and intended for use by humans, with limited exclusions for devices purchased by the general public at retail for individual use. There is no exemption for small companies, and we began paying the tax in January 2013. The Health Care Act also requires manufacturers to report to the Department of Health and Human Services detailed information about financial arrangements with physicians and teaching hospitals. These reporting provisions preempt state laws that require reporting of the same information, but not those that require reports of different or additional information. Failure to comply subjects the manufacturer to significant civil monetary penalties.
Employees
As of December 31, 2014, we have 73 full-time employees located in Salt Lake City, Utah. We also contract for hire with approximately four outside consultants and contractors.
Available Information
We are required to file annual reports on Form 10-K, quarterly reports on Form 10-Q, current reports on Form 8-K and other information with the SEC. We are subject to the informational requirements of the Exchange Act and files or furnishes reports, proxy statements, and other information with the SEC. Copies of these materials, filed by us with the SEC, are available free of charge on our website at www.gbscience.com. These filings are available as soon as reasonably practicable after we electronically file such material with, or furnish it to, the SEC. You can also obtain copies of these materials by visiting the SEC’s Public Reference Room at 100 F Street, NE, Washington, D.C. 20549, by calling the SEC at 1-800-SEC-0330, or by accessing the SEC’s website at www.sec.gov. The information on, or that may be accessed through, these websites is not incorporated into this filing and should not be considered a part of this filing.
21
Table of Contents
An investment in our securities involves a high degree of risk. Before you invest in our securities, you should give careful consideration to the following risk factors, in addition to the other information included in this annual report, including our financial statements and related notes, before deciding whether to invest in our securities. The occurrence of any of the adverse developments described in the following risk factors could materially and adversely harm our business, financial condition, results of operations or prospects. In that case, the trading price of our common stock could decline, and you may lose all or part of your investment.
Risks Related to Our Business and Industry
We have a limited commercial history upon which to base our prospects, have not generated profits and do not expect to generate profits for the foreseeable future. We may never achieve or sustain profitability. We began operations in January 2005, and we have a limited operating history. We have not earned significant revenue to date and do not expect to earn significant revenue in the near future. We had a net loss of $21.7 million and $9.6 million in the twelve month period ending December 31, 2014 and the twelve month period ending December 31, 2013, respectively. Our accumulated deficit was $64.0 million and $42.3 million as of December 31, 2014 and December 31, 2013, respectively. Potential investors should be aware of the difficulties normally encountered by a new enterprise, many of which are beyond our control, including substantial risks and expenses in the course of developing new diagnostic tests, establishing or entering new markets, organizing operations and marketing procedures. The likelihood of our success must be considered in light of these risks, expenses, complications and delays, and the competitive environment in which we operate. There is, therefore, nothing at this time upon which to base an assumption that our business plan will prove successful, and we may not be able to generate significant revenue, raise additional capital or operate profitably. We will continue to encounter risks and difficulties frequently experienced by early commercial stage companies, including scaling up our infrastructure and headcount, and may encounter unforeseen expenses, difficulties or delays in connection with our growth. In addition, as a result of the start-up nature of our business, we can be expected to continue to sustain substantial operating expenses without generating sufficient revenues to cover expenditures. As discussed in Note 3 to the audited financial statements and elsewhere in this annual report on Form 10-K, our recurring operating losses from operations and our need for additional sources of capital to fund our ongoing operations raise substantial doubt about our ability to continue as a going concern. Any investment in our company is therefore highly speculative and could result in the loss of your entire investment.
We will need to raise additional capital, which may not be available on favorable terms, if at all, and which may cause dilution to stockholders, restrict our operations or adversely affect our ability to operate our business. As of December 31, 2014, our cash balance was $2.0 million and our working capital deficit was $0.3 million. At our current burn rate of approximately $1 million a month, we estimate that our existing capital resources will fund our operations for two months or through the end of February 2015. Accordingly, we will need to raise additional funds through public or private debt or equity financing or through other means in order to sustain our operations and current business strategy. We may be unable to obtain adequate financing on favorable terms, or at all, and any additional financings could result in additional dilution to our then existing stockholders or restrict our operations or adversely affect our ability to operate our business. If we are unable to obtain needed financing on acceptable terms, we may not be able to implement our business plan, which could have a material adverse effect on our business, financial condition and results of operations. We may not be able to meet our business objectives, our equity value may decrease and investors may lose some or all of their investment. If we raise funds by issuing equity securities, the percentage ownership of our then stockholders will be reduced. If we raise funds by issuing debt, the ability of our stockholders to receive earnings or distributions may be adversely affected and we may be subject to additional covenants and restrictions.
22
Table of Contents
Our near-term success is dependent upon our ability to expand our customer base. Our current customer base is composed of hospitals and testing laboratories that use our C. diff assay. Our success will depend, in part, upon our ability to expand our customer base. Attracting new customers requires substantial time and expense. Any failure to expand our existing customer base would adversely affect our operating results. Many factors could affect the market acceptance and commercial success of our diagnostic assays, including:
| • | our ability to convince our potential customers of the advantages and economic value of our analyzers and assays over competing technologies and diagnostic assays; |
| • | the breadth of our assay menu relative to competitors; |
| • | changes to policies, procedures or currently accepted best practices in clinical diagnostics; |
| • | the extent and success of our marketing and sales efforts; |
| • | our ability to manufacture analyzers for use by potential customers during the sales evaluation phase; and |
| • | our ability to manufacture our commercial diagnostic cartridges and meet demand in a timely fashion. |
If we cannot successfully develop, obtain regulatory approvals for and commercialize new diagnostic assays, our financial results will be harmed and our ability to compete will be harmed. Our financial performance depends in part upon our ability to successfully develop and market new assays in a rapidly changing technological and economic environment. If we fail to successfully introduce new assays, we could lose customers and market share. We could also lose market share if our competitors introduce new assays or technologies that render our assays less competitive or obsolete. In addition, delays in the introduction of new assays due to regulatory, developmental or other obstacles could negatively impact our revenue and market share, as well as our earnings. Factors that can influence our ability to introduce new assays, the timing associated with new product approvals and commercial success of these assays include:
| • | the scope of and progress made in our research and development activities; |
| • | our ability to successfully initiate and complete clinical trial studies; |
| • | timely expansion of our menu of assays; |
| • | the results of clinical trials needed to support any regulatory approvals of our assays; |
| • | our ability to obtain requisite FDA or other regulatory clearances or approvals for our assays under development on a timely basis; |
| • | demand for the new assays we introduce; |
| • | product offerings from our competitors; and |
| • | the functionality of new assays that address market requirements and customer demands. |
We are subject to many laws and governmental regulations and any adverse regulatory action may materially adversely affect our financial condition and business operations. Our C. diff assay and any assays that we develop and commercialize in the future are subject to regulation by numerous government agencies, including the FDA and comparable foreign agencies. To varying degrees, each of these agencies requires us to comply with laws and regulations governing the development, testing, manufacturing, labeling, marketing and distribution of our assays. In the clinical market, our assays are regulated by the FDA and comparable agencies of other countries. In particular, FDA regulations govern activities such as product development, product testing, product labeling, product storage, premarket clearance or approval, manufacturing, advertising, promotion, product sales, reporting of certain product failures and distribution. Our assays will require 510(k) clearance from the FDA prior to marketing. Clinical trials are required to support a 510(k) submission.
23
Table of Contents
We may be unable to obtain marketing clearance for our additional assays, including our Group B Strep Test for which a 510(K) application is currently under review by the FDA. If such approval is obtained, it may:
| • | take a significant amount of time; |
| • | require the expenditure of substantial resources; |
| • | involve stringent clinical and pre-clinical testing; |
| • | involve modifications, repairs, or replacements of our assays; and/or |
| • | result in limitations on the proposed uses of our assays. |
Our facilities are subject to periodic inspection by the FDA and foreign regulatory agencies, among other things, conformance to the FDA’s Quality System Regulation and current Good Manufacturing Practice requirements, as well as applicable foreign or international standards. The results of these inspections can include inspectional observations, which are recorded on FDA Form 483, regarding potential violations of the Food, Drug and Cosmetic Act and related laws, warning letters, restrictions on medical device sales or other forms of enforcement.
Since 2009, the FDA has significantly increased its oversight of companies subject to its regulations, including medical device companies, by hiring new investigators and stepping up inspections of manufacturing facilities. The FDA has recently also significantly increased the number of warning letters issued to companies. If the FDA were to conclude that we are not in compliance with applicable laws or regulations, or that any of our medical devices are ineffective or pose an unreasonable health risk, the FDA could ban such medical devices, detain or seize adulterated or misbranded medical devices, order a recall, repair, replacement, or refund of such devices, refuse to grant pending pre-market approval applications or require certificates of foreign governments for exports, and/or require us to notify health professionals and others that the devices present unreasonable risks of substantial harm to the public health. The FDA may also impose operating restrictions on a company-wide basis, enjoin and restrain certain violations of applicable law pertaining to medical devices and assess civil or criminal penalties against our officers, employees or us. The FDA may also recommend prosecution to the Department of Justice. Any adverse regulatory action, depending on its magnitude, may restrict us from effectively marketing and selling our diagnostic tests.
Foreign governmental regulations have become increasingly stringent and more common, and we may become subject to more rigorous regulation by foreign governmental authorities in the future. Penalties for a company’s non-compliance with foreign governmental regulation could be severe, including revocation or suspension of a company’s business license and criminal sanctions. Any domestic or foreign governmental law or regulation imposed in the future may have a material adverse effect on us.
On February 27, 2013, the FDA issued a Form-483 after inspecting our manufacturing facility in Salt Lake City, Utah. The Form-483 included 17 observations of non-compliance with FDA’s requirements. The FDA’s observations listed on a Form 483 do not constitute a final determination that we were in violation of any law or regulation and in response to the Form 483 we took corrective actions to address all 17 observations, including revising manufacturing and quality procedures, training personnel, and creating new manufacturing facilities, and informed the FDA that all observations had been resolved in a final update letter on February 7, 2014. We received a letter from the FDA, dated July 22, 2014 informing us that the inspection is closed. We do not anticipate the FDA to take further action or provide further notice with regard to this matter.
Our current and potential customers in the United States and elsewhere may also be subject, directly or indirectly, to applicable anti-kickback, fraud and abuse, false claims, transparency, health information privacy and security and other healthcare laws and regulations, which could expose us to criminal sanctions, civil penalties, contractual damages, reputational harm, administrative burdens and diminished profits and future earnings.
24
Table of Contents
The life sciences industry is highly competitive and subject to rapid technological change. If our competitors and potential competitors develop superior assays and technologies, our competitive position and results of operations would suffer. We face intense competition from a number of companies that offer assays in our target markets, many of which have substantially greater financial resources and larger, more established marketing, sales and service organizations than we do. The life sciences industry is characterized by rapid and continuous technological innovation. We may need to develop new technologies for our existing products and assays to be competitive. One or more of our current or future competitors could render our existing products or assays under development obsolete or uneconomical by technological advances. We may also encounter other problems in the process of delivering new assays to the marketplace, such as problems related to FDA clearance or regulations, design, development or manufacturing of such assays, and as a result we may be unsuccessful in selling such assays. Our future success depends on our ability to compete effectively against current technologies, as well as to respond effectively to technological advances by developing and marketing assays that are competitive in the continually changing technological landscape.
If our assays do not perform as expected or the reliability of the technology on which our assays are based is questioned, we could experience delayed or reduced market acceptance of our assays, increased costs and damage to our reputation. Our success depends on the market’s confidence that we can provide reliable, high-quality analyzers and diagnostic cartridges. We believe that customers in our target markets are likely to be particularly sensitive to product defects and errors. Our reputation and the public image of our assays or technologies may be impaired if our assays fail to perform as expected or our assays are perceived as difficult to use. Despite quality control testing, defects or errors could occur in our assays or technologies.
In the future, if our assays experience a material defect or error, this could result in loss or delay of revenues, delayed market acceptance, product recalls, damaged reputation, diversion of development resources, legal claims, increased insurance costs or increased service and warranty costs, any of which could harm our business. Such defects or errors could also prompt us to amend certain warning labels or narrow the scope of the use of our assays, either of which could hinder our success in the market. Even after any underlying concerns or problems are resolved, any widespread concerns regarding our technology or any manufacturing defects or performance errors in our assays could result in lost revenue, delayed market acceptance, damaged reputation, increased service and warranty costs and claims against us.
If our international distributor relationships are not successful, our ability to market and sell our assays will be harmed and our financial performance will be adversely affected. Outside of the United States, we depend on relationships with distributors for the marketing and sales of our assays in various geographic regions, and we have a limited ability to influence their efforts. Relying on distributors for our sales and marketing could harm our business for various reasons, including:
| • | agreements with distributors may terminate prematurely due to disagreements or may result in litigation between the partners; |
| • | our distributors may not devote sufficient resources to the sale of assays; |
| • | our distributors may be unsuccessful in marketing our assays; and |
| • | we may not be able to negotiate future distributor agreements on acceptable terms. |
If we become subject to claims relating to improper handling, storage or disposal of hazardous materials, we could incur significant cost and time to comply. Our research and development processes involve the controlled storage, use and disposal of hazardous materials, including biological hazardous materials. We are subject to foreign, federal, state and local regulations governing the use, manufacture, storage, handling and disposal of materials and waste products. We may incur significant costs complying with both existing and future environmental laws and regulations. In particular, we are subject to regulation by the Occupational Safety and Health Administration, or OSHA, and the Environmental Protection Agency, or EPA, and to regulation under the
25
Table of Contents
Toxic Substances Control Act and the Resource Conservation and Recovery Act in the United States. OSHA or the EPA may adopt additional regulations in the future that may affect our research and development programs. The risk of accidental contamination or injury from hazardous materials cannot be eliminated completely. In the event of an accident, we could be held liable for any damages that result, and any liability could exceed the limits or fall outside the coverage of our workers’ compensation insurance. We may not be able to maintain insurance on acceptable terms, if at all.
Our diagnostic cartridges have not been manufactured on a high volume scale and are subject to unforeseen scale-up risks. While we have developed a process to manufacture diagnostic test cartridges for our current volume of sales, there can be no assurance that we can manufacture our diagnostic test cartridges at a scale that is adequate for our future commercial needs. We may face significant or unforeseen difficulties in manufacturing our diagnostic cartridges, including but not limited to:
| • | technical issues relating to manufacturing components of our diagnostic cartridges on a high volume commercial scale at reasonable cost, and in a reasonable time frame; |
| • | difficulty meeting demand or timing requirements for orders due to excessive costs or lack of capacity for part or all of an operation or process; |
| • | lack of skilled labor or unexpected increases in labor costs needed to produce or maintain our analyzers or perform certain required operations; |
| • | changes in government regulations or in quality or other requirements that lead to additional manufacturing costs or an inability to supply product in a timely manner, if at all; and |
| • | increases in raw material or component supply cost or an inability to obtain supplies of certain critical supplies needed to complete our manufacturing processes. |
These and other difficulties may only become apparent when scaling up to the manufacturing process of our diagnostic cartridges to a more substantive commercial scale. In the event our diagnostic cartridges cannot be manufactured in sufficient commercial quantities or manufacturing is delayed, our future prospects could be significantly impacted and our financial prospects would be materially harmed.
We or our suppliers may experience development or manufacturing problems or delays that could limit the growth of our revenue or increase our losses. We may encounter unforeseen situations in the manufacturing of our diagnostic cartridges that could result in delays or shortfalls in our production. Our suppliers may also face similar delays or shortfalls. In addition, our or our suppliers’ production processes may have to change to accommodate any significant future expansion of our manufacturing capacity, which may increase our or our suppliers’ manufacturing costs, delay production of our diagnostic cartridges, reduce our product gross margin and adversely impact our business. If we are unable to satisfy demand for our diagnostic cartridges by successfully manufacturing and shipping our diagnostic cartridges in a timely manner, our revenue could be impaired, market acceptance for our assays could be adversely affected and our customers might instead purchase our competitors’ assays. In addition, developing manufacturing procedures for assays under development tests may require developing specific production processes for those assays. Developing such processes could be time consuming and any unexpected difficulty in doing so can delay the introduction of a product.
We expect to rely on third parties to conduct studies of our assays under development that will be required by the FDA or other regulatory authorities and those third parties may not perform satisfactorily. We do not have the ability to independently conduct the field trial studies or other studies that may be required to obtain FDA and other regulatory clearances or approvals for our assays. Accordingly, we expect to rely on third parties, such as independent testing laboratories and hospitals, to conduct such studies. Our reliance on these third parties will reduce our control over these activities. These third-party contractors may not complete activities on schedule or conduct studies in accordance with regulatory requirements or our study design. We cannot control whether they devote sufficient time, skill and resources to our studies. Our reliance on third parties that we do not control will
26
Table of Contents
not relieve us of any applicable requirement to prepare, and ensure compliance with, various procedures required under good clinical practices. If these third parties do not successfully carry out their contractual duties or regulatory obligations or meet expected deadlines, if the third parties need to be replaced or if the quality or accuracy of the data they obtain is compromised due to their failure to adhere to our clinical protocols or regulatory requirements or for other reasons, our studies may be extended, delayed, suspended or terminated, and we may not be able to obtain regulatory approval for additional diagnostic assays.
Product liability claims could adversely impact our financial condition and our earnings and impair our reputation. Our business exposes us to potential product liability risks that are inherent in the design, manufacture and marketing of medical devices. Device failures, manufacturing defects, design flaws, or inadequate disclosure of product-related risks or product-related information with respect to our assays could result in an unsafe condition, injury to, or death of, a patient. The occurrence of such a problem could result in product liability claims or a recall of, or safety alert relating to, one or more of our assays. Product liability claims or product recalls in the future, regardless of their ultimate outcome, could have a material adverse effect on our business and reputation and on our ability to attract and retain customers for our assays.
Health care policy changes, including U.S. health care reform legislation signed in 2010, may have a material adverse effect on us. In March 2010, the Patient Protection and Affordable Care Act and the Health Care and Education Affordability Reconciliation Act of 2010 were signed into law. The legislation imposes significant new taxes on medical device makers. This significant increase in the tax burden on our industry could have a material, negative impact on our results of operations and our cash flows. Other elements of this legislation, such as comparative effectiveness research, an independent payment advisory board, payment system reforms, including shared savings pilots, and other provisions, could meaningfully change the way health care is developed and delivered, and may materially impact numerous aspects of our business.
Consolidation in the health care industry could have an adverse effect on our revenues and results of operations. Many health care industry companies, including health care systems, are consolidating to create new companies with greater market power. As the health care industry consolidates, competition to provide goods and services to industry participants will become more intense. These industry participants may try to use their market power to negotiate price concessions or reductions for diagnostic tests. If we are forced to reduce our prices because of consolidation in the health care industry, our projected revenues would decrease and our earnings, financial condition, and/or cash flows would suffer.
Our ability to compete depends on our ability to attract and retain talented employees. Our future success depends on our ability to identify, attract, train, integrate and retain highly qualified technical, development, sales and marketing, managerial and administrative personnel. Competition for highly skilled individuals is extremely intense and we face difficulty identifying and hiring qualified personnel in many areas of our business. We may not be able to hire and retain such personnel at compensation levels consistent with our existing compensation and salary structure. Many of the companies with which we compete for hiring experienced employees have greater resources than we have. If we fail to identify, attract, train, integrate and retain highly qualified and motivated personnel, our reputation could suffer and our business, financial condition and results of operations could be adversely affected.
Our future success also depends on the continued service and performance of our senior management team. The replacement of members of our senior management team likely would involve significant time and costs, and the loss of any these individuals may delay or prevent the achievement of our business objectives.
Changes in tax laws or exposure to additional income tax liabilities could have a material impact on our financial condition and results of operations. We are subject to income taxes as well as non-income based taxes, in both the United States and various foreign jurisdictions. Changes in existing tax laws, treaties, regulations or policies or the interpretation or enforcement thereof, or the enactment or adoption of new tax laws, treaties, regulations or policies could materially impact our effective tax rate.
27
Table of Contents
If we do not achieve, sustain or successfully manage our anticipated growth, our business and prospects will be harmed. If we are unable to obtain or sustain adequate revenue growth, our financial results could suffer. Furthermore, significant growth will place strains on our management and our operational and financial systems and processes and our operating costs may escalate even faster than planned. If we cannot effectively manage our expanding operations and our costs, we may not be able to grow effectively or we may grow at a slower pace. Additionally, if we do not successfully forecast the timing of regulatory authorization for our additional tests, marketing and subsequent demand for our diagnostic tests or manage our anticipated expenses accordingly, our operating results will be harmed.
Our revenue, results of operations and cash flows may suffer upon the loss of a significant customer. We have one large customer that generates a significant amount of our revenue. Our largest customer accounted for 10.9% of our revenue for the twelve months ended December 31, 2014. The loss of any significant customer or a significant reduction in the amount of product ordered by any such customer would adversely affect our revenue, results of operations, and cash flows.
Other companies or institutions have commercial assays or may develop and market novel or improved methods for infectious disease diagnostics which may make our diagnostic platform less competitive or obsolete. The market for diagnostics is large and established, and our competitors may possess significantly greater financial resources and have larger development and commercialization capabilities than we do. We may be unable to compete effectively against these competitors either because their diagnostic platforms are superior or because they may have more expertise, experience, financial resources or stronger business relationships.
Demand for our assays depends in part on the operating budgets and hospital-acquired infection rates of our customers, a reduction in which could limit demand for our assays and adversely affect our business. In the near term, we expect that our revenue will be derived primarily from sales of our C. diff assays to hospitals. The demand for our assays will depend in part upon the prevalence of C. diff at the hospitals of these customers and impacted by other factors beyond our control, such as:
| • | global macroeconomic conditions; |
| • | total bed days; |
| • | changes in the regulatory environment; |
| • | differences in budgetary cycles; |
| • | market-driven pressures to consolidate operations and reduce costs; and |
| • | market acceptance of new technologies. |
Our operating results may fluctuate due to reductions and delays in expenditures by our customers. Any decrease in our customers’ budgets or expenditures, or in the size, scope or frequency of operating expenditures, could materially and adversely affect our business, operating results and financial condition.
New technologies, techniques or assays could emerge that might offer better combinations of price and performance than our current C. diff assay or future assays and analyzers. It is critical to our success that we anticipate changes in technology and customer requirements and to successfully introduce, on a timely and cost-effective basis, new, enhanced and competitive technologies that meet the needs of current and prospective customers. If we do not successfully innovate and introduce new technology into our product lines or manage the transitions to new product offerings, our revenues, results of operations and business will be adversely impacted. Competitors may be able to respond more quickly and effectively than we can to new or changing opportunities, technologies, standards or customer requirements. We anticipate that we will face increased competition in the future as existing companies and competitors develop new or improved diagnostic tests and as new companies enter the market with new technologies.
28
Table of Contents
We are dependent on single source suppliers for some of the components and materials used in our assays, and supply chain interruptions could negatively impact our operations and financial performance. Our assays are manufactured by us and we obtain supplies from a limited number of suppliers. In some cases, critical components required to manufacture our assays may only be available from a sole supplier or limited number of suppliers, any of whom would be difficult to replace. The supply of any of our manufacturing materials may be interrupted because of poor vendor performance or other events outside our control, which may require us, among other things, to identify alternate vendors and result in lost sales and increased expenses. Even if the manufacturing materials that we source are available from other parties, the time and effort involved in validating the new supplies and obtaining any necessary regulatory approvals for substitutes could impede our ability to replace such components in a timely manner or at all.
Due to our fixed overhead costs and the depreciation of our analyzers at customer sites included in cost of sales and the costs associated with our current hand-build cartridge manufacturing process we have in the past experienced substantial negative gross margins. We will need to increase our sales volumes significantly and automate our cartridge manufacturing process in order to achieve profitability. We had negative gross margins of 146.9% and 187.4% during the twelve months ended December 31, 2014 and 2013, respectively. The components of our cost of sales include cost of materials, supplies, labor for manufacturing, equipment and facility expenses associated with manufacturing. Facility expenses include allocated overhead comprised of rent, equipment depreciation and utilities. Due to our fixed overhead costs we will continue to experience negative gross margins unless and until we are able to significantly increase our sales volume. In addition, we currently hand-build our diagnostic cartridges. We are working to automate portions of our manufacturing and assembly process, which we believe will reduce our cartridge manufacturing costs. However, there is no assurance that we will be successful in automating our manufacturing process, and our failure to do so will materially limit our ability to reduce our cost of sales in the future.
Risks Relating to Our Financial Position and Need for Additional Capital
We expect that we will need substantial additional funding to expand our commercialization efforts for our C. diff diagnostic test and other new diagnostic tests. Molecular diagnostic development, which includes research and development, pre-clinical and human clinical trials, is a time-consuming and expensive process that takes years to complete. We expect that our expenses will increase substantially as we move new assays through human clinical trials, seek regulatory approvals, and pursue development of additional innovations. If we obtain marketing approval for the diagnostic tests that we develop, license, or acquire, we expect to incur significant commercialization expenses related to regulatory compliance requirements, sales and marketing, manufacturing and distribution. Net loss for the twelve months ended December 31, 2014 and 2013 was approximately $21.7 million and $9.6 million, respectively. As of December 31, 2014, we had an accumulated deficit of $64.0 million. As discussed in Note 3 to the audited financial statements and elsewhere in this annual report on Form 10-K, our recurring operating losses from operations and our need for additional sources of capital to fund our ongoing operations raise substantial doubt about our ability to continue as a going concern. We expect to continue to incur losses for the foreseeable future, and we anticipate these losses will increase as we continue our development and commercialization of our platform and seek regulatory approval for additional assays. Accordingly, our ability to continue as a going concern depends on our ability to obtain additional financing to fund our operations and there can be no assurance that additional financing will be available to us or that such financing, if available, will be available on favorable terms. Even if we achieve profitability in the future, we may not be able to sustain profitability in subsequent periods.
We expect that we will need additional funding to manufacturer analyzers to be used by potential customers during the sales evaluation phase. Our customers evaluate the performance of products through the use of analyzers that we manufacture and provide at no cost. Our ability to grow our customer base depends upon our ability to obtain additional financing to fund the manufacturing of analyzers to deliver to such potential customers.
29
Table of Contents
Our inability to raise capital on acceptable terms in the future may cause us to delay, diminish, or curtail certain operational activities, including research and development activities, clinical trials, sales and marketing, and other operations, in order to reduce costs and sustain the business, and such inability would have a material adverse effect on our business and financial condition. We expect capital outlays and operating expenditures to increase over the next several years as we work to expand our commercial activities, expand our development activities, conduct clinical trials, expand manufacturing operations and expand our infrastructure. We may need to raise additional capital to, among other things:
| • | fund clinical trials and preclinical trials for our assays under development as requested or required by regulatory agencies; |
| • | sustain commercialization of our C. diff assays and other new assays under development; |
| • | expand and automate our manufacturing capabilities and reduce our cost of sales; |
| • | increase our sales and marketing efforts to drive market adoption and address competitive developments; |
| • | finance capital expenditures and our general and administrative expenses; |
| • | develop new assays; |
| • | maintain, expand and protect our intellectual property portfolio; |
| • | add operational, financial and management information systems; and |
| • | hire additional research and development, quality control, scientific, and general and administrative personnel. |
Our present and future funding requirements will depend on many factors, including but not limited to:
| • | the progress and timing of our clinical trials; |
| • | the level of research and development investment required to maintain and improve our technology position; |
| • | cost of filing, prosecuting, defending and enforcing patent claims and other intellectual property rights, if any; |
| • | our efforts to acquire or license complementary technologies or acquire complementary businesses; |
| • | changes in product development plans needed to address any difficulties in commercialization or changing market conditions; |
| • | competing technological and market developments; |
| • | changes in regulatory policies or laws that may affect our operations; and |
| • | changes in physician acceptance or medical society recommendations that may affect commercial efforts. |
We may not be able to continue to operate as a going concern. Our independent registered public accounting firm has included an explanatory paragraph relating to our ability to continue as a going concern in its report on our audited financial statements. We may be unable to continue to operate without the threat of liquidation for the foreseeable future.
Raising additional capital may cause dilution to our existing stockholders, and restrict our operations or require us to relinquish certain intellectual property rights. We may seek additional capital through a combination of public and private equity offerings, debt financings, strategic partnerships and alliances, licensing
30
Table of Contents
arrangements and grants. To the extent that we raise additional capital through the sale of equity or convertible debt securities, the ownership interest of our existing stockholders may be diluted, and the terms may include liquidation or other preferences that adversely affect the rights of our stockholders. Debt and receivables financings may be coupled with an equity component, such as warrants to purchase shares, which could also result in dilution of our existing stockholders’ ownership. The incurrence of indebtedness would result in increased fixed payment obligations and could also result in certain restrictive covenants, such as limitations on our ability to incur additional debt, limitations on our ability to acquire or license intellectual property rights and other operating restrictions that could adversely impact our ability to conduct our business. If we raise additional funds through strategic partnerships and alliances and licensing arrangements with third parties, we may have to relinquish valuable rights to our product candidates, or grant licenses on terms that are not favorable to us. A failure to obtain adequate funds may cause us to curtail certain operational activities, including research and development, regulatory trials, sales and marketing, and manufacturing operations, in order to reduce costs and sustain the business, and would have a material adverse effect on our business and financial condition.
Market and economic conditions may negatively impact our business, financial condition and share price. Concerns over inflation, energy costs, geopolitical issues, the U.S. mortgage market and a declining real estate market, unstable global credit markets and financial conditions, and volatile oil prices have led to periods of significant economic instability, diminished liquidity and credit availability, declines in consumer confidence and discretionary spending, diminished expectations for the global economy and expectations of slower global economic growth going forward, increased unemployment rates, and increased credit defaults in recent years. Our general business strategy may be adversely affected by any such economic downturns, volatile business environments and continued unstable or unpredictable economic and market conditions. If these conditions continue to deteriorate or do not improve, it may make any necessary debt or equity financing more difficult to complete, more costly, and more dilutive. Failure to secure any necessary financing in a timely manner and on favorable terms could have a material adverse effect on our growth strategy, financial performance, and share price and could require us to delay or abandon development or commercialization plans. In addition, there is a risk that one or more of our current and future service providers, manufacturers, suppliers, hospitals and other medical facilities, our third party payors, and other partners could be negatively affected by these difficult economic times, which could adversely affect our ability to attain our operating goals on schedule and on budget or meet our business and financial objectives.
Our ability to use our net operating loss carryforwards may be limited. As of December 31, 2014, we had federal income tax net operating loss, or NOL, carryforwards of approximately $51.8 million and state income tax NOL carryforwards of approximately $32.5 million. These NOL carryforwards, if not previously used, will begin to expire in 2023. We do not believe that we have experienced any previous shifts in our stock ownership within the meaning of Section 382 of the Internal Revenue Code of 1986, as amended, or the Code, that currently subject our NOL carryforwards to an annual limitation; however, future shifts in our stock ownership within the meaning of Section 382 of the Code may subject our NOL carryforwards to an annual limitation. As a result, if we earn net taxable income in the future, the limitations on our ability to use our NOL carryforwards to reduce U.S. federal and state tax liabilities could potentially result in increased future tax liability to us.
We have not performed an evaluation of our internal control over financial reporting. Internal control over financial reporting is a process designed to provide reasonable assurance regarding the reliability of financial reporting and the preparation of financial statements in accordance with U.S. GAAP. We have identified a material weakness in our internal control over financial reporting relating to the processes and controls to properly identify and account for transactions of a complex or non-routine nature. We are currently in the process of reviewing, documenting and testing our internal control over financial reporting. We have not performed an evaluation of our internal control over financial reporting, such as required by Section 404 of the Sarbanes-Oxley Act of 2002, or the Sarbanes-Oxley Act, nor have we engaged an independent registered public accounting firm to perform an audit of our internal control over financial reporting as of any balance sheet date or for any period reported in our financial statements.
31
Table of Contents
Risks Related to Intellectual Property
The extent to which we can protect our business and technologies through intellectual property rights that we own, acquire or license is uncertain. We employ a variety of proprietary and patented technologies and methods in connection with the assays we sell or are developing. We license some of these technologies from third parties. We cannot provide any assurance that the intellectual property rights that we own or license provide effective protection from competitive threats or that we would prevail in any litigation in which our intellectual property rights are challenged. In addition, we may not be successful in obtaining new proprietary or patented technologies or methods in the future, whether through acquiring ownership or through licenses from third parties.
Our currently pending or future patent applications may not result in issued patents, and we cannot predict how long it may take for a patent to issue on any of our pending patent applications, assuming a patent does issue. Other parties may challenge patents issued or exclusively licensed to us, or courts or administrative agencies will hold our patents or the patents we license on an exclusive basis to be valid and enforceable. We may not be successful in defending challenges made against our patents and other intellectual property rights. Any third-party challenge to any of our patents could result in the unenforceability or invalidity of some or all of the claims of such patents and could be time consuming and expensive.
The extent to which the patent rights of life sciences companies effectively protect their diagnostic tests and technologies is often highly uncertain and involves complex legal and factual questions for which important legal principles remain unresolved. No consistent policy regarding the proper scope of allowable claims of patents held by life sciences companies has emerged to date in the United States. Various courts, including the U.S. Supreme Court, have rendered decisions that impact the scope of patentability of certain inventions or discoveries relating to diagnostic tests or genomic diagnostic testing. These decisions generally stand for the proposition that inventions that recite laws of nature are not themselves patentable unless they have sufficient additional features that provide practical assurance that the processes are genuine inventive applications of those laws rather than patent drafting efforts designed to monopolize a law of nature itself. What constitutes a “sufficient” additional feature for this purpose is uncertain. While we do not generally rely on gene sequence patents, this evolving case law in the United States may adversely impact our ability to obtain new patents and may facilitate third-party challenges to our existing owned and exclusively licensed patents.
We cannot predict the breadth of claims that may be allowed or enforced in patents we own or in those to which we have exclusive license rights. For example:
| • | the inventor(s) named in one or more of our patents or patent applications might not have been the first to have made the relevant invention; |
| • | the inventor (or his assignee) might not have been the first to file a patent application for the claimed invention; |
| • | others may independently develop similar or alternative diagnostic tests and technologies or may successfully replicate our product and technologies; |
| • | it is possible that the patents we own or in which have exclusive license rights may not provide us with any competitive advantages or may be challenged by third parties and found to be invalid or unenforceable; |
| • | any patents we obtain or exclusively license may expire before, or within a limited time period after, the assays and services relating to such patents are commercialized; |
| • | we may not develop or acquire additional proprietary assays and technologies that are patentable; and |
| • | others may acquire patents that could be asserted against us in a manner that could have an adverse effect on our business. |
32
Table of Contents
Changes in either the patent laws or in interpretations of patent laws in the United States or other countries may diminish the value of our intellectual property rights. On September 16, 2011, the Leahy-Smith America Invents Act, or the Leahy-Smith Act, was signed into law. The Leahy-Smith Act includes a number of significant changes to U.S. patent law. These include provisions that affect the way patent applications are prosecuted, redefine prior art, may affect patent litigation and switch the U.S. patent system from a “first-to-invent” system to a “first-to-file” system. Under a first-to-file system, assuming the other requirements for patentability are met, the first inventor to file a patent application generally will be entitled to the patent on an invention regardless of whether another inventor had made the invention earlier. The U.S. Patent and Trademark Office, or USPTO, recently developed new regulations and procedures to govern administration of the Leahy-Smith Act, and many of the substantive changes to patent law associated with the Leahy-Smith Act, including the first-to-file provisions in particular, only became effective on March 16, 2013. Accordingly, it is not clear what, if any, impact the Leahy-Smith Act will have on the operation of our business. However, the Leahy-Smith Act and its implementation could increase the uncertainties and costs surrounding the prosecution of our owned and licensed patent applications and the enforcement or defense of issued patents that we own or license, all of which could have a material adverse effect on our business and financial condition.
Patent applications in the United States and many foreign jurisdictions are not published until at least eighteen months after filing and it is possible for a patent application filed in the United States to be maintained in secrecy until a patent issues on the application. In addition, publications in the scientific literature often lag behind actual discoveries. We therefore cannot be certain that others have not filed patent applications that cover inventions that are the subject of pending applications that we own or exclusively license or that we were the first to invent the technology (if filed prior to the Leahy-Smith Act) or first to file (if filed after the Leahy-Smith Act). Our competitors may have filed, and may in the future file, patent applications covering technology that is similar to or the same as our technology. Any such patent application may have priority over patent applications that we own and, if a patent issues on such patent application, we could be required to obtain a license to such patent in order to carry on our business. If another party has filed a U.S. patent application covering an invention that is similar to, or the same as, an invention that we own, we may have to participate in an interference or other proceeding in the USPTO or a court to determine priority of invention in the United States, for applications and patents made prior to the enactment of the Leahy-Smith Act. For applications and patents made following the enactment of the Leahy-Smith Act, we may have to participate in a derivation proceeding to resolve disputes relating to inventorship. The costs of these proceedings could be substantial, and it is possible that such efforts would be unsuccessful, resulting in our inability to obtain or retain any U.S. patent rights with respect to such invention.
In addition, the laws of foreign jurisdictions may not protect our rights to the same extent as the laws of the United States. For example, European patent law restricts the patentability of methods of treatment of the human body more than U.S. law does. Publications of discoveries in scientific literature often lag behind the actual discoveries, and patent applications in the United States and other jurisdictions are typically not published until 18 months after filing, or in some cases not at all. Therefore, we cannot be certain that we were the first to make the inventions claimed in our owned or licensed patents or pending patent applications, or that we or our licensors were the first to file for patent protection of such inventions. Moreover, the USPTO might require that the term of a patent issuing from a pending patent application be disclaimed and limited to the term of another patent that is commonly owned or names a common inventor. As a result, the issuance, scope, validity, term, enforceability and commercial value of our patent rights are highly uncertain.
The patent prosecution process is expensive and time-consuming, is highly uncertain and involves complex legal and factual questions. Recent patent reform legislation could increase the uncertainties and costs surrounding the prosecution of our patent applications and the enforcement or defense of our issued patents. Our success depends in large part on our ability to obtain and maintain patent protection in the United States and other countries with respect to our proprietary technology and product candidates. We seek to protect our proprietary position by filing in the United States and in certain foreign jurisdictions patent applications related to our novel technologies and product candidates that are important to our business.
33
Table of Contents
The patent prosecution process is expensive and time-consuming, and we may not be able to file and prosecute all necessary or desirable patent applications at a reasonable cost or in a timely manner. It is also possible that we will fail to identify patentable aspects of our research and development output before it is too late to obtain patent protection. In addition, we may not pursue or obtain patent protection in all major markets. Moreover, in some circumstances, we may not have the right to control the preparation, filing or prosecution of patent applications, or to maintain the patents, covering technology that we license from third parties. In some circumstances, our licensors may have the right to enforce the licensed patents without our involvement or consent, or to decide not to enforce or to allow us to enforce the licensed patents. Therefore, these patents and patent applications may not be prosecuted and enforced in a manner consistent with the best interests of our business. If any of our licensors fail to maintain such patents, or lose rights to those patents, the rights that we have licensed may be reduced or eliminated and our right to develop and commercialize any of our product candidates that are the subject of such licensed rights could be adversely affected.
Our pending and future patent applications may not result in patents being issued which protect our technology or products, in whole or in part, or which effectively prevent others from commercializing competitive technologies and products. In particular, during prosecution of any patent application, the issuance of any patents based on the application may depend upon our ability to generate additional nonclinical or clinical data that support the patentability of our proposed claims. We may not be able to generate sufficient additional data on a timely basis, or at all. Moreover, changes in either the patent laws or interpretation of the patent laws in the United States or other countries may diminish the value of our patents or narrow the scope of our patent protection.
Moreover, we may be subject to a third-party pre-issuance submission of prior art to the USPTO, or become involved in opposition, derivation, reexamination, inter partes review, post-grant review or interference proceedings or other patent office proceedings or litigation, in the United States or elsewhere, challenging our patent rights or the patent rights of others. An adverse determination in any such submission or proceeding could reduce the scope of, or invalidate, our patent rights; allow third parties to commercialize our technology or products and compete directly with us, without payment to us; or result in our inability to manufacture or commercialize products without infringing third-party patent rights. In addition, if the breadth or strength of protection provided by our owned and licensed patents and patent applications is threatened, it could dissuade companies from collaborating with us to license, develop or commercialize current or future product candidates.
Obtaining and maintaining our patent protection depends upon compliance with various procedural, document submission, fee payment and other requirements imposed by governmental patent agencies, and our patent protection could be reduced or eliminated for non-compliance with these requirements. The USPTO and various foreign governmental patent agencies require compliance with a number of procedural, documentary, fee payment and other provisions during the patent prosecution process and following the issuance of a patent. There are situations in which noncompliance with these requirements can result in abandonment or lapse of a patent or patent application, resulting in partial or complete loss of patent rights in the relevant jurisdiction. In such an event, competitors might be able to enter the market earlier than would otherwise have been the case if our patent were in force.
Our intellectual property rights may not be sufficient to protect our competitive position and to prevent others from manufacturing, using or selling competing assays. The scope of our owned and exclusively licensed intellectual property rights may not be sufficient to prevent others from manufacturing, using or selling competing assays. Competitors could purchase our product and attempt to replicate some or all of the competitive advantages we derive from our development efforts, willfully infringe our intellectual property rights, design around our protected technology or develop their own competitive technologies and thereby avoid infringing our intellectual property rights. If our intellectual property is not sufficient to effectively prevent our competitors from developing and selling similar diagnostic tests, our competitive position and our business could be adversely affected.
34
Table of Contents
Our platform depends on certain technologies that are licensed to us. We do not control these technologies and any loss of our rights to them could prevent us from manufacturing our assays. We rely on licenses to various proprietary technologies that are material to our business, including the development of certain future assays. We have entered into non-exclusive licenses with Biohelix, a subsidiary of Quidel Corporation and a license with Integrated DNA Technologies that has certain exclusive and non-exclusive fields. Our rights to use these technologies will be subject to the continuation of and our compliance with the terms of those licenses.
We may become involved in disputes relating to our intellectual property rights, and may need to resort to litigation in order to defend and enforce our intellectual property rights. Extensive litigation regarding patents and other intellectual property rights has been common in the medical diagnostic testing industry. Litigation may be necessary to assert infringement claims, protect trade secrets or know-how and determine the enforceability, scope and validity of certain proprietary rights. Litigation may even be necessary to resolve disputes of inventorship or ownership of proprietary rights. The defense and prosecution of intellectual property lawsuits, USPTO interference or derivation proceedings and related legal and administrative proceedings (e.g., a re-examination) in the United States and internationally involve complex legal and factual questions. As a result, such proceedings are costly and time consuming to pursue, and their outcome is uncertain.
Even if we prevail in such a proceeding in which we assert our intellectual property rights against third parties, the remedy we obtain may not be commercially meaningful or adequately compensate us for any damages we may have suffered. If we do not prevail in such a proceeding, our patents could potentially be declared to be invalid, unenforceable or narrowed in scope, or we could otherwise lose valuable intellectual property rights. Similar proceedings involving the intellectual property we exclusively license could also have an impact on our business. Further, if any of our other owned or exclusively licensed patents are declared invalid, unenforceable or narrowed in scope, our competitive position could be adversely affected.
We could face claims that our activities or the manufacture, use or sale of our assays infringe the intellectual property rights of others, which could cause us to pay damages or licensing fees and limit our ability to sell some or all of our assays and services. Our research, development and commercialization activities may infringe or be claimed to infringe patents or other intellectual property rights owned by other parties of which we may be unaware because the relevant patent applications may have been filed but not yet published. Certain of our competitors and other companies have substantial patent portfolios, and may attempt to use patent litigation as a means to obtain a competitive advantage or to extract licensing revenue. In addition to patent infringement claims, we may also be subject to other claims relating to the violation of intellectual property rights, such as claims that we have misappropriated trade secrets or infringed third party trademarks. The risks of being involved in such litigation may also increase as we gain greater visibility as a public company and as we gain commercial acceptance of our diagnostic tests and move into new markets and applications for our assays.
Regardless of merit or outcome, our involvement in any litigation, interference or other administrative proceedings could cause us to incur substantial expense and could significantly divert the efforts of our technical and management personnel. Any public announcements related to litigation or interference proceedings initiated or threatened against us could cause our share price to decline. An adverse determination, or any actions we take or agreements we enter into in order to resolve or avoid disputes, may subject us to the loss of our proprietary position or to significant liabilities, or require us to seek licenses that may include substantial cost and ongoing royalties. Licenses may not be available from third parties, or may not be obtainable on satisfactory terms. An adverse determination or a failure to obtain necessary licenses may restrict or prevent us from manufacturing and selling our diagnostic tests and offering our services. These outcomes could materially harm our business, financial condition and results of operations.
We may not be able to adequately protect our intellectual property outside of the United States. The laws of some foreign countries do not protect intellectual property rights to the same extent as the laws of the United States, and many companies have encountered significant problems in protecting and defending such rights in foreign jurisdictions. The legal systems of certain countries, particularly certain developing countries, do not
35
Table of Contents
favor the enforcement of patents and other intellectual property protection, particularly those relating to medical devices, diagnostic testing and biotechnology, which could make it difficult for us to stop the infringement of our patents and for licensors, if they were to seek to do so, to stop infringement of patents that are licensed to us. Proceedings to enforce our patent rights in foreign jurisdictions could result in substantial cost and divert our efforts and attention from other aspects of our business. Additionally, prosecuting and maintaining intellectual property (particularly patent) rights are very costly endeavors, and for these and other reasons we may not pursue or obtain patent protection in all major markets. We do not know whether legal and government fees will increase substantially and therefore are unable to predict whether cost may factor into our global intellectual property strategy.
In addition to the risks associated with patent rights, the laws in some foreign jurisdictions may not provide protection for our trade secrets and other intellectual property. If our trade secrets or other intellectual property are misappropriated in foreign jurisdictions, we may be without adequate remedies to address these issues. Additionally, we also rely on confidentiality and assignment of invention agreements to protect our intellectual property in foreign jurisdictions. These agreements may provide for contractual remedies in the event of misappropriation, but we do not know to what extent, if any, these agreements and any remedies for their breach, will be enforced by a foreign court. In the event our intellectual property is misappropriated or infringed upon and an adequate remedy is not available, our future prospects will likely diminish. The sale of diagnostic tests that infringe our intellectual property rights, particularly if such diagnostic tests are offered at a lower cost, could negatively impact our ability to achieve commercial success and may materially and adversely harm our business.
Our failure to secure trademark registrations could adversely affect our business and our ability to market our assays and product candidates. Our trademark applications in the United States and any other jurisdictions where we may file may not be allowed for registration, and our registered trademarks may not be maintained or enforced. During trademark registration proceedings, we may receive rejections. Although we are given an opportunity to respond to those rejections, we may be unable to overcome such rejections. In addition, in the USPTO and in corresponding foreign agencies, third parties are given an opportunity to oppose pending trademark applications and to seek to cancel registered trademarks. Opposition or cancellation proceedings may be filed against our applications and/or registrations, and our applications and/or registrations may not survive such proceedings. Failure to secure such trademark registrations in the United States and in foreign jurisdictions could adversely affect our business and our ability to market our diagnostic tests and product candidates.
We may be unable to adequately prevent disclosure of trade secrets and other proprietary information, or the misappropriation of the intellectual property we regard as our own. We rely on trade secrets to protect our proprietary know how and technological advances, particularly where we do not believe patent protection is appropriate or obtainable. Nevertheless, trade secrets are difficult to protect. We rely in part on confidentiality agreements with our employees, consultants, third party contractors, third party collaborators and other advisors to protect our trade secrets and other proprietary information. These agreements generally require that the other party to the agreement keep confidential and not disclose to third parties all confidential information developed by us or made known to the other party by us during the course of the other party’s relationship with us. These agreements may not effectively prevent disclosure of confidential information and may not provide an adequate remedy in the event of unauthorized disclosure of confidential information. Monitoring unauthorized disclosure is difficult, and we do not know whether the steps we have taken to prevent such disclosure are, or will be, adequate. If we were to seek to pursue a claim that a third party had illegally obtained and was using our trade secrets, it would be expensive and time consuming, and the outcome would be unpredictable. Further, courts outside the United States may be less willing to protect trade secrets. In addition, others may independently discover our trade secrets and proprietary information and therefore be free to use such trade secrets and proprietary information. Costly and time consuming litigation could be necessary to enforce and determine the scope of our proprietary rights. In addition, our trade secrets and proprietary information may be misappropriated as a result of breaches of our electronic or physical security systems in which case we may have no legal recourse. Failure to obtain, or maintain, trade secret protection could enable competitors to use our proprietary
36
Table of Contents
information to develop assays that compete with our diagnostic tests or cause additional, material adverse effects upon our competitive business position.
We may be subject to claims that our employees have wrongfully used or disclosed alleged trade secrets of their former employers. As is common in our industry, we employ individuals who were previously employed at other companies in our industry or in related industries, including our competitors or potential competitors. We may be subject to claims that we or these employees have inadvertently or otherwise used or disclosed trade secrets or other proprietary information of their former employers. Litigation may be necessary to defend against these claims. Even if we are successful in defending against these claims, litigation could result in substantial costs and be a distraction to management.
Risks Related to Owning our Common Stock and Other Securities
The price of our common stock may fluctuate substantially. The market price of our common stock has been and may continue to be subject to wide fluctuation in response to various factors, some of which are beyond our control. Some factors that may cause the market price of our common stock to fluctuate, in addition to the other risks mentioned in this “Risk Factors” section and elsewhere in this Form-10K, are:
| • | sales of our common stock by our stockholders, executives, and directors; |
| • | volatility and limitations in trading volumes of our shares of common stock; |
| • | fluctuations in our results of operations; |
| • | our ability to enter new markets; |
| • | actual or un-anticipated fluctuations in our annual and quarterly financial results; |
| • | our ability to obtain financings to continue and expand our commercial activities, expand our manufacturing operations, conduct and complete research and development activities including, but not limited to, our human clinical trials, and other business activities; |
| • | our ability to secure resources and the necessary personnel to continue and expand our commercial activities, develop additional assays, conduct clinical trials and gain approval for our additional assays on our desired schedule; |
| • | commencement, enrollment or results of our clinical trials of our assays or any future clinical trials we may conduct; |
| • | changes in the development status of our assays; |
| • | any delays or adverse developments or perceived adverse developments with respect to the FDA’s review of our planned clinical trials; |
| • | any delay in our submission for studies or test approvals or adverse regulatory decisions, including failure to receive regulatory approval for our assays; |
| • | our announcements or our competitors’ announcements regarding new assays, enhancements, significant contracts, acquisitions or strategic investments; |
| • | unanticipated safety concerns related to our assays; |
| • | failures to meet external expectations or management guidance; |
| • | changes in our capital structure or dividend policy, including as a result of future issuances of securities and sales of large blocks of common stock by our stockholders; |
| • | our cash position; |
| • | announcements and events surrounding financing efforts, including debt and equity securities; |
| • | our inability to enter into new markets or develop new assays; |
37
Table of Contents
| • | reputational issues; |
| • | competition from existing technologies and assays or new technologies and assays that may emerge; |
| • | announcements of acquisitions, partnerships, collaborations, joint ventures, new diagnostic tests, capital commitments, or other events by us or our competitors; |
| • | changes in general economic, political and market conditions in any of the regions in which we conduct our business; |
| • | changes in industry conditions or perceptions; |
| • | changes in valuations of similar companies or groups of companies; |
| • | analyst research reports, recommendations and changes in recommendations, price targets and withdrawals of coverage; |
| • | departures and additions of key personnel; |
| • | disputes and litigations related to intellectual properties, proprietary rights and contractual obligations; |
| • | changes in applicable laws, rules, regulations, or accounting practices and other dynamics; |
| • | release or expiry of lockup or other transfer restrictions on our outstanding common shares; |
| • | announcements or actions taken by our principal stockholders; and |
| • | other events or factors, many of which may be out of our control. |
In addition, if the market for stocks in our industry or industries related to our industry, or the stock market in general, experiences a loss of investor confidence, the trading price of our common stock could decline for reasons unrelated to our business, financial condition and results of operations. If any of the foregoing occurs, it could cause our stock price to fall and may expose us to lawsuits that, even if unsuccessful, could be costly to defend and a distraction to management.
Future sales and issuances of our common stock or rights to purchase common stock could result in additional dilution of the percentage ownership of our stockholders and could cause our share price to fall. We expect that significant additional capital will be needed in the future to continue our planned operations, including expanding research and development, funding clinical trials, purchasing of capital equipment, hiring new personnel, commercializing our diagnostic tests, and continuing activities as an operating public company. To the extent we raise additional capital by issuing equity securities, our stockholders may experience substantial dilution. We may sell common stock, convertible securities or other equity securities in one or more transactions at prices and in a manner we determine from time to time. If we sell common stock, convertible securities or other equity securities in more than one transaction, investors may be materially diluted by subsequent sales. Such sales may also result in material dilution to our existing stockholders, and new investors could gain rights superior to our existing stockholders.
The low trading volume of our common stock may adversely affect the price of our shares. Although our common stock is listed on The NASDAQ Capital Market, or NASDAQ, our common stock has experienced low trading volume. As of February 13, 2015, the 50 day average daily trading volume of our common stock, as reported by NASDAQ, was 12,668 shares. Limited trading volume may subject our common stock to greater price volatility and may make it difficult for investors to sell shares of our common stock at a price that is attractive to them.
Future sales of our common stock in the public market may cause our stock price to decline and impair our ability to raise future capital through the sale of our equity securities. There are a substantial number of shares of our common stock held by stockholders who owned shares of our capital stock prior to our initial public offering that may be able to sell in the public market upon expiration of the 180-day lock-up agreements they
38
Table of Contents
signed in connection with our initial public offering. Sales by such stockholders of a substantial number of shares could significantly reduce the market price of our common stock.
We plan to register all shares of our common stock that we may issue pursuant to our 2006 Stock Option Plan, our 2014 Stock Option Plan and our Omnibus Plan. Shares issued by us upon exercise of options granted under these equity plans will be eligible for sale in the public market. If any of these holders cause a large number of securities to be sold in the public market, the sales could reduce the trading price of our common stock. These sales also could impede our ability to raise capital in the future.
“Penny stock” rules may make buying or selling our securities difficult, which may make our stock less liquid and make it harder for investors to buy and sell our securities. If at any time in the future our shares of common stock are not listed for trading by NASDAQ and begin to trade on an over-the-counter market such as the Over-the-Counter Bulletin Board or any quotation system maintained by OTC Markets, Inc., trading in our securities will be subject to the SEC’s “penny stock” rules and it is anticipated that trading in our securities will continue to be subject to the penny stock rules for the foreseeable future. The Securities and Exchange Commission has adopted regulations that generally define a penny stock to be any equity security that has a market price of less than $5.00 per share, subject to certain exceptions. These rules require that any broker-dealer who recommends our securities to persons other than prior customers and accredited investors must, prior to the sale, make a special written suitability determination for the purchaser and receive the purchaser’s written agreement to execute the transaction. Unless an exception is available, the regulations require the delivery, prior to any transaction involving a penny stock, of a disclosure schedule explaining the penny stock market and the risks associated with trading in the penny stock market. In addition, broker-dealers must disclose commissions payable to both the broker-dealer and the registered representative and current quotations for the securities they offer. The additional burdens imposed upon broker-dealers by these requirements may discourage broker-dealers from recommending transactions in our securities, which could severely limit the liquidity of our securities and consequently adversely affect the market price for our securities.
NASDAQ may delist our common stock from its exchange, which could limit investors’ ability to make transactions in our common stock and subject us to additional trading restrictions. Should we fail to satisfy the continued listing requirements of NASDAQ, such as the corporate governance requirements or the minimum closing bid price requirement, NASDAQ may take steps to delist our common stock. Such a delisting would likely have a negative effect on the price of our common stock, respectively, and would impair your ability to sell or purchase our common stock when you wish to do so. In the event of a delisting, we would take actions to restore our compliance with NASDAQ’s listing requirements, but we can provide no assurance that any such action taken by us would allow our common stock to become listed again, stabilize the market price or improve the liquidity of our common stock, prevent our common stock from dropping below the NASDAQ minimum bid price requirement or prevent future non-compliance with NASDAQ’s listing requirements.
If The NASDAQ Capital Market does not maintain the listing of our securities for trading on its exchange, we could face significant material adverse consequences, including:
| • | a limited availability of market quotations for our securities; |
| • | reduced liquidity with respect to our securities; |
| • | a determination that our shares of common stock are “penny stock” which will require brokers trading in our shares of common stock to adhere to more stringent rules, possibly resulting in a reduced level of trading activity in the secondary trading market for our shares of common stock; |
| • | a limited amount of news and analyst coverage for our company; and |
| • | decreased ability to issue additional securities or obtain additional financing in the future. |
Therefore, it may be difficult for our stockholders to sell any shares or Units if they desire or need to sell them.
39
Table of Contents
Financial reporting obligations of being a public company in the United States are expensive and time consuming, and may place significant demands on our management and other personnel. The additional obligations of being a public company in the United States require significant expenditures and may place significant demands on our management and other personnel, including costs resulting from public company reporting obligations under the Securities Exchange Act of 1934, as amended, or the Exchange Act, and the rules and regulations regarding corporate governance practices, including those under the Sarbanes-Oxley Act, the Dodd-Frank Wall Street Reform and Consumer Protection Act, and the listing requirements of The NASDAQ Capital Market. Our management and other personnel devote a substantial amount of time to ensure that we comply with all of these requirements. Moreover, despite recent reforms made possible by the JOBS Act (certain provisions of which we are taking advantage of), the reporting requirements, rules, and regulations will make some activities more time-consuming and costly, particularly after we are no longer an “emerging growth company.” Any changes that we make to comply with these obligations may not be sufficient to allow us to satisfy our obligations as a public company on a timely basis, or at all.
We do not intend to pay cash dividends on our shares of common stock so any returns will be limited to the value of our shares. We currently anticipate that we will retain future earnings for the development, operation and expansion of our business and do not anticipate declaring or paying any cash dividends for the foreseeable future. Any return to stockholders will therefore be limited to the increase, if any, of our share price.
We are an “emerging growth company” and will be able to avail ourselves of reduced disclosure requirements applicable to emerging growth companies, which could make our common stock less attractive to investors. We are an “emerging growth company,” as defined in the Jumpstart Our Business Startups Act of 2012, or the JOBS Act, and we intend to take advantage of certain exemptions from various reporting requirements that are applicable to other public companies that are not “emerging growth companies” including not being required to comply with the auditor attestation requirements of Section 404(b) of the Sarbanes-Oxley Act, reduced disclosure obligations regarding executive compensation in our periodic reports and proxy statements, and exemptions from the requirements of holding a nonbinding advisory vote on executive compensation and stockholder approval of any golden parachute payments not previously approved. Investors may find our common stock less attractive because we may rely on these exemptions. If some investors find our common stock less attractive as a result, there may be a less active trading market for our common stock and our stock price may be more volatile. We may take advantage of these reporting exemptions until we are no longer an “emerging growth company.” We will remain an “emerging growth company” until the earliest of (i) the last day of the fiscal year in which we have total annual gross revenues of $1 billion or more; (ii) the last day of our fiscal year following the fifth anniversary of the date of the completion of our initial public offering; (iii) the date on which we have issued more than $1 billion in nonconvertible debt during the previous three years; or (iv) the date on which we are deemed to be a large accelerated filer under the rules of the Securities and Exchange Commission.
We have elected to use the extended transition periods for complying with new or revised accounting standards. We have elected to use the extended transition period provided in Section 7(a)(2)(B) of the Securities Act for complying with new or revised accounting standards that have different effective dates for public and private companies until the earlier of the date we (i) are no longer an emerging growth company or (ii) affirmatively and irrevocably opt out of the extended transaction period provided in Section 7(a)(2)(B). As a result, our financial statements may not be comparable to those of companies that comply with public company effective dates.
We may be at risk of securities class action litigation. We may be at risk of securities class action litigation. This risk is especially relevant for us due to our dependence on positive clinical trial outcomes and regulatory approvals of our diagnostic tests. In the past, life science companies have experienced significant stock price volatility, particularly when associated with binary events such as clinical trials and product approvals. If we face such litigation, it could result in substantial costs and a diversion of management’s attention and resources, which could harm our business and results in a decline in the market price of our common stock.
40
Table of Contents
Our management is required to devote substantial time to compliance initiatives. As a public company, we incur significant legal, accounting and other expenses that we did not incur as a newly formed entity. The Sarbanes-Oxley Act, as well as rules subsequently implemented by the Securities and Exchange Commission, and NASDAQ, have imposed various new requirements on public companies, including requiring establishment and maintenance of effective disclosure and financial controls and changes in corporate governance practices. Our management and other personnel devote a substantial amount of time to these new compliance initiatives. Moreover, these rules and regulations increase our legal and financial compliance costs and make some activities more time consuming and costly. We expect these rules and regulations to make it more difficult and more expensive for us to obtain director and officer liability insurance and we may be required to incur substantial costs to maintain the same or similar coverage.
The dilutive effect of our outstanding warrants could have an adverse effect on the future market price of our shares or otherwise adversely affect the interests of our stockholders. As of December 31 2014, there are 5,447,940 outstanding warrants to purchase 5,447,940 of our common shares at an average exercise price of $4.17 per share. These warrants are likely to be exercised if the market price of our shares equals or exceeds the warrant exercise price. To the extent such warrants are exercised, additional shares will be issued, which would dilute the ownership of existing stockholders. Further, if the warrants are exercised at any time in the future at a price lower than the book value per share of our common stock, existing stockholders could suffer dilution of their investment. Of these previously issued warrants, 5,045,584 warrants have a price adjustment provision, such that if the Company issues shares at a price lower than the exercise price of the warrants, the exercise price will be readjusted to match the issuance price.
Provisions of our Seventh Amended and Restated Certificate of Incorporation, our Amended and Restated Bylaws and Delaware law could make an acquisition of our Company, which may be beneficial to our stockholders, more difficult and may prevent attempts by our stockholders to replace or remove the current members of our board and management. Certain provisions of our Seventh Amended and Restated Certificate of Incorporation and our Amended and Restated Bylaws could discourage, delay or prevent a merger, acquisition or other change of control that stockholders may consider favorable, including transactions in which you might otherwise receive a premium for your shares. Furthermore, these provisions could prevent or frustrate attempts by our stockholders to replace or remove members of our board of directors. These provisions also could limit the price that investors might be willing to pay in the future for our common stock, thereby depressing the market price of our common stock. Stockholders who wish to participate in these transactions may not have the opportunity to do so. These provisions:
| • | establish a classified board of directors, such that not all members of the Board of Directors may be elected at one time; |
| • | authorize our board of directors to issue without stockholder approval up to 5,000,000 shares of preferred stock, the rights of which will be determined at the discretion of the Board of Directors that, if issued, could operate as a “poison pill” to dilute the stock ownership of a potential hostile acquirer to prevent an acquisition that is not approved by our board of directors; |
| • | require that stockholder actions must be effected at a duly called stockholder meeting or by written consent of the stockholders if such action has been earlier approved by the board of directors; |
| • | establish advance notice requirements for stockholder nominations to our board of directors or for stockholder proposals that can be acted on at stockholder meetings; |
| • | limit who may call stockholder meetings; and |
| • | require the approval of the holders of at least sixty percent of the outstanding shares of our capital stock entitled to vote in order to amend certain provisions of our Seventh Amended and Restated Certificate of Incorporation and at least two-thirds of the outstanding voting stock to amend certain provisions of our Amended and Restated bylaws. |
41
Table of Contents
In addition, we are governed by the provisions of Section 203 of the Delaware General Corporation Law, which may, unless certain criteria are met, prohibit large stockholders, in particular those owning 15% or more of the voting rights on our common stock, from merging or combining with us for a prescribed period of time.
ITEM 1B. UNRESOLVED STAFF COMMENTS.
None
Our headquarters and manufacturing facility is located in Salt Lake City, Utah. As of February 1, 2015, we leased approximately 33,000 square feet of building space in Salt Lake City, Utah. We believe our existing facilities and equipment are in good operating condition and are suitable for the conduct of its business.
We are not currently a party to any pending or threatened legal proceeding or government investigations.
ITEM 4. MINE SAFETY DISCLOSURES.
Not Applicable
42
Table of Contents
PART II
ITEM 5. MARKET FOR REGISTRANT’S COMMON EQUITY, RELATED STOCKHOLDER MATTERS AND ISSUER PURCHASES OF EQUITY SECURITIES.
Our shares of common stock are currently quoted on The NASDAQ Capital Market under the symbol “GBSN”.
The following table sets forth the high and low prices of our common stock, as reported by The NASDAQ Capital Market since our initial public offering, for the periods indicated:
| 2014 | ||||||||
| High | Low | |||||||
| Fourth Quarter (October 9 to December 31, 2014) |
$ | 9.08 | $ | 2.12 | ||||
| 2015 | ||||||||
| High | Low | |||||||
| First Quarter (January 1 to February 13, 2015) |
$ | 2.93 | $ | 1.48 | ||||
As of February 13, 2015, there were approximately 509 stockholders of record of our common stock. This number excludes stockholders whose stock is held in nominee or street name by brokers.
On February 13, 2015, the closing price of our common stock was $1.77 per share. We have never declared or paid any cash dividends on our common stock. We currently intend to retain any future earnings and do not expect to pay cash dividends on our common stock for the foreseeable future. Any determination to pay dividends in the future will be at the discretion of our board of directors and will be dependent on a number of factors, including our earnings, capital requirements and overall financial condition.
Unregistered Sales of Securities
Certain Exercises of Class B Common Warrants
In October and November 2014, the Company issued 158,000 shares of common stock to various unaffiliated investors upon the exercise of 158,000 of Class B warrants at an exercise price of $31,600 or $0.20 per share.
Use of Proceeds
Use of Proceeds from Initial Public Offering
On October 8, 2014, the SEC declared effective our initial public offering registration statement on Form S-1 (File No. 333-197954) related to 1,150,000 shares of common stock and 1,150,000 Series A Warrants, which were sold in combinations of one share of common stock and one Series A Warrant at a public offering price of $7.00 per unit. Each Series A Warrant is exercisable for one share of common stock and one Series B Warrant. In addition, the managing underwriter, Dawson James Securities, Inc. exercised its option to purchase 172,500 Series A Warrants. The IPO commenced on October 8, 2014 and has not yet terminated.
The aggregate sale price for securities sold in the initial public offering was $8,051,725. The aggregate net proceeds received by the Company from the initial public offering was approximately $6,376,486 after deducting total expenses of $1,675,241, including approximately $644,138 in underwriting discounts and commissions and approximately $1,031,103 in other expenses payable by the Company.
None of the underwriting discounts and commissions or offering expenses were paid, directly or indirectly, to any of our directors or officers or their associates or to persons owning 10% or more of our common stock or to any of our affiliates.
We intend to use the net proceeds from the initial public offering for research and development expenses, sales and marketing expenses, the manufacture of analyzers for customers, the automation of our manufacturing facility, increasing manufacturing capacity and other general corporate purposes, including working capital.
ITEM 6. SELECTED FINANCIAL DATA.
As a smaller reporting company, we have elected not to provide the disclosure required by this item.
43
Table of Contents
ITEM 7. MANAGEMENT’S DISCUSSION AND ANALYSIS OF FINANCIAL CONDITION AND RESULTS OF OPERATIONS.
You should read the following discussion and analysis of our financial condition and results of operations together with our financial statements and related notes appearing elsewhere in this annual report. Except for historical information contained herein, the following discussion and analysis contains forward-looking statements which are subject to known and unknown risks, uncertainties and other factors that may cause our actual results to differ materially from those expressed or implied by such forward-looking statements. We discuss such risks, uncertainties and other factors throughout this report and specifically under Item 1A of Part I of this report, “Risk Factors”.
Overview of Our Business
We are a molecular diagnostic testing company. We are focused on improving patient care through the development and commercialization of our patented, low-cost, molecular diagnostic platform for testing for infectious disease, especially hospital-acquired infections. We believe our platform has the ability to transform molecular testing for infectious diseases at small to medium sized hospitals by providing an affordable solution that meets the rapidly evolving needs of patients and providers.
We believe there is a fast-growing market for molecular diagnostic systems being purchased by hospital microbiology labs to replace culture and other legacy testing formats. We believe our platform is well positioned to meet this need. Our platform provides results in 45 to 115 minutes depending on the test. Molecular testing generally reduces test time from days to hours, and provides more accurate results, leading to shortened hospital stays and improved patient outcomes, all of which leads to reduced cost for hospitals that implement molecular testing in their labs.
Our platform is an automated molecular diagnostic system, consisting of an analyzer and associated assay cartridge. Our platform utilizes a sample-to-result format, which means that once a patient specimen is received, it undergoes limited processing before it is placed in the analyzer where the assay is run without further technician intervention. This reduces assay complexity and eliminates the need for highly trained and expensive molecular technicians to run the tests. Our platform is designed to enable simple, rapid and cost-effective analysis of multiple pathogens from a single clinical sample, which will allow small to medium sized community hospitals that traditionally could not afford more expensive or complex molecular diagnostic testing platforms to modernize their laboratory testing and provide better patient care at an affordable cost.
In November 2012, we launched our first FDA-cleared test for C. diff, a bacteria that causes life-threatening gastro-intestinal distress in hospital patients. We currently sell our diagnostic test cartridge in the United States through a direct sales force and we use distributors in the European Union and New Zealand. As of December 31, 2014, we had 106 customers worldwide (84 in the United States and 22 in the rest of the world), who use an aggregate of 220 analyzers. Our easy to use platform allows small to medium sized hospitals that we believe could not previously afford more expensive or complex molecular diagnostic systems to modernize their laboratory testing and provide better patient care at an affordable cost.
In addition to our C. diff assay, we have developed a Group B Strep assay for which we filed a 510(k) submission to the FDA in the fourth quarter of 2014 and expect to receive the results of the FDA’s review during the second quarter of 2015. We began a clinical trial for a Staph ID/R assay for blood infections caused by Staphylococcus bacteria in the fourth quarter of 2014. We also began a clinical trial for our Shiga toxin producing E. coli assay in the first quarter of 2015. Additionally, we have three other assays in product development: (i) a pre-surgical nasal screen for Staphylococcus aureus, or SA, (ii) a food borne pathogen panel, and (iii) a panel for candida blood infections.
44
Table of Contents
Financial Operations Overview
Revenue
We derive our revenue from the sale of single use assays sold through our dedicated sales force in the United States, and in the European Union and New Zealand through a network of distributors. Revenue is recognized when all four of the following criteria are met: (1) persuasive evidence that an arrangement exists; (2) delivery of the products has occurred; (3) the selling price of the product is fixed or determinable; and (4) collectability of that price is reasonably assured. Change in title to the product and recognition of revenue from sales of the assays occurs at the time of shipment.
We believe our revenue from the sale of our assays will increase as we expand our sales and marketing efforts and as we introduce new assays into the market. We expect that our revenue will continue to be primarily attributable to sales of our assays in the United States.
Our material increases in revenues since the inception of our business have been attributable to increases in the volume of goods being sold as a result of increases in the number of customers. As of December 31, 2014, we only have one commercial product, our C. diff assay and the average price has not materially changed since its commercial release.
Cost of Sales
The components of our cost of sales include cost of materials, supplies, labor for manufacturing and support personnel, equipment and facility expenses associated with manufacturing. We depreciate the cost of each analyzer that is at a customer site over a period of 5 years on a straight line basis and include that cost in cost of sales. We perform all of our manufacturing activities at our facility located in Salt Lake City, Utah. Facility expenses include allocated overhead comprised of rent, equipment depreciation and utilities. We expect our cost of sales in absolute dollars to increase, as the number of diagnostic cartridges we manufacture increases. However, we also expect that as assay volumes increase we will realize manufacturing efficiencies, which would result in a decrease in our cost of sales as a percentage of revenue. We also license certain technologies for our C. diff assay, which are described in the section of this annual report on Form 10-K titled “Business—License Agreements.” Pursuant to the terms of these license agreements, we pay royalty fees in the aggregate equal to 14% of our worldwide “Net Sales” of those products that use these technologies (as defined and adjusted pursuant to the terms of the applicable license agreements).
Research and Development
All research and development costs, including those funded by third parties, are expensed as incurred. Research and development costs consist of engineering, product development, clinical trials, test-part manufacturing, testing, developing and validating the manufacturing process, manufacturing, facility and regulatory-related costs. Research and development costs also include employee cash compensation, employee and non-employee stock-based compensation, supplies and materials, consultant services, and travel related to research activities.
In 2014 we incurred additional research and development costs as we continued to develop new assays and as we advanced the development of our product candidates, including our Group B Strep, Staph ID/R and shiga toxin producing e. coli assays. In particular, we plan to conduct clinical trials for the Staph ID/R and shiga toxin producing e.coli product candidates in 2015, which will increase our research and development expenses.
45
Table of Contents
Sales and Marketing
Sales and marketing expenses primarily consist of salaries, benefits and other related costs, including stock-based compensation, for personnel employed in sales, marketing, and training. In addition, our sales and marketing expenses include commissions and bonuses, generally based on a percentage of sales, to our sales representatives.
We expect our sales and marketing expenses to continue to increase as we introduce new assays, such as our Group B Strep and Staph ID/R assays, if approved, and seek to enhance our commercial infrastructure, including increasing our sales force and marketing efforts. Additionally, we expect our commissions to continue to increase in absolute terms over time but to decline as a percentage of revenue.
General and Administrative Expenses
General and administrative expenses primarily consist of salaries, benefits and other related costs, including stock-based compensation, for certain members of our executive team and other personnel employed in finance, legal, compliance, administrative, information technology, customer service, executive and human resource departments. General and administrative expenses include allocated facility expenses, related travel expenses and professional fees for accounting and legal services.
We expect our general and administrative expenses will increase due to costs associated with transitioning from a private to a public company including expenses related to compliance with the rules and regulations of the Securities and Exchange Commission and the NASDAQ Capital Market, additional insurance expenses, investor relations activities and other administrative and professional services and as we continue to grow our business.
Gain or Loss on Sale of Assets
Analyzers used outside the United States are sold to the customer and the sale is accounted for as a sale of fixed assets. For these limited situations, management has elected to sell the fixed asset analyzers as opposed to placing them with international customers (thereby not retaining title over the analyzers) as it would be impractical to retain ownership due to, among other reasons, the Company lacking the necessary personnel needed to service international customers, the need to comply with the additional laws and regulations of countries outside the United States to which the Company is not currently subject, and the added costs to recover, reconfigure, ship and redeploy fixed asset analyzers that have been used internationally. A corresponding loss on the sale of assets is recorded for the difference in the sales price from the cost of the analyzers. Other fixed assets of the Company are sold from time to time after the usefulness has ended. A corresponding gain or loss on the sale of other assets is recorded for the difference in the sales price from the cost of the asset.
Interest Income and Other Income
Interest income and other income primarily consist of interest earned on our cash.
Interest Expense
Interest expense consists of interest on capital leases, convertible notes payable and notes payable.
Change in Fair Value of Derivative Liability
We have issued certain common stock warrants that contain a price adjustment clause which states that in the event the Company issues common stock for a price less than the exercise price of warrants, the exercise price will be reduced to the issuance price of the common stock. The Company has determined that these warrants are accounted for as a derivative liability and are recorded at fair value measured at the transaction date and again at each reporting period. Any difference in fair value between the transaction date and future reporting periods must be recognized in earnings for the period.
46
Table of Contents
Results of Operations
Comparison of the Years Ended December 31, 2014 and 2013
The following table sets forth our results of operations for the years ended December 31, 2014 and December 31, 2013:
| Years Ended December 31, |
||||||||
| 2014 | 2013 | |||||||
| Revenue |
$ | 1,606,254 | $ | 760,646 | ||||
|
|
|
|
|
|||||
| Cost of sales |
3,968,185 | 2,185,992 | ||||||
|
|
|
|
|
|||||
| Gross loss |
(2,361,931 | ) | (1,425,346 | ) | ||||
| Operating Expenses |
||||||||
| Research and development |
4,609,913 | 3,345,693 | ||||||
| Selling and marketing |
2,301,610 | 2,618,901 | ||||||
| General and administrative |
2,928,186 | 1,866,875 | ||||||
| (Gain) loss on sale of assets |
(8,166 | ) | 22,768 | |||||
|
|
|
|
|
|||||
| Total operating expenses |
9,831,543 | 7,854,237 | ||||||
|
|
|
|
|
|||||
| Loss from operations |
(12,193,474 | ) | (9,279,583 | ) | ||||
|
|
|
|
|
|||||
| Interest expense |
(1,136,054 | ) | (284,323 | ) | ||||
| Interest income |
3,176 | 3,876 | ||||||
| Change in fair value of derivative liability |
(8,396,169 | ) | — | |||||
| Provision for income taxes |
(5,297 | ) | (1,250 | ) | ||||
|
|
|
|
|
|||||
| Net loss |
$ | (21,727,818 | ) | $ | (9,561,280 | ) | ||
|
|
|
|
|
|||||
Revenue
Revenue increased by $845,608 or 111.2% in the twelve months ended December 31, 2014 to $1,606,254 as compared to $760,646 in same period of 2013. This increase in total revenue was primarily attributable to a 115.6% increase in the volume of sales of C. diff assays from 35,690 for the twelve months ended December 31, 2013 to 76,960 for the twelve months ended December 31, 2014 partially offset by a 2.1% decrease in the average selling price.
Cost of Sales
Cost of sales increased $1,782,193, or 81.5%, in the twelve months ended December 31, 2014 to $3,968,185 as compared to $2,185,992 for the same period of 2013, due to the costs associated with manufacturing additional C. diff assays to meet the increased demand of our product. The negative gross margin decreased from 187.4% in the twelve months ended December 31, 2013 to 147.0% in the twelve months ended December 31, 2014 primarily due to a decrease in the cost of our C. diff assays and increased production that allowed for economies of scale and the allocation of fixed costs over a greater number of units.
Research and Development
Research and development expenses increased $1,264,220, or 37.8%, in the twelve months ended December 31, 2014 to $4,609,913 as compared to $3,345,693 for the same period of 2013. The increase was due to increased salaries and non-cash stock option compensation of $535,938, the increased cost for supply of internal assays and research and development materials of $633,332 and an increase in all other expenses of $94,950.
Selling and Marketing
Selling and marketing expenses decreased $317,291 or 12.1%, in the twelve months ended December 31, 2014 to $2,301,610 as compared to $2,618,901 for the same period of 2013. The decrease was due primarily to a decrease
47
Table of Contents
of $358,109 in costs associated with providing analyzers and assays to potential customers in the evaluation process, a decrease of $122,041 in travel costs, partially offset by an increase in salaries and non-cash stock option compensation of $218,083 along with a decrease in all other expenses of $55,224.
General and Administrative
General and administrative expenses increased $1,061,311, or 56.8%, in the twelve months ended December 31, 2014 to $2,928,186 as compared to $1,886,875 for the same period of 2013. The increase was due to an increase in legal and accounting fees of $828,268, an increase in salaries and non-cash stock option compensation of $252,668 and an increase in insurance of $137,279, partially offset by a decrease in all other expenses of $156,901.
(Gain) Loss on Sale of Assets
We realized a gain the on the sale of assets in the twelve months ended December 31, 2014 due the sale of equipment to an employee. In the same period of 2013 we incurred a loss on the sale of assets due to the sales of our analyzer fixed assets outside the U.S.
Interest Expense
Interest expense increased by $851,731 or 299.6% in the twelve months ended December 31, 2014 to $1,136,054 as compared to $284,323 for the same period of 2013. The increase was related to interest associated with the analyzer sale-leaseback agreements and associated letters of credit and interest on the related party notes payable.
Interest Income
Interest income increased by $700 or 10.7% in the twelve months ended December 31, 2014 as compared to the same period of 2013, due to an increase in our average cash balance during 2014.
Change in fair value of derivative liability
The change in fair value of derivative liability increased by $8,396,169 as a result of the change in the estimated fair value of certain warrants during the twelve months ended December 31, 2014. These warrants contain an exercise price adjustment provision that requires them to be accounted for as a derivative liability. The warrants were granted during 2014 and revalued at December 31, 2014. The change in the fair value of the derivative liability represents the change in the estimated fair value of the warrants from the estimated fair value at their grant date. There were no warrants that were required to be recorded at fair value in 2013.
Liquidity and Capital Resources
We have funded our operations to date primarily with net proceeds from our initial public offering, sales of our preferred stock, convertible notes, and revenues from operations. Since January 2013, we issued the following securities to help fund our operations. All share numbers and prices set forth below have been adjusted to reflect a reverse stock split effective as of September 5, 2014 whereby each two hundred shares of common stock were replaced with one share of stock (with no fractional shares issued). In addition, we have adjusted the number of shares of preferred stock to reflect the number of shares of common stock into which such preferred stock would convert.
| • | Between May 2013 and September 2013, we issued an aggregate principal amount of $2.4 million of 8% Convertible Promissory Notes, or the Series C Senior Secured Notes. All outstanding Series C Senior Secured Notes were converted into 511,043 shares of our Series C convertible preferred stock in November 2013. |
| • | In 2013, we issued an aggregate principal amount of $2 million of 8% Convertible Promissory Notes, or the Series C-1 Senior Secured Notes. All outstanding Series C-1 Senior Secured Notes were converted into 420,135 shares of our Series C-1 convertible preferred stock in November 2013. |
| • | In 2013, we issued an aggregate of 243,902 shares of our Series C Preferred stock for an aggregate price of $1.2 million at a price per share of $4.92. |
48
Table of Contents
| • | In 2014, we issued an aggregate of 74,441 shares of our Series C Preferred stock for an aggregate price of $0.4 million at a price per share of $4.92. |
| • | In 2014, we issued an aggregate principal amount of $0.4 million of 8% Convertible Promissory Notes, or the Series D Notes. All outstanding Series D Notes were converted into 82,625 shares of our Series D convertible preferred stock in July of 2014. |
| • | In July 2014, we issued a promissory note for $500,000 to Spring Forth Investments, LLC, an entity controlled by Mr. Spafford. The note has a maturity date of one year, with a one-year extension option. As additional consideration for the note, we issued Spring Forth Investments, LLC 20,000 Series D Preferred Units. |
| • | From April 2014 to July 2014, we issued an aggregate of 1,510,458 shares of our Series D Preferred Units for a net price of $6.7 million (including the conversion of the $0.4 million of convertible promissory notes described above) at a price per unit of $5.00. The 1,510,458 units consist of 1,510,458 shares of our Series D Preferred stock, 1,510,458 Class A warrants to purchase common stock at a price of $4.92 per share and 1,510,458 Class B warrants to purchase common stock at a price of $0.20 per share. |
| • | In October 2014, in our initial public offering, we issued 1,150,000 units for net proceeds of $6,375,335 at a price per unit of $7.00. The 1,150,000 units consist of 1,150,000 shares of our common stock, and 1,150,000 Series A warrants exercisable at $7.00 per warrant. Each Series A warrant is exercisable for one share of common stock and one Series B warrant. The Series B warrants will only be issued upon the exercise of the Series A warrants. Each Series B warrant is exercisable for one share of common stock at $8.75 per share. |
| • | In February 2015, the Company entered into a loan agreement for $250,000 with Spring Forth Investments, LLC, an entity controlled by Mr. Spafford. The loan bears interest at a rate of twelve percent (12%) per year and has a maturity date of the earlier of (i) 90 days from the date of the loan agreement or (ii) five days after the closing of a registered public offering of securities of the Company. Upon the earlier to occur of the maturity date or the prepayment of the loan, the Company will be obligated to pay a termination fee equal to five percent (5%) of the principal balance of the loan. Payment of the principal balance of the loan plus any accrued interest due and payable may be accelerated upon an event of default by the Company pursuant to the terms and conditions of the loan agreement. |
As of December 31, 2014 and 2013, we had approximately $2.0 million and $1.2 million, respectively, in cash. In order to finance the continued growth in product sales, to invest in further product development and to otherwise satisfy obligations as they mature, we will need to seek additional financing through the issuance of common stock, preferred stock, convertible or non-convertible debt financing. Any additional equity financing, if available to us, may not be available on favorable terms, will most likely be dilutive to our current stockholders, and debt financing, if available, may involve restrictive covenants. If we are unable to access additional funds when needed, we will not be able to continue the development of our molecular diagnostic platform, our diagnostic tests or we could be required to delay, scale back or eliminate some or all of our development programs and other operations. Any of these events could have an adverse impact on our business, financial condition and prospects.
Our independent registered public accounting firm has included an explanatory paragraph relating to our ability to continue as a going concern in its report on our audited financial statements. We may be unable to continue to operate without the threat of liquidation for the foreseeable future unless we raise additional capital.
49
Table of Contents
Summary Statement of Cash Flows for the Years Ended December 31, 2014 and 2013
The following table summarizes our cash flows for the periods indicated:
| Years Ended December 31, |
||||||||
| 2014 | 2013 | |||||||
| Cash used in operating activities |
$ | (11,611,180 | ) | $ | (8,338,797 | ) | ||
| Cash used in investing activities |
$ | (470,493 | ) | $ | (439,382 | ) | ||
| Cash provided by financing activities |
$ | 12,888,073 | $ | 8,846,593 | ||||
|
|
|
|
|
|||||
| Net increase in cash |
$ | 806,400 | $ | 68,414 | ||||
|
|
|
|
|
|||||
Cash Flows from Operating Activities
Cash used in operating activities for 2014 was $11,611,180. The net loss of $21,727,818 was partially offset by non-cash items of $8,396,169 for change in fair value of derivative liability, $1,157,976 for depreciation and amortization, $297,244 of stock-based compensation and $82,817 in other non-cash items. The change in operating assets and liabilities further reduced cash used in operations by $182,432, primarily due to an increase of $823,409 in accounts payable partially offset by a decrease of $217,597 in prepaid and other assets, a decrease of $203,455 in accrued liabilities and a $219,925 increase in inventory and accounts receivables. As of December 31, 2014, 64.6% of accounts receivable was less than 60 days old.
Cash used in operating activities for 2013 was $8,338,797. The net loss of $9,561,280 was partially offset by non-cash items of $854,950 for depreciation and amortization, $111,091 of stock-based compensation and $139,403 of interest expense converted to preferred stock. The change in operating assets and liabilities further added to cash used in operations by $94,271, primarily due to a $473,433 increase in accounts payable and accrued liabilities due to the growth in our operations and the timing of payments offset by a $81,439 increase in accounts receivable as our revenue has increased period over period, a $226,159 increase in inventory, and a $71,564 increase in prepaid and other assets. As of December 31, 2013, 82.0% of accounts receivable was less than 60 days old.
Cash Flows from Investing Activities
Cash used in investing activities was $470,493 for 2014 and is due to $1,757,360 for the cost of the construction of our analyzer equipment and $248,133 of capital expenditures offset by $1,500,000 that was provided from the sale-leaseback of analyzers and $35,000 provided from the sale of assets.
Cash used in investing activities was $439,382 for 2013 and is due to $2,181,563 for the cost of the construction of our analyzer equipment, $595,819 of capital expenditures and $225,000 for the acquisition of intangible assets offset by $2,500,000 that was provided from the sale-leaseback of analyzers and $63,000 provided from the sale of assets.
Cash Flows from Financing Activities
Cash provided by financing activities for 2014 of $12,888,073 was from the proceeds of $6,569,886 from the issuance of preferred stock, proceeds of $6,375,837 from the issuance of units in our initial public offering and proceeds of $1,321,600 in other financing activities offset by $944,606 in payments of capital leases and $434,644 for the payments of notes payables.
Cash provided by financing activities for 2013 of $8,846,593 was from the issuance of $4,577,688 of convertible notes, $1,160,000 from the issuance of preferred stock, $3,288,333 from subscriptions receivable, offset by $144,071 in payments of capital leases and $35,357 for the payments of notes payables.
50
Table of Contents
Critical Accounting Policies and Estimates
The preparation of the financial statements requires us to make assumptions, estimates and judgments that affect the reported amounts of assets and liabilities, the disclosures of contingent assets and liabilities as of the date of the financial statements, and the reported amounts of revenue and expenses during the reporting periods. Certain of our more critical accounting policies require the application of significant judgment by management in selecting the appropriate assumptions for calculating financial estimates. By their nature, these judgments are subject to an inherent degree of uncertainty. On an ongoing basis, we evaluate our judgments, including those related to inventories, receivables, recoverability of long-lived assets and the fair value of our preferred and common stock and related instruments. We use historical experience and other assumptions as the basis for our judgments and making these estimates. Because future events and their effects cannot be determined with precision, actual results could differ significantly from these estimates. Any changes in those estimates will be reflected in our financial statements as they occur. While our significant accounting policies are more fully described in the footnotes to our financial statements included elsewhere in this prospectus, we believe that the following accounting policies and estimates are most critical to a full understanding and evaluation of our reported financial results. The critical accounting policies addressed below reflect our most significant judgments and estimates used in the preparation of our financial statements.
As an emerging growth company, we have elected to opt-in to the extended transition period for new or revised accounting standards. As a result, our financial statements may not be comparable to those of companies that comply with public company effective dates.
Revenue Recognition
We derive our revenue from the sale of single use assays sold through our dedicated sales force in the United States, and through a network of distributors in the European Union and New Zealand. Revenue is recognized when all four of the following criteria are met: (1) persuasive evidence that an arrangement exists; (2) delivery of the products has occurred; (3) the selling price of the product is fixed or determinable; and (4) collectability of that price is reasonably assured. Change in title to the product and recognition of revenue from sales of assays occurs at the time of shipment.
Accounts Receivable and Allowance for Doubtful Accounts
Accounts receivable are generated from the sale of assays to end users in the United States and to a network of distributors outside the United States. These accounts receivable are recorded at the invoiced amount, net of allowances for doubtful amounts. We routinely review outstanding accounts receivable balances for estimated uncollectible accounts and establish or adjust the allowances for doubtful accounts receivable using the specific identification method and records a reserve for amounts not expected to be fully recovered. Actual balances are not applied against the reserve until substantially all collection efforts have been exhausted. We do not have customer acceptance provisions, but we provide our customers a limited right of return for defective assays.
Inventories
Inventories are stated at the lower of cost or market with cost determined according to the average cost method. Manufactured inventory consists of raw material, direct labor and manufacturing overhead cost components. We review the components of our inventory on a regular basis for excess and obsolete inventory and make appropriate adjustments when necessary. We have made adjustments to, and it is reasonably possible that we may be required to make further adjustments to, the carrying value of inventory in future periods.
Long-Lived Assets
Long-lived tangible assets, including property and equipment, and definite-lived intangible assets, are reviewed for impairment whenever events or changes in circumstances indicate that the carrying value of the asset may not
51
Table of Contents
be recoverable. We regularly evaluate whether events or circumstances have occurred that indicate possible impairment and rely on a number of factors, including expected future operating results, business plans, economic projections, and anticipated future cash flows. We use an estimate of the future undiscounted net cash flows and comparisons to like-kind assets, as appropriate, of the related asset over the remaining life in measuring whether the assets are recoverable. Measurement of the amount of impairment, if any, is based upon the difference between the asset’s carrying value and estimated fair value. Fair value is determined through various valuation techniques, including cost-based, market and income approaches as considered necessary. We amortize intangible assets on a straight-line basis over their estimated useful lives.
Our long-lived assets include our analyzers used by hospitals in the United States to run the assays they buy from us. There are no contractual terms with respect to the usage of our analyzers by our customers. Hospitals are under no contractual commitment to use our analyzers. We maintain ownership of these analyzers and, when requested, we can remove the analyzers from the customer’s site. We do not currently charge for the use of our analyzers and there are no minimum purchase commitments of our assays. As our analyzer is used numerous times over several years, often by many different customers, analyzers are capitalized as property and equipment once they have been placed in service. Once placed in service, analyzers are carried at cost, less accumulated depreciation. Depreciation is computed using the straight-line method based on average estimated useful lives. The estimated useful life of our analyzers is determined based on a variety of factors including in reference to associated product life cycles, and average 5 years. As analyzers are integral to the performance of our diagnostic test, depreciation of analyzers is recognized as a cost of sales. Analyzer depreciation expense was $486,476 and $754,970 for the years ended December 31, 2013 and 2014.
Analyzers used outside the United States are sold to the customer and the sale is accounted for as a sale of fixed assets. Since inception, the Company has not focused nor placed significant emphasis on developing international markets for the Company’s product. The Company has never had an international sales force and has never manufactured analyzers specifically for international markets. Over the past two years on occasion, small, international sales opportunities have come along through international distributors. The analyzers that were sold to them were part of the fixed asset pool of analyzers the Company has, and many of these specific analyzers had been previously placed at customer locations within the United States. In 2013, these opportunities represented 5% of the total analyzers built. For the year ended December 31, 2014 these opportunities represented 4% of the total analyzers built during this period. Sale of the fixed asset analyzers in these limited international opportunities have not been based on established product price listings as no such listing exists or has been publicly marketed to customers; instead, the final sales price has been a negotiated amount based on the sale of a functioning fixed asset analyzer, whether or not that analyzer was previously used at another customer site. Similar to other fixed asset sales, there were no stated or implied warranties or other continuing service requirements made with the sale of these assets. For these limited situations, management has elected to sell the fixed asset analyzers as opposed to placing them with international customers (thereby not retaining title over the analyzers) as it would be impractical for us to retain ownership due to, among other reasons, the Company lacking the necessary personnel needed to service international customers, the need to comply with the additional laws and regulations of countries outside the United States to which the Company is not currently subject, and the added costs to recover, reconfigure, ship and redeploy fixed asset analyzers that have been used internationally.
Income Taxes
We are required to determine the aggregate amount of income tax expense or loss based upon tax statutes in jurisdictions in which we conduct business. In making these estimates, we adjust our results determined in accordance with generally accepted accounting principles for items that are treated differently by the applicable taxing authorities. Deferred tax assets and liabilities resulting from these differences are reflected on our balance sheet for temporary differences in loss and credit carryforwards that will reverse in subsequent years. We also establish a valuation allowance against deferred tax assets when it is more likely than not that some or all of the deferred tax assets will not be realized. Valuation allowances are based, in part, on predictions that management
52
Table of Contents
must make as to our results in future periods. The outcome of events could differ over time which would require that we make changes in our valuation allowance.
The tax effects from an uncertain tax position can be recognized in the financial statements only if the position is more likely than not of being sustained if the position were to be challenged by a taxing authority. We examined the tax positions taken in tax returns and determined that there are no uncertain tax positions. As a result, we recorded no uncertain tax liabilities in our balance sheet.
Stock Based Compensation
We measure and recognize compensation expense for stock options granted to our employees and directors, based on the estimated fair value of the award on the grant date. Historically, for all periods prior to our initial public offering, the fair values of the shares of common stock underlying our stock-based awards were estimated on each grant date by our board of directors. In order to determine the fair value of our common stock underlying option grants, our board of directors considered, among other things, contemporaneous valuations of our common stock prepared by an unrelated third-party valuation firm in accordance with the guidance provided by the Statements of Standards for Valuation Services No. 1 of the American Institute of Certified Public Accountants.
We use the Black-Scholes valuation model to estimate the fair value of stock option awards. The fair value is recognized as expense, net of estimated forfeitures, over the requisite service period, which is generally the vesting period of the respective award on a straight-line basis. Given the absence of a public trading market of our common stock, our board of directors exercised reasonable judgment and considered a number of objective and subjective factors to determine the best estimate of the fair value of our common stock, including:
| • | contemporaneous valuations of our common stock performed by unrelated third-party valuation firm; |
| • | our stage of development; |
| • | our operational and financial performance; |
| • | the nature of our services and our competitive position in the marketplace; |
| • | the value of companies that we consider peers based on a number of factors, including similarity to us with respect to industry and business model; |
| • | the likelihood of achieving a liquidity event, such as an initial public offering or sale given prevailing market conditions, and the nature and history of our business; |
| • | issuances of preferred stock and the rights, preferences and privileges of our preferred stock relative to those of our common stock; |
| • | business conditions and projections; |
| • | the history of our company and progress of our research and development efforts and clinical trials; and |
| • | the lack of marketability of our common stock. |
Subsequent to the completion of our initial public offering, our board of directors determines the fair value of each share of underlying common stock based on the closing price of our common stock as reported by the NASDAQ Capital Market on the date of grant.
Jumpstart Our Business Startups Act of 2012
On April 5, 2012, the Jumpstart Our Business Startups Act of 2012, or JOBS Act, was enacted. Section 107 of the JOBS Act, provides that an “emerging growth company” can take advantage of the extended transition period provided in Section 7(a)(2)(B) of the Securities Act of 1933, as amended, for complying with new or revised
53
Table of Contents
accounting standards. In other words, an emerging growth company can delay the adoption of certain accounting standards until those standards would otherwise apply to private companies. Presently, we are an emerging growth company as defined in Section 2(a) of the Securities Act. We are electing to delay such adoption of new or revised accounting standards, and as a result, we may not comply with new or revised accounting standards on the relevant dates on which adoption of such standards is required for non-emerging growth companies. As a result of this election, our financial statements may not be comparable to the financial statements of other public companies. We may take advantage of these reporting exemptions until we are no longer an emerging growth company.
We are in the process of evaluating the benefits of relying on other exemptions and reduced reporting requirements provided by the JOBS Act. Subject to certain conditions set forth in the JOBS Act, as an emerging growth company, we intend to rely on certain of these exemptions, including without limitation, (1) providing an auditor’s attestation report on our system of internal controls over financial reporting pursuant to Section 404(b) of the Sarbanes-Oxley Act and (2) complying with any requirement that may be adopted by the Public Company Accounting Oversight Board regarding mandatory audit firm rotation or a supplement to the auditor’s report providing additional information about the audit and the financial statements, known as the auditor discussion and analysis. We may be able to remain an “emerging growth company” until the earliest of (a) the last day of the fiscal year in which we have total annual gross revenues of $1 billion or more, (b) the last day of our fiscal year following the fifth anniversary of the date of the completion of our initial public offering, (c) the date on which we have issued more than $1 billion in non-convertible debt during the previous three years or (d) the date on which we are deemed to be a large accelerated filer under the rules of the SEC.
Controls and Procedures
Internal control over financial reporting is a process designed to provide reasonable assurance regarding the reliability of financial reporting and the preparation of financial statements in accordance with U.S. GAAP. Our independent public registered accounting firm will not be required to attest to the effectiveness of our internal control over financial reporting until the first year we are no longer an “emerging growth company”. We have identified a material weakness in our internal control over financial reporting relating to the processes and controls to properly identify and account for transactions of a complex or non-routine nature. We are currently in the process of reviewing, documenting and testing our internal control over financial reporting. Although remediation efforts are still in progress, management is taking steps to address the causes of our audit adjustments and to improve our internal control over financial reporting, including the implementation of new accounting processes and control procedures and the identification of gaps in our skills base and expertise of the staff required to meet the financial reporting requirements of a public company. For example, in October of 2013 we hired accounting consultants to provide the necessary staffing and we intend to continue to work with these consultants as we hire qualified permanent employees. We have not performed an evaluation of our internal control over financial reporting, such as required by Section 404 of the Sarbanes-Oxley Act, nor have we engaged an independent registered public accounting firm to perform an audit of our internal control over financial reporting as of any balance sheet date or for any period reported in our financial statements.
ITEM 7A. QUANTITATIVE AND QUALITATIVE DISCLOSURES ABOUT MARKET RISK.
As a smaller reporting company, we have elected not to provide the disclosure required by this item.
ITEM 8. FINANCIAL STATEMENTS AND SUPPLEMENTARY DATA.
Our financial statements required by this item are set forth immediately following the signature page to this annual report on Form 10-K beginning on page F-1 and are incorporated herein by reference.
54
Table of Contents
ITEM 9. CHANGES IN AND DISAGREEMENTS WITH ACCOUNTANTS ON ACCOUNTING AND FINANCIAL DISCLOSURES.
None.
ITEM 9A. CONTROLS AND PROCEDURES.
(a) Disclosure Controls and Procedures
We maintain a set of disclosure controls and procedures (as defined in Rule 13a-15(e) of the Exchange Act) designed to ensure that information required to be disclosed in reports filed or submitted under the Exchange Act is recorded, processed, summarized, and reported within the time periods specified in rules and forms adopted by the SEC.
In accordance with Rule 13a-15(b) of the Exchange Act, as of the end of the period covered by this annual report on Form 10-K, an evaluation was carried out under the supervision and with the participation of our management, including our Chief Executive Officer and Chief Financial Officer, to assess the effectiveness of our disclosure controls and procedures. As of the end of the period covered by this annual report on Form 10-K our disclosure controls and procedures were effective to provide reasonable assurance that information required to be disclosed by us in reports that we file or submit under the Exchange Act is recorded, processed, summarized and reported within the time periods specified in the SEC’s rules and forms and is accumulated and communicated to our management, including the Chief Executive Officer and Chief Financial Officer, as appropriate to allow timely decisions regarding required disclosure.
(b) Management’s Report on Internal Control over Financial Reporting and Attestation Report of Registered Public Accounting Firm
This annual report on Form 10-K does not include a report of management’s assessment regarding internal control over financial reporting or an attestation report of our registered public accounting firm due to a transition period established by rules of the SEC applicable to newly public companies.
(c) Changes in Internal Control Over Financial Reporting
We are currently in the process of reviewing, documenting and testing our internal control over financial reporting. Although remediation efforts are still in progress, management is taking steps to address the causes of our audit adjustments and to improve our internal control over financial reporting, including the implementation of new accounting processes and control procedures and the identification of gaps in our skills base and expertise of the staff required to meet the financial reporting requirements of a public company. For example, in October of 2013 we hired accounting consultants to provide the necessary staffing and we intend to continue to work with these consultants as we hire qualified permanent employees.
On February 12, 2015, the Company entered into a loan agreement for $250,000 with Spring Forth Investments, LLC, an entity controlled by Mr. Spafford. The loan bears interest at a rate of twelve percent (12%) per year and has a maturity date of the earlier of (i) 90 days from the date of the loan agreement, or (ii) five days after the closing of a registered public offering of securities of the Company. Upon the earlier to occur of the maturity date or the prepayment of the loan, the Company will be obligated to pay a termination fee equal to five percent (5%) of the principal balance of the loan. Payment of the principal balance of the loan plus any accrued interest due and payable may be accelerated upon an event of default by the Company pursuant to the terms and conditions of the loan agreement.
55
Table of Contents
PART III
ITEM 10. DIRECTORS, EXECUTIVE OFFICERS AND CORPORATE GOVERNANCE.
The information required by this item will be included in our definitive proxy statement to be filed pursuant to Regulation 14A within 120 days after our year ended December 31, 2014 in connection with our 2015 Annual Meeting of Stockholders, or the 2015 Proxy Statement, and is incorporated herein by reference.
ITEM 11. EXECUTIVE COMPENSATION.
The information required by this item will be included in the 2015 Proxy Statement and is incorporated herein by reference.
ITEM 12. SECURITY OWNERSHIP OF CERTAIN BENEFICIAL OWNERS AND MANAGEMENT AND RELATED STOCKHOLDER MATTERS.
The information required by this item will be included in the 2015 Proxy Statement and is incorporated herein by reference.
ITEM 13. CERTAIN RELATIONSHIPS AND RELATED TRANSACTIONS, AND DIRECTOR INDEPENDENCE.
The information required by this item will be included in the 2015 Proxy Statement and is incorporated herein by reference.
ITEM 14. PRINCIPAL ACCOUNTING FEES AND SERVICES.
The information required by this item will be included in the 2015 Proxy Statement and is incorporated herein by reference.
56
Table of Contents
PART IV
| ITEM 15. | EXHIBITS, FINANCIAL STATEMENT SCHEDULES. |
| (a) | Financial Statements: |
See “Index to Financial Statements” set forth on page F-1.
| (b) | Financial Statement Schedules: |
All schedules for which provision is made in the applicable accounting requirements of the Securities and Exchange Commission are not required or the required information has been included within the financial statements or the notes thereto.
| (c) | Exhibits: |
The list of exhibits in the Exhibit Index to this annual report on Form 10-K is incorporated herein by reference.
EXHIBIT INDEX
| Exhibit No. | Description | |
| 3.1 | Seventh Amended and Restated Certificate of Incorporation of Great Basin Scientific, Inc. (2) | |
| 3.2 | Amended and Restated Bylaws of Great Basin Scientific, Inc. (2) | |
| 4.1 | Specimen certificate evidencing shares of common stock. (2) | |
| 10.1 | Master Lease Agreement by and between Onset Financial, Inc. and Great Basin, dated as of October 16, 2013 (“Onset Lease Agreement”). (1) | |
| 10.2 | Schedule 001 for Onset Lease Agreement dated October 16, 2013, as amended by that certain amendment dated December 10, 2013 and associated (i) Acceptance and Delivery Certificate, (ii) Bill of Sale and (iii) Sale and Leaseback Agreement. (1) | |
| 10.3 | Schedule 002 for Onset Lease Agreement dated March 14, 2014, as amended by that certain amendment dated March 18, 2014 and associated (i) Acceptance and Delivery Certificate, (ii) Bill of Sale and (iii) Sale and Leaseback Agreement. (1) | |
| 10.4 | Financial Advisory Agency Agreement by and between Great Basin and Rona Capital, LLC, dated as of April 15, 2014 (Series D Compensation). (1) | |
| 10.5 | Financial Advisory Agency Agreement by and between Great Basin and Rona Capital, LLC, dated as of April 15, 2014 (IPO Compensation). (1) | |
| 10.6# | Great Basin 2006 Stock Option Plan and forms used in connection therewith. (1) | |
| 10.7# | Great Basin 2014 Stock Option Plan and forms used in connection therewith. (1) | |
| 10.8# | Great Basin Scientific, Inc. 2014 Omnibus Incentive Plan. (2) | |
| 10.9# | Form of Stock Option Agreement. (2) | |
| 10.10 | Letter of Appointment Regarding Appointment of David Spafford as Executive Chairman. (3) | |
| 10.11 | Amended and Restated Series D Preferred Stock and Warrant Purchase Agreement dated July 30, 2014 (the “Series D Purchase Agreement”). (1) | |
57
Table of Contents
| Exhibit No. | Description | |
| 10.12 | Form of Class A Warrant to Purchase Common Stock issued to investors pursuant to the Series D Purchase Agreement. (1) | |
| 10.13 | Form of Class B Warrant to Purchase Common Stock issued to investors pursuant to Series D Purchase Agreement. (1) | |
| 10.14@ | License and Supply Agreement by and between Biohelix Corporation and Great Basin, effective as of January 9, 2009, as amended by (i) that First Amendment dated June 25, 2010, and (ii) that Second Amendment dated January 18, 2011. (1) | |
| 10.15@ | License Agreement by and between Integrated DNA Technologies, Inc. and Great Basin, effective as of August 5, 2010, as amended by (i) that First Amendment dated February 21, 2012, (ii) that Second Amendment dated October 17, 2012, (iii) that Third Amendment dated February 21, 2013 and (iv) that Fourth Amendment dated March 19, 2014. (1) | |
| 10.16 | Reimbursement Agreement dated as of October 30, 2013 by and between Great Basin and Utah Autism Foundation. (1) | |
| 10.17 | Reimbursement Agreement dated as of March 21, 2014 by and between Great Basin and Utah Autism Foundation. (1) | |
| 10.18 | Reimbursement Agreement dated as of October 30, 2013 by and between Great Basin and Spring Forth Investments, LLC. (1) | |
| 10.19 | Security Agreement dated as of October 30, 2013 by and between Great Basin and Utah Autism Foundation. (1) | |
| 10.20 | Security Agreement dated as of March 21, 2014 by and between Great Basin and Utah Autism Foundation. (1) | |
| 10.21 | Security Agreement dated as of October 30, 2013 by and between Great Basin and Spring Forth Investments, LLC. (1) | |
| 10.22# | Employment Agreement with Ryan Ashton. (2) | |
| 10.23# | Employment Agreement with Jeffrey A. Rona. (2) | |
| 10.24# | Employment Agreement with Robert Jenison. (2) | |
| 10.25 | Lease Agreement between JTM, Inc. and Great Basin, dated April 26, 2010, as amended by that Certain amendment dated July 1, 2012 (South Side Lease). (1) | |
| 10.26 | Lease Agreement between JTM, Inc. and Great Basin, dated September 6, 2012 (North Side Lease). (1) | |
| 10.27 | Loan and Issuance Agreement by and between Great Basin and Spring Forth Investments, LLC, dated July 18, 2014. (1) | |
| 10.28 | Promissory Note dated July 18, 2014 in favor of Spring Forth Investments, LLC. (1) | |
| 10.29 | Form of Warrant to Purchase Common Stock. (4) | |
| 10.30 | Form of Warrant to Purchase Common Stock or Preferred Stock. (4) | |
| 10.31 | Form of Warrant to Purchase Common Stock. (4) | |
| 10.32 | Form of Series A Warrant. (3) | |
| 10.33 | Form of Series B Warrant. (3) | |
| 10.34 | Form of Representative’s Warrant issued in connection with the Registrant’s initial public offering. (3) | |
58
Table of Contents
| Exhibit No. | Description | |
| 10.35 | Amended and Restated Voting Agreement dated as of July 30, 2014. (1) | |
| 10.36 | Third Amended and Restated Investor Rights Agreement dated as of April 21, 2014. (1) | |
| 10.37 | Loan Agreement between Great Basin and Spring Forth Investments, LLC, dated February 12, 2015. (5) | |
| 31.1* | Certification of Principal Executive Officer Pursuant to Rules 13a-14(a) and 15d-14(a) under the Securities Exchange Act of 1934, as Adopted Pursuant to Section 302 of the Sarbanes-Oxley Act of 2002. | |
| 31.2* | Certification of Principal Financial Officer Pursuant to Rules 13a-14(a) and 15d-14(a) under the Securities Exchange Act of 1934, as Adopted Pursuant to Section 302 of the Sarbanes-Oxley Act of 2002. | |
| 32.1* | Certification of Principal Executive Officer Pursuant to 18 U.S.C. Section 1350, as Adopted Pursuant to Section 906 of the Sarbanes-Oxley Act of 2002. | |
| 32.2* | Certification of Principal Financial Officer Pursuant to 18 U.S.C. Section 1350, as Adopted Pursuant to Section 906 of the Sarbanes-Oxley Act of 2002. | |
| 101.INS** | XBRL Instance Document | |
| 101.SCH** | XBRL Taxonomy Extension Schema Linkbase Document | |
| 101.CAL** | XBRL Taxonomy Extension Calculation Linkbase Document | |
| 101.DEF** | XBRL Taxonomy Extension Definition Linkbase Document | |
| 101.LAB** | XBRL Taxonomy Extension Label Linkbase Document | |
| 101.PRE** | XBRL Taxonomy Extension Presentation Linkbase Document | |
| * | Filed herewith. |
| ** | XBRL (Extensible Business Reporting Language) information is furnished and not filed or a part of a registration statement or prospectus for purposes of Sections 11 or 12 of the Securities Act of 1933, as amended, is deemed not filed for purposes of Section 18 of the Securities Exchange Act of 1934, as amended, and otherwise is not subject to liability under these sections. |
| @ | Portions of this exhibit (indicated by asterisks) have been omitted pursuant to a grant of confidential treatment from the SEC. |
| # | Management contract or compensatory plan or arrangement. |
| (1) | Filed as an exhibit to Amendment No. 1 to the Company’s Registration Statement on Form S-1 (File No. 333-197954) filed with the SEC on August 20, 2014, and incorporated herein by reference. |
| (2) | Filed as an exhibit to Amendment No. 2 to the Company’s Registration Statement on Form S-1 (File No. 333-197954) filed with the SEC on September 8, 2014, and incorporated herein by reference. |
| (3) | Filed as an exhibit to Amendment No. 3 to the Company’s Registration Statement on Form S-1 (File No. 333-197954) filed with the SEC on September 23, 2014, and incorporated herein by reference. |
| (4) | Filed as an exhibit to Amendment No. 4 to the Company’s Registration Statement on Form S-1 (File No. 333-197954) filed with the SEC on September 24, 2014, and incorporated herein by reference. |
| (5) | Filed as an exhibit to Amendment No. 1 to the Company’s Registration Statement of Form S-1 (File No. 333-201596) filed with the SEC on February 18, 2015 and incorporated herein by reference. |
59
Table of Contents
Pursuant to the requirements of Section 13 or 15(d) of the Securities Exchange Act of 1934, as amended, the Registrant has duly caused this Report to be signed on its behalf by the undersigned, thereunto duly authorized.
| Great Basin Scientific, Inc. | ||||||
| Date: February 18, 2015 | By: | /s/ Ryan Ashton | ||||
| Ryan Ashton | ||||||
| President, Chief Executive Officer, Director (Principal Executive Officer) | ||||||
| Date: February 18, 2015 | By: | /s/ Jeffrey A. Rona | ||||
| Jeffrey A. Rona | ||||||
| Chief Financial Officer (Principal Financial and Accounting Officer) | ||||||
Pursuant to the requirements of the Securities Exchange Act of 1934, as amended, this Report has been signed below by the following persons on behalf of the Registrant in the capacities and on the dates indicated.
| Name |
Title |
Date | ||
| /s/ David Spafford David Spafford |
Director and Executive Chairman |
February 18, 2015 | ||
| /s/ Stephen C. Aldous Stephen C. Aldous |
Director |
February 18, 2015 | ||
| /s/ Ronald K. Labrum Ronald K. Labrum |
Director |
February 18, 2015 | ||
| /s/ Sam Chawla Sam Chawla |
Director |
February 18, 2015 | ||
| /s/ Ryan Ashton Ryan Ashton |
President, Chief Executive Officer, Director (Principal Executive Officer) |
February 18, 2015 | ||
| /s/ Jeffrey A. Rona Jeffrey A. Rona |
Chief Financial Officer (Principal Financial and Accounting Officer) |
February 18, 2015 | ||
60
Table of Contents
| Great Basin Scientific, Inc. Audited Financial Statements: |
||||
| F-2 | ||||
| F-3 | ||||
| Statements of Operations for the Years Ended December 31, 2014 and 2013 |
F-4 | |||
| Statements of Stockholders’ Deficit for the Years Ended December 31, 2014 and 2013 |
F-5 | |||
| Statements of Cash Flows for the Years Ended December 31, 2014 and 2013 |
F-6 | |||
| F-7 | ||||
F-1
Table of Contents

REPORT OF INDEPENDENT REGISTERED PUBLIC ACCOUNTING FIRM
The Board of Directors and Shareholders
Great Basin Scientific, Inc.
Salt Lake City, UT
We have audited the accompanying balance sheets of Great Basin Scientific, Inc. (the “Company”) as of December 31, 2014 and 2013, and the related statements of operations, stockholders’ deficit, and cash flows for the years then ended. These financial statements are the responsibility of the Company’s management. Our responsibility is to express an opinion on these financial statements based on our audits.
We conducted our audits in accordance with the standards of the Public Company Accounting Oversight Board (United States). Those standards require that we plan and perform an audit to obtain reasonable assurance about whether the financial statements are free of material misstatement. The Company has determined that it is not required to have, nor were we engaged to perform, an audit of its internal control over financial reporting. Our audits included consideration of internal control over financial reporting as a basis for designing audit procedures that are appropriate in the circumstances, but not for the purposes of expressing an opinion on the effectiveness of the Company’s internal controls over financial reporting. Accordingly, we express no such opinion. An audit includes examining, on a test basis, evidence supporting the amounts and disclosures in the financial statements, assessing the accounting principles used and significant estimates made by management, as well as evaluating the overall financial statement presentation. We believe that our audits provide a reasonable basis for our opinion.
In our opinion, the financial statements referred to above present fairly, in all material respects, the financial position of Great Basin Scientific, Inc. as of December 31, 2014 and 2013, and the results of its operations and cash flows for the years then ended, in conformity with accounting principles generally accepted in the United States of America.
The accompanying financial statements have been prepared assuming that the Company will continue as a going concern. As discussed in Note 3 to the financial statements, the Company has incurred substantial losses from operations causing negative working capital and negative operating cash flows. These issues raise substantial doubt about its ability to continue as a going concern. Management’s plans in regard to these matters are also described in Note 3. The financial statements do not include any adjustments that might result from the outcome of this uncertainty.
/s/ Mantyla McReynolds, LLC
Mantyla McReynolds, LLC
Salt Lake City, Utah
February 18, 2015
F-2
Table of Contents
GREAT BASIN SCIENTIFIC, INC.
| December 31, | ||||||||
| 2014 | 2013 | |||||||
| Assets | ||||||||
| Current assets: |
||||||||
| Cash |
$ | 2,017,823 | $ | 1,211,423 | ||||
| Accounts receivable, net |
267,485 | 184,415 | ||||||
| Inventory |
457,094 | 320,239 | ||||||
| Prepaid and other current assets |
376,778 | 94,421 | ||||||
|
|
|
|
|
|||||
| Total current assets |
3,119,180 | 1,810,498 | ||||||
| Intangible assets, net |
216,580 | 334,025 | ||||||
| Property and equipment, net |
4,237,467 | 3,703,582 | ||||||
|
|
|
|
|
|||||
| Total assets |
$ | 7,573,227 | $ | 5,848,105 | ||||
|
|
|
|
|
|||||
| Liabilities and Stockholders’ Deficit | ||||||||
| Current liabilities: |
||||||||
| Accounts payable |
$ | 1,369,169 | $ | 874,119 | ||||
| Accrued expenses |
612,359 | 815,814 | ||||||
| Current portion of notes payable |
49,994 | 44,601 | ||||||
| Notes payable—related party, net of discount of $58,333 |
441,667 | — | ||||||
| Current portion of capital lease obligations |
947,422 | 506,506 | ||||||
|
|
|
|
|
|||||
| Total current liabilities |
3,420,611 | 2,241,040 | ||||||
| Notes payable, net of current portion |
5,693 | 55,730 | ||||||
| Capital lease obligations, net of current portion |
2,156,837 | 2,042,359 | ||||||
| Derivative liability |
9,998,636 | — | ||||||
|
|
|
|
|
|||||
| Total liabilities |
15,581,777 | 4,339,129 | ||||||
|
|
|
|
|
|||||
| Commitments and contingencies |
||||||||
| Convertible preferred stock: |
||||||||
| Series A convertible preferred stock, par value $.001; 0 and 125,000,000 shares authorized; 0 and 117,131,171 shares issued and outstanding, respectively |
— | 18,846,539 | ||||||
| Series B convertible preferred stock, par value $.001; 0 and 100,000,000 shares authorized; 0 and 59,465,350 shares issued and outstanding, respectively |
— | 9,464,454 | ||||||
| Series C convertible preferred stock, par value $.001; 0 and 210,000,000 shares authorized; 0 and 150,989,224 shares issued and outstanding, respectively |
— | 3,674,335 | ||||||
| Series C-1 convertible preferred stock, par value $.001; 0 and 100,000,000 shares authorized; 0 and 84,027,175 shares issued and outstanding, respectively |
— | 2,067,068 | ||||||
| Series D convertible preferred stock, par value $.001; 0 shares authorized 0 shares issued and outstanding |
— | — | ||||||
| Stockholders’ deficit: |
||||||||
| Preferred stock, $.001 par value, 5,000,000 and 0 shares authorized, 0 shares issued and outstanding |
— | — | ||||||
| Common stock, $.001 par value: 50,000,000 and 700,000,000 shares authorized; 5,086,458 and 115,510 shares issued and outstanding, respectively |
5,086 | 116 | ||||||
| Additional paid-in capital |
55,991,060 | 9,733,342 | ||||||
| Accumulated deficit |
(64,004,696 | ) | (42,276,878 | ) | ||||
|
|
|
|
|
|||||
| Total stockholders’ deficit |
(8,008,550 | ) | (32,543,420 | ) | ||||
|
|
|
|
|
|||||
| Total liabilities, convertible preferred stock and stockholders’ deficit |
$ | 7,573,227 | $ | 5,848,105 | ||||
|
|
|
|
|
|||||
The accompanying notes are an integral part of these financial statements
F-3
Table of Contents
GREAT BASIN SCIENTIFIC, INC.
| Years ended December 31, | ||||||||
| 2014 | 2013 | |||||||
| Revenues |
$ | 1,606,254 | $ | 760,646 | ||||
| Cost of sales |
3,968,185 | 2,185,992 | ||||||
|
|
|
|
|
|||||
| Gross loss |
(2,361,931 | ) | (1,425,346 | ) | ||||
| Operating expenses: |
||||||||
| Research and development |
4,609,913 | 3,345,693 | ||||||
| Selling and marketing |
2,301,610 | 2,618,901 | ||||||
| General and administrative |
2,928,186 | 1,866,875 | ||||||
| (Gain) loss on sale of assets |
(8,166 | ) | 22,768 | |||||
|
|
|
|
|
|||||
| Total operating expenses |
9,831,543 | 7,854,237 | ||||||
|
|
|
|
|
|||||
| Loss from operations |
(12,193,474 | ) | (9,279,583 | ) | ||||
|
|
|
|
|
|||||
| Other income (expense): |
||||||||
| Interest expense |
(1,136,054 | ) | (284,323 | ) | ||||
| Interest income |
3,176 | 3,876 | ||||||
| Change in fair value of derivative liability |
(8,396,169 | ) | — | |||||
|
|
|
|
|
|||||
| Total other income (expense) |
(9,529,047 | ) | (280,447 | ) | ||||
|
|
|
|
|
|||||
| Loss before provision for income taxes |
(21,722,521 | ) | (9,560,030 | ) | ||||
| Provision for income taxes |
(5,297 | ) | (1,250 | ) | ||||
|
|
|
|
|
|||||
| Net loss |
(21,727,818 | ) | (9,561,280 | ) | ||||
| Less: Cumulative preferred stock dividends (undeclared) |
— | (2,533,470 | ) | |||||
|
|
|
|
|
|||||
| Net loss attributable to common stockholders |
$ | (21,727,818 | ) | $ | (12,094,750 | ) | ||
|
|
|
|
|
|||||
| Net loss per common share—basic and diluted |
$ | (17.32 | ) | $ | (104.71 | ) | ||
|
|
|
|
|
|||||
| Weighted average common shares—basic and diluted |
1,254,142 | 115,510 | ||||||
|
|
|
|
|
|||||
The accompanying notes are an integral part of these financial statements
F-4
Table of Contents
GREAT BASIN SCIENTIFIC, INC.
STATEMENTS OF STOCKHOLDERS’ DEFICIT
For the Years Ended December 31, 2013 and 2014
| Common Stock | Additional Paid-In Capital |
Accumulated Deficit |
Total Stockholders’ Deficit |
|||||||||||||||||
| Shares | Par Value | |||||||||||||||||||
| Balance—December 31, 2012 |
115,510 | $ | 116 | $ | 9,622,251 | $ | (32,715,598 | ) | $ | (23,093,231 | ) | |||||||||
|
|
|
|
|
|
|
|
|
|
|
|||||||||||
| Employee stock option expense |
— | — | 111,091 | — | 111,091 | |||||||||||||||
| Net loss for the year |
— | — | — | (9,561,280 | ) | (9,561,280 | ) | |||||||||||||
|
|
|
|
|
|
|
|
|
|
|
|||||||||||
| Balance—December 31, 2013 |
115,510 | $ | 116 | $ | 9,733,342 | $ | (42,276,878 | ) | (32,543,420 | ) | ||||||||||
|
|
|
|
|
|
|
|
|
|
|
|||||||||||
| Issuance of common stock and warrants, net |
1,150,000 | 1,150 | 6,374,687 | — | 6,375,837 | |||||||||||||||
| Exercise of common stock warrants |
158,000 | 158 | 31,442 | — | 31,600 | |||||||||||||||
| Employee stock option expense |
— | — | 297,244 | — | 280,958 | |||||||||||||||
| Conversion of preferred stock into common stock |
3,662,948 | 3,662 | 41,131,749 | — | 41,135,411 | |||||||||||||||
| Derivative liability on warrants issued and exercised |
— | — | (1,602,467 | ) | — | (1,602,467 | ) | |||||||||||||
| Modification of warrants |
— | — | 25,063 | — | 25,063 | |||||||||||||||
| Net loss for the year |
— | — | — | (21,727,818 | ) | (21,727,818 | ) | |||||||||||||
|
|
|
|
|
|
|
|
|
|
|
|||||||||||
| Balance—December 31, 2014 |
5,086,458 | $ | 5,086 | $ | 55,991,060 | $ | (64,004,696 | ) | $ | (8,008,550 | ) | |||||||||
|
|
|
|
|
|
|
|
|
|
|
|||||||||||
The accompanying notes are an integral part of these financial statements
F-5
Table of Contents
GREAT BASIN SCIENTIFIC, INC.
| Years ended December 31, | ||||||||
| 2014 | 2013 | |||||||
| Cash flows from operating activities: |
||||||||
| Net loss |
$ | (21,727,818 | ) | $ | (9,561,280 | ) | ||
| Adjustments to reconcile net loss to net cash used in operating activities: |
||||||||
| Depreciation and amortization |
1,157,976 | 854,950 | ||||||
| Change in fair value measurement |
8,396,169 | — | ||||||
| (Gain) loss on sale of assets |
(8,166 | ) | 22,768 | |||||
| Interest converted to preferred stock |
13,129 | 139,403 | ||||||
| Employee stock compensation |
297,244 | 111,091 | ||||||
| Warrant issuance and modifications |
25,063 | — | ||||||
| Debt discount amortization |
41,667 | — | ||||||
| Asset disposal |
11,124 | — | ||||||
| Changes in operating assets and liabilities: |
||||||||
| Increase in accounts receivable, net |
(83,070 | ) | (81,439 | ) | ||||
| Increase in inventory |
(136,855 | ) | (226,159 | ) | ||||
| Increase in prepaid and other assets |
(217,597 | ) | (71,564 | ) | ||||
| Increase in accounts payable |
823,409 | 149,873 | ||||||
| Increase (decrease) in accrued liabilities |
(203,455 | ) | 323,560 | |||||
|
|
|
|
|
|||||
| Net cash used in operating activities |
(11,611,180 | ) | (8,338,797 | ) | ||||
|
|
|
|
|
|||||
| Cash flows from investing activities: |
||||||||
| Acquisition of property and equipment |
(248,133 | ) | (595,819 | ) | ||||
| Acquisition of intangible asset |
— | (225,000 | ) | |||||
| Construction of equipment |
(1,757,360 | ) | (2,181,563 | ) | ||||
| Proceeds from sale of assets |
35,000 | 63,000 | ||||||
| Proceeds from sale leaseback |
1,500,000 | 2,500,000 | ||||||
|
|
|
|
|
|||||
| Net cash used in investing activities |
(470,493 | ) | (439,382 | ) | ||||
|
|
|
|
|
|||||
| Cash flows from financing activities: |
||||||||
| Net proceeds from issuance of common stock |
6,375,837 | — | ||||||
| Proceeds from exercise of warrants |
31,600 | — | ||||||
| Proceeds from issuance of convertible notes payable |
100,000 | 4,577,688 | ||||||
| Proceeds from issuance of convertible notes payable—related party |
300,000 | — | ||||||
| Net proceeds from issuance of preferred stock |
6,569,886 | 1,160,000 | ||||||
| Proceeds from issuance of notes payable—related party |
890,000 | — | ||||||
| Proceeds from subscriptions receivable |
— | 3,288,333 | ||||||
| Principal payments of capital leases |
(944,606 | ) | (144,071 | ) | ||||
| Principal payments of notes payable |
(44,644 | ) | (35,357 | ) | ||||
| Principal payments of notes payable—related party |
(390,000 | ) | — | |||||
|
|
|
|
|
|||||
| Net cash provided by financing activities |
12,888,073 | 8,846,593 | ||||||
|
|
|
|
|
|||||
| Net increase in cash |
806,400 | 68,414 | ||||||
| Cash, beginning of the period |
1,211,423 | 1,143,009 | ||||||
|
|
|
|
|
|||||
| Cash, end of the period |
$ | 2,017,823 | $ | 1,211,423 | ||||
|
|
|
|
|
|||||
| Supplemental disclosures of cash flow information: |
||||||||
| Interest paid |
$ | 1,121,066 | $ | 144,920 | ||||
|
|
|
|
|
|||||
| Income taxes paid |
$ | 6,447 | $ | — | ||||
|
|
|
|
|
|||||
| Supplemental schedule of non-cash investing and financing activities: |
||||||||
| Conversion of preferred stock to common stock |
$ | 18,846,539 | $ | — | ||||
|
|
|
|
|
|||||
| Issuance of preferred stock as debt discount |
$ | 100,000 | $ | — | ||||
|
|
|
|
|
|||||
| Conversion of note payable to preferred stock |
$ | 400,000 | $ | 4,442,000 | ||||
|
|
|
|
|
|||||
| Assets acquired through capital leases |
$ | 807,272 | $ | 1,293,205 | ||||
|
|
|
|
|
|||||
| Initial public offering costs incurred but unpaid |
$ | 64,760 | $ | — | ||||
|
|
|
|
|
|||||
| Property and equipment included in accounts payable |
$ | 393,119 | $ | — | ||||
|
|
|
|
|
|||||
| Change in derivative liability from new and exercised warrants |
$ | 1,586,181 | $ | — | ||||
|
|
|
|
|
|||||
The accompanying notes are an integral part of these financial statements
F-6
Table of Contents
GREAT BASIN SCIENTIFIC, INC.
NOTE 1 DESCRIPTION OF BUSINESS
Great Basin Scientific, Inc. (the “Company”) (d.b.a., Great Basin Corporation) is a Delaware corporation headquartered in Salt Lake City, Utah. The Company was originally incorporated as Diagnostic Micro Arrays, Inc., a Nevada corporation, on June 27, 2003. The Company changed its name to Great Basin Scientific, Inc. on April 19, 2006. On August 12, 2008, the Company took steps to change its corporate domicile from Nevada to Delaware by forming Great Basin Scientific, Inc., a Delaware corporation and on August 29, 2008, Great Basin Scientific, Inc., a Nevada corporation, was merged with and into Great Basin Scientific, Inc., a Delaware corporation, wherein the Delaware corporation was the sole surviving entity.
The Company is a molecular diagnostic testing company focused on improving patient care through the development and commercialization of it’s patented, molecular diagnostic platform designed to test for infectious disease, especially hospital-acquired infections. The Company’s focus is mainly on small to medium sized hospital laboratories, those under 400 beds, that are shifting from traditional testing methods to molecular methods of diagnosis. The Company’s platform includes an analyzer, which is provided for customers’ use without charge in the United States, and a diagnostic test cartridge, which is sold to customers. This platform combines both affordability and ease-of-use when compared to other commercially available molecular testing methods, which allows small to medium sized hospitals that traditionally could not afford more expensive molecular diagnostic systems to modernize their laboratory testing and provide better patient care. The Company currently has one commercially available test, a diagnostic test for clostridium difficile, or C. diff, which received clearance from the Food and Drug Administration, or FDA, in April of 2012. The Company filed a 510(k) pre-market application for our second diagnostic test for Group B Strep in the fourth quarter of 2014.
NOTE 2 SUMMARY OF SIGNIFICANT ACCOUNTING POLICIES
Basis of Presentation
These financial statements have been prepared to reflect the financial position, results of operations and cash flows of the Company and have been prepared in accordance with accounting principles generally accepted in the United States of America (“GAAP”).
Reverse Stock Split
On September 5, 2014, the Company effected a reverse stock split of the Company’s common stock whereby each two hundred shares of common stock was replaced with one share of common stock (with no fractional shares issued). The par value and authorized shares of the common stock were not adjusted as a result of the reverse stock split. All common share, options, warrants and per share amounts for all periods presented in these financial statements have been adjusted retroactively to reflect the reverse stock split. The convertible preferred stock was not included in the reverse stock split and the outstanding amounts have not been adjusted. However, the conversion ratio was adjusted as a result of the reverse stock split such that upon conversion, each two hundred shares of preferred stock will be converted into one share of common stock.
Initial Public Offering
On October 8, 2014, the Company completed an initial public offering (“IPO”) whereby the Company sold 1,150,000 shares of its common stock and 1,150,000 Series A Warrants, which were sold in units of one share of common stock and one Series A Warrant at an issuance price of $7.00 per unit, less underwriting discounts and commissions. In addition, the underwriter exercised its option to purchase 172,500 additional Series A Warrants. As a result of the IPO, the Company received proceeds of approximately $6.4 million, net of approximately $1.7 million in underwriting and other offering costs.
F-7
Table of Contents
GREAT BASIN SCIENTIFIC, INC.
NOTES TO FINANCIAL STATEMENTS
Use of Estimates
The preparation of financial statements in conformity with generally accepted accounting principles requires management to make estimates and assumptions that affect the amounts reported in the financial statements and the accompanying notes. Such estimates include the warranty reserve, accounts receivable and inventory reserves, intangible assets and other long lived assets, legal and regulatory contingencies, income taxes, share based arrangements, the derivative liability for common stock warrants and others. These estimates and assumptions are based on management’s best estimates and judgments. Actual amounts and results could differ from those estimates.
Cash and Cash Equivalents
The Company considers highly liquid investments with insignificant interest rate risk and original maturities to the Company of three months or less to be cash equivalents. Cash equivalents consist primarily of interest and non-interest bearing bank accounts held in checking, savings and money market accounts. These assets are generally available on a daily or weekly basis and are highly liquid in nature. If the balances are greater than $250,000, the Company does not have FDIC coverage on the entire amount of bank deposits.
Accounts Receivable
Accounts receivable are generated from the sale of single use diagnostic test cartridges to end users in the United States and to a network of distributors outside the United States. These accounts receivable are recorded at the invoiced amount, net of allowances for doubtful amounts. The Company routinely reviews outstanding accounts receivable balances for estimated uncollectible accounts and establishes or adjusts the allowances for doubtful accounts receivable using the specific identification method and records a reserve for amounts not expected to be fully recovered. Actual balances are not applied against the reserve until substantially all collection efforts have been exhausted. The Company does not have customer acceptance provisions, but it does provide its customers a limited right of return for defective diagnostic test cartridges.
The balance of accounts receivable at December 31, 2014 and 2013, net of an allowance for doubtful accounts of $5,482, was $267,485 and $184,415, respectively.
Inventories
Inventories are stated at the lower of cost or market with cost determined according to the average cost method. Manufactured inventory consists of raw material, direct labor and manufacturing overhead cost components. The Company reviews the components of its inventory on a regular basis for excess and obsolete inventory and makes appropriate adjustments when necessary. Inventories consisted of the following at December 31, 2014 and 2013:
| December 31, | ||||||||
| 2014 | 2013 | |||||||
| Raw materials |
$ | 360,019 | $ | 278,947 | ||||
| Work-in-process |
91,153 | 39,192 | ||||||
| Finished goods |
5,922 | 2,100 | ||||||
|
|
|
|
|
|||||
| Total inventories |
$ | 457,094 | $ | 320,239 | ||||
|
|
|
|
|
|||||
Property and Equipment
Property and equipment is recorded at cost and depreciated over the estimated useful lives of the assets (which range from three to ten years) using the straight-line method. Amortization of leasehold improvements is
F-8
Table of Contents
GREAT BASIN SCIENTIFIC, INC.
NOTES TO FINANCIAL STATEMENTS
computed on the straight-line method over the shorter of the lease term or estimated useful lives of the assets. The analyzers that the Company manufactures and retains title over are placed with customers and are recorded in property and equipment under “Analyzers.” The materials used for the manufacture of the analyzers are recorded in property and equipment under “Construction in progress.” Major renewals and betterments are capitalized and depreciated over their estimated useful lives while minor expenditures for maintenance and minor repairs are charged to operations as incurred.
The Company classifies assets to be sold as assets held for sale when (i) Company management has approved and commits to a plan to sell the asset, (ii) the asset is available for immediate sale in its present condition and is ready for sale, (iii) an active program to locate a buyer and other actions required to sell the asset have been initiated, (iv) the sale of the asset is probable, (v) the asset is being actively marketed for sale at a price that is reasonable in relation to its current fair value, and (vi) it is unlikely that significant changes to the plan will be made or that the plan will be withdrawn. Assets classified as held for sale are recorded at the lower of the carrying amount or fair value less the cost to sell and are a component of prepaid and other current assets in the balance sheets. The Company did not have any assets classified as held for sale as of December 31, 2014 and 2013.
Intangible Assets
The Company records its intangible assets at cost which consist of two licensing and royalty agreements for certain intellectual property rights used in the development and manufacture of our products. These intangible assets are being amortized over an estimated useful life of seven years from the date that the technology licenses became effective. As of December 31, 2014 and 2013, intangible assets totaled $600,000 valued at cost, less accumulated amortization of $383,420 and $265,975, respectively. The Company recorded amortization associated with these agreements of $117,445 and $97,680 for the years ended December 31, 2014 and 2013, respectively.
Estimated future intangible asset amortization expense for the next five years are as follows:
| Years ended December 31, |
||||
| 2015 |
$ | 97,405 | ||
| 2016 |
76,583 | |||
| 2017 |
42,591 | |||
| 2018 |
— | |||
| 2019 |
— | |||
|
|
|
|||
| Total estimated amortization expense |
$ | 216,579 | ||
|
|
|
Impairment of Long Lived Assets
Long-lived tangible assets, including property and equipment, and definite-lived intangible assets, are reviewed for impairment whenever events or changes in circumstances indicate that the carrying value of the asset may not be recoverable. The Company regularly evaluates whether events or circumstances have occurred that indicate possible impairment and relies on a number of factors, including expected future operating results, business plans, economic projections, and anticipated future cash flows. The Company uses an estimate of the future undiscounted net cash flows and comparisons to like-kind assets, as appropriate, of the related asset over the remaining life in measuring whether the assets are recoverable. Measurement of the amount of impairment, if any, is based upon the difference between the asset’s carrying value and estimated fair value. Fair value is determined through various valuation techniques, including cost-based, market and income approaches as considered necessary.
F-9
Table of Contents
GREAT BASIN SCIENTIFIC, INC.
NOTES TO FINANCIAL STATEMENTS
Derivative Instruments
The Company accounts for derivative instruments under the provisions of ASC 815 Derivatives and Hedging. ASC 815 requires the Company to record derivative instruments at their fair value. Changes in the fair value of derivatives are recognized in earnings. As a result of certain terms, conditions and features included in certain common stock purchase warrants granted by the Company, those warrants are required to be accounted for as derivatives at estimated fair value, with changes in fair value recognized in earnings.
Fair Value of Financial Instruments
The Company measures at fair value certain of its financial and non-financial assets and liabilities by using a fair value hierarchy that prioritizes the inputs to valuation techniques used to measure fair value. Fair value is the price that would be received to sell an asset or paid to transfer a liability in an orderly transaction between market participants at the measurement date, essentially an exit price, based on the highest and best use of the asset or liability. The levels of the fair value hierarchy are:
Level 1—Quoted market prices in active markets for identical assets or liabilities;
Level 2—Significant other observable inputs (e.g. quoted prices for similar items in active markets, quoted prices for identical or similar items in markets that are not active, inputs other than quoted prices that are observable, such as interest rate and yield curves, and market-corroborated inputs); and
Level 3—Unobservable inputs in which there is little or no market data, which require the reporting unit to develop its own assumptions.
The following tables set forth the financial liabilities measured at fair value on a recurring basis by level within the fair value hierarchy at December 31, 2014:
| Fair Value Measurements at December 31, 2014 | ||||||||||||||||
| Description |
Level 1 | Level 2 | Level 3 | Total | ||||||||||||
| Derivative liability |
||||||||||||||||
| Common stock warrants |
$ | — | $ | — | $ | 9,998,636 | $ | 9,998,636 | ||||||||
|
|
|
|
|
|
|
|
|
|||||||||
| Total derivative liability |
$ | — | $ | — | $ | 9,998,636 | $ | 9,998,636 | ||||||||
|
|
|
|
|
|
|
|
|
|||||||||
Revenue Recognition
The Company derives its product revenue from the sale of single use diagnostic test cartridges sold through our dedicated sales force, except in the European Union where the Company sells through a network of distributors. Product revenue is recognized when all four of the following criteria are met: (1) persuasive evidence that an arrangement exists; (2) delivery of the products has occurred; (3) the selling price of the product is fixed or determinable; and (4) collectability of that price is reasonably assured. Change in title to the product and recognition of revenue from sales of diagnostic test cartridges occurs at the time of shipment. Shipping and handling fees and related freight costs and supplies for test kits are billed to customers. Additional costs associated with shipping products to customers are included as a component of cost of sales.
Research and Development Costs
Research and development costs are charged to operations as incurred. Research and development costs include, among other things, salaries and wages for research scientists and staff (including stock-based compensation), materials and supplies used in the development of new products, developing and validating the manufacturing process, costs for clinical trials, and costs for research and development facilities and equipment.
F-10
Table of Contents
GREAT BASIN SCIENTIFIC, INC.
NOTES TO FINANCIAL STATEMENTS
Stock Based Compensation
The Company has accounted for stock-based compensation under the provisions of Financial Accounting Standards Board Accounting Standards Codification (“FASB ASC”) 718, “Compensation—Stock Compensation”. This standard requires the Company to record an expense associated with the fair value of stock-based compensation over the requisite service period. The Company uses the Black-Scholes option valuation model to calculate the value of options at the date of grant. Option pricing models require the input of highly subjective assumptions, including the estimated fair value of the Company’s common stock on the date of grant, the expected term of the stock option, and the expected price volatility of the Company’s common stock over the period equal to the expected term of the grant. Changes in these assumptions can materially affect the fair value estimate. The Company estimates forfeitures at the date of grant and revises the estimates, if necessary, in subsequent periods if actual forfeitures differ from those estimates.
Financial Instruments and Concentration of Credit Risk
The Company’s financial instruments include cash and cash equivalents, accounts receivable, and accounts payable. The carrying amount of cash and cash equivalents, accounts receivable, and accounts payable approximate fair value because of their immediate or short-term maturities.
All of the Company’s accounts receivable result from sales in the normal course of business to its customers primarily throughout the United States. The Company attempts to limit its credit risk by performing credit evaluations of new customers and maintaining adequate allowances for potential credit losses. As of December 31, 2014, 30% of the accounts receivable balance resulted from one customer. As of December 31, 2013, 25% of the accounts receivable balances resulted from one customer. Historically, the Company has not experienced any credit losses on such receivables. Allowances for bad debt in the amount of $5,482 were recorded against accounts receivable for the years ended December 31, 2014 and 2013. There was no bad debt for the year ended December 31, 2014. The Company cannot ensure that such losses will not be realized in the future.
The Company’s customers are primarily hospitals and health clinics. For the year ended December 31, 2014, 11% of revenues resulted from one customer who accounted for more than 10% of revenues. For the year ended December 31, 2013, 23% of revenues resulted from two customers who each accounted for more than 10% of revenues.
Income Taxes
The Company accounts for income taxes under FASB ASC 740, “Income Taxes”. Deferred income tax assets and liabilities are determined based upon differences between the financial reporting and tax basis of assets and liabilities and are measured using the enacted tax rates and laws that will be in effect when the differences are expected to reverse. Accounting standards require the consideration of a valuation allowance for deferred tax assets if it is “more likely than not” that some component or all of the benefits of deferred tax assets will not be realized.
The tax effects from an uncertain tax position can be recognized in the financial statements only if the position is more likely than not of being sustained if the position were to be challenged by a taxing authority. The Company has examined the tax positions taken in its tax returns and determined that there are no uncertain tax positions. As a result, the Company has recorded no uncertain tax liabilities in its balance sheet.
F-11
Table of Contents
GREAT BASIN SCIENTIFIC, INC.
NOTES TO FINANCIAL STATEMENTS
Loss per Common Share
Basic loss per share (“EPS”) is computed by dividing net loss, less cumulative preferred stock dividends for the period, including undeclared or unpaid cumulative dividends (the numerator) by the weighted average number of common shares outstanding for the period (the denominator). Diluted EPS is computed by dividing net loss by the weighted average number of common shares and potential common shares outstanding (if dilutive) during each period. Potential common shares include convertible preferred stock, stock options and warrants. The number of potential common shares outstanding is computed using the treasury stock method.
As the Company has incurred losses for the years ended December 31, 2014 and 2013, the potentially dilutive shares are anti-dilutive and are thus not added into the loss per share calculations. As of December 31, 2014 and 2013, there were 6,150,974 and 2,459,343 potentially dilutive shares, respectively.
New Accounting Pronouncements
From time to time, new accounting pronouncements are issued by the FASB that are adopted by the Company as of the specified effective date. If not discussed, management believes that the impact of recently issued standards, which are not yet effective, will not have a material impact on the Company’s financial statements upon adoption.
In May 2014, the Financial Accounting Standards Board issued accounting guidance on revenue recognition. The amended guidance will enhance the comparability of revenue recognition practices and will be applied to all contracts with customers. Improved disclosures related to the nature, amount, timing, and uncertainty of revenue that is recognized are requirements under the amended guidance. This guidance will be effective for fiscal 2017 and will be required to be applied retrospectively. We are currently assessing the impact that this guidance will have on our financial statements at this time.
In August 2014, the Financial Accounting Standards Board issued ASU No. 2014-15. This standard provides guidance on determining when and how to disclose going-concern uncertainties in the financial statements. The new standard requires management to perform interim and annual assessments of an entity’s ability to continue as a going concern within one year of the date the financial statements are issued. This ASU is effective for fiscal years, and interim periods within those years, beginning on or after December 15, 2016, with early adoption permitted. The Company is evaluating the new guidance and plans to provide additional information about its expected impact at a future date.
NOTE 3 GOING CONCERN
The Company’s financial statements have been prepared on a going concern basis which contemplates the realization of assets and the liquidation of liabilities in the ordinary course of business. The Company has incurred substantial losses from operations causing negative working capital and negative operating cash flows, which raise substantial doubt about the Company’s ability to continue as a going concern. The Company sustained a net loss for the year ended December 31, 2014 of $21,727,818 and a net loss for the year ended December 31, 2013 of $9,561,280, and has an accumulated deficit of $64,004,696 as of December 31, 2014.
The Company intends to develop its products and expand its customer base, but does not have sufficient realized revenues or operating cash flows in order to finance these activities internally. As a result, the Company intends to seek financing in order to fund its working capital and development needs.
The Company has been able to meet its short-term needs through private placements of convertible preferred securities, an initial public offering (“IPO”) and the sale and leaseback of analyzers used to report test results. The Company will continue to seek funding through the issuance of additional equity securities, debt
F-12
Table of Contents
GREAT BASIN SCIENTIFIC, INC.
NOTES TO FINANCIAL STATEMENTS
financing, the sale and leaseback of analyzers, or a combination of these items. Any proceeds received from these items could provide the needed funds for continued operations and development programs. The Company can provide no assurance that it will be able to obtain sufficient additional financing that it needs to alleviate doubt about its ability to continue as a going concern. If the Company is able to obtain sufficient additional financing proceeds, the Company cannot be certain that this additional financing will be available on acceptable terms, if at all. To the extent the Company raises additional funds by issuing equity securities, the Company’s stockholders may experience significant dilution. Any debt financing, if available, may involve restrictive covenants that impact the Company’s ability to conduct business. The financial statements do not include any adjustments that might result from the outcome of this uncertainty. If the Company is unable to obtain additional financings, the impact on the Company’s operations will be material and adverse.
NOTE 4 PROPERTY AND EQUIPMENT
Property and equipment consisted of the following at December 31, 2014 and December 31, 2013:
| December 31, | ||||||||
| 2014 | 2013 | |||||||
| Construction in progress |
$ | 1,133,654 | $ | 308,411 | ||||
| Analyzers |
1,139,352 | 1,421,293 | ||||||
| Computers and office equipment |
290,754 | 244,454 | ||||||
| Machinery and equipment |
1,060,993 | 910,643 | ||||||
| Leasehold improvements |
366,945 | 366,945 | ||||||
| Furniture and fixtures |
16,145 | 11,730 | ||||||
| Equipment under capital lease |
2,148,476 | 1,462,122 | ||||||
|
|
|
|
|
|||||
| 6,156,319 | 4,712,598 | |||||||
| Less: accumulated depreciation and amortization |
(1,918,852 | ) | (1,022,016 | ) | ||||
|
|
|
|
|
|||||
| Total property and equipment, net |
$ | 4,237,467 | $ | 3,703,582 | ||||
|
|
|
|
|
|||||
The total expense for depreciation of fixed assets and amortization of leasehold improvements was $1,040,531 and $757,270 for the years ended December 31, 2014 and 2013, respectively.
NOTE 5 ACCRUED EXPENSES
Accrued liabilities consisted of the following as of December 31, 2014 and 2013:
| December 31, | ||||||||
| 2014 | 2013 | |||||||
| Accrued payroll |
$ | 421,645 | $ | 564,740 | ||||
| Royalties |
166,540 | 105,319 | ||||||
| Accrued interest |
— | 39,808 | ||||||
| Accrued property and use tax |
10,905 | 99,707 | ||||||
| Other |
13,269 | 6,240 | ||||||
|
|
|
|
|
|||||
| Total accrued liabilities |
$ | 612,359 | $ | 815,814 | ||||
|
|
|
|
|
|||||
F-13
Table of Contents
GREAT BASIN SCIENTIFIC, INC.
NOTES TO FINANCIAL STATEMENTS
NOTE 6 LEASE COMMITMENTS
Capital Leases
The Company has entered into two lease agreements for the sale-leaseback of molecular diagnostic analyzers. The first agreement was entered into in November 2013 and provided for the sale of 125 molecular diagnostic analyzers for a sales price of $2,500,000, which are being leased back for a base period of thirty-six monthly payments of $74,875. The second agreement was entered into in April 2014 for the sale of 75 molecular diagnostic analyzers for a sales price of $1,500,000, which are being leased back for a base period of twenty-four monthly payments of $64,665. At the end of each lease term, the leases shall automatically renew for twelve additional months at the current monthly rate unless the Company gives written notice 150 days prior to the end of the lease. If timely notice is given the Company shall have the opportunity to: 1) repurchase the analyzers for a negotiated purchase price, not to exceed forty percent of their original cost; or 2) terminate the lease, return the property and enter into a new lease with new property that replaces the property of the old lease. Both the Company and the lessor shall have the right to reject any terms of option 1 or 2 and if rejected, the 12 month extension shall apply. As such, the Company is amortizing the capital lease over a forty-eight month period for the first agreement and a thirty-six month period for the second agreement. The second agreement also has a rewrite clause wherein the leasing company agrees to use its commercially best efforts to rewrite the lease agreement at more favorable terms when the Company raises sufficient capital to cover current and future expenses for a minimum of 12 months. The Company’s obligations under the lease agreements are secured by a $500,000 letter of credit. The Letter of Credit was issued by a bank at the behest of a non-profit foundation and Spring Forth Investments LLC both of which are related parties through Mr. David Spafford, a director of the Company. The Company is obligated to reimburse the non-profit foundation and Spring Forth Investments LLC for any draws made under the Letter of Credit. The lease agreement is also secured by personal guarantees from Mr. Ryan Ashton, the Chief Executive Officer of the Company, and Mr. Spafford (See Note 12 RELATED PARTY TRANSACTIONS). The lease is accounted for as a capital lease sale-leaseback transaction in accordance with ASC 840, “Leases”.
Annual future maturities of capital leases for the next five years are as follows:
| Years ended December 31, |
||||
| 2015 |
$ | 947,422 | ||
| 2016 |
1,305,426 | |||
| 2017 |
851,411 | |||
| 2018 |
— | |||
| 2019 |
— | |||
|
|
|
|||
| Total capital lease commitments |
3,104,259 | |||
| Less: current portion of capital leases |
(947,422 | ) | ||
|
|
|
|||
| Long term portion of capital leases |
$ | 2,156,837 | ||
|
|
|
Operating leases
The Company leases office and manufacturing buildings as well as certain office equipment such as copiers and printers under operating lease agreements that expire at various dates.
Amounts charged to expense under operating leases were $293,773 and $284,941 for the years ended December 31, 2014 and 2013, respectively.
F-14
Table of Contents
GREAT BASIN SCIENTIFIC, INC.
NOTES TO FINANCIAL STATEMENTS
Operating lease commitments for the next five years are as follows:
| Years ended December 31, |
||||
| 2015 |
$ | 108,237 | ||
| 2016 |
4,937 | |||
| 2017 |
715 | |||
| 2018 |
— | |||
| 2019 |
— | |||
|
|
|
|||
| Total operating lease commitments |
$ | 113,889 | ||
|
|
|
NOTE 7 NOTES PAYABLE
The Company purchased certain machinery and equipment under two note payable agreements which consist of the following as of December 31, 2014 and 2013:
| December 31, | ||||||||
| 2014 | 2013 | |||||||
| Note payable, 15.2% interest, monthly payments of $1,328, due February 6, 2016, secured by equipment |
$ | 16,938 | $ | 29,259 | ||||
| Note payable, 10.0% interest, monthly payments of $3,161, due January 1, 2016, secured by equipment |
38,749 | 71,072 | ||||||
|
|
|
|
|
|||||
| Total notes payable |
55,687 | 100,331 | ||||||
| Less: current portion of notes payable |
(49,994 | ) | (44,601 | ) | ||||
|
|
|
|
|
|||||
| Long term portion of notes payable |
$ | 5,693 | $ | 55,730 | ||||
|
|
|
|
|
|||||
NOTE 8 NOTES PAYABLE—RELATED PARTY
In July 2014, the Company entered into a note agreement for $500,000 with Spring Forth Investments, LLC a company owned by Mr. David Spafford, a director. The maturity date for the note is July 18, 2015. The note pays interest at an annual rate of 20% and is paid monthly. The Company may extend the due date of the note to July 18, 2016 by giving notice no later than April 18, 2015 and paying an extension fee of $10,000. The Company prepaid the last three months of interest for a total of $25,000 at the time of issuance of the note. As additional consideration for the note, the Company issued 4,000,000 Series D preferred stock units (which are separable into 4,000,000 shares of Series D preferred stock, 20,000 Class A warrants to purchase a share of common stock at $4.92 and 20,000 Class B warrants to purchase a share of common stock at $0.20) at a value of $100,000 or $0.025 per unit. The Series D preferred stock units were accounted as a debt discount to be amortized over the life of the note. As of December 31, 2014 the unamortized debt discount was $58,333. On the date of the IPO, the 4,000,000 shares of Series D Preferred Stock converted into 20,000 shares of Common Stock at a conversion ratio of 200 to 1.
NOTE 9 COMMON AND PREFERRED STOCK
Common Stock
The Company had 50,000,000 and 700,000,000 shares of common stock authorized at a par value of $0.001 per share as of December 31, 2014 and 2013, respectively. As of December 31, 2014 and 2013 there were 5,086,458 and 115,510 shares of common stock issued and outstanding, respectively. There were no issuances of common stock during 2013.
F-15
Table of Contents
GREAT BASIN SCIENTIFIC, INC.
NOTES TO FINANCIAL STATEMENTS
In July 2014, the Company issued 46,250 shares of common stock to Spring Forth Investments pursuant to the exercise of the conversion option of 9,250,000 shares of Series A preferred stock at a conversion ratio of 200 to 1 (SEE NOTE 12 RELATED PARTY TRANSACTIONS).
In October and November 2014, the Company issued 158,000 shares of common stock to various unaffiliated investors upon the exercise of 158,000 of Class B warrants at an exercise price of $31,600 or $0.20 per share.
In October 2014, the Company completed an IPO, whereby the Company sold 1,150,000 shares of its common stock and 1,150,000 Series A Warrants, which were sold in units of one share of common stock and one Series A Warrant at a public offering price of $7.00 per unit. Each Series A Warrant is exercisable for one share of common stock and one Series B Warrant. In addition, the underwriter was granted 57,500 common warrants and also exercised its option to purchase 172,500 Series A Warrants. The shares began trading on the NASDAQ Capital Market on October 9, 2014. The aggregate net proceeds received by the Company from the offering were approximately $6.4 million, after deducting underwriting discounts and commissions and other estimated offering expenses payable by the Company.
In October 2014, upon the closing of the IPO, all outstanding shares of convertible preferred stock converted into 3,616,714 shares of common stock at a ratio of 200 to 1.
Preferred Stock
The Company had 5,000,000 and 535,000,000 shares of preferred stock authorized at a par value of $0.001 per share as of December 31, 2014 and 2013, respectively. As of December 31, 2014 there were no shares of preferred stock issued and outstanding. The preferred stock may be issued from time to time by the board of directors as shares of one or more classes or series with authority to fix the designation and relative powers including voting powers, preferences, rights, qualifications, limitations, and restrictions relating to the shares of each class or series. As of December 31, 2013, there were 117,131,171 shares of Series A preferred stock outstanding; 59,465,350 shares of Series B preferred stock outstanding; 150,989,224 shares of Series C preferred stock outstanding; and 84,027,175 shares of Series C-1 preferred stock outstanding.
During the year ended December 31, 2013 the Company issued 150,989,224 shares of Series C preferred stock for cash in the amount of $1,160,000 net of offering costs and pursuant to the exercise of convertible notes in the amount $2,442,000 plus interest of $72,338 for a total issuance price of $3,674,338 or $0.0246 per share. The Company also issued 84,027,174 shares of Series C-1 preferred stock pursuant to the exercise of a convertible note in the amount of $2,000,000 plus interest of $67,068 for a total conversion price of $2,067,068 or $0.0246 per share.
During the year ended December 31, 2014 the Company issued 14,888,211 shares of Series C preferred stock for cash in the amount of $366,250 or $0.0246 per share. The Company also sold 285,566,560 shares of Series D preferred stock units for gross proceeds in the amount of $7,139,164 or $0.025 per unit and after deducting offering costs and expenses, the Company received $6,203,636 in net proceeds. The preferred stock units were separable into 285,566,560 shares of Series D preferred stock, 1,427,832 Class A warrants to purchase a share of common stock at $4.92 and 1,427,832 Class B warrants to purchase a share of common stock at $0.20. In conjunction with the offering an additional 7,200,000, 466,436 and 251,216 of Series D preferred stock warrants, Class A warrants and Class B warrants, respectively, were granted as part of the offering costs.
In July 2014, the Company converted notes payable in the amount of $400,000 plus $13,129 in accrued interest into 16,525,121 Series D preferred stock units at a conversion price of $0.025 per share. These units consist of 16,525,121 shares of Series D preferred stock, 82,625 Class A warrants to purchase a share of common stock at
F-16
Table of Contents
GREAT BASIN SCIENTIFIC, INC.
NOTES TO FINANCIAL STATEMENTS
$4.92 and 82,625 Class B warrants to purchase a share of common stock at $0.20. The shares of Series D preferred stock are convertible into shares of common stock at a ratio of 200:1, at the option of the holder at any time after issuance. The conversion of the notes was pursuant to the terms of the notes that upon a qualified equity financing of at least $5 million the notes would be converted into shares of the equity securities at the price per share at which the equity securities were issued in the qualified equity financing. The sale of the Series D preferred stock units through July 2014 met this threshold and triggered the conversion.
In July 2014, as additional consideration for the issuance of the Spring Forth Note (See NOTE 8 NOTES PAYABLE—RELATED PARTY) the Company issued 4,000,000 Series D preferred stock units (which were separable into 4,000,000 shares of Series D preferred stock, 20,000 Class A warrants to purchase a share of common stock at $4.92 and 20,000 Class B warrants to purchase a share of common stock at $0.20) at a value of $100,000 or $0.025 per unit.
In July 2014, Spring Forth Investments exercised its conversion option and converted 9,250,000 shares of Series A preferred stock valued at $1,480,000 or $0.16 per share into 46,250 shares of common stock.
The Series C and Series D preferred stock had a conversion price adjustment provision that in the event the Company sells shares of any additional stock, subject to certain exceptions, at a price per share less than the original issue price of the respective series preferred stock, the conversion price shall be adjusted to a price equal to the price paid per share for such additional stock. These conversion price adjustment provisions, and other relevant features of the preferred stock, were analyzed in accordance with the provisions of FASB ASC 815, “Derivatives and Hedging”. The Company evaluated the conversion price adjustment provision embedded in the preferred stock and other relevant features and determined, in accordance with the provisions of the referenced accounting guidance, that such conversion option or other relevant features do not meet the criteria requiring bifurcation as a derivative liability of these instruments. The characteristics of the common stock that is issuable upon a holder’s exercise of the conversion option embedded in the convertible preferred stock are deemed to be clearly and closely related to the characteristics of the preferred shares. Further, the Company determined the other relevant features of the preferred stock are clearly and closely related to the equity host and do not qualify for derivative accounting.
In July 2014, the Company filed a sixth amended and restated Certificate of Incorporation authorizing a modification to the number of authorized shares of common stock and Series D preferred stock. The number of common shares authorized was amended to 1,800,000,000 shares and the number of Series D preferred shares authorized was amended to 325,000,000 shares.
In October 2014, the Company filed a seventh amended and restated Certificate of Incorporation authorizing a modification to the number of authorize shares of common stock and preferred stock. The number of common shares authorized was amended to 50,000,000 shares and the number of preferred shares authorized was amended to 5,000,000 shares.
In October 2014, upon the closing of the IPO, all outstanding shares of convertible preferred stock converted into 3,616,714 shares of common stock at a conversion ratio of 200 to 1.
NOTE 10 WARRANTS
As of December 31, 2014, there were 5,447,940 fully vested warrants outstanding to purchase shares of common stock. As of December 31, 2013 there were 274,420, fully vested warrants outstanding to purchase shares of common stock and 2,231,727 fully vested warrants to purchase shares of Series A preferred stock.
F-17
Table of Contents
GREAT BASIN SCIENTIFIC, INC.
NOTES TO FINANCIAL STATEMENTS
During the year ended December 31, 2013 warrants to purchase 100,000 shares of common stock were granted and issued as compensation to two related parties in conjunction with providing their personal guarantee of the leaseback agreements on our analyzers (see NOTE 6 LEASE COMMITMENTS and NOTE 12 RELATED PARTY TRANSACTIONS). The warrants have an exercise price of $2.00 and expire seven years from the date of grant. These transactions are accounted for by the Company under the provisions of FASB ASC 505 which require the Company to record an expense associated with the fair value of stock-based payments. The Company uses the Black-Scholes option valuation model to calculate the fair value of stock-based payments at the date of grant. Warrant pricing models require the input of highly subjective assumptions, including the expected price volatility. For warrants granted, the Company used a variety of comparable and peer companies to determine the expected volatility. The Company believes that the use of peer company data fairly represents the expected volatility it would experience if the Company were actively publicly traded in the life sciences industry over the contractual term of the warrants. Changes in these assumptions can materially affect the fair value estimate. The Company determined that the value of the 100,000 common stock warrants granted was nominal due to the fair value of the Company’s common stock as of the grant date being nominal as a result of the priority provisions of the preferred stock outstanding at that time.
During the year ended December 31, 2014, warrants to purchase 5,331,520 shares of common stock and warrants to purchase 7,200,000 shares of Series D preferred stock were granted.
Of the warrants granted during 2014, 2,855,664 were Class A and Class B warrants to purchase shares of common stock and were issued as part of the sale for cash of the Series D preferred stock units (see NOTE 9 COMMON AND PREFERRED STOCK). These warrants have an exercise price between $0.20 and $4.92 and expire between April 2021 and July 2021.
In addition during 2014 prior to the IPO, 1,048,698 common warrants, Class A warrants and Class B warrants to purchase common stock and 7,200,000 warrants to purchase Series D preferred stock were granted in conjunction with the issuance of certain convertible notes payable, consulting services and as financing fees. The warrants have an exercise price between $0.20 and $4.92 and expire between February 2021 and July 2021. The Company determined that the fair value of the warrants granted was nominal due to the fair value of the Company’s common stock as of the grant date being nominal as a result of the priority provisions of the preferred stock outstanding at that time.
In October 2014 common warrants in the amount of 57,500 and Series A warrants in the amount of 1,322,500 were issued in conjunction with our IPO (see NOTE 9 COMMON AND PREFERRED STOCK). The common warrants have an exercise price of $8.75 and expire in October 2019. Each Series A warrant is exercisable for one share of common stock and one Series B Warrant. The Series A warrants have an exercise price of $7.00 and expire in October 2015. Each Series B warrant is exercisable for one share of common stock and will only be issued upon the exercise of a Series A warrant. The Series B warrants have an exercise price of $8.75 and expire on the sixth anniversary of the date of issuance.
In October 2014 upon the closing of the IPO, 2,231,727 outstanding warrants to purchase shares of Series A preferred stock and 7,200,000 outstanding warrants to purchase shares of Series D preferred stock were converted at a ratio of 200 to 1 into 47,178 warrants to purchase common stock with same expiration date as the original preferred warrant and the exercise price adjusted to $32.00 per warrant for those converted from the Series A Preferred Stock and $5.00 per warrant for those converted from the Series D Preferred Stock.
F-18
Table of Contents
GREAT BASIN SCIENTIFIC, INC.
NOTES TO FINANCIAL STATEMENTS
In September 2014, 157,093 warrants previously issued were amended to eliminate a clause that would cancel the warrant upon the completion of an IPO. The Company recorded an expense for the incremental fair value based on the difference between the fair value of the modified award and the fair value of the original award immediately before it was modified using the Black-Scholes option valuation model to calculate the fair value. The Company determined the incremental fair value of the warrants to be $25,061 which was expensed in the period as the warrants were fully vested.
The following is the weighted average of the assumptions used in calculating the fair value of the warrants after they were modified in September 2014 using the Black-Scholes method:
| Fair market value |
$ | 4.94 | ||
| Exercise price |
$ | 10.00 | ||
| Risk free rate |
0.61 | % | ||
| Dividend yield |
0.00 | % | ||
| Expected volatility |
37.23 | % | ||
| Remaining contractual term |
1.97 years |
F-19
Table of Contents
GREAT BASIN SCIENTIFIC, INC.
NOTES TO FINANCIAL STATEMENTS
The following table summarizes the common stock warrant activity during the years ended December 31, 2014 and 2013:
| Common Stock Warrants |
Weighted Average Exercise Price |
Weighted Average Remainder Contractual Term in Years |
||||||||||
| As of December 31, 2013: |
||||||||||||
| Warrants outstanding as of January 1, 2013 |
174,420 | $ | 10.00 | 3.8 | ||||||||
| Granted |
100,000 | $ | 2.00 | 7.0 | ||||||||
| Exercised |
— | — | — | |||||||||
| Expired |
— | — | — | |||||||||
|
|
|
|||||||||||
| Warrants outstanding as of December 31, 2014 |
274,420 | $ | 8.00 | 4.2 | ||||||||
|
|
|
|||||||||||
| As of December 31, 2014: |
||||||||||||
| Warrants outstanding as of January 1, 2014 |
274,420 | $ | 8.00 | 4.2 | ||||||||
| Granted |
5,331,520 | $ | 3.91 | 5.5 | ||||||||
| Exercised |
(158,000 | ) | 0.20 | 6.6 | ||||||||
| Expired |
— | — | — | |||||||||
|
|
|
|||||||||||
| Warrants outstanding as of December 31, 2014 |
5,447,940 | $ | 4.17 | 4.9 | ||||||||
|
|
|
|||||||||||
All warrants outstanding were fully vested upon issuance.
The following table summarizes the Preferred A stock warrant activity during the years ended December 31, 2014 and 2013:
| Preferred Stock A Warrants |
Weighted Average Exercise Price |
Weighted Average Remainder Contractual Term in Years |
||||||||||
| As of December 31, 2013: |
||||||||||||
| Warrants outstanding as of January 1, 2013 |
2,231,727 | $ | 0.16 | 4.1 | ||||||||
| Granted |
— | — | — | |||||||||
| Converted |
— | — | — | |||||||||
| Expired |
— | — | — | |||||||||
|
|
|
|||||||||||
| Warrants outstanding as of December 31, 2013 |
2,231,727 | $ | 0.16 | 3.1 | ||||||||
|
|
|
|||||||||||
| As of December 31, 2014: |
||||||||||||
| Warrants outstanding as of January 1, 2014 |
2,231,727 | $ | 0.16 | 3.1 | ||||||||
| Granted |
— | — | — | |||||||||
| Converted |
(2,231,727 | ) | 0.16 | 2.3 | ||||||||
| Expired |
— | — | — | |||||||||
|
|
|
|||||||||||
| Warrants outstanding as of December 31, 2014 |
— | $ | — | — | ||||||||
|
|
|
|||||||||||
F-20
Table of Contents
GREAT BASIN SCIENTIFIC, INC.
NOTES TO FINANCIAL STATEMENTS
The following table summarizes the preferred D stock warrant activity during the year ended December 31, 2014:
| Preferred Stock D Warrants |
Weighted Average Exercise Price |
Weighted Average Remainder Contractual Term in Years |
||||||||||
| As of December 31, 2014: |
||||||||||||
| Warrants outstanding as of January 1, 2014 |
— | — | — | |||||||||
| Granted |
7,200,000 | $ | 0.025 | 6.8 | ||||||||
| Converted |
(7,200,000 | ) | $ | 0.025 | 6.7 | |||||||
| Expired |
— | — | — | |||||||||
|
|
|
|||||||||||
| Warrants outstanding as of December 31, 2014 |
— | $ | — | — | ||||||||
|
|
|
|||||||||||
Common Warrant Derivative Liability
Our Class A warrants, Class B warrants, Series A warrants, and common warrants from the conversion of the Series D Preferred warrants, which in total comprise 5,045,584 warrants, all have an exercise price adjustment provision that falls within the scope of ASC 815. This provision states that if the Company shall issue: (i) any common stock, except for certain excluded issuances, (ii) any security or debt instrument carrying the right to convert into common stock, or (iii) any warrant, right or option to purchase common stock, at a price less than the exercise price in effect at the time of such issuance, then the exercise price shall be reduced to the lower price. Such exercise price adjustment prohibits the Company from being able to conclude that the warrants are indexed to the Company’s own stock. Accordingly, these warrants are accounted for as derivative liabilities and are recorded at fair value at inception and at each reporting date. The liability for these warrants was revalued at December 31, 2014 and the change in the fair value of the warrant derivative liability was included as a component of Other income (expense). The change in fair value of the warrant derivative liability has no effect on the Company’s cash flows.
The following table summarizes the change in the value of the warrant derivative liability during the year ended December 31, 2014:
| Balance at December 31, 2013 |
$ | — | ||
| Issuance of warrants |
2,487,726 | |||
| Exercise of warrants |
(885,258 | ) | ||
| Change in fair value of warrant liability |
8,396,169 | |||
|
|
|
|||
| Balance at December 31, 2014 |
$ | 9,998,636 | ||
|
|
|
The Company estimates the fair value of the warrants at inception and at each reporting date using a modified Black-Scholes option valuation model utilizing the fair value of underlying common stock and has determined the fair value measurement to be a level 3 measurement (see NOTE 2 SUMMARY OF SIGNIFICANT ACCOUNTING POLICIES). Black-Scholes has inherent limitations for use in the case of a warrant with a price protection provision, since the model is designed to be used when the inputs to the model are static throughout the life of a security. Accordingly, our valuation model was modified to incorporate a probability weighted fair value calculation for the price reset provision taking into account the likelihood of future resets of the exercise price. The estimates in the modified Black-Scholes option-pricing model are based, in part, on assumptions, including but not limited to stock price volatility, the expected life of the warrants, the risk free rate and the fair value of the equity stock underlying the warrants.
F-21
Table of Contents
GREAT BASIN SCIENTIFIC, INC.
NOTES TO FINANCIAL STATEMENTS
The following is the weighted average of the assumptions as of December 31, 2014 used in the Black-Scholes method for calculating the fair value of the warrants that contain the conversion price adjustment provision:
| Fair market value |
$ | 2.46 | ||
| Exercise price |
$ | 1.27 | ||
| Risk free rate |
1.83 | % | ||
| Dividend yield |
0.00 | % | ||
| Expected volatility |
107.49 | % | ||
| Probability of price reset |
100.00 | % | ||
| Remaining contractual term |
5.00 years |
NOTE 11 EMPLOYEE STOCK OPTIONS
The Company has three stock based employee compensation plans, the 2006 Stock Option Plan, the 2014 Stock Option Plan, and the Omnibus Plan pursuant to which certain employees and non-employee directors have been granted options to purchase common stock. The Company had 703,034 and 115,750 employee stock options outstanding as of December 31, 2014 and 2013, respectively. All options vest in installments over a three to four year period and expire ten years from the date of grant.
In October 2013, an employee was awarded 5,000 common stock options under the 2006 Stock Option Plan with an exercise price of $2.00 per share that expire in October 2023. The options vest over a period of four years.
In April and June 2014, the Company awarded 483,000 common stock options to certain employees under the 2014 Stock Option plan with an exercise price of $2.00 per share that expire in April and June 2024. The options vest over a period of four years.
The Company accounts for employee stock options according to FASB ASC 718 which requires the Company to calculate the fair value of the stock options on the date of grant and amortize over the vesting period of the options. The Company determined the value of the 5,000 options granted in October 2013 and the 483,000 options granted in April and June 2014 to be nominal due to the fair value of the Company’s common stock as of the grant date being nominal as a result of the priority provisions of the preferred stock outstanding at the time. The Company used a variety of comparable and peer companies to determine the expected volatility. The Company believes the use of peer company data fairly represents the expected volatility it would experience if the Company was more actively publicly traded in the life sciences industry over the expected life of the options. The Company has no historical data regarding the expected life of the options and therefore used the simplified method of calculating the expected life. The risk free rate was calculated using the U.S. Treasury constant maturity rates similar to the expected life of the options, as published by the Federal Reserve.
In September 2014, the Company completed a tender offer to eligible employees to exchange 103,250 employee stock options under the 2006 Stock Option Plan for new options under the 2014 Stock Option Plan. The new options have an exercise price of $3.50 with all other terms the same as the original terms under the 2006 Option Plan. These transactions are accounted for under the provisions of FASB ASC 718 as a modification of a stock based compensation award and require the Company to record an expense for the incremental fair value based on the difference between the fair value of the modified award and the fair value of the original award immediately before it was modified. The Company used the Black-Scholes option valuation model to calculate the fair value of the stock options. The Company determined the incremental fair value of the options to be $223,031 which was expensed in the period as the options are fully vested.
F-22
Table of Contents
GREAT BASIN SCIENTIFIC, INC.
NOTES TO FINANCIAL STATEMENTS
The following is the weighted average of the assumptions used in calculating the fair value of the options modified in September 2014 using the Black-Scholes method:
| Fair market value |
$ | 4.94 | ||
| Exercise price |
$ | 3.50 | ||
| Risk free rate |
1.06 | % | ||
| Dividend yield |
0.00 | % | ||
| Expected volatility |
46.31 | % | ||
| Expected term |
2.74 years |
In October and December 2014, the Company awarded 136,784 common stock options under the Omnibus Plan to certain employees and non-employee directors with an exercise price ranging from $2.56 to $7.00 per share that expire in October and December 2024. The options vest over a three and four year period. The Company accounts for employee stock options according to FASB ASC 718 which requires the Company to calculate the fair value of the stock options on the date of grant and amortize over the vesting period of the options. The Company determined the value of the 136,784 options granted in October and December 2014 to be $306,709 of which $54,394 was expensed in the period with the remainder to be expensed over the vesting term of the options.
The following is the weighted average of the assumptions used in calculating the fair value of the options granted in October and December 2014 using the Black-Scholes method:
| Fair market value |
$ | 5.28 | ||
| Exercise price |
$ | 5.91 | ||
| Risk free rate |
1.70 | % | ||
| Dividend yield |
0.00 | % | ||
| Expected volatility |
54.97 | % | ||
| Expected term |
6.06 years |
The following table summarizes the Company’s total option activity for the years ended December 31, 2014 and 2013:
| Options | Weighted Average Exercise Price |
Weighted Average Remaining Contractual Term in Years |
Intrinsic Value |
|||||||||||||
| As of December 31, 2013: |
||||||||||||||||
| Options outstanding as of January 1, 2013 |
110,750 | $ | 32.00 | 7.2 | ||||||||||||
| Granted |
5,000 | $ | 2.00 | 9.8 | ||||||||||||
| Exercised |
— | — | — | |||||||||||||
| Forfeited/expired |
— | — | — | |||||||||||||
|
|
|
|||||||||||||||
| Options outstanding as of December 31, 2013 |
115,750 | $ | 30.00 | 6.3 | $ | — | ||||||||||
|
|
|
|||||||||||||||
| As of December 31, 2014: |
||||||||||||||||
| Options outstanding as of January 1, 2014 |
115,750 | $ | 30.00 | 6.3 | ||||||||||||
| Granted |
619,784 | $ | 2.86 | 9.4 | ||||||||||||
| Exercised |
— | — | — | |||||||||||||
| Forfeited/expired |
(32,500 | ) | $ | 8.92 | 5.7 | |||||||||||
|
|
|
|||||||||||||||
| Options outstanding as of December 31, 2014 |
703,034 | $ | 2.98 | 8.8 | $ | — | ||||||||||
|
|
|
|||||||||||||||
F-23
Table of Contents
GREAT BASIN SCIENTIFIC, INC.
NOTES TO FINANCIAL STATEMENTS
Outstanding and exercisable stock options as of December 31, 2014 are as follows:
| Options Outstanding | Options Exercisable | |||||||||||||||||||||||
| Number of Options Outstanding |
Remaining Life (Years) |
Exercise Price |
Number of Options Exercisable |
Exercise Price |
Intrinsic Value | |||||||||||||||||||
| December 31, 2013 |
115,750 | 6.3 | $ | 30.00 | 106,570 | $ | 32.00 | $ | — | |||||||||||||||
| December 31, 2014 |
703,034 | 8.8 | $ | 2.98 | 117,404 | $ | 3.86 | $ | — | |||||||||||||||
The estimated fair value of the Company stock options, less expected forfeitures, is amortized over the options vesting period on the straight-line basis. The Company recognized the following equity-based compensation expenses during the twelve ended December 31, 2014 and 2013:
| December 31, | ||||||||
| 2014 | 2013 | |||||||
| Stock based compensation expense |
$ | 297,244 | $ | 111,091 | ||||
As of December 31, 2014 and 2013, there were $252,315 and $19,818 of total unrecognized compensation cost with a remaining vesting period of 3.44 and 0.30 years, respectively.
NOTE 12 RELATED PARTY TRANSACTIONS
During 2013, the Company issued promissory notes to SSA Ventures, LLC and SBS Charitable Remainder Trust U/A/D November 27, 1995, entities controlled by Mr. Stephen C. Aldous, a Director, reflecting obligations of $571,000 and $2,000,000 respectively. The principal balance of these notes, along with accrued interest of $21,901 and $67,068 respectively, converted to shares of Series C Preferred Stock at $4.92 per share in 2013.
During 2013, the Company issued a promissory note to Bourne Spafford Charitable Trust U/A/D May 15, 1995, an entity controlled by Mr. David Spafford, a Director reflecting an obligation of $200,000. This note had an 8% interest rate. The principal and $7,540 of accrued interest converted into shares of Series C Preferred Stock at $4.92 per share in 2013.
Mr. Ryan Ashton, the Chief Executive Officer of the Company, and Mr. Spafford, each personally guaranteed the obligations of the Company under two sale-leaseback agreements. On November 25, 2013, the Company issued Mr. Ashton warrants to purchase 50,000 shares of common stock and Mr. Spafford warrants to purchase 50,000 shares of common stock, each in compensation for their personal guarantees of the obligations of the Company under the sale-leaseback agreement. The warrants have an exercise price of $2.00 and expire seven years from the date of grant.
The Company’s obligations pursuant to its sale-leaseback agreements described in NOTE 6 LEASE COMMITMENTS are secured by letters of credit (Letters of Credit) in an aggregate amount of $3,000,000. The Letters of Credit were issued by a bank at the behest of a non-profit foundation (the “Foundation”) and Spring Forth Investments. The Company is obligated to reimburse the Foundation and Spring Forth Investments for any draws made under the Letters of Credit pursuant to two reimbursement agreements between the Company and the Foundation and Spring Forth Investments dated October 30, 2013. Mr. Spafford, one of our directors, and his wife, Susan Spafford, have been designated by the Foundation as “Founding Trustees” under its bylaws and have authority to control certain activities of the Foundation. Our obligations under the reimbursement agreements are secured by a security interest in all of our assets pursuant to a Security Agreement dated October 30, 2013. As of December 31, 2014, no draws on the line of credit had taken place.
F-24
Table of Contents
GREAT BASIN SCIENTIFIC, INC.
NOTES TO FINANCIAL STATEMENTS
In February 2014, we issued a convertible promissory note with an 8% interest rate and 25,000 warrants to purchase common stock to Mr. Ashton. The consideration paid by Mr. Ashton for the note and warrants was $200,000. The maturity date for the promissory note was February 26, 2015, or upon or a qualified equity financing of at least $5 million. This financing was for general working capital purposes. The principal balance of this note, along with accrued interest of $6,751 converted to 8,270,027 Series D Units at $0.025 per unit in July 2014 which were separable into 8,270,027 shares of Series D Preferred Stock, 41,350 Class A warrants to purchase common stock exercisable at $4.92 per warrant which expire in July 2021 and 41,350 Series B warrants exercisable at $0.20 which expire in July 2021. Upon the closing of our IPO, the Series D Preferred Stock converted into 41,350 shares of common stock at a conversion ratio of 200 to 1.
In March 2014, we issued a convertible promissory note with an 8% interest rate and 12,500 warrants to purchase common stock to DRS, LLC, an entity controlled by Mr. Spafford. The consideration paid by DRS, LLC for the note and warrants was $100,000. The maturity date for the promissory note was March 10, 2015, or upon a qualified equity financing of at least $5 million. This financing was for general working capital purposes. The principal balance of this note, along with accrued interest of $3,112 converted to 4,124,493 Series D Units at $0.025 per unit in July 2014 which were separable into 4,124,493 shares of Series D Preferred Stock, 20,622 Class A warrants to purchase common stock exercisable at $4.92 per warrant which expire in July 2021 and 20,622 Series B warrants exercisable at $0.20 which expire in July 2021. Upon the closing of our IPO, the Series D Preferred Stock converted into 20,622 shares of common stock at a conversion ratio of 200 to 1.
In July 2014, the Company entered into a note agreement for $500,000 with Spring Forth Investments, LLC a company owned by Mr. Spafford. The maturity date for the note is July 18, 2015. The note pays interest at an annual rate of 20% and is paid monthly. The Company may extend the due date of the note to July 18, 2016 by giving notice no later than April 18, 2015 and paying an extension fee of $10,000. The Company prepaid the last three months of interest for a total of $25,000 at the time of issuance of the note. As additional consideration for the note, the Company issued 4,000,000 Series D preferred stock units (which are separable into 4,000,000 shares of Series D preferred stock, 20,000 Class A warrants to purchase a share of common stock at $4.92 and 20,000 Class B warrants to purchase a share of common stock at $0.20) at a value of $100,000 or $0.025 per unit. The Series D preferred stock units were accounted as a debt discount to be amortized over the life of the note. As of December 31, 2014 the unamortized debt discount was $58,333. Upon the closing of our IPO, the 4,000,000 shares of Series D Preferred Stock converted into 20,000 shares of common stock at a conversion ratio of 200 to 1.
In April 2014, the Company entered into two Financial Advisory Agency Agreements with Rona Capital, LLC, an entity owned by Jeffrey A. Rona. Mr. Rona became our Chief Financial Officer in October 2014. The first agreement was for financial advisory services related to the Company’s ongoing financing activities prior to the filing of an S-1 registration with the SEC. The Company agreed to pay Rona Capital $15,000 per month plus reasonable out-or-pocket expenses. In addition, the Company issued warrants to Rona Capital to purchase 7,200,000 Series D units which were separable into 7,200,000 Series D Preferred Shares, 36,000 Class A warrants to purchase a share of common stock exercisable at $4.92 and 36,000 Class B warrants to purchase a share of common stock exercisable at $0.20 pursuant to the initial S-1 filing with the SEC. The Company also indemnified Rona Capital for claims arising from the agreement, subject to certain exceptions. This agreement terminated upon the final closing of the Series D Preferred Stock financing. Upon the closing of our IPO, the 7,200,000 shares of Series D Preferred Stock converted into 36,000 shares of common stock at a conversion ratio of 200 to 1.
The Company also entered into a second Financial Advisory Agency Agreement with Rona Capital effective in June 2014, wherein Rona Capital provided the Company with financial advisory services related to the Company’s ongoing financing activities. The Company paid Rona Capital $15,000 per month and additional cash amounts on the achievement of specified milestones, including $50,000 upon the filing of an S-1 with the SEC and $100,000 upon the closing of an initial public offering.
F-25
Table of Contents
GREAT BASIN SCIENTIFIC, INC.
NOTES TO FINANCIAL STATEMENTS
NOTE 13 INCOME TAXES
The Company utilizes the asset and liability approach to measuring deferred tax assets and liabilities based on temporary differences existing at each balance sheet date using currently enacted tax rates in accordance with FASB ASC 740. Deferred tax assets are reduced by a valuation allowance when, in the opinion of management, it is more likely than not that some portion or all of the deferred tax assets will not be realized. Deferred tax assets and liabilities are adjusted for the effects of changes in tax laws and rates on the date of enactment.
The income tax expense for the years ended December 31, 2014 and 2013 consists of the following:
| 2014 | 2013 | |||||||
| Current |
||||||||
| Federal |
$ | — | $ | — | ||||
| State and Local |
5,297 | 1,250 | ||||||
|
|
|
|
|
|||||
| 5,297 | 1,250 | |||||||
|
|
|
|
|
|||||
| Deferred |
||||||||
| Federal |
— | — | ||||||
| State and Local |
— | — | ||||||
|
|
|
|
|
|||||
| — | — | |||||||
|
|
|
|
|
|||||
| $ | 5,297 | $ | 1,250 | |||||
|
|
|
|
|
|||||
The following is a reconciliation of the reported amount of income tax expense (benefit) for the years ended December 31, 2014 and 2013 to the amount of income tax expenses that would result from applying the statutory rate to pretax income.
The components of the Company’s deferred tax assets for the years ended December 31, 2014 and 2013 are as follows:
| 2014 | 2013 | |||||||
| Current deferred tax assets: |
||||||||
| Allowance for doubtful accounts |
$ | 2,035 | $ | 2,035 | ||||
| Accrued vacation |
85,081 | 131,302 | ||||||
| Accrued personal property tax |
4,048 | 37,012 | ||||||
|
|
|
|
|
|||||
| Total current deferred tax assets |
91,164 | 170,349 | ||||||
|
|
|
|
|
|||||
| Non-current deferred tax assets |
||||||||
| Net operating losses |
18,229,887 | 13,674,825 | ||||||
| Depreciation and amortization |
162,344 | 15,935 | ||||||
| Other |
171 | 171 | ||||||
| Total non-current deferred tax assets |
18,392,402 | 13,690,931 | ||||||
|
|
|
|
|
|||||
| Total deferred tax assets |
18,483,566 | 13,861,280 | ||||||
| Less: Valuation allowance |
(18,483,566 | ) | (13,861,280 | ) | ||||
|
|
|
|
|
|||||
| Net deferred tax assets |
$ | — | $ | — | ||||
|
|
|
|
|
|||||
F-26
Table of Contents
GREAT BASIN SCIENTIFIC, INC.
NOTES TO FINANCIAL STATEMENTS
Reconciliation of reported amount of income tax expense for the years ended December 31, 2014 and 2013 consists of the following:
| 2014 | 2013 | |||||||
| Benefit for income taxes computed at federal statutory rate |
$ | (7,385,656 | ) | $ | (3,250,410 | ) | ||
| State income taxes, net of federal tax benefit |
(407,156 | ) | (214,899 | ) | ||||
| Non-deductible expenses |
3,024,860 | 7,472 | ||||||
| Increase in valuation allowance |
4,622,286 | 3,459,087 | ||||||
| Other, net |
150,963 | — | ||||||
|
|
|
|
|
|||||
| Provision for income taxes |
$ | 5,297 | $ | 1,250 | ||||
|
|
|
|
|
|||||
| Effective tax rate |
(0.07% | ) | (0.04% | ) | ||||
|
|
|
|
|
|||||
As of December 31, 2014 the Company has generated operating losses. As a result the Company has recorded a full valuation allowance against its net deferred tax assets as of December 31, 2014 and 2013. The valuation allowance increased by $4,622,286 during the tax year ended December 31, 2014.
As of December 31, 2014 and 2013, the Company has a net operating loss carry forwards for Federal income tax purposes of $51.8 million and $37.8 million, respectively, which expire in varying amounts during the tax years 2023 and 2034. The Company has net operating loss carry forwards for State income tax purposes of $32.5 million and $26.3 million which expire in varying years from 2023 to 2034.
Under FASB ASC 740, tax benefits are recognized only for tax positions that are more likely than not to be sustained upon examination by tax authorities. The amount recognized is measured as the largest amount of benefit that is greater than 50 percent likely to be realized upon ultimate settlement. Unrecognized tax benefits are tax benefits claimed in the Company’s tax returns that do not meet these recognition and measurement standards. As of December 31, 2014 and 2013, the Company has no liabilities for unrecognized tax benefits.
The Company’s policy is to recognize potential interest and penalties accrued related to unrecognized tax benefits within income tax expense. For the years ended December 31, 2014, and 2013, the Company did not recognize any interest or penalties in its statement of operations, nor did it have any interest or penalties accrued in its balance sheet at December 31, 2014 and 2013 relating to unrecognized tax benefits.
The tax years 2010-2014 remain open to examination for federal income tax purposes and by the other major taxing jurisdictions to which the Company is subject.
NOTE 14 LEGAL PROCEEDINGS
We are not currently a party to any pending or threatened legal proceeding or regulatory or government investigations. We may become involved in litigation from time to time relating to claims arising in the ordinary course of our business. We do not believe that the ultimate resolution of such claims would have a material effect on our business, results of operations, financial condition or cash flows. However, the results of these matters cannot be predicted with certainty, and an unfavorable resolution of one or more of these matters could have a material effect on our business, results of operations, financial condition and cash flows.
F-27
Table of Contents
GREAT BASIN SCIENTIFIC, INC.
NOTES TO FINANCIAL STATEMENTS
NOTE 15 GEOGRAPHIC INFORMATION
The Company has both domestic (U.S.) and international customers for its products. Sales for the years ended December 31, 2014 and 2013 were as follows:
| 2014 | 2013 | |||||||
| Domestic sales |
$ | 1,559,614 | $ | 736,215 | ||||
| International sales |
46,640 | 24,431 | ||||||
|
|
|
|
|
|||||
| Total sales |
$ | 1,606,254 | $ | 760,646 | ||||
|
|
|
|
|
|||||
NOTE 16 SUBSEQUENT EVENTS
In January of 2015 the Company filed a S-1 registration statement for the sale of an unspecified number of units consisting of Series E convertible preferred stock and warrants to purchase the Company’s common stock. The registration has not yet become effective.
On February 12, 2015, the Company entered into a loan agreement for $250,000 with Spring Forth Investments, LLC, an entity controlled by Mr. Spafford. The loan bears interest at a rate of twelve percent (12%) per year and has a maturity date of the earlier of (i) 90 days from the date of the loan agreement, or (ii) five days after the closing of a registered public offering of securities of the Company. Upon the earlier to occur of the maturity date or the prepayment of the loan, the Company will be obligated to pay a termination fee equal to five percent (5%) of the principal balance of the loan. Payment of the principal balance of the loan plus any accrued interest due and payable may be accelerated upon an event of default by the Company pursuant to the terms and conditions of the loan agreement.
F-28