Attached files
| file | filename |
|---|---|
| 8-K - FORM 8-K - SOUTHERN Co GAS | form_8-k.htm |
| EX-99.1 - PRESS RELEASE - SOUTHERN Co GAS | exhibit_99-1.htm |

Fourth Quarter and Year-End 2014 Earnings Presentation February 12, 2015

Cautionary Statements & Supplemental Information Forward-Looking Statements This presentation contains forward-looking statements. Senior officers and other employees also may make statements to analysts, investors, regulators, the media and others that are forward-looking. Forward-looking statements include matters that are not historical facts, such as statements regarding our future operations, prospects, strategies, financial condition, economic performance (including growth and earnings), industry conditions and demand for our products and services. Because these statements involve anticipated events or conditions, forward-looking statements often include words such as "anticipate," "assume," "believe," "can," "could," "estimate," "expect," "forecast," "future," "goal," "indicate," "intend," "may," "outlook," "plan," "potential," "predict," "project," "seek," "should," "target," "would," or similar expressions. Forward-looking statements contained in this presentation include, without limitation, statements regarding when we expect to realize earnings related to our mark-to-market hedge movements, regulatory filings and approvals, pipeline investments and infrastructure programs and their impact on future periods, financing activities, performance expectations and growth potential in future periods, segment EBIT expectations, priorities for 2015 and 2015 earnings guidance and related expectations and assumptions. Our expectations are not guarantees and are based on currently available competitive, financial and economic data along with our operating plans. While we believe our expectations are reasonable in view of the currently available information, our expectations are subject to future events, risks and uncertainties, and there are several factors - many beyond our control - that could cause results to differ materially from our expectations. Actual results may differ materially from those suggested by the forward-looking statements for a number of reasons including, but not limited to, changes in price, supply and demand for natural gas and related products; the impact of changes in state and federal legislation and regulation, including changes related to climate change; actions taken by government agencies on rates and other matters, including regulatory approval of new partnerships and infrastructure programs; impact of any material weakness on our internal control over financial reporting; concentration of credit risk; utility and energy industry consolidation; the impact on cost and timeliness of construction projects by government and other approvals; development project delays; adequacy of supply of diversified vendors; unexpected change in project costs, including the cost of funds to finance these projects; the impact of acquisitions and divestitures; limits on natural gas pipeline capacity; direct or indirect effects on our business, financial condition or liquidity resulting from a change in our credit ratings or the credit ratings of our counterparties or competitors; interest rate fluctuations; financial market conditions, including disruptions in the capital markets and lending environment and the current economic uncertainty; general economic conditions; uncertainties about environmental issues and the related impact of such issues, including our environmental remediation plans; the impact of changes in weather, including climate change, on the temperature-sensitive portions of our business; the impact of natural disasters such as hurricanes on the supply and price of natural gas; the outcome of litigation; acts of war or terrorism; and other factors which are provided in detail in our filings with the Securities and Exchange Commission. Forward-looking statements are only as of the date they are made, and we disclaim any obligation to update these statements to reflect subsequent changes, except as required by law. Supplemental Information Company management evaluates segment financial performance based on operating margin and earnings before interest and taxes (EBIT), which include the effects of corporate expense allocations. The company believes EBIT is a useful measurement of its performance because it provides information that can be used to evaluate the effectiveness of its businesses from an operational perspective, exclusive of the costs to finance those activities and exclusive of income taxes, neither of which is directly relevant to the efficiency of those operations. Further, management calculates “economic earnings” in relation to EBIT reported on a GAAP basis for the wholesale services segment in order to assess and evaluate earnings generated during the year. The company believes economic earnings is a useful measurement of the wholesale services’ segment as it provides information excluding the volatility effects resulting from mark-to-market, LOCOM accounting adjustments and gains or losses from dispositions recorded during the prior period, as well as the offset of mark-to-market gains or losses reported in prior periods. Operating margin is a non-GAAP measure calculated as operating revenues minus cost of goods sold and revenue taxes, excluding operation and maintenance expense, depreciation and amortization, certain taxes other than income taxes, and gains or losses on the sale of assets, if any. These items are included in the company's calculation of operating income. The company believes operating margin is a better indicator than operating revenues of the contribution resulting from customer growth, since cost of gas and revenue taxes are generally passed directly through to customers. In addition, we use a non-GAAP measure of adjusted earnings per share (EPS) that excludes the impacts of our wholesale services segment and our discontinued operations. The company believes presenting EPS excluding wholesale services provides investors with an additional measure of operating performance excluding the volatility effects resulting from mark-to-market and LOCOM accounting adjustments in the wholesale services segment. In addition, income (loss) related to the sale of Tropical Shipping are reflected as discontinued operations, and the company believes excluding the impacts of discontinued operations provides a more accurate view of earnings from continuing operations. Operating margin and adjusted EPS should not be considered as alternatives to, or more meaningful indicators of, the company's operating performance than net income attributable to AGL Resources Inc., operating income or EPS as determined in accordance with GAAP. In addition, the company's operating margin and adjusted EPS may not be comparable to similarly titled measures of another company. Reconciliations of non-GAAP financial measures referenced in this presentation are attached as an exhibit to this presentation and also are available on the company’s website at www.aglresources.com under the Investor Relations section. *

Record EPS from continuing operations of $4.71 for 2014, an increase of 92% over 2013 EPS of $2.45 2014 EPS excluding wholesale services of $2.55 compared to $2.47 in 2013 Announced 4.1% dividend increase on 2/3/15 2015 EPS guidance initiated at $2.70-$2.90 on a consolidated basis, and $2.65-$2.75 excluding wholesale services 3-year EPS CAGR target raised to 5% - 8%, 5-year EPS CAGR target raised to 6% - 9% Key Financial Highlights *

Announced investment in three major interstate pipelines totaling approximately $670 million Completed sale of Tropical Shipping, which generated after-tax cash proceeds and distributions of $225 million Deployed $715 million of capital into regulated utilities, of which approximately $165 million was related to rider programs Anticipate 9-year, $1.5 billion “Investing in Illinois” infrastructure replacement program Issued sharing payments of $47 million to AGL Resources utility customers through asset management agreements with Sequent, compared to $18 million and $15 million in 2013 and 2012, respectively Effectively managed wholesale storage and transportation portfolios to achieve strongest earnings in Sequent’s history 2014 Significant Accomplishments *

2014 Financial Results * Note: Please review the AGL Resources 10-K filed with the SEC on 2/12/15 for detailed information. Operating Margin and Adjusted EPS from continuing operations excluding wholesale services are non-GAAP measures. Please see the appendix to this presentation or visit the investor relations section of www.aglresources.com for a reconciliation to GAAP. Adjusted for cost of goods sold and revenue tax expenses for Nicor Gas, which are passed directly through to customers. 2013 includes $11 million, or $0.04 EPS, from the sale of Compass Energy in May 2013, and 2014 includes a $3 million, or $0.01 EPS, payment related to settlement of an earn out provision from the 2013 sale of Compass Energy. Adjusted EPS from continuing operations excludes wholesale services EPS of $2.16 for 2014 and a net loss of $(0.02) for 2013. Strong operating performance Record earnings, up 92%, driven by: Strong wholesale services commercial activity and net hedge gains Non-weather related customer usage and growth Colder-than-normal weather across distribution and retail Operating expense up 3%, including higher compensation expense related to record wholesale earnings 2014 HIGHLIGHTS
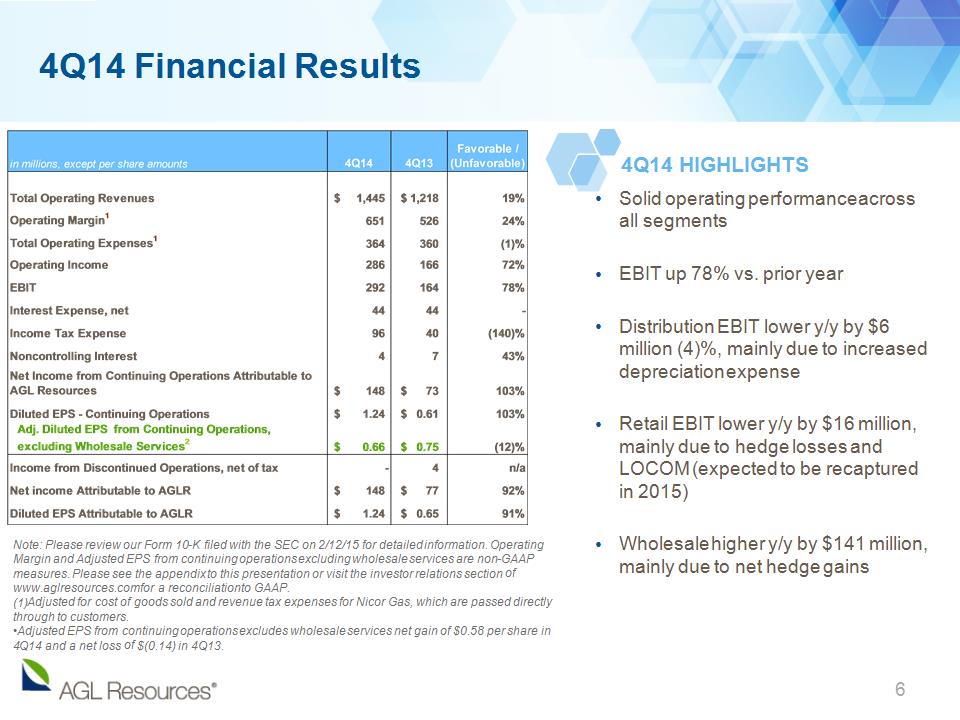
4Q14 Financial Results * Note: Please review our Form 10-K filed with the SEC on 2/12/15 for detailed information. Operating Margin and Adjusted EPS from continuing operations excluding wholesale services are non-GAAP measures. Please see the appendix to this presentation or visit the investor relations section of www.aglresources.com for a reconciliation to GAAP. Adjusted for cost of goods sold and revenue tax expenses for Nicor Gas, which are passed directly through to customers. Adjusted EPS from continuing operations excludes wholesale services net gain of $0.58 per share in 4Q14 and a net loss of $(0.14) in 4Q13. Solid operating performance across all segments EBIT up 78% vs. prior year Distribution EBIT lower y/y by $6 million (4)%, mainly due to increased depreciation expense Retail EBIT lower y/y by $16 million, mainly due to hedge losses and LOCOM (expected to be recaptured in 2015) Wholesale higher y/y by $141 million, mainly due to net hedge gains 4Q14 HIGHLIGHTS

2014 EBIT of $581 million, 6% higher vs. 2013 $22 million y/y positive margin related to customer usage and growth $8 million year-over-year positive impact of significantly colder-than-normal weather in 2014 relative to prior year, net of weather-related expense ($20 million vs. normal) O&M up 2% mainly due to higher expenses related to pipeline compliance work and weather-related expenses 4Q14 EBIT down 4% compared to prior year Increased margin from higher customer usage and growth offset primarily by higher depreciation expense and expense related to distribution system compliance programs Distribution Operations * DISTRIBUTION HIGHLIGHTS

Retail Operations * 2014 EBIT of $132 million equal to prior year $11 million y/y positive margin from higher customer usage, growth and service contracts Colder-than-normal weather increased margin by $5 million, net of weather hedges and expense, with primary impacts in Georgia and Illinois ($14 million vs. normal) Additional margin benefit of $9 million from acquisitions in 2013 Offset by temporal mark-to-market hedge losses and LOCOM of $16 million O&M expense up 11% Higher expenses related to higher legal and bad debt expenses and increased variable compensation expense 4Q14 EBIT down by $16 million vs. prior year due to $16 million of hedge losses and LOCOM that will be realized in 2015 Georgia market share stable y/y RETAIL HIGHLIGHTS

Wholesale Services * WHOLESALE HIGHLIGHTS 2014 EBIT of $422 million strongest in Sequent’s 15 years of operation Three primary drivers: strong commercial activity, earnings realization of 2013 MTM losses, earnings “pull forward” of 2015 positions related to sharply falling natural gas prices at the end of 2014 Commercial activity of $444 million, compared to $129 million of commercial activity in 2013 Mark-to-market gain on storage and transportation hedge positions, net of LOCOM, was $57 million vs. net losses of $90 million in 2013 4Q14 EBIT up $141 million vs. prior year Net mark-to-market gain on storage and transportation hedge positions of $84 million vs. net losses of $72 million in 4Q13 O&M expense increase due to higher variable compensation expense related to record earnings

Three months ended December 31, Three months ended December 31, Wholesale services EBIT (1) $114 $(27) Current quarter and prior year-end realized storage roll-out, net (21) 5 Current transportation hedge movement, net of prior period hedge offset (85) 40 Deferred incentive compensation (8) - Economic Earnings $ - $18 Economic earnings adjusts wholesale services’ EBIT by adjusting for mark-to-market accounting recorded during the current period, offset by mark-to-market accounting adjustments reported in prior periods related to Sequent’s natural gas transportation portfolio. Economic earnings further reflect the changes in wholesale services’ storage roll-out value. In 2014, wholesale services achieved $277 million of economic earnings compared to $69 million in 2013. Wholesale Services – Economic Earnings * Full Year Full Year $422 $(14) (31) - (106) 83 (8) - $277 $69 2014 2014 2013 2013 (1) Excludes $11 million gain on sale of Compass Energy in May 2013 and 2014 includes a $3 million payment related to the settlement of an earn out provision from the sale.

Midstream Operations * 2014 EBIT declined $7 million year-over-year primarily due to the $10 million fuel true-up at one of our storage facilities 4Q14 EBIT improved by $8 million year-over-year Sawgrass storage impairment of $8 million in 4Q13 Segment remains challenged, however market rates and fundamentals have modestly improved in recent months MIDSTREAM HIGHLIGHTS

Balance Sheet * Solid balance sheet with significant opportunity to fund capital requirements Good access to capital markets Company credit metrics support solid, investment-grade ratings $5.0 billion debt outstanding Long-term debt: $3.6 billion $200 million of senior notes redeemed with commercial paper at its maturity in January 2015 Short-term debt: $1.2 billion Debt-to-Cap Ratio: 55% Expect to be more active in debt market over next two years to refinance existing, maturing debt as well as to issue new debt related to higher capital expenditures Executed forward starting interest rate swaps for $800 million in 10 and 30 year tranches in January 2015 to lock in underlying rates associated with planned debt issuances BALANCE SHEET HIGHLIGHTS

2015 EPS Guidance *

2015 EPS Guidance Assumptions * Key assumptions for EPS guidance include: Normal weather Interest expense of $175 million to $180 million Pension expense of $45 million to $49 million (before capitalizations) Effective tax rate of 37.9% Average diluted shares outstanding of 120.3 million Successful implementation of regulatory infrastructure programs Capital expenditures of $1.1 billion, including ~$425 million of rider-related expenditures and ~$115 million related to non-utility operations The wholesale services segment is expected to generate economic earnings of $50 million in 2015. However, EPS on a GAAP basis in the wholesale services segment is expected to be approximately $0.10 per share, reflecting the offset of hedge gains in 2014 related to 2015 transactions. This estimate excludes mark-to-market movements that may impact EPS in 2015. Reported EBIT for the wholesale services segment will be provided each quarter along with a reconciliation to economic earnings.

Key Variances – 2014A to 2015E * When normalized for weather and one-time items, y/y growth is 11.6% When further normalized for hedge movements at retail, y/y growth is 6.5% (1) Weather impact of $34 million across distribution and retail; $5 million of synergy sharing savings in GA; $4 million of other one-time items.

Key Distribution Variances – 2014A to 2015E * When normalized for weather and one-time items, y/y growth is 4.7% (1) Weather impact of $20 million; $5 million of synergy sharing savings in GA; $4 million of other one-time items.

CAGR Targets Increased * Capital expenditures funded by cash and debt issuance, while remaining solidly in current ratings categories; no equity issuance planned Prior 3-Year Outlook 5-Year Outlook Target EPS Growth CAGR 4%-6% 5%-8% 6%-9%+ Target Rate Base Growth 4.5%-5.5% 7%-9% 7%-9% Estimated Capital Expenditures $750 M annually with ~22% under riders $4.7 B over five years with ~40% under riders $4.7 B over five years with ~40% under riders New Pipeline Investment EBIT Estimate n/a 2017: ~$20 M 2018: ~$40 M 2019: ~$40 M Rate Case Assumptions No rate cases since 2010 Rate case filings expected in several jurisdictions TBD

“Investing in Illinois” program underway with plans for capital spend of approximately $200 million in 2015 and $250 million in each of 2016 and 2017 Pipeline Replacement Program (PRP) true-up filing anticipated in Georgia next week; requesting increase of the current surcharge collected under STRIDE to recover amounts spent but not yet collected due to surcharge freeze agreed to in 2005 $210 million investment in Dalton pipeline which brings additional supplies into Georgia; largest portion of spending in 2016, and expected in-service date of 2017 ~$200 million investment in PennEast pipeline; will bring additional supplies into New Jersey; construction expected to begin in 2017, and expected in-service date in late 2017 ~$260 million investment in Atlantic Coast Pipeline which brings additional supplies into Virginia; construction expected to begin in late 2016, and expected in-service date in late 2018 Discussions ongoing with Tallgrass and interested parties on proposed Prairie State Pipeline Additional Business Updates * Pipeline Investments Summary Infrastructure Investment Programs

AGL Resources - 2015 Priorities Invest necessary capital to maintain and enhance system reliability Remain a low-cost leader within the industry Opportunistically expand system and capitalize on potential customer conversions Maintain margins in Georgia and Illinois while continuing to expand into other profitable retail markets Continue to grow and expand Pivotal Home Solutions Maximize strong storage and transportation positions Effectively perform on existing asset management agreements and expand customers Grow gas supply to power generation markets Optimize storage portfolio, including expiring contracts Execute, in conjunction with partners, on interstate pipeline investments Pursue land-based LNG transportation opportunities Effectively control expenses and focus on capital discipline in each of our business segments * DISTRIBUTION RETAIL WHOLESALE MIDSTREAM EXPENSES

Appendix

Distribution - Regulatory Recovery Mechanisms Utility Rate Decoupling Weather Normalization Bad Debt Recovery Conservation Program Recovery Infrastructure Programs Nicor Gas (~70% Fixed) P P P Atlanta Gas Light P (Straight-Fixed-Variable) P Virginia Natural Gas P (Revenue Normalization) P P P P Elizabethtown Gas P P P Florida City Gas P Chattanooga Gas P* (Revenue Normalization) P P P* * *Chattanooga Revenue Normalization Adjustment (RNA) was set to expire in May 2014, but it has been extended in its current form until the Commission concludes a proceeding on the matter. Currently no proceeding or hearings on the issue have been scheduled.
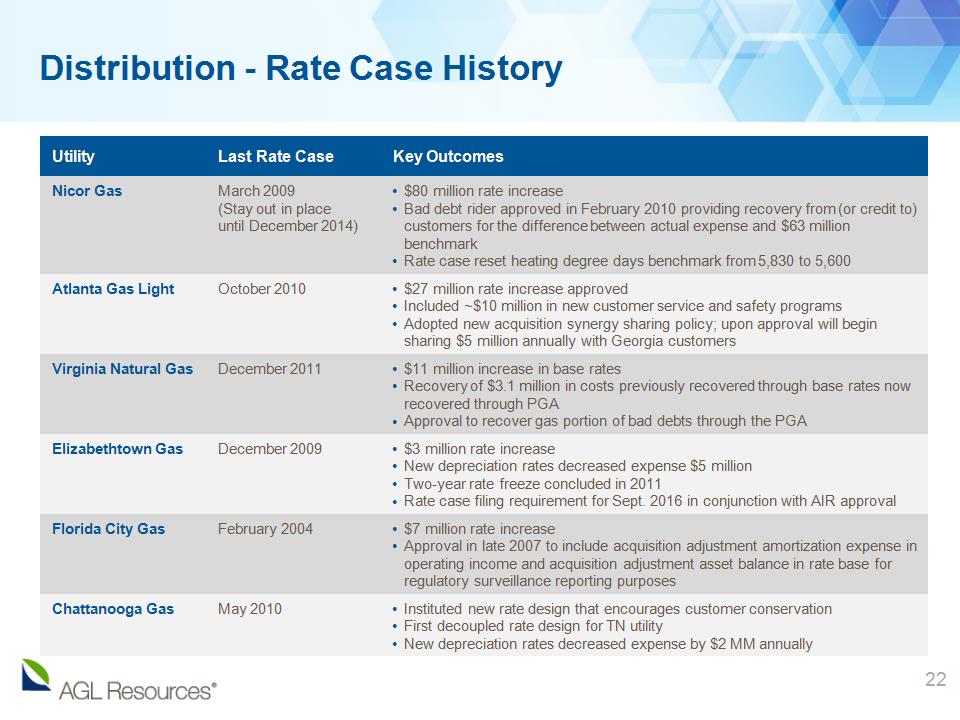
* millions redeemed Utility Last Rate Case Key Outcomes Nicor Gas March 2009 (Stay out in place until December 2014) $80 million rate increase Bad debt rider approved in February 2010 providing recovery from (or credit to) customers for the difference between actual expense and $63 million benchmark Rate case reset heating degree days benchmark from 5,830 to 5,600 Atlanta Gas Light October 2010 $27 million rate increase approved Included ~$10 million in new customer service and safety programs Adopted new acquisition synergy sharing policy; upon approval will begin sharing $5 million annually with Georgia customers Virginia Natural Gas December 2011 $11 million increase in base rates Recovery of $3.1 million in costs previously recovered through base rates now recovered through PGA Approval to recover gas portion of bad debts through the PGA Elizabethtown Gas December 2009 $3 million rate increase New depreciation rates decreased expense $5 million Two-year rate freeze concluded in 2011 Rate case filing requirement for Sept. 2016 in conjunction with AIR approval Florida City Gas February 2004 $7 million rate increase Approval in late 2007 to include acquisition adjustment amortization expense in operating income and acquisition adjustment asset balance in rate base for regulatory surveillance reporting purposes Chattanooga Gas May 2010 Instituted new rate design that encourages customer conservation First decoupled rate design for TN utility New depreciation rates decreased expense by $2 MM annually Distribution - Rate Case History

* millions redeemed GAAP Reconciliation – Net Income

* millions redeemed GAAP Reconciliation – 4Q EBIT Our other segment now also includes our investment in Triton, which was part of our cargo shipping segment and has been classified as discontinued operations.

GAAP Reconciliation - Full-Year EBIT * Our other segment now also includes our investment in Triton, which was part of our cargo shipping segment and has been classified as discontinued operations.

* millions redeemed GAAP Reconciliation – EPS