Attached files
| file | filename |
|---|---|
| 8-K - FORM 8-K - GLOBE SPECIALTY METALS INC | form8k2q2015.htm |
| EX-99.1 - PRESS RELEASE Q2 FY15 - GLOBE SPECIALTY METALS INC | pressrelease2q2015.htm |

February 10, 2015 2nd Quarter 2015 Earnings Call

Disclaimer This presentation may contain statements that relate to future events and expectations and, as such, constitute "forward-looking statements" within the meaning of the federal securities laws. These statements can be identified by the use of words such as “believes,” “expects,” “may,” “will,” “intends,” “plans,” “estimates” or “anticipates,” or other comparable terminology, or by discussions of strategy, plans or intentions. These statements are based on management’s current expectations and assumptions about the industries in which Globe operates. Globe disclaims any intention or obligation to update publicly any forward-looking statements, whether in response to new information, future events or otherwise, except as required by applicable law. Forward-looking statements are not guarantees of future performance and are subject to significant risks and uncertainties that may cause actual results or achievements to be materially different from the future results or achievements expressed or implied by the forward-looking statements. These risks and uncertainties include, but are not limited to, those risks and uncertainties described in Globe’s most recent Annual Report on Form 10-K, including under “Special Note Regarding Forward-Looking Statements” and “Risk Factors” and Globe’s quarterly reports on Form 10-Q. These reports can be accessed through the “Investors” section of Globe’s website at www.glbsm.com. EBITDA, adjusted EBITDA and adjusted diluted earnings per share are non-GAAP measures. Reconciliations of these measures to the comparable GAAP financial measures are provided in the financial statements included in Globe’s most recent earnings press release, available through the “Investors” section of Globe’s website at www.glbsm.com. All references to “MT” or “tons” mean metric tons, each of which equals 2,204.6 pounds.

2nd Quarter 2015 Financial Highlights 1 Adjusted EBITDA for the second quarter increased 43% to $37.4 million and up 8% from the prior quarter. Adjusted EBITDA % was 18.9%, up by 4.2% or 29% for the second quarter of last year and up 2.1% from the prior quarter. Adjusted diluted earnings per share attributable to GSM for the second quarter were $0.21, up 62% from the second quarter of last year and up 11% from the prior quarter. Sales of $198.0 million in the second quarter, up 11% from the second quarter of last year and down 4% from the prior quarter. The Board of Directors announced a Quarterly Dividend of $0.08 per share to be paid on March 12, 2015 to Shareholders of Record as of February 26, 2015.

| * Impact of Conversion of Silicon Alloy Capacity to Silicon Metal Capacity and transfer of alloy production to South Africa 1 Converted 40,000 MT of Silicon Alloy production to 24,000 MT of Silicon Metal production Higher Inventory – South Africa Finished Goods & Coal Lower Ferrosilicon Sales – Converted Ferrosilicon to Silicon Metal in US & 3 month SA Lead Time to Export Customers (temporary) Higher Silicon Metal Sales – Converted Ferrosilicon to Silicon Metal in US Higher Profitability - Margins Higher on Silicon Metal

| * 1 EBITDA margin increased from 16.8% to 18.9% sequentially Revenue was lower due to seasonal impact and longer transportation cycle time from South Africa $3.0M South Africa Sales - Cycle Time $3.4M By-products - Seasonality $1.6M Slurry/Dross - Seasonality $1.2M Medium Ash Coal - Seasonality $0.7M Fume - Seasonality Inventory/Working Capital Increased Due to Transition $10M South Africa - Cycle Time $14M North American Plants - Seasonality Conversion of Silicon Alloy Capacity to Silicon Metal Capacity and Transferring of Silicon Alloy Production to South Africa
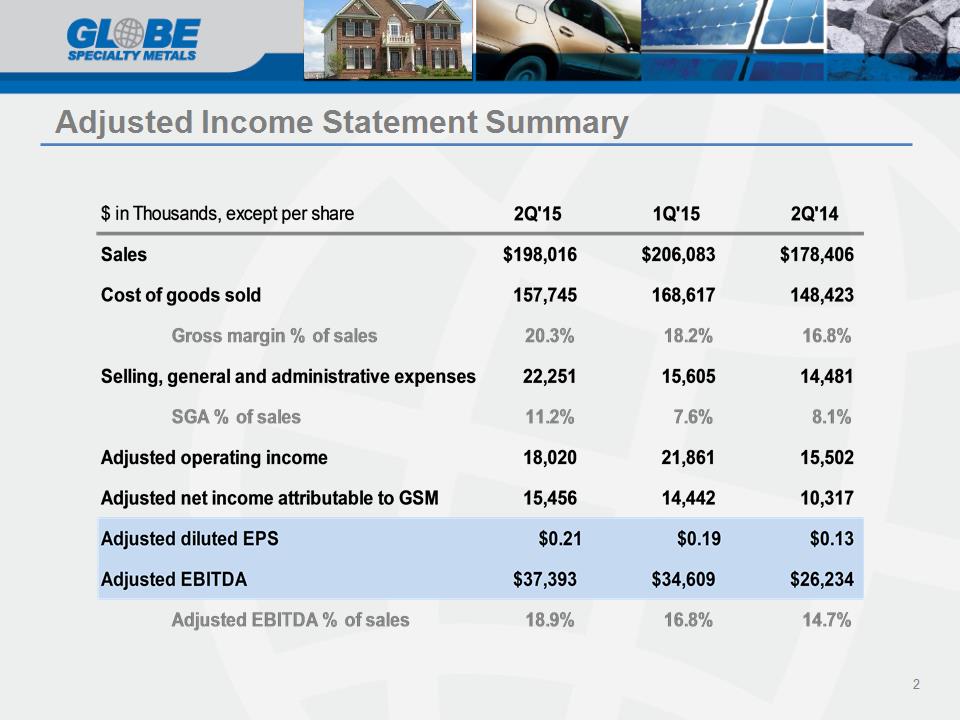
Adjusted Income Statement Summary 2

2nd Quarter 2015 Special Items 3

2nd Quarter 2015 Reported Results 4

5 Sequential Adj. EBITDA Bridge, $m Adjusted EBITDA Bridge – Sequential Quarter

6 Net Debt Bridge – Sequential Quarter Sequential Net Debt Bridge, $m Note: Net debt calculated as total debt outstanding less cash and cash equivalents and marketable securities

February 10, 2015 2nd Quarter 2015 Earnings Call