Attached files
| file | filename |
|---|---|
| EX-31.2 - EXHIBIT 31.2 - GLOBE SPECIALTY METALS INC | exhibit31-2.htm |
| EX-31.1 - EXHIBIT 31.1 - GLOBE SPECIALTY METALS INC | exhibit31-1.htm |
| EX-32.1 - EXHIBIT 32.1 - GLOBE SPECIALTY METALS INC | exhibit32-1.htm |
| EX-10.11 - EXHIBIT 10.11 - GLOBE SPECIALTY METALS INC | exhibit10-11.htm |
UNITED STATES SECURITIES AND EXCHANGE COMMISSION
Washington, DC 20549
Form 10-K
|
(Mark One)
|
||
|
þ
|
ANNUAL REPORT PURSUANT TO SECTION 13 OR 15(d) OF THE SECURITIES EXCHANGE ACT OF 1934
|
|
|
For the fiscal year ended June 30, 2011
|
||
|
OR
|
||
|
o
|
TRANSITION REPORT PURSUANT TO SECTION 13 OR 15(d) OF THE SECURITIES EXCHANGE ACT OF 1934
|
|
|
For the transition period from to
|
||
Commission File Number 001-34420
Globe Specialty Metals, Inc.
(Exact name of registrant as specified in its charter)
|
Delaware
|
20-2055624
|
|
(State or other jurisdiction of
incorporation or organization)
|
(I.R.S. Employer
Identification No.)
|
One Penn Plaza
250 West 34th Street, Suite 4125
New York, NY 10119
(Address of principal executive offices, including zip code)
(212) 798-8122
(Registrant’s telephone number, including area code)
Securities registered pursuant to Section 12(b) of the Act:
|
Title of Each Class
|
Name of Each Exchange on Which Registered
|
|||
| Common stock, $0.0001 par value | The NASDAQ Global Select Market |
Securities registered pursuant to Section 12(g) of the Act: None
Indicate by check mark if the registrant is a well-known seasoned issuer, as defined in Rule 405 of the Securities Act. Yes o No þ
Indicate by check mark if the registrant is not required to file reports pursuant to Section 13 or Section 15(d) of the Act. Yes o No þ
Indicate by check mark whether the registrant (1) has filed all reports required to be filed by Section 13 or 15(d) of the Securities Exchange Act of 1934 during the preceding 12 months (or for such shorter period that the registrant was required to file such reports), and (2) has been subject to such filing requirements for the past 90 days. Yes þ No o
Indicate by check mark whether the registrant has submitted electronically and posted on its corporate Web site, if any, every Interactive Data File required to be submitted and posted pursuant to Rule 405 of Regulation S-T (§ 232.405 of this chapter) during the preceding 12 months (or for such shorter period that the registrant was required to submit and post such files). Yes þ No o
Indicate by check mark if disclosure of delinquent filers pursuant to Item 405 of Regulation S-K is not contained herein, and will not be contained, to the best of registrant’s knowledge, in definitive proxy or information statements incorporated by reference in Part III of this Form 10-K or any amendment to this Form 10-K. o
Indicate by check mark whether the registrant is a large accelerated filer, an accelerated filer, a non-accelerated filer, or a smaller reporting company. See the definitions of “large accelerated filer,” “accelerated filer,” and “smaller reporting company” in Rule 12b-2 of the Exchange Act. (Check one):
|
Large accelerated filer þ
|
Accelerated filer o
|
Non-accelerated filer o
|
Smaller reporting company o
|
Indicate by check mark whether the registrant is a shell company (as defined in Rule 12b-2 of the Act). Yes o No þ
As of August 23, 2011, the registrant had 75,317,614 shares of common stock outstanding. As of December 31, 2010 (the last business day of the Registrant's most recently completed second fiscal quarter), the aggregate market value of such shares held by non-affiliates of the Registrant was approximately $1,100.3 million.
DOCUMENTS INCORPORATED BY REFERENCE
Portions of the Registrant's definitive Proxy Statement relating to the 2011 Annual Meeting of Stockholders, filed with the Securities and Exchange Commission, are incorporated by reference in Part III, Items 10 - 14 of this Annual Report on Form 10-K as indicated herein.
Globe Specialty Metals, Inc.
|
Page
|
||||||
|
No.
|
||||||
|
PART I
|
||||||
|
1
|
||||||
|
1
|
1
|
|||||
|
1A
|
9
|
|||||
|
1B
|
15
|
|||||
|
2
|
16
|
|||||
|
3
|
16
|
|||||
|
4
|
16
|
|||||
|
PART II
|
||||||
|
5
|
17
|
|||||
|
6
|
18
|
|||||
|
7
|
19
|
|||||
|
7A
|
31
|
|||||
|
8
|
32
|
|||||
|
9
|
32
|
|||||
|
9A
|
32
|
|||||
|
9B
|
32
|
|||||
|
PART III
|
||||||
|
10
|
33
|
|||||
|
11
|
33
|
|||||
|
12
|
33
|
|||||
|
13
|
33
|
|||||
|
14
|
33
|
|||||
|
PART IV
|
||||||
|
15
|
34
|
|||||
|
36
|
||||||
Special Note Regarding Forward-Looking Statements
This Annual Report on Form 10-K contains “forward-looking statements” as that term is used in the Private Securities Litigation Reform Act of 1995. The forward-looking statements are contained principally in the sections entitled “Business,” “Risk Factors,” and “Management’s Discussion and Analysis of Financial Condition and Results of Operations.” In some cases, you can identify forward-looking statements by terms such as “anticipates,” “believes,” “could,” “estimates,” “expects,” “intends,” “may,” “plans,” “potential,” “predicts,” “projects,” “should,” “will,” “would” and similar expressions intended to identify forward-looking statements. These statements involve known and unknown risks, uncertainties, and other factors which may cause our actual results, performance, or achievements to be materially different from any future results, performance, or achievements expressed or implied by the forward-looking statements. Forward-looking statements include statements about:
|
|
•
|
the anticipated benefits and risks associated with our business strategy;
|
|
|
•
|
our future operating results and the future value of our common stock;
|
|
|
•
|
the anticipated size or trends of the markets in which we compete and the anticipated competition in those markets;
|
|
|
•
|
our ability to attract customers in a cost-efficient manner;
|
|
|
•
|
our ability to attract and retain qualified management personnel;
|
|
|
•
|
our future capital requirements and our ability to satisfy our capital needs;
|
|
|
•
|
the potential for additional issuances of our securities; and
|
|
|
•
|
the possibility of future acquisitions of businesses or assets.
|
Forward-looking statements reflect our current views with respect to future events and are based on assumptions and subject to risks and uncertainties including, but not limited to:
|
|
•
|
the historic cyclicality of the metals industry and the attendant swings in market price and demand;
|
|
|
•
|
increases in energy costs and the effect on our cost of production;
|
|
|
•
|
disruptions in the supply of power;
|
|
|
•
|
availability of raw materials or transportation;
|
|
|
•
|
cost of raw material inputs and our ability to pass along those costs to customers;
|
|
|
•
|
the concentration of our sales to a limited number of customers and the potential loss of a portion of sales to those customers;
|
|
|
•
|
changes in laws protecting U.S. companies from foreign competition;
|
|
|
•
|
integration and development of prior and future acquisitions; and
|
|
|
•
|
other risks described from time to time in our filings with the United States Securities and Exchange Commission (SEC), including the risks discussed under the heading “Risk Factors” in this Annual Report.
|
Given these uncertainties, you should not place undue reliance on these forward-looking statements. Also, forward-looking statements represent our estimates and assumptions only as of the date the statements are made. You should read this Annual Report on Form 10-K and the documents that we have filed as exhibits completely and with the understanding that our actual future results may be materially different from what we expect. Except as required by law, we assume no obligation to update any forward-looking statements publicly or to update the reasons actual results could differ materially from those anticipated in any forward-looking statements, even if new information becomes available in the future.
Item 1. Business
Overview
Globe Specialty Metals, Inc. and subsidiary companies (GSM, the Company, we, us, or our) is one of the world’s largest and most efficient producers of silicon metal and silicon-based alloys, with approximately 100,000 metric tons (MT) of silicon metal capacity (excluding Dow Corning Corporation’s portion of the capacity of our Alloy, West Virginia plant) and 120,000 MT of silicon-based alloys capacity. Silicon metal, our principal product, is used as a primary raw material in making silicone compounds, aluminum and polysilicon. Our silicon-based alloys are used as raw materials in making steel, automotive components and ductile iron. We control the supply of most of our raw materials, and we capture, recycle and sell most of the by-products generated in our production processes.
1
Our products are currently produced in six principal operating facilities located in the United States and Argentina. Additionally, we operate facilities in Poland and China. Our flexible manufacturing capabilities allow us to optimize production and focus on products that enhance profitability. We also benefit from the lowest average operating costs of any large Western World producer of silicon metal, according to CRU International Limited (CRU), a leading metals industry consultant. CRU defines “Western World” as all countries supplying or consuming silicon metal with the exception of China and the former republics of the Soviet Union, including Russia.
Fiscal 2011 was a very successful and active one for us. Sales and profits grew significantly from the prior year as all our long-term and annual sales contracts for silicon metal expired at the end of calendar 2010 and we entered into new annual contracts at higher prices. In addition, silicon-based alloy pricing, which is typically re-set on a quarterly basis, grew through the year propelled by end market growth. Also, we announced the building of a silicon metal plant in Iceland and the acquisition of Alden Resources, North America’s leading miner of specialty metallurgical coal for the silicon and silicon-based alloy industries. These transactions, as described below, will serve to broaden our product mix, improve our profitability and position us for significant future growth.
|
·
|
In July 2011, we closed on the acquisition of Alden Resources, LLC, North America’s leading miner, processor and supplier of specialty metallurgical coal to the silicon and silicon-based alloys industries and also a supplier of thermal coal to the power industry. Specialty metallurgical coal is a key ingredient in the production of silicon metal. Alden is a major supplier of this type of specialty metallurgical coal to GSM and other silicon producers. By acquiring Alden, we secured a stable, long-term and low-cost supply of this key raw material to support continued growth worldwide while maintaining Alden's position as a leading supplier to other silicon and silicon-based alloy producers. Charcoal, where available, is a more costly alternative to coal and whose cost Globe would have to incur without adequate coal supplies. Alden has approximately 21 million tons of reserves of specialty metallurgical coal used predominately in the silicon and silicon-based alloy industries. Alden is currently operating six mines in Kentucky and Tennessee. Currently, Alden supplies approximately 600,000 tons of coal annually to the silicon and silicon-based alloy markets in North America and overseas, with small quantities including byproducts sold to the thermal market. Alden also owns and operates a coal preparation plant in eastern Kentucky that washes and prepares the coal. The plant is newly upgraded and capable of processing over 2.5 million tons of coal per year. We financed the acquisition with $55,000,000 million of bank debt, at an interest rate of approximately 3%, and with $18,200,000 million of cash from GSM's balance sheet. In addition, the seller could receive a contingent payment of up to $6,800,000 million based on future performance.
|
|
·
|
In February 2011, we announced our intention to build a 40,000 metric ton silicon metal plant in Iceland. We are building the plant with a minority partner, Tomahawk Development Company (Tomahawk), who secured substantially all the environmental and operating permits and the land, and who will own approximately 15% of the plant. We obtained an 18 year, competitively priced power contract for 66 megawatts. Prior to beginning construction, which is expected to take place before the end of calendar 2011, we have a few remaining steps to complete, including obtaining final board of directors approval. The plant is expected to be operational in the second half of calendar 2013. The total project will cost approximately €115,000,000 and will be financed with €79,000,000 of financing provided by two commercial banks, approximately €34,000,000 of cash from GSM, and €2,000,000 from Tomahawk.
|
Volumes shipped in fiscal year 2011 increased more than 20% from our prior fiscal year, with approximately 27% of the increase in volume coming from the acquisition of Core Metals completed in April 2010 net of the arrangement to ship material, at cost, from our former Brazilian plant to a European customer, which ended in December 2010. Our average selling price of silicon metal and silicon-based alloys increased 9% in the fiscal year. We are presently running all of our furnaces at full capacity, subject to planned maintenance outages.
Demand and pricing for silicon metal appears to be primarily driven by strong end user demand for silicones, which are additives to hundreds of products such as cosmetics, textiles, paints and coatings, and by growing demand for polysilicon, which is used to produce photovoltaic (solar) cells. Major silicone and polysilicon producers have announced strong financial results along with expectations for future growth and significant new polysilicon capacity is being built in the United States and abroad. Demand and pricing for silicon-based alloys is largely driven by end user requirements for our customized product offerings from specialty steel producers and foundries. Major customers are growing to support increased auto production, domestically and overseas, and for other uses of specialty steel and castings.
Business segments
GMI
GMI currently operates five principal production facilities in the United States located in Beverly, Ohio, Alloy, West Virginia, Selma, Alabama, Niagara Falls, New York and Bridgeport, Alabama.
Globe Metais
Globe Metais is a distributor of silicon metal manufactured in Brazil. This segment includes the historical Brazilian manufacturing operations, comprised of a manufacturing plant in Breu Branco, mining operations and forest reserves, which were sold on November 5, 2009. Subsequent to this divestiture, Globe Metais’ net sales relate only to the fulfillment of certain retained customer contracts, which were completed as of December 31, 2010.
Globe Metales
Globe Metales operates a production facility in Mendoza, Argentina and a cored-wire fabrication facility in San Luis, Argentina. Globe Metales specializes in producing silicon-based alloy products, either in lump form or in cored-wire, a delivery method preferred by some manufacturers of steel, ductile iron, machine and auto parts and industrial pipe.
Solsil
Solsil is continuing to develop its technology to produce upgraded metallurgical grade silicon metal (UMG) manufactured through a proprietary metallurgical process, which is primarily used in silicon-based photovoltaic (solar) cells. Solsil is located in Beverly, Ohio and is currently focused on research and development projects and is not producing material for commercial sale. We own an 81% interest in Solsil, Inc. (Solsil).
Corporate
The corporate office, located in New York, New York, includes general expenses, investments, and related investment income.
2
Other
Ningxia Yonvey Coal Industrial Co., Ltd. (Yonvey). Yonvey produces carbon electrodes, an important input in our production process, at a production facility in Shizuishan in the Ningxia Hui Autonomous Region of China. We currently consume internally the majority of Yonvey’s output of electrodes. We hold a 70% ownership interest in Yonvey.
Ultracore Polska Sp.z.o.o (UCP). UCP produces cored-wire silicon-based alloy products. The fabrication facility is located in Police in northern Poland.
See our June 30, 2011 consolidated financial statements for financial information with respect to our segments.
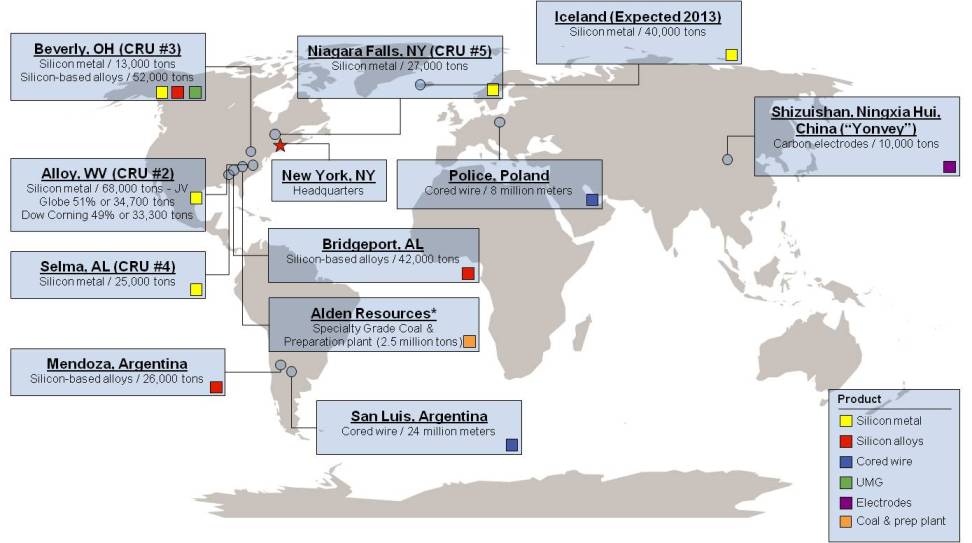
Products and Operations
The following chart shows the location of our primary facilities, the products produced at each facility and each facility’s production capacity.
Customers and Markets
The following table details our shipments and average selling price per MT over the last eight quarters through June 30, 2011. See note 24 (Operating Segments) to our June 30, 2011 consolidated financial statements for additional information.
|
Quarter Ended
|
||||||||||||||||
|
June 30,
|
March 31,
|
December 31,
|
September 30,
|
June 30,
|
March 31,
|
December 31,
|
September 30,
|
|||||||||
|
2011
|
2011
|
2010
|
2011
|
2010
|
2010
|
2009
|
2009
|
|||||||||
|
(Unaudited)
|
||||||||||||||||
|
Shipments (MT) (a)
|
56,580
|
59,276
|
59,171
|
58,448
|
62,207
|
47,684
|
44,508
|
40,072
|
||||||||
|
Average selling price ($/MT)
|
$
|
2,862
|
2,703
|
2,294
|
2,161
|
2,157
|
2,248
|
2,348
|
2,470
|
|||||||
___________
|
|
(a)
|
Shipments and average selling price exclude silica fume, other by-products and electrodes.
|
During the year ended June 30, 2011, our customers engaged primarily in the manufacture of silicone chemicals and polysilicon (35% of revenue), foundry alloys (20% of revenue), aluminum (18% of revenue) and steel (17% of revenue). Our customer base is geographically diverse, and includes North America, Europe, South America and Asia, which for the year ended June 30, 2011, represented 83%, 12%, 3% and 2% of our revenue, respectively.
For the year ended June 30, 2011, one customer accounted for more than 10% of revenues: Dow Corning, which represented approximately 17% of revenues (approximately 62% of which was a result of the manufacturing joint venture at our Alloy, West Virginia plant). Our ten largest customers account for approximately 48% of our net sales. These percentages include sales made under our joint venture agreement to Dow Corning.
3
Silicon Metal
We are among the world’s largest and most efficient producers of silicon metal. Silicon-based products are classified by the approximate percentage of silicon contained in the material and the levels of trace impurities. We produce specialty-grade, high quality silicon metal with silicon content generally greater than 99.25%. We produce the majority of this high-grade silicon metal for three industries: (i) the aluminum industry; (ii) the chemical industry; and (iii) polysilicon producers in the photovoltaic (solar)/semiconductor industry. We also continue to develop our technology to produce UMG for photovoltaic (solar) applications.
We market to primary aluminum producers who require silicon metal with certain purity requirements for use as an alloy, as well as to the secondary aluminum industry where specifications are not as stringent. Aluminum is used to manufacture a variety of automobile and truck components, including engine pistons, housings, and cast aluminum wheels and trim, as well as uses in high tension electrical wire, aircraft parts, beverage containers and other products which require optimal aluminum properties. The addition of silicon metal reduces shrinkage and the hot cracking tendencies of cast aluminum and improves the castability, hardness, corrosion resistance, tensile strength, wear resistance and weldability of the end products.
Purity and quality control are important. For instance, the presence of iron in aluminum alloys, in even small quantities, tends to reduce its beneficial mechanical properties as well as reduce its lustrous appearance, an important consideration when producing alloys for aluminum wheels and other automotive trim. We have the ability to produce silicon metal with especially low iron content as a result of our precisely controlled production processes.
We market to all the major silicone chemical producers. Silicone chemicals are used in a broad range of applications, including personal care items, construction-related products, health care products and electronics. In construction and equipment applications, silicones promote adhesion, act as a sealer and have insulating properties. In personal care and health care products, silicones add a smooth texture, prevent against ultra violet rays and provide moisturizing and cleansing properties. Silicon metal is an essential component of the manufacture of silicones, accounting for approximately 20% of raw materials used.
We market to producers of silicon wafers and solar cells who utilize silicon metal as the core ingredient of their product. These manufacturers employ processes to further purify the silicon metal and then use the material to grow crystals. These crystals are then cut into wafers, which are capable of converting sun light to electricity. The individual wafers are then soldered together to make solar cells.
We enter into annual contracts for a majority of our silicon metal production.
Silicon-Based Alloy Products
We make ferrosilicon by combining silicon dioxide (quartzite) with iron in the form of scrap steel and iron oxides. To produce our high-grade silicon-based alloys, we combine ferrosilicon with other additions that can include precise measured quantities of other metals and rare earths to create alloys with specific metallurgical characteristics. Our silicon-based alloy products can be divided into four general categories: (i) ferrosilicon, (ii) magnesium-ferrosilicon-based alloys, (iii) ferrosilicon-based alloys and (iv) calcium silicon.
Magnesium-ferrosilicon-based alloys are known as “nodularizers” because, when combined with molten grey iron, they change the graphite flakes in the iron into spheroid particles, or “nodules,” thereby increasing the iron’s strength and resilience. The resulting product is commonly known as ductile iron. Ductile iron is employed in numerous applications, such as the manufacture of automobile crankshafts and camshafts, exhaust manifolds, hydraulic valve bodies and cylinders, couplings, sprockets and machine frames, as well as in commercial water pipes. Ductile iron is lighter than steel and provides better castability (i.e., intricate shapes are more easily produced) than untreated iron.
Ferrosilicon-based alloys (without or with very low concentrations of magnesium) are known as “inoculants” and can contain any of a large number of combinations of metallic elements. Inoculants act to evenly distribute the graphite particles found in both grey and ductile iron and refine other microscopic structures, resulting in a product with greater strength and improved casting and machining properties.
Calcium silicon alloys are widely used to improve the quality, castability and machinability of steel. Calcium is a powerful modifier of oxides and sulfides. It improves the castability of the steel in a continuous casting process by keeping nozzles from clogging. Calcium also improves the machinability of steel, increasing the life of cutting tools.
We believe that we distinguish ourselves from our competitors by providing technical advice and service to our silicon-based alloy customers and by tailoring the chemical composition of our alloys to the specific requirements of each customer’s product line and foundry process. Silicon-based alloy customers are extremely quality conscious. We have intensive quality control measures at each stage of the manufacturing process to ensure that our customers’ specifications are met.
Our silicon-based alloys are sold to a diverse base of customers worldwide. Silicon-based alloys are typically sold on quarterly contracts or on a spot basis. We have evergreen year-to-year contracts with many of our customers for the purchase of our magnesium-ferrosilicon-based products, while foundry ferrosilicon alloys are typically purchased in smaller quantities for delivery within 30 days.
By-Products
We capture, recycle and sell most of the by-products generated in our production processes. The largest volume by-product not recycled into the manufacturing process is silica fume (also known as microsilica). This dust-like material, collected in our air filtration systems, is sold to our 50%-owned affiliate, Norchem Inc., and other companies which process, package and market it for use as a concrete additive, refractory material or oil well conditioner. The other major by-products of our manufacturing processes are “fines,” the fine material resulting from crushing, and dross, which results from the purification process during smelting. The fines and dross that are not recycled into our own production processes are generally sold to customers who utilize these products in other manufacturing processes, including steel production.
4
Raw Material Supply
We control the supply of most of our raw materials. We have mining operations located in Billingsley, Alabama. These mines supply our U.S. operations with a substantial portion of our requirements for quartzite, the principal raw material used in the manufacturing of all of our products. We believe that these mines, together with additional leasing opportunities in the vicinity, should cover our needs well into the future. We also obtain quartzite from other sources in the U.S. The gravel is mined, washed and screened to our specifications by our suppliers. All of our products also require coal or charcoal and woodchips in their manufacture. We source our low ash metallurgical-grade coal mainly from the midwest region of the U.S., mostly under long-term fixed price contracts, for our U.S. operations, and we use charcoal from local suppliers for our Argentine operations. Going forward, we will reduce our use of charcoal because of our increased coal supply from our Alden acquisition. The acquisition of Alden Resources, in July 2011, will provide us with a stable and long-term supply of low ash metallurgical grade coal. It will also provide us with an additional revenue stream from selling this coal to other silicon metal and silicon-based alloy smelters. Woodchips are sourced locally by each plant, and we maintain a wood chipping operation at our Alloy, West Virginia plant, which allows us to either buy logs or chips based on market pricing and availability. Carbon electrodes are supplied by Yonvey and are also purchased from several other suppliers on annual contracts and spot purchases. Most of our metal purchases are made on the spot market or from scrap dealers, with the exception of magnesium, which is purchased under a fixed duration contract for our U.S. business. Our principal iron source for producing ferrosilicon-based alloys has been scrap steel. Magnesium and other additives are obtained from a variety of sources producing or dealing in these products. We also obtain raw materials from a variety of other sources. Rail is the principal transportation method for gravel and coal. We have rail spurs at all of our plants. Other materials arrive primarily by truck. We require our suppliers, whenever feasible, to use statistical process control procedures in their production processes to conform to our own processes.
We believe that we have a cost advantage in most of our long-term power supply contracts. Our power supply contracts result in stable, favorably priced, long-term commitments of power at reasonable rates. In Argentina, our power contract with the province of Mendoza to provide power at a discount to the local market price expired in October 2009, and we are currently paying a month-to-month rate. We entered into a fixed-priced contract for power transmission in Argentina and are in negotiations to enter into a new long-term power contract. In West Virginia, we have a contract with Brookfield Energy to provide approximately 45% of our power needs at a fixed rate through December 2021. The remainder of our power needs in West Virginia, Ohio and Alabama are sourced through contracts that provide tariff rates at historically competitive levels. In connection with the reopening of our Niagara Falls, New York plant, and as an incentive to reopen the plant, we obtained a public-sector package including 40 megawatts of hydropower through 2013, which was subsequently extended to 2020. We have entered into power hedge agreements, ending in June 2013, for approximately 20% of the total power required by our Niagara Falls, New York plant. These hedges cover our expected needs not supplied by the long-term power contract over the term of the hedge agreements.
Sales and Marketing Activities
Our silicon metal is typically sold through annual contracts which serve to lock in volumes and prices. Multi-year contracts have historically represented a meaningful portion of our silicon metal sales; however, substantially all silicon metal multi-year contracts expired at the end of calendar 2010 and we have not entered into any new multi-year agreements. We did enter into annual calendar 2011 contracts for the bulk of our capacity. These agreements are largely fixed priced - with the minority being priced based on an index - with a mix of firm volume commitments and requirements contracts.
Our marketing strategy is to maximize profitability by varying the balance of our product mix among the various silicon-based alloys and silicon metal. Our products are marketed directly by our own marketing staff located in Buenos Aires, Argentina, Police, Poland, and at various locations in the United States and who work together to optimize the marketing efforts. The marketing staff is supported by our Technical Services Manager, who supports the sales representatives by advising foundry customers on how to improve their processes using our products.
We also employ customer service representatives. Order receiving, entry, shipment coordination and customer service is handled primarily from the Beverly, Ohio facility for our U.S. operations, and in Buenos Aires, Argentina, and Police, Poland for our non U.S. operations. In addition to our direct sales force, we sell through distributors in various U.S. regions, Canada, Southern and Northern Mexico, Australia, South America and Europe.
We maintain credit insurance for the majority of our customer receivables to mitigate collection risk.
Competition
The silicon metal and silicon-based alloy markets are capital intensive and competitive. Our primary competitors are Elkem AS, owned by China National Bluestar Group Co. Ltd., and Grupo Ferroatlantica S.L. In addition, we also face competition from other companies, such as, Quebec Silicon, Rima Industrial SA and Ligas de Alumino SA, as well as producers in China and the former republics of the Soviet Union. We have historically proven to be a highly efficient, low cost producer, with competitive pricing and manufacturing processes that capture most of our production by-products for reuse or resale. We also have the flexibility to adapt to current market demands by switching between silicon-based alloy and silicon metal production with reasonable switching costs. We face continual threats from existing and new competition. Nonetheless, certain factors can affect the ability of competition to enter or expand. These factors include (i) lead time of three to five years to obtain the necessary governmental approvals and construction completion; (ii) construction costs; (iii) the need to situate a manufacturing facility proximate to raw material sources, and (iv) energy supply for manufacturing purposes.
5
Competitive Strengths
We believe that we possess a number of competitive strengths that position us well to continue as one of the leading global suppliers of silicon metal and silicon-based alloys.
|
|
•
|
Leading Market Positions. We hold leading market shares in a majority of our products. Our silicon metal capacity of approximately 100,000 MT annually (excluding Dow Corning’s portion of the capacity of our Alloy, West Virginia plant), represents approximately 9% total Western World capacity, including 45% capacity in North America. We estimate that we have approximately 20% Western World capacity for magnesium ferrosilicon, including 50% capacity in North America and are one of only six suppliers of calcium silicon in the Western World (with estimated 18% capacity).
|
|
|
•
|
Low Cost Producer. We have been recognized by CRU as the lowest average operating cost large silicon metal producer in the Western World. Currently, CRU lists our four silicon metal manufacturing facilities as being among CRU’s five most cost efficient silicon metal manufacturing facilities in the Western World, including the three lowest cost facilities. Our Niagara Falls, New York plant is included in the CRU analysis at its normalized expected production costs.
|
|
|
•
|
Highly Variable Cost Structure. We operate with a largely variable cost of production and have the ability to rapidly turn furnaces on and off to react to changes in customer demand. During the global economic recession, we were able to quickly idle certain furnaces as demand declined and then quickly re-start them at minimal cost as demand returned.
|
|
|
•
|
Long-Term Power Contracts. We also believe that we have a cost advantage in our long-term power supply contracts, which provide a significant portion of our power needs. These power supply contracts result in stable, favorably priced, long-term commitments of power at reasonable rates.
|
|
|
•
|
Stable Raw Material Supply Through Captive Mines. We have quartz mining operations, located in Billingsley, Alabama, for which we currently possess long-term lease mining rights. These mines supply our U.S. plants with a majority of our requirements for quartzite, the principal raw material used in the manufacturing of our products. We believe that these mines, taken together with additional leasing opportunities in the vicinity should cover our needs well into the future. We have also obtained a captive supply of electrodes, an important input in our manufacturing process, through our ownership in Yonvey. We acquired Alden Resources in July 2011 which will provide us with a stable and long-term supply of low ash metallurgical coal.
|
|
|
•
|
Efficient and Environmentally Sensitive By-Product Usage. We utilize or sell most of our manufacturing processes’ by-products, which reduces costs and limits environmental impact.
|
|
|
•
|
Diverse Products and Markets. We sell our products to a wide variety of industries and to companies in over 30 countries. We believe that our diverse product and geographic end-market profile provides us with numerous growth opportunities and should help insulate us from economic downturns occurring in any individual industry or geographic region, however global macroeconomic factors will impact the effectiveness of our industrial and geographical diversity strategy. See note 24 (Operating Segments) to our June 30, 2011 consolidated financial statements for additional information.
|
|
|
•
|
Experienced, Highly Qualified Management Team. We have assembled a highly qualified management team with over 50 years of combined experience in the metals industry among our top four executives. Alan Kestenbaum, our Executive Chairman, Jeff Bradley, our Chief Executive Officer and Chief Operating Officer, Malcolm Appelbaum, our Chief Financial Officer, and Stephen Lebowitz, our Chief Legal Officer, have over 21, 26, 6 and 8 years of experience, respectively, in metals industries. We believe that our management team has the operational and technical skill to continue to operate our business at world class levels of efficiency and to consistently produce silicon metal and silicon-based alloys.
|
6
Business Strategy
|
|
•
|
Focus on Core Businesses. We differentiate ourselves on the basis of our technical expertise and high product quality and use these capabilities to retain existing accounts and cultivate new business. As part of this strategy, we are focusing our production and sales efforts on our silicon metals and silicon-based alloys to end markets where we may achieve the highest profitability. We continue to evaluate our core business strategy and may divest certain non-core and lower margin businesses to improve our financial and operational results.
|
|
|
•
|
Continue to Rationalize Costs to Meet Current Levels of Demand. We are focused on operating in a cost effective manner and continue to focus on cost control in order to improve our profitability. Our largely variable cost of production should allow us to remain profitable during periods of reduced demand.
|
|
|
•
|
Capitalize on Market Conditions. In fiscal year 2010, we reopened our Niagara Falls, New York and Selma, Alabama plants and are currently running all furnaces at full capacity, other than planned maintenance outages. We remain focused on improving furnace uptime and production output.
|
|
|
•
|
Maintain Low Cost Position While Controlling Inputs. We intend to maintain our position as one of the most cost-efficient producers of silicon metal in the world by continuing to control the cost of the process inputs through our captive sources and long-term supply contracts. We continue to focus on reducing our fixed costs in order to reduce costs per MT of silicon metal and silicon-based alloy sold.
|
|
|
•
|
Continue Pursuing Strategic Acquisition Opportunities. We continue to pursue complementary acquisitions at appropriate valuations. We are actively reviewing several possible transactions to expand our strategic capabilities and leverage our products and operations. We intend to build on our history of successful acquisitions by continuing to evaluate attractive acquisition opportunities for the purpose of increasing our capacity, increasing our access to raw materials and other inputs and acquiring further refined products for our customers. Our focus is on investing globally in companies, technologies or products that complement and/or diversify our business or product offerings. In particular, we will consider acquisitions or investments that will enable us to leverage our expertise in silicon metal and silicon-based alloy products and to grow in these markets, as well as enable us to enter new markets or sell new products. We believe our overall metallurgical expertise and skills in lean production technologies position us well for future growth.
|
|
|
•
|
Leverage Flexible Manufacturing and Expand Other Lines of Business. We will leverage our flexible manufacturing capabilities to optimize the product mix produced while expanding the products we offer. Additionally, we can leverage our broad geographic manufacturing reach to ensure that production of specific metals is in the most appropriate facility/region. Besides our principal silicon metal products, we have the capability to produce silicon-based alloys, such as ferrosilicon and silicomanganese, using the same facilities. Our business philosophy is to allocate our furnace capacity to the products which we expect will improve profitability.
|
|
|
•
|
Leverage Synergies Among Units. According to CRU, we currently have the three lowest cost, and four of the five lowest cost silicon metal manufacturing facilities in the Western World. Additionally, according to CRU, the average operating cost of our four silicon metal production facilities is approximately 8.9% lower than the Western World weighted average cost. Our Niagara Falls, New York plant is included in the CRU analysis at its normalized expected production costs. We seek to leverage each of our facilities’ best practices and apply them across our system.
|
Employees
As of June 30, 2011, we had 1,213 employees. We have 822 employees in the United States, 155 employees in Argentina, 32 employees in Poland and 204 employees in China. Our total employees consist of 470 salaried employees and 743 hourly employees and include 511 unionized workers. This compares to 1,136 employees at June 30, 2010.
We have not experienced any work stoppages and consider our relations with our employees to be good. Our hourly employees at our Selma, Alabama facility are covered by a collective bargaining agreement with the Industrial Division of the Communications Workers of America, under a contract running through July 31, 2013. Our hourly employees at our Alloy, West Virginia, Niagara Falls, New York and Bridgeport, Alabama facilities are covered by collective bargaining agreements with The United Steel, Paper and Forestry, Rubber, Manufacturing, Energy, Allied Industrial and Service Workers International Union under contracts running through April 27, 2014, July 29, 2014, and March 31, 2012, respectively. Union employees in Argentina are working under a contract running through April 30, 2012. Our operations in Poland and China are not unionized.
Research and Development
Our primary research and development activities are concentrated in our Solsil business unit. Solsil is continuing to develop its technology to produce upgraded metallurgical grade silicon manufactured through a proprietary metallurgical process and which is primarily used in silicon-based photovoltaic (solar) cells. Solsil conducts research and development activities designed to improve the purity of its silicon. The business performs experiments, including continuous batch modifications with the goal of improving efficiencies, lowering costs and developing new products that we expect will meet the needs of the photovoltaic (solar) industry. These activities are performed at Solsil’s operations, which are currently located within our facility at Beverly, Ohio. Our success in producing UMG for the solar industry is expected to help lower the production cost of photovoltaic (solar) cells and increase the overall affordability of the technology.
Proprietary Rights and Licensing
The majority of our intellectual property relates to process design and proprietary know-how. Our intellectual property strategy is focused on developing and protecting proprietary know-how and trade secrets, which are maintained through employee and third-party confidentiality agreements and physical security measures. Although we have some patented technology, our businesses or profitability does not rely fundamentally upon such technology.
7
Regulatory Matters
We operate facilities in the U.S. and abroad, which are subject to foreign, federal, national, state, provincial and local environmental, health and safety laws and regulations, including, among others, those governing the discharge of materials into the environment, hazardous substances, land use, reclamation and remediation and the health and safety of our employees. These laws and regulations require us to obtain from governmental authorities permits to conduct certain regulated activities, which permits may be subject to modification or revocation by such authorities.
We are subject to the risk that we have not been or will not be at all times in complete compliance with such laws, regulations and permits. Failure to comply with these laws, regulations and permits may result in the assessment of administrative, civil and criminal penalties or other sanctions by regulators, the imposition of remedial obligations, the issuance of injunctions limiting or preventing our activities and other liabilities. Under these laws, regulations and permits, we could also be held liable for any and all consequences arising out of human exposure to hazardous substances or environmental damage we may cause or that relates to our operations or properties. Environmental, health and safety laws are likely to become more stringent in the future. Our costs of complying with current and future environmental, health and safety laws, and our liabilities arising from past or future releases of, or exposure to, hazardous substances, may adversely affect our business, results of operations and financial condition.
There are a variety of laws and regulations in place or being considered at the international, federal, regional, state and local levels of government that restrict or are reasonably likely to restrict the emission of carbon dioxide and other greenhouse gases. These legislative and regulatory developments may cause us to incur material costs to reduce the greenhouse gas emissions from our operations (through additional environmental control equipment or retiring and replacing existing equipment) or to obtain emission allowance credits, or result in the incurrence of material taxes, fees or other governmental impositions on account of such emissions. In addition, such developments may have indirect impacts on our operations, which could be material. For example, they may impose significant additional costs or limitations on electricity generators, which could result in a material increase in our energy costs.
Certain environmental laws assess liability on current or previous owners or operators of real property for the cost of removal or remediation of hazardous substances. In addition to cleanup, cost recovery or compensatory actions brought by federal, state and local agencies, neighbors, employees or other third parties could make personal injury, property damage or other private claims relating to the presence or release of hazardous substances. Environmental laws often impose liability even if the owner or operator did not know of, or was not responsible for, the release of hazardous substances. Persons who arrange for the disposal or treatment of hazardous substances also may be responsible for the cost of removal or remediation of these substances. Such persons can be responsible for removal and remediation costs even if they never owned or operated the disposal or treatment facility. In addition, such owners or operators of real property and persons who arrange for the disposal or treatment of hazardous substances can be held responsible for damages to natural resources.
Soil or groundwater contamination resulting from historical, ongoing or nearby activities is present at certain of our current and historical properties, and additional contamination may be discovered at such properties in the future. Based on currently available information, we do not believe that any costs or liabilities relating to such contamination will have a material adverse effect on our financial condition, results of operations or liquidity.
Other Information
Globe Specialty Metals, Inc. was incorporated in December 2004 pursuant to the laws of the State of Delaware under the name “International Metal Enterprises, Inc.” for the initial purpose to serve as a vehicle for the acquisition of companies operating in the metals and mining industries. In November 2006, we changed our name to “Globe Specialty Metals, Inc.”
Our internet website address is www.glbsm.com. Copies of the following reports are available free of charge through the internet website, as soon as reasonably practicable after they have been filed with or furnished to the SEC pursuant to Section 13(a) or 15(d) of the Securities Exchange Act of 1934, as amended: the Annual Report on Form 10-K; quarterly reports on Form 10-Q; current reports on Form 8-K; any amendments to such reports; and proxy statements. Information on the website does not constitute part of this or any other report filed with or furnished to the SEC.
8
|
Risk Factors
|
You should consider and read carefully all of the risks and uncertainties described below, together with all of the other information contained in this Annual Report on Form 10-K, including the consolidated financial statements and the related notes to consolidated financial statements. If any of the following events actually occur, our business, business prospects, financial condition, results of operations or cash flows could be materially affected. In any such case, the trading price of our common stock could decline, and you could lose all or part of your investment.
The metals industry, including silicon-based metals, is cyclical and has been subject in the past to swings in market price and demand which could lead to volatility in our revenues.
Our business has historically been subject to fluctuations in the price of our products and market demand for them, caused by general and regional economic cycles, raw material and energy price fluctuations, competition and other factors. Historically, our subsidiary, Globe Metallurgical, Inc., has been particularly affected by recessionary conditions in the end-markets for its products. In April 2003, Globe Metallurgical, Inc. sought protection under Chapter 11 of the United States Bankruptcy Code following its inability to restructure or refinance its indebtedness in light of the confluence of several negative economic and other factors, including an influx of low-priced, dumped imports, which caused it to default on then-outstanding indebtedness. A recurrence of such economic factors could have a material adverse effect on our business prospects, condition (financial or otherwise) and results of operations.
In calendar 2009, the global silicon metal industry suffered from unfavorable market conditions. The weakened economic environment of national and international metals markets that occurred during that time may return; any decline could have a material adverse effect on our business prospects, condition (financial or otherwise), and results of operations. In addition, our business is directly related to the production levels of our customers, whose businesses are dependent on highly cyclical markets, such as the automotive, residential and nonresidential construction, consumer durables, polysilicon, and chemical markets. In response to unfavorable market conditions, customers may request delays in contract shipment dates or other contract modifications. If we grant modifications, they could adversely affect our anticipated revenues and results of operations. Also, many of our products are internationally traded products with prices that are significantly affected by worldwide supply and demand. Consequently, our financial performance will fluctuate with the general economic cycle, which could have a material adverse effect on our business prospects, condition (financial or otherwise) and results of operations.
Our business is particularly sensitive to increases in energy costs, which could materially increase our cost of production.
Electricity is one of our largest production cost components, comprising approximately 24% of cost of goods sold. The level of power consumption of our submerged electric arc furnaces is highly dependent on which products are being produced and typically fall in the following ranges: (i) silicon-based alloys require between 3.5 and 8 megawatt hours to produce one MT of product and (ii) silicon metal requires approximately 11 megawatt hours to produce one MT of product. Accordingly, consistent access to low cost, reliable sources of electricity is essential to our business.
Electrical power to our U.S. facilities is supplied mostly by AEP, Alabama Power, Brookfield Power, Tennessee Valley Authority and Niagara Mohawk Power Corporation through dedicated lines. Our Alloy, West Virginia facility obtains approximately 45% of its power needs under a 15-year fixed-price contract with a nearby hydroelectric facility. This facility is over 70 years old and any breakdown could result in the Alloy facility having to pay much higher rates for electric power from third parties. Our energy supply for our facilities located in Argentina is supplied through the Edemsa hydroelectric facilities located in Mendoza, Argentina. Our contract expired in October 2009; we are currently operating under a month-to-month arrangement and are negotiating a new contract. Because energy constitutes such a high percentage of our production costs, we are particularly vulnerable to cost fluctuations in the energy industry. Accordingly, the termination or non-renewal of any of our energy contracts, or an increase in the price of energy could materially adversely affect our future earnings, if any, and may prevent us from effectively competing in our markets.
Losses caused by disruptions in the supply of power would reduce our profitability.
Our operations are heavily dependent upon a reliable supply of electrical power. We may incur losses due to a temporary or prolonged interruption of the supply of electrical power to our facilities, which can be caused by unusually high demand, blackouts, equipment failure, natural disasters or other catastrophic events, including failure of the hydroelectric facilities that currently provide power under contract to our West Virginia, New York and Argentina facilities. Large amounts of electricity are used to produce silicon metal and silicon-based alloys, and any interruption or reduction in the supply of electrical power would adversely affect production levels and result in reduced profitability. Our insurance coverage may not be sufficient to cover any or all losses, and such policies do not cover all events. Certain of our insurance policies will not cover any losses that may be incurred if our suppliers are unable to provide power during periods of unusually high demand.
Investments in Argentina’s electricity generation and transmission systems have been lower than the increase in demand in recent years. If this trend is not reversed, there could be electricity supply shortages as the result of inadequate generation and transmission capacity. Given the heavy dependence on electricity of our manufacturing operations, any electricity shortages could adversely affect our financial results.
Government regulations of electricity in Argentina give priority access of hydroelectric power to residential users and subject violators of these restrictions to significant penalties. This preference is particularly acute during Argentina’s winter months due to a lack of natural gas. We have previously successfully petitioned the government to exempt us from these restrictions given the demands of our business for continuous supply of electric power. If we are unsuccessful in our petitions or in any action we take to ensure a stable supply of electricity, our production levels may be adversely affected and our profitability reduced.
9
Any decrease in the availability, or increase in the cost, of raw materials or transportation could materially increase our costs.
Principal components in the production of silicon metal and silicon-based alloys include metallurgical-grade coal, charcoal, carbon electrodes, quartzite, wood chips, steel scrap, and other metals, such as magnesium. We buy some raw materials on a spot basis. We are dependent on certain suppliers of these products, their labor union relationships, mining and lumbering regulations and output and general local economic conditions in order to obtain raw materials in a cost efficient and timely manner. An increase in costs of raw materials or transportation, or the decrease in their production or deliverability in a timely fashion, or other disruptions in production, could result in increased costs to us and lower productivity levels. We may not be able to obtain adequate supplies of raw materials from alternative sources on terms as favorable as our current arrangements or at all. Any increases in the price or shortfall in the production and delivery of raw materials, could materially adversely affect our business prospects, condition (financial or otherwise) or results of operation.
Cost increases in raw material inputs may not be passed on to our customers, which could negatively impact our profitability.
The availability and prices of raw material inputs may be influenced by supply and demand, changes in world politics, unstable governments in exporting nations and inflation. The market prices of our products and raw material inputs are subject to change. We may not be able to pass a significant amount of increased input costs on to our customers. Additionally, we may not be able to obtain lower prices from our suppliers should our sale prices decrease.
Compliance with and changes in environmental laws, including proposed climate change laws and regulations, could adversely affect our performance.
The principal environmental risks associated with our operations are emissions into the air and releases into the soil, surface water, or groundwater. Our operations are subject to extensive federal, state, and local environmental laws and regulations, including those relating to the discharge of materials into the environment, waste management, pollution prevention measures and greenhouse gas emissions. If we violate or fail to comply with these laws and regulations, we could be fined or otherwise sanctioned. Because environmental laws and regulations are becoming more stringent and new environmental laws and regulations are continuously being enacted or proposed, such as those relating to greenhouse gas emissions and climate change, the level of expenditures required for environmental matters could increase in the future. Future legislative action and regulatory initiatives could result in changes to operating permits, additional remedial actions, material changes in operations, increased capital expenditures and operating costs, increased costs of the goods we sell, and decreased demand for our products that cannot be assessed with certainty at this time.
Some of the proposed federal cap-and-trade legislation would require businesses that emit greenhouse gases to buy emission credits from the government, other businesses, or through an auction process. As a result of such a program, we may be required to purchase emission credits for greenhouse gas emissions resulting from our operations. Although it is not possible at this time to predict the final form of a cap-and-trade bill (or whether such a bill will be passed), any new federal restrictions on greenhouse gas emissions – including a cap-and-trade program – could result in material increased compliance costs, additional operating restrictions for our business, and an increase in the cost of the products we produce, which could have a material adverse effect on our financial position, results of operations, and liquidity.
We make a significant portion of our sales to a limited number of customers, and the loss of a portion of the sales to these customers could have a material adverse effect on our revenues and profits.
In the year ended June 30, 2011, we made approximately 48% of our consolidated net sales to our top ten customers and approximately 17% to our top customer. These percentages include sales made under our joint venture agreement to Dow Corning. We expect that we will continue to derive a significant portion of our business from sales to these customers. If we were to experience a significant reduction in the amount of sales we make to some or all of these customers and could not replace these sales with sales to other customers, it could have a material adverse effect on our revenues and profits.
Our U.S.-based businesses benefit from U.S. antidumping duties and laws that protect U.S. companies by taxing imports from foreign companies. If these laws change, foreign companies will be able to compete more effectively with us. Conversely, our foreign operations are adversely affected by these U.S. duties and laws.
Antidumping duties are currently in place covering silicon metal imports from China and Russia. The orders imposing these duties benefit our U.S. operations by constraining supply and increasing U.S. market prices and sales of domestic silicon metal. Rates of duty can change as a result of “administrative reviews” and “new shipper reviews” of antidumping orders. These orders can also be revoked as a result of periodic “sunset reviews,” which determine whether the orders will continue to apply to imports from particular countries. A sunset review of the order covering imports from China will begin in late 2011, with a decision expected in late 2012. Thus, the current orders may not remain in effect and continue to be enforced from year to year, the goods and countries now covered by antidumping orders may no longer be covered, and duties may not continue to be assessed at the same rates. Changes in any of these factors could adversely affect our business and profitability. Finally, at times, in filing trade actions, we find ourselves acting against the interests of our customers. Some of our customers may not continue to do business with us because of our having filed a trade action. Antidumping rules may, conversely, also adversely impact our foreign operations.
The European Union, like the U.S., maintains an antidumping duty covering silicon metal imports from China. The duty was reduced in May 2010.
10
We may be unable to successfully integrate and develop our prior and future acquisitions.
We acquired five private companies between November 2006 and April 2010, and entered into a business combination in May 2008 and a joint venture agreement in November 2009. We expect to acquire additional companies in the future. Integration of our prior and future acquisitions with our existing business is a complex, time-consuming and costly process requiring the employment of additional personnel, including key management and accounting personnel. Additionally, the integration of these acquisitions with our existing business may require significant financial resources that would otherwise be available for the ongoing development or expansion of existing operations. Unanticipated problems, delays, costs or liabilities may also be encountered in the development of these acquisitions. Failure to successfully and fully integrate and develop these businesses and operations may have a material adverse effect on our business, financial condition, results of operations and cash flows. The difficulties of combining the acquired operations include, among other things:
|
|
•
|
operating a significantly larger combined organization;
|
|
|
•
|
coordinating geographically disparate organizations, systems and facilities;
|
|
•
|
consolidating corporate technological and administrative functions;
|
|
|
•
|
integrating internal controls and other corporate governance matters;
|
|
|
•
|
the diversion of management’s attention from other business concerns;
|
|
|
•
|
unexpected customer or key employee loss from the acquired businesses;
|
|
|
•
|
hiring additional management and other critical personnel;
|
|
|
•
|
negotiating with labor unions;
|
|
|
•
|
a significant increase in our indebtedness; and
|
|
|
•
|
potential environmental or regulatory liabilities and title problems.
|
In addition, we may not realize all of the anticipated benefits from any prior and future acquisitions, such as increased earnings, cost savings and revenue enhancements, for various reasons, including difficulties integrating operations and personnel, higher and unexpected acquisition and operating costs, unknown liabilities, inaccurate reserve estimates and fluctuations in markets. If these benefits do not meet the expectations of financial or industry analysts, the market price of our shares may decline.
We are subject to the risk of union disputes and work stoppages at our facilities, which could have a material adverse effect on our business.
Hourly workers at our Selma, Alabama facility are covered by a collective bargaining agreement with the Industrial Division of the Communications Workers of America, under a contract running through July 31, 2013. Hourly employees at our Alloy, West Virginia, Niagara Falls, New York and Bridgeport, Alabama facilities are covered by collective bargaining agreements with The United Steel, Paper and Forestry, Rubber, Manufacturing, Energy, Allied Industrial and Service Workers International Union under contracts running through April 27, 2014, July 29, 2014, and March 31, 2012, respectively. Our union employees in Argentina are working under a contract running through April 30, 2012. New labor contracts will have to be negotiated to replace expiring contracts from time to time. If we are unable to satisfactorily renegotiate those labor contracts on terms acceptable to us or without a strike or work stoppage, the effects on our business could be materially adverse. Any strike or work stoppage could disrupt production schedules and delivery times, adversely affecting sales. In addition, existing labor contracts may not prevent a strike or work stoppage, and any such work stoppage could have a material adverse effect on our business.
We are dependent on key personnel.
Our operations depend to a significant degree on the continued employment of our core senior management team. In particular, we are dependent on the skills, knowledge and experience of Alan Kestenbaum, our Executive Chairman, Jeff Bradley, our Chief Executive Officer and Chief Operating Officer, Malcolm Appelbaum, our Chief Financial Officer, and Stephen Lebowitz, our Chief Legal Officer. If these employees are unable to continue in their respective roles, or if we are unable to attract and retain other skilled employees, our results of operations and financial condition could be adversely affected. We currently have employment agreements with Alan Kestenbaum, Jeff Bradley, Malcolm Appelbaum and Stephen Lebowitz, each of which contains non-compete provisions. Such provisions may not be enforceable by us. Additionally, we are substantially dependent upon key personnel in our financial and information technology staff who enable us to meet our regulatory and contractual financial reporting obligations, including reporting requirements under our credit facilities.
Metals manufacturing is an inherently dangerous activity.
Metals manufacturing generally, and smelting, in particular, is inherently dangerous and subject to fire, explosion and sudden major equipment failure. This can and has resulted in accidents resulting in the serious injury or death of production personnel and prolonged production shutdowns. We have experienced fatal accidents and equipment malfunctions in our manufacturing facilities in recent years and may experience fatal accidents or equipment malfunctions again, which could materially affect our business and operations.
Unexpected equipment failures may lead to production curtailments or shutdowns.
Many of our business activities are characterized by substantial investments in complex production facilities and manufacturing equipment. Because of the complex nature of our production facilities, any interruption in manufacturing resulting from fire, explosion, industrial accidents, natural disaster, equipment failures or otherwise could cause significant losses in operational capacity and could materially and adversely affect our business and operations.
11
We depend on proprietary manufacturing processes and software. These processes may not yield the cost savings that we anticipate and our proprietary technology may be challenged.
We rely on proprietary technologies and technical capabilities in order to compete effectively and produce high quality silicon metals and silicon-based alloys. Some of these proprietary technologies that we rely on are:
|
|
•
|
computerized technology that monitors and controls production furnaces;
|
|
|
•
|
production software that monitors the introduction of additives to alloys, allowing the precise formulation of the chemical composition of products; and
|
|
|
•
|
flowcaster equipment, which maintains certain characteristics of silicon-based alloys as they are cast.
|
We are subject to a risk that:
|
|
•
|
we may not have sufficient funds to develop new technology and to implement effectively our technologies as competitors improve their processes;
|
|
|
•
|
if implemented, our technologies may not work as planned; and
|
|
|
•
|
our proprietary technologies may be challenged and we may not be able to protect our rights to these technologies.
|
Patent or other intellectual property infringement claims may be asserted against us by a competitor or others. Our intellectual property may not be enforceable, and it may not prevent others from developing and marketing competitive products or methods. An infringement action against us may require the diversion of substantial funds from our operations and may require management to expend efforts that might otherwise be devoted to operations. A successful challenge to the validity of any of our proprietary intellectual property may subject us to a significant award of damages, or we may be enjoined from using our proprietary intellectual property, which could have a material adverse effect on our operations.
We also rely on trade secrets, know-how and continuing technological advancement to maintain our competitive position. We may not be able to effectively protect our rights to unpatented trade secrets and know-how.
We are subject to environmental, health and safety regulations, including laws that impose substantial costs and the risk of material liabilities.
We are subject to extensive foreign, federal, national, state, provincial and local environmental, health and safety laws and regulations governing, among other things, the generation, discharge, emission, storage, handling, transportation, use, treatment and disposal of hazardous substances; land use, reclamation and remediation; and the health and safety of our employees. We are also required to obtain permits from governmental authorities for certain operations. We may not have been and may not be at all times in complete compliance with such laws, regulations and permits. If we violate or fail to comply with these laws, regulations or permits, we could be subject to penalties, fines, restrictions on operations or other sanctions. Under these laws, regulations and permits, we could also be held liable for any and all consequences arising out of human exposure to hazardous substances or environmental damage we may cause or that relates to our operations or properties.
Under certain environmental laws, we could be required to remediate or be held responsible for all of the costs relating to any contamination at our or our predecessors’ past or present facilities and at third party waste disposal sites. We could also be held liable under these environmental laws for sending or arranging for hazardous substances to be sent to third party disposal or treatment facilities if such facilities are found to be contaminated. Under these laws we could be held liable even if we did not know of, or were not responsible for, such contamination, or even if we never owned or operated the contaminated disposal or treatment facility.
There are a variety of laws and regulations in place or being considered at the international, federal, regional, state and local levels of government that restrict or are reasonably likely to restrict the emission of carbon dioxide and other greenhouse gases. These legislative and regulatory developments may cause us to incur material costs if we are required to reduce or offset greenhouse gas emissions and may result in a material increase in our energy costs due to additional regulation of power generators.
Environmental laws are complex, change frequently and are likely to become more stringent in the future. Therefore, our costs of complying with current and future environmental laws, and our liabilities arising from past or future releases of, or exposure to, hazardous substances may adversely affect our business, results of operations and financial condition.
We operate in a highly competitive industry.
The silicon-based alloy and silicon metal markets are capital intensive and competitive. Our primary competitors are Elkem AS, owned by China National Bluestar Group Co. Ltd., Grupo Ferroatlantica S.L. and various producers in China. Our competitors may have greater financial resources, as well as other strategic advantages to maintain, improve and possibly expand their facilities; and as a result, they may be better positioned to adapt to changes in the industry or the global economy. The advantages that our competitors have over us could have a material adverse effect on our business. In addition, new entrants may increase competition in our industry, which could materially adversely affect our business. An increase in the use of substitutes for certain of our products also could have a material adverse effect on our financial condition and operations.
12
We have historically operated at near the maximum capacity of our operating facilities. Because the cost of increasing capacity may be prohibitively expensive, we may have difficulty increasing our production and profits.
Our facilities are able to manufacture, collectively, approximately 100,000 MT of silicon metal (excluding Dow Corning’s portion of the capacity of our Alloy, West Virginia plant) and 120,000 MT of silicon-based alloys on an annual basis. Our ability to increase production and revenues will depend on expanding existing facilities or opening new ones. Increasing capacity is difficult because:
|
|
•
|
adding new production capacity to an existing silicon plant to produce approximately 30,000 MT of metallurgical grade silicon would cost approximately $120,000,000 and take at least 12 to 18 months to complete once permits are obtained, which could take more than a year;
|
|
|
•
|
a greenfield development project would take at least three to five years to complete and would require significant capital expenditure and environmental compliance costs; and
|
|
|
•
|
obtaining sufficient and dependable power at competitive rates near areas with the required natural resources is difficult to accomplish.
|
We may not have sufficient funds to expand existing facilities or open new ones and may be required to incur significant debt to do so, which could have a material adverse effect on our business.
Some of our subsidiaries are subject to restrictive covenants under credit facilities. These covenants could significantly affect the way in which we conduct our business. Our failure to comply with these covenants could lead to an acceleration of our debt.
Credit facilities maintained by some of our subsidiaries contain covenants that, among other things, restrict our ability to sell assets; incur, repay or refinance indebtedness; create liens; make investments; engage in mergers or acquisitions; pay dividends, including to us; repurchase stock; or make capital expenditures. These credit facilities also require compliance with specified financial covenants, including minimum interest coverage and maximum leverage ratios. These subsidiaries cannot borrow under their credit facilities if the additional borrowings would cause them to breach the financial covenants. Further, a significant portion of Globe Metallurgical, Inc.’s assets and West Virginia Manufacturing’s assets are pledged to secure indebtedness.
Our ability to comply with applicable covenants may be affected by events beyond our control. The breach of any of the covenants contained in a credit facility, unless waived, would be a default under the facility. This would permit the lenders to terminate their commitments to extend credit under, and accelerate the maturity of, the facility. The acceleration of debt could have a material adverse effect on our financial condition and liquidity. If we were unable to repay our debt to the lenders and holders or otherwise obtain a waiver from the lenders and holders, the lenders and holders could proceed against the collateral securing the credit facility and exercise all other rights available to them. We may not have sufficient funds to make these accelerated payments and may not be able to obtain any such waiver on acceptable terms or at all.
Certain of our subsidiaries are restricted from making distributions to us, which limits our ability to pay dividends.
Substantially all of our assets are held by and our revenues are generated by our subsidiaries. Our subsidiaries borrow funds in order to finance our operations. The terms of certain of those financings place restrictions on distributions of funds to us. If these limitations prevent distributions to us or our subsidiaries do not generate positive cash flows, we will be limited in our ability to pay dividends and may be unable to transfer funds between subsidiaries if required to support our subsidiaries.
Our insurance costs may increase, and we may experience additional exclusions and limitations on coverage in the future.
We have maintained various forms of insurance, including insurance covering claims related to our properties and risks associated with our operations. Our existing property and liability insurance coverages contain exclusions and limitations on coverage. From time-to-time, in connection with renewals of insurance, we have experienced additional exclusions and limitations on coverage, larger self-insured retentions and deductibles and significantly higher premiums. As a result, in the future, our insurance coverage may not cover claims to the extent that it has in the past and the costs that we incur to procure insurance may increase significantly, either of which could have an adverse effect on our results of operations.
Solsil may never operate profitably or generate substantial revenues.
Solsil is currently focused on research and development projects and is not producing material for commercial sale. Although we expect to expand its operations through the construction of new facilities, its financial prospects are uncertain. Solsil’s anticipated growth, including the construction of new facilities, will require a commitment of significant financial resources that we may determine are not available given the expansion of other existing operations and continuing research and development efforts. In addition, Solsil’s anticipated growth will require a commitment of personnel, including key positions in management, that may not be available to us when needed. Unanticipated problems, construction delays, cost overruns, raw material shortages, environmental and/or governmental regulation, limited power availability or unexpected liabilities may also be encountered. Furthermore, Solsil’s expected future profitability is dependent on its ability to produce UMG at significantly larger scales than it currently can produce today and with commercially viable costs. Some of the other challenges we may encounter include:
13
|
|
•
|
technical challenges, including further improving Solsil’s proprietary metallurgical process;
|
|
|
•
|
increasing the size and scale of our operations on a cost-effective basis;
|
|
|
•
|
capitalizing on market demands and potentially rapid market supply and demand fluctuations;
|
|
|
•
|
continued acceptance by the market of our current and future products, including the use of UMG in the photovoltaic (solar) market;
|
|
|
•
|
a rapidly growing competitive environment with more new players entering the photovoltaic (solar) market;
|
|
|
•
|
alternative competing technologies; and
|
|
|
•
|
responding to rapid technological changes.
|
Failure to successfully address these and other challenges may hinder or prevent our ability to achieve our objectives in a timely manner, and may result in the impairment of assets currently used in Solsil’s production processes.
We have operations and assets in the U.S., Argentina, China and Poland, and may have operations and assets in other countries in the future. Our international operations and assets may be subject to various economic, social and governmental risks.
Our international operations and sales will expose us to risks that could negatively impact our future sales or profitability. Our operations may not develop in the same way or at the same rate as might be expected in a country with an economy similar to the United States. The additional risks that we may be exposed to in these cases include, but are not limited to:
|
|
•
|
tariffs and trade barriers;
|
|
|
•
|
currency fluctuations, which could decrease our revenues or increase our costs in U.S. dollars;
|
|
|
•
|
regulations related to customs and import/export matters;
|
|
|
•
|
tax issues, such as tax law changes and variations in tax laws;
|
|
|
•
|
limited access to qualified staff;
|
|
|
•
|
inadequate infrastructure;
|
|
|
•
|
cultural and language differences;
|
|
|
•
|
inadequate banking systems;
|
|
|
•
|
different and/or more stringent environmental laws and regulations;
|
|
|
•
|
restrictions on the repatriation of profits or payment of dividends;
|
|
|
•
|
crime, strikes, riots, civil disturbances, terrorist attacks or wars;
|
|
|
•
|
nationalization or expropriation of property;
|
|
|
•
|
law enforcement authorities and courts that are weak or inexperienced in commercial matters; and
|
|
|
•
|
deterioration of political relations among countries.
|
Our competitive strength as a low-cost silicon metal producer is partly tied to the value of the U.S. dollar compared to other currencies. The U.S. dollar has fluctuated significantly in value in comparison to major currencies in recent years. Should the value of the U.S. dollar rise in comparison to other currencies, we may lose this competitive strength.
Exchange controls and restrictions on transfers abroad and capital inflow restrictions have limited, and can be expected to continue to limit, the availability of international credit. In 2001 and 2002, Argentina imposed exchange controls and transfer restrictions substantially limiting the ability of companies to retain foreign currency or make payments abroad. These restrictions have been substantially eased, including those requiring the Central Bank’s prior authorization for the transfer of funds abroad in order to pay dividends. However, Argentina may re-impose exchange control or transfer restrictions in the future, among other things, in response to capital flight or a significant depreciation of the Argentine peso. In addition, the government adopted various rules and regulations in June 2005 that established new controls on capital inflows, requiring, among other things, that 30% of all capital inflows (subject to certain exceptions) be deposited for one year in a non-assignable, noninterest bearing account in Argentina. Additional controls could have a negative effect on the economy and our Argentine business if imposed in an economic environment where access to local capital is substantially constrained. Moreover, in such event, restrictions on the transfers of funds abroad may impede our ability to receive dividend payments from our Argentine subsidiaries.
14
Our stock price may be volatile, and purchasers of our common stock could incur substantial losses.
Our stock price may be volatile. The stock market in general has experienced extreme volatility that has often been unrelated to the operating performance of particular companies. As a result of this volatility, you may not be able to sell your common stock at or above the price at which you purchase the shares. The market price for our common stock may be influenced by many factors, including:
|
|
•
|
the success of competitive products or technologies;
|
|
|
•
|
regulatory developments in the United States and foreign countries;
|
|
|
•
|
developments or disputes concerning patents or other proprietary rights;
|
|
|
•
|
the recruitment or departure of key personnel;
|
|
|
•
|
quarterly or annual variations in our financial results or those of companies that are perceived to be similar to us;
|
|
|
•
|
market conditions in the industries in which we compete and issuance of new or changed securities analysts’ reports or recommendations;
|
|
|
•
|
the failure of securities analysts to cover our common stock or changes in financial estimates by analysts;
|
|
|
•
|
the inability to meet the financial estimates of analysts who follow our common stock;
|
|
|
•
|
investor perception of our company and of the industry in which we compete; and
|
|
|
•
|
general economic, political and market conditions.
|
The concentration of our capital stock ownership among our largest stockholders, and their affiliates, may limit your ability to influence corporate matters.
To the best of our knowledge, our four largest stockholders, including our Executive Chairman, together beneficially own approximately 30% of our outstanding common stock. Consequently, these stockholders have significant influence over all matters that require approval by our stockholders, including the election of directors and approval of significant corporate transactions. This concentration of ownership may limit your ability to influence corporate matters, and as a result, actions may be taken that you may not view as beneficial.
The issuance of dividends may or may not occur in the foreseeable future.
On September 16, 2010, our Board of Directors approved an annual dividend of $0.15 per common share. The decision to pay dividends is at the discretion of our Board of Directors and depends on our financial condition, results of operations, capital requirements and other factors that our Board of Directors deems relevant. In the future, we intend to continue to consider declaring dividends on an annual basis, subject to reviewing our earnings and then current circumstances, but there is no guaranty that we will continue to issue dividends.
Provisions of our certificate of incorporation and by-laws could discourage potential acquisition proposals and could deter or prevent a change in control.
Some provisions in our certificate of incorporation and by-laws, as well as Delaware statutes, may have the effect of delaying, deferring or preventing a change in control. These provisions, including those providing for the possible issuance of shares of our preferred stock and the right of our Board of Directors to amend the bylaws, may make it more difficult for other persons, without the approval of the Board of Directors, to make a tender offer or otherwise acquire a substantial number of shares of our common stock or to launch other takeover attempts that a stockholder might consider to be in his or her best interest. These provisions could limit the price that some investors might be willing to pay in the future for shares of our common stock.
Our acquisition of exploration mining licenses in Nigeria involves a number of risks and uncertainties and may not be profitable.
During the three months ended March 31, 2011, we made advances totaling approximately $17,000,000 to acquire exploration mining licenses in Nigeria to mine for manganese ore, a raw material used in the production of certain silicon and manganese based alloys. We are in the process of having these licenses transferred from the existing owners, and intend to conduct geological and geophysical studies to ascertain the quality and quantity of manganese reserves on these sites. Until such evaluations are completed, the potential reserves associated with the mining licenses, as well as the capital and operating costs associated with the related extractive activities, are subject to considerable uncertainty.
We have no history of mining operations in Nigeria. Our future operations in Nigeria may be affected by changing economic, regulatory and political environments, which may impact our financial returns from projects in that country. The advancement of this project will require the operation of mines and the development of related infrastructure. In addition, if the price of manganese ore declines, if production costs increase, or recovery rates are lower than expected, or if applicable laws and regulations are adversely changed, we may never successfully establish mining operations, or any operations established may not achieve profitability.
|
Item 1B.
|
Unresolved Staff Comments
|
None.
15
|
Properties
|
We believe our facilities are suitable and adequate for our business and current production requirements. The following tables describe our primary office space, manufacturing facilities and mining properties:
|
Square
|
Number of
|
Business
|
||||||||||||||||
|
Location of Facility
|
Purpose
|
Footage
|
Furnaces
|
Own/Lease
|
Segment Served
|
|||||||||||||
|
New York, New York
|
Office
|
13,958
|
—
|
Lease
|
Corporate
|
|||||||||||||
|
Beverly, Ohio
|
Manufacturing and other
|
273,377
|
5
|
*
|
Own
|
GMI
|
||||||||||||
|
Selma, Alabama
|
Manufacturing and other
|
126,207
|
2
|
Own
|
GMI
|
|||||||||||||
|
Alloy, West Virginia
|
Manufacturing and other
|
1,063,032
|
5
|
Own
|
GMI
|
|||||||||||||
|
Niagara Falls, New York
|
Manufacturing and other
|
227,732
|
2
|
Own
|
GMI
|
|||||||||||||
|
Bridgeport, Alabama
|
Manufacturing and other
|
155,100
|
1
|
Own
|
GMI
|
|||||||||||||
|
Mendoza, Argentina
|
Manufacturing and other
|
138,500
|
2
|
Own
|
Globe Metales
|
|||||||||||||
|
San Luis, Argentina
|
Manufacturing and other
|
59,200
|
—
|
Own
|
Globe Metales
|
|||||||||||||
|
Police, Poland
|
Manufacturing and other
|
43,951
|
—
|
Own
|
Other
|
|||||||||||||
|
Shizuishan, China
|
Manufacturing and other
|
227,192
|
—
|
**
|
Other
|
|||||||||||||
___________________________
|
*
|
Excludes Solsil’s seven smaller furnaces used to produce UMG for solar cell applications.
|
|
**
|
We own the long-term land use rights for the land on which this facility is located. We own the building and equipment forming part of this facility.
|
|
Business
|
||||||
|
Location of Mine
|
Product
|
Own/Lease
|
Segment Served
|
|||
|
Billingsley, Alabama
|
Quartzite
|
Lease
|
GMI
|
|
Legal Proceedings
|
In the ordinary course of our business, we are subject to periodic lawsuits, investigations, claims and proceedings, including, but not limited to, contractual disputes, employment, environmental, health and safety matters, as well as claims associated with our historical acquisitions and divestitures. Although we cannot predict with certainty the ultimate resolution of lawsuits, investigations, claims and proceedings asserted against us, we do not believe any currently pending legal proceeding to which we are a party will have a material adverse effect on our business, prospects, financial condition, cash flows, results of operations or liquidity.
|
Item 4.
|
16
PART II
|
Item 5.
|
Market for Registrant’s Common Equity, Related Stockholder Matters and Issuer Purchases of Equity Securities
|
Market Information
Shares of our common stock are traded on the NASDAQ Global Select Market under the symbol “GSM.”
Price Range of Common Stock
Our shares began trading on the NASDAQ Global Select Market on July 30, 2009. The price range per share of common stock presented below represents the highest and lowest sales prices for our common stock on the NASDAQ Global Select Market during each quarter of the last two fiscal years.
|
Fourth Quarter
|
|
Third Quarter
|
|
Second Quarter
|
|
First Quarter
|
|
|
Fiscal year 2011 price range per common share
|
20.25 – 24.38
|
16.85 – 23.64
|
14.20 – 17.92
|
9.80 – 14.18
|
|||
|
Fiscal year 2010 price range per common share
|
12.74 – 9.59
|
|
11.40 – 9.20
|
|
9.98 – 7.60
|
|
9.22 – 6.81
|
Holders
As of August 23, 2011, there were approximately 32 holders of record of our common stock. The number of record holders does not include holders of shares in “street names” or persons, partnerships, associations, corporations or other entities identified in security position listings maintained by depositories.
Dividends and Dividend Policy
On September 16, 2010, our Board of Directors approved an annual dividend of $0.15 per common share. The dividend was paid on October 29, 2010, to stockholders of record as of October 15, 2010. The decision to pay dividends is at the discretion of our Board of Directors and depends on our financial condition, results of operations, capital requirements and other factors that our Board of Directors deems relevant. In the future, we intend to continue to consider declaring dividends on an annual basis, subject to reviewing our earnings and then current circumstances.
Sales of Unregistered Securities
The following is a summary of our transactions during the last three fiscal years, involving sales of our securities that were not registered under the Securities Act of 1933, as amended:
Between September 6, 2009 and October 2, 2009, we issued 1,574,529 shares of common stock in connection with the exercise of UPOs and 201,404 shares in connection with the exercise of outstanding warrants. These exercises resulted in proceeds of $1,497,000. The sales and issuances of shares to US persons pursuant to the exercise of UPOs and pursuant to the exercise of warrants were deemed to be exempt from registration under the Securities Act by virtue of Section 4(2) of the Securities Act as transactions by an issuer not involving any public offering. The sales and issuances of shares to non-US persons pursuant to the exercise of warrants were deemed to be exempt from registration under the Securities Act pursuant to Regulation S governing offers and sales made outside the United States.
Use of Proceeds
In August 2009, we closed on an initial public offering of 16,100,000 shares of our common stock at $7.00 per share. Of the shares offered, 5,600,000 shares were offered by us and 10,500,000 shares were offered by selling stockholders (which included 2,100,000 shares sold by the selling stockholders pursuant to the exercise of the underwriters’ over-allotment option). Total proceeds of the offering were $112,700,000, of which the selling stockholders received $68,355,000, net of underwriting discounts and commissions totaling $5,145,000, and we received $36,456,000, net of underwriting discounts and commissions totaling $2,744,000. In addition, we also recognized offering costs of $1,688,000. Net proceeds were utilized for the acquisition of Core Metals; the remaining proceeds have been added to working capital.
Purchases of Equity Securities by the Issuer and Affiliated Purchaser
We did not repurchase any of our outstanding equity securities during the most recent quarter covered by this report.
Securities Authorized for Issuance Under Equity Compensation Plans
|
Plan Category
|
Number of securities to be issued upon exercise of outstanding options, warrants and rights
(a)
|
Weighted-average exercise price of outstanding options, warrants and rights
(b)
|
Number of securities remaining available for future issuance under equity compensation plans (excluding securities reflected in column (a))
(c)
|
|
Equity compensation plans approved by security holders
|
3,390,127
|
$4.93
|
1,513,579
|
|
Equity compensation plans not approved by security holders
|
-
|
-
|
-
|
|
Total
|
3,390,127
|
$4.93
|
1,513,579
|
17
|
Item 6.
|
The following tables summarize certain selected consolidated financial data, which should be read in conjunction with our consolidated financial statements and the notes thereto and with “Management’s Discussion and Analysis of Financial Condition and Results of Operations” included elsewhere in this Annual Report on Form 10-K. The selected consolidated financial data presented below for the fiscal years ended June 30, 2011, 2010, 2009, 2008, and 2007 are derived from our audited consolidated financial statements.
|
Year Ended June 30,
|
||||||||||
|
2011
|
2010
|
2009
|
2008
|
2007
|
||||||
|
(Dollars in thousands, except per share data)
|
||||||||||
|
Statement of operations data:
|
||||||||||
|
Net sales
|
$ |
641,863
|
472,658
|
426,291
|
452,639
|
221,928
|
||||
|
Cost of goods sold
|
488,018
|
390,093
|
330,036
|
351,918
|
187,630
|
|||||
|
Selling, general and administrative expenses
|
54,739
|
47,875
|
56,322
|
42,857
|
15,033
|
|||||
|
Research and development
|
87
|
200
|
1,394
|
901
|
120
|
|||||
|
Restructuring charges
|
-
|
(81)
|
1,711
|
-
|
-
|
|||||
|
Loss (gain) on sale of business
|
4,249
|
(19,715)
|
-
|
-
|
-
|
|||||
|
Goodwill and intangible asset impairment
|
-
|
-
|
69,704
|
-
|
-
|
|||||
|
Operating income (loss)
|
94,770
|
54,286
|
(32,876)
|
56,963
|
19,145
|
|||||
|
Interest and other (expense) income
|
(2,056)
|
521
|
(899)
|
(5,285)
|
504
|
|||||
|
Income (loss) before income taxes and deferred interest subject to redemption
|
92,714
|
54,807
|
(33,775)
|
51,678
|
19,649
|
|||||
|
Provision for (benefit from) income taxes
|
35,988
|
20,539
|
11,609
|
15,936
|
7,047
|
|||||
|
Net income (loss) before deferred interest subject to redemption
|
56,726
|
34,268
|
(45,384)
|
35,742
|
12,602
|
|||||
|
Deferred interest subject to redemption
|
-
|
-
|
-
|
-
|
(768)
|
|||||
|
(Income) losses attributable to noncontrolling interest, net of tax
|
(3,918)
|
(167)
|
3,403
|
721
|
-
|
|||||
|
Net income (loss) attributable to Globe Specialty Metals, Inc.
|
$ |
52,808
|
34,101
|
(41,981)
|
36,463
|
11,834
|
||||
|
Earnings (loss) per common share - basic
|
$ |
0.70
|
0.46
|
(0.65)
|
0.62
|
0.25
|
||||
|
Earnings (loss) per common share - diluted
|
$ |
0.69
|
0.46
|
(0.65)
|
0.50
|
0.24
|
||||
|
Cash dividends declared per common share
|
$ |
0.15
|
-
|
-
|
-
|
0.07
|
||||
|
June 30,
|
June 30,
|
June 30,
|
June 30,
|
June 30,
|
|||||||
|
2011
|
2010
|
2009
|
2008
|
2007
|
|||||||
|
(Dollars in thousands)
|
|||||||||||
|
Balance sheet data:
|
|||||||||||
|
Cash and cash equivalents
|
$ |
166,208
|
157,029
|
61,876
|
73,994
|
67,741
|
|||||
|
Total assets
|
678,269
|
607,145
|
473,280
|
548,174
|
389,343
|
||||||
|
Total debt, including current portion
|
48,083
|
41,079
|
59,613
|
89,205
|
75,877
|
||||||
|
Total stockholders' equity
|
515,276
|
458,829
|
311,352
|
346,237
|
222,621
|
||||||
18
|
Item 7.
|
You should read the following discussion and analysis together with “Selected Financial Data” and our consolidated financial statements and the notes to those statements included elsewhere in this Annual Report on Form 10-K. This discussion contains forward-looking statements based on our current expectations, assumptions, estimates and projections about us and our industry. These forward-looking statements involve assumptions, risks and uncertainties. Our actual results could differ materially from those indicated in these forward-looking statements as a result of certain factors, as more fully described in the “Risk Factors” section and elsewhere in this Annual Report on Form 10-K. We undertake no obligation to update publicly any forward-looking statements for any reason, even if new information becomes available or other events occur in the future.
Introduction
Globe Specialty Metals, Inc., together with its subsidiaries (collectively, GSM, we, or our) is one of the leading manufacturers of silicon metal and silicon-based alloys. As of June 30, 2011, we owned and operated six principal manufacturing facilities, in two primary operating segments: GMI, our U.S. operations and, Globe Metales, our Argentine operations.
Business Segments
We operate in six reportable segments:
|
|
•
|
GMI — a manufacturer of silicon metal and silicon-based alloys located in the United States with plants in Beverly, Ohio, Alloy, West Virginia, Niagara Falls, New York, Selma, Alabama and Bridgeport, Alabama;
|
|
|
•
|
Globe Metais — a distributor of silicon metal manufactured in Brazil. This segment includes the historical Brazilian manufacturing operations, comprised of a manufacturing plant in Breu Branco and mining operations and forest reserves, which were all sold on November 5, 2009. Subsequent to this divestiture, Globe Metais’ net sales relate only to the fulfillment of certain retained customer contracts, which were completed as of December 31, 2010;
|
|
|
•
|
Globe Metales — a manufacturer of silicon-based alloys located in Argentina with a silicon-based alloys plant in Mendoza and a cored-wire fabrication facility in San Luis;
|
|
|
•
|
Solsil — a developer and manufacturer of upgraded metallurgical grade silicon metal located in the United States with operations in Beverly, Ohio;
|
|
|
•
|
Corporate — a corporate office including general expenses, investments, and related investment income; and
|
|
|
•
|
Other — includes an electrode production operation in China (Yonvey) and a cored-wire production facility located in Poland. These operations do not fit into the above reportable segments, and are immaterial for purposes of separate disclosure.
|
Overview and Recent Developments
Customer demand and pricing remain solid as our end markets for silicon metal and silicon-based alloys, which include chemicals, steel, aluminum, and solar, continue to perform well. During this summer there have been some reports that silicon metal spot sales and pricing were off slightly from their yearly high, which did not meaningfully affect us as the majority of our silicon metal sales are under annual contracts. In particular, aluminum customers experienced a modest slow down, as auto production was temporarily disrupted due to the Japanese earthquake. Overall, our end markets are performing well and have excellent prospects for continued growth. In our chemicals end market, which represents producers of silicones, the single largest application for silicon metal, the large manufacturers are performing well and generally meeting their growth and earnings expectations. Polysilicon production and solar cell demand is also continuing its growth with new production capacity coming on line around the world, including two new plants being built in Tennessee. Steel capacity utilization and auto production, two significant end markets, are both expected to grow, and aluminum production is also expected to increase. We are presently running all of our furnaces in our six primary plants at full capacity, subject to normal maintenance outages.
During our fiscal fourth quarter, we had a planned major maintenance outage of the furnace at our Bridgeport, Alabama plant for approximately thirty days. We also had an unplanned outage in Bridgeport due to a five day power disruption from the April tornadoes. We shipped approximately 4% less material in this quarter as we did in the immediately preceding quarter, which only included one meaningful planned outage of a smaller furnace than Bridgeport, primarily as a result of the Bridgeport planned outage. In the next quarter, ending September 30, 2011, we expect to have one planned outage. However, in the following quarter ending December 31, 2011, we anticipate having several planned maintenance outages in our Beverly, Ohio, Selma, Alabama and Niagara Falls, New York plants in order to prepare our furnaces for calendar 2012 and to take advantage of the 100% bonus depreciation tax deduction, which expires at the end of the calendar year.
We are nearing the beginning of construction of our new plant in Iceland. As we announced last quarter, we intend to build a 40,000 annual metric ton silicon metal plant in Iceland. We are building the plant with a minority partner, Tomahawk Development Company (Tomahawk), who secured substantially all the environmental and operating permits and the land, and who will own approximately 15% of the plant. We obtained an 18 year, competitively priced power contract for 66 megawatts. Prior to beginning construction, which is expected to take place before the end of calendar 2011, we have a few remaining steps to complete, including obtaining final board of directors approval. The plant is expected to be operational in the second half of calendar 2013. The total project will cost approximately €115,000,000 and will be financed with €79,000,000 of financing provided by two commercial banks, approximately €34,000,000 of cash from GSM, and €2,000,000 from Tomahawk.
Net sales for the quarter ended June 30, 2011 increased $3,132,000, or 2%, from the preceding quarter ended March 31, 2011, as a result of a 6% increase in average selling price partially offset by a 4% decrease in tons shipped. The average selling price increased in the quarter due to increased silicon metal spot pricing, higher pricing of all our alloy products, which reset each quarter, a mix shift towards the higher priced alloys and the pass-through of higher costs for certain raw materials.
During the quarter ended June 30, 2011, we incurred $2,745,000 of transaction-related and due diligence expenses and had $4,249,000 of expenses related to the settlement of certain liabilities from our Brazilian plant that we sold in November 2009 for a $19,715,000 gain. The Brazilian settlement represents the final ruling of an arbitration panel regarding a working capital dispute we had with Camargo Correa who sold us the Brazilian plant in January 2007. Also, the Bridgeport planned maintenance outage added approximately $2,500,000 of expense to cost of goods sold in the quarter.
19
Income before provision for income taxes totaled $29,238,000 in the quarter ended June 30, 2011, and included the $2,745,000 of transaction expenses and $4,249,000 of expenses related to the Brazilian settlement. This compares to income before provision for income taxes in the preceding quarter ended March 31, 2011 of $36,475,000, which included $1,350,000 of transaction expenses.
Outlook
We continue to be optimistic about the demand for our products as our end markets continue to grow. We are operating at full capacity, subject to maintenance outages. As demand has continued to improve, and all Western world suppliers appear to be running at full capacity, prices for our products have increased. We had a modest benefit in this quarter from this increase in silicon metal pricing from the fourth calendar quarter of 2010, when our annual 2011 contracts were entered into. We expect our average selling price of silicon metal to remain relatively flat for the remainder of calendar 2011. Silicon-based alloy pricing resets each quarter, and pricing is a function of overall supply and demand. Demand is largely derived from steel capacity utilization and auto production. We benefited in this quarter from increasing silicon-alloy pricing in all products, and expect pricing for the individual products to remain stable for the balance of calendar 2011, while mix shifts may cause the average pricing to vary. In addition, we were able to pass-through to our customers increases in rare earth prices. Certain rare earths are used in the manufacture of magnesium ferrosilicon.
We expect a modest decline in tons sold in the quarter ending September 30, 2011 as we build inventory during the quarter in order to fulfill shipments under customer contracts in the following quarter when we have a significant number of planned maintenance outages. As a result of the anticipated decrease in sales, we expect earnings to decline approximately 10% in the quarter ending September 30, 2011, from the quarter ended June 30, 2011, and then, in the subsequent quarter, to return to the level of the quarter ended June 30, 2011. In addition, we expect all planned outages to be completed by the end of November 2011, so that production will be at full capacity in December 2011.
In July 2011, we closed on the acquisition of Alden Resources, LLC, North America’s leading miner, processor and supplier of specialty metallurgical coal to the silicon and silicon-based alloys industries and also a supplier of thermal coal to the power industry. Specialty metallurgical coal is a key ingredient in the production of silicon metal. Alden is a major supplier of this type of specialty metallurgical coal to Globe and other silicon producers. By acquiring Alden, we secured a stable, long-term and low-cost supply of this key raw material to support continued growth worldwide while maintaining Alden's position as a leading supplier to other silicon and silicon-based alloy producers. Charcoal, where available, is a more costly alternative to coal and whose cost GSM would have to incur without adequate coal supplies. Alden has approximately 21 million tons of reserves of specialty metallurgical coal used predominately in the silicon and silicon-based alloy industries. Alden is currently operating six mines in Kentucky and Tennessee. Currently Alden supplies approximately 600,000 tons of coal annually to the silicon and silicon-based alloy markets in North America and overseas, with small quantities including byproducts sold to the thermal market. Alden also owns and operates a coal preparation plant in eastern Kentucky that washes and prepares the coal. The plant is newly upgraded and capable of processing over 2.5 million tons of coal per year. We financed the acquisition with $55,000,000 million of bank debt, at an interest rate of approximately 3%, and with $18,200,000 million of cash from GSM's balance sheet. In addition, the seller could receive a contingent payment of up to $6,800,000 million based on future performance.
Critical Accounting Policies
We prepare our consolidated financial statements in accordance with accounting principles generally accepted in the United States of America (U.S. GAAP). The preparation of these financial statements requires management to make estimates and assumptions that affect the reported amounts of assets, liabilities, revenues and expenses, as well as the disclosure of contingent assets and liabilities. We base our estimates and judgments on historical experience and other factors that are believed to be reasonable under the circumstances. Actual results may differ from the estimates used under different assumptions or conditions.
Business Combinations
We have completed a number of significant business acquisitions. Our business strategy contemplates that we may pursue additional acquisitions in the future. When we acquire a business, the purchase price is allocated based on the fair value of tangible assets and identifiable intangible assets acquired, and liabilities assumed. Fair value is the price that would be received to sell an asset or paid to transfer a liability in an orderly transaction between market participants. Goodwill as of the acquisition date is measured as the residual of the excess of the consideration transferred, plus the fair value of any noncontrolling interest in the acquiree at the acquisition date, over the fair value of the identifiable net assets acquired. We generally engage independent third-party appraisal firms to assist in determining the fair value of assets acquired and liabilities assumed. Such a valuation requires management to make significant estimates, especially with respect to intangible assets. These estimates are based on historical experience and information obtained from the management of the acquired companies. These estimates are inherently uncertain and may impact reported depreciation and amortization in future periods, as well as any related impairment of goodwill or other long lived assets.
Goodwill
At June 30, 2011, we had goodwill totaling $53,503,000. We annually review, in the third quarter of our fiscal year, goodwill for impairment. A review is also performed whenever events or changes in circumstances indicate the carrying amount of goodwill may not be recoverable. Impairment is the condition that exists when the carrying amount of goodwill exceeds its implied fair value. The implied fair value of goodwill is determined in the same manner as the amount of goodwill recognized in a business combination. The excess of the fair value of a reporting unit over the amounts assigned to its assets and liabilities is the implied fair value of goodwill. An impairment loss would be recognized when the carrying amount of goodwill exceeds the implied fair value of goodwill of the reporting unit. Fair value is measured based on a discounted cash flow method, using a discount rate determined by us to be commensurate with the risk inherent in our current business model, or a valuation technique based on multiples of earnings consistent with the objective of measuring fair value. The estimates of cash flows, future earnings, and discount rate are subject to change due to the economic environment and business trends, including such factors as raw material and product pricing, interest rates, expected market returns and volatility of markets served, as well as our future manufacturing capabilities, government regulation and technological change. We believe that the estimates of future cash flows, future earnings, and fair value are reasonable; however, changes in estimates, circumstances or conditions could have a significant impact on our fair valuation determination, which could then result in a material impairment charge in our results of operations.
Long-Lived Assets
At June 30, 2011, we had property, plant, and equipment, net of accumulated depreciation and amortization, totaling $229,977,000, including $18,731,000 associated with our Solsil business unit. Solsil is currently focused on research and development projects and is not producing material for commercial sale. We review the recoverability of our long-lived assets when events or changes in circumstances occur that indicate that the carrying value of the asset or asset group may not be recoverable. The assessment of possible impairment is based on our ability to recover the carrying value of the asset or asset group from the expected future undiscounted pretax cash flows of the related operations.
20
We assess the recoverability of the carrying value of long-lived assets at the lowest level for which identifiable cash flows are largely independent of the cash flows of other assets and liabilities. If these undiscounted cash flows are less than the carrying value of such asset or asset group, an impairment loss is measured based on the difference between estimated fair value and carrying value. Assets to be disposed are written down to the lower of carrying amount or fair value less costs to sell, and depreciation ceases. Fair value is determined through various valuation techniques, including discounted cash flow models, quoted market values, and third-party independent appraisals, as considered necessary. We believe that the estimates of future cash flows, future earnings, and fair value are reasonable; however, changes in estimates, circumstances or conditions, including the results of Solsil’s research and development activities, could have a significant impact on our fair valuation determination, which could then result in a material impairment charge in our results of operations.
Inventories
At June 30, 2011, we had inventories totaling $109,292,000. Inventories are valued at the lower of cost or market value, which does not exceed net realizable value. Cost of inventories is determined either by the first-in, first-out method or by the average cost method. When circumstances indicate a potential valuation issue, tests are performed to assess net realizable value, and as necessary, an inventory write-down is recorded for obsolete, slow moving or defective inventory. We estimate market and net realizable value based on current and future selling prices for our inventories, as well as the expected utilization of parts and supplies in our manufacturing process. We believe that these estimates are reasonable; however, changes in estimates or future price decreases caused by changing economic conditions, including customer demand, could result in future inventory adjustments, resulting in decreased operating profits and lower asset levels.
Share-Based Compensation
During the year ended June 30, 2011, we recorded share-based compensation expense of $4,462,000. Share-based payments (to the extent they are compensatory) are recognized in our consolidated statement of operations based on their fair values. We have applied the provisions of the SEC’s Staff Accounting Bulletin No. 107 (SAB 107) in our accounting for share-based compensation. We are required to estimate the stock awards that we ultimately expect to vest and to reduce share-based compensation expense for the effects of estimated forfeitures of awards over the expense recognition period. Given our share-based compensation was granted under a new plan and that there is limited historical data, we have estimated a forfeiture rate of zero. Actual forfeitures in the future may differ from this estimate, which would favorably impact our future results from operations.
We estimate the fair value of employee stock options using a Black-Scholes valuation model. Our common stock is currently traded on the NASDAQ Global Select Market (effective July 29, 2009). Accordingly, for stock awards granted subsequent to July 29, 2009, we value our common stock based upon the closing price of our common stock on the NASDAQ Global Select Market on the date immediately preceding the date of grant. Prior to July 29, 2009, our common stock was traded on the AIM market of the London Stock Exchange, and we valued our common stock based upon the closing price of our common stock on the AIM market on the date immediately preceding the date of grant. The fair value of an award is affected by our closing stock price as well as other assumptions, including the estimated volatility over the term of the awards and the estimated period of time that we expect employees to hold their stock options, which is calculated using the simplified method allowed by SAB 107. As there is limited trading data related to our common stock, the expected volatility over the expected vesting term of our share-based compensation is based upon the historical volatilities of similar companies. The risk-free interest rate assumption we use is based upon United States Treasury interest rates appropriate for the expected life of the award. Our expected dividend rate for grants prior to June 30, 2010 was zero as we did not pay cash dividends on our common stock and did not anticipate doing so. Actual results could differ from these estimates, which would impact our results from operations.
Income Taxes
We recorded a provision for income taxes of $35,988,000 during the year ended June 30, 2011. As part of the process of preparing consolidated financial statements, we are required to estimate income taxes in each of the jurisdictions in which we conduct business. This process involves estimating actual current tax expense and temporary differences between tax and financial reporting. Temporary differences result in deferred tax assets and liabilities, which are included in the consolidated balance sheet. We must assess the likelihood that deferred tax assets will be realized. A valuation allowance is recognized to reduce deferred tax assets if, and to the extent that, it is more likely than not that all or some portion of the deferred tax assets will not be realized. The determination of the need for a valuation allowance is based on an on-going evaluation of current information including, among other things, estimates of future earnings in different tax jurisdictions and the expected timing of deferred income tax asset and liability reversals. We believe that the determination to record a valuation allowance to reduce deferred income tax assets is a critical accounting estimate because it is based, in part, on an estimate of future taxable income in the various tax jurisdictions in which we do business, which is susceptible to change and may or may not occur, as well as the estimated timing of the reversal of temporary differences, which give rise to our deferred income tax assets, and because the impact of adjusting a valuation allowance may be material. In the event that actual results differ from estimates in future periods, and depending on the tax strategies that we may be able to implement, changes to the valuation allowance could impact our financial position and results of operations.
As part of our accounting for business combinations, some of the purchase price is allocated to goodwill and intangible assets. Amortization expense associated with acquired intangible assets is generally not tax deductible; however, deferred taxes have been recorded for non-deductible amortization expense as a part of the purchase price allocation process. We have taken into account the allocation of these identified intangibles among different taxing jurisdictions in establishing the related deferred tax liabilities. Income tax contingencies existing as of the acquisition dates of the acquired companies are evaluated quarterly and any adjustments are recorded as adjustments to income tax expense. Prior to our adoption of Accounting Standards Codification Subtopic 805-10, Business Combinations, on July 1, 2009, such adjustments were recorded to (a) reduce to zero any goodwill related to the acquisition, (b) reduce to zero other noncurrent intangible assets related to the acquisition, and (c) reduce income tax expense.
We recognize an uncertain tax position only if it is more likely than not that the tax position will be sustained upon examination by the relevant taxing authority that has full knowledge of all relevant information, based on the technical merits of the position. The income tax position is measured at the largest amount of benefit that is more than 50% likely of being realized upon settlement with a taxing authority. The determination of an uncertain tax position and the likelihood of it being realized requires critical judgment and estimates. We carefully assess each of the uncertain tax positions in order to determine the tax benefit that can be recognized in the consolidated financial statements. We record and/or disclose such potential tax liabilities, as appropriate, and reasonably estimate our income tax liabilities and recoverable tax assets. If new information becomes available, adjustments will be charged against income at that time. We do not anticipate that such adjustments would have a material adverse effect on our consolidated financial position or liquidity; however, it is possible that the final outcomes could have a material impact on our reported results of operations.
Results of Operations
Our results of operations are affected by our recent acquisitions and divestitures. We acquired Core Metals in April 2010. Accordingly, our results for the year ended June 30, 2011 include the results of Core Metals for the entire period. Results for the year ended June 30, 2010 include the results of Core Metals for three months. We sold the manufacturing operations of Globe Metais in November 2010, but continued to sell a portion of the silicon metal produced by Globe Metais to fulfill commitments to customers of Globe Metais that we retained until December 31, 2010.
21
GSM Fiscal Year Ended June 30, 2011 vs. 2010
Consolidated Operations:
|
Years Ended
|
|||||||||
|
June 30,
|
Increase
|
Percentage
|
|||||||
|
2011
|
2010
|
(Decrease)
|
Change
|
||||||
|
(Dollars in thousands)
|
|||||||||
| Results of Operations | |||||||||
| Net sales | $ |
641,863
|
472,658
|
169,205
|
35.8%
|
||||
| Cost of goods sold |
488,018
|
390,093
|
97,925
|
25.1%
|
|||||
| Selling, general and administrative expenses |
54,739
|
47,875
|
6,864
|
14.3%
|
|||||
| Research and development |
87
|
200
|
(113)
|
(56.5%)
|
|||||
| Restructuring charges |
-
|
(81)
|
81
|
NA
|
|||||
| Loss (gain) on sale of business |
4,249
|
(19,715)
|
23,964
|
NA
|
|||||
|
|
Operating income |
94,770
|
54,286
|
40,484
|
74.6%
|
||||
| Interest expense, net |
(2,984)
|
(4,054)
|
1,070
|
(26.4%)
|
|||||
| Other income |
928
|
4,575
|
(3,647)
|
(79.7%)
|
|||||
|
|
Income before provision for income taxes |
92,714
|
54,807
|
37,907
|
69.2%
|
||||
| Provision for income taxes |
35,988
|
20,539
|
15,449
|
75.2%
|
|||||
|
|
Net income |
56,726
|
34,268
|
22,458
|
65.5%
|
||||
| Income attributable to noncontrolling interest, net of tax |
(3,918)
|
(167)
|
(3,751)
|
2,246.1%
|
|||||
|
|
Net income attributable to Globe Specialty Metals, Inc. | $ |
52,808
|
34,101
|
18,707
|
54.9%
|
|||
Net Sales:
|
Year Ended June 30, 2011
|
Year Ended June 30, 2010
|
||||||||||||||
|
Net Sales
|
Net Sales
|
||||||||||||||
|
$ (in 000s)
|
MT
|
$/MT
|
$ (in 000s)
|
MT
|
$/MT
|
||||||||||
|
Silicon metal and silicon-based alloys
|
$ |
584,206
|
233,475
|
$ |
2,502
|
$ |
444,855
|
194,471
|
$ |
2,288
|
|||||
|
Silica fume and other
|
57,657
|
27,803
|
|||||||||||||
|
Total net sales
|
$ |
641,863
|
$ |
472,658
|
|||||||||||
Net sales increased $169,205,000, or 36%, from the prior year to $641,863,000 primarily as a result of a 20% increase in metric tons sold and a 9% increase in our average selling price. The increase in metric tons sold resulted in an increase in net sales of $78,269,000. Silicon metal volume sold was higher due to increased demand, which led us to reopen our Niagara Falls, New York facility in November 2009, which contributed approximately 7,900 incremental metric tons, and our Selma, Alabama facility in January 2010, which contributed approximately 11,500 incremental metric tons sold during fiscal year 2011. These increases were offset by the decrease in volume due to the timing of the sale of our Brazilian manufacturing operations on November 5, 2009. Subsequent to this divestiture, remaining Globe Metais sales related only to the fulfillment of certain retained customer contracts with product purchased from our former Brazilian manufacturing operations at a purchase price equal to our sales price. These customer contracts were fulfilled at the end of the second quarter of fiscal year 2011, and no further sales will be made under this arrangement. The increase in volume includes the impact of the Core Metals acquisition, which contributed approximately 25,397 incremental metric tons in fiscal year 2011 versus fiscal year 2010. Additionally, end market demand for ferrosilicon and magnesium ferrosilicon increased in fiscal year 2011 due to the economic recovery, particularly in steel and automotive production.
The increase in average selling price of 9% resulted in increased net sales of approximately $61,082,000. The increase in pricing was primarily due to higher pricing of the annual calendar 2011 contracts and higher spot pricing. The increase in pricing was also due to improved demand from the economic recovery, offset by the impact of the acquisition of Core Metals in the fourth quarter of fiscal year 2010, which resulted in a mix shift towards the production of ferrosilicon. Ferrosilicon is our lowest priced alloy and also has the lowest cost of production. Other revenue increased by $29,854,000 as a result of $13,956,000 of incremental other sales from Core Metals during fiscal year 2011 and the recognition of $9,400,000 in previously deferred revenue from Solsil as the technology license, joint development and supply agreement with BP Solar International Inc. (BP Solar) was terminated in the second quarter of fiscal year 2011.
Cost of Goods Sold:
The $97,925,000, or 25%, increase in cost of goods sold was a result of a 20% increase in metric tons sold, as well as a 4% increase in our cost per ton sold. This increase in cost per ton sold was primarily due to the impact of planned furnace maintenance outages at GMI and Core Metals, higher power rates at Globe Metales and GMI, and $4,300,000 of expense related to satisfaction of the long-term supply contract in fiscal year 2011. These cost increases were partially offset by the impact of reduced start-up costs of approximately $6,500,000 at our Niagara Falls and Selma plants in the year over year period, the mix shift to ferrosilicon, which has our lowest cost of production, and the timing of the sale of our Brazilian manufacturing operations on November 5, 2009.
Gross margin represented approximately 24% of net sales in fiscal year 2011 and increased from 17% of net sales in fiscal year 2010, primarily as a result of higher silicon metal and silicon-based alloy selling prices, partially offset by higher power costs at Globe Metales and GMI, as well as the impact of reduced margins on the sale of product purchased from our former Brazilian manufacturing operations.
Selling, General and Administrative Expenses:
The increase in selling, general and administrative expenses of $6,864,000, or 14%, was primarily a result of the impact of the acquisition of Core Metals, which incrementally increased expense by $2,458,000, and an increase in due diligence and transaction-related costs and audit and other professional fees, including Sarbanes-Oxley Act compliance related expenditures, of approximately $4,369,000 and $576,000, respectively, at Corporate. Additionally, bonus expense at Corporate increased approximately $1,794,000 due to profitability improvement year over year. These cost increases were partially offset by a decrease of approximately $2,488,000 at Globe Metais due to the timing of the sale of our Brazilian manufacturing operations.
22
Loss (Gain) on Sale of Business:
Loss (gain) on sale of business for fiscal year 2010 was associated with the sale of our Brazilian manufacturing operations on November 5, 2009. A subsequent settlement associated with our Brazilian manufacturing operations was recorded in fiscal year 2011.
Net Interest Expense:
Net interest expense decreased by $1,070,000 primarily due to lower interest rate swap expense of approximately $755,000 at GMI, as well as the timing of the sale of our Brazilian manufacturing operations on November 5, 2009, which resulted in a reduction in net interest expense of $347,000.
Other Income:
Other income decreased by $3,647,000 due primarily to a foreign exchange gain of $3,773,000 at Globe Metais in fiscal year 2010. The foreign exchange gain at Globe Metais consisted of foreign exchange gains of $2,924,000, primarily associated with the revaluation of long-term reais denominated tax liabilities, and a gain of $849,000 on our foreign exchange forward contracts. These foreign exchange fluctuations no longer occur following the sale of our Brazilian manufacturing operations on November 5, 2009.
Provision for Income Taxes:
Provision for income taxes as a percentage of pre-tax income was approximately 39%, or $35,988,000, in fiscal year 2011 and was approximately 37%, or $20,539,000, in fiscal year 2010. The increase in the effective tax rate is primarily due to the benefit associated with the recording of certain state tax credits partially offset by the recognition of $9,395,000 in income tax expense associated with the sale of our Brazilian manufacturing operations in fiscal year 2010.
Segment Operations
GMI
|
Years Ended
|
||||||||
|
June 30,
|
Increase
|
Percentage
|
||||||
|
2011
|
2010
|
(Decrease)
|
Change
|
|||||
|
(Dollars in thousands)
|
||||||||
|
Results of Operations
|
||||||||
|
Net sales
|
$ |
549,418
|
358,279
|
191,139
|
53.3%
|
|||
|
Cost of goods sold
|
422,775
|
296,122
|
126,653
|
42.8%
|
||||
|
Selling, general and administrative expenses
|
22,958
|
21,112
|
1,846
|
8.7%
|
||||
|
Restructuring charges
|
-
|
(81)
|
81
|
NA
|
||||
|
Operating income
|
$ |
103,685
|
41,126
|
62,559
|
152.1%
|
|||
Net sales increased $191,139,000, or 53%, from the prior year to $549,418,000. The increase was primarily attributable to a 35% increase in metric tons sold. Volume was higher primarily due to increased demand, which led us to reopen our Niagara Falls, New York facility in November 2009, which contributed approximately 7,900 incremental metric tons, and our Selma, Alabama facility in January 2010, which contributed approximately 11,500 incremental metric tons sold during fiscal year 2011. Volume was also higher due to the acquisition of Core Metals and an increase in end market demand, primarily from the steel and automotive industries for ferrosilicon and magnesium ferrosilicon in fiscal year 2011. The Core Metals acquisition contributed approximately 25,397 incremental metric tons in fiscal year 2011. Pricing increased 12% due to higher pricing of the annual calendar 2011 contracts and improved spot pricing in fiscal year 2011, offset by the impact of the Alloy joint venture pricing. As a result of the acquisition of Core Metals in the fourth quarter of fiscal year 2010, there was a product mix shift towards ferrosilicon, which is our lowest priced alloy and also has the lowest cost of production. This impact was offset by higher pricing on ferrosilicon and magnesium ferrosilicon products due to increased market demand.
The GMI segment includes the Alloy joint venture, which was entered into on November 5, 2009, and sells 49% of the output of the Alloy plant to Dow Corning Corporation (Dow Corning) at cost. We control the joint venture and consolidate its results in our financial statements. As a result of the joint venture, GMI’s gross margin has been negatively impacted by virtue of the material sold to Dow Corning at cost. The increase in pricing for silicon metal during fiscal year 2011 more than offset this impact and resulted in increased gross margin year over year.
Operating income increased by $62,559,000 from the prior year to $103,685,000. This increase was primarily due to higher volumes shipped of silicon-based alloys and silicon metal and higher average selling prices for silicon metal. Cost of goods sold increased by 43%, while volumes increased by only 35%. This was a result of an increase in the cost per ton sold due to the impact of planned furnace maintenance outages, higher power rates, and $4,300,000 of expense related to satisfaction of the long-term supply contract in fiscal year 2011, offset by the impact of reduced start-up costs of approximately $6,500,000 at our Niagara Falls and Selma plants in the year over year period. The addition of Core Metals incrementally contributed $2,458,000 to selling, general and administrative expenses in fiscal year 2011.
Globe Metais
|
Years Ended
|
||||||||
|
June 30,
|
Increase
|
Percentage
|
||||||
|
2011
|
2010
|
(Decrease)
|
Change
|
|||||
|
(Dollars in thousands)
|
||||||||
|
Results of Operations
|
||||||||
|
Net sales
|
$ |
15,421
|
62,126
|
(46,705)
|
(75.2%)
|
|||
|
Cost of goods sold
|
14,948
|
53,091
|
(38,143)
|
(71.8%)
|
||||
|
Selling, general and administrative expenses
|
76
|
2,564
|
(2,488)
|
(97.0%)
|
||||
|
Research and development
|
-
|
11
|
(11)
|
NA
|
||||
|
Loss on sale of business
|
-
|
1,197
|
(1,197)
|
NA
|
||||
|
Operating income
|
$ |
397
|
5,263
|
(4,866)
|
(92.5%)
|
|||
23
Net sales decreased $46,705,000, or 75%, from the prior year to $15,421,000. The decrease was primarily attributable to a decrease in metric tons sold of 69% and a decrease in average selling prices of 17%. The decrease in volume was due to the timing of the sale of our Brazilian manufacturing operations on November 5, 2009. Subsequent to this divestiture, remaining Globe Metais sales related only to the fulfillment of certain retained customer contracts with product purchased from our former Brazilian manufacturing operations at a purchase price equal to our sales price. These customer contracts were fulfilled at the end of the second quarter of fiscal year 2011, and no further sales will be made under this arrangement. The decrease in pricing was due to the year over year currency impact of Euro denominated contracts.
Operating income decreased by $4,866,000, or 93%, from the prior year to $397,000. The decrease was primarily due to the timing of the sale of our Brazilian manufacturing operations, which led to lower sales volumes, as well as the impact of reduced margins on the sale of product purchased from our former Brazilian manufacturing operations. Selling, general and administrative expenses decreased by $2,488,000 primarily due to the timing of the sale of our Brazilian manufacturing operations on November 5, 2009. Results in fiscal year 2010 also included transaction costs of $1,197,000 associated with the sale of the Brazilian manufacturing operations.
Globe Metales
|
Years Ended
|
||||||||
|
June 30,
|
Increase
|
Percentage
|
||||||
|
2011
|
2010
|
(Decrease)
|
Change
|
|||||
|
(Dollars in thousands)
|
||||||||
|
Results of Operations
|
||||||||
|
Net sales
|
$ |
62,321
|
48,959
|
13,362
|
27.3%
|
|||
|
Cost of goods sold
|
45,316
|
35,635
|
9,681
|
27.2%
|
||||
|
Selling, general and administrative expenses
|
3,808
|
3,251
|
557
|
17.1%
|
||||
|
Operating income
|
$ |
13,197
|
10,073
|
3,124
|
31.0%
|
|||
Net sales increased $13,362,000, or 27%, from the prior year to $62,321,000. This increase was primarily attributable to a 21% increase in average selling prices, as well as a 5% increase in metric tons sold. Pricing increased on magnesium ferrosilicon and calcium silicon due to improving demand, especially in the automotive and steel end markets. Additionally, pricing increased due to a mix shift from ferrosilicon, the lowest priced alloy, to calcium silicon and magnesium ferrosilicon. Volumes increased from higher shipments of magnesium ferrosilicon and calcium silicon as demand in the automotive and steel end markets continues to recover.
Operating income increased by $3,124,000 from the prior year to $13,197,000. The increase was primarily due to higher average selling prices offset by higher production costs. Cost of goods sold increased by 27%, primarily due to higher power, raw material and freight costs, and higher wage expense, while volumes increased by only 5%. Power costs increased beginning in November 2009 as our long-term power agreement expired. Additionally, selling, general and administrative expenses increased $557,000, primarily due to higher wage expense as a result of the terms of the union contract signed at the beginning of fiscal year 2011.
Solsil
|
Years Ended
|
||||||||
|
June 30,
|
Increase
|
Percentage
|
||||||
|
2011
|
2010
|
(Decrease)
|
Change
|
|||||
|
(Dollars in thousands)
|
||||||||
|
Results of Operations
|
||||||||
|
Net sales
|
$ |
9,420
|
20
|
9,400
|
47,000.0%
|
|||
|
Cost of goods sold
|
488
|
823
|
(335)
|
(40.7%)
|
||||
|
Selling, general and administrative expenses
|
175
|
385
|
(210)
|
(54.5%)
|
||||
|
Research and development
|
87
|
187
|
(100)
|
(53.5%)
|
||||
|
Operating income (loss)
|
$ |
8,670
|
(1,375)
|
10,045
|
(730.5%)
|
|||
Net sales increased $9,400,000 from the prior year to $9,420,000. This increase was primarily due to the recognition of $9,400,000 in previously deferred revenue as the BP Solar technology license, joint development and supply agreement was terminated during the second quarter of fiscal year 2011.
Operating income (loss) increased by $10,045,000 from the prior year to $8,670,000. The primary driver of this increase was the recognition of $9,400,000 in previously deferred revenue as the BP Solar technology license, joint development and supply agreement was terminated during the second quarter of fiscal year 2011. The decrease in cost of goods sold of $335,000 from the prior year to $488,000 was a result of Solsil’s suspension of commercial production and enhanced focus on refining its production processes to improve yield and reduce the cost of production. As a result of these changes, selling, general and administrative expenses decreased $210,000 and research and development expenses decreased $100,000.
Corporate
|
Years Ended
|
||||||||
|
June 30,
|
Increase
|
Percentage
|
||||||
|
2011
|
2010
|
(Decrease)
|
Change
|
|||||
|
(Dollars in thousands)
|
||||||||
|
Results of Operations
|
||||||||
|
Net sales
|
$ |
-
|
-
|
-
|
-
|
|||
|
Selling, general and administrative expenses
|
25,357
|
18,422
|
6,935
|
37.6%
|
||||
|
Loss (gain) on sale of business
|
4,249
|
(21,237)
|
25,486
|
NA
|
||||
|
Operating (loss) income
|
$ |
(29,606)
|
2,815
|
(32,421)
|
(1,151.7%)
|
|||
24
Operating (loss) income decreased $32,421,000 from the prior year to ($29,606,000). Fiscal year 2010 included a $21,237,000 gain on the sale of the manufacturing operations of Globe Metais, which was net of transaction expenses and the recording of certain retained liabilities. A subsequent settlement of retained acquisition contingencies was recorded in fiscal year 2011. Selling, general and administrative expenses increased by $6,935,000 primarily due to an increase in due diligence and transaction-related costs and audit and other professional fees, including Sarbanes-Oxley Act compliance related expenditures, of approximately $4,369,000 and $576,000, respectively. Additionally, bonus expense increased approximately $1,794,000 due to profitability improvement year over year.
GSM Fiscal Year Ended June 30, 2010 vs. 2009
Consolidated Operations:
|
Years Ended
|
|||||||||
|
June 30,
|
Increase
|
Percentage
|
|||||||
|
2010
|
2009
|
(Decrease)
|
Change
|
||||||
|
(Dollars in thousands)
|
|||||||||
| Results of Operations | |||||||||
| Net sales | $ |
472,658
|
426,291
|
46,367
|
10.9%
|
||||
| Cost of goods sold |
390,093
|
330,036
|
60,057
|
18.2%
|
|||||
| Selling, general and administrative expenses |
47,875
|
56,322
|
(8,447)
|
(15.0%)
|
|||||
| Research and development |
200
|
1,394
|
(1,194)
|
(85.7%)
|
|||||
| Restructuring charges |
(81)
|
1,711
|
(1,792)
|
(104.7%)
|
|||||
| Gain on sale of business |
(19,715)
|
-
|
(19,715)
|
NA
|
|||||
| Goodwill and intangible asset impairment |
-
|
69,704
|
(69,704)
|
NA
|
|||||
|
|
Operating income (loss) |
54,286
|
(32,876)
|
87,162
|
(265.1%)
|
||||
| Interest expense, net |
(4,054)
|
(6,218)
|
2,164
|
(34.8%)
|
|||||
| Other income |
4,575
|
5,319
|
(744)
|
(14.0%)
|
|||||
|
|
Income (loss) before provision for income taxes |
54,807
|
(33,775)
|
88,582
|
(262.3%)
|
||||
| Provision for income taxes |
20,539
|
11,609
|
8,930
|
76.9%
|
|||||
|
|
Net income (loss) |
34,268
|
(45,384)
|
79,652
|
(175.5%)
|
||||
| (Income) losses attributable to noncontrolling interest, net of tax |
(167)
|
3,403
|
(3,570)
|
(104.9%)
|
|||||
|
|
Net income (loss) attributable to Globe Specialty Metals, Inc. | $ |
34,101
|
(41,981)
|
76,082
|
(181.2%)
|
|||
Net Sales:
|
Year Ended June 30, 2010
|
Year Ended June 30, 2009
|
||||||||||||||
|
Net Sales
|
Net Sales
|
||||||||||||||
|
$ (in 000s)
|
MT
|
$/MT
|
$ (in 000s)
|
MT
|
$/MT
|
||||||||||
|
Silicon metal and silicon-based alloys
|
$ |
444,855
|
194,471
|
$ |
2,288
|
$ |
398,927
|
160,015
|
$ |
2,493
|
|||||
|
Silica fume and other
|
27,803
|
27,364
|
|||||||||||||
|
Total net sales
|
$ |
472,658
|
$ |
426,291
|
|||||||||||
Net sales increased $46,367,000, or 11%, from the prior year to $472,658,000 primarily as a result of a 22% increase in metric tons sold, offset by an 8% decrease in average selling price. The increase in metric tons sold resulted in an increase in net sales of $85,184,000. Volume sold was higher due to the reopening of our Niagara Falls, New York facility in November 2009, which provided approximately an additional 13,500 metric tons, offset by a decrease in production volumes in Selma, Alabama of approximately 2,500 metric tons due to plant closure from April 2009 to January 2010. The increase in volume includes the impact of the Core Metals acquisition, which contributed approximately 10,000 metric tons in fiscal year 2010. Additionally, end market demand for magnesium ferrosilicon increased in the second half of fiscal year 2010 due to the economic recovery, particularly in automotive production. The decline in average selling price of 8% resulted in decreased net sales of approximately $39,256,000. The decline in pricing was due to a significant reduction in steel production in the first half of fiscal year 2010, driven by lower automobile production and construction spending. This resulted in an overall reduction in customer demand, which caused us to reduce pricing to retain volume and also caused a mix shift towards the production of ferrosilicon, which is our lowest priced alloy and also has the lowest cost of production. Additionally, the acquisition of Core Metals in the fourth quarter of fiscal year 2010 caused a further mix shift within silicon-based alloys to ferrosilicon. The decrease in pricing was also due to the impact of shipping 49% of the Alloy joint venture output at cost to Dow Corning, offset by favorable annual contracts and higher spot pricing in the quarter ended June 30, 2010. Silica fume and other revenue increased by $439,000 as a result of $6,116,000 of other sales from Core Metals in fiscal year 2010, offset by a decline of $3,010,000 in Yonvey’s electrode sales to third parties, and lower production levels and sales of other by-products.
Cost of Goods Sold:
The $60,057,000, or 18%, increase in cost of goods sold was a result of a 22% increase in metric tons sold, offset by a 3% decline in cost per ton sold. This decline in cost per ton sold was the result of several factors, including the curtailment of Solsil production, which lowered cost of goods sold by $8,985,000 and metric tons sold by approximately 200, a mix shift within silicon-based alloys to lower cost ferrosilicon, which reduced cost of goods sold by approximately $6,800,000, and our overall cost reduction programs. These cost decreases were partially offset by lower capacity utilization during fiscal year 2010 and start-up costs totaling approximately $10,000,000, primarily at our Niagara Falls and Selma plants.
Gross margin represented approximately 23% of net sales in fiscal year 2009 and decreased to approximately 17% of net sales in fiscal year 2010, primarily as a result of the start-up costs for our Niagara Falls and Selma plants, the impact of selling 49% of the Alloy joint venture output at cost to Dow Corning, and the lower silicon-based alloy average selling price.
25
Selling, General and Administrative Expenses:
The decrease in selling, general and administrative expenses of $8,447,000, or 15%, was largely due to the write-off of $2,527,000 of deferred offering costs in the second quarter of fiscal year 2009, caused by a more than 90 day delay in our initial public offering, a decrease of $1,382,000 and $722,000 in audit and other professional fees at Corporate and Yonvey, respectively, a decrease of $716,000 of wages, insurance and general expense at Yonvey through aggressive cost cutting measures, a decrease of $757,000 primarily in salaries and wages at Solsil due to the suspension of commercial production, and a decrease of approximately $6,236,000 at Globe Metais, of which $5,680,000 was due to the timing of the sale of our Brazilian manufacturing operations, and the balance was due to aggressive cost reduction measures. These decreases were offset by an increase in salaries and benefits of $1,308,000 at GMI with the restart of the Niagara Falls plant, higher due diligence costs of $833,000 and the impact of the acquisition of Core Metals, which increased expense by $616,000.
Research and Development:
The decrease in research and development expenses of $1,194,000 was primarily due to the suspension of production and related activities at Solsil, which resulted in a decrease of $930,000.
Gain on Sale of Business:
Gain on sale of business recorded in fiscal year 2010 is associated with the sale of our Brazilian manufacturing operations on November 5, 2009 for gross cash proceeds of approximately $75,000,000, less transaction expenses and the recording of certain retained liabilities.
Goodwill and Intangible Asset Impairment:
Goodwill and intangible asset impairment recorded in fiscal year 2009 was approximately $69,704,000 and was associated with the Solsil business unit. The global economic slowdown, combined with a decrease in oil prices, caused a sharp decline in the product price and demand for upgraded metallurgical grade silicon. As a result, it was determined that the value of the Solsil business unit no longer supported its goodwill and intangible asset balances.
Net Interest Expense:
Net interest expense decreased by $2,164,000 due to the refinancing and repayment of credit facilities at GMI, Yonvey, and Globe Metales, which resulted in lower average debt balances and interest rates, and the timing of the sale of our Brazilian manufacturing operations on November 5, 2009.
Other Income:
Other income decreased by $744,000 due primarily to a one-time gain at GMI of $954,000 due to the settlement of litigation in fiscal year 2009, a year-over-year decrease of $543,000 of other income related to royalties associated with the lease of certain property at GMI, and a year-over-year decrease of $311,000 of dividend income to Globe Metales from hydroelectric plant ownership interests, offset by a year-over-year foreign exchange gain of $1,609,000, driven primarily by fluctuations of the Brazilian real against the U.S. dollar prior to our sale of Globe Metais’ manufacturing operations.
Provision for Income Taxes:
Our effective tax rate for fiscal years 2010 and 2009 was 37.5% and (34.4%), respectively. Our tax rate is affected by recurring items, such as tax rates in foreign jurisdictions and the relative amount of income we earn in each jurisdiction. It is also affected by discrete items that may occur in any given year, but are not consistent from year to year. The change in our tax provision was primarily due to the fact that the prior year goodwill impairment charge arose from a non-taxable acquisition and no tax benefit was obtained from the goodwill impairment. In addition, the change in the level of earnings and losses within the various tax jurisdictions in which we operate also impacted the effective tax rate. The increase in the effective tax rate was partially offset by the benefit associated with the recording of certain state tax credits and adjustments in fiscal year 2010.
Segment Operations
GMI
|
Years Ended
|
||||||||
|
June 30,
|
Increase
|
Percentage
|
||||||
|
2010
|
2009
|
(Decrease)
|
Change
|
|||||
|
(Dollars in thousands)
|
||||||||
|
Results of Operations
|
||||||||
|
Net sales
|
$ |
358,279
|
277,466
|
80,813
|
29.1%
|
|||
|
Cost of goods sold
|
296,122
|
212,213
|
83,909
|
39.5%
|
||||
|
Selling, general and administrative expenses
|
21,112
|
17,625
|
3,487
|
19.8%
|
||||
|
Restructuring charges
|
(81)
|
281
|
(362)
|
(128.8%)
|
||||
|
Operating income
|
$ |
41,126
|
47,347
|
(6,221)
|
(13.1%)
|
|||
Net sales increased $80,813,000, or 29%, from the prior year to $358,279,000. The increase was primarily attributable to a 33% increase in metric tons sold. Volume was higher primarily due to the impact of the reopening of our Niagara Falls facility in November 2009, which provided approximately an additional 13,500 metric tons, offset by a decrease in production volumes in Selma of approximately 2,600 metric tons due to plant closure from April 2009 to January 2010. Volume was also higher due to an increase in end market demand, primarily from the automotive industry, for magnesium ferrosilicon in the second half of fiscal year 2010. The increase in volume included the impact of the Core Metals acquisition, which contributed approximately 10,000 metric tons in fiscal year 2010. Pricing was down 4% due to a product mix shift towards ferrosilicon coupled with reduced ferrosilicon pricing, which was the result of reduced demand and aggressive foreign imports, offset by favorable annual contracts and improving spot market prices for certain products in the second half of fiscal year 2010. Additionally, the acquisition of Core Metals in the fourth quarter of fiscal year 2010 caused a further mix shift to ferrosilicon.
26
The GMI segment includes the Alloy joint venture, which was entered into on November 5, 2009, and sells 49% of the output of the Alloy plant to Dow Corning at cost. We control the joint venture and consolidate its results in our financial statements. As a result of the joint venture, GMI’s gross margin has been reduced by virtue of the material sold to Dow Corning at cost.
Operating income decreased by $6,221,000 from the prior year to $41,126,000. This was primarily due to increased production costs and lower average selling prices. Cost of goods sold increased by 40% while volumes increased by only 33%. This caused an increase in the cost per ton sold, which reflects our reduced capacity utilization, and start-up costs of approximately $9,700,000 at our Niagara Falls and Selma plants. The addition of Core Metals contributed $616,000 to selling, general and administrative expenses in fiscal year 2010, and the reopening of the Niagara Falls plant was a major driver of the $1,308,000 increase in salaries and benefits at GMI.
Globe Metais
|
Years Ended
|
||||||||
|
June 30,
|
Increase
|
Percentage
|
||||||
|
2010
|
2009
|
(Decrease)
|
Change
|
|||||
|
(Dollars in thousands)
|
||||||||
|
Results of Operations
|
||||||||
|
Net sales
|
$ |
62,126
|
95,096
|
(32,970)
|
(34.7%)
|
|||
|
Cost of goods sold
|
53,091
|
71,164
|
(18,073)
|
(25.4%)
|
||||
|
Selling, general and administrative expenses
|
2,564
|
8,800
|
(6,236)
|
(70.9%)
|
||||
|
Research and development
|
11
|
130
|
(119)
|
(91.5%)
|
||||
|
Restructuring charges
|
-
|
400
|
(400)
|
NA
|
||||
|
Gain on sale of business
|
1,197
|
-
|
1,197
|
NA
|
||||
|
Operating income
|
$ |
5,263
|
14,602
|
(9,339)
|
(64.0%)
|
|||
Net sales decreased $32,970,000, or 35%, from the prior year to $62,126,000. The decrease was primarily attributable to a 32% decrease in metric tons sold and a decrease in the sale of by-products of $3,928,000. The decrease in volume was due to the timing of the sale of our Brazilian manufacturing operations on November 5, 2009 and the global economic recession, which caused a pronounced decline in domestic Brazilian demand and European demand from producers of silicones and aluminum. After the sale of our Brazilian manufacturing operations, Globe Metais no longer produces or sells by-products.
Operating income decreased by $9,339,000, or 64%, from the prior year to $5,263,000. The decrease was primarily due to the timing of the sale of our Brazilian manufacturing operations, which led to lower sales volumes. Results also included transaction costs associated with the sale of $1,197,000. Cost of goods sold decreased 25% while volumes decreased 32%, which caused an increase in the cost per metric ton sold. This increase was due to lower capacity utilization and increased production costs associated with the appreciation of the Brazilian real, which was offset by gains on our foreign exchange forward contract, which are recorded in other income. Selling, general and administrative expenses decreased by $6,236,000 due to the timing of the sale of our Brazilian manufacturing operations on November 5, 2009, which resulted in a cost reduction of approximately $5,680,000, and the balance was due to aggressive cost reduction measures.
The gain on sale of business reflects only transaction costs of $1,197,000 associated with the sale of our Brazilian manufacturing operations, as the gain on the sale of the manufacturing operations is reported in the Corporate operating segment.
Globe Metales
|
Years Ended
|
||||||||
|
June 30,
|
Increase
|
Percentage
|
||||||
|
2010
|
2009
|
(Decrease)
|
Change
|
|||||
|
(Dollars in thousands)
|
||||||||
|
Results of Operations
|
||||||||
|
Net sales
|
$ |
48,959
|
50,731
|
(1,772)
|
(3.5%)
|
|||
|
Cost of goods sold
|
35,635
|
31,544
|
4,091
|
13.0%
|
||||
|
Selling, general and administrative expenses
|
3,251
|
3,560
|
(309)
|
(8.7%)
|
||||
|
Restructuring charges
|
-
|
678
|
(678)
|
NA
|
||||
|
Operating income
|
$ |
10,073
|
14,949
|
(4,876)
|
(32.6%)
|
|||
Net sales decreased $1,772,000, or 4%, from the prior year to $48,959,000. The decrease was primarily attributable to a 27% decrease in average selling price, partially offset by a 34% increase in metric tons sold. Pricing decreased due to the completion of certain favorable long-term contracts, a change in product mix, which included the sale of lower priced ferrosilicon, the market price of which was affected by a reduction in global steel production. Volumes increased primarily due to the re-entry of Globe Metales into the lower priced ferrosilicon market.
Operating income decreased by $4,876,000 from the prior year to $10,073,000. The decrease was primarily due to a decrease in average selling prices offset by higher volumes and lower production costs. Average selling prices decreased by 27% while cost per ton decreased by only 16%, partially as a result of the expiration of a long-term, low-priced power contract. The reduced gross margin and operating income resulted primarily from the change in product mix, which included the production of lower priced ferrosilicon, partially offset by our aggressive cost reduction initiatives.
27
Solsil
|
Years Ended
|
||||||||
|
June 30,
|
Increase
|
Percentage
|
||||||
|
2010
|
2009
|
(Decrease)
|
Change
|
|||||
|
(Dollars in thousands)
|
||||||||
|
Results of Operations
|
||||||||
|
Net sales
|
$ |
20
|
2,202
|
(2,182)
|
(99.1%)
|
|||
|
Cost of goods sold
|
823
|
9,808
|
(8,985)
|
(91.6%)
|
||||
|
Selling, general and administrative expenses
|
385
|
1,183
|
(798)
|
(67.5%)
|
||||
|
Research and development
|
187
|
1,117
|
(930)
|
(83.3%)
|
||||
|
Restructuring charges
|
-
|
187
|
(187)
|
NA
|
||||
|
Goodwill and intangible asset impairment
|
-
|
69,704
|
(69,704)
|
NA
|
||||
|
Operating loss
|
$ |
(1,375)
|
(79,797)
|
78,422
|
(98.3%)
|
|||
Net sales decreased $2,182,000 from the prior year to $20,000. The decrease was primarily attributable to Solsil suspending commercial production as a result of a significant decline in the price of polysilicon and the decline in demand for upgraded metallurgical grade silicon. As a result, we are concentrating our efforts on research and development activities focused on reducing our cost of production.
Cost of goods sold decreased $8,985,000 from the prior year to $823,000. Cost of goods sold was $7,606,000 in excess of sales in 2009, reflecting Solsil’s additional investment to refine its production processes. Selling, general and administrative expenses decreased $798,000 and research and development expenses decreased $930,000 as a result of suspended production and the focus on enhancing production yields and lowering the cost of production. Solsil recorded a goodwill and intangible asset impairment in the second quarter of fiscal year 2009 of $69,704,000. The global economic slowdown, combined with the decrease in oil prices, caused a sharp decline in the product price and demand for upgraded metallurgical grade silicon. As a result, it was determined that the value of the Solsil business no longer supported its goodwill and intangible asset balances.
Corporate
|
Years Ended
|
||||||||
|
June 30,
|
Increase
|
Percentage
|
||||||
|
2010
|
2009
|
(Decrease)
|
Change
|
|||||
|
(Dollars in thousands)
|
||||||||
|
Results of Operations
|
||||||||
|
Selling, general and administrative expenses
|
$ |
18,422
|
21,302
|
(2,880)
|
(13.5%)
|
|||
|
Restructuring charges
|
-
|
95
|
(95)
|
NA
|
||||
|
Gain on sale of business
|
(21,237)
|
-
|
(21,237)
|
NA
|
||||
|
Operating income (loss)
|
$ |
2,815
|
(21,397)
|
24,212
|
(113.2%)
|
|||
Operating income (loss) increased by $24,212,000 from the prior year to $2,815,000. The increase was primarily due to the $21,237,000 gain on the sale of business recorded in fiscal year 2010, which was associated with the sale of our Brazilian manufacturing operations on November 5, 2009 for gross cash proceeds of approximately $75,000,000, less transaction expenses and the recording of certain retained liabilities.
Selling, general and administrative expenses decreased $2,880,000 or 14%, from the prior year to $18,422,000. This was primarily due to the write-off of $2,527,000 of deferred offering costs in the second quarter of fiscal year 2009 because our initial public offering was postponed by more than 90 days and a decrease of $1,382,000 in audit and other professional fees.
Sources of Liquidity
Our principal sources of liquidity are our cash and cash equivalents balance, cash flows from operations, and unused commitments under our existing credit facilities. At June 30, 2011, our cash and cash equivalents balance was approximately $166,208,000, and we had $64,071,000 available for borrowing under our existing financing arrangements. We generated cash flows from operations totaling $61,188,000 during the year ended June 30, 2011.
Our subsidiaries borrow funds in order to finance working capital requirements and capital expansion programs. The terms of certain of our financing arrangements place restrictions on distributions of funds to us, however, we do not expect this to have an impact on our ability to meet our cash obligations. We believe we have access to adequate resources to meet our needs for normal operating costs, capital expenditure, and working capital for our existing business. Our ability to fund planned capital expenditures and make acquisitions will depend upon our future operating performance, which will be affected by prevailing economic conditions in our industry as well as financial, business and other factors, some of which are beyond our control.
As discussed in the Outlook section, in July 2011 we closed on the acquisition of Alden Resources, LLC, North America’s leading miner, processor and supplier of specialty metallurgical coal to the silicon and silicon-based alloys industries and also a supplier of thermal coal to the power industry. We financed the acquisition with $55,000,000 of bank debt, at an interest rate of approximately 3%, and with $18,200,000 of cash from GSM’s balance sheet. In addition, the seller could receive a contingent payment of up to $6,800,000 based on future performance.
We also mentioned in the Outlook section that we are nearing the beginning of the construction of our new silicon metal plant in Iceland. The project is expected to cost approximately €115,000,000. We have a few remaining steps to complete, including final board of directors approval, prior to beginning construction, which is expected to take place before the end of calendar 2011. We anticipate financing the plant with €79,000,000 of project financing from two commercial banks, approximately €34,000,000 of cash from GSM, and €2,000,000 from our minority partner. We intend to use our cash and cash equivalents balance to fund our portion of the project costs.
28
Cash Flows
The following table summarizes our primary sources (uses) of cash during the periods presented:
|
Year Ended June 30,
|
||||||||
|
2011
|
2010
|
2009
|
||||||
|
(Dollars in thousands)
|
||||||||
|
Cash and cash equivalents at beginning of period
|
$
|
157,029
|
61,876
|
73,994
|
||||
|
Cash flows provided by (used in) operating activities
|
61,188
|
(19,255)
|
64,014
|
|||||
|
Cash flows used in investing activities
|
(51,512)
|
(16,159)
|
(48,185)
|
|||||
|
Cash flows provided by financing activities
|
81
|
130,560
|
(27,954)
|
|||||
|
Effect of exchange rate changes on cash
|
(578)
|
7
|
7
|
|||||
|
Cash and cash equivalents at end of period
|
$
|
166,208
|
157,029
|
61,876
|
||||
Operating Activities:
Our business is cyclical and cash flows from operating activities may fluctuate during the year and from year-to-year due to economic conditions.
Net cash provided by (used in) operating activities was $61,188,000 and ($19,255,000) during fiscal year 2011 and 2010, respectively. The $80,443,000 increase in net cash provided by operating activities was primarily due to improved operating results, excluding the impact of the gain on the sale of our Brazilian manufacturing operations, as well as a less significant increase in net working capital during fiscal year 2011, compared with fiscal year 2010. Inventories increased during fiscal year 2011 due primarily to higher electrode levels for use in future production. Additionally, accounts receivable increased due to timing of sales and higher average selling prices. In fiscal year 2010, accounts receivable increased significantly due to overall increased sales from the prior year, primarily due to the start-up of our Niagara Falls, New York and Selma, Alabama plants. This increase in accounts receivables in fiscal year 2010 was offset by an increase in accounts payable, primarily due to increased production in response to higher demand for our products, as well as additional purchases associated with the restart of furnaces. In fiscal year 2010, a tax payment of $38,449,000 was made on the taxable gains on sale of our former Brazilian manufacturing operations and a noncontrolling interest in WVA Manufacturing LLC (WVA LLC).
Net cash (used in) provided by operating activities was approximately ($19,255,000) and approximately $64,014,000 during fiscal year 2010 and 2009, respectively. Net cash provided by operating activities excludes changes in our operating assets and liabilities associated with the sale of our Brazilian manufacturing operations, but include the operating cash flows of these operations prior to the November 5, 2009 date of sale. Excluding the impact of the one-time goodwill and intangible asset charge and the gain on the sale of Globe Metais, the $83,269,000 decrease in net cash provided by operating activities was due to an increase in net working capital and lower operating results, as well as a tax payments of $38,449,000 made on the taxable gains on sale of Globe Metais and a noncontrolling interest in WVA LLC. In fiscal year 2010, accounts receivable increased significantly due to overall increased sales. Further, accounts payable increased primarily due to increased production in response to higher demand for our products. Finally, we reduced accrued liabilities due to the timing of recognition of deferred revenue based on product shipment.
Investing Activities:
Net cash used in investing activities was approximately $51,512,000 and $16,159,000 during fiscal year 2011 and 2010, respectively. In fiscal year 2010, $58,136,000 of cash was provided by the sale of our Brazilian manufacturing operations, net of cash transferred of $16,555,000. The acquisition of Core Metals on April 1, 2010 resulted in the use of approximately $52,000,000 in cash, net of cash acquired of $1,873,000, and was offset by net cash received from the sale of Masterloy of $2,423,000. Year over year capital expenditures increased from approximately $22,901,000 to $35,039,000 due to furnace overhauls at our GMI and Core Metals plants during fiscal year 2011. Additionally, we received $2,500,000 in proceeds associated with the divestiture of our 49% ownership interest in Fluorita de Mexico, S.A. de C.V., offset by net payments of $2,038,000, which were made for working capital claims associated with our historical acquisitions. During fiscal year 2011, we made advances totaling approximately $17,000,000 to acquire exploration mining licenses in Nigeria to mine for manganese ore, a raw material used in the production of certain silicon and manganese based alloys.
Net cash used in investing activities was approximately $16,159,000 and approximately $48,185,000 during fiscal year 2010 and 2009, respectively. In fiscal year 2010, $58,136,000 of cash was provided by the sale of 100% of our interest in the manufacturing operations of Globe Metais, net of cash transferred with the sale of $16,555,000. The acquisition of Core Metals on April 1, 2010 resulted in the use of approximately $52,000,000 in cash, net of cash acquired of $1,873,000, and was offset by net cash received from the sale of Masterloy of $2,423,000. Year over year capital expenditures decreased from approximately $51,437,000 to $22,901,000 as capital expenditures related to the reopening and expansion of the Niagara Falls facility, capital investments to increase the upgraded metallurgical grade silicon capacity of Solsil, and capital improvements at Yonvey have largely been completed. Capital expenditures in fiscal year 2010 primarily consisted of maintenance capital expenditure and the completion of the Niagara Falls facility expansion. Net cash provided by investing activities of approximately $2,987,000 in fiscal year 2009 was due to the redemption of U.S. government treasury securities.
Financing Activities:
Net cash provided by financing activities was approximately $81,000 and $130,560,000 during fiscal year 2011 and 2010, respectively. The proceeds from the close of our initial public offering and listing on the NASDAQ during fiscal year 2010 contributed $36,456,000, net of underwriting discounts and commissions of $2,744,000. Additionally, $97,917,000 of cash was provided by the sale of a 49% interest in WVA LLC, net of transaction costs, during fiscal year 2010. Net borrowings of approximately $7,004,000 of long-term and short-term debt occurred during fiscal year 2011, as compared to net payments of approximately $4,540,000 of long-term and short-term debt in fiscal year 2010. During fiscal year 2011, a dividend payment of $11,269,000 was paid to our common stockholders, which was partially offset by the contribution of $5,215,000 from the exercise of stock options.
Net cash provided by (used in) financing activities was approximately $130,560,000 and approximately $(27,954,000) during fiscal year 2010 and 2009, respectively. The increase of approximately $158,514,000 in cash provided by financing activities was mainly due to $97,917,000 of cash provided by the sale of a 49% interest in WVA LLC, net of transaction costs. Proceeds from the close of our initial public offering and listing on the NASDAQ contributed $36,456,000, net of underwriting discounts and commissions of $2,744,000. Additionally, net payments of approximately $4,540,000 of long-term and short-term debt, compared to net repayments of $28,041,000 in the fiscal year 2009. Current year borrowings include $16,000,000 used for the acquisition of Core Metals, which remains outstanding at June 30, 2010. Cash provided by warrant and UPO exercises increased by approximately $664,000 year-over-year, as UPO and warrant holders exercised these financial instruments prior to their expiration in October 2009.
Exchange Rate Change on Cash:
The effect of exchange rate changes on cash was related to fluctuations in renminbi, the functional currency of our Chinese subsidiary, Yonvey.
29
Commitments and Contractual Obligations
The following tables summarize our contractual obligations at June 30, 2011 and the effects such obligations are expected to have on our liquidity and cash flows in future periods:
|
Contractual Obligations
|
Less than
|
One to
|
Three to
|
More than
|
|||||||
|
(as of June 30, 2011)
|
Total
|
One Year
|
Three Years
|
Five Years
|
5 Years
|
||||||
|
(Dollars in thousands)
|
|||||||||||
|
Operating lease obligations (1)
|
$ |
8,951
|
3,297
|
4,701
|
953
|
—
|
|||||
|
Purchase obligations (2)
|
102,857
|
25,500
|
43,270
|
34,087
|
—
|
||||||
|
Total
|
$
|
111,808
|
28,797
|
47,971
|
35,040
|
—
|
|||||
____________
|
|
(1)
|
Represents minimum rental commitments under noncancelable leases for machinery and equipment, automobiles, rail cars and office space.
|
|
|
(2)
|
Purchase obligations include contractual commitments under various long and short-term take or pay arrangements with suppliers. These obligations include commitments to purchase raw materials used in our manufacturing process, which specify a minimum purchase quantity through calendar year 2016.
|
The table above also excludes certain other obligations reflected in our consolidated balance sheet, including estimated funding for pension obligations, for which the timing of payments may vary based on changes in the fair value of pension plan assets and actuarial assumptions. We expect to contribute approximately $1,870,000 to our pension plans for the year ended June 30, 2012.
Off-Balance Sheet Arrangements
We do not have any material off-balance sheet arrangements or relationships with unconsolidated entities of financial partnerships, such as entities often referred to as structured finance or special purpose entities.
Litigation and Contingencies
We are subject to various lawsuits, claims and proceedings that arise in the normal course of business, including employment, commercial, environmental, safety and health matters, as well as claims associated with our historical acquisitions and divestitures. Although it is not presently possible to determine the outcome of these matters, in the opinion of management, the ultimate disposition of these matters will not have a material adverse effect on our consolidated financial position, results of operations, or liquidity.
At June 30, 2011 and June 30, 2010, there are no liabilities recorded for environmental contingencies. With respect to the cost for ongoing environmental compliance, including maintenance and monitoring, such costs are expensed as incurred unless there is a long-term monitoring agreement with a governmental agency, in which case a liability is established at the inception of the agreement.
Recently Implemented Accounting Pronouncements
In June 2009, the FASB issued an amendment to ASC Subtopic 860-10, Transfers and Servicing. The objective of this amendment is to improve the relevance, representational faithfulness, and comparability of the information that a reporting entity provides in its financial statements about a transfer of financial assets; the effects of a transfer on its financial position, financial performance, and cash flows; and a transferor’s continuing involvement, if any, in transferred financial assets. This amendment improves financial reporting by eliminating (1) the exceptions for qualifying special-purpose entities from the consolidation guidance and (2) the exception that permitted sale accounting for certain mortgage securitizations when a transferor has not surrendered control over the transferred financial assets. This amendment was adopted on July 1, 2010. This change had no effect on the Company’s financial position or results of operations.
In June 2009, the FASB issued an amendment to ASC Subtopic 810-10, Consolidation — Variable Interest Entities. The objective of this amendment is to improve financial reporting by enterprises involved with variable interest entities by eliminating the quantitative-based risks and rewards calculation and requiring an enterprise to perform an analysis to determine whether the enterprise’s variable interest or interests give it a controlling interest in a variable interest entity. In addition, the amendment requires an ongoing reassessment of whether an enterprise is the primary beneficiary of a variable interest entity. This amendment was adopted on July 1, 2010. The Company is not currently involved with variable interest entities and, therefore, this change had no effect on the Company’s financial position or results of operations.
In October 2009, the FASB issued an amendment to ASC Subtopic 820-10, Fair Value Measurements and Disclosures (ASC 820). This amendment requires reporting entities to make new disclosures about recurring or nonrecurring fair value measurements, including significant transfers into and out of Level 1 and Level 2 fair value measurements and information about purchases, sales, issuances, and settlements on a gross basis in the reconciliation of Level 3 fair value measurements. The amendment also clarifies existing fair value measurement disclosure guidance about the level of disaggregation, inputs, and valuation techniques. Adoption of this amendment to ASC 820 had no impact on the Company’s financial position and results of operations.
Accounting Pronouncements to be Implemented
In June 2011, the FASB issued an amendment to ASC Subtopic 220-10, Comprehensive Income (ASC 220). The objective of this amendment is to increase the prominence of other comprehensive income in the financial statements. The new accounting guidance requires entities to report components of net income comprehensive income in either (1) a continuous statement of comprehensive income or (2) two separate but consecutive statements. This amendment is effective for fiscal years ending after December 15, 2011. The Company is currently evaluating the impact of adopting this guidance on its financial statements.
30
|
Item 7A.
|
Quantitative and Qualitative Disclosures About Market Risk
|
Quantitative and Qualitative Disclosures about Market Risk
We are exposed to market risks arising from adverse changes in:
|
|
•
|
commodity prices,
|
|
|
•
|
interest rates, and
|
|
|
•
|
foreign exchange rates.
|
In the normal course of business, we manage these risks through a variety of strategies, including obtaining captive or long-term contracted raw material supplies and hedging strategies. Obtaining captive or long-term contracted raw material supplies involves the acquisition of companies or assets for the purpose of increasing our access to raw materials or the identification and effective implementation of long-term leasing rights or supply agreements. We enter into derivative instruments to hedge certain commodity price, interest rate, and foreign currency risks. We do not engage in commodity, interest rate, or currency speculation, and no derivatives are held for trading purposes.
All derivatives are accounted for using mark-to-market accounting. We believe it is not practical to designate our derivative instruments as hedging instruments as defined under ASC Subtopic 815-10, Derivatives and Hedging (ASC 815). Accordingly, we adjust our derivative financial instruments to current market value through the consolidated statement of operations based on the fair value of the agreement as of period-end. Although not designated as hedged items as defined under ASC 815, these derivative instruments serve to significantly offset our commodity, interest rate, and currency risks. Gains or losses from these transactions offset gains or losses on the assets, liabilities, or transactions being hedged. No credit loss is anticipated as the counterparties to our derivative agreements are major financial institutions that are highly rated.
The sensitivity of our derivatives to these market fluctuations is discussed below. See our June 30, 2011 consolidated financial statements for further discussion of these derivatives and our hedging policies.
Commodity Prices:
We are exposed to price risk for certain raw materials and energy used in our production process. The raw materials and energy which we use are largely commodities, subject to price volatility caused by changes in global supply and demand and governmental controls. Derivative financial instruments are not used extensively to manage our exposure to fluctuations in the cost of commodity products used in our operations. We attempt to reduce the impact of increases in our raw material and energy costs by negotiating long-term contracts and through the acquisition of companies or assets for the purpose of increasing our access to raw materials with favorable pricing terms. We have entered into long-term power supply contracts that result in stable, favorably priced long-term commitments for the majority of our power needs. Additionally, we have long-term lease mining rights in the U.S. that supply us with a substantial portion of our requirements for quartzite. We also have obtained a captive supply of electrodes through our 70% ownership interest in Yonvey.
In June 2010, we entered into a power hedge agreement on a 175,440 MWh notional amount of electricity, representing approximately 20% of the total power required by our Niagara Falls, New York plant. This hedge covers our expected needs not supplied by the facility’s long-term power contract over the term of the hedge agreement. The notional amount decreases equally per month through the agreement’s expiration on June 30, 2012. Under the power hedge agreement, we fixed the power rate at $39.60 per MWh over the life of the contract. In October 2010, we entered into a power hedge agreement on a 87,600 MWh notional amount of electricity. The agreement is effective July 1, 2012 and the notional amount decreases equally per month through the agreement’s expiration on June 30, 2013. Under the power hedge agreement, we fixed the power rate at $39.95 per MWh over the life of the contract.
The $110,000 liability associated with the fair value of our power hedge agreements at June 30, 2011 is included in other long-term liabilities.
To the extent that we have not mitigated our exposure to rising raw material and energy prices, we may not be able to increase our prices to our customers to offset such potential raw material or energy price increases, which could have a material adverse effect on our results of operations and operating cash flows.
Interest Rates:
We are exposed to market risk from changes in interest rates on certain of our short-term and long-term debt obligations.
At June 30, 2011, we had approximately $46,989,000 of variable rate debt. To manage our interest rate risk exposure we have entered into an interest rate cap and interest rate swap agreements with investment grade financial institutions.
In connection with our revolving credit facility and senior term loan, we entered into an interest rate cap arrangement and three interest rate swap agreements to reduce our exposure to interest rate fluctuations.
In October 2008, we entered into an interest rate cap arrangement to cap LIBOR on a $20,000,000 notional amount of debt, with the notional amount decreasing by $1,053,000 per quarter through the interest rate cap’s expiration on June 30, 2013. Under the interest rate cap, we capped LIBOR at a maximum of 4.5% over the life of the agreement.
In November 2008, we entered into an interest rate swap agreement involving the exchange of interest obligations relating to a $13,333,000 notional amount of debt, with the notional amount decreasing by $702,000 per quarter. Under the interest rate swap, we receive LIBOR in exchange for a fixed interest rate of 2.85% over the life of the agreement. The agreement expires in June 2013.
In January 2009, we entered into a second interest rate swap agreement involving the exchange of interest obligations relating to a $12,632,000 notional amount of debt, with the notional amount decreasing by $702,000 per quarter. Under the interest rate swap, we receive LIBOR in exchange for a fixed interest rate of 1.66% over the life of the agreement. The agreement expires in June 2013.
In April 2009, we entered into a third interest rate swap agreement involving the exchange of interest obligations relating to an $11,228,000 notional amount of debt, with the notional amount decreasing by $702,000 per quarter. Under the interest rate swap, we receive LIBOR in exchange for a fixed interest rate of 2.05% over the life of the agreement. The agreement expires in June 2013.
31
In connection with our export prepayment financing arrangement, we entered into an interest rate swap agreement involving the exchange of interest obligations relating to a $14,000,000 notional amount of debt, with the notional amount decreasing by $3,000,000 on a semiannual basis through August 2011, and a final $2,000,000 notional amount swapped for the six month period ended January 2012. Under the interest rate swap, we received LIBOR in exchange for a fixed interest rate of 2.66% over the life of the agreement. This agreement, as well as the related export prepayment financing arrangement, was transferred with the sale of the manufacturing operations of Globe Metais.
The $320,000 liability associated with the fair value of our interest rate derivative instruments at June 30, 2011 is included in other long-term liabilities.
If market interest rates were to increase or decrease by 10% for the full 2012 fiscal year as compared to the rates in effect at June 30, 2011, we estimate that the change would not have a material impact to our cash flows or results of operations.
Foreign Currency Risk:
We are exposed to market risk arising from changes in currency exchange rates as a result of operations outside the United States, principally in Argentina and China. A portion of our net sales generated from our non-U.S. operations is denominated in currencies other than the U.S. dollar. Most of our operating costs for our non-U.S. operations are denominated in local currencies, principally the Argentine peso and the Chinese renminbi. Consequently, the translated U.S. dollar value of our non-U.S. dollar sales, and related accounts receivable balances, and our operating costs are subject to currency exchange rate fluctuations. Derivative instruments are not used extensively to manage this risk. We have utilized derivative financial instruments, including foreign exchange forward contracts, to manage a portion of our net foreign currency exposure to the Brazilian real and the Euro. All of the Brazilian real contracts were settled prior to the sale of the manufacturing operations of Globe Metais.
If foreign exchange rates were to increase or decrease by 10% for the full 2012 fiscal year, as compared to the rates in effect at June 30, 2011, we estimate that the change would not have a material impact to our cash flows or results of operations.
|
Item 8.
|
Financial Statements and Supplementary Data
|
The financial statements appearing on pages 37 to 69 are incorporated herein by reference.
|
Changes in and Disagreements with Accountants on Accounting and Financial Disclosure
|
None.
|
Item 9A.
|
Controls and Procedures
|
Conclusion Regarding the Effectiveness of Disclosure Controls and Procedures
Under the supervision and with the participation of our management, including our Chief Executive Officer and Chief Financial Officer, we evaluated the effectiveness of our disclosure controls and procedures as such term is defined in Securities Exchange Act Rule 13a-15(e) or 15d-15(e). Based on that evaluation, the Chief Executive Officer and Chief Financial Officer have concluded that our disclosure controls and procedures are effective as of the end of the period covered by this report.
Management’s Report on Internal Control Over Financial Reporting
Management is responsible for establishing and maintaining adequate internal control over financial reporting and for the assessment of the effectiveness of internal controls over financial reporting. Our internal control system over financial reporting is a process designed under the supervision of our Chief Executive Officer and Chief Financial Officer to provide reasonable assurance regarding the reliability of financial reporting and the preparation of the consolidated financial statements in accordance with U.S. generally accepted accounting principles.
The Company’s internal control over financial reporting includes those policies and procedures that (i) pertain to the maintenance of records that, in reasonable detail, accurately and fairly reflect the transactions and dispositions of the assets of the Company; (ii) provide reasonable assurance that transactions are recorded as necessary to permit preparation of the financial statements in accordance with U.S. generally accepted accounting principles, and that receipts and expenditures of the Company are being made only in accordance with authorizations of management and directors of the Company; and (iii) provide reasonable assurance regarding prevention or timely detection of unauthorized acquisition, use, or disposition of the Company’s assets that could have a material effect on the Company’s financial statements.
Because of its inherent limitations, internal control over financial reporting may not prevent or detect misstatements. Also, projections of any evaluation of effectiveness to future periods are subject to the risk that controls may become inadequate because of changes in conditions, or that the degree of compliance with the policies or procedures may deteriorate.
In connection with the preparation of our annual consolidated financial statements, management has undertaken its assessment of the effectiveness of our internal control over financial reporting as of June 30, 2011, based on the criteria established in Internal Control-Integrated Framework issued by the Committee of Sponsoring Organizations of the Treadway Commission (COSO). Management’s assessment included an evaluation of the design of our internal control over financial reporting and testing of the operational effectiveness of those controls. Based on this assessment, management has concluded that the Company’s internal control over financial reporting was effective as of June 30, 2011.
Report of Independent Registered Public Accounting Firm
KPMG LLP, the independent registered public accounting firm that audited our consolidated financial statements included in this report, has issued its report on the effectiveness of our internal control over financial reporting, a copy of which appears on page 39 of this annual report.
Changes in Internal Control Over Financial Reporting
There has been no change in our internal control over financial reporting during the fourth quarter ended June 30, 2011, that has materially affected, or is reasonably likely to materially affect, our internal control over financial reporting.
|
Item 9B.
|
Not applicable.
32
PART III
Certain information required by Part III is omitted from this report in that we will file a definitive proxy statement pursuant to Regulation 14A with respect to our 2011 Annual Meeting (the “Proxy Statement”) no later than 120 days after the end of the fiscal year covered by this report, and certain information included therein is incorporated herein by reference. Only those sections of the Proxy Statement which specifically address the items set forth herein are incorporated by reference.
Item 10. Directors, Executive Officers and Corporate Governance
Except as set forth below, the information required by this Item is hereby incorporated herein by reference to the Proxy Statement.
Set forth below is certain information about our executive officers:
|
Name
|
Age
|
Position
|
||||
|
Alan Kestenbaum
|
49
|
Executive Chairman and Director
|
||||
|
Jeff Bradley
|
51
|
Chief Executive Officer and Chief Operating Officer
|
||||
|
Malcolm Appelbaum
|
50
|
Chief Financial Officer
|
||||
|
Stephen Lebowitz
|
46
|
Chief Legal Officer
|
||||
Alan Kestenbaum has served as Executive Chairman and Director since our inception in December 2004, and served as Chief Executive Officer from our inception through May 2008. From June 2004, Mr. Kestenbaum served as Chairman of Globe Metallurgical, Inc., until its acquisition by us in November 2006. He has over 20 years of experience in metals including finance, distribution, trading and manufacturing. Mr. Kestenbaum is a founder and the Chief Executive Officer of Marco International Corp., and its affiliates, a finance trading group specializing in metals, minerals and other raw materials, founded in 1985. Mr. Kestenbaum was involved in the expansion by certain of Marco International’s affiliates into China and the former Soviet Union. He also established affiliated private equity businesses in 1999 which were involved in sourcing and concluding a number of private equity transactions, including ones relating to McCook Metals, Scottsboro Aluminum and Globe Metallurgical, Inc. From 1997 until June 2008, Mr. Kestenbaum was also the Vice President of Marco Hi-Tech JV LLC, a nutritional ingredient supplier to the nutritional supplement industry. Mr. Kestenbaum serves as a member of the Board of Directors of Wolverine Tube, Inc., a provider of copper and copper alloy tube, fabricated products and metal joining products. Mr. Kestenbaum began his career in metals with Glencore, Inc. and Philipp Brothers in New York City. He received his B.A. in Economics cum laude from Yeshiva University, New York.
Jeff Bradley has served as our Chief Executive Officer since May 2008 and our Chief Operating Officer since August 2010. From June 2005 until February 2008, Mr. Bradley served as Chairman, Chief Executive Officer and Director of Claymont Steel Holdings, Inc., a company specializing in the manufacture and sale of custom-order steel plate in the United States and Canada. Mr. Bradley was not employed after his February 2008 departure from Claymont Steel until he joined us in May 2008. Prior to joining Claymont Steel, from September 2004 to June 2005, Mr. Bradley served as Vice President of strategic planning for Dietrich Industries, a construction products subsidiary of Worthington Industries. From September 2000 to August 2004, Mr. Bradley served as a vice president and general manager for Worthington Steel, a diversified metal processing company. Mr. Bradley holds a B.S. in Business Administration from Loyola College in Baltimore, Maryland.
Malcolm Appelbaum joined our company as Chief Financial Officer in September 2008. Prior to that, from 2000 until September 2008, Mr. Appelbaum served as President of Appletree Advisors, Inc., a financial consulting and advisory firm he founded to serve the portfolio companies of private equity firms and senior and mezzanine lenders. While at Appletree, he served as Interim-Chief Financial Officer for several underperforming companies and assisted others as an outside consultant. Between 1992 and 2000, Mr. Appelbaum was a principal at Wand Partners Inc., a private equity investor. At Wand he was the financial officer responsible for the firm and worked extensively with portfolio companies and developed an investment practice closing several platform and add-on acquisitions. Prior to joining Wand Partners, Mr. Appelbaum was an associate at M&T Bank, a financial analyst at Goldman Sachs and a senior consultant and senior accountant at Deloitte & Touche. Mr. Appelbaum received a B.S. from Brooklyn College and an M.B.A. from Columbia University.
Stephen Lebowitz has served as our Chief Legal Officer since July 2008. Prior to that, from 2001 to 2008, Mr. Lebowitz was in-house counsel at BP p.l.c., one of the world’s largest petroleum companies, to its jet fuel, marine and solar energy divisions. Prior to joining BP, Mr. Lebowitz was in private practice, both as a partner at the law firm Ridberg, Press and Aaronson, and as an associate with the law firm Kaye Scholer LLP. Mr. Lebowitz holds a B.A. from the University of Vermont, received a law degree from George Washington University, and while overseas as a Fulbright Scholar, obtained an L.L.M. in European law.
Item 11. Executive Compensation
The information required by this Item is hereby incorporated herein by reference to the Proxy Statement.
Item 12. Security Ownership of Certain Beneficial Owners and Managers and Related Stockholder Matters
The information required by this Item is hereby incorporated herein by reference to the Proxy Statement.
Item 13. Certain Relationships and Related Transactions and Director Independence
The information required by this Item is hereby incorporated herein by reference to the Proxy Statement.
Item 14. Principal Accountant Fees and Services
33
PART IV
|
Exhibits and Financial Statement Schedules
|
(a) The following documents are filed as part of this Annual Report on Form 10-K:
|
(1)
|
Financial Statements
|
| Page | ||||
|
Reports of Independent Registered Public Accounting Firm
|
|
38
|
||
|
Consolidated Balance Sheets at June 30, 2011 and 2010
|
40
|
|||
|
Consolidated Statements of Operations for the years ended June 30, 2011, 2010, and 2009
|
41
|
|||
|
Consolidated Statements of Changes in Stockholders’ Equity for the years ended June 30, 2011, 2010, and 2009
|
42
|
|||
|
Consolidated Statements of Cash Flows for the years ended June 30, 2011, 2010, and 2009
|
43
|
|||
|
Notes to Consolidated Financial Statements
|
44
|
|||
|
(2)
|
Financial Statement Schedules
|
Not applicable.
|
(3)
|
Exhibits
|
The following exhibits are filed with this Annual Report or incorporated by reference:
| Exhibit | |||
| Number | Description of Document | ||
|
2
|
.1
|
Purchase Agreement, dated as of November 5, 2009, by and between Dow Corning Corporation and GSM (5) | |
|
2
|
.2
|
Purchase and Sale Agreement dated as of March 26, 2010, by and among Globe Metals Enterprises, Inc., Core Metals Group Holdings LLC and each of the Sellers named therein (6) | |
|
2
|
.3
|
Membership Interest Purchase Agreement dated May 27, 2011 by and among NGPC Asset Holdings II, LP,NGP Capital Resources Company and Globe BG, LLC relating to Alden Resources Inc. (7) | |
|
2
|
.4
|
Membership Interest Purchase Agreement dated May 27, 2011 by and among NGPC Asset Holdings II, LP,NGP Capital Resources Company and Globe BG, LLC relating to Gatliff Services, Inc. (7) | |
|
2
|
.5
|
Purchase Agreement dated May 27, 2011 by and among NGP Capital Resources Company, Globe BG, LLC and Globe Specialty Metals, Inc. regarding The Overriding Royalty Interests (7) | |
| Articles of Incorporation and Bylaws | |||
|
3
|
.1
|
Amended and Restated Certificate of Incorporation (1) | |
|
3
|
.2
|
Certificate of Amendment to the Amended and Restated Certificate of Incorporation (1) | |
|
3
|
.3
|
Amended and Restated Bylaws (2) | |
| Instruments Defining the Rights of Security Holders, Including Indentures | |||
|
4
|
.1
|
Third Amended and Restated Credit Agreement dated as of March 30, 2011, by and among GMI, Tennessee Alloys Company LLC, and GSM Sales, Inc., as borrowers, Alabama Sand and Gravel, Inc. and Laurel Ford Resources, Inc., as subsidiary guarantors, GSM, as Parent, the lender parties thereto, and Societe Generale, as Administrative Agent, Issuing Bank, Swingline Lender and Collateral Agent and SG Americas Securities LLC, as Sole Arranger (3) | |
| We are a party to other instruments defining the rights of holders of long-term debt. No such instrument authorizes an amount of securities in excess of 10 percent of the total assets of the company and its subsidiaries on a consolidated basis. We agree to furnish a copy of each such instrument to the Commission on request. | |||
| Material Contracts | |||
|
10
|
.1
|
Amended and Restated Limited Liability Company Agreement of WVA Manufacturing, LLC, dated as of November 5, 2009, by and among WVA Manufacturing, LLC, GSM, GSM Alloys I, Inc., GSM Alloys II, Inc., Dow Corning Enterprises, Inc. and Dow Corning Corporation. (5) | |
|
10
|
.2
|
Output and Supply Agreement, dated as of November 5, 2009, by and among WVA Manufacturing, LLC, Dow Corning Corporation, Globe Metallurgical Inc., and GSM. (5) | |
| Management Contracts and Compensatory Plans | |||
|
10
|
.3
|
2006 Employee, Director and Consultant Stock Option Plan (1) | |
|
10
|
.4
|
Amendments to 2006 Employee, Director and Consultant Stock Option Plan (8) | |
|
10
|
.5
|
2010 Annual Executive Bonus Plan (9) | |
|
10
|
.6
|
Chief Financial Officer and Chief Legal Officer Annual Bonus Plan (10) | |
|
10
|
.7
|
Framework for the 2011 Annual Executive Long Term Incentive Plan (11) | |
|
10
|
.8
|
Employment Agreement, dated January 27, 2011, between GSM and Alan Kestenbaum (11) | |
|
10
|
.9
|
Employment Agreement, dated May 26, 2008, between GSM and Jeff Bradley (1) | |
|
10
|
.10
|
Amendment to Employment Agreement, dated October 27, 2010, between GSM and Jeff Bradley (8) | |
|
10
|
.11
|
Employment Agreement, dated July 5, 2011, between GSM and Jeff Bradley † | |
|
10
|
.12
|
Employment Agreement, dated September 21, 2008, between GSM and Malcolm Appelbaum (4) | |
|
10
|
.13
|
Employment Agreement, dated June 20, 2008, between GSM and Stephen Lebowitz (1) | |
|
10
|
.14
|
Amendment to Employment Agreement, dated October 27, 2010, between GSM and Stephen Lebowitz (8) | |
|
|
|||
|
21
|
.1
|
Subsidiaries (9) | |
|
31
|
.1
|
Certification of Principal Executive Officer Pursuant to Section 302 of the Sarbanes-Oxley Act of 2002 † | |
|
31
|
.2
|
Certification of the Principal Financial Officer Pursuant to Section 302 of the Sarbanes-Oxley Act of 2002 † | |
|
32
|
.1
|
Certification of the Principal Executive Officers and Principal Financial Officer Pursuant to 18 U.S.C. 1350, as adopted Pursuant to Section 906 of the Sarbanes-Oxley Act of 2002 † | |
34
________________
|
†
|
Filed herewith.
|
|
1
|
Incorporated by reference to the exhibit with the same designation filed with the Company’s registration statement on Form S-1 (Registration No. 333-152513) filed on July 25, 2008.
|
|
2
|
Incorporated by reference to the exhibit with the same designation filed with Amendment No. 1 to the Company’s registration statement on Form S-1 (Registration No. 333-152513) filed on November 4, 2008.
|
|
3
|
Incorporated by reference to exhibit 10.1 filed with the Company’s Form 8-K filed on April 5, 2011.
|
|
4
|
Incorporated by reference to the exhibit with the same designation filed with Amendment No. 3 to the Company’s registration statement Form S-1 (Registration Statement No. 333-152513) filed on July 16, 2009.
|
|
5
|
Incorporated by reference to the exhibit with the same designation filed with the Company’s Form 8-K filed on November 12, 2009.
|
|
6
|
Incorporated by reference to the exhibit with the same designation filed with the Company’s Form 8-K filed on April 1, 2010.
|
|
7
|
Incorporated by reference to exhibits to the Company’s Form 8-K filed on June 3, 2011.
|
|
8
|
Incorporated by reference to exhibits to the Company’s Form 10-Q filed on February 11, 2011.
|
|
9
|
Incorporated by reference to exhibit to the Company’s Form 10-K filed on September 28, 2010.
|
|
10
|
Incorporated by reference to exhibit to the Company’s Form 10-Q filed on November 12, 2010.
|
|
11
|
Incorporated by reference to exhibits to the Company’s Form 10-Q filed on May 12, 2011.
|
35
Pursuant to the requirements of Section 13 or 15(d) of the Securities Exchange Act of 1934, the Registrant has duly caused this report to be signed on its behalf by the undersigned, thereunto duly authorized.
|
Globe Specialty Metals, Inc. (Registrant)
|
|||
|
By:
|
/s/ Malcolm Appelbaum
|
||
|
Malcolm Appelbaum
Chief Financial Officer
|
|||
August 26, 2011
Pursuant to the requirements of the Securities Exchange Act of 1934, this report has been signed below by the following persons on behalf of the Registrant and in the capacities and on the dates indicated.
|
Signature
|
Title
|
Date
|
||||
|
/s/ Alan Kestenbaum
|
Executive Chairman and Director
|
August 26, 2011
|
||||
|
Alan Kestenbaum
|
||||||
|
/s/ Jeff Bradley
|
Chief Executive Officer, Chief Operating Officer and Principal Executive Officer
|
August 26, 2011
|
||||
|
Jeff Bradley
|
||||||
|
/s/ Malcolm Appelbaum
|
Chief Financial Officer, Principal Financial Officer and Principal Accounting Officer
|
August 26, 2011
|
||||
|
Malcolm Appelbaum
|
|
|||||
|
/s/ Stuart E. Eizenstat
|
Director
|
August 26, 2011
|
||||
|
Stuart E. Eizenstat
|
||||||
|
/s/ Franklin Lavin
|
Director
|
August 26, 2011
|
||||
|
Franklin Lavin
|
||||||
|
/s/ Donald Barger
|
Director
|
August 26, 2011
|
||||
|
Donald Barger
|
||||||
|
/s/ Thomas Danjczek
|
Director
|
August 26, 2011
|
||||
|
Thomas Danjczek
|
||||||
36
INDEX TO CONSOLIDATED FINANCIAL STATEMENTS
GLOBE SPECIALTY METALS, INC.
|
Page
|
||||
|
Reports of Independent Registered Public Accounting Firm
|
38
|
|||
|
Consolidated Balance Sheets — June 30, 2011 and 2010
|
40
|
|||
|
Consolidated Statements of Operations — Years ended June 30, 2011, 2010, and 2009
|
41
|
|||
|
Consolidated Statements of Changes in Stockholders’ Equity — Years ended June 30, 2011, 2010, and 2009
|
42
|
|||
|
Consolidated Statements of Cash Flows — Years ended June 30, 2011, 2010, and 2009
|
43
|
|||
|
Notes to Consolidated Financial Statements
|
44
|
|||
37
Report of Independent Registered Public Accounting Firm
The Board of Directors and Stockholders
Globe Specialty Metals, Inc.:
We have audited the accompanying consolidated balance sheets of Globe Specialty Metals, Inc. and subsidiary companies (the Company) as of June 30, 2011 and 2010, and the related consolidated statements of operations, changes in stockholders’ equity, and cash flows for each of the years in the three-year period ended June 30, 2011. These consolidated financial statements are the responsibility of the Company’s management. Our responsibility is to express an opinion on these consolidated financial statements based on our audits.
We conducted our audits in accordance with the Standards of the Public Company Accounting Oversight Board (United States). Those standards require that we plan and perform the audit to obtain reasonable assurance about whether the financial statements are free of material misstatement. An audit includes examining, on a test basis, evidence supporting the amounts and disclosures in the financial statements. An audit also includes assessing the accounting principles used and significant estimates made by management, as well as evaluating the overall financial statement presentation. We believe that our audits provide a reasonable basis for our opinion.
In our opinion, the consolidated financial statements referred to above present fairly, in all material respects, the financial position of Globe Specialty Metals, Inc. and subsidiary companies as of June 30, 2011 and 2010, and the results of their operations and their cash flows for each of the years in the three-year period ended June 30, 2011, in conformity with U.S. generally accepted accounting principles.
We also have audited, in accordance with the standards of the Public Company Accounting Oversight Board (United States), Globe Specialty Metals, Inc. and subsidiary companies’ internal control over financial reporting as of June 30, 2011, based on criteria established in Internal Control - Integrated Framework issued by the Committee of Sponsoring Organizations of the Treadway Commission (COSO), and our report dated August 26, 2011 expressed an unqualified opinion on the effectiveness of the Company’s internal control over financial reporting.
/s/ KPMG LLP
New York, New York
August 26, 201138
Report of Independent Registered Public Accounting Firm
The Board of Directors and Stockholders
Globe Specialty Metals, Inc.:
We have audited Globe Specialty Metals, Inc. and subsidiary companies' (the Company) internal control over financial reporting as of June 30, 2011, based on criteria established in Internal Control – Integrated Framework issued by the Committee of Sponsoring Organizations of the Treadway Commission (COSO). Globe Specialty Metals, Inc. and subsidiary companies’ management is responsible for maintaining effective internal control over financial reporting and for its assessment of the effectiveness of internal control over financial reporting, included in the accompanying Management’s Report on Internal Control over Financial Reporting under Item 9A. Our responsibility is to express an opinion on the Company’s internal control over financial reporting based on our audit.
We conducted our audit in accordance with the standards of the Public Company Accounting Oversight Board (United States). Those standards require that we plan and perform the audit to obtain reasonable assurance about whether effective internal control over financial reporting was maintained in all material respects. Our audit included obtaining an understanding of internal control over financial reporting, assessing the risk that a material weakness exists, and testing and evaluating the design and operating effectiveness of internal control based on the assessed risk. Our audit also included performing such other procedures as we considered necessary in the circumstances. We believe that our audit provides a reasonable basis for our opinion.
A company’s internal control over financial reporting is a process designed to provide reasonable assurance regarding the reliability of financial reporting and the preparation of financial statements for external purposes in accordance with generally accepted accounting principles. A company’s internal control over financial reporting includes those policies and procedures that (1) pertain to the maintenance of records that, in reasonable detail, accurately and fairly reflect the transactions and dispositions of the assets of the company; (2) provide reasonable assurance that transactions are recorded as necessary to permit preparation of financial statements in accordance with generally accepted accounting principles, and that receipts and expenditures of the company are being made only in accordance with authorizations of management and directors of the company; and (3) provide reasonable assurance regarding prevention or timely detection of unauthorized acquisition, use, or disposition of the company’s assets that could have a material effect on the financial statements.
Because of its inherent limitations, internal control over financial reporting may not prevent or detect misstatements. Also, projections of any evaluation of effectiveness to future periods are subject to the risk that controls may become inadequate because of changes in conditions, or that the degree of compliance with the policies or procedures may deteriorate.
In our opinion, Globe Specialty Metals, Inc. and subsidiary companies maintained, in all material respects, effective internal control over financial reporting as of June 30, 2011, based on criteria established in Internal Control – Integrated Framework issued by the Committee of Sponsoring Organizations of the Treadway Commission.
We also have audited, in accordance with the standards of the Public Company Accounting Oversight Board (United States), the consolidated balance sheets of Globe Specialty Metals, Inc. and subsidiary companies as of June 30, 2011 and 2010, and the related consolidated statements of operations, changes in stockholders’ equity, and cash flows for each of the years in the three-year period ended June 30, 2011, and our report dated August 26, 2011 expressed an unqualified opinion on those consolidated financial statements.
/s/ KPMG LLP
New York, New York
August 26, 2011
39
|
GLOBE SPECIALTY METALS, INC. AND SUBSIDIARY COMPANIES
|
|||||||
|
Consolidated Balance Sheets
|
|||||||
|
June 30, 2011 and 2010
|
|||||||
|
(In thousands, except share and per share amounts)
|
|||||||
|
2011
|
2010
|
||||||
|
ASSETS
|
|||||||
|
Current assets:
|
|||||||
|
Cash and cash equivalents
|
$
|
166,208
|
157,029
|
||||
|
Accounts receivable, net of allowance for doubtful accounts of $715
|
|||||||
|
and $997 at June 30, 2011 and 2010, respectively
|
60,871
|
55,907
|
|||||
|
Inventories
|
109,292
|
87,163
|
|||||
|
Prepaid expenses and other current assets
|
27,876
|
23,809
|
|||||
|
Total current assets
|
364,247
|
323,908
|
|||||
|
Property, plant, and equipment, net of accumulated depreciation and amortization
|
229,977
|
219,267
|
|||||
|
Goodwill
|
53,503
|
52,025
|
|||||
|
Other intangible assets
|
477
|
477
|
|||||
|
Investments in unconsolidated affiliates
|
8,640
|
8,185
|
|||||
|
Deferred tax assets
|
217
|
71
|
|||||
|
Other assets
|
21,208
|
3,212
|
|||||
|
Total assets
|
$
|
678,269
|
607,145
|
||||
| LIABILITIES AND STOCKHOLDERS’ EQUITY | |||||||
|
Current liabilities:
|
|||||||
|
Accounts payable
|
$
|
39,947
|
47,298
|
||||
|
Current portion of long-term debt
|
-
|
10,092
|
|||||
|
Short-term debt
|
1,094
|
8,067
|
|||||
|
Revolving credit agreements
|
12,000
|
-
|
|||||
|
Accrued expenses and other current liabilities
|
34,475
|
35,832
|
|||||
|
Total current liabilities
|
87,516
|
101,289
|
|||||
|
Long-term liabilities:
|
|||||||
|
Revolving credit agreements
|
34,989
|
16,000
|
|||||
|
Long-term debt
|
-
|
6,920
|
|||||
|
Deferred tax liabilities
|
23,264
|
6,645
|
|||||
|
Other long-term liabilities
|
17,224
|
17,462
|
|||||
|
Total liabilities
|
162,993
|
148,316
|
|||||
|
Commitments and contingencies (note 18)
|
|||||||
|
Stockholders’ equity:
|
|||||||
|
Common stock, $0.0001 par value. Authorized, 150,000,000 shares; issued, 75,289,614
|
|||||||
|
and 74,421,826 shares at June 30, 2011 and 2010, respectively
|
8
|
7
|
|||||
|
Additional paid-in capital
|
399,900
|
390,354
|
|||||
|
Retained earnings
|
80,300
|
38,761
|
|||||
|
Accumulated other comprehensive income (loss):
|
|||||||
|
Foreign currency translation adjustment
|
937
|
142
|
|||||
|
Pension liability adjustment, net of tax
|
(3,933)
|
(4,580)
|
|||||
|
Unrealized gain on available for sale securities, net of tax
|
1
|
-
|
|||||
|
Total accumulated other comprehensive loss
|
(2,995)
|
(4,438)
|
|||||
|
Treasury stock at cost, 282,437 and 1,000 shares at
|
|
|
|||||
|
June 30, 2011 and 2010, respectively
|
(4) | (4) | |||||
|
Total Globe Specialty Metals, Inc. stockholders’ equity
|
477,209
|
424,680
|
|||||
|
Noncontrolling interest
|
38,067
|
34,149
|
|||||
|
Total stockholders’ equity
|
515,276
|
458,829
|
|||||
|
Total liabilities and stockholders’ equity
|
$
|
678,269
|
607,145
|
||||
|
See accompanying notes to consolidated financial statements.
|
|||||||
40
|
GLOBE SPECIALTY METALS, INC. AND SUBSIDIARY COMPANIES
|
|||||||||||
|
Consolidated Statements of Operations
|
|||||||||||
|
Years ended June 30, 2011, 2010, and 2009
|
|||||||||||
|
(In thousands, except per share amounts)
|
|||||||||||
|
2011
|
2010
|
2009
|
|||||||||
|
Net sales
|
$
|
641,863
|
472,658
|
426,291
|
|||||||
|
Cost of goods sold
|
488,018
|
390,093
|
330,036
|
||||||||
|
Selling, general, and administrative expenses
|
54,739
|
47,875
|
56,322
|
||||||||
|
Research and development
|
87
|
200
|
1,394
|
||||||||
|
Restructuring charges
|
-
|
(81)
|
1,711
|
||||||||
|
Loss (gain) on sale of business
|
4,249
|
(19,715)
|
-
|
||||||||
|
Goodwill and intangible asset impairment
|
-
|
-
|
69,704
|
||||||||
|
Operating income (loss)
|
94,770
|
54,286
|
(32,876)
|
||||||||
|
Other income (expense):
|
|||||||||||
|
Interest income
|
214
|
318
|
729
|
||||||||
|
Interest expense, net of capitalized interest
|
(3,198)
|
(4,372)
|
(6,947)
|
||||||||
|
Foreign exchange (loss) gain
|
(390)
|
3,811
|
2,202
|
||||||||
|
Other income
|
1,318
|
764
|
3,117
|
||||||||
|
Income (loss) before provision for income taxes
|
92,714
|
54,807
|
(33,775)
|
||||||||
|
Provision for income taxes
|
35,988
|
20,539
|
11,609
|
||||||||
|
Net income (loss)
|
56,726
|
34,268
|
(45,384)
|
||||||||
|
(Income) losses attributable to noncontrolling interest, net of tax
|
(3,918)
|
(167)
|
3,403
|
||||||||
|
Net income (loss) attributable to Globe Specialty Metals, Inc.
|
$
|
52,808
|
34,101
|
(41,981)
|
|||||||
|
Weighted average shares outstanding:
|
|||||||||||
|
Basic
|
74,925
|
73,512
|
64,362
|
||||||||
|
Diluted
|
76,624
|
74,770
|
64,362
|
||||||||
|
Earnings (loss) per common share:
|
|||||||||||
|
Basic
|
$
|
0.70
|
0.46
|
(0.65)
|
|||||||
|
Diluted
|
0.69
|
0.46
|
(0.65)
|
||||||||
|
Cash dividends declared per common share
|
0.15
|
—
|
—
|
||||||||
See accompanying notes to consolidated financial statements.
41
| GLOBE SPECIALTY METALS, INC. AND SUBSIDIARY COMPANIES | |||||||||||||||||||||||
|
|
|||||||||||||||||||||||
|
Consolidated Statements of Changes in Stockholders’ Equity
|
|||||||||||||||||||||||
|
Years ended June 30, 2011, 2010, and 2009
|
|||||||||||||||||||||||
| (In thousands) | |||||||||||||||||||||||
|
Globe Specialty Metals, Inc. Stockholders’ Equity
|
|||||||||||||||||||||||
|
Accumulated
|
|||||||||||||||||||||||
|
Additional
|
Other
|
Treasury
|
Total
|
||||||||||||||||||||
| Common Stock |
Paid-In
|
Retained
|
Comprehensive
|
Stock
|
Noncontrolling
|
Comprehensive
|
Stockholders’
|
||||||||||||||||
|
Shares
|
Amount
|
Capital
|
Earnings
|
Income (Loss)
|
at Cost
|
Interest
|
Income (Loss)
|
Equity
|
|||||||||||||||
|
Balance at June 30, 2008
|
63,051
|
$
|
6
|
296,137
|
46,641
|
(503)
|
—
|
3,956
|
346,237
|
||||||||||||||
|
Warrants exercised
|
166
|
—
|
833
|
—
|
—
|
—
|
—
|
833
|
|||||||||||||||
|
UPOs exercised
|
243
|
—
|
—
|
—
|
—
|
—
|
—
|
—
|
|||||||||||||||
|
Warrant conversions
|
3,484
|
1
|
(1)
|
—
|
—
|
—
|
—
|
—
|
|||||||||||||||
|
Share-based compensation
|
—
|
—
|
6,395
|
—
|
—
|
—
|
—
|
6,395
|
|||||||||||||||
|
Treasury stock acquired
|
—
|
—
|
—
|
—
|
—
|
(4)
|
—
|
(4)
|
|||||||||||||||
|
Noncontrolling interest from business combinations
|
|||||||||||||||||||||||
|
and subsidiary share issuances
|
— | — | — | — | — | — |
6,416
|
6,416
|
|||||||||||||||
|
Comprehensive income (loss):
|
|||||||||||||||||||||||
|
Foreign currency translation adjustment
|
—
|
—
|
—
|
—
|
7
|
—
|
—
|
7
|
7
|
||||||||||||||
|
Pension liability adjustment (net of income
|
|||||||||||||||||||||||
|
tax benefit of $1,917)
|
—
|
—
|
—
|
—
|
(3,128)
|
—
|
—
|
(3,128)
|
(3,128)
|
||||||||||||||
|
Unrealized loss on available for sale securities
|
|||||||||||||||||||||||
|
(net of income tax benefit of $10)
|
—
|
—
|
—
|
—
|
(20)
|
—
|
—
|
(20)
|
(20)
|
||||||||||||||
| Net loss |
—
|
—
|
—
|
(41,981)
|
—
|
—
|
(3,403)
|
(45,384)
|
(45,384)
|
||||||||||||||
|
Total comprehensive loss
|
(48,525)
|
(48,525)
|
|||||||||||||||||||||
|
Balance at June 30, 2009
|
66,944
|
7
|
303,364
|
4,660
|
(3,644)
|
(4)
|
6,969
|
(48,525) |
311,352
|
||||||||||||||
|
Warrants exercised
|
257
|
—
|
1,287
|
—
|
—
|
—
|
—
|
1,287
|
|||||||||||||||
|
UPOs exercised
|
1,519
|
—
|
210
|
—
|
—
|
—
|
—
|
210
|
|||||||||||||||
|
Share-based compensation
|
3
|
—
|
5,712
|
—
|
—
|
—
|
—
|
5,712
|
|||||||||||||||
|
Stock option exercises
|
99
|
—
|
616
|
—
|
—
|
—
|
—
|
616
|
|||||||||||||||
|
Stock issuance
|
5,600
|
—
|
34,768
|
—
|
—
|
—
|
—
|
34,768
|
|||||||||||||||
|
Sale of noncontrolling interest
|
—
|
—
|
44,397
|
—
|
—
|
—
|
27,012
|
71,409
|
|||||||||||||||
|
Realized gain on available-for-sale securities
|
—
|
—
|
—
|
—
|
(10)
|
—
|
—
|
(10)
|
|||||||||||||||
|
Comprehensive (loss) income:
|
|||||||||||||||||||||||
|
Foreign currency translation adjustment
|
—
|
—
|
—
|
—
|
64
|
—
|
1
|
65
|
65
|
||||||||||||||
|
Pension liability adjustment (net of income
|
|||||||||||||||||||||||
|
tax benefit of $551)
|
—
|
—
|
—
|
—
|
(851)
|
—
|
—
|
(851)
|
(851)
|
||||||||||||||
|
Unrealized gain on available-for-sale securities
|
|||||||||||||||||||||||
|
(net of provision for income taxes of $1)
|
—
|
—
|
—
|
—
|
3
|
—
|
—
|
3
|
3
|
||||||||||||||
| Net income |
—
|
—
|
—
|
34,101
|
—
|
—
|
167
|
34,268
|
34,268
|
||||||||||||||
|
Total comprehensive income
|
33,485
|
33,485
|
|||||||||||||||||||||
|
Balance at June 30, 2010
|
74,422
|
7
|
390,354
|
38,761
|
(4,438)
|
(4)
|
34,149
|
33,485
|
458,829
|
||||||||||||||
|
Share-based compensation
|
4
|
—
|
4,332
|
—
|
—
|
—
|
—
|
4,332
|
|||||||||||||||
|
Stock option exercises
|
864
|
1
|
5,214
|
—
|
—
|
—
|
—
|
5,215
|
|||||||||||||||
|
Cash dividend declared
|
—
|
—
|
—
|
(11,269)
|
—
|
—
|
—
|
(11,269)
|
|||||||||||||||
|
Comprehensive (loss) income:
|
|||||||||||||||||||||||
|
Foreign currency translation adjustment
|
—
|
—
|
—
|
—
|
795
|
—
|
—
|
795
|
795
|
||||||||||||||
|
Pension liability adjustment (net of income
|
|||||||||||||||||||||||
|
tax expense of $419)
|
—
|
—
|
—
|
—
|
647
|
—
|
—
|
647
|
647
|
||||||||||||||
|
Unrealized gain on available-for-sale securities
|
|||||||||||||||||||||||
|
(net of provision for income taxes of $0)
|
—
|
—
|
—
|
—
|
1
|
—
|
—
|
1
|
1
|
||||||||||||||
| Net income |
52,808
|
—
|
—
|
3,918
|
56,726
|
56,726
|
|||||||||||||||||
|
Total comprehensive income
|
58,169
|
58,169
|
|||||||||||||||||||||
|
Balance at June 30, 2011
|
75,290
|
$
|
8
|
399,900
|
80,300
|
(2,995)
|
(4)
|
38,067
|
58,169
|
515,276
|
|||||||||||||
|
See accompanying notes to consolidated financial statements.
|
|||||||||||||||||||||||
42
|
GLOBE SPECIALTY METALS, INC. AND SUBSIDIARY COMPANIES
|
||||||||||||
|
Consolidated Statements of Cash Flows
|
||||||||||||
|
Years ended June 30, 2011, 2010, and 2009
|
||||||||||||
|
(In thousands)
|
||||||||||||
|
2011
|
2010
|
2009
|
||||||||||
|
Cash flows from operating activities:
|
||||||||||||
| Net income (loss) |
$
|
56,726
|
34,268
|
(45,384)
|
||||||||
|
Adjustments to reconcile net income (loss) to net cash (used in) provided by operating activities:
|
||||||||||||
|
Depreciation and amortization
|
25,055
|
20,672
|
19,807
|
|||||||||
|
Share-based compensation
|
4,332
|
5,712
|
6,395
|
|||||||||
|
Loss (gain) on sale of business
|
4,249
|
(19,715)
|
-
|
|||||||||
|
Goodwill and intangible asset impairment
|
-
|
-
|
69,704
|
|||||||||
|
Deferred taxes
|
13,538
|
(8,123)
|
4,735
|
|||||||||
|
Changes in operating assets and liabilities:
|
||||||||||||
|
Accounts receivable, net
|
(4,664)
|
(29,029)
|
29,449
|
|||||||||
|
Inventories
|
(25,355)
|
(16,326)
|
(6,463)
|
|||||||||
|
Prepaid expenses and other current assets
|
(1,649)
|
6,984
|
(6,889)
|
|||||||||
|
Accounts payable
|
(7,833)
|
28,290
|
(20,499)
|
|||||||||
|
Accrued expenses and other current liabilities
|
(6,179)
|
(13,438)
|
18,487
|
|||||||||
| Other |
2,968
|
(28,550)
|
(5,328)
|
|||||||||
|
Net cash provided by (used in) operating activities
|
61,188
|
(19,255)
|
64,014
|
|||||||||
|
Cash flows from investing activities:
|
||||||||||||
| Capital expenditures |
(35,039)
|
(22,901)
|
(51,437)
|
|||||||||
|
Sale of businesses, net of cash disposed of $0, $17,132, and $0 during the
|
||||||||||||
|
years ended June 30, 2011, 2010, and 2009, respectively
|
2,500
|
60,559
|
-
|
|||||||||
|
Acquisition of businesses, net of cash acquired of $0, $1,873, and $0 during the
|
||||||||||||
|
years ended June 30, 2011, 2010, and 2009, respectively
|
-
|
(53,084)
|
(74)
|
|||||||||
|
Working capital adjustments from acquisition of business, net
|
(2,038)
|
-
|
-
|
|||||||||
|
Held-to-maturity treasury securities
|
-
|
-
|
2,987
|
|||||||||
|
Other investing activities
|
(16,935)
|
(733)
|
339
|
|||||||||
|
Net cash used in investing activities
|
(51,512)
|
(16,159)
|
(48,185)
|
|||||||||
|
Cash flows from financing activities:
|
||||||||||||
|
Net payments of long-term debt
|
(17,012)
|
(21,917)
|
(16,163)
|
|||||||||
|
Net (payments) borrowings of short-term debt
|
(6,973)
|
1,378
|
(11,878)
|
|||||||||
|
Net borrowings on revolving credit agreements
|
30,989
|
16,000
|
-
|
|||||||||
| Dividend payment |
(11,269)
|
-
|
-
|
|||||||||
|
Proceeds from stock option exercises
|
5,215
|
616
|
-
|
|||||||||
|
Proceeds from warrants exercised
|
-
|
1,287
|
833
|
|||||||||
|
Proceeds from UPOs exercised
|
-
|
210
|
-
|
|||||||||
|
Sale of noncontrolling interest
|
-
|
97,917
|
-
|
|||||||||
|
Sale of common stock
|
-
|
36,456
|
-
|
|||||||||
|
Solsil, Inc. common share issuance
|
-
|
-
|
1,570
|
|||||||||
|
Other financing activities
|
(869)
|
(1,387)
|
(2,316)
|
|||||||||
|
Net cash provided by (used in) financing activities
|
81
|
130,560
|
(27,954)
|
|||||||||
|
Effect of exchange rate changes on cash and cash equivalents
|
(578)
|
7
|
7
|
|||||||||
|
Net increase (decrease) in cash and cash equivalents
|
9,179
|
95,153
|
(12,118)
|
|||||||||
|
Cash and cash equivalents at beginning of year
|
157,029
|
61,876
|
73,994
|
|||||||||
|
Cash and cash equivalents at end of year
|
$
|
166,208
|
157,029
|
61,876
|
||||||||
|
Supplemental disclosures of cash flow information:
|
||||||||||||
|
Cash paid for interest, net of capitalized interest
|
$
|
2,533
|
2,494
|
5,964
|
||||||||
|
Cash paid for income taxes, net of refunds totaling $586, $2,729 and $0 during the
|
||||||||||||
|
years ended June 30, 2011, 2010, and 2009, respectively
|
19,819
|
51,709
|
10,785
|
|||||||||
See accompanying notes to consolidated financial statements.
43
GLOBE SPECIALTY METALS, INC. AND SUBSIDIARY COMPANIES
June 30, 2011, 2010, and 2009
(Dollars in thousands, except per share data)
|
(1)
|
Organization and Business Operations
|
Globe Specialty Metals, Inc. and subsidiary companies (GSM, the Company, we, or our) is among the world’s largest producers of silicon metal and silicon-based alloys, important ingredients in a variety of industrial and consumer products. The Company’s customers include major silicone chemical, aluminum and steel manufacturers, auto companies and their suppliers, ductile iron foundries, manufacturers of photovoltaic solar cells and computer chips, and concrete producers.
GSM was incorporated in Delaware on December 23, 2004, under the name International Metal Enterprises, Inc., to serve as a vehicle for the acquisition of operating companies in the metals and mining industry.
On November 13, 2006, the Company acquired 100% of the outstanding stock of Globe Metallurgical, Inc. (GMI), a manufacturer of silicon metal and silicon-based alloys. GMI owns and operates plants in Beverly, Ohio, Alloy, West Virginia, Niagara Falls, New York, and Selma, Alabama. GMI’s products are sold primarily to the silicone chemical, aluminum, metal casting, and solar cell industries, primarily in the United States, Canada, and Mexico. GMI also owns 50% of the outstanding stock of Norchem, Inc. (Norchem). Norchem manufactures and sells additives that enhance the durability of concrete, refractory material, and oil well conditioners. GMI sells silica fume (also known as microsilica), a by-product of its ferrosilicon metal and silicon metal production process, to Norchem, as well as other companies.
On November 20, 2006, the Company acquired 100% of the outstanding stock of Stein Ferroaleaciones S.A. (SFA), an Argentine manufacturer of silicon-based alloys, and SFA’s two affiliates, UltraCore Polska Sp.z.o.o. (UCP), a Polish manufacturer of cored wire alloys, and Ultra Core Corporation, a U.S.-based alloy distributor (collectively, Stein). SFA, incorporated in Argentina in 1974, is among Latin America’s leading producers of silicon-based alloys. Headquartered in Buenos Aires, Argentina, it operates a silicon-based alloy manufacturing plant in Mendoza province, Argentina and cored wire packing plants in San Luis province, Argentina and Police, Poland. Stein’s products are important ingredients in the manufacturing of steel, ductile iron, machine and auto parts, and pipe. SFA has been renamed Globe Metales S.A. (Globe Metales).
On January 31, 2007, the Company acquired 100% of the outstanding stock of Camargo Correa Metais S.A. (CCM), one of Brazil’s largest producers of silicon metal and silica fume. CCM was renamed Globe Metais Indústria e Comércio S.A. (Globe Metais). Globe Metais operated a manufacturing facility located in Breu Branco, Para, Brazil. It also operated quartzite mining and forest reserves operations in Para, Brazil. On November 5, 2009, the Company sold 100% of its interest in Globe Metais. The sale of the Company’s equity interest in Globe Metais was executed in connection with the sale of a 49% membership interest in WVA Manufacturing, LLC (WVA LLC), a newly formed entity by the Company, to Dow Corning Corporation (Dow Corning), the execution of a long-term supply agreement, and an amendment to an existing supply agreement between Dow Corning and the Company.
On February 29, 2008, the Company completed the acquisition of approximately 81% of Solsil, Inc. (Solsil). Solsil is continuing to develop its technology to produce upgraded metallurgical grade silicon through a proprietary metallurgical process for use in photovoltaic (solar) cells. Solsil remains focused on research and development and is not presently producing material for commercial sale.
On May 15, 2008, the Company entered into a business combination, which provided an ownership interest of approximately 58% of Ningxia Yonvey Coal Industrial Co., Ltd (Yonvey). Yonvey is a producer of carbon electrodes, an important input in the silicon metal production process. Prior to the business combination, Yonvey’s predecessor was one of the Company’s electrode suppliers, and Yonvey now principally supplies its electrodes to our subsidiaries. Yonvey’s operations are located in Chonggang Industrial Park, Shizuishan in the Ningxia Hui Autonomous Region of China. On November 28, 2008, the Company increased its interest by an additional 12%.
On April 1, 2010, the Company purchased all of the ownership interests in Core Metals Group Holdings LLC (Core Metals), a Delaware limited liability company. Core Metals is a leading producer, marketer, and distributor of ferroalloys and specialty materials for the North American steel and foundry industry. The acquisition was made to strengthen our growing ferrosilicon business and expand the line of products and services we offer to steel markets around the world. Core Metals is included in our GMI reportable segment.
See note 3 (Business Combinations, Investments, and Divestitures) for additional information regarding business combinations, investments, and divestitures.
|
(2)
|
Summary of Significant Accounting Policies
|
a. Basis of Presentation and Principles of Consolidation
The Company’s consolidated financial statements have been prepared in accordance with accounting principles generally accepted in the United States of America (U.S. GAAP). When the Company does not have a controlling interest in an entity, but exerts significant influence over the entity, the Company applies the equity method of accounting. For investments in which the Company does not have significant influence, the cost method of accounting is used.
The Company also evaluates the consolidation of entities under Financial Accounting Standards Board (FASB) Accounting Standards Codification Topic 810, Consolidation (ASC 810). ASC 810 requires management to evaluate whether an entity or interest is a variable interest entity and whether the Company is the primary beneficiary. Consolidation is required if both of these criteria are met. The Company does not have any variable interest entities requiring consolidation.
All intercompany balances and transactions have been eliminated in consolidation.
b. Use of Estimates
The preparation of financial statements in conformity with U.S. GAAP requires management to make estimates and assumptions that affect amounts reported in the consolidated financial statements and related notes. Significant estimates and assumptions in these consolidated financial statements include the valuation of inventories; the depreciable lives for property, plant, and equipment; estimates of fair value associated with accounting for business combinations; goodwill and long-lived asset impairment tests; income taxes and deferred tax valuation allowances; valuation of derivative instruments; the determination of the discount rate and the rate of return on plan assets for pension expense (benefit); and the determination of the fair value of share-based compensation, involving assumptions about forfeiture rates, stock volatility, discount rates, expected dividend yield, and expected time to exercise. Due to the inherent uncertainty involved in making estimates, actual results reported in future periods may be different from these estimates.
44
c. Revenue Recognition
Revenue is recognized in accordance with ASC Topic 605, Revenue Recognition (ASC 605), when a firm sales agreement is in place, delivery has occurred and title and risks of ownership have passed to the customer, the sales price is fixed or determinable, and collectability is reasonably assured. Shipping and other transportation costs charged to buyers are recorded in both net sales and cost of goods sold. Sales taxes collected from customers and remitted to governmental authorities are accounted for on a net basis and, therefore, are excluded from net sales. When the Company provides a combination of products and services to customers, the arrangement is evaluated under ASC Subtopic 605-25, Revenue Recognition — Multiple Element Arrangements (ASC 605.25). ASC 605.25 addresses certain aspects of accounting by a vendor for arrangements under which the vendor will perform multiple revenue-generating activities. If the Company cannot objectively determine the fair value of any undelivered elements under an arrangement, the Company defers revenue until all elements are delivered and services have been performed, or until fair value can objectively be determined for any remaining undelivered elements.
d. Foreign Currency Translation
The determination of the functional currency for the Company’s foreign subsidiaries is made based on appropriate economic factors, including the currency in which the subsidiary sells its products, the market in which the subsidiary operates, and the currency in which the subsidiary’s financing is denominated. Based on these factors, management has determined that the U.S. dollar is the functional currency for Globe Metales. The U.S. dollar was also the functional currency for Globe Metais prior to its divestiture. The functional currency for Yonvey is the Chinese renminbi. Yonvey’s assets and liabilities are translated using current exchange rates in effect at the balance sheet date and for income and expense accounts using average exchange rates. Resulting translation adjustments are reported as a separate component of stockholders’ equity. Translation gains and losses are recognized on transactions in currencies other than the subsidiary’s functional currency and included in the consolidated statement of operations for the period in which the exchange rates changed.
e. Cash and Cash Equivalents
Cash equivalents consist of highly liquid investments that are readily convertible into cash. Securities with contractual maturities of three months or less, when purchased, are cash equivalents. The carrying amount of these securities approximates fair value because of the short-term maturity of these instruments.
Refer to note 3 (Business Combinations, Investments, and Divestitures) and note 19 (Stockholders’ Equity) for supplemental disclosures of noncash investing and financing activities.
f. Inventories
Inventories are valued at the lower of cost or market value, which does not exceed net realizable value. Cost of inventories is determined either by the first-in, first-out method or by the average cost method. When circumstances indicate a potential recoverability issue, tests are performed to assess the market value, and as necessary, an inventory write-down is recorded for obsolete, slow moving, or defective inventory. Management estimates market and net realizable value based on current and expected future selling prices for our inventories, as well as the expected utilization of parts and supplies in our manufacturing process.
g. Property, Plant, and Equipment
Property, plant, and equipment are recorded at cost. Depreciation is calculated using the straight-line method based on the estimated useful lives of assets. The estimated useful lives of property, plant, and equipment are as follows:
|
Range of
|
||
|
Useful Lives
|
||
|
Asset type:
|
||
|
Land improvements and land use rights
|
20 to 36 years
|
|
|
Buildings
|
35 to 40 years
|
|
|
Manufacturing equipment
|
5 to 25 years
|
|
|
Furnaces
|
10 to 20 years
|
|
|
Other
|
2 to 5 years
|
Costs that do not extend the life of an asset, materially add to its value, or adapt the asset to a new or different use are considered repair and maintenance costs and expensed as incurred.
h. Business Combinations
When the Company acquires a business, the purchase price is allocated based on the fair value of tangible assets and identifiable intangible assets acquired, and liabilities assumed. Fair value is the price that would be received to sell an asset or paid to transfer a liability in an orderly transaction between market participants. Goodwill as of the acquisition date is measured as the residual of the excess of the consideration transferred, plus the fair value of any noncontrolling interest in the acquiree at the acquisition date, over the fair value of the identifiable net assets acquired. If the fair value of the net assets acquired exceeds the purchase price, the resulting bargain purchase is recognized as a gain in the statement of operations. Prior to the adoption of ASC Subtopic 805-10, Business Combinations (ASC 805-10), the resulting negative goodwill was allocated as a pro rata reduction of the values of acquired nonmonetary assets. The Company generally engages independent, third-party appraisal firms to assist in determining the fair value of assets acquired and liabilities assumed. Such a valuation requires management to make significant estimates, especially with respect to intangible assets. These estimates are based on historical experience and information obtained from the management of the acquired companies. These estimates are inherently uncertain. For all acquisitions, operating results are included in the consolidated statement of operations from the date of acquisition.
i. Goodwill and Other Intangible Assets
Goodwill as of the acquisition date is measured as the residual of the excess of the consideration transferred, plus the fair value of any noncontrolling interest in the acquiree at the acquisition date, over the fair value of the identifiable net assets acquired. In accordance with ASC Topic 350, Intangibles — Goodwill and Other (ASC 350), goodwill is tested for impairment annually at the end of the third quarter, and will be tested for impairment between annual tests if an event occurs or circumstances change that more likely than not would indicate the carrying amount may be impaired. Impairment testing for goodwill is done at a reporting unit level. Reporting units are at the reportable segment level, or one level below the reportable segment level for our GMI and Other reportable segments, and are aligned with our management reporting structure. Goodwill relates and is assigned directly to a specific reporting unit.
45
Impairment is the condition that exists when the carrying amount of goodwill exceeds its implied fair value. The implied fair value of goodwill is determined in the same manner as the amount of goodwill recognized in a business combination. The excess of the fair value of a reporting unit over the amounts assigned to its assets and liabilities is the implied fair value of goodwill. An impairment loss would be recognized when the carrying amount of goodwill exceeds the implied fair value of goodwill of the reporting unit. Refer to note 3 (Business Combinations, Investments, and Divestitures), note 4 (Goodwill and Intangible Asset Impairment), and note 10 (Goodwill and Other Intangibles) for additional information.
Other intangible assets include electricity and other supplier contracts, customer relationships, trade names, and other intangible assets acquired from an independent party. Except for trade names, our intangible assets have a definite life and are amortized on a straight-line basis over their estimated useful lives as follows:
|
Range of
|
||
|
Useful Lives
|
||
|
Asset type:
|
||
|
Electricity contracts
|
3 to 11 years
|
|
|
Unpatented technology
|
10 years
|
|
|
Supplier contracts
|
2 years
|
|
|
Customer relationships
|
1 year
|
|
|
Software
|
1 year
|
Trade names have indefinite lives and are not amortized but rather tested annually for impairment and written down to fair value as required.
j. Impairment of Long-Lived Assets
In accordance with ASC Topic 360, Property, Plant, and Equipment (ASC 360), the Company reviews the recoverability of its long-lived assets, such as plant and equipment and definite-lived intangible assets, when events or changes in circumstances occur that indicate that the carrying value of the asset or asset group may not be recoverable. The assessment of possible impairment is based on the Company’s ability to recover the carrying value of the asset or asset group from the expected future undiscounted pretax cash flows of the related operations. The Company assesses the recoverability of the carrying value of long-lived assets at the lowest level for which identifiable cash flows are largely independent of the cash flows of other assets and liabilities. If these cash flows are less than the carrying value of such asset or asset group, an impairment loss is measured based on the difference between estimated fair value and carrying value. Assets to be disposed are written down to the lower of carrying amount or fair value less costs to sell, and depreciation ceases. Fair value is determined through various valuation techniques, including discounted cash flow models, quoted market values, and third-party independent appraisals, as considered necessary.
k. Share-Based Compensation
The Company recognizes share-based compensation expense based on the estimated grant date fair value of share-based awards using a Black-Scholes option pricing model. Prior to vesting, cumulative compensation cost equals the proportionate amount of the award earned to date. The Company has elected to treat each award as a single award and recognize compensation cost on a straight-line basis over the requisite service period of the entire award. If the terms of an award are modified in a manner that affects both the fair value and vesting of the award, the total amount of remaining unrecognized compensation cost (based on the grant-date fair value) and the incremental fair value of the modified award are recognized over the amended vesting period.
Prior to March 30, 2008, awards were liability-classified given net cash settlement provisions contained in the Company’s stock option plan, and awards were required to be remeasured to fair value each reporting period. Effective March 30, 2008, the Company agreed to amend the terms of its share-based compensation plan to remove the cash settlement provisions. Based on this amendment, all outstanding awards were converted from liability-classified awards to equity-classified awards. When a liability-classified award is modified so that it becomes equity-classified without changing any of the other terms of the award, the fair value of the award at the date of the modification becomes its measurement basis from that point forward. As of the date of modification, the Company reclassified its accumulated liability for share-based compensation from other long-term liabilities to additional paid-in capital.
Refer to note 21 (Share-Based Compensation) for further information on the Company’s accounting for share-based compensation.
l. Restructuring Charges
Restructuring activities are programs planned and controlled by management that materially change either the scope of the business undertaken by the Company or the manner in which business is conducted. Restructuring activities include, but are not limited to, one-time termination benefits provided to current employees that are involuntarily terminated, costs to terminate a contract that is not a capital lease, and costs to consolidate facilities and relocate employees. Restructuring charges are recognized in accordance with ASC Topic 420, Exit or Disposal Cost Obligations (ASC 420), which requires a liability for a cost associated with an exit or disposal activity to be recognized at its fair value in the period in which the liability is incurred, except for a liability for one-time termination benefits that is incurred over time. In periods subsequent to initial measurement, changes to a restructuring liability are measured using the credit-adjusted risk-free rate that was used to measure the liability initially.
m. Income Taxes
Income taxes are accounted for under the asset and liability method. Deferred tax assets and liabilities are recognized for the future tax consequences attributable to differences between the financial statement carrying amounts of existing assets and liabilities and their respective tax bases and operating loss and tax credit carryforwards. Deferred tax assets and liabilities are measured using enacted tax rates expected to apply to taxable income in the years in which those temporary differences are expected to be recovered or settled. The effect on deferred tax assets and liabilities of a change in tax rates is recognized in the statement of operations in the period that includes the enactment date. Valuation allowances are recorded to reduce deferred tax assets when it is more likely than not that a tax benefit will not be realized.
The Company has adopted the amendment to ASC Subtopic 740-10, Income Taxes (ASC 740-10), which provides a comprehensive model for the recognition, measurement, and disclosure in financial statements of uncertain income tax positions that a company has taken or expects to take on a tax return. Under ASC 740-10, a company can recognize the benefit of an income tax position only if it is more likely than not (greater than 50%) that the tax position will be sustained upon tax examination, based solely on the technical merits of the tax position. Otherwise, no benefit can be recognized. The tax benefits recognized are measured based on the largest benefit that has a greater than fifty percent likelihood of being realized upon ultimate settlement. Additionally, companies are required to accrue interest and related penalties, if applicable, on all tax exposures for which reserves have been established consistent with jurisdictional tax laws. The Company has elected to recognize interest expense and penalties related to uncertain tax positions as a component of its provision for income taxes.
46
n. Financial Instruments
The Company accounts for derivatives and hedging activities in accordance with ASC Topic 815, Derivatives and Hedging (ASC 815). ASC 815 requires that all derivative instruments be recorded on the balance sheet at their respective fair values. The Company’s derivative instruments consist of an interest rate cap and interest rate swaps employed to manage interest rate exposures on long-term debt discussed in note 12 (Debt) and a power hedge and foreign exchange forward contracts to manage commodity price and foreign currency exchange exposures discussed in note 15 (Derivative Instruments).
o. Recently Implemented Accounting Pronouncements
In June 2009, the FASB issued an amendment to ASC Subtopic 860-10, Transfers and Servicing. The objective of this amendment is to improve the relevance, representational faithfulness, and comparability of the information that a reporting entity provides in its financial statements about a transfer of financial assets; the effects of a transfer on its financial position, financial performance, and cash flows; and a transferor’s continuing involvement, if any, in transferred financial assets. This amendment improves financial reporting by eliminating (1) the exceptions for qualifying special-purpose entities from the consolidation guidance and (2) the exception that permitted sale accounting for certain mortgage securitizations when a transferor has not surrendered control over the transferred financial assets. This amendment was adopted on July 1, 2010. This change had no effect on the Company’s financial position or results of operations.
In June 2009, the FASB issued an amendment to ASC Subtopic 810-10, Consolidation — Variable Interest Entities. The objective of this amendment is to improve financial reporting by enterprises involved with variable interest entities by eliminating the quantitative-based risks and rewards calculation and requiring an enterprise to perform an analysis to determine whether the enterprise’s variable interest or interests give it a controlling interest in a variable interest entity. In addition, the amendment requires an ongoing reassessment of whether an enterprise is the primary beneficiary of a variable interest entity. This amendment was adopted on July 1, 2010. The Company is not currently involved with variable interest entities and, therefore, this change had no effect on the Company’s financial position or results of operations.
In October 2009, the FASB issued an amendment to ASC Subtopic 820-10, Fair Value Measurements and Disclosures (ASC 820). This amendment requires reporting entities to make new disclosures about recurring or nonrecurring fair value measurements, including significant transfers into and out of Level 1 and Level 2 fair value measurements and information about purchases, sales, issuances, and settlements on a gross basis in the reconciliation of Level 3 fair value measurements. The amendment also clarifies existing fair value measurement disclosure guidance about the level of disaggregation, inputs, and valuation techniques. Adoption of this amendment to ASC 820 had no impact on the Company’s financial position and results of operations.
p. Accounting Pronouncements to be Implemented
In June 2011, the FASB issued an amendment to ASC Subtopic 220-10, Comprehensive Income (ASC 220). The objective of this amendment is to increase the prominence of other comprehensive income in the financial statements. The new accounting guidance requires entities to report components of net income comprehensive income in either (1) a continuous statement of comprehensive income or (2) two separate but consecutive statements. This amendment is effective for fiscal years ending after December 15, 2011. The Company is currently evaluating the impact of adopting this guidance on its financial statements.
|
|
(3)
|
Business Combinations, Investments, and Divestitures
|
Dow Corning Transactions:
On November 5, 2009, the Company sold 100% of its interest in Globe Metais pursuant to a purchase agreement entered into on that same date by and among the Company and Dow Corning. The cash received by the Company in connection with the disposition was approximately $65,600, which represents a purchase price of $75,000 less withholding taxes and certain expenses. Dow Corning assumed Globe Metais’ cash balances totaling $16,555 and $14,000 of export prepayment financing. The final purchase price was subject to adjustment for changes in working capital as provided for in the purchase agreement, which did not result in a significant change in the final purchase price.
The sale of the Company’s equity interest in Globe Metais was executed in connection with the sale of a 49% membership interest in WVA LLC, to Dow Corning, the execution of a long-term supply agreement, and an amendment to an existing supply agreement between Dow Corning and the Company to reduce the amount required to be sold in calendar year 2010 to 20,000 metric tons of silicon metal.
For accounting purposes, the Company allocated $75,000 of the total purchase price received from Dow Corning to the sale of the equity of Globe Metais and $100,000 to the sale of membership interests in WVA LLC. The allocation of total purchase price to the separate transactions was based on the relative fair values of Globe Metais and the membership interests in WVA LLC.
ASC 815.40 requires an entity to consolidate all subsidiaries over which it has a controlling financial interest and considers changes in the ownership interest while the entity retains its controlling financial interest in the subsidiary as equity transactions, resulting in no gain or loss recognition in the statement of operations. As the Company retained a controlling financial interest in WVA LLC, no gain has been recognized in net income on the sale of the 49% membership interest. Rather, noncontrolling interest has been adjusted to reflect the change in our ownership interest in WVA LLC. The difference between the fair value of the consideration received, net of final purchase price adjustments, related transaction costs of $2,146, and provision for income taxes of $26,575, and the amount by which noncontrolling interest increased has been recognized as an increase in additional paid-in capital of $44,397.
Core Metals Group Holdings, LLC Transactions:
On April 1, 2010, the Company, pursuant to a Purchase and Sale Agreement dated as of March 26, 2010 (the Purchase Agreement), purchased from Ospraie Special Opportunities Master Alternative Holdings LLC, The Ospraie Fund L.P., Ospraie Holdings, Inc., and the individuals named in the Purchase Agreement, all of the ownership interests in Core Metals, a Delaware limited liability company, for approximately $52,000 in cash, including $15,329 borrowed under the Company’s senior revolving credit facility. The Company engaged a third-party appraisal firm to assist in the process of determining the estimated fair value of certain assets acquired. The Company finalized the purchase price allocation for the Core Metals acquisition during the quarter ended March 31, 2011. Goodwill totaling $1,274 has been recorded and assigned to the GMI operating segment.
On April 7, 2010, the Company sold Masterloy for $3,000 in cash. Masterloy was acquired in connection with the Company’s acquisition of Core Metals. Masterloy is a producer of ferrovanadium and ferromolybdenum, an ancillary business the Company does not consider critical to its fundamental business strategy.
In December 2010, the Company completed the divestiture of its 49% ownership interest in Fluorita de Mexico, S.A. de C.V. (FDM) for $2,500. The Company acquired its ownership interest in FDM in connection with the acquisition of Core Metals. FDM operates a fluorite ore mine and fluorspar processing plant located in Mexico, an ancillary business the Company does not consider critical to its fundamental business strategy. There was no gain or loss associated with the sale of the 49% ownership interest in FDM as the sales price was equal to the recorded book value of this investment.
47
Nigerian Mining Licenses:
In March 2011, the Company made irrevocable advances totaling approximately $17,000 to acquire through transfer exploration mining licenses in Nigeria to mine for manganese ore, a raw material used in the production of certain silicon and manganese based alloys. This investment is recorded in other assets and reflected in other investing activities in the consolidated statement of cash flows. The transfer process is subject to regulatory approval that may impact the Company's ability to acquire through transfer the exploration mining licenses.
(4) Goodwill and Intangible Asset Impairment
In accordance with ASC 350, the Company applies a fair value based impairment test to the net book value of goodwill and indefinite-lived intangible assets on an annual basis and on an interim basis if certain events or circumstances indicate that an impairment loss may have occurred. During the second quarter of fiscal year 2009, the Company experienced a decrease in profitability and a significant decline in demand for high purity solar-grade silicon. Consistent with the guidance in ASC 350, the Company performed an interim impairment test of goodwill and indefinite-lived intangible assets at the end of the second quarter of fiscal year 2009. In performing this test, the Company made a substantial downward revision in the forecasted cash flows from its Solsil reporting unit as a result of a decrease in the market price for solar-grade silicon and weakness in demand for solar products. The Company finalized this impairment analysis during the third quarter of fiscal year 2009 and has recorded an impairment charge totaling $65,340, comprising the write-off of $57,656 of goodwill and $12,048 of unpatented technology, offset by the write-off of associated deferred tax liabilities totaling $4,364. These impairment charges are entirely associated with the Solsil business unit.
|
(5)
|
Restructuring Charges
|
During the third quarter of fiscal year 2009, the Company implemented formal restructuring programs, including the temporary shutdown of certain furnace operations and furloughing or terminating employees. The restructuring programs included employee severance and benefits, as well as costs associated with lease termination obligations. Total restructuring (income) expenses of ($81) and $1,711 were incurred during the year ended June 30, 2010 and 2009, respectively, and are included in restructuring charges in the consolidated statement of operations. There is no remaining unpaid liability as of June 30, 2010, and no additional costs are expected to be incurred associated with these restructuring actions.
|
(6)
|
Treasury Securities
|
During March 2008, the Company purchased U.S. government treasury securities with a term to maturity of 125 days. The securities were redeemed during the year ended June 30, 2009.
|
(7)
|
Inventories
|
Inventories comprise the following at June 30:
|
2011
|
2010
|
|||||
|
Finished goods
|
$
|
29,570
|
19,655
|
|||
|
Work in process
|
2,078
|
2,860
|
||||
|
Raw materials
|
67,213
|
54,988
|
||||
|
Parts and supplies
|
10,431
|
9,660
|
||||
|
Total
|
$
|
109,292
|
87,163
|
|||
At June 30, 2011, $102,478 in inventory is valued using the first-in, first-out method and $6,814 using the average cost method. At June 30, 2010, $80,435 in inventory is valued using the first-in, first-out method and $6,728 using the average cost method.
During the year ended June 30, 2009, the Company recorded inventory write-downs totaling $5,835 due to expected lower net realizable values for certain Solsil and Yonvey inventories. These write-downs have been recorded in cost of goods sold. There were no significant inventory write-downs during the years ended June 30, 2011 and 2010.
|
(8)
|
Prepaid Expenses and Other Current Assets
|
Prepaid expenses and other current assets comprise the following at June 30:
|
2011
|
2010
|
|||||
|
Deferred taxes
|
$
|
5,766
|
3,224
|
|||
|
Income tax receivables
|
3,777
|
5,251
|
||||
|
Value added and other non-income tax receivables
|
3,391
|
2,695
|
||||
|
Restricted cash
|
4,404
|
154
|
||||
|
Other
|
10,538
|
12,485
|
||||
|
Total
|
$
|
27,876
|
23,809
|
|||
48
|
(9)
|
Property, Plant, and Equipment
|
Property, plant, and equipment, net of accumulated depreciation and amortization, comprise the following at June 30:
|
2011
|
2010
|
|||||||||
|
Land, land improvements, and land use rights
|
$
|
6,907
|
6,080
|
|||||||
|
Building and improvements
|
43,076
|
41,262
|
||||||||
|
Machinery and equipment
|
93,891
|
78,370
|
||||||||
|
Furnaces
|
136,177
|
124,898
|
||||||||
| Other |
3,993
|
3,640
|
||||||||
|
Construction in progress
|
23,743
|
17,824
|
||||||||
|
Property, plant, and equipment, gross
|
307,787
|
272,074
|
||||||||
|
Less accumulated depreciation and amortization
|
(77,810)
|
(52,807)
|
||||||||
|
Property, plant, and equipment, net of accumulated depreciation and amortization
|
$
|
229,977
|
219,267
|
|||||||
Depreciation expense for the year ended June 30, 2011 was $25,055, of which $24,330 is recorded in cost of goods sold and $725 is recorded in selling, general, and administrative expenses, respectively. Depreciation expense for the year ended June 30, 2010 was $20,362, of which $19,912 is recorded in cost of goods sold and $450 is recorded in selling, general, and administrative expenses. Depreciation expense for the year ended June 30, 2009 was $17,665, of which $17,281 is recorded in cost of goods sold and $384 is recorded in selling, general, and administrative expenses.
Capitalized interest for the years ended June 30, 2011, 2010, and 2009 was $52, $376, and $968, respectively.
|
(10)
|
Goodwill and Other Intangibles
|
Goodwill and other intangibles presented below have been allocated to the Company’s operating segments.
a. Goodwill
Changes in the carrying amount of goodwill, by reportable segment, during the years ended June 30 are as follows:
|
Globe
|
||||||||||||
|
GMI
|
Metales
|
Solsil
|
Other
|
Total
|
||||||||
|
Balance at July 1, 2009
|
||||||||||||
|
Goodwill
|
$
|
30,255
|
14,313
|
57,656
|
7,260
|
109,484
|
||||||
|
Accumulated impairment loss
|
—
|
—
|
(57,656)
|
—
|
(57,656)
|
|||||||
|
30,255
|
14,313
|
—
|
7,260
|
51,828
|
||||||||
|
Core Metals acquisition
|
150
|
—
|
—
|
—
|
150
|
|||||||
|
Foreign exchange rate changes
|
—
|
—
|
—
|
47
|
47
|
|||||||
|
Balance at June 30, 2010
|
||||||||||||
|
Goodwill
|
30,405
|
14,313
|
57,656
|
7,307
|
109,681
|
|||||||
|
Accumulated impairment loss
|
—
|
—
|
(57,656)
|
—
|
(57,656)
|
|||||||
|
30,405
|
14,313
|
—
|
7,307
|
52,025
|
||||||||
|
Core Metals purchase price allocation adjustments
|
1,124
|
—
|
—
|
—
|
1,124
|
|||||||
|
Foreign exchange rate changes
|
—
|
—
|
—
|
354
|
354
|
|||||||
|
Balance at June 30, 2011
|
||||||||||||
|
Goodwill
|
31,529
|
14,313
|
57,656
|
7,661
|
111,159
|
|||||||
|
Accumulated impairment loss
|
—
|
—
|
(57,656)
|
—
|
(57,656)
|
|||||||
|
$
|
31,529
|
14,313
|
—
|
7,661
|
53,503
|
|||||||
49
b. Other Intangible Assets
Changes in the carrying amounts of definite lived intangible assets are as follows:
|
Electricity
|
||||||||||
|
Contracts
|
Other
|
|||||||||
|
Cost:
|
||||||||||
|
Balance at June 30, 2009
|
$
|
7,905
|
323
|
|||||||
|
Sale of Globe Metais (see note 3)
|
(5,073)
|
(78)
|
||||||||
|
Balance at June 30, 2010
|
2,832
|
245
|
||||||||
|
Balance at June 30, 2011
|
$
|
2,832
|
245
|
|||||||
|
Accumulated amortization:
|
||||||||||
|
Balance at June 30, 2009
|
$
|
7,151
|
323
|
|||||||
|
Sale of Globe Metais (see note 3)
|
(4,629)
|
(78)
|
||||||||
|
Amortization expense
|
310
|
—
|
||||||||
|
Balance at June 30, 2010
|
2,832
|
245
|
||||||||
|
Balance at June 30, 2011
|
2,832
|
245
|
||||||||
|
Net balance at June 30, 2011
|
$
|
—
|
—
|
|||||||
There were no changes in the value of the Company’s indefinite lived intangible assets during the years ended June 30, 2011 or 2010. The trade name balance is $477 at June 30, 2011 and 2010.
Amortization expense of purchased intangible assets for the years ended June 30, 2011, 2010 and 2009 was $0, $310 and $2,142, respectively, which is recorded in cost of goods sold.
(11) Investments in Unconsolidated Affiliates
Investments in unconsolidated affiliates comprise the following:
|
Balance at
|
Balance at
|
||||||||||||
|
Ownership
|
June 30,
|
June 30,
|
|||||||||||
|
Interest
|
2011
|
2010
|
|||||||||||
|
Equity method investment:
|
|||||||||||||
|
Norchem
|
50.00%
|
$
|
2,667
|
2,212
|
|||||||||
|
Other cost investments:
|
|||||||||||||
|
Inversora Nihuiles S.A.(a)
|
9.75
|
3,067
|
3,067
|
||||||||||
|
Inversora Diamante S.A.(b)
|
8.40
|
2,906
|
2,906
|
||||||||||
|
Total
|
$
|
8,640
|
8,185
|
||||||||||
|
(a) This entity owns a 51% interest in Hidroelectrica Los Nihuiles S.A., which is a hydroelectric company in Argentina.
|
|||||||||||||
|
(b) This entity owns a 59% interest in Hidroelectrica Diamante S.A., which is a hydroelectric company in Argentina.
|
|||||||||||||
Equity income (loss) from our Norchem investment was $455, $257, and ($38), respectively, for the years ended June 30, 2011, 2010, and 2009, which is included in other income.
(12) Debt
a. Short-Term Debt
Short-term debt comprises the following:
|
Weighted
|
|||||||||||||
|
Outstanding
|
Average
|
Unused
|
|||||||||||
|
Balance
|
Interest Rate
|
Credit Line
|
|||||||||||
|
June 30, 2011:
|
|||||||||||||
|
Type debt:
|
|||||||||||||
|
Export financing
|
$
|
731
|
2.75%
|
$
|
8,310
|
||||||||
|
Other
|
363
|
8.00%
|
—
|
||||||||||
|
Total
|
$
|
1,094
|
$
|
8,310
|
|||||||||
|
June 30, 2010:
|
|||||||||||||
|
Type debt:
|
|||||||||||||
|
Export financing
|
$
|
—
|
—
|
$
|
7,041
|
||||||||
|
Other
|
8,067
|
3.42%
|
446
|
||||||||||
|
Total
|
$
|
8,067
|
$
|
7,487
|
|||||||||
50
Export Financing Agreements — The Company’s Argentine subsidiary maintains various short-term export financing agreements. Generally, these arrangements are for periods ranging between seven and eleven months, and require the Company to pledge as collateral certain export accounts receivable.
Other — The balance at June 30, 2010 relates primarily to $5,880 in short-term notes payable to Dow Corning for working capital loans given to WVA LLC. The notes accrued interest at 3.0% and were settled during October 2010.
b. Revolving Credit Agreements
A summary of the Company’s revolving credit agreements at June 30, 2011 is as follows:
|
Weighted
|
|||||||||
|
Outstanding
|
Average
|
Unused
|
Total
|
||||||
|
Balance
|
Interest Rate
|
Commitment
|
Commitment
|
||||||
| Senior credit facility |
$
|
34,989
|
2.44%
|
$
|
52,761
|
90,000
|
|||
| Revolving credit facility |
12,000
|
2.44%
|
3,000
|
15,000
|
|||||
In September 2008, the Company’s subsidiary, Globe Metallurgical, Inc. (GMI), entered into a borrowing arrangement, which included a $35,000 senior credit facility expiring in September 2013 and five-year senior term loan in an aggregate principal amount of $40,000. The senior term loan was subject to certain mandatory prepayments based on excess cash flow, as defined in the loan agreement. Further, as part of the Dow Corning transactions discussed in note 3, the Company agreed to modify certain terms of the borrowing facilities, which included a reduction of revolving credit from $35,000 to $28,000 and a $6,000 prepayment of the senior term loan, in exchange for the release of the assets of West Virginia Alloys, Inc. as a security for these borrowings.
On March 30, 2011, certain of the Company’s domestic subsidiaries (the Borrowers) entered into an agreement to amend and restate the Company’s existing senior credit facility and senior term loan. The amended and restated senior credit agreement provides for a $90,000 revolving credit facility, subject to a defined borrowing base, and matures on March 30, 2014. This facility includes a provision for the issuance of standby letters of credit and a $10,000 sublimit for swingline loans. The facility may be increased from time to time by an amount up to $10,000 in the aggregate at the Company’s election, subject to approval by the existing or additional lenders. Interest on borrowings under the credit agreement is payable, at the Company’s election, at either a base rate (the higher of the U.S. federal funds rate plus 0.50% per annum and the issuing bank’s “prime rate”) plus a margin of 1.50% per annum, or LIBOR plus a margin of 2.25% per annum. Certain commitment fees are also payable under the credit agreement. The facility is guaranteed by certain of the Borrowers’ subsidiaries, and borrowings under the credit agreement are collateralized by the Borrowers’ cash and cash equivalents, accounts receivable, and inventories, and the stock of their subsidiaries. The agreement contains certain restrictive and financial covenants, which include a maximum total debt to capitalization ratio and a minimum combined tangible net worth, as well as a minimum fixed charge coverage ratio and a maximum annual capital expenditure level, both of which are only applicable if availability under the senior credit facility is below minimum levels specified in the credit agreement. The Company was in compliance with the loan covenants at June 30, 2011.
At June 30, 2011, there was a $34,989 balance outstanding on the senior credit facility. The total commitment outstanding on this credit facility includes $440 outstanding letters of credit associated with supplier contracts and a $1,810 outstanding letter of credit associated with a power supply contract. The outstanding balances under the previous senior credit agreement and senior term loan were transferred into the new facility.
The Company classifies borrowings under the senior credit facility as long-term liabilities given our ability to renew and extend borrowings under this agreement beyond one year from the balance sheet date.
On October 1, 2010, the Company entered into a new $15,000 revolving credit facility, and utilized proceeds from borrowings under the revolving credit facility to repay the Company’s $5,880 short-term notes payable to Dow Corning. Total borrowings under this credit facility were $12,000 at June 30, 2011. Interest on advances under the revolving credit facility accrues at LIBOR plus an applicable margin percentage or, at the Company’s option, prime plus an applicable margin percentage. The credit facility is subject to certain restrictive and financial covenants, which include limits on additional debt, a maximum ratio of debt to earnings before interest, taxes, depreciation and amortization and minimum net worth. The Company was in compliance with the loan covenants at June 30, 2011.
The Company classifies borrowings under this revolving credit facility as current liabilities as the arrangement is payable in full upon the earlier of 10 business days following written demand by the lender or the agreement’s expiration on March 31, 2012.
See note 15 (Derivative Instruments) for a discussion of derivative financial instruments entered into to reduce the Company’s exposure to interest rate fluctuations on outstanding debt.
c. Long-Term Debt
Long-term debt comprises the following at June 30:
|
2011
|
2010
|
|||||||||
|
Senior term loan
|
$
|
—
|
16,916
|
|||||||
| Other |
—
|
96
|
||||||||
| Total |
—
|
17,012
|
||||||||
|
Less current portion of long-term debt
|
—
|
(10,092)
|
||||||||
|
Long-term debt, net of current portion
|
$
|
—
|
6,920
|
|||||||
Senior Term Loan — As discussed above, the outstanding balance on the senior term loan was transferred to the Company’s amended and restated senior credit facility in March 2011.
d. Fair Value of Debt
The recorded carrying values of our debt balances approximate fair value given our debt is at variable rates tied to market indicators or is short-term in nature.
51
(13) Accrued Expenses and Other Current Liabilities
Accrued expenses and other current liabilities comprise the following at June 30:
|
2011
|
2010
|
|||||||||||
|
Accrued income taxes
|
$
|
4,257
|
3,030
|
|||||||||
|
Accrued insurance
|
758
|
717
|
||||||||||
|
Accrued professional fees
|
1,093
|
959
|
||||||||||
|
Accrued property taxes
|
1,161
|
1,181
|
||||||||||
|
Accrued wages, bonuses, and benefits
|
11,877
|
7,668
|
||||||||||
|
Customer advances
|
731
|
10,768
|
||||||||||
| Deferred taxes |
36
|
35
|
||||||||||
|
Current portion of retained acquisition contingencies
|
10,931
|
5,348
|
||||||||||
|
Accrued purchase obligations
|
632
|
1,153
|
||||||||||
| Other |
2,999
|
4,973
|
||||||||||
| Total |
$
|
34,475
|
35,832
|
|||||||||
(14) Other Long-Term Liabilities
Other long-term liabilities comprise the following at June 30:
|
2011
|
2010
|
|||||||||||
|
Accrued pension liability
|
$
|
7,716
|
9,118
|
|||||||||
|
Retained acquisition contingencies
|
5,791
|
4,583
|
||||||||||
| Other |
3,717
|
3,761
|
||||||||||
| Total |
$
|
17,224
|
17,462
|
|||||||||
(15) Derivative Instruments
The Company enters into derivative instruments to hedge certain interest rate, currency, and commodity price risks. The Company does not engage in interest rate, currency, or commodity speculation, and no derivatives are held for trading purposes. All derivatives are accounted for using mark-to-market accounting. The Company believes it is not practical to designate its derivative instruments as hedging instruments as defined under ASC Subtopic 815-10, Derivatives and Hedging (ASC 815). Accordingly, the Company adjusts its derivative financial instruments to current market value through the consolidated statement of operations based on the fair value of the agreement as of period-end. Although not designated as hedged items as defined under ASC 815, these derivative instruments serve to significantly offset the Company’s interest rate, currency, and commodity risks. Gains or losses from these transactions offset gains or losses on the assets, liabilities, or transactions being hedged. No credit loss is anticipated as the counterparties to these agreements are major financial institutions that are highly rated.
Interest Rate Risk:
The Company is exposed to market risk from changes in interest rates on certain of its short-term and long-term debt obligations.
In connection with GMI’s revolving credit facility and senior term loan (note 12), the Company entered into an interest rate cap arrangement and three interest rate swap agreements to reduce our exposure to interest rate fluctuations.
In October 2008, the Company entered into an interest rate cap arrangement to cap LIBOR on a $20,000 notional amount of debt, with the notional amount decreasing by $1,053 per quarter through the interest rate cap’s expiration on June 30, 2013. Under the interest rate cap, the Company capped LIBOR at a maximum of 4.5% over the life of the agreement.
In November 2008, the Company entered into an interest rate swap agreement involving the exchange of interest obligations relating to a $13,333 notional amount of debt, with the notional amount decreasing by $702 per quarter. Under the interest rate swap, the Company receives LIBOR in exchange for a fixed interest rate of 2.85% over the life of the agreement. The agreement expires in June 2013.
In January 2009, the Company entered into a second interest rate swap agreement involving the exchange of interest obligations relating to a $12,632 notional amount of debt, with the notional amount decreasing by $702 per quarter. Under the interest rate swap, the Company receives LIBOR in exchange for a fixed interest rate of 1.66% over the life of the agreement. The agreement expires in June 2013.
In April 2009, the Company entered into a third interest rate swap agreement involving the exchange of interest obligations relating to an $11,228 notional amount of debt, with the notional amount decreasing by $702 per quarter. Under the interest rate swap, the Company receives LIBOR in exchange for a fixed interest rate of 2.05% over the life of the agreement. The agreement expires in June 2013.
Foreign Currency Risk:
The Company is exposed to market risk arising from changes in currency exchange rates as a result of its operations outside the United States, principally in Argentina and China. A portion of the Company’s net sales generated from its non-U.S. operations is denominated in currencies other than the U.S. dollar. Most of the Company’s operating costs for its non-U.S. operations are denominated in local currencies, principally the Argentine peso and the Chinese renminbi. Consequently, the translated U.S. dollar value of the Company’s non-U.S. dollar net sales, and related accounts receivable balances, and our operating costs are subject to currency exchange rate fluctuations. Derivative instruments are not used extensively to manage this risk. The Company utilized derivative financial instruments, including foreign exchange forward contracts, to manage a portion of its net foreign currency exposure to the Brazilian real, prior to the sale of Globe Metais discussed in note 3, and the Euro. No foreign currency derivative financial instruments are outstanding at June 30, 2011.
52
Commodity Price Risk:
The Company is exposed to price risk for certain raw materials and energy used in its production process. The raw materials and energy that the Company uses are largely commodities subject to price volatility caused by changes in global supply and demand and governmental controls. Derivative financial instruments are not used extensively to manage the Company’s exposure to fluctuations in the cost of commodity products used in its operations. The Company attempts to reduce the impact of increases in its raw material and energy costs by negotiating long-term contracts and through the acquisition of companies or assets for the purpose of increasing its access to raw materials with favorable pricing terms.
In June 2010, the Company entered into a power hedge agreement on a 175,440 MWh notional amount of electricity, representing approximately 20% of the total power required by our Niagara Falls, New York plant. This hedge covers our expected needs not supplied by the facility’s long-term power contract over the term of the hedge agreement. The notional amount decreases equally per month through the agreement’s expiration on June 30, 2012. Under the power hedge agreement, the Company fixed the power rate at $39.60 per MWh over the life of the contract. In October 2010, the Company entered into a power hedge agreement on an 87,600 MWh notional amount of electricity, also for power required at our Niagara Falls, New York plant. The notional amount decreases equally per month from the agreement’s July 1, 2012 effective date through its expiration on June 30, 2013. Under this power hedge agreement, the Company fixed the power rate at $39.95 per MWh over the life of the contract.
The effect of the Company’s derivative instruments on the consolidated statements of operations is summarized in the following table:
|
(Loss) Gain Recognized
|
||||||||||||||
|
During
|
||||||||||||||
|
the Years Ended June 30
|
Location
|
|||||||||||||
|
2011
|
2010
|
2009
|
of (Loss) Gain
|
|||||||||||
|
Interest rate derivatives
|
$
|
(252)
|
(1,231)
|
(840)
|
Interest expense
|
|||||||||
|
Foreign exchange forward contracts
|
(190)
|
772
|
4,789
|
Foreign exchange (loss) gain
|
||||||||||
| Power hedge |
173
|
(243)
|
—
|
Cost of goods sold
|
||||||||||
The fair values of the Company’s derivative instruments at June 30, 2011 are summarized in note 22 (Fair Value Measures). The liabilities associated with the Company’s interest rate derivatives and power hedge of $320 and $110, respectively, are included in other long-term liabilities.
(16) Pension Plans
a. Defined Benefit Pension Plans
The Company’s subsidiary, GMI, sponsors three noncontributory defined benefit pension plans covering certain domestic employees. These plans were frozen in 2003. The Company’s subsidiary, Core Metals, sponsors a noncontributory defined benefit pension plan covering certain domestic employees. This plan was closed to new participants in April 2009.
The Company’s funding policy has been to contribute, as necessary, an amount in excess of the minimum requirements in order to achieve the Company’s long-term funding targets. During the years ended June 30, 2011, and 2011, the Company made contributions of $1,080 and $1,008, respectively, to the domestic pension plans.
The Company uses a June 30 measurement date for these defined benefit pension plans.
Benefit Obligations and Funded Status — The following provides a reconciliation of the benefit obligations, plan assets, and funded status of the plans at June 30, 2011 and 2010:
|
2011
|
2010
|
|||||||||
|
Change in benefit obligations:
|
||||||||||
|
Benefit obligations at beginning of year
|
$
|
28,367
|
19,984
|
|||||||
|
Acquisition of business
|
—
|
5,400
|
||||||||
| Interest cost |
1,439
|
1,285
|
||||||||
| Service cost |
114
|
26
|
||||||||
|
Actuarial loss
|
1,698
|
2,848
|
||||||||
|
Benefits paid
|
(1,400)
|
(1,176)
|
||||||||
|
Benefit obligations at end of year
|
$
|
30,218
|
28,367
|
|||||||
|
Change in plan assets:
|
||||||||||
|
Fair value of plan assets at beginning of year
|
$
|
19,249
|
13,027
|
|||||||
|
Acquisition of business
|
—
|
4,445
|
||||||||
|
Actual gain on plan assets
|
3,573
|
1,945
|
||||||||
|
Employer contributions
|
1,080
|
1,008
|
||||||||
|
Benefits paid
|
(1,400)
|
(1,176)
|
||||||||
|
Fair value of plan assets at end of year
|
$
|
22,502
|
19,249
|
|||||||
|
Funded status at end of year:
|
||||||||||
|
Fair value of plan assets
|
$
|
22,502
|
19,249
|
|||||||
|
Benefit obligations
|
30,218
|
28,367
|
||||||||
|
Funded status
|
$
|
(7,716)
|
(9,118)
|
|||||||
|
Amounts recognized in the consolidated balance sheet consist of:
|
||||||||||
|
Noncurrent liability
|
$
|
(7,716)
|
(9,118)
|
|||||||
|
Accumulated other comprehensive loss
|
6,356
|
7,422
|
||||||||
53
All of our pension plans are underfunded, and have been underfunded for all years presented. The amounts recognized in other comprehensive income (loss) consist entirely of net actuarial loss during the years ended June 30, 2011, 2010, and 2009 and totaled $1,066, ($1,402), and ($5,045), respectively.
The accumulated benefit obligations for defined benefit pension plans were $30,218 and $28,367 at June 30, 2011 and 2010.
Net Periodic Pension Expense — The components of net periodic pension expense (benefit) for the Company’s defined benefit pension plans are as follows:
|
2011
|
2010
|
2009
|
|||||
| Interest cost |
$
|
1,439
|
1,285
|
1,224
|
|||
| Service cost |
114
|
26
|
—
|
||||
| Expected return on plan assets |
(1,487)
|
(1,075)
|
(1,236)
|
||||
| Amortization of net loss |
678
|
572
|
229
|
||||
|
|
Net periodic pension expense |
$
|
744
|
808
|
217
|
||
In fiscal year 2012, actuarial net losses of approximately $578 are expected to be recognized into periodic benefit cost from accumulated other comprehensive loss.
Assumptions and Other Data — The assumptions used to determine benefit obligations at June 30, 2011 and 2010 follow:
|
2011
|
2010
|
|||||||||||
| Discount rate |
5.25% - 5.30%
|
5.25%
|
||||||||||
The discount rate used in calculating the present value of our pension plan obligations is developed based on the Citigroup Pension Discount Curve for GMI plans and the Mercer Yield Curve for the Core Metals plan and the expected cash flows of the benefit payments.
The assumptions used to determine net periodic expense for years ended June 30, 2011, 2010, and 2009 are as follows:
|
2011
|
2010
|
2009
|
||||||||||||
| Discount rate |
5.25%
|
5.85% - 6.25%
|
6.75%
|
|||||||||||
|
Expected return on plan assets
|
8.00 - 8.50
|
8.00 - 8.50
|
8.50
|
|||||||||||
Expected return on plan assets is determined based on management’s expectations of long-term average rates of return on funds invested to provide for benefits included in the projected benefit obligations. In determining the expected return on plan assets, the Company takes into account historical returns, plan asset allocations and related investment strategies, as well as the outlook for inflation and overall fixed income and equity returns.
The Company expects to make discretionary contributions of approximately $1,870 to the plans for the year ending June 30, 2012.
The following reflects the gross benefit payments that are expected to be paid for the pension plans for the years ended June 30:
|
2012
|
$
|
1,619
|
|
2013
|
1,678
|
|
|
2014
|
1,696
|
|
|
2015
|
1,730
|
|
|
2016
|
1,788
|
|
|
Years 2017-2021
|
10,273
|
The Company’s overall strategy is to invest in high-grade securities and other assets with a limited risk of market value fluctuation. In general, the Company’s goal is to maintain the following allocation ranges:
|
Equity securities
|
55 - 70%
|
|
Fixed income securities
|
30 - 40
|
|
Real estate
|
5 - 10
|
On July 1, 2009, the Company adopted the new accounting guidance on employer’s disclosures about postretirement benefit plan assets, which requires categorization of pension assets into three levels based upon the assumptions (inputs) used to price the assets. See note 22 (Fair Value Measures) for additional disclosures related to the fair value hierarchy.
54
The Company held no level 3 assets during the year. The fair values of the Company’s pension plan assets as of June 30, 2011 are as follows:
|
Quoted Prices in Active Markets for Identical Assets
|
Significant Observable Inputs
|
|||||||
|
(Level 1)
|
(Level 2)
|
Total
|
||||||
|
Cash and cash equivalents
|
$
|
341
|
—
|
341
|
||||
|
Equity securities:
|
||||||||
|
Domestic equity mutual funds
|
5,083
|
—
|
5,083
|
|||||
|
International equity mutual funds
|
2,573
|
—
|
2,573
|
|||||
|
Commingled equity funds
|
—
|
3,374
|
3,374
|
|||||
|
Fixed income securities:
|
||||||||
|
Fixed income mutual funds
|
8,212
|
—
|
8,212
|
|||||
|
Commingled fixed income funds
|
—
|
2,037
|
2,037
|
|||||
|
Real estate mutual funds
|
882
|
—
|
882
|
|||||
|
$
|
17,091
|
5,411
|
22,502
|
|||||
b. Other Benefit Plans
The Company administers healthcare benefits for certain retired employees through a separate welfare plan requiring reimbursement from the retirees.
The Company’s subsidiary, GMI, provides two defined contribution plans (401(k) plans) that allow for employee contributions on a pretax basis. During fiscal year 2008, the Company agreed to match 25% of participants’ contributions up to a maximum of 6% of compensation. Company matching contributions for the years ended June 30, 2011, 2010, and 2009 were $202, $223, and $231, respectively. Additionally, subsequent to the acquisition of Core Metals as discussed in note 3 (Business Acquisitions, Investments, and Divestitures), the Company began sponsoring the Core Metals defined contribution plan. Under the plan the Company may make discretionary payments to salaried and non-union participants in the form of profit sharing and matching funds. Company matching contributions for the years ended June 30, 2011 and 2010 were $111 and $26, respectively.
Other benefit plans offered by the Company include a Section 125 cafeteria plan for the pretax payment of healthcare costs and flexible spending arrangements.
(17) Income Taxes
The sources of income (loss) before provision for income taxes and (income) losses attributable to noncontrolling interest for the years ended June 30, 2011, 2010, and 2009 were as follows:
|
2011
|
2010
|
2009
|
||||||||||
| U.S. operations |
$
|
87,096
|
21,865
|
(55,448)
|
||||||||
|
Non-U.S. operations
|
5,618
|
32,942
|
21,673
|
|||||||||
| Total |
$
|
92,714
|
54,807
|
(33,775)
|
||||||||
The components of current and deferred income tax expense are as follows:
|
2011
|
2010
|
2009
|
||||||||||
| Current: | ||||||||||||
| Federal |
$
|
16,113
|
10,471
|
(43)
|
||||||||
| State |
1,982
|
2,686
|
1,407
|
|||||||||
| Foreign |
4,355
|
14,446
|
6,710
|
|||||||||
|
Total current
|
22,450
|
27,603
|
8,074
|
|||||||||
| Deferred: | ||||||||||||
| Federal |
12,622
|
(3,745)
|
(311)
|
|||||||||
| State |
1,107
|
(3,315)
|
1,556
|
|||||||||
| Foreign |
(191)
|
(4)
|
2,290
|
|||||||||
|
Total deferred
|
13,538
|
(7,064)
|
3,535
|
|||||||||
|
Total provision for income taxes
|
$
|
35,988
|
20,539
|
11,609
|
||||||||
The following is a reconciliation, stated in percentage, of the U.S. statutory federal income tax rate to our effective tax rate for the years ended June 30, 2011, 2010, and 2009:
|
2011
|
2010
|
2009
|
||||||||||
|
Federal statutory rate
|
35.0%
|
35.0%
|
35.0%
|
|||||||||
|
State taxes, net of federal benefit
|
2.6
|
(3.6)
|
(5.7)
|
|||||||||
|
Goodwill impairment
|
—
|
—
|
(59.7)
|
|||||||||
|
Foreign tax holiday and rate differential
|
0.7
|
2.3
|
3.5
|
|||||||||
|
Change in valuation allowance
|
(0.2)
|
5.5
|
(6.7)
|
|||||||||
|
Domestic production activities deduction
|
(1.7)
|
(1.2)
|
0.3
|
|||||||||
| Other items |
2.4
|
(0.5)
|
(1.1)
|
|||||||||
|
Effective tax rate
|
38.8%
|
37.5%
|
(34.4)%
|
|||||||||
55
The Company’s effective state tax rate for fiscal year 2010 reflects the benefit associated with the recording of certain state tax credits arising from the reopening of our Niagara Falls, New York plant and other state tax adjustments totaling $1,855, which were entirely recorded in the fourth quarter of the year ended June 30, 2010, but related to our prior years’ operations. The Company sold its Brazilian operations in the second quarter of the year ended June 30, 2010, and incurred a Brazilian tax of $9,395 on the associated gain. Prior to the sale, the Company operated under a tax holiday in Brazil, which taxed the Company’s manufacturing income at the preferential rate of 15.25% compared to a statutory rate of 34%. The Company currently operates under a tax holiday in Argentina, where the Company’s manufacturing income is taxed at a preferential rate, which varies based on production levels from the Company’s Argentine facilities, compared to a statutory rate of 35%. The tax holiday in Argentina expires in 2012. For the year ended June 30, 2011, the foreign tax holiday in Argentina provided a decrease of $546 to net income attributable to common stock and decrease of $0.01 to net income per common share. For the year ended June 30, 2010, the foreign tax holidays in Argentina and Brazil provided a decrease of $701 to net income attributable to common stock and decrease of $0.01 to net income per common share. For the year ended June 30, 2009, the foreign tax holidays in Brazil and Argentina provided a benefit of $1,835 to net loss attributable to common stock and $0.03 to loss per common share.
In connection with the Dow Corning transaction that occurred on November 5, 2009, the Company recorded a provision for income taxes of $26,575 in fiscal year 2010 and ($1,005) in fiscal year 2011, which included a change in deferred tax liabilities of $2,073, and was reflected in additional paid-in capital, consistent with the accounting treatment for the transactions.
Significant components of the Company’s deferred tax assets and deferred tax liabilities at June 30, 2011 and 2010 consist of the following:
| 2011 | 2010 | |||||
|
Deferred tax assets:
|
||||||
|
Inventories
|
$
|
2,414
|
2,418
|
|||
|
Accounts receivable
|
139
|
470
|
||||
| Accruals |
6,673
|
5,434
|
||||
|
Deferred Revenue
|
298
|
3,857
|
||||
|
Net operating losses and other carryforwards
|
17,999
|
23,369
|
||||
|
Other assets
|
259
|
443
|
||||
|
Share-based compensation
|
4,868
|
7,465
|
||||
|
Gross deferred tax assets
|
32,650
|
43,456
|
||||
|
Valuation allowance
|
(8,754)
|
(13,497)
|
||||
|
Net deferred tax assets
|
23,896
|
29,959
|
||||
|
Deferred tax liabilities:
|
||||||
|
Fixed assets
|
(39,340)
|
(31,772)
|
||||
|
Prepaid expenses
|
(899)
|
(850)
|
||||
|
Intangibles
|
(974)
|
(722)
|
||||
|
Investments
|
—
|
—
|
||||
|
Total deferred tax liabilities
|
(41,213)
|
(33,344)
|
||||
|
Net deferred tax liabilities
|
$
|
(17,317)
|
(3,385)
|
|||
The Company has undistributed earnings of foreign subsidiaries of approximately $75,000 at June 30, 2011 for which deferred taxes have not been provided for. These earnings, which are considered to be permanently reinvested, would be subject to U.S. tax if they were remitted as dividends. It is not practicable to determine the deferred tax liability on these earnings.
The Company has tax benefits for net operating loss carry forwards (NOLs), a portion of which are subject to various limitations, which expire at various dates in the future. The Company’s NOLs and expiration dates at June 30, 2011 are as follows:
|
Amount
|
Expires
|
|||
|
Federal
|
$
|
24,810
|
2024 through 2026
|
|
| State |
135,343
|
2012 through 2031
|
||
|
Foreign
|
5,391
|
2012 through 2020
|
The Company maintains valuation allowances where it is more likely than not that all or a portion of a deferred tax asset will not be realized. Changes in valuation allowances are included in our tax provision in the period of change. In determining whether a valuation allowance is warranted, the Company evaluates factors such as prior earnings history, expected future earnings, carry back and carry forward periods and tax strategies that could potentially enhance the likelihood of the realization of a deferred tax asset. For the year ended June 30, 2011, the decrease in the valuation allowance of $4,743 was primarily attributable to the Company’s net operating loss carryforwards in China and a corresponding adjustment to the valuation allowance resulting in no net impact on the Company’s provision for income taxes. For the year ended June 30, 2010, the decrease in the valuation allowance of $27,805 was primarily due to the Company’s sale of its Brazilian manufacturing operations.
The total valuation allowance at June 30, 2011, 2010, and 2009 is $8,754, $13,497, and $41,302, respectively, and consists of the following:
|
2011
|
2010
|
2009
|
|||||
|
Federal NOLs
|
$
|
4,100
|
3,848
|
3,848
|
|||
| State NOLs |
819
|
1,055
|
2,819
|
||||
|
Foreign NOLs
|
1,229
|
5,781
|
34,083
|
||||
|
Federal credits
|
235
|
463
|
461
|
||||
| State credits |
2,371
|
2,350
|
—
|
||||
|
Capital loss carryover
|
—
|
—
|
91
|
||||
| Total | $ |
8,754
|
13,497
|
41,302
|
|||
56
The Company files a consolidated U.S. income tax return and tax returns in various state and local jurisdictions. Our subsidiaries also file tax returns in various foreign jurisdictions. The Company’s principal jurisdictions include the U.S., Argentina, and China. The number of open tax years subject to examination varies depending on the tax jurisdiction. The Company’s major taxing jurisdictions and the related open tax years subject to examination are as follows: the U.S. from 2008 to present, Argentina from 2006 to present, and China from 2008 to present.
General accounting principles relating to uncertain income tax positions prescribe a minimum recognition threshold a tax position is required to meet before being recognized, and provides guidance on the derecognition, measurement, classification and disclosure relating to income taxes. The following is a tabular reconciliation of the total amount of unrecognized tax benefits for the year, excluding interest and penalties:
|
2011
|
2010
|
2009
|
||||||
| Balance at the beginning of the year |
$
|
2,039
|
—
|
—
|
||||
|
|
Gross increases for prior year tax positions |
206
|
2,039
|
—
|
||||
|
|
Gross decreases for prior year tax positions |
(1,471)
|
—
|
—
|
||||
| Balance at the end of the year |
$
|
774
|
2,039
|
—
|
||||
The Company has elected to include interest and penalties in its income tax expense. Included in our liability for uncertain tax positions are interest and penalties of $145, $336, and $0 for the years ended June 30, 2011, 2010, and 2009, respectively. For the years ended June 30, 2011, 2010 and 2009, we recognized ($149), $268 and $0, respectively, of interest and penalties in income tax benefit/provision. The Company believes that it is reasonably possible that approximately $212 of its currently remaining uncertain tax position liability may be recognized within the next twelve months. The portion of uncertain tax positions as of June 30, 2011 that would, if recognized, impact the effective tax rate was $774, $629 and $0 as of June 30, 2011, 2010, and 2009, respectively.
(18) Commitments and Contingencies
a. Legal Contingencies
The Company is subject to various lawsuits, claims, and proceedings that arise in the normal course of business, including employment, commercial, environmental, safety, and health matters, as well as claims associated with our historical acquisitions and divestitures. Although it is not presently possible to determine the outcome of these matters, in the opinion of management, the ultimate disposition of these matters will not have a material adverse effect on the Company’s consolidated financial position, results of operations, or liquidity.
During the year ended June 30, 2011, the Company made escrow deposits and received payments totaling $2,038 and accrued $4,249 for working capital claims associated with our historical acquisitions.
b. Environmental Contingencies
It is the Company’s policy to accrue for costs associated with environmental assessments, remedial efforts, or other environmental liabilities when it becomes probable that a liability has been incurred and the costs can be reasonably estimated. When a liability for environmental remediation is recorded, such amounts will be recorded without giving effect to any possible future recoveries. At June 30, 2011, there are no significant liabilities recorded for environmental contingencies. With respect to the cost for ongoing environmental compliance, including maintenance and monitoring, such costs are expensed as incurred unless there is a long-term monitoring agreement with a governmental agency, in which case a liability is established at the inception of the agreement.
c. Employee Contracts
As of June 30, 2011, we have 1,213 employees. The Company’s total employees consist of 470 salaried employees and 743 hourly employees, and include 511 unionized employees. 42.1% of the workforce is covered by collective bargaining agreements and 13.4% of the workforce is covered by collective bargaining agreements expiring within one year of June 30, 2011. Collective bargaining agreements associated with 70 unionized employees, which were set to expire within one year of June 30, 2011, have been renegotiated after June 30, 2011.
d. Power Commitments
Electric power is a major cost of the Company’s production process as large amounts of electricity are required to operate arc furnaces. A summary of electric power commitments follows:
|
Facility
|
Supplier
|
Terms
|
Price Structure
|
Capacity
|
||||
|
Alloy, West Virginia
|
Appalachian Power
|
Through October 30, 2012, 1-year termination notice
|
Published tariff rate
|
110 MW interruptible
|
||||
|
Alloy, West Virginia
|
Brookfield Power
|
Through December 31, 2021
|
Fixed rate
|
100 MW (hydro power)
|
||||
|
Beverly, Ohio
|
American Electric Power
|
Evergreen, 1-year termination notice
|
Published tariff rate
|
2.5 MW firm
85 MW interruptible
|
||||
|
Niagara Falls, New York
|
New York Power Authority
|
Through September 30, 2021
|
Based on the EP and RP commodity agreement
|
32.6 MW replacement
7.3 MW expansion
|
||||
|
Selma, Alabama
|
Alabama Power
|
Evergreen, 1-year termination notice
|
Published tariff rate
|
2.15 MW firm
40.85 MW interruptible
|
||||
|
Mendoza, Argentina
|
EDEMSA
|
Through October 31, 2009
|
Specified discount from established price
|
24 MW firm
2.5 MW interruptible
|
||||
|
Bridgeport, Alabama
|
Tennessee Valley Authority
|
Through April 30, 2020, 2-year termination notice
|
Fixed rate, reset annually
|
10MW firm
30MW interruptible
|
On February 24, 2011, the Company entered into a hydropower contract extension agreement with the New York Power Authority. Under the terms of this commodity purchase agreement, the Company will be supplied up to a maximum of 40,000 kW of hydropower from the Niagara Power Project to operate its Niagara Falls, New York facility. The hydropower will be supplied at preferential power rates plus market-based delivery charges through September 30, 2021. Under the terms of the contract, the Company has committed to specified employment, power utilization, and capital investment levels, which, if not met, could reduce the Company’s power allocation from the Niagara Power Project.
57
e. Joint Development Supply Agreement
On April 24, 2008, the Company’s subsidiaries, Solsil and GMI, entered into a technology license, joint development and supply agreement with BP Solar International Inc. (BP Solar) for the sale of solar grade silicon. As part of this agreement, BP Solar paid Solsil $10,000 as an advance for research and development services and facilities construction. In accordance with ASC 605.25, revenue associated with this agreement was deferred until specific contract milestone had been achieved, or research development services were successful in reducing manufacturing costs. Revenue would then would be recognized ratably as product was delivered to BP Solar, or, if research and development services were performed, but unsuccessful, deferred until contract expiration. In November 2010, the technology license, joint development and supply agreement was terminated, $9,400 in previously deferred revenue was recognized by the Company, and the Company made a $600 payment to BP Solar.
f. Operating Lease Commitments
The Company leases certain machinery and equipment, automobiles, railcars and office space. For the years ended June 30, 2011, 2010, and 2009, lease expense was $3,173, $2,191, and $2,489, respectively.
Minimum rental commitments under noncancelable operating leases outstanding at June 30, 2011 for the fiscal years of 2012 onward are as follows:
|
2012
|
2013
|
2014
|
2015
|
2016
|
Thereafter
|
||||||
|
$
|
3,297
|
2,929
|
1,772
|
772
|
181
|
—
|
g. Purchase Commitments
The Company has entered into agreements to purchase raw materials utilized in its manufacturing process. Minimum purchase commitments under these agreements for the fiscal years of 2012 onward are as follows:
|
2012
|
2013
|
2014
|
2015
|
2016
|
Thereafter
|
||||||
|
$
|
25,500
|
21,315
|
21,955
|
22,613
|
11,474
|
—
|
For the years ended June 30, 2011, 2010 and 2009, purchases under these contracts totaled $13,484, $8,028, and $8,475 respectively.
(19) Stockholders’ Equity
a. Common Stock
In August 2009, the Company closed on an initial public offering on the NASDAQ Global Select Market of 16,100,000 shares of its common stock at $7.00 per share. Of the shares offered, 5,600,000 new shares were offered by the Company and 10,500,000 existing shares were offered by selling stockholders (which included 2,100,000 shares sold by the selling stockholders pursuant to the exercise of the underwriters’ over-allotment option). Total proceeds of the offering to the Company were $36,456, net of underwriting discounts and commissions totaling $2,744.
b. Preferred Stock
The Company is authorized to issue one million shares of preferred stock with such designations, voting and other rights and preferences as may be determined from time to time by the board of directors. To date, no preferred stock has been issued by the Company.
c. Warrants
In connection with the Company’s initial public offering on the AIM market of the London Stock Exchange on October 3, 2005, the Company sold 33,500,000 units, consisting of one share of the Company’s common stock and two redeemable common stock purchase warrants. Also in connection with this initial public offering, the Company issued an option to purchase 1,675,000 units (individually, UPO) at an exercise price of $7.50 per UPO. Each UPO consists of one share of the Company’s common stock and two redeemable common stock purchase warrants. All of the Company’s warrants had an exercise price of $5.00 per common share and were scheduled to expire on October 3, 2009.
During the year ended June 30, 2008, 699,440 of the warrants issued in connection with the Company’s initial public offering were exercised and an additional 100,262 warrants and 50,131 common shares were issued in connection with a cashless exercise of 67,458 UPOs.
During the year ended June 30, 2009, 166,668 of the warrants issued in connection with the Company’s initial public offering were exercised and an additional 485,505 warrants and 242,753 common shares were issued in connection with a cashless exercise of 282,128 UPOs. Also during the year ended June 30, 2009, the Company executed a warrant exchange program under which it agreed to exchange 5.5 warrants for one share of the Company’s common stock. A total of 19,164,294 warrants were converted to 3,484,417 common shares under this exchange program.
Prior to the expiration date, the Company received exercise notifications from the holders of substantially all of the outstanding warrants and UPOs. The holders of the UPOs exercising their UPOs also immediately exercised the warrants issuable upon the exercise of their UPOs. As a result of all of these exercises, the Company issued 1,775,933 shares of common stock to the former holders of the warrants and UPOs, and no warrants or UPOs remain outstanding at June 30, 2010. The Company received $1,497 in cash with respect to these exercises, and the remainder of the shares were issued on a net, cashless basis. The sales and issuances of shares pursuant to the warrant and UPO exercises were deemed to be exempt from registration under the Securities Act of 1933 by virtue of Section 4(2) pertaining to private offers and sales or Regulation S pertaining to foreign offers and sales.
The Company has accounted for all warrant transactions as a component of stockholders’ equity.
d. Treasury Stock
In December 2008, the Company’s board of directors approved a share repurchase program that authorized the Company to repurchase up to $25,000 of the Company’s common stock during the ensuing six months. The program did not obligate the Company to acquire any particular amount of shares. 1,000 shares were repurchased at $4.00 per share under this program.
58
In connection with the Company’s acquisition of approximately 81% of Solsil in February 2008, 562,867 of the 5,628,657 shares issued to the former shareholders and optionholders of Solsil were placed into escrow pending the attainment of certain milestones. In April 2008, 281,430 of these escrow shares were released based on the satisfaction of certain conditions. Upon expiration of the escrow period in February 2011, the remaining 281,437 escrow shares were returned to the Company and are now included in treasury stock at cost, which is equal to their par value.
e. Noncontrolling Interest
As discussed in note 3, the Company recorded an increase in noncontrolling interest of $27,012 in association with the sale of a 49% membership interest in WVA LLC on November 5, 2009.
f. Dividend
On September 16, 2010, the Company’s board of directors approved a dividend of $0.15 per common share. The dividend, totaling $11,269, was paid on October 29, 2010, to stockholders of record as of October 15, 2010.
(20) Earnings (Loss) Per Share
Basic earnings (loss) per common share are calculated based on the weighted average number of common shares outstanding during the years ended June 30, 2011, 2010, and 2009, respectively. Diluted earnings (loss) per common share assumes the exercise of stock options, the conversion of warrants, and the exercise of UPOs, provided in each case the effect is dilutive.
The reconciliation of the amounts used to compute basic and diluted earnings (loss) per common share for the years ended June 30, 2011, 2010, and 2009 is as follows:
|
2011
|
2010
|
2009
|
||||
|
Basic earnings (loss) per share computation
|
||||||
|
Numerator:
|
||||||
|
Net income (loss) attributable to Globe Specialty Metals, Inc.
|
$
|
52,808
|
34,101
|
(41,981)
|
||
| Denominator: | ||||||
|
Weighted average basic shares outstanding
|
74,924,947
|
73,511,696
|
64,361,828
|
|||
|
Basic earnings (loss) per common share
|
$
|
0.70
|
0.46
|
(0.65)
|
||
|
Diluted earnings (loss) per share computation
|
||||||
|
Numerator:
|
||||||
|
Net income (loss) attributable to Globe Specialty Metals, Inc.
|
$
|
52,808
|
34,101
|
(41,981)
|
||
|
Denominator:
|
||||||
|
Weighted average basic shares outstanding
|
74,924,947
|
73,511,696
|
64,361,828
|
|||
|
Effect of dilutive securities
|
1,699,398
|
1,258,451
|
—
|
|||
|
Weighted average diluted shares outstanding
|
76,624,345
|
74,770,147
|
64,361,828
|
|||
|
Diluted earnings (loss) per common share
|
$
|
0.69
|
0.46
|
(0.65)
|
The following potential common shares were excluded from the calculation of diluted earnings per common share because their effect would be anti-dilutive:
|
2011
|
2010
|
2009
|
|||||
| Stock options |
66,667
|
160,000
|
4,315,000
|
||||
| Warrants |
—
|
—
|
201,453
|
||||
| UPOs |
—
|
—
|
3,976,242
|
||||
|
|
Total |
66,667
|
160,000
|
8,492,695
|
|||
(21) Share-Based Compensation
The Company’s share-based compensation program consists of the Globe Specialty Metals, Inc. 2006 Employee, Director and Consultant Stock Plan (the Stock Plan). The Stock Plan was initially approved by the Company’s stockholders on November 10, 2006, and was amended and approved by the Company’s stockholders on December 6, 2010 to increase by 1,000,000 the number of shares of common stock authorized for issuance under the Stock Plan. The Stock Plan, as amended, provides for the issuance of a maximum of 6,000,000 shares of common stock for the granting of incentive stock options, nonqualified options, stock grants, and share-based awards. Any remaining shares available for grant, but not yet granted, will be carried over and used in the following fiscal years. During the years ended June 30, 2011, 2010, and 2009 share-based compensation awards were limited to the issuance of 7,960 nonqualified stock options, 112,274 restricted stock grants and 4,356 common stock grants.
On April 30, 2009, the Company’s board of directors approved modifications to the terms of 1,037,000 outstanding stock options. The modifications reduced the exercise price of these options to $4.00 per common share, and amended the vesting period of the awards. The modified awards vest and become exercisable in equal one-quarter increments every six months from the date of modification.
At June 30, 2011, there were 1,513,579 shares available for grant. 3,527,250 outstanding incentive stock options, of which 443,250 were exercised through June 30, 2011, vested and became exercisable in equal one-quarter increments every six months from the date of grant or date of modification. 810,000 option grants, of which 533,333 were exercised through June 30, 2011, vest and become exercisable in equal one-third increments on the first, second, and third anniversaries of the date of grant. 7,960 option grants and 3,696 restricted stock grants vested and became exercisable on June 30, 2011. 108,578 restricted stock grants vest and become exercisable on November 13, 2020. 21,500 option grants and 4,356 common stock grants were issued as immediately vested at the date of grant. All option grants have maximum contractual terms ranging from 5 to 10 years.
59
A summary of the changes in options outstanding under the Stock Plan for the years ended June 30, 2011, 2010, and 2009 is presented below:
|
Weighted-
|
||||||||||||||||
|
Average
|
||||||||||||||||
|
Weighted-
|
Remaining
|
Aggregate
|
||||||||||||||
|
Number of
|
Average
|
Contractual
|
Intrinsic
|
|||||||||||||
|
Options
|
Exercise Price
|
Term in Years
|
Value
|
|||||||||||||
|
Outstanding as of June 30, 2008
|
1,635,000
|
$
|
13.46
|
|||||||||||||
|
Granted
|
2,746,000
|
5.10
|
||||||||||||||
|
Exercised
|
—
|
—
|
||||||||||||||
|
Forfeited and expired
|
(66,000)
|
20.84
|
||||||||||||||
|
Outstanding as of June 30, 2009
|
4,315,000
|
$
|
5.12
|
4.83
|
$
|
5,095
|
||||||||||
|
Outstanding as of June 30, 2009
|
4,315,000
|
$
|
5.12
|
|||||||||||||
|
Granted
|
60,000
|
11.40
|
||||||||||||||
|
Exercised
|
(98,558)
|
6.25
|
||||||||||||||
|
Forfeited and expired
|
(10,000)
|
4.00
|
||||||||||||||
|
Outstanding as of June 30, 2010
|
4,266,442
|
$
|
5.18
|
3.89
|
$
|
23,509
|
||||||||||
|
Outstanding as of June 30, 2010
|
4,266,442
|
$
|
5.18
|
|||||||||||||
|
Granted
|
7,960
|
16.23
|
||||||||||||||
|
Exercised
|
(878,025)
|
6.28
|
||||||||||||||
|
Forfeited and expired
|
(6,250)
|
4.00
|
||||||||||||||
|
Outstanding as of June 30, 2011
|
3,390,127
|
$
|
4.93
|
3.18
|
$
|
59,643
|
||||||||||
|
Exercisable as of June 30, 2011
|
3,335,876
|
$
|
4.64
|
3.13
|
$
|
59,401
|
||||||||||
The weighted average grant date fair value of stock options granted during the years ended June 30, 2011, 2010, and 2009 was $7.34, $4.46, and $2.05, respectively. The weighted average per share fair value of stock option grants outstanding at June 30, 2011 is $2.73.
A summary of the Company’s nonvested options as of June 30, 2011, and changes during the year ended June 30, 2011 is presented below:
|
Weighted-Average
|
|||||||||||
|
Number of
|
Grant-Date Fair
|
||||||||||
|
Options
|
Value, as Modified
|
||||||||||
|
Nonvested as of June 30, 2010
|
1,857,667
|
$
|
1.74
|
||||||||
| Granted |
7,960
|
7.54
|
|||||||||
| Vested |
(1,805,126)
|
1.68
|
|||||||||
|
Forfeited and expired
|
(6,250)
|
1.48
|
|||||||||
|
Nonvested as of June 30, 2011
|
54,251
|
$
|
5.04
|
||||||||
The Company estimates the fair value of grants using the Black-Scholes option pricing model. The following assumptions were used to estimate the fair value of stock option awards granted during the years ended June 30, 2011, 2010, and 2009:
|
2011
|
2010
|
2009
|
|||
|
Risk-free interest rate
|
0.72%
|
1.26% to 1.54%
|
1.37% to 3.47%
|
||
|
Expected dividend yield
|
—
|
—
|
—
|
||
|
Expected volatility
|
73.20
|
69.10 to 75.20
|
50.00 to 67.70
|
||
|
Expected forfeiture rate
|
—
|
—
|
—
|
||
|
Expected term (years)
|
2.79
|
2.50 to 3.43
|
3.13 to 6.25
|
The following assumptions were used to estimate the fair value of stock option awards modified on April 30, 2009:
|
Risk-free interest rate
|
1.45%
|
|
Expected dividend yield
|
—
|
|
Expected volatility
|
67.40%
|
|
Expected forfeiture rate
|
—
|
|
Expected term (years)
|
3.13
|
The risk-free interest rate is based on the yield of zero coupon U.S. Treasury bonds with terms similar to the expected term of the options. The expected dividend yield for grants is zero given the Company’s limited history of dividend issuances and the uncertainty of any future dividend amounts, if any. Since there is limited historical trading data related to the Company’s common stock, the expected volatility over the term of the options is estimated using the historical volatilities of similar companies. Given that the options granted are under a new plan and there is relatively no historical data, the expected forfeiture rate is zero, and the expected term is the average of the vesting period and contractual term.
The weighted average per share fair value of stock option grants outstanding at June 30, 2011, 2010, and 2009 was $2.73, $3.89, and $4.13, respectively.
60
For the years ended June 30, 2011, 2010, and 2009, share-based compensation expense was $4,462 ($2,407 after tax), $5,712 ($3,082 after tax), and $6,395 ($3,449 after tax), respectively. The expense is reported within selling, general, and administrative expenses.
As of June 30, 2011, the Company has unearned compensation expense of $116, before income taxes, related to nonvested stock option awards. The unrecognized compensation expense is expected to be recognized over the following periods ending on June 30:
|
2012
|
2013
|
2014
|
2015
|
2016
|
||||||
|
Share-based compensation (pretax)
|
$
|
114
|
2
|
—
|
—
|
—
|
The total fair value of shares vested during the years ended June 30, 2011, 2010, and 2009 was $8,397, $10,323, and $2,488, respectively. As previously mentioned, certain outstanding stock option grants were modified on April 30, 2009. As a result, the vesting period on the modified awards was reset, and certain formerly vested options are no longer vested.
It is the Company’s policy to issue new shares to satisfy the requirements of its share-based compensation plan. The Company does not expect to repurchase shares in the future to support its share-based compensation plan.
In addition to share-based awards issued under the Stock Plan, the Company issued 35,225 restricted stock units on January 1, 2011 under the terms of the Company’s executive bonus plans. The restricted stock units proportionally vest over three years, but are not delivered until the end of the third year. The Company will settle these awards by cash transfer, based on the Company’s stock price of the date of such transfer. For the year ended June 30, 2011, share-based compensation expense for these restricted stock units was $130 ($70 after tax). The $130 liability associated with these restricted stock units is included in accrued expenses and other current liabilities at June 30, 2011.
(22) Fair Value Measures
Effective July 1, 2009, the Company completed its adoption of ASC 820, which establishes a fair value hierarchy for disclosure of fair value measurements. The fair value framework requires the categorization of assets and liabilities into three levels based upon the assumptions (inputs) used to value the assets or liabilities. Level 1 provides the most reliable measure of fair value, whereas Level 3 generally requires significant management judgment. The three levels are defined as follows:
Level 1 — Quoted prices in active markets for identical assets or liabilities.
Level 2 — Observable inputs other than those included in Level 1. For example, quoted prices for similar assets or liabilities in active markets or quoted prices for identical assets or liabilities in inactive markets.
Level 3 — Unobservable inputs reflecting management’s own assumptions about the inputs used in pricing the asset or liability. For example, cash flow modeling using inputs based on management’s assumptions.
The Company does not have any assets that are required to be remeasured at fair value at June 30, 2011. The following table summarizes liabilities measured at fair value on a recurring basis at June 30, 2011:
|
Total
|
Level 1
|
Level 2
|
Level 3
|
|||||||||||
|
Interest rate derivatives
|
$
|
320
|
—
|
320
|
—
|
|||||||||
| Power hedge |
110
|
—
|
110
|
—
|
||||||||||
|
Restricted stock units
|
130
|
130
|
— | — | ||||||||||
| Total |
$
|
560
|
130
|
430
|
—
|
|||||||||
The Company does not have any assets that are required to be remeasured at fair value at June 30, 2010. The following table summarizes liabilities measured at fair value on a recurring basis at June 30, 2010:
|
Total
|
Level 1
|
Level 2
|
Level 3
|
|||||||
|
Interest rate derivatives
|
$
|
476
|
—
|
476
|
—
|
|||||
|
Foreign exchange forward contracts
|
77
|
—
|
77
|
—
|
||||||
| Power hedge |
243
|
—
|
243
|
—
|
||||||
| Total |
$
|
796
|
—
|
796
|
—
|
|||||
Derivative liabilities relate to the interest rate cap and interest rate swap agreements, the foreign exchange forward contracts, and power hedge agreement summarized in note 15 (Derivative Instruments). Fair values are determined by independent brokers using quantitative models based on readily observable market data.
The fair value of restricted stock units is based on quoted market prices of the Company stock at the end of each reporting period.
See note 12 (Debt) for information regarding the fair value of our outstanding debt.
(23) Related Party Transactions
From time to time, the Company enters into transactions in the normal course of business with related parties. Management believes that such transactions are at arm’s length and for terms that would have been obtained from unaffiliated third parties.
61
A current and a former member of the board of directors are affiliated with Marco International and Marco Realty. During the years ended June 30, 2011, 2010, and 2009, the Company:
|
|
•
|
Paid Marco Realty $0, $166, and $207, respectively, to rent office space for its corporate headquarters in New York City, New York.
|
|
|
•
|
Entered into agreements with Marco International to purchase graphitized carbon electrodes. Marco International billed $24,731, $21,962, and $0, respectively, under these agreements. At June 30, 2011 and 2010, payables to Marco International under these agreements totaled $2,952 and $8,162, respectively.
|
|
|
•
|
Entered into agreements to purchase rare earth materials from Marco International. Purchases under this agreement totaled $1,001, $0, and $0, respectively. At June 30, 2011 and 2010, payables to Marco International under these agreements totaled $1,001 and $0, respectively.
|
|
|
•
|
Entered into agreements to purchase sodium carbonate from Marco International. Purchases under this agreement totaled $0, $0, and $126, respectively.
|
|
|
•
|
Entered into an agreement to sell ferrosilicon to Marco International. Net sales were $895, $590, and $1,286, respectively, under this agreement.
|
|
|
•
|
Entered into agreements to sell calcium silicon powder to Marco International. Net sales under these agreements totaled $524, $0, and $0, respectively.
|
The Company is affiliated with Norchem through its 50.0% equity interest. During the years ended June 30, 2011, 2010, and 2009, the Company sold Norchem product valued at $5,575, $4,065, and $3,531, respectively. At June 30, 2011 and 2010, receivables from Norchem totaled $576 and $747, respectively.
Prior to our Yonvey business combination, Yonvey’s predecessor had entered into a lending agreement with the remaining minority stockholder. At June 30, 2011 and 2010, $1,086 and $849, respectively, remained payable to Yonvey from this related party.
(24) Operating Segments
Operating segments are based upon the Company’s management reporting structure and include the following six reportable segments:
|
|
•
|
GMI — a manufacturer of silicon metal and silicon-based alloys located in the United States.
|
|
|
•
|
Globe Metais — a distributor of silicon metal manufactured in Brazil. This segment includes the historical Brazilian manufacturing operations, comprised of a manufacturing plant in Breu Branco, mining operations, and forest reserves, which were sold on November 5, 2009.
|
|
|
•
|
Globe Metales — a manufacturer of silicon-based alloys located in Argentina.
|
|
|
•
|
Solsil — a manufacturer of upgraded metallurgical grade silicon metal located in the United States.
|
|
|
•
|
Corporate — general corporate expenses, investments, and related investment income.
|
|
|
•
|
Other — operations that do not fit into the above reportable segments and are immaterial for purposes of separate disclosure. The operating segments include Yonvey’s electrode production operations and certain other distribution operations for the sale of silicon metal and silicon-based alloys.
|
Each of our reportable segments distributes its products in both its country of domicile, as well as to other international customers. The following presents the Company’s consolidated net sales by product line for the years ended:
|
2011
|
2010
|
2009
|
|||||
| Silicon metal and silicon-based alloys |
$
|
584,206
|
444,855
|
398,927
|
|||
| Other, primarily by-products |
57,657
|
27,803
|
27,364
|
||||
|
|
Total |
$
|
641,863
|
472,658
|
426,291
|
||
a. Segment Data
Summarized financial information for our reportable segments as of, and for, the years ended June 30, 2011, 2010, and 2009 are shown in the following tables:
|
2011
|
||||||||||||||||
|
Net Sales
|
Depreciation and Amortization
|
Operating Income (Loss)
|
Interest Income
|
Interest Expense (1)
|
Income (Loss) Before Income Taxes
|
Total Assets
|
Capital Expenditures
|
|||||||||
|
GMI
|
$
|
549,418
|
20,430
|
103,685
|
5
|
1,775
|
102,240
|
384,495
|
31,061
|
|||||||
|
Globe Metais
|
15,421
|
-
|
397
|
-
|
-
|
398
|
294
|
-
|
||||||||
|
Globe Metales
|
62,321
|
1,634
|
13,197
|
-
|
1,050
|
12,669
|
82,751
|
1,023
|
||||||||
|
Solsil
|
9,420
|
488
|
8,670
|
-
|
-
|
8,670
|
29,191
|
165
|
||||||||
|
Corporate
|
-
|
426
|
(29,606)
|
816
|
470
|
(30,086)
|
403,177
|
1,226
|
||||||||
|
Other
|
32,325
|
2,077
|
31
|
1
|
511
|
428
|
43,317
|
1,564
|
||||||||
|
Eliminations
|
(27,042)
|
-
|
(1,604)
|
(608)
|
(608)
|
(1,605)
|
(264,956)
|
-
|
||||||||
|
$
|
641,863
|
25,055
|
94,770
|
214
|
3,198
|
92,714
|
678,269
|
35,039
|
||||||||
62
|
2010
|
||||||||||||||||
|
Net Sales
|
Depreciation and Amortization
|
Operating Income (Loss)
|
Interest Income
|
Interest Expense (1)
|
Income (Loss) Before Income Taxes
|
Total Assets
|
Capital Expenditures
|
|||||||||
|
GMI
|
$
|
358,279
|
15,812
|
41,126
|
42
|
2,368
|
39,107
|
324,680
|
18,971
|
|||||||
|
Globe Metais
|
62,126
|
776
|
5,263
|
178
|
525
|
8,579
|
8,192
|
208
|
||||||||
|
Globe Metales
|
48,959
|
1,820
|
10,073
|
-
|
1,090
|
10,069
|
71,790
|
996
|
||||||||
|
Solsil
|
20
|
508
|
(1,375)
|
-
|
30
|
(1,405)
|
30,526
|
(1,410)
|
||||||||
|
Corporate
|
-
|
122
|
2,815
|
619
|
317
|
2,836
|
415,184
|
1,273
|
||||||||
|
Other
|
12,557
|
1,634
|
(4,273)
|
6
|
569
|
(5,036)
|
41,508
|
2,863
|
||||||||
|
Eliminations
|
(9,283)
|
-
|
657
|
(527)
|
(527)
|
657
|
(284,735)
|
-
|
||||||||
|
$
|
472,658
|
20,672
|
54,286
|
318
|
4,372
|
54,807
|
607,145
|
22,901
|
||||||||
|
2009
|
||||||||||||||||
|
Net Sales
|
Depreciation and Amortization
|
Operating Income (Loss)
|
Interest Income
|
Interest Expense (1)
|
Income (Loss) Before Income Taxes
|
Total Assets
|
Capital Expenditures
|
|||||||||
|
GMI
|
$
|
277,466
|
12,300
|
47,347
|
60
|
2,688
|
46,627
|
230,463
|
29,424
|
|||||||
|
Globe Metais
|
95,096
|
2,588
|
14,602
|
470
|
2,061
|
15,065
|
74,975
|
3,466
|
||||||||
|
Globe Metales
|
50,731
|
2,401
|
14,949
|
-
|
1,456
|
13,998
|
64,064
|
481
|
||||||||
|
Solsil
|
2,202
|
1,171
|
(79,797)
|
-
|
(154)
|
(79,643)
|
31,834
|
11,244
|
||||||||
|
Corporate
|
-
|
38
|
(21,397)
|
477
|
334
|
(20,771)
|
287,995
|
138
|
||||||||
|
Other
|
18,140
|
1,309
|
(6,386)
|
3
|
843
|
(6,857)
|
39,844
|
6,684
|
||||||||
|
Eliminations
|
(17,344)
|
-
|
(2,194)
|
(281)
|
(281)
|
(2,194)
|
(255,895)
|
-
|
||||||||
|
$
|
426,291
|
19,807
|
(32,876)
|
729
|
6,947
|
(33,775)
|
473,280
|
51,437
|
||||||||
1 — Net of capitalized interest.
The accounting policies of our operating segments are the same as those disclosed in note 2 (Summary of Significant Accounting Policies). We evaluate segment performance principally based on operating income (loss). Intersegment net sales are not material.
b. Geographic Data
Net sales are attributed to geographic regions based upon the location of the selling unit. Net sales by geographic region for the years ended June 30, 2011, 2010, and 2009 consist of the following:
|
2011
|
2010
|
2009
|
|||||
|
United States
|
$
|
574,181
|
407,455
|
331,095
|
|||
|
Argentina
|
54,695
|
42,101
|
41,045
|
||||
|
Brazil
|
—
|
12,820
|
42,923
|
||||
|
China
|
899
|
592
|
3,602
|
||||
|
Poland
|
12,088
|
9,690
|
7,626
|
||||
|
Total
|
$
|
641,863
|
472,658
|
426,291
|
|||
Long-lived assets by geographical region at June 30, 2011, 2010, and 2009 consist of the following:
|
2011
|
2010
|
2009
|
|||||
|
United States
|
$
|
224,556
|
211,876
|
180,392
|
|||
|
Argentina
|
31,054
|
31,665
|
32,515
|
||||
|
Brazil
|
-
|
-
|
29,760
|
||||
|
China
|
27,524
|
27,428
|
27,060
|
||||
|
Poland
|
823
|
800
|
839
|
||||
|
Total
|
$
|
283,957
|
271,769
|
270,566
|
|||
Long-lived assets consist of property, plant, and equipment, net of accumulated depreciation and amortization, and goodwill and other intangible assets.
63
c. Major Customer Data
The following is a summary of the Company’s major customers and their respective percentages of consolidated net sales for the years ended June 30, 2011, 2010, and 2009:
|
2011
|
2010
|
2009
|
||||
| Dow Corning |
17%
|
30%
|
18%
|
|||
| All other customers |
83
|
70
|
82
|
|||
|
|
Total |
100%
|
100%
|
100%
|
||
The majority of sales to Dow Corning for the year ended June 30, 2011 are associated with Dow Corning’s 49% ownership interest in WVA LLC. In addition, the Company maintained a four year arrangement in which Dow Corning was to purchase 30,000 metric tons of silicon metal per calendar year through December 31, 2010. This contract was amended in November 2008 to provide for the sale of an additional 17,000 metric tons of silicon metal to be purchased in calendar year 2009. The contract was further amended in connection with the Dow Corning transactions discussed in note 3 to reduce the amount required to be sold in calendar year 2010 to 20,000 metric tons of silicon metal. In December 2010, the Company agreed to pay $4,276 to Dow Corning to settle certain remaining sales obligations under this contract. The settlement cost was recorded in cost of goods sold in December 2010. Sales to Dow Corning are included in the GMI segment.
64
(25) Parent Company Condensed Financial Information
As discussed in note 12 (Debt), certain of the Company’s subsidiaries have revolving credit agreements outstanding as of June 30, 2011 and 2010, which places restrictions on dividend and other equity distributions. As their restricted net assets represent a significant portion of the Company’s consolidated net assets, and the Company has guaranteed certain obligations of its operating subsidiaries, the Company is presenting the following parent company only condensed financial information:
|
GLOBE SPECIALTY METALS, INC.
|
|||||||
|
(Parent Company Only)
|
|||||||
|
Condensed Balance Sheets
|
|||||||
|
June 30, 2011 and 2010
|
|||||||
|
2011
|
2010
|
||||||
|
Assets
|
|||||||
|
Current assets:
|
|||||||
|
Cash and cash equivalents
|
$
|
87,581
|
72,491
|
||||
|
Due from affiliates
|
14,672
|
13,470
|
|||||
|
Prepaid expenses and other current assets
|
21,755
|
14,670
|
|||||
|
Total current assets
|
124,008
|
100,631
|
|||||
|
Property, plant, and equipment, net of accumulated depreciation and amortization
|
1,024
|
1,370
|
|||||
|
Investments in affiliates
|
410,657
|
359,719
|
|||||
|
Deferred tax assets
|
-
|
7,657
|
|||||
|
Due from affliliates
|
5,829
|
11,568
|
|||||
|
Other assets
|
1,199
|
520
|
|||||
|
Total assets
|
$
|
542,717
|
481,465
|
||||
|
Liabilities and Stockholders’ Equity
|
|||||||
|
Current liabilities:
|
|||||||
|
Accounts payable
|
$
|
617
|
281
|
||||
|
Due to affiliates
|
8,545
|
11,501
|
|||||
|
Accrued expenses and other current liabilities
|
7,637
|
6,893
|
|||||
|
Total current liabilities
|
16,799
|
18,675
|
|||||
|
Long-term liabilities:
|
|||||||
|
Deferred tax liabilities
|
5,602
|
-
|
|||||
|
Other long-term liabilities
|
5,040
|
3,961
|
|||||
|
Total liabilities
|
27,441
|
22,636
|
|||||
|
Stockholders’ equity:
|
|||||||
|
Common stock, $0.0001 par value. Authorized, 150,000,000 shares;
|
|||||||
|
issued, 75,289,614 and 74,421,826 shares at June 30, 2011 and 2010, respectively
|
8
|
7
|
|||||
|
Additional paid-in capital
|
399,900
|
390,354
|
|||||
|
Retained earnings
|
80,300
|
38,761
|
|||||
|
Accumulated other comprehensive loss
|
(2,995)
|
(4,438)
|
|||||
|
Treasury stock at cost, 282,437 and 1,000 shares at
|
|
|
|||||
|
June 30, 2011 and 2010, respectively
|
(4) | (4) | |||||
|
Total Globe Specialty Metals, Inc. stockholders' equity
|
477,209
|
424,680
|
|||||
|
Noncontrolling interest
|
38,067
|
34,149
|
|||||
|
Total stockholders’ equity
|
515,276
|
458,829
|
|||||
|
Total liabilities and stockholders’ equity
|
$
|
542,717
|
481,465
|
||||
65
|
GLOBE SPECIALTY METALS, INC.
|
|||||||||||
|
(Parent Company Only)
|
|||||||||||
|
Condensed Statements of Operations
|
|||||||||||
|
Years ended June 30, 2011, 2010, and 2009
|
|||||||||||
|
2011
|
2010
|
2009
|
|||||||||
|
Equity in income (loss) from operating subsidiaries, net of tax
|
$
|
45,007
|
50,929
|
(43,842)
|
|||||||
|
Dividend income from operating subsidiaries
|
29,623
|
5,895
|
12,769
|
||||||||
|
Selling, general, and administrative expenses
|
(23,397)
|
(18,393)
|
(22,786)
|
||||||||
|
Restructuring charges
|
-
|
-
|
(95)
|
||||||||
| Interest income |
745
|
540
|
224
|
||||||||
|
Interest expense
|
(470)
|
(317)
|
(334)
|
||||||||
|
Foreign exchange (loss) gain
|
(613)
|
(284)
|
644
|
||||||||
| Other income |
5
|
33
|
18
|
||||||||
|
Income (loss) before benefit from (provision for) income taxes
|
50,900
|
38,403
|
(53,402)
|
||||||||
|
Benefit from (provision for) income taxes
|
5,826
|
(4,135)
|
8,018
|
||||||||
|
Net income (loss)
|
56,726
|
34,268
|
(45,384)
|
||||||||
|
(Income) losses attributable to noncontrolling interest, net of tax
|
(3,918)
|
(167)
|
3,403
|
||||||||
|
Net income (loss) attributable to Globe Specialty Metals, Inc.
|
$
|
52,808
|
34,101
|
(41,981)
|
|||||||
66
|
GLOBE SPECIALTY METALS, INC.
|
||||||||||||
|
(Parent Company Only)
|
||||||||||||
|
Condensed Statements of Cash Flows
|
||||||||||||
|
Years ended June 30, 2011, 2010, and 2009
|
||||||||||||
|
2011
|
2010
|
2009
|
||||||||||
|
Cash flows from operating activities:
|
||||||||||||
| Net income (loss) |
$
|
56,726
|
34,268
|
(45,384)
|
||||||||
|
Adjustments to reconcile net income (loss) income to net cash (used in) provided by operating activities:
|
||||||||||||
|
Equity in (income) loss from operating subsidiaries
|
(45,007)
|
(50,929)
|
43,842
|
|||||||||
|
Depreciation and amortization
|
404
|
122
|
38
|
|||||||||
|
Share-based compensation
|
4,332
|
5,712
|
6,395
|
|||||||||
|
Deferred taxes
|
900
|
(1,188)
|
(3,174)
|
|||||||||
|
Changes in operating assets and liabilities:
|
||||||||||||
|
Due from affiliates
|
4,537
|
(11,474)
|
(2,392)
|
|||||||||
|
Prepaid expenses and other current assets
|
(4,391)
|
(3,028)
|
(5,336)
|
|||||||||
|
Accounts payable
|
374
|
157
|
(937)
|
|||||||||
|
Due to affiliates
|
(2,956)
|
3,123
|
4,443
|
|||||||||
|
Accrued expenses and other current liabilities
|
481
|
(661)
|
1,315
|
|||||||||
|
Other operating cash flows
|
1,381
|
(28,757)
|
2,142
|
|||||||||
|
Net cash (used in) provided by operating activities
|
16,781
|
(52,655)
|
952
|
|||||||||
|
Cash flows from investing activities:
|
||||||||||||
| Capital expenditures |
(121)
|
(1,273)
|
(138)
|
|||||||||
| Sale of businesses |
2,500
|
77,691
|
-
|
|||||||||
|
Acquisition of businesses
|
-
|
(54,957)
|
-
|
|||||||||
|
Working capital adjustments from acquisition of businesses
|
1,985
|
-
|
-
|
|||||||||
|
Held-to-maturity treasury securities
|
-
|
-
|
2,987
|
|||||||||
|
Net investments in operating subsidiaries
|
-
|
(49,882)
|
(32,466)
|
|||||||||
|
Loans to operating subsidiaries
|
-
|
(11,120)
|
-
|
|||||||||
|
Notes receivable from Solsil, Inc.
|
-
|
-
|
-
|
|||||||||
|
Other investing activities
|
-
|
-
|
-
|
|||||||||
|
Net cash used in investing activities
|
4,364
|
(39,541)
|
(29,617)
|
|||||||||
|
Cash flows from financing activities:
|
||||||||||||
| Dividend payment |
(11,269)
|
-
|
-
|
|||||||||
|
Sale of noncontrolling interest
|
-
|
97,917
|
-
|
|||||||||
|
Sale of common stock
|
-
|
36,456
|
-
|
|||||||||
|
Proceeds from warrants exercised
|
-
|
1,287
|
833
|
|||||||||
|
Proceeds from UPOs exercised
|
-
|
210
|
-
|
|||||||||
|
Proceeds from stock option exercises
|
5,214
|
616
|
-
|
|||||||||
|
Other financing activities
|
-
|
(1,387)
|
(1,185)
|
|||||||||
|
Net cash provided by (used in) financing activities
|
(6,055)
|
135,099
|
(352)
|
|||||||||
|
Net increase (decrease) in cash and cash equivalents
|
15,090
|
42,903
|
(29,017)
|
|||||||||
|
Cash and cash equivalents at beginning of year
|
72,491
|
29,588
|
58,605
|
|||||||||
|
Cash and cash equivalents at end of year
|
$
|
87,581
|
72,491
|
29,588
|
||||||||
67
|
(26)
|
Subsequent Events
|
On July 28, 2011, the Company completed its acquisition of certain coal mining properties and operations pursuant to Membership Interest Purchase Agreements and Purchase Agreement dated May 27, 2011 (the Purchase Agreements) for $73.2 million plus an additional $6.8 million that could be payable pursuant to an earn-out payment upon the achievement of certain operational conditions. The Company financed the acquisition with $55.0 million of bank debt.
The Company has evaluated subsequent events through the date these financial statements were issued.
|
(27)
|
Unaudited Quarterly Results
|
Unaudited quarterly results for the years ended June 30, 2011 and 2010 were as follows:
|
First
|
Second
|
Third
|
Fourth
|
|||||||||||
|
Quarter
|
Quarter
|
Quarter
|
Quarter
|
|||||||||||
|
(Unaudited)
|
||||||||||||||
|
2011:
|
||||||||||||||
| Net sales |
$
|
137,352
|
155,775
|
172,802
|
175,934
|
|||||||||
|
Operating income
|
8,228
|
20,229
|
36,753
|
29,560
|
||||||||||
|
Net income attributable to Globe Specialty Metals, Inc.
|
2,162
|
11,708
|
23,393
|
15,545
|
||||||||||
|
Basic earnings per common share
|
0.03
|
0.16
|
0.31
|
0.21
|
||||||||||
|
Diluted earnings per common share
|
0.03
|
0.15
|
0.30
|
0.20
|
||||||||||
|
2010:
|
||||||||||||||
| Net sales |
$
|
105,458
|
108,278
|
112,486
|
146,436
|
|||||||||
|
Operating income
|
12,326
|
30,466
|
3,307
|
8,187
|
||||||||||
|
Net income attributable to Globe Specialty Metals, Inc.
|
8,442
|
18,534
|
516
|
6,609
|
||||||||||
|
Basic earnings per common share
|
0.12
|
0.25
|
0.01
|
0.09
|
||||||||||
|
Diluted earnings per common share
|
0.12
|
0.25
|
0.01
|
0.09
|
||||||||||
Exhibit Index
| Exhibit | |||
| Number | Description of Document | ||
|
2
|
.1
|
Purchase Agreement, dated as of November 5, 2009, by and between Dow Corning Corporation and GSM (5) | |
|
2
|
.2
|
Purchase and Sale Agreement dated as of March 26, 2010, by and among Globe Metals Enterprises, Inc., Core Metals Group Holdings LLC and each of the Sellers named therein (6) | |
|
2
|
.3
|
Membership Interest Purchase Agreement dated May 27, 2011 by and among NGPC Asset Holdings II, LP,NGP Capital Resources Company and Globe BG, LLC relating to Alden Resources Inc. (7) | |
|
2
|
.4
|
Membership Interest Purchase Agreement dated May 27, 2011 by and among NGPC Asset Holdings II, LP,NGP Capital Resources Company and Globe BG, LLC relating to Gatliff Services, Inc. (7) | |
|
2
|
.5
|
Purchase Agreement dated May 27, 2011 by and among NGP Capital Resources Company, Globe BG, LLC and Globe Specialty Metals, Inc. regarding The Overriding Royalty Interests (7) | |
| Articles of Incorporation and Bylaws | |||
|
3
|
.1
|
Amended and Restated Certificate of Incorporation (1) | |
|
3
|
.2
|
Certificate of Amendment to the Amended and Restated Certificate of Incorporation (1) | |
|
3
|
.3
|
Amended and Restated Bylaws (2) | |
| Instruments Defining the Rights of Security Holders, Including Indentures | |||
|
4
|
.1
|
Third Amended and Restated Credit Agreement dated as of March 30, 2011, by and among GMI, Tennessee Alloys Company LLC, and GSM Sales, Inc., as borrowers, Alabama Sand and Gravel, Inc. and Laurel Ford Resources, Inc., as subsidiary guarantors, GSM, as Parent, the lender parties thereto, and Societe Generale, as Administrative Agent, Issuing Bank, Swingline Lender and Collateral Agent and SG Americas Securities LLC, as Sole Arranger (3) | |
| We are a party to other instruments defining the rights of holders of long-term debt. No such instrument authorizes an amount of securities in excess of 10 percent of the total assets of the company and its subsidiaries on a consolidated basis. We agree to furnish a copy of each such instrument to the Commission on request. | |||
| Material Contracts | |||
|
10
|
.1
|
Amended and Restated Limited Liability Company Agreement of WVA Manufacturing, LLC, dated as of November 5, 2009, by and among WVA Manufacturing, LLC, GSM, GSM Alloys I, Inc., GSM Alloys II, Inc., Dow Corning Enterprises, Inc. and Dow Corning Corporation. (5) | |
|
10
|
.2
|
Output and Supply Agreement, dated as of November 5, 2009, by and among WVA Manufacturing, LLC, Dow Corning Corporation, Globe Metallurgical Inc., and GSM. (5) | |
| Management Contracts and Compensatory Plans | |||
|
10
|
.3
|
2006 Employee, Director and Consultant Stock Option Plan (1) | |
|
10
|
.4
|
Amendments to 2006 Employee, Director and Consultant Stock Option Plan (8) | |
|
10
|
.5
|
2010 Annual Executive Bonus Plan (9) | |
|
10
|
.6
|
Chief Financial Officer and Chief Legal Officer Annual Bonus Plan (10) | |
|
10
|
.7
|
Framework for the 2011 Annual Executive Long Term Incentive Plan (11) | |
|
10
|
.8
|
Employment Agreement, dated January 27, 2011, between GSM and Alan Kestenbaum (11) | |
|
10
|
.9
|
Employment Agreement, dated May 26, 2008, between GSM and Jeff Bradley (1) | |
|
10
|
.10
|
Amendment to Employment Agreement, dated October 27, 2010, between GSM and Jeff Bradley (8) | |
|
10
|
.11
|
Employment Agreement, dated July 5, 2011, between GSM and Jeff Bradley † | |
|
10
|
.12
|
Employment Agreement, dated September 21, 2008, between GSM and Malcolm Appelbaum (4) | |
|
10
|
.13
|
Employment Agreement, dated June 20, 2008, between GSM and Stephen Lebowitz (1) | |
|
10
|
.14
|
Amendment to Employment Agreement, dated October 27, 2010, between GSM and Stephen Lebowitz (8) | |
|
|
|||
|
21
|
.1
|
Subsidiaries (9) | |
|
31
|
.1
|
Certification of Principal Executive Officer Pursuant to Section 302 of the Sarbanes-Oxley Act of 2002 † | |
|
31
|
.2
|
Certification of the Principal Financial Officer Pursuant to Section 302 of the Sarbanes-Oxley Act of 2002 † | |
|
32
|
.1
|
Certification of the Principal Executive Officers and Principal Financial Officer Pursuant to 18 U.S.C. 1350, as adopted Pursuant to Section 906 of the Sarbanes-Oxley Act of 2002 † | |
________________
|
†
|
Filed herewith.
|
|
1
|
Incorporated by reference to the exhibit with the same designation filed with the Company’s registration statement on Form S-1 (Registration No. 333-152513) filed on July 25, 2008.
|
|
2
|
Incorporated by reference to the exhibit with the same designation filed with Amendment No. 1 to the Company’s registration statement on Form S-1 (Registration No. 333-152513) filed on November 4, 2008.
|
|
3
|
Incorporated by reference to exhibit 10.1 filed with the Company’s Form 8-K filed on April 5, 2011.
|
|
4
|
Incorporated by reference to the exhibit with the same designation filed with Amendment No. 3 to the Company’s registration statement Form S-1 (Registration Statement No. 333-152513) filed on July 16, 2009.
|
|
5
|
Incorporated by reference to the exhibit with the same designation filed with the Company’s Form 8-K filed on November 12, 2009.
|
|
6
|
Incorporated by reference to the exhibit with the same designation filed with the Company’s Form 8-K filed on April 1, 2010.
|
|
7
|
Incorporated by reference to exhibits to the Company’s Form 8-K filed on June 3, 2011.
|
|
8
|
Incorporated by reference to exhibits to the Company’s Form 10-Q filed on February 11, 2011.
|
|
9
|
Incorporated by reference to exhibit to the Company’s Form 10-K filed on September 28, 2010.
|
|
10
|
Incorporated by reference to exhibit to the Company’s Form 10-Q filed on November 12, 2010.
|
|
11
|
Incorporated by reference to exhibits to the Company’s Form 10-Q filed on May 12, 2011.
|
69