Attached files
| file | filename |
|---|---|
| 8-K - FORM 8-K - Genpact LTD | d864834d8k.htm |
| EX-99.1 - EX-99.1 - Genpact LTD | d864834dex991.htm |
 February 4, 2015
Ticker (NYSE: G)
Genpact
Q4 and FY 2014 Earnings Presentation
Exhibit 99.2 |
 DESIGN
•
TRANSFORM
•
RUN
2
©
2015 Copyright Genpact. All Rights Reserved.
These
materials
contain
certain
statements
concerning
our
future
growth
prospects
and
forward-looking
statements,
as
defined
in
the
safe
harbor
provisions
of
the
U.S.
Private
Securities
Litigation
Reform
Act
of
1995.
These
statements
are
based
on
Genpact’s
current
expectations
and
beliefs,
as
well
as
a
number
of
assumptions
concerning
future
events.
These
statements
involve
a
number
of
risks,
uncertainties
and
other
factors
that
could
cause
actual
results
to
differ
materially
from
those
in
such
forward-looking
statements.
These
risks
and
uncertainties
include
but
are
not
limited
to
a
slowdown
in
the
economies
and
sectors
in
which
our
clients
operate,
a
slowdown
in
the
BPO
and
IT
Services
sectors,
the
risks
and
uncertainties
arising
from
our
past
and
future
acquisitions,
our
ability
to
convert
bookings
to
revenues,
our
ability
to
manage
growth,
factors
which
may
impact
our
cost
advantage,
wage
increases,
our
ability
to
attract
and
retain
skilled
professionals,
risks
and
uncertainties
regarding
fluctuations
in
our
earnings,
dependence
on
tax
legislation,
general
economic
conditions
affecting
our
industry
as
well
as
other
risks
detailed
in
our
reports
filed
with
the
U.S.
Securities
and
Exchange
Commission
(the
“SEC”),
including
the
Company’s
Annual
Report
on
Form
10-K.
These
filings
are
available
at
www.sec.gov
or
on
the
investor
relations
section
of
our
website,
www.genpact.com.
Genpact
may
from
time
to
time
make
additional
written
and
oral
forward-looking
statements,
including
statements
contained
in
our
filings
with
the
SEC.
The
Company
undertakes
no
obligation
to
update
any
forward-
looking
statements
that
may
be
made
from
time
to
time
by
or
on
behalf
of
the
Company.
These
materials
also
include
measures
defined
by
the
SEC
as
non-GAAP
financial
measures.
Genpact
believes
that
these
non-
GAAP
measures
can
provide
useful
supplemental
information
to
investors
regarding
financial
and
business
trends
relating
to
its
financial
condition
and
results
of
operations
when
read
in
conjunction
with
the
Company’s
reported
results.
Reconciliations
of
these
non-GAAP
measures
from
GAAP
are
available
in
this
presentation
and
in
our
earnings
release
dated
February
4,
2015.
Forward-Looking Statements
Non-GAAP Financial Measures |
 DESIGN •
TRANSFORM •
RUN
3
©
2015 Copyright Genpact. All Rights Reserved.
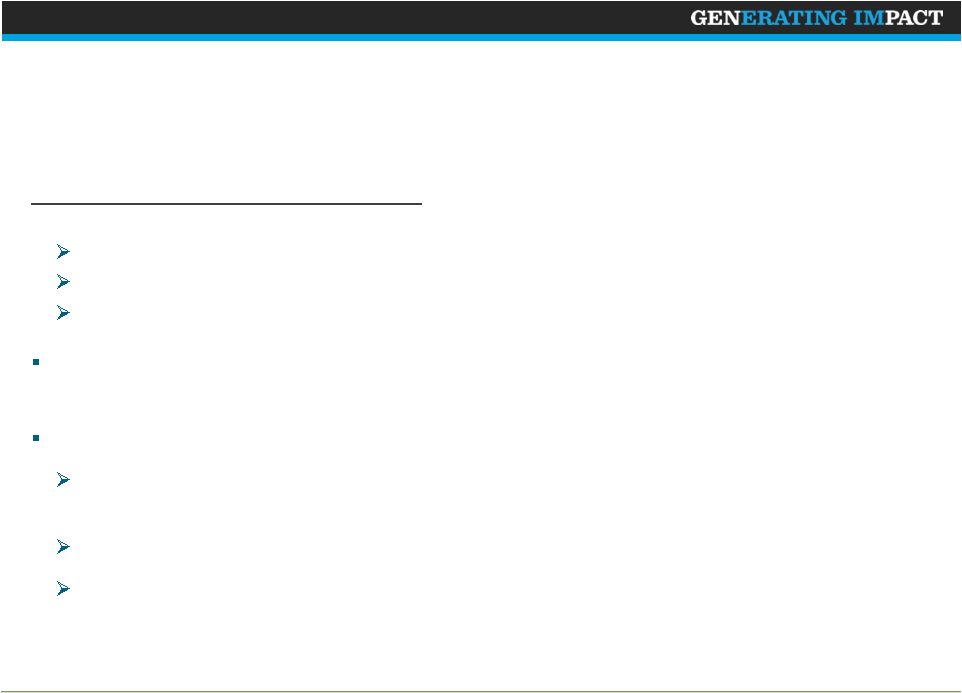
FY 2014 –
Key Financial Highlights
Solid growth and strategy execution
FY ‘14 versus FY ‘13 performance:
Total Revenue:
+7%
Revenue from Global Clients
(1)
:
+10%
GE Revenue
(1)
:
-2%
FY 2014 Adjusted Income from Operations margin at 15.1%, reflecting planned
strategic investments
(2)
Solid progress in the execution of our strategy:
Realigning our resources and developing new solutions for our targeted
verticals, service lines and geographies
Making significant client-facing investments
Adding domain and subject-matter experts to drive differentiation
Notes:
1.
Data adjusted for dispositions by GE of businesses that Genpact continues to serve
as Global Clients. 2.
Adjusted Income from Operations is a non-GAAP measure. FY ‘14 GAAP income
from operations margin was 12.9%. |
 DESIGN •
TRANSFORM •
RUN
4
©
2015 Copyright Genpact. All Rights Reserved.
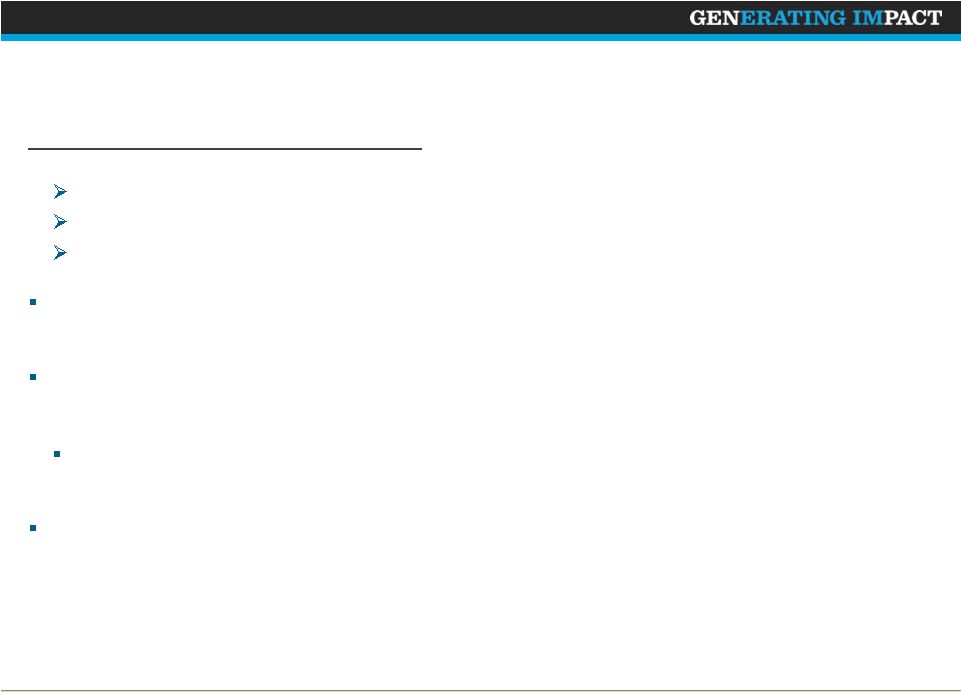
Q4 2014 –
Key Financial Highlights
Q4 ‘14 versus Q4 ‘13 performance:
Total Revenue:
+8%
Revenue from Global Clients
(1)
:
+11%
GE Revenue
(1)
:
-5%
Q4 2014 Adjusted Income from Operations margin at 13.6%, reflecting planned
investments
(2)
Global
Client
growth
was
broad-based
and
led
by
five
of
our
target
verticals
–
CPG,
Life
Sciences, Insurance, Manufacturing and Services, and Capital Markets
From a service line perspective, Finance & Accounting, Core Vertical
Operations, and Consulting led growth
Signed two large transformational deals, one each in the CPG and
Banking verticals
Notes:
1.
Data adjusted for dispositions by GE of businesses that Genpact continues to serve
as Global Clients 2.
Adjusted Income from Operations is a non-GAAP measure. Q4 ‘14 GAAP income
from operations margin was 11.8%. |
 DESIGN •
TRANSFORM •
RUN
5
©
2015 Copyright Genpact. All Rights Reserved.
FY 2014 –
Solid Growth and Progress on Strategy Execution
Key events and accomplishments:
Continued
progress
on
converting
large
deal
pipeline;
signed
six
large
transformational
engagements, including two in the fourth quarter
Continued to add depth to our client-facing teams; invested 6.6% of our revenue
in sales and marketing and also made incremental investments in capability
builds Built industry leading solutions that integrate new technology and
data insights to solve for critical client and industry needs
Launched
Systems
of
Engagement
SM
(SOE)
technology;
combining
advanced
technologies
with our deep domain and process expertise to drive business impact for
clients Accelerated
the
integration
of
rapid
robotic
automation
solutions
with
our
SEP
SM
framework
to drive increased efficiency and effectiveness and operational intelligence for
our clients Made strong progress on the Know Your Customer (KYC) solution
with Markit; Integration of our Life Sciences regulatory affairs acquisition
on track Collaboration with Lombard Risk Management on collateral management
exemplifies use of strategic partnerships and alliances to create new client
solutions |
 DESIGN •
TRANSFORM •
RUN
6
©
2015 Copyright Genpact. All Rights Reserved.
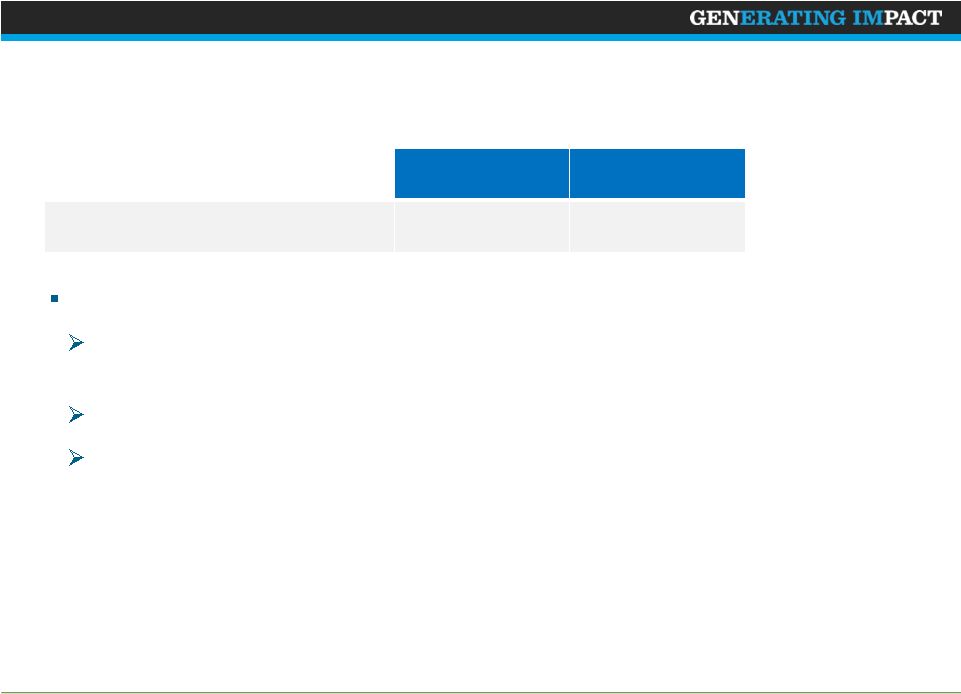
Bookings Up 50% Year-Over-Year
($ millions)
2014
YoY
Bookings*
2,156
+50%
Annual bookings up significantly over 2013 of $1,440m due to:
Realignment of our strategic focus to key target verticals, service lines and
geographies led to an increase in salesforce productivity
2013 bookings were broadly flat in comparison to 2012
Focus on large annuity opportunities led to six new large deal wins over the
course of 2014
Notes:
* New bookings means the total contract value of new contracts, and certain
renewals, extensions and changes to existing contracts. Regular renewals of contracts with
no change in scope are not counted as new bookings. |
 DESIGN •
TRANSFORM •
RUN
7
©
2015 Copyright Genpact. All Rights Reserved.
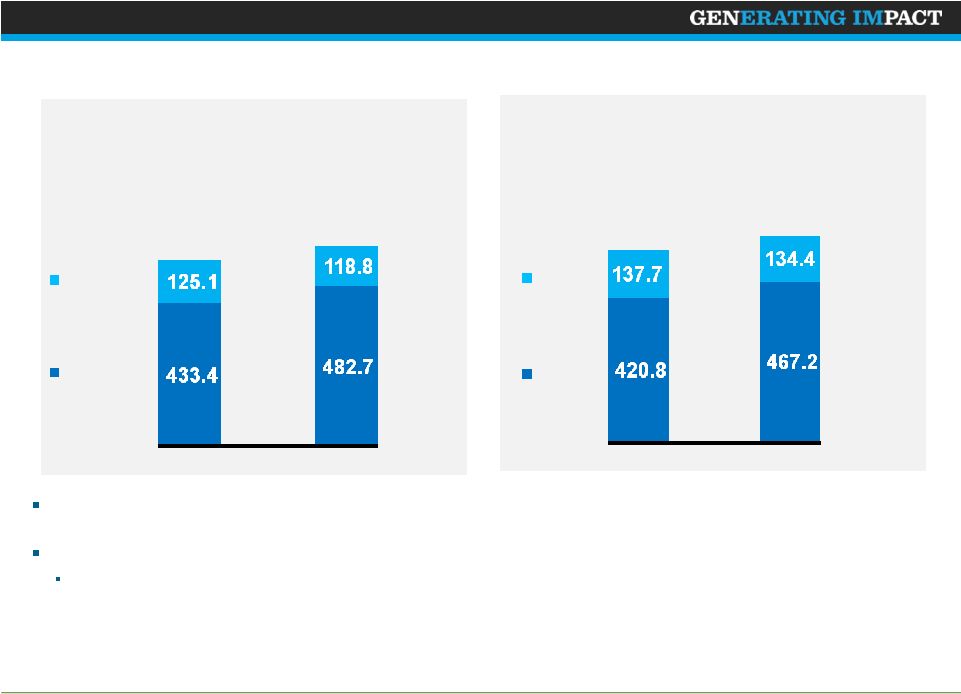
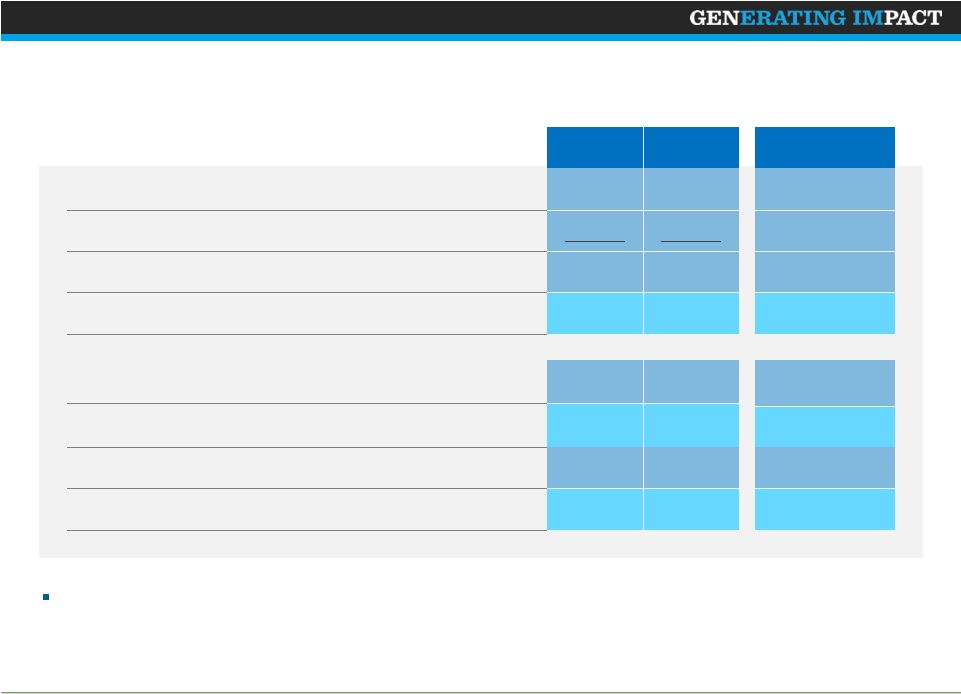
Q4 2014 Revenue Summary
Total growth at constant currency was 9.2%; excluding Pharmalink, total revenue
growth was 5.6%, or 7.1% on a constant currency basis
Q4 2014 Global Clients
BPO revenues increased 16% and ITO revenues declined 3%
Notes:
1.
Data adjusted for dispositions by GE of businesses that Genpact continues to serve
as Global Clients Global
Clients
(1)
GE
(1)
BPO
ITO
7.7%
YoY
Growth%
11.4%
(5.0%)
7.7%
(2.4%)
11.0%
YoY
Growth%
Q4 ‘13
Q4 ‘14
Q4 ‘13
Q4 ‘14
($ in millions)
($ in millions)
$558.5
$601.5
$601.5
$558.5 |
 DESIGN •
TRANSFORM •
RUN
8
©
2015 Copyright Genpact. All Rights Reserved.
Q4 Results Reflect Investments in Client-Facing Teams
and Capabilities
Q4‘13
Q4‘14
YoY
Revenue
558.5
601.5
7.7%
Cost of Revenue
345.8
359.2
3.9%
Gross Profit
212.6
242.3
14.0%
Gross Profit % of Revenue
38.1%
40.3%
220 bps
SG&A
136.2
167.3
22.8%
SG&A % of Revenue
24.4%
27.8%
340bps
Adjusted
Income
from
Operations
(1)
85.7
81.8
-4.5%
Adjusted Income from Operations Margin
15.3%
13.6%
-170 bps
($ millions)
Notes:
1.
Adjusted Income from Operations is a non-GAAP measure. Income from Operations
was $71.6 million in Q4 ‘13 and $70.9 million in Q4’14. Gross
profit margins increase was driven by productivity and favorable foreign exchange |
 DESIGN •
TRANSFORM •
RUN
9
©
2015 Copyright Genpact. All Rights Reserved.
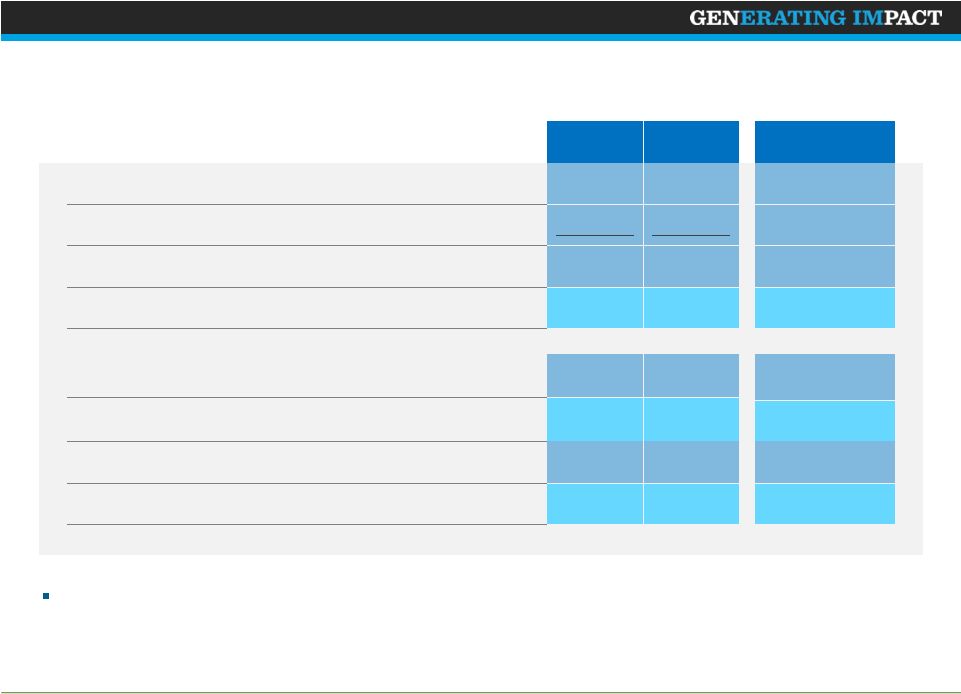
FY 2014 Revenue Summary
Notes:
1.
Data adjusted for dispositions by GE of businesses that Genpact continues to serve
as Global Clients Global
Clients
(1)
GE
(1)
BPO
ITO
6.9%
YoY
Growth%
9.6%
(2.4%)
6.9%
3.6%
8.0%
YoY
Growth%
2,132
2,279
FY ‘13
FY ‘14
FY ‘13
FY ‘14
($ in millions)
($ in millions)
2,132
2,279
Total growth at constant currency was 7.9%; excluding Pharmalink, total revenue
growth was 5.7%, or 6.7% on a constant currency basis
FY 2014 Global Clients
Business Process Outsourcing revenues increased 12% and ITO revenues increased
3% |
 DESIGN •
TRANSFORM •
RUN
10
©
2015 Copyright Genpact. All Rights Reserved.
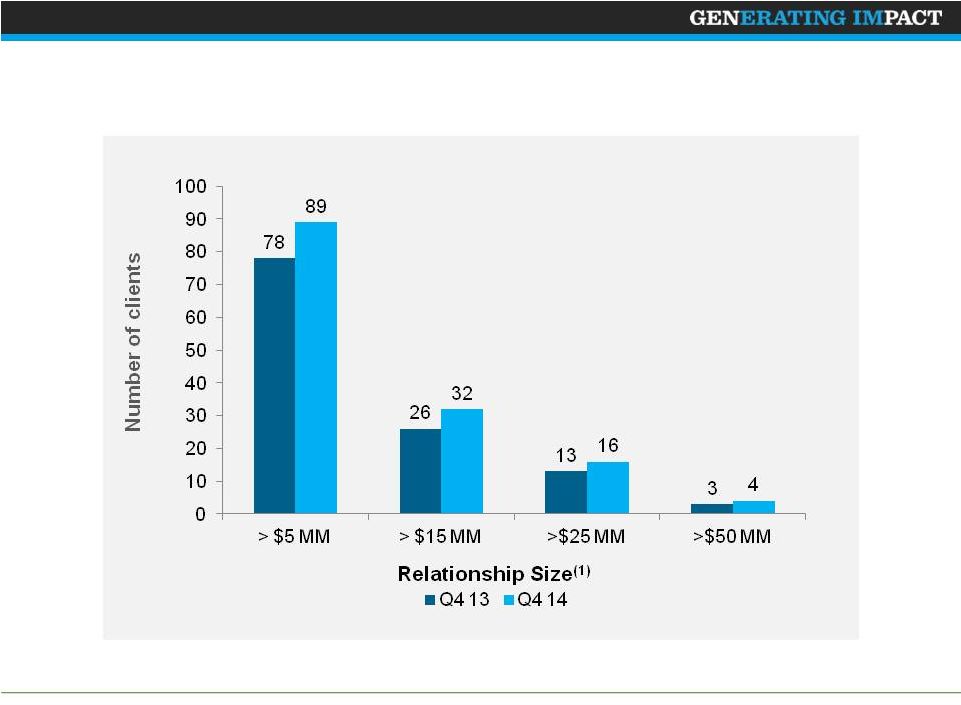
Continue to Expand Client Relationships
Notes:
1.
Relationship size = Clients representing annual revenues based on last four rolling
quarters |
 DESIGN •
TRANSFORM •
RUN
11
©
2015 Copyright Genpact. All Rights Reserved.
FY‘13
FY’14
YoY
Revenue
2,132.0
2,279.4
6.9%
Cost of Revenue
1,319.6
1,378.1
4.4%
Gross Profit
812.4
901.4
10.9%
Gross Profit % of Revenue
38.1%
39.5%
140 bps
SG&A
484.8
585.6
20.8%
SG&A % of Revenue
22.7%
25.7%
300bps
Adjusted
Income
from
Operations
(1)
352.6
344.2
-2.4%
Adjusted Income from Operations Margin
16.5%
15.1%
-140 bps
($ millions)
Notes:
1.
Adjusted Income from Operations is a non-GAAP measure. Income from Operations
was $309.5 million in FY ‘13 and $294.0 million in FY’14. FY Results
Reflect Investments in Client-Facing Teams and Capabilities
Gross profit margins increase driven by incremental revenue as well as operating
efficiencies and favorable foreign exchange |
 DESIGN •
TRANSFORM •
RUN
12
©
2015 Copyright Genpact. All Rights Reserved.
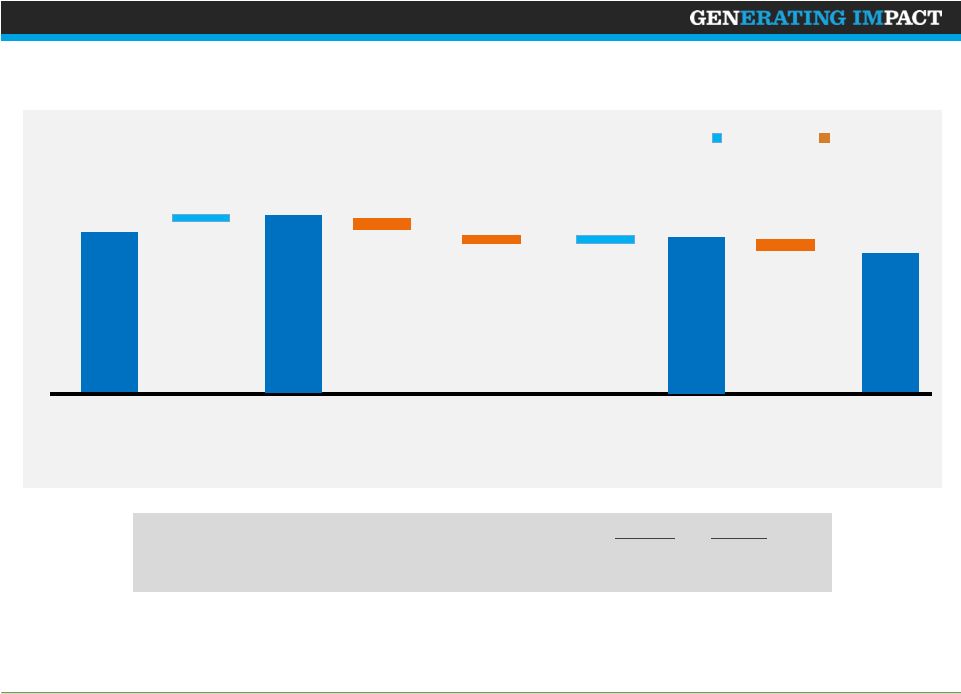
EPS Year-Over-Year Bridge
FY ‘13
FY ‘14
Adjusted Net Income ($ millions)
265.9
231.4
Diluted
Shares
Outstanding
(millions)
(2)
236
225
97
-11
FX Re-
measurement
Loss
FY ‘13
GAAP
EPS
(Cents per share)
Net
Adjustments
(1)
113
16
Net
Adjustments
(1)
FY ‘13
Adjusted
EPS
FY ‘14
Adjusted
EPS
FY ‘14
GAAP
EPS
-3
Lower Adjusted
Income from
Operations
-18
Increase Decrease
Notes:
1.
Adjustments primarily include amortization of acquired intangible assets,
stock-based compensation expenses and acquisition-related expenses.
2.
Weighted average number of diluted shares outstanding
-
The above bridge reflects only significant variance items year over year and is
illustrative and subject to rounding. -
EPS = Diluted earnings per share
Share buyback
net of dilution/
Others
4
85
103 |
 DESIGN •
TRANSFORM •
RUN
13
©
2015 Copyright Genpact. All Rights Reserved.
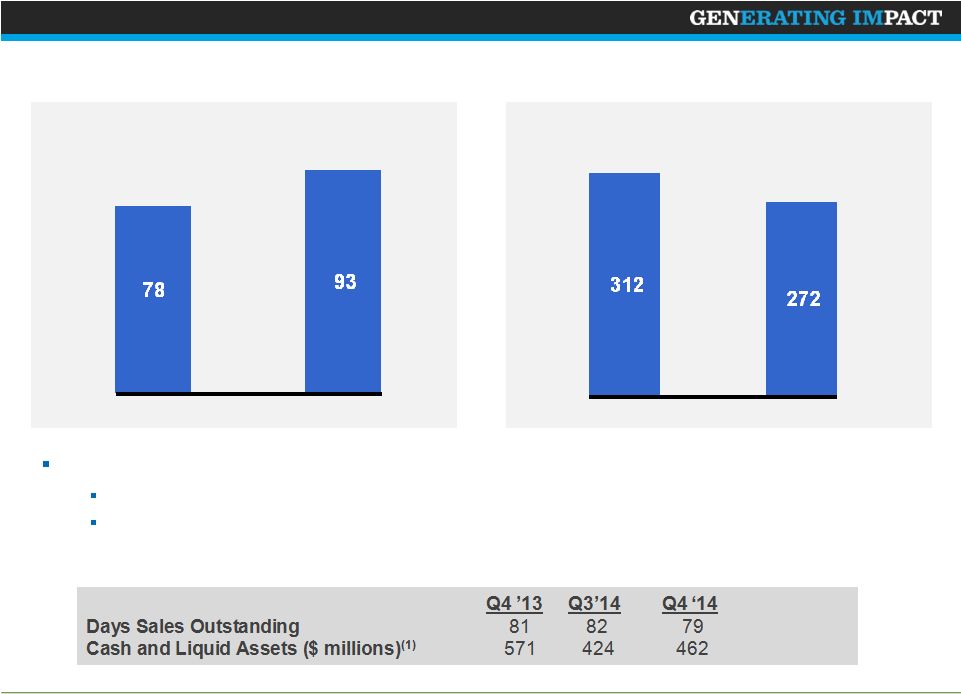
Cash From Operations
FY 2014 cash from operations down $40 MM
Cash from operations down 13% YoY; better than our earlier outlook mainly due to
the improvement in DSOs. The year over year decline was primarily driven by
the impact of foreign exchange re-measurement. Lower
operating income also contributed to the decline.
Q4 ‘13
Q4 ‘14
19%
Notes:
1) Cash and Liquid Assets = Cash and cash equivalents and short-term
deposits (13%)
FY ‘13
FY ‘14
YoY
Change%
YoY
Change%
($ in millions)
($ in
millions) |
 DESIGN •
TRANSFORM •
RUN
14
©
2015 Copyright Genpact. All Rights Reserved.
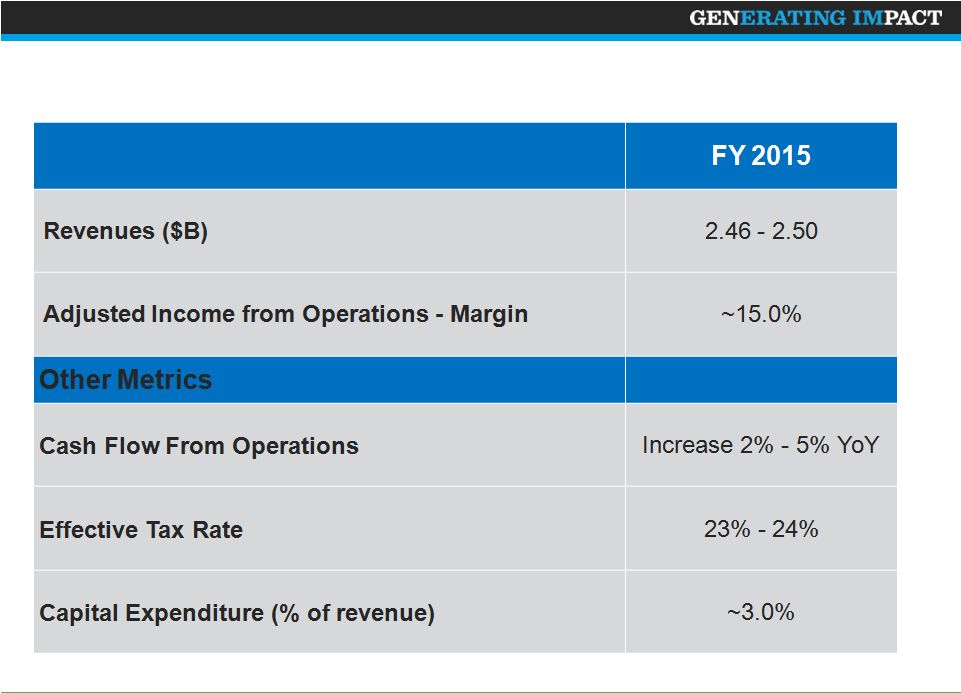
Full Year 2015 Outlook |
 DESIGN •
TRANSFORM •
RUN
15
©
2015 Copyright Genpact. All Rights Reserved.
Annexure 1: Reconciliation of Adjusted Income from
Operations –
Full Year 2014
(USD, in thousands)
Year ended December 31
2013
2014
Income from operations per GAAP
$
309,527
$
294,031
Add: Stock-based compensation
31,129
28,065
Add: Amortization of acquired intangible assets
18,321
22,233
Add: Acquisition related expenses
-
2,772
Add/Less: Other Income (Expense), net excluding net interest
(1,168)
2,112
Add/Less: Gain (Loss) on Equity-method investment activity, net
169
(4,795)
Less: Net income attributable to noncontrolling interest
(5,334)
(169)
Adjusted income from operations
$
352,644
$
344,249 |
 DESIGN •
TRANSFORM •
RUN
16
©
2015 Copyright Genpact. All Rights Reserved.
Annexure 2: Reconciliation of Adjusted Income From
Operations –
Q4 2014
(USD, in thousands)
Quarter ended December 31
2013
2014
Income from operations per GAAP
$
71,633
$
70,866
Add: Stock-based compensation
9,198
7,912
Add: Amortization of acquired intangible assets
4,685
6,347
Add: Acquisition related expenses
-
795
Add/Less: Other Income (Expense), net excluding net interest
1,190
776
Add/Less: Gain (Loss) on Equity-method investment activity, net
30
(4,882)
Less: Net income attributable to noncontrolling interest
(1,064)
-
Adjusted income from operations
$
85,672
$
81,814 |
 DESIGN •
TRANSFORM •
RUN
17
©
2015 Copyright Genpact. All Rights Reserved.
Annexure 3: Reconciliation of Adjusted Net Income –
Full
Year 2014
(USD, in thousands, except per share data)
Year ended December 31
2013
2014
Net income attributable to Genpact Limited shareholders per GAAP
$
229,717
$
192,002
Add: Stock-based compensation
31,129
28,065
Add: Amortization of acquired intangible assets
18,321
22,233
Add: Acquisition related expenses
-
2,772
Less: Tax impact on stock-based compensation
(6,913)
(6,366)
Less: Tax impact on amortization of acquired intangibles
(6,373)
(7,154)
Less: Tax impact on acquisition related expenses
-
(184)
Adjusted net income
$
265,881
$
231,368
Adjusted diluted earnings per share
$
1.13
$
1.03 |
 DESIGN •
TRANSFORM •
RUN
18
©
2015 Copyright Genpact. All Rights Reserved.
Annexure 4: Reconciliation of Adjusted Net Income –
Q4
2014
(USD, in thousands, except per share data)
Quarter ended December 31
2013
2014
Net income attributable to Genpact Limited shareholders per GAAP
$
48,842
$
45,752
Add: Stock-based compensation
9,198
7,912
Add: Amortization of acquired intangible assets
4,685
6,347
Add: Acquisition related expenses
-
795
Less: Tax impact on stock-based compensation
(1,160)
(1,160)
Less: Tax impact on amortization of acquired intangibles
(2,085)
(1,997)
Less: Tax impact on acquisition related expenses
-
(131)
Adjusted net income
$
59,480
$
57,518
Adjusted diluted earnings per share
$
0.25
$
0.26 |
 Thank You |