Attached files
| file | filename |
|---|---|
| 8-K - FORM 8-K - General Motors Financial Company, Inc. | d865414d8k.htm |
| EX-99.1 - EX-99.1 - General Motors Financial Company, Inc. | d865414dex991.htm |
Exhibit 99.2
|
|

4th Quarter 2014 Earnings Call
February 4, 2015
|
|
Safe Harbor Statement
This presentation contains several “forward-looking statements.” Forward-looking statements are those that use words such as “believe,” “expect,” “anticipate,” “intend,” “plan,” “may,” “likely,” “should,” “estimate,” “continue,” “future” or other comparable expressions. These words indicate future events and trends. Forward-looking statements are our current views with respect to future events and financial performance. These forward-looking statements are subject to many assumptions, risks and uncertainties that could cause actual results to differ significantly from historical results or from those anticipated by us. The most significant risks are detailed from time to time in our filings and reports with the Securities and Exchange Commission, including our annual report on Form 10-K for the year ended December 31, 2014. Such risks include—but are not limited to—changes in general economic and business conditions; GM’s ability to sell new vehicles that we finance in the markets we serve in North America, Europe, Latin America and China; interest rate and currency fluctuations; our financial condition and liquidity, as well as future cash flows and earnings; competition; the effect, interpretation or application of new or existing laws, regulations, court decisions and accounting pronouncements; the availability of sources of financing; the level of net charge-offs, delinquencies and prepayments on the loans and leases we originate; vehicle return rates and the residual value performance on vehicles we lease; the viability of GM-franchised dealers that are commercial loan customers; the prices at which used cars are sold in the wholesale markets; and changes in business strategy, including expansion of product lines and credit risk appetite, and acquisitions. If one or more of these risks or uncertainties materialize, or if underlying assumptions prove incorrect, actual events or results may differ materially. It is advisable not to place undue reliance on any forward-looking statements. We undertake no obligation to, and do not, publicly update or revise any forward-looking statements, except as required by federal securities laws, whether as a result of new information, future events or otherwise.
| 2 |
|
|
|
4th Quarter 2014 Highlights
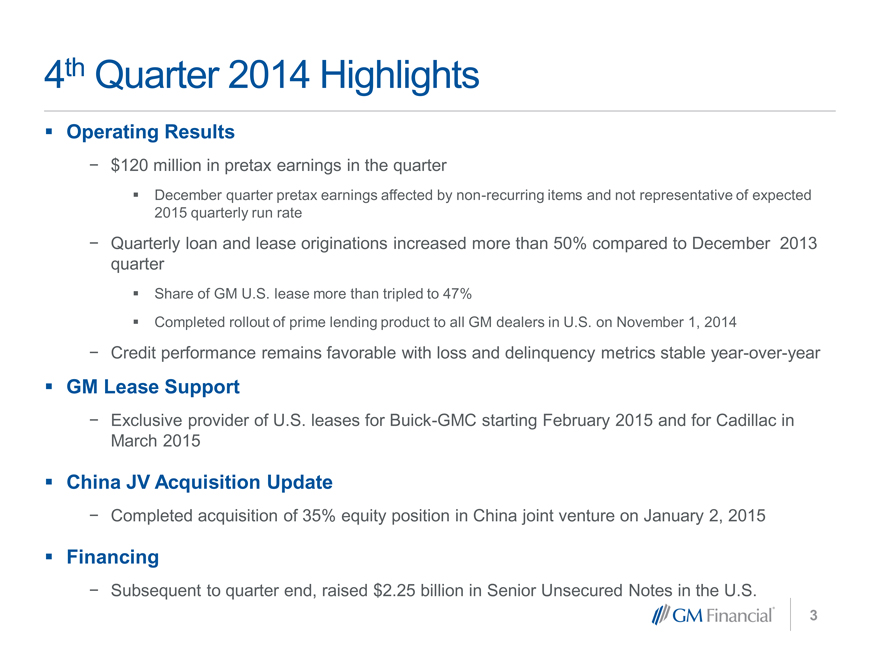
Operating Results
$120 million in pretax earnings in the quarter
?December quarter pretax earnings affected by non-recurring items and not representative of expected 2015 quarterly run rate
Quarterly loan and lease originations increased more than 50% compared to December 2013 quarter
?Share of GM U.S. lease more than tripled to 47%
?Completed rollout of prime lending product to all GM dealers in U.S. on November 1, 2014
Credit performance remains favorable with loss and delinquency metrics stable year-over-year
GM Lease Support
Exclusive provider of U.S. leases for Buick-GMC starting February 2015 and for Cadillac in March 2015
China JV Acquisition Update
Completed acquisition of 35% equity position in China joint venture on January 2, 2015
Financing
Subsequent to quarter end, raised $2.25 billion in Senior Unsecured Notes in the U.S.
| 3 |
|
|
|
Key Metrics
December 2014 Quarter December 2013 Quarter
North North Total
($MM) America International Total Co. America International Co.
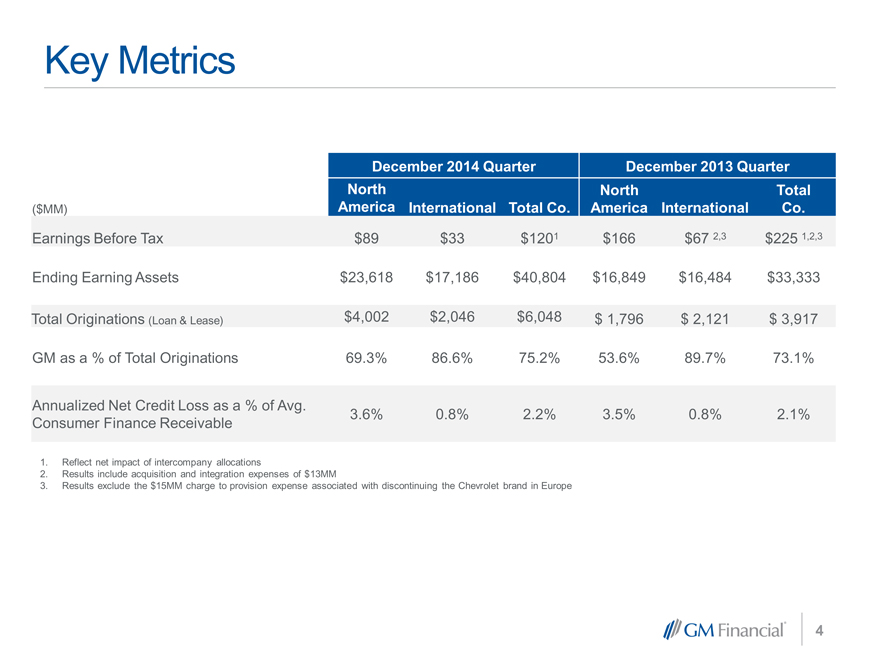
Earnings Before Tax $89 $33 $1201 $166 $67 2,3 $225 1,2,3
Ending Earning Assets $23,618 $17,186 $40,804 $16,849 $16,484 $33,333
Total Originations (Loan & Lease) $4,002 $2,046 $6,048 $ 1,796 $ 2,121 $ 3,917
GM as a % of Total Originations 69.3% 86.6% 75.2% 53.6% 89.7% 73.1%
Annualized Net Credit Loss as a % of Avg.
Consumer Finance Receivable 3.6% 0.8% 2.2% 3.5% 0.8% 2.1%
1. Reflect net impact of intercompany allocations
2. Results include acquisition and integration expenses of $13MM
3. Results exclude the $15MM charge to provision expense associated w ith discontinuing the Chevrolet brand in Europe
| 4 |
|
|
|
North America
GM and GMF Penetration Statistics
Dec-14 Sept-14 Dec-13
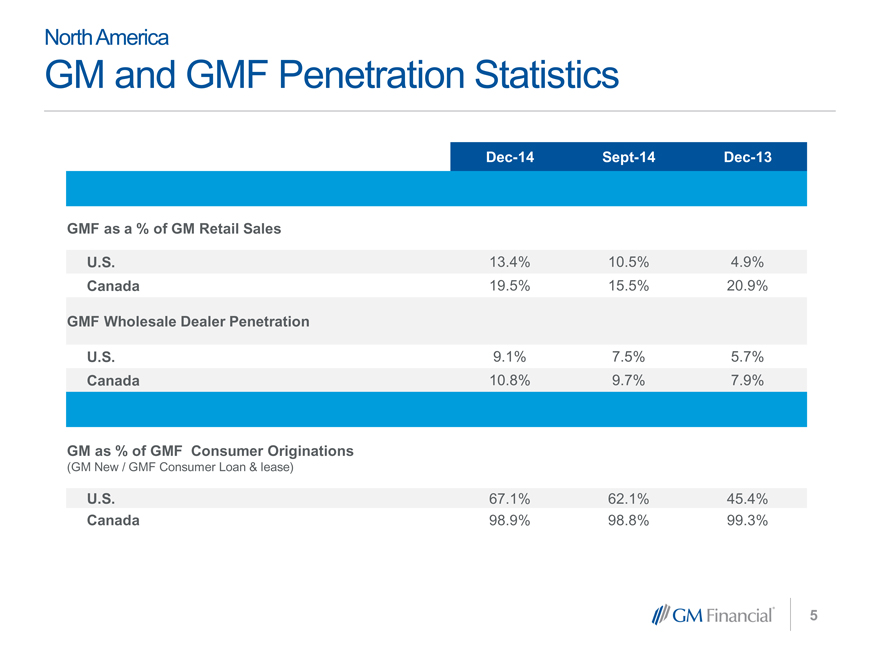
GMF as a % of GM Retail Sales
U.S. 13.4% 10.5% 4.9%
Canada 19.5% 15.5% 20.9%
GMF Wholesale Dealer Penetration
U.S. 9.1% 7.5% 5.7%
Canada 10.8% 9.7% 7.9%
GM as % of GMF Consumer Originations
(GM New / GMF Consumer Loan & lease)
U.S. 67.1% 62.1% 45.4%
Canada 98.9% 98.8% 99.3%
| 5 |
|
|
|
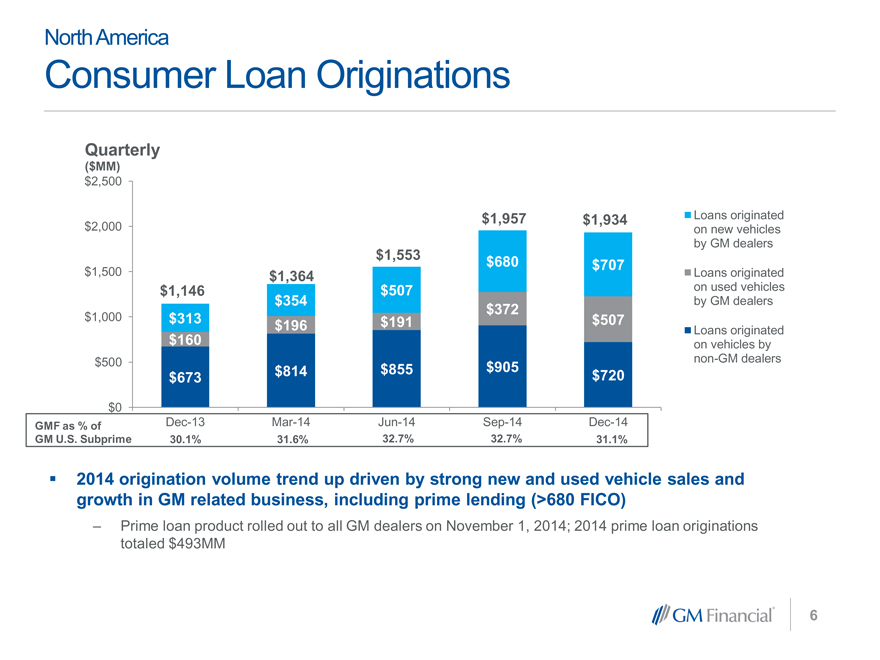
North America
Consumer Loan Originations
Quarterly
($MM)
$2,500
$2,000 $1,957 $1,934
$1,553 $680 $707
$1,500 $1,364
$1,146 $507
$354 $372
$1,000 $313 $196 $191 $507
$160
$500 $673 $814 $855 $905 $720
$0
GMF as % of Dec-13 Mar-14 Jun-14 Sep-14 Dec-14
GM U.S. Subprime 30.1% 31.6% 32.7% 32.7% 31.1%
Loans originated on new vehicles by GM dealers
Loans originated on used vehicles by GM dealers
Loans originated on vehicles by non-GM dealers
2014 origination volume trend up driven by strong new and used vehicle sales and growth in GM related business, including prime lending (>680 FICO)
Prime loan product rolled out to all GM dealers on November 1, 2014; 2014 prime loan originations totaled $493MM
| 6 |
|
|
|
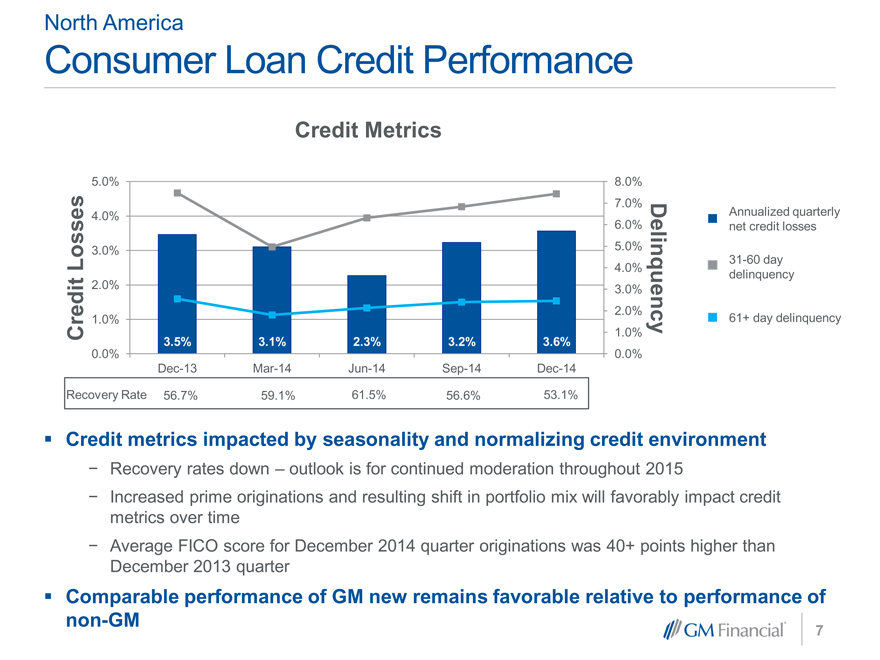
North America
Consumer Loan Credit Performance
Credit Metrics
5.0% 8.0%
7.0%
4.0%
6.0%
3.0% 5.0%
4.0%
2.0% 3.0%
2.0%
Losses 1.0% Delinquency
Credit 1.0%
3.5% 3.1% 2.3% 3.2% 3.6%
0.0% 0.0%
Dec-13 Mar-14 Jun-14 Sep-14 Dec-14
Recovery Rate 56.7% 59.1% 61.5% 56.6% 53.1%
Annualized quarterly net credit losses
31-60 day delinquency
61+ day delinquency
Credit metrics impacted by seasonality and normalizing credit environment
Recovery rates down – outlook is for continued moderation throughout 2015
Increased prime originations and resulting shift in portfolio mix will favorably impact credit metrics over time
Average FICO score for December 2014 quarter originations was 40+ points higher than December 2013 quarter
Comparable performance of GM new remains favorable relative to performance of non-GM
| 7 |
|
|
|
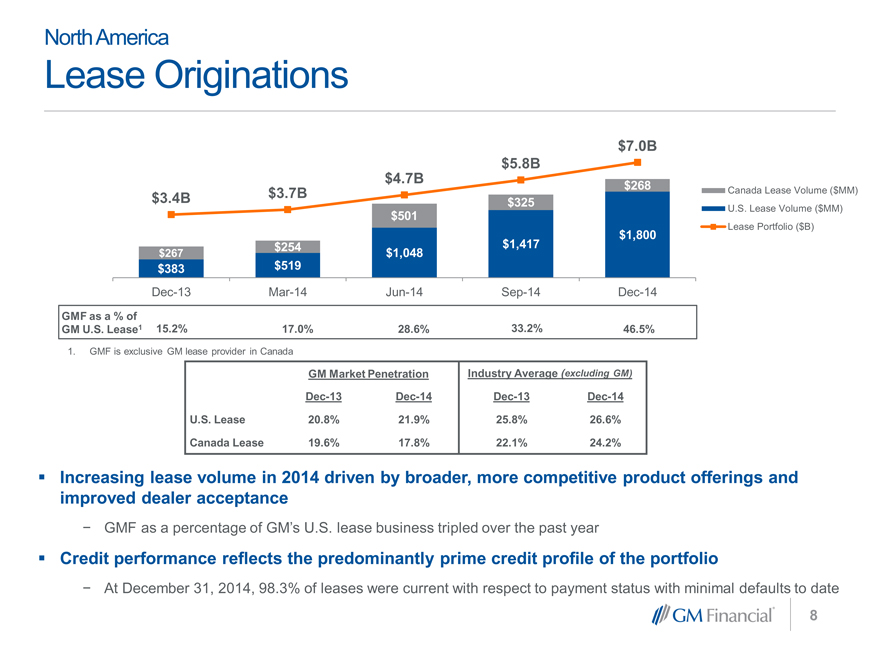
North America
Lease Originations
$7.0B
2500 $5.8B
2000 $4.7B $268
$3.4B $3.7B
1500 $325
$501
1000 $1,800
$254 $1,417
500 $267 $1,048
$383 $519
0
Dec-13 Mar-14 Jun-14 Sep-14 Dec-14
GMF as a % of
GM U.S. Lease1 15.2% 17.0% 28.6% 33.2% 46.5%
1. GMF is exclusive GM lease provider in Canada
Canada Lease Volume ($MM)
U.S. Lease Volume ($MM)
Lease Portfolio ($B)
GM Market Penetration Industry Average (excluding GM)
Dec-13 Dec-14 Dec-13 Dec-14
U.S. Lease 20.8% 21.9% 25.8% 26.6%
Canada Lease 19.6% 17.8% 22.1% 24.2%
Increasing lease volume in 2014 driven by broader, more competitive product offerings and improved dealer acceptance
- GMF as a percentage of GM’s U.S. lease business tripled over the past year
Credit performance reflects the predominantly prime credit profile of the portfolio
- At December 31, 2014, 98.3% of leases were current with respect to payment status with minimal defaults to date
| 8 |
|
|
|
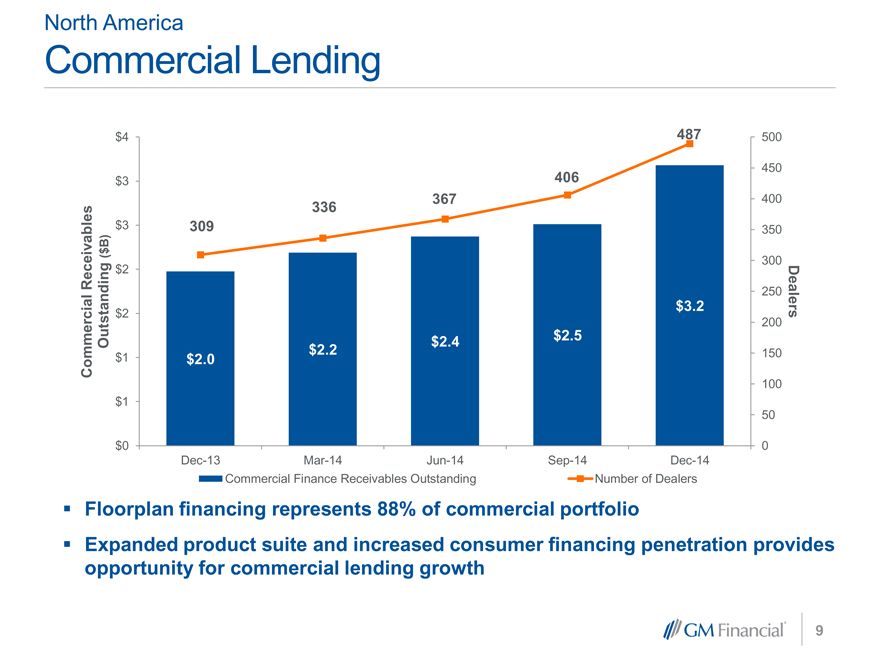
North America
Commercial Lending
$4 487 500
450
$3 406
336 367 400
$3 309 350
B)
$
( 300
Receivables $2
250
$2 $3.2 Dealers
200
Outstanding $2.4 $2.5
Commercial $1 $2.0 $2.2 150
100
$1
50
$0 0
Dec-13 Mar-14 Jun-14 Sep-14 Dec-14
Commercial Finance Receivables Outstanding Number of Dealers
Floorplan financing represents 88% of commercial portfolio
Expanded product suite and increased consumer financing penetration provides opportunity for commercial lending growth
9
|
|
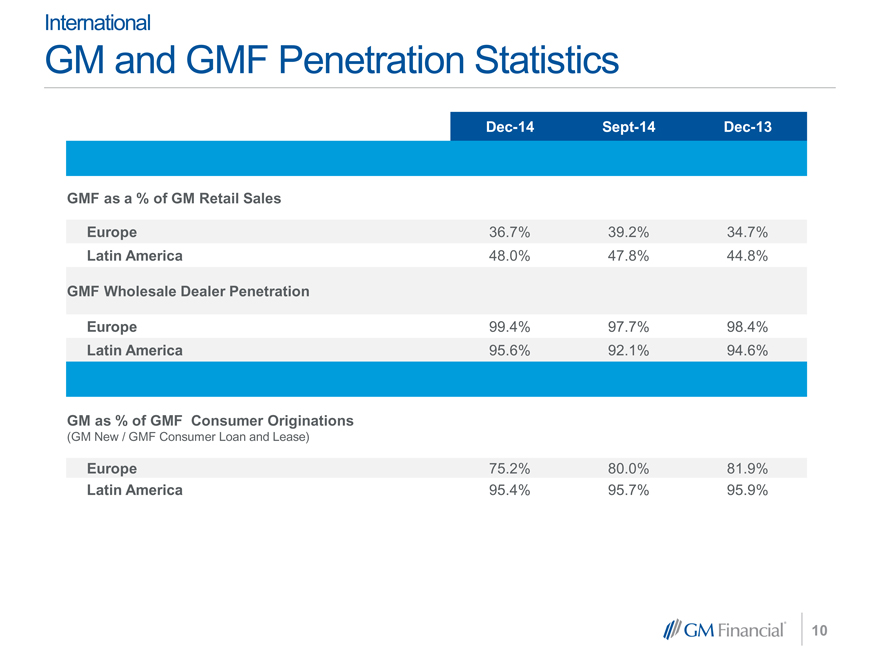
International
GM and GMF Penetration Statistics
Dec-14 Sept-14 Dec-13
GMF as a % of GM Retail Sales
Europe 36.7% 39.2% 34.7%
Latin America 48.0% 47.8% 44.8%
GMF Wholesale Dealer Penetration
Europe 99.4% 97.7% 98.4%
Latin America 95.6% 92.1% 94.6%
GM as % of GMF Consumer Originations
(GM New / GMF Consumer Loan and Lease)
Europe 75.2% 80.0% 81.9%
Latin America 95.4% 95.7% 95.9%
10
|
|
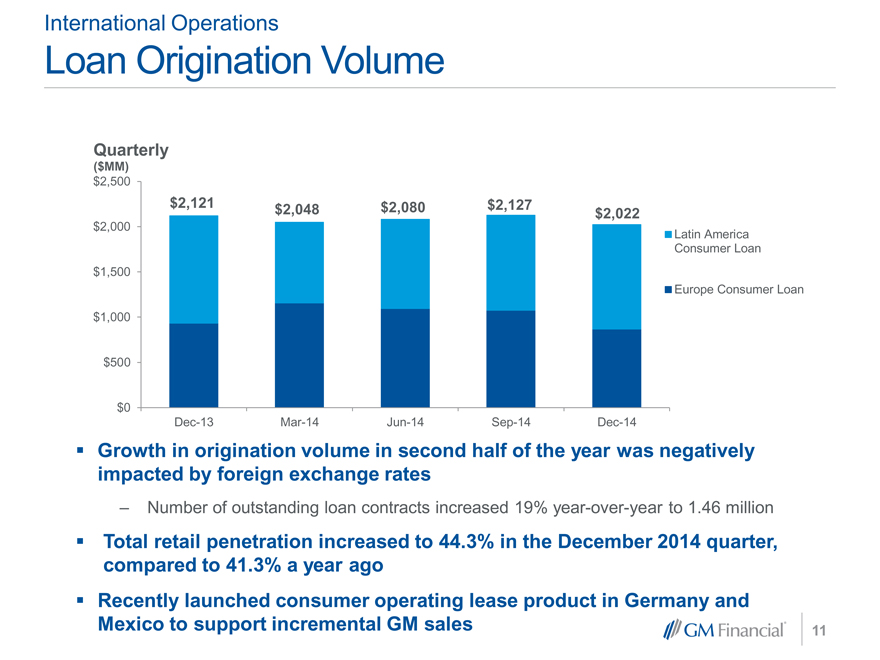
International Operations
Loan Origination Volume
Quarterly
($MM)
$2,500
$2,121 $2,048 $2,080 $2,127 $2,022
$2,000
$1,500
$1,000
$500
$0
Dec-13 Mar-14 Jun-14 Sep-14 Dec-14
Latin America Consumer Loan
Europe Consumer Loan
Growth in origination volume in second half of the year was negatively impacted by foreign exchange rates
Number of outstanding loan contracts increased 19% year-over-year to 1.46 million
Total retail penetration increased to 44.3% in the December 2014 quarter, compared to 41.3% a year ago Recently launched consumer operating lease product in Germany and Mexico to support incremental GM sales
11
|
|
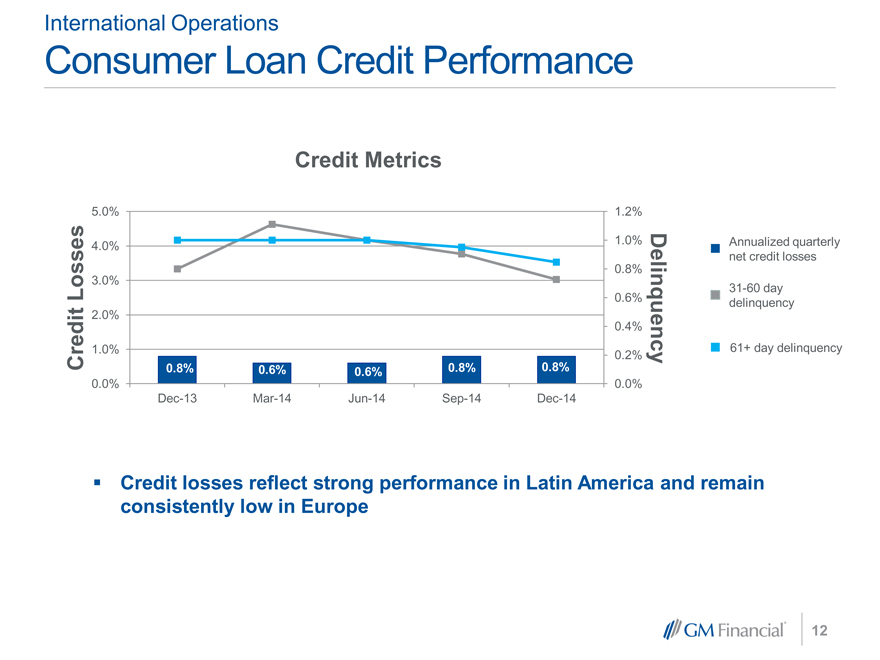
International Operations
Consumer Loan Credit Performance
Credit Metrics
5.0% 1.2%
4.0% 1.0%
0.8%
3.0%
0.6%
2.0%
0.4%
Credit Losses 1.0% 0.2% Delinquency
0.8% 0.6% 0.6% 0.8% 0.8%
0.0% 0.0%
Dec-13 Mar-14 Jun-14 Sep-14 Dec-14
Annualized quarterly net credit losses
31-60 day delinquency
61+ day delinquency
Credit losses reflect strong performance in Latin America and remain consistently low in Europe
12
|
|
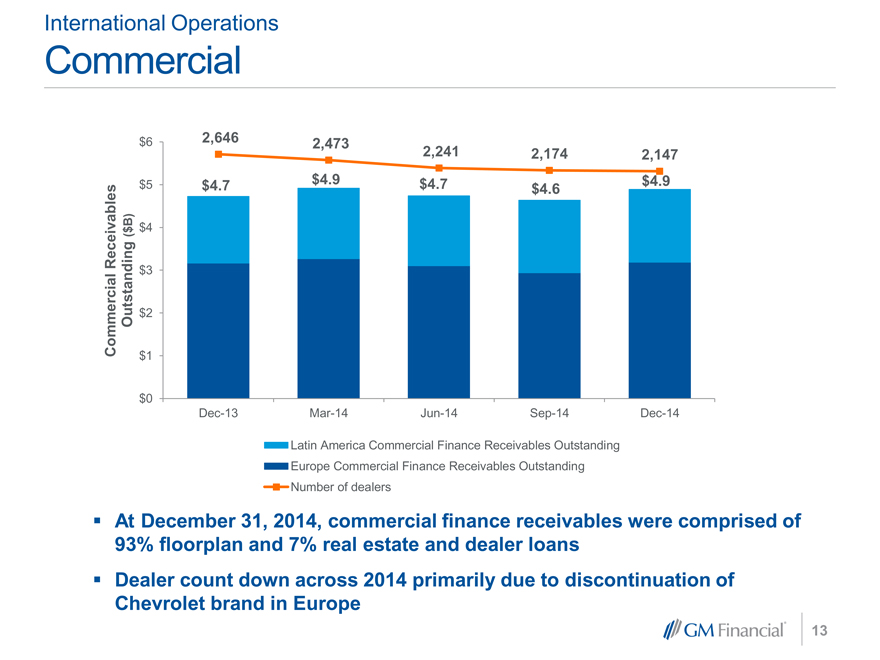
International Operations
Commercial
$ 6 2,646 2,473
2,241 2,174 2,147
$ 5 $4.7 $4.9 $4.7 $4.6 $4.9
B)
$ $ 4
Receivables (
$ 3
Commercial Outstanding $ 2
$ 1
$ 0
Dec-13 Mar-14 Jun-14 Sep-14 Dec-14
Latin America Commercial Finance Receivables Outstanding Europe Commercial Finance Receivables Outstanding Number of dealers
At December 31, 2014, commercial finance receivables were comprised of 93% floorplan and 7% real estate and dealer loans Dealer count down across 2014 primarily due to discontinuation of Chevrolet brand in Europe
13
|
|
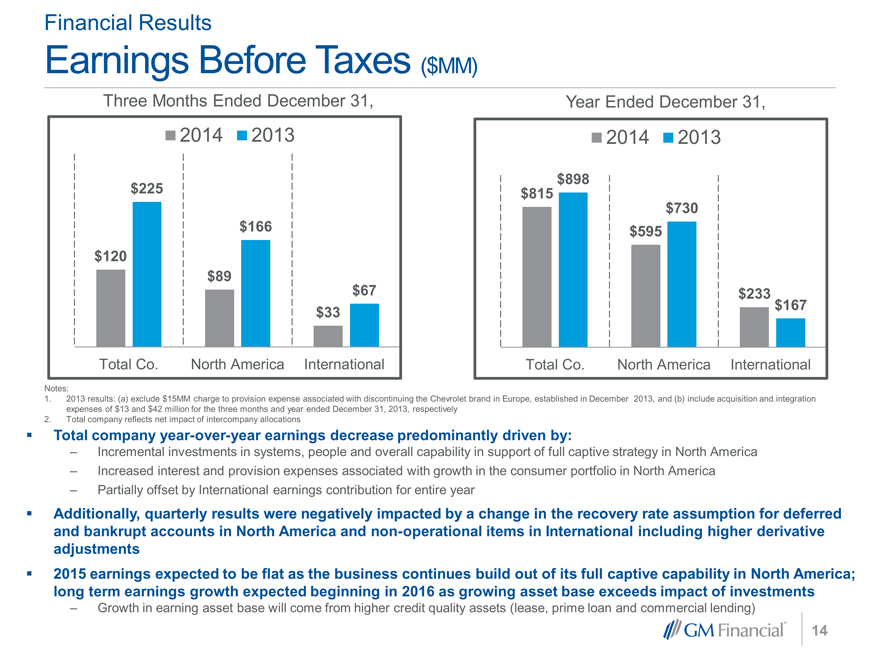
Financial Results
Earnings Before Taxes ($MM)
Three Months Ended December 31,
2014 2013
$225
$166
$120
$89
$67
$33
Total Co. North America International
Year Ended December 31,
2014 2013
$898
$815
$730
$595
$233
$167
Total Co. North America International
Notes:
1. 2013 results: (a) exclude $15MM charge to prov ision expense associated with discontinuing the Chev rolet brand in Europe, established in December 2013, and (b) include acquisition and integration expenses of $13 and $42 million f or the three months and y ear ended December 31, 2013, respectiv ely
2. Total company ref lects net impact of intercompany allocations
Total company year-over-year earnings decrease predominantly driven by:
Incremental investments in systems, people and overall capability in support of full captive strategy in North America
Increased interest and provision expenses associated with growth in the consumer portfolio in North America
Partially offset by International earnings contribution for entire year
Additionally, quarterly results were negatively impacted by a change in the recovery rate assumption for deferred and bankrupt accounts in North America and non-operational items in International including higher derivative adjustments 2015 earnings expected to be flat as the business continues build out of its full captive capability in North America; long term earnings growth expected beginning in 2016 as growing asset base exceeds impact of investments
Growth in earning asset base will come from higher credit quality assets (lease, prime loan and commercial lending)
14
|
|
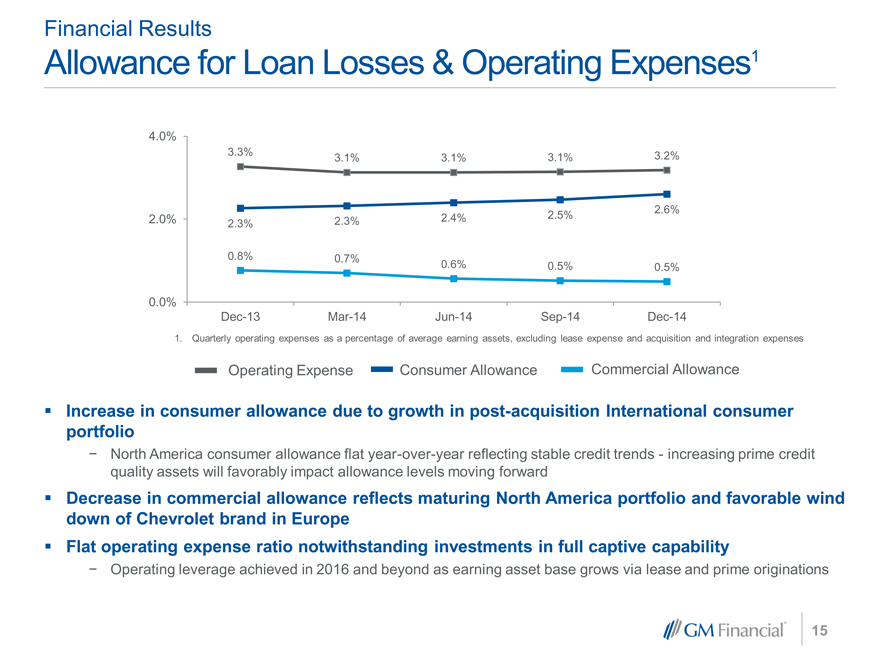
Financial Results
Allowance for Loan Losses & Operating Expenses1
4.0%
3.3% 3.1% 3.1% 3.1% 3.2%
2.6%
2.0% 2.3% 2.3% 2.4% 2.5%
0.8% 0.7% 0.6% 0.5% 0.5%
0.0%
Dec-13 Mar-14 Jun-14 Sep-14 Dec-14
1. Quarterly operating expenses as a percentage of average earning assets, excluding lease expense and acquisition and integration expenses
Operating Expense Consumer Allowance Commercial Allowance
Increase in consumer allowance due to growth in post-acquisition International consumer portfolio
North America consumer allowance flat year-over-year reflecting stable credit trends—increasing prime credit quality assets will favorably impact allowance levels moving forward
Decrease in commercial allowance reflects maturing North America portfolio and favorable wind down of Chevrolet brand in Europe Flat operating expense ratio notwithstanding investments in full captive capability
Operating leverage achieved in 2016 and beyond as earning asset base grows via lease and prime originations
15
|
|
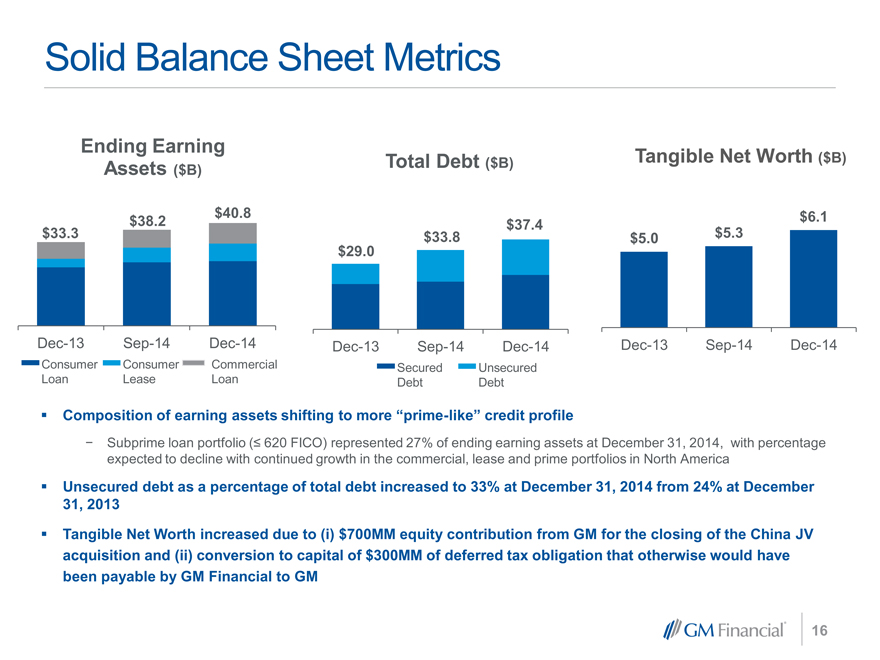
Solid Balance Sheet Metrics
Ending Earning
Assets ($B)
$38.2 $40.8
$33.3
Dec-13 Sep-14 Dec-14
Consumer Consumer Commercial Loan Lease Loan
Total Debt ($B)
$37.4
$33.8
$29.0
Dec-13 Sep-14 Dec-14
Secured Unsecured Debt Debt
Tangible Net Worth ($B)
$6.1
$5.0 $5.3
Dec-13 Sep-14 Dec-14
Composition of earning assets shifting to more “prime-like” credit profile
Subprime loan portfolio (? 620 FICO) represented 27% of ending earning assets at December 31, 2014, with percentage expected to decline with continued growth in the commercial, lease and prime portfolios in North America
Unsecured debt as a percentage of total debt increased to 33% at December 31, 2014 from 24% at December 31, 2013
Tangible Net Worth increased due to (i) $700MM equity contribution from GM for the closing of the China JV acquisition and (ii) conversion to capital of $300MM of deferred tax obligation that otherwise would have been payable by GM Financial to GM
16
|
|
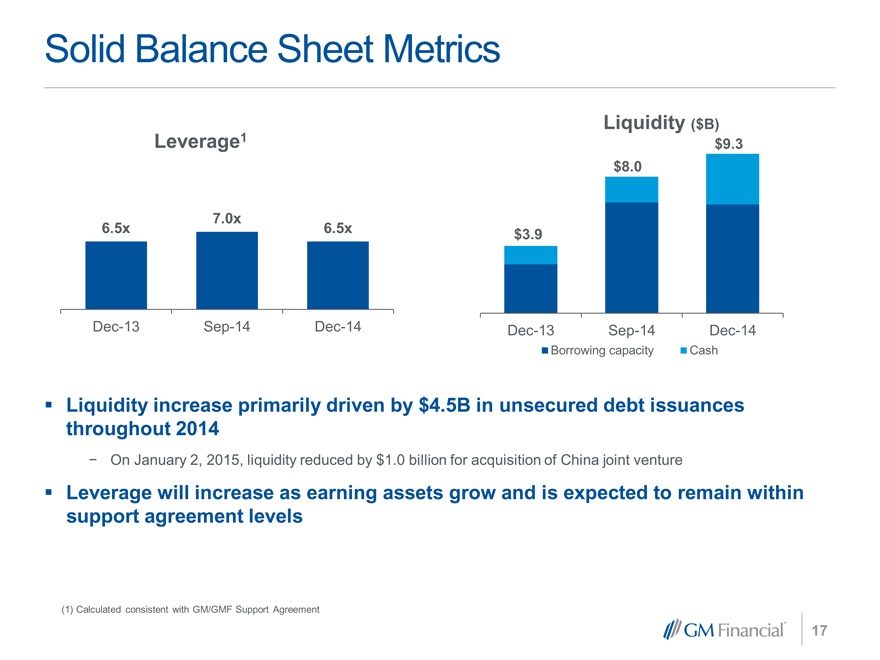
Solid Balance Sheet Metrics
Leverage1
7.0x
6.5x 6.5x
Dec-13 Sep-14 Dec-14
Liquidity ($B)
$9.3
$8.0
$3.9
Dec-13 Sep-14 Dec-14
Borrowing capacity Cash
Liquidity increase primarily driven by $4.5B in unsecured debt issuances throughout 2014
On January 2, 2015, liquidity reduced by $1.0 billion for acquisition of China joint venture
Leverage will increase as earning assets grow and is expected to remain within support agreement levels
| (1) |
|
Calculated consistent w ith GM/GMF Support Agreement |
17
|
|
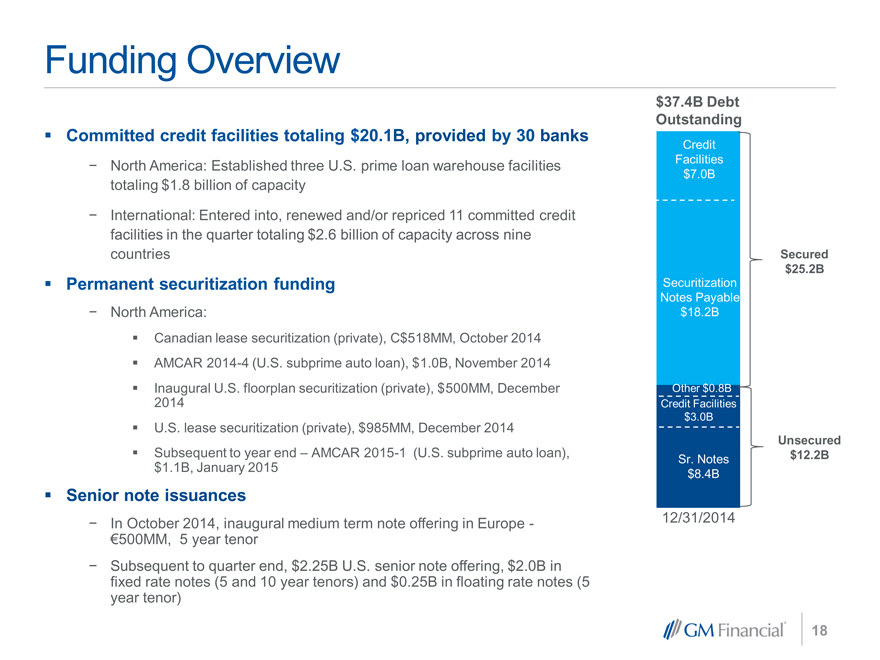
Funding Overview
Committed credit facilities totaling $20.1B, provided by 30 banks
North America: Established three U.S. prime loan warehouse facilities totaling $1.8 billion of capacity
International: Entered into, renewed and/or repriced 11 committed credit facilities in the quarter totaling $2.6 billion of capacity across nine countries
Permanent securitization funding
North America:
?Canadian lease securitization (private), C$518MM, October 2014 ??AMCAR 2014-4 (U.S. subprime auto loan), $1.0B, November 2014 ??Inaugural U.S. floorplan securitization (private), $500MM, December 2014 ??U.S. lease securitization (private), $985MM, December 2014 ??Subsequent to year end – AMCAR 2015-1 (U.S. subprime auto loan), $1.1B, January 2015
Senior note issuances
In October 2014, inaugural medium term note offering in Europe—€500MM, 5 year tenor
Subsequent to quarter end, $2.25B U.S. senior note offering, $2.0B in fixed rate notes (5 and 10 year tenors) and $0.25B in floating rate notes (5 year tenor)
$37.4B Debt Outstanding
Credit Facilities $7.0B
Secured $25.2B
Securitization Notes Payable $18.2B
Other $0.8B Credit Facilities $3.0B
Unsecured
Sr. Notes $12.2B $8.4B
12/31/2014
18
|
|
Highlights/Accomplishments
In 2014, GMF:
Rolled out our prime loan product in the U.S., substantially completing the build out of its auto finance product suite in North America
Continued to increase penetration of GM’s business
Experienced threefold increase in U.S. lease penetration
Realized solid retail penetration growth in both Europe and Latin America
Completed support agreement with GM providing for explicit capital support levels and liquidity availability, if needed
Upgraded to investment grade by S&P and GMF’s ratings equalized to GM’s across all four agencies
Continued to experience strong access to capital markets
Completed acquisition of international portfolio with closure of China joint venture (closed January 2, 2015)
Finalized preparation for lease exclusivity
Buick-GMC launched February 3, 2015; Cadillac targeted for March 2015
19
|
|

For more information, visit
www.gmfinancial.com