Attached files
| file | filename |
|---|---|
| 8-K - 8-K - ZAIS Group Holdings, Inc. | v400254_8k.htm |
| EX-99.2 - EXHIBIT 99.2 - ZAIS Group Holdings, Inc. | v400254_ex99-2.htm |
Exhibit 99.1

Supplemental Financial Presentation February 3, 2015 to Acquire Majority Equity Interest in ZAIS Group Parent, LLC, the sole member of HF2 Financial Management Inc.
HF2 F INANCIAL M ANAGEMENT I NC . The following slide show was furnished to the Securities and Exchange Commission (“SEC”) as part of a Current Report on Form 8 - K filed by HF 2 Financial Management Inc . (“HF 2 ”) with the SEC on February 3 , 2015 . HF 2 will be holding presentations for certain of its stockholders, as well as other persons who might be interested in purchasing HF 2 securities, regarding its acquisition of a majority of the membership interests in ZAIS Group Parent, LLC (“ZGP”), the parent and sole member of ZAIS Group, LLC (“ZAIS” or “ZAIS Group”, and together with ZGP, the “Company”) pursuant to an Investment Agreement with ZGP as described in the Form 8 - K (and exhibits thereto) filed by HF 2 on September 17 , 2014 . This presentation and Form 8 - K are being distributed from time to time to attendees of this presentation . HF 2 and its directors and officers and EarlyBirdCapital, Inc . (“EBC”) and Sandler O’Neill & Partners, L . P . (“SOP”), the underwriters of HF 2 ’s initial public offering, may be deemed participants in the solicitation of proxies to HF 2 ’s stockholders with respect to the proposed transaction . A list of the names of HF 2 ’s directors and officers and a description of their interests in HF 2 is contained in HF 2 ’s Annual Report on Form 10 - K, which was filed with the SEC on March 31 , 2014 , and is contained in the definitive proxy statement for the proposed transaction, which was filed with the SEC on January 26 , 2015 . EBC’s and SOP’s interests in HF 2 is contained in HF 2 ’s Annual Report on Form 10 - K, which was filed with the SEC on March 31 , 2014 , and the Merger and Acquisition Agreement by and among HF 2 , EBC and SOP, which is an exhibit to such report, and is also contained in the definitive proxy statement for the proposed transaction . Information about the Company and its officers and directors is also included in the definitive proxy statement for the proposed transaction . HF 2 filed a definitive proxy statement on Schedule 14 A with the SEC on January 26 , 2015 in connection with the stockholder vote on the proposed transaction . STOCKHOLDERS OF HF 2 AND OTHER INTERESTED PERSONS ARE ADVISED TO READ THE COMPANY’S DEFINITIVE PROXY STATEMENT IN CONNECTION WITH THE SOLICITATION OF PROXIES FOR THE SPECIAL MEETING TO APPROVE THE PROPOSED TRANSACTION BECAUSE THIS PROXY STATEMENT CONTAINS IMPORTANT INFORMATION . The definitive proxy statement was mailed on January 29 , 2015 , to stockholders of record as of January 26 , 2015 , for voting on the proposed transaction . Stockholders may also obtain a copy of the definitive proxy statement, and other relevant documents, without charge, at the SEC’s Internet site http : //www . sec . gov or by contacting HF 2 ’s secretary at HF 2 Financial Management Inc . , 999 18 th Street, Suite 3000 , Denver, Colorado 80202 . None of the information in this investor presentation constitutes either an offer or solicitation to buy or sell any of ZAIS’s products or services, nor is any such information a recommendation for any of ZAIS’s products or services .

HF2 F INANCIAL M ANAGEMENT I NC . Forward - Looking Statements This investor presentation, and other statements that HF 2 may make, contains forward - looking statements within the meaning of the Private Securities Litigation Reform Act, including, for example, statements about ( 1 ) the ability to complete and the benefits of the transaction with the Company ; and ( 2 ) HF 2 ’s and the Company’s future financial or business performance, strategies, growth initiatives and expectations . Forward - looking statements are typically identified by words or phrases such as “trend,” “potential,” “opportunity,” “pipeline,” “believe,” “comfortable,” “expect,” “anticipate,” “current,” “intention,” “estimate,” “position,” “assume,” “outlook,” “continue,” “remain,” “maintain,” “sustain,” “seek,” “achieve,” and similar expressions, or future or conditional verbs such as “will,” “would,” “should,” “could,” “may” and similar expressions . HF 2 cautions that forward - looking statements are subject to numerous assumptions, risks and uncertainties, which change over time . Forward - looking statements speak only as of the date they are made, and HF 2 assumes no duty to and does not undertake to update forward - looking statements . Actual results could differ materially from those anticipated in forward - looking statements and future results could differ materially from historical performance . In addition to factors previously disclosed in HF 2 ’s filings with the SEC, the following factors, among others, could cause actual results to differ materially from forward - looking statements or historical performance : ( 1 ) the inability of HF 2 to consummate the transaction with the Company and realize the benefits of such transaction, which may be affected by, among other things, competition, the ability of the combined company to grow and manage growth profitably, and retain its management and key employees ; ( 2 ) the occurrence of any event, change or other circumstances that could give rise to the termination of the definitive agreement between HF 2 and the Company for the business combination ; ( 3 ) the outcome of any legal proceedings that may be instituted against HF 2 , the Company or others following announcement of the proposed transaction ; ( 4 ) the inability to meet Nasdaq’s listing standards and to continue to be listed on the NASDAQ Stock Market ; ( 5 ) the risk that the proposed transaction disrupts current plans and operations of the Company as a result of the announcement and consummation of the transactions described herein ; ( 6 ) costs related to the proposed transaction ; ( 7 ) changes in political, economic or industry conditions, the interest rate environment or financial and capital markets, which could result in changes in demand for products or services or in the value of assets under management ; ( 8 ) the relative and absolute investment performance of advised or sponsored investment products ; ( 9 ) the impact of capital improvement projects ; ( 10 ) the impact of future acquisitions or divestitures ; ( 11 ) the unfavorable resolution of legal proceedings ; ( 12 ) the extent and timing of any share repurchases ; ( 13 ) the impact, extent and timing of technological changes and the adequacy of intellectual property protection ; ( 14 ) the impact of legislative and regulatory actions and reforms and regulatory, supervisory or enforcement actions of government agencies relating to HF 2 ; ( 15 ) terrorist activities and international hostilities, which may adversely affect the general economy, financial and capital markets, specific industries, and HF 2 ; ( 16 ) the ability to attract and retain highly talented professionals ; and ( 17 ) the impact of changes to tax legislation and, generally, the tax position of HF 2 . HF 2 ’s filings with the SEC , including HF 2 ’s definitive proxy statement in connection with the stockholder vote on the proposed transaction, accessible on the SEC’s website at http : //www . sec . gov, discuss these factors in more detail and identify additional factors that can affect forward - looking statements .

HF2 F INANCIAL M ANAGEMENT I NC . Introduction 1 (1) As of September 30, 2014. AUM primarily is comprised of ( i ) cash plus aggregate principal balance of investments with respect to certain non - mark - to - market structured vehicles; (ii) cash plus market value of investments with respect to certain structured vehicles; (iii) total assets for mark - to - market funds and separately managed acco unts; and (iv) uncalled capital commitments, if any, for funds that are not in liquidation. AUM also includes assets in the warehouse phase for new structured credit vehicles and does not treat leverage and other operating liabilities as a reduction of AUM. ZAIS’s September 30, 2014 AUM uses values for: ZAIS Value - Added Real Estate Fund I, L.P. as of June 30, 2014, Epics I, Ltd. and Co - Epics I, Ltd. as of Se ptember 15, 2014, Euro Epics and Galleria CDO V, Ltd. as of September 10, 2014, ZAIS Investment Grade Limited IX as of September 3, 2014 and ZAIS CLO 1, Limited as of September 4, 2014. ▪ Outstanding team ▪ Strong reputation with institutional investors ▪ Distinguished investment track record across multiple market cycles since 1997 ▪ Robust and scalable platform ▪ Specifically identified growth initiatives ▪ Experience managing public REIT ZAIS is a dynamic investment management firm with approximately $ 4 . 7 billion ( 1 ) of AUM focused on specialized credit investments HF2 F INANCIAL M ANAGEMENT I NC . ▪ ~$175 million available for business combination ▪ Listed on NASDAQ (“HTWO”) ▪ No dilutive warrants or options ▪ Launched by principals of Berkshire Capital Securities LLC ▪ Leading M&A advisory boutique focused exclusively on the financial services industry ▪ Sponsor of an earlier successful SPAC, Highbury Financial Inc. (“HBRF”) HF 2 is a special purpose acquisition company with a focus on companies operating in the financial services industry

HF2 F INANCIAL M ANAGEMENT I NC . Overview 2 (1) As of June 30, 2014. Please see page 9 for a calculation of this initial valuation multiple and Exhibit B for an explanation of Adjusted EBITDA as well as the reconciliation to Total Comprehensive Income (Loss). Transaction ▪ HF2 to acquire majority equity interest in ZAIS ▪ No liquidity for current owners of ZAIS at closing ▪ 100% of HF2’s cash investment to fuel ZAIS’ strategic growth initiatives ▪ ZAIS team will assume leadership of the combined company ▪ Special meeting of stockholders scheduled for February 19, 2015 ▪ Approval of HF2 stockholders required to consummate transaction ▪ HF2 stockholders may redeem public shares for $10.50 per share ▪ Some HF2 stockholders will seek liquidity in open market in advance of special meeting Timing and Process ▪ Attractive initial valuation for public investors today ▪ 3.9x LTM Adjusted EBITDA from existing business lines ( 1) ▪ Plus: investment returns to HF2’s invested cash from scaling new business lines ▪ Plus: management and incentive fees from 3 rd party clients in new business lines ▪ 4 - 6% anticipated yield from quarterly dividends to be paid from distributable earnings Compelling Investment Opportunity Today

HF2 F INANCIAL M ANAGEMENT I NC . Transaction Summary 3 (1) Assumes no HF2 stockholder redemptions and no other closing adjustments . Ownership interests retained by current ZAIS owners and received by ZAIS employees will be in the form of units of ZAIS Group Parents, LLC (“Units”) and will be exchangeable into shares of Class A common stock, subject to certain restric tio ns, initially in on a 1 - for - 1 ratio. (2) Up to 1,600,000 Units to be issued to key employees following closing, which are subject to a two - year cliff vesting period. Un vested Units do not participate in distributions and will be cancelled upon employees’ termination for any reason before the end of the vesting period. (3) Assumes issuance of 8,000,000 additional Units (maximum issuable) based on achievement of all four Total Value per HF2 Share hurdles. (4) Equal to the sum of (i) the average closing price during the 20 trading day period ending on any measurement date and (ii) th e c umulative dividends paid between the closing and the beginning of such 20 trading day period . ▪ HF2 to invest 100 % of its capital in ZAIS to drive strategic growth ▪ Approximately 73% ownership post - closing HF2 ▪ Approximately 22% ownership post - closing ▪ Two - year lockup with annual liquidity limits thereafter ▪ Additional equity incentives available based on growth in stockholder value Current ZAIS Owners ▪ Approximately 5% ownership post - closing ▪ Two - year cliff vesting / lockup with annual liquidity limits thereafter ▪ Additional equity incentives available based on growth in stockholder value Key Employees All figures in millions, except per share amounts or as noted otherwise After At Closing Contingent Issuances # % # % Current HF2 shareholders 23.6 73.3% 23.6 58.7% Current ZAIS owners 7.0 21.7% 9.8 (3) 24.4% ZAIS employees 1.6 (2) 5.0% 6.8 (3) 16.9% Total 32.2 100.0% 40.2 100.0% Ownership (1) Structure of Contingent Issuances Total Contingent Value per HF2 Additional Units Share Hurdle (4) Tranche 1 2.0 12.50$ Tranche 2 2.0 15.00$ Tranche 3 2.0 18.00$ Tranche 4 2.0 21.50$

HF2 F INANCIAL M ANAGEMENT I NC . Multiple Value Drivers 4 (1) As of September 30, 2014. (2) As of June 30, 2014 . Please see page 9 for a calculation of this initial valuation multiple and Exhibit B for an explanation of Adjusted EBITDA as well as the reconciliation to Total Comprehensive Income (Loss). Robust Core Business ▪ Skilled team with experience investing across a wide range of credit investments ▪ $4.7b of assets under management ( 1) ▪ $42.1m LTM Adjusted EBITDA (2) ▪ New separately managed accounts and investments in Opportunity Fund ▪ Additional corporate CLO issuances ▪ Enhanced sales, marketing and distribution efforts Organic Growth ▪ Up to $175m of new capital from HF2 to catalyze incremental growth initiatives ▪ 10 - 20% anticipated returns to ZGP on invested capital ▪ Invested capital creates new investment vehicles for clients, fee streams for ZAIS Returns to Invested Capital ▪ Residential mortgage conduit platform ▪ Credit and credit derivatives trading fund ▪ Commercial real estate CLO platform Platforms for Incremental Growth

HF2 F INANCIAL M ANAGEMENT I NC . Robust Core Business with Organic Growth Potential 5 (1) Does not include anticipated attrition over the next five years of approximately $290 million of assets managed in structure vehicles in connection with the normal run - off of assets in those vehi cles. (2) Fees rates for new managed account assets anticipated to be consistent with average fee rates for existing managed accounts. Fee rates for new structured vehicles (corporate CLOs) anticipated to be consistent with market rate fees for recently issued CLOs (0.35% - 0.45% on assets plus private equity - style performance fee). (3) ZAIS launched its corporate CLO platform in late 2013 and began purchasing loans in late March 2014. As of September 30, 2014 , n ew corporate CLO assets totaled $637 million Diversified investment platform with multiple investment structures and revenue streams Near - Term Growth Initiatives ▪ Raise capital in separately managed accounts for identified investment opportunity ▪ 2015 target: $500 million new client capital ▪ Continue growth of corporate CLO platform ▪ 2015 target: $1 billion of incremental CLO assets (3) ▪ Enhance sales and marketing efforts ▪ 2015 plan: hire global head of distribution ▪ Pursue expansion into additional distribution channels

HF2 F INANCIAL M ANAGEMENT I NC . Residential Mortgage Conduit Business 6 (1) As of January 26, 2015. (2) Targeted economics do not represent actual results. There is no assurance that the targeted economics will be achieved. Subje ct to adjustment based on market conditions and opportunities. Returns to external capital would be lower due to management and incentive fees. See Exhibit A for additional assumptions and a hypothetical illustration. Opportunity ▪ Constrained mortgage lending environment ▪ Good borrowers unable to obtain loans ▪ Investors seeking attractive relative yields in newly originated mortgages Strategy ▪ Use ZAIS equity to capitalize a warehouse facility ▪ Purchase individual residential mortgage loans directly from originators ▪ Allocate loans to securitization vehicles or to ZAIS - managed funds or accounts Implementation & Outlook (1) ▪ Agreements inked with 4 approved originators, 14 approvals in process and 9 active prospects ▪ Conduit program is an approved purchaser from 13 warehouse banks; 8 approvals in process ▪ Proprietary web - based platform operational; live on 2 major loan pricing engines ▪ Current pipeline: 2 purchased loans, 3 locked loans and 1 in due diligence since December ▪ Capital from HF2 may be deployed promptly to pursue significant scale in a very large market Overview Target Economics (2) ▪ First $100m of capital from HF2 transaction to be allocated promptly post - closing ▪ Ramp - up targets: $1 billion of new loans purchased in year 1, $10 billion in year 3 ▪ 7 - 8% return to invested capital in warehouse (per securitization) ▪ Origination, management and/or incentive fees on 3rd party capital

HF2 F INANCIAL M ANAGEMENT I NC . 7 Opportunity ▪ Regulatory pressures driving significant changes ▪ Disintermediation of banks as liquidity providers ▪ Proprietary trading shifting away from banks ▪ Improving technology for trading / exchange of debt securities and derivatives Credit and Credit Derivatives Trading and Positioning Fund (1) Targeted economics do not represent actual results. There is no assurance that the targeted economics will be achieved. Subje ct to adjustment based on market conditions and opportunities. Returns to external capital would be lower due to management and incentive fees. (2) Assumes closing consideration exceeds $100 million. If closing consideration does not exceed $100 million, all of the closing co nsideration will be allocated to the residential mortgage conduit business. (3) Fee rates anticipated to be similar to fee rates on ZAIS Opportunity Fund. Overview Strategy ▪ Seed new commingled fund focused on trading credit and credit derivatives ▪ Open fund to third party investors Implementation & Outlook ▪ Capital from HF2 may be deployed immediately in existing investment strategies ▪ Anticipate raising third party capital beginning 6 months post - closing ▪ Developing incremental trading strategies to exploit market inefficiencies Target Economics (1) ▪ Up to $75m of capital from HF2 transaction to be allocated (2) ▪ Initial new capital target: $100 million per year ▪ 15 - 20% targeted annual investment returns ▪ ZAIS will earn market rate management and incentive fees on 3 rd party capital (3)
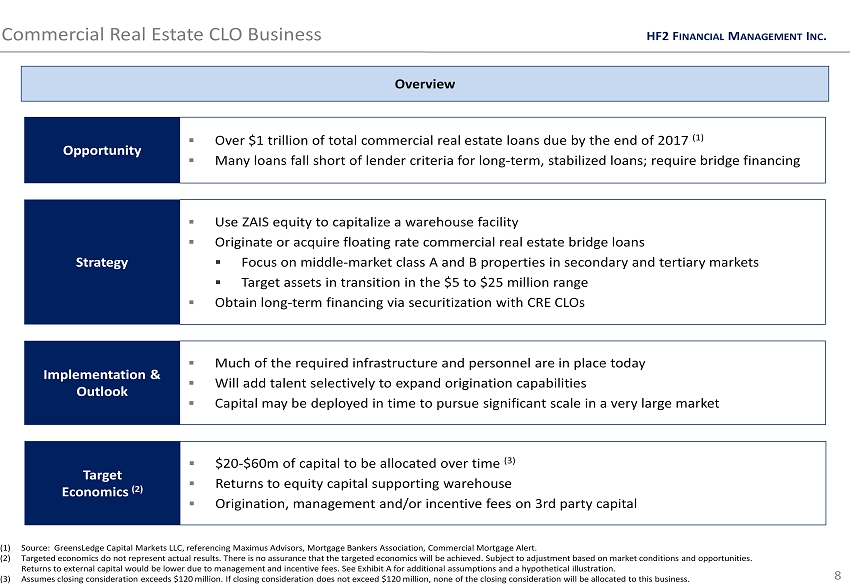
HF2 F INANCIAL M ANAGEMENT I NC . 8 Opportunity ▪ Over $1 trillion of total commercial real estate loans due by the end of 2017 (1) ▪ Many loans fall short of lender criteria for long - term, stabilized loans; require bridge financing Strategy ▪ Use ZAIS equity to capitalize a warehouse facility ▪ Originate or acquire floating rate commercial real estate bridge loans ▪ Focus on middle - market class A and B properties in secondary and tertiary markets ▪ Target assets in transition in the $5 to $25 million range ▪ Obtain long - term financing via securitization with CRE CLOs Implementation & Outlook ▪ Much of the required infrastructure and personnel are in place today ▪ Will add talent selectively to expand origination capabilities ▪ Capital may be deployed in time to pursue significant scale in a very large market Commercial Real Estate CLO Business (1) Source: GreensLedge Capital Markets LLC, referencing Maximus Advisors, Mortgage Bankers Association, Commercial Mortgage Ale rt. (2) Targeted economics do not represent actual results. There is no assurance that the targeted economics will be achieved. Subje ct to adjustment based on market conditions and opportunities. Returns to external capital would be lower due to management and incentive fees. See Exhibit A for additional assumptions and a hypothetical illustration . (3) Assumes closing consideration exceeds $ 120 million. If closing consideration does not exceed $ 120 million, none of the closing consideration will be allocated to this business. Overview Target Economics (2) ▪ $20 - $60m of capital to be allocated over time (3) ▪ Returns to equity capital supporting warehouse ▪ Origination, management and/or incentive fees on 3rd party capital

HF2 F INANCIAL M ANAGEMENT I NC . Financial Metrics (1) Assumes no HF2 stockholder redemptions and no other closing adjustments . Includes 7.0 million Class A Units to be held by current ZAIS owners and 1.6 million Class B Units to be held by ZAIS empl oye es following closing, which will be exchangeable into Class A Common Stock in the future, subject to certain limitations. (2) The actual price per share of HF2 Class A common stock may differ. (3) These financials include unaudited, Non - GAAP performance measures that ZAIS management uses to evaluate its operating performanc e and exclude revenue and expenses of investment vehicles required to be consolidated in accordance with GAAP. Please refer to Exhibit E for the reconciliation from GAAP to these Non - GAAP perfor mance measures and the explanations for the Non - GAAP adjustments. 9 All figures in millions, except per share amounts or as noted otherwise ▪ Strong investment platform with consistent profitability and recurring management fees and incentive income ▪ ZAIS has been profitable in every year since its inception Last 10 years: average of $36.4 million; high of $107.8 million in 2007; low of $2.9 million in 2009 ▪ ZAIS generated incentive income in every year since 2004 ▪ Flexible cost structure going forward supports profitability and provides incentives for growth ▪ Total compensation expense anticipated to be capped at 50% of total revenue net of all non - compensation expenses ▪ Incentive compensation expense to vary in proportion to realized incentive income Summary ZGP Financials (3) Current Valuation Shares outstanding at closing (1) 32.2 Illustrative price per share (2) 10.50$ Total equity value 338$ Less: estimated HF2 cash 175 Implied enterprise value 163$ LTM Adjusted EBITDA as of 6/30/14 (3) 42.1$ Implied EV / LTM Adjusted EBITDA 3.9x 9 Months LTM as Year Ended December 31, 6ME June 30, Ended 9/30/14 of 6/30/14 2013 2012 Management fee income 23.4$ 33.5$ 36.8$ 37.3$ Incentive income 52.5 71.7 38.0 127.6 Other revenues 0.5 1.0 1.4 1.4 Total revenues 76.4 106.2 76.2 166.3 Employee compensation & benefits (39.1) (50.0) (42.2) (77.2) General, administrative & other (13.1) (13.6) (20.1) (24.4) Total operating expenses (52.2) (63.6) (62.3) (101.6) Other income (expense) 0.7 (0.5) (0.5) (1.0) Adjusted EBITDA 24.9$ 42.1$ 13.4$ 63.7$

HF2 F INANCIAL M ANAGEMENT I NC . 0.0x 5.0x 10.0x 15.0x 20.0x OMAM MDLY FSAM ZAIS At IPO At 1/23/15 Compelling Relative Valuation Today (1) Date of IPO for OMAM was October 9, 2014 . Date of IPO for MDLY was September 24, 2014 . Date of IPO for FSAM was October 30, 2014. Source : Sandler O’Neill + Partners, L.P. ( with reference to Bloomberg, company filings) 10 Current pricing represents discounted value relative to other asset management firms to come public recently LTM EV / EBITDA Multiples (1) Accretion to minimum valuation of comparable firms indicates significant potential upside from current share price

HF2 F INANCIAL M ANAGEMENT I NC . Potential for Significant Revenue Enhancement in Year 1 11 Robust Core Business ▪ Revenue potential of existing business ▪ A dditional revenue from targeted new accounts ▪ Additional revenue from targeted new CLO issuances Organic Growth ▪ Yields to equity in securitization process in residential mortgage conduit business ▪ Investment income from target returns in credit trading fund Returns to Invested Capital ▪ Management fees from mortgage conduit securitizations (either public or private) ▪ Management and incentive fees from credit trading fund Platforms for Incremental Growth ▪ Revenue potential of existing business ▪ Plus: Significant additional investment income and fee revenue from growth initiatives Dynamic Investment Platform
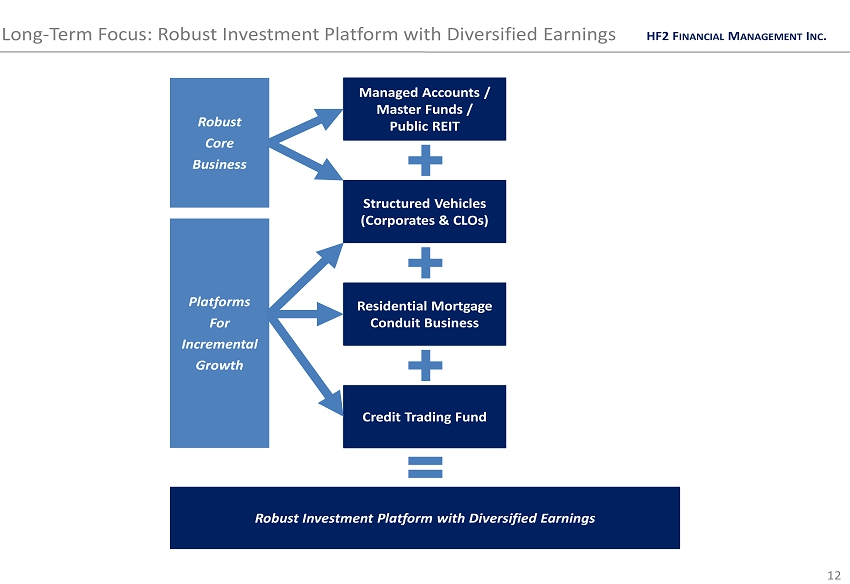
HF2 F INANCIAL M ANAGEMENT I NC . Long - Term Focus: Robust Investment Platform with Diversified Earnings 12 Managed Accounts / Master Funds / Public REIT Residential Mortgage Conduit Business Credit Trading Fund Robust Investment Platform with Diversified Earnings Structured Vehicles (Corporates & CLOs) Robust Core Business Platforms For Incremental Growth
Exhibits CONFIDENTIAL A. Platforms for Incremental Growth B. Financial Statements
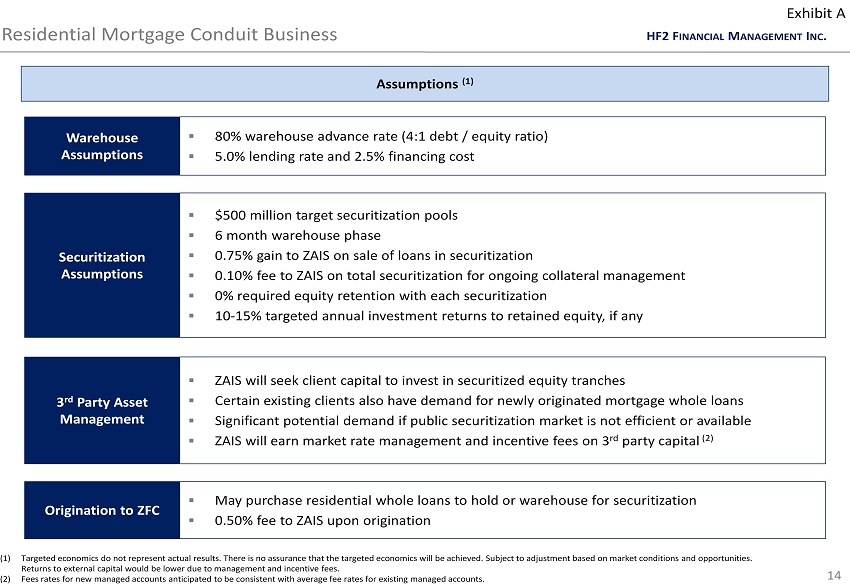
HF2 F INANCIAL M ANAGEMENT I NC . Residential Mortgage Conduit Business 14 Warehouse Assumptions ▪ 80% warehouse advance rate (4:1 debt / equity ratio) ▪ 5.0% lending rate and 2.5% financing cost Origination to ZFC ▪ May purchase residential whole loans to hold or warehouse for securitization ▪ 0.50% fee to ZAIS upon origination Securitization Assumptions ▪ $500 million target securitization pools ▪ 6 month warehouse phase ▪ 0.75 % gain to ZAIS on sale of loans in securitization ▪ 0.10% fee to ZAIS on total securitization for ongoing collateral management ▪ 0% required equity retention with each securitization ▪ 10 - 15% targeted annual investment returns to retained equity, if any 3 rd Party Asset Management ▪ ZAIS will seek client capital to invest in securitized equity tranches ▪ Certain existing clients also have demand for newly originated mortgage whole loans ▪ Significant potential demand if public securitization market is not efficient or available ▪ ZAIS will earn market rate management and incentive fees on 3 rd party capital (2) (1) Targeted economics do not represent actual results. There is no assurance that the targeted economics will be achieved. Subje ct to adjustment based on market conditions and opportunities. Returns to external capital would be lower due to management and incentive fees. (2) Fees rates for new managed accounts anticipated to be consistent with average fee rates for existing managed accounts. Exhibit A Assumptions (1)
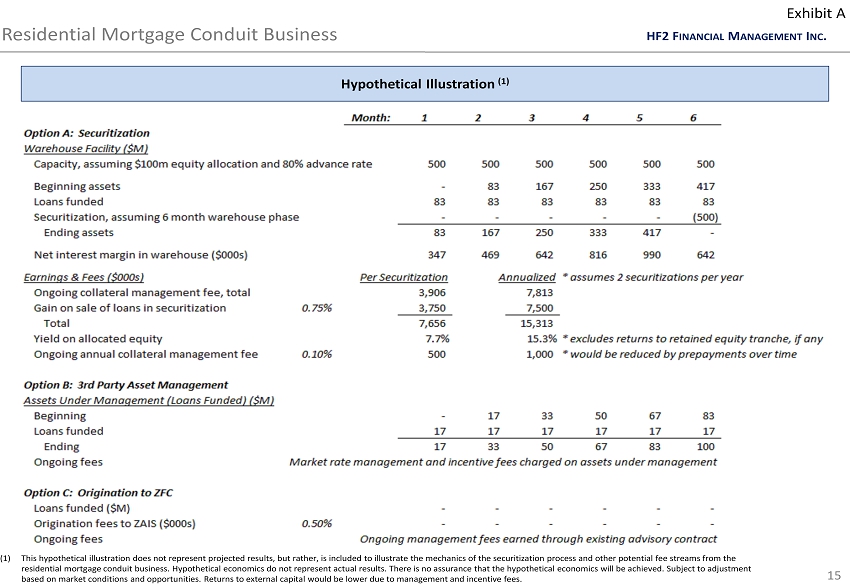
HF2 F INANCIAL M ANAGEMENT I NC . Residential Mortgage Conduit Business 15 Hypothetical Illustration (1) Exhibit A (1) This hypothetical illustration does not represent projected results, but rather, is included to illustrate the mechanics of t he securitization process and other potential fee streams from the residential mortgage conduit business. Hypothetical economics do not represent actual results. There is no assurance that the hypothetical economics will be achieved. Subject to adjustment based on market conditions and opportunities. Returns to external capital would be lower due to management and incentive fees .

HF2 F INANCIAL M ANAGEMENT I NC . Commercial Real Estate CLO Business 16 Warehouse Assumptions ▪ 75% warehouse advance rate (3:1 debt / equity ratio) ▪ 5.5% lending rate and 3.0% financing cost Securitization Assumptions ▪ $250 million target securitization pools ▪ 6 month warehouse phase ▪ 0.33% fee to ZAIS on total securitization for ongoing collateral management ▪ 5% required equity retention with each securitization ▪ 15 - 18% targeted annual investment returns to retained equity 3 rd Party Asset Management ▪ ZAIS will seek client capital to co - invest in securitized equity tranches ▪ ZAIS will earn market rate management and incentive fees on 3 rd party capital (2) (1) Targeted economics do not represent actual results. There is no assurance that the targeted economics will be achieved. Subje ct to adjustment based on market conditions and opportunities. Returns to external capital would be lower due to management and incentive fees. (2) Fees rates for new managed accounts anticipated to be consistent with average fee rates for existing managed accounts. Exhibit A Assumptions (1)

HF2 F INANCIAL M ANAGEMENT I NC . 17 Commercial Real Estate CLO Business Exhibit A Hypothetical Illustration (1) (1) This hypothetical illustration does not represent projected results, but rather, is included to illustrate the mechanics of t he securitization process for the CRE - CLO business. Hypothetical economics do not represent actual results. There is no assurance that the hypothetical economics will be achieved. Subject to adjustment based on market conditions and opportunities. Returns to external capital would be lower due to management and incentive fees. Month: 1 2 3 4 5 6 Securitization Warehouse Facility ($M) Capacity, assuming $40m equity and 75% advance rate 160 160 160 160 160 160 Beginning assets - 27 53 80 107 133 Loans funded 27 27 27 27 27 27 Securitization, assuming 6 month warehouse phase - - - - - (160) Ending assets 27 53 80 107 133 - Net interest margin in warehouse ($000s) 122 183 239 294 350 239 Earnings & Fees ($000s) Per Securitization Annualized* assumes 2 securitizations per year Net interest margin in warehouse, total 1,428 2,856 Yield on allocated equity 3.6% 7.1%* excludes returns to retained equity tranche Ongoing annual collateral management fee 0.33% 528 1,056 Fees from 3rd party clients Market rate management and incentive fees charged on client equity alongside ZAIS equity in warehouse
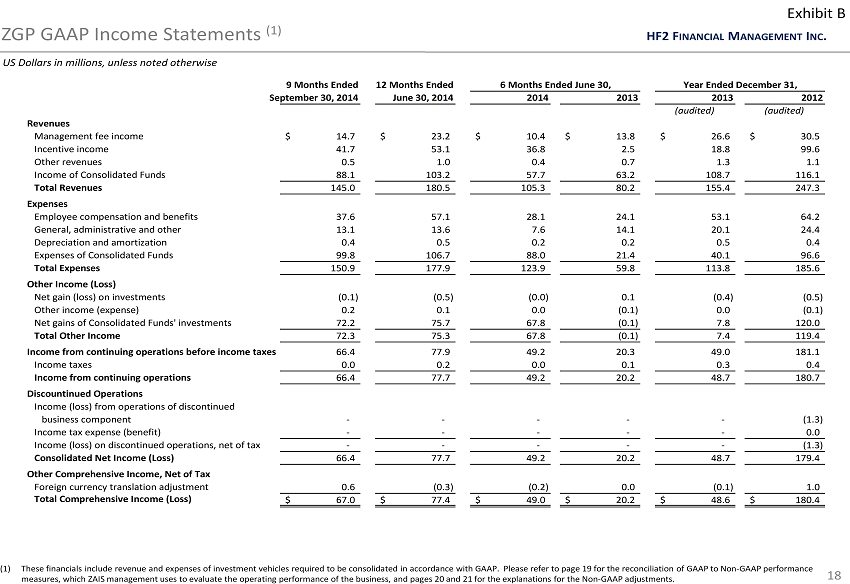
HF2 F INANCIAL M ANAGEMENT I NC . ZGP GAAP Income Statements (1) 18 Exhibit B (1) These financials include revenue and expenses of investment vehicles required to be consolidated in accordance with GAAP. Please refer to page 19 for the reconciliation of GAAP to Non - GAAP performance measures, which ZAIS management uses to evaluate the operating performance of the business, and pages 20 and 21 for the explanations for the Non - GAAP adjustments . US Dollars in millions, unless noted otherwise 9 Months Ended 12 Months Ended 6 Months Ended June 30, Year Ended December 31, September 30, 2014 June 30, 2014 2014 2013 2013 2012 (audited) (audited) Revenues Management fee income 14.7$ 23.2$ 10.4$ 13.8$ 26.6$ 30.5$ Incentive income 41.7 53.1 36.8 2.5 18.8 99.6 Other revenues 0.5 1.0 0.4 0.7 1.3 1.1 Income of Consolidated Funds 88.1 103.2 57.7 63.2 108.7 116.1 Total Revenues 145.0 180.5 105.3 80.2 155.4 247.3 Expenses Employee compensation and benefits 37.6 57.1 28.1 24.1 53.1 64.2 General, administrative and other 13.1 13.6 7.6 14.1 20.1 24.4 Depreciation and amortization 0.4 0.5 0.2 0.2 0.5 0.4 Expenses of Consolidated Funds 99.8 106.7 88.0 21.4 40.1 96.6 Total Expenses 150.9 177.9 123.9 59.8 113.8 185.6 Other Income (Loss) Net gain (loss) on investments (0.1) (0.5) (0.0) 0.1 (0.4) (0.5) Other income (expense) 0.2 0.1 0.0 (0.1) 0.0 (0.1) Net gains of Consolidated Funds' investments 72.2 75.7 67.8 (0.1) 7.8 120.0 Total Other Income 72.3 75.3 67.8 (0.1) 7.4 119.4 Income from continuing operations before income taxes 66.4 77.9 49.2 20.3 49.0 181.1 Income taxes 0.0 0.2 0.0 0.1 0.3 0.4 Income from continuing operations 66.4 77.7 49.2 20.2 48.7 180.7 Discountinued Operations Income (loss) from operations of discontinued business component - - - - - (1.3) Income tax expense (benefit) - - - - - 0.0 Income (loss) on discontinued operations, net of tax - - - - - (1.3) Consolidated Net Income (Loss) 66.4 77.7 49.2 20.2 48.7 179.4 Other Comprehensive Income, Net of Tax Foreign currency translation adjustment 0.6 (0.3) (0.2) 0.0 (0.1) 1.0 Total Comprehensive Income (Loss) 67.0$ 77.4$ 49.0$ 20.2$ 48.6$ 180.4$

HF2 F INANCIAL M ANAGEMENT I NC . ZGP Non - GAAP Performance Measures (1) 19 Exhibit B (1) Please refer to the following page for further disclosure and an explanation of these Non - GAAP performance measures . US Dollars in millions, unless noted otherwise 9 Months Ended 12 Months Ended 6 Months Ended June 30, Year Ended December 31, September 30, 2014 June 30, 2014 2014 2013 2013 2012 Total Comprehensive Income (Loss) 67.0$ 77.4$ 49.0$ 20.2$ 48.6$ 180.4$ Addback: Eliminations to Management fee income 8.7 10.3 7.5 7.4 10.2 6.8 Addback: Eliminations to Incentive income 10.8 18.6 9.7 10.3 19.2 28.0 Addback: Eliminations to Other revenues 0.0 0.1 0.0 0.1 0.1 0.3 Less: Income of Consolidated Funds (88.1) (103.2) (57.7) (63.2) (108.7) (116.1) Plus: Expenses of Consolidated Funds 99.8 106.7 88.0 21.4 40.1 96.6 Less: Net gains of Consolidated Funds' investments (72.2) (75.7) (67.8) 0.1 (7.8) (120.0) Less: Unrealized gain (loss) on investments (0.0) 0.1 0.1 (0.1) (0.0) (0.1) Plus: Compensation attributable to Income Unit Plan 6.2 6.1 4.1 2.0 4.0 - Reclassification of incentive compensation (7.7) 1.0 (6.8) (0.9) 6.9 (13.0) Distributable Earnings (1) 24.5$ 41.4$ 26.1$ (2.7)$ 12.6$ 62.9$ Plus: Depreciation and amortization 0.4 0.5 0.2 0.2 0.5 0.4 Plus: Income taxes 0.0 0.2 0.0 0.1 0.3 0.4 Adjusted EBITDA (1) 24.9$ 42.1$ 26.3$ (2.4)$ 13.4$ 63.7$

HF2 F INANCIAL M ANAGEMENT I NC . Explanation of Non - GAAP Performance Measures 20 Exhibit B In addition to analyzing results on a GAAP basis, ZAIS management also reviews its results on a “Distributable Earnings ” and “Adjusted EBITDA” basis . Distributable Earnings and Adjusted EBITDA exclude the adjustments described below that are required for presentation of results on a GAAP basis, but that ZAIS management does not consider when evaluating operating performance in any given period . ZAIS management, therefore, uses Distributable Earnings and Adjusted EBITDA as the basis on which it evaluates its financial performance . ZAIS management considers it important that investors review the same operating information that it uses . Distributable Earnings Distributable Earnings is a measure of operating performance before U . S . federal and state income taxes that is intended to show the amount of net realized earnings without the effects of consolidation of the Consolidated Funds, and other non - cash or non - operating items . Distributable Earnings excludes the following from results on a GAAP basis : ▪ Amounts related to the ZAIS Consolidated Funds, including the related eliminations of management fee income, incentive income an d other revenues, as ZAIS management reviews the total amount of management fee income, incentive income and other revenues earned in re lation to total assets under management and fund performance. Management fee income allocations from ZAIS Consolidated Funds are ac cru ed as earned and are calculated and paid monthly, quarterly, or annually, depending on the individual agreements, consistent with t he revenue recognition policy for the funds ZAIS does not consolidate. ZAIS also defers the recognition of incentive income allocations fr om the ZAIS Consolidated Funds until it is ( i ) contractually receivable (ii) fixed or determinable (“crystallized”), and (iii) all related contingencies have been removed and collection is reasonably assured, consistent with the revenue recognition policy for the funds ZAIS does not cons oli date. ▪ Net unrealized gains (losses) on investments in ZAIS funds, as ZAIS management does not consider these non - cash items to be reflective of operating performance. ▪ Employee compensation and benefits amounts attributable to ZAIS’s Income Unit Plan. The Income Unit Plan was initially implemented in 201 3 and was designed to deliver equity - like participation in ZAIS’s pre - tax income to key employees. Payments under the Income Unit Plan are recognized as compensation under GAAP. The Income Unit Plan will terminate at the end of 2014. Employees will participate in ZA IS’s profits and growth going forward through the equity allocations set forth elsewhere in this presentation . ▪ Adjustments to reclassify certain of ZAIS’s legacy incentive compensation programs that were not designed for a GAAP environment. These programs provided incentive compensation payments equal to a fixed percentage of incentive fees received by ZAIS and were due an d payable in the period ZAIS received the incentive fees. Under GAAP, a portion of these incentive compensation payments are required to be recognized in accounting periods prior to the accounting periods in which the related incentive fees were received and recognized. These adjustments reclassify these certain incentive compensation expenses into the accounting period in which the associated incentive fees we re received and recognized. One of ZAIS’s existing incentive compensation programs with respect to one single separate account may cause a similar timing issue in the future. Otherwise , none of ZAIS’s current or ongoing incentive compensation programs are expected to cause similar timing issues for financial statements prepared in accordance with GAAP . ▪ Amounts related to equity - based compensation, as ZAIS management does not consider these non - cash expenses to be reflective of its operating performance . ▪ Certain other non - cash and non - operating items.
HF2 F INANCIAL M ANAGEMENT I NC . Explanation of Non - GAAP Performance Measures (cont.) 21 Exhibit B Adjusted EBITDA Adjusted EBITDA is a component of Distributable Earnings and is used to measure ZAIS’s ability to cover recurring operating expenses from cash earnings . Adjusted EBITDA is computed as Distributable Earnings excluding any applicable taxes, interest expense, and depreciation and amortization expenses . As a result of the adjustments described above, management fee income, incentive income and other revenues as presented on both a Distributable Earnings and Adjusted EBITDA basis are also non - GAAP measures . ZAIS’s non - GAAP financial measures should not be considered as alternatives to its GAAP net income (loss), or as indicative of l iquidity or the cash available to fund operations. ZAIS’s non - GAAP performance measures may not be comparable to similarly titled measures used by o ther companies.