Attached files
| file | filename |
|---|---|
| EX-32.2 - EXHIBIT 32.2 - ZAIS Group Holdings, Inc. | v451610_ex32-2.htm |
| EX-32.1 - EXHIBIT 32.1 - ZAIS Group Holdings, Inc. | v451610_ex32-1.htm |
| EX-31.2 - EXHIBIT 31.2 - ZAIS Group Holdings, Inc. | v451610_ex31-2.htm |
| EX-31.1 - EXHIBIT 31.1 - ZAIS Group Holdings, Inc. | v451610_ex31-1.htm |
UNITED STATES
SECURITIES AND EXCHANGE COMMISSION
Washington, D.C. 20549
FORM 10-Q
(Mark One)
| x | QUARTERLY REPORT PURSUANT TO SECTION 13 OR 15(d) OF THE SECURITIES EXCHANGE ACT OF 1934 |
For the quarterly period ended September 30, 2016
| ¨ | TRANSITION REPORT PURSUANT TO SECTION 13 OR 15(d) OF THE SECURITIES EXCHANGE ACT OF 1934 |
For the transition period from to
Commission file number: 001-35848
ZAIS GROUP HOLDINGS, INC.
(Exact Name of Registrant as Specified in Its Charter)
| Delaware | 46-1314400 |
| (State or Other Jurisdiction of Incorporation or Organization) |
(I.R.S. Employer Identification No.) |
Two Bridge Avenue, Suite 322
Red Bank, NJ 07701-1106
(Address of Principal Executive Offices and Zip Code)
(732) 978-7518
(Registrant’s Telephone Number, Including Area Code)
Indicate by check mark whether the registrant: (1) has filed all reports required to be filed by Section 13 or 15(d) of the Securities Exchange Act of 1934 during the preceding 12 months (or for such shorter period that the registrant was required to file such reports), and (2) has been subject to such filing requirements for the past 90 days. Yes x No ¨
Indicate by check mark whether the registrant has submitted electronically and posted on its corporate Web site, if any, every Interactive Data File required to be submitted and posted pursuant to Rule 405 of Regulation S-T (§232.405 of this chapter) during the preceding 12 months (or for such shorter period that the registrant was required to submit and post such files). Yes x No ¨
Indicate by check mark whether the registrant is a large accelerated filer, an accelerated filer, a non-accelerated filer, or a smaller reporting company. See the definitions of “large accelerated filer,” “accelerated filer” and “smaller reporting company” in Rule 12b-2 of the Exchange Act. (Check one):
| Large accelerated filer ¨ | Accelerated filer x |
| Non-accelerated filer ¨ | Smaller reporting company ¨ |
| (Do not check if smaller reporting company) |
Indicate by check mark whether the registrant is a shell company (as defined in Rule 12b-2 of the Exchange Act). Yes ¨ No x
As of November 3, 2016, 13,900,917 shares of Class A common stock, par value $0.0001 per share, and 20,000,000 shares of Class B Common Stock, par value $0.000001 per share, were issued and outstanding.
TABLE OF CONTENTS
| PART I – FINANCIAL INFORMATION | 3 |
| Item 1. Financial Statements | 3 |
| Item 2. MANAGEMENT’S DISCUSSION AND ANALYSIS OF FINANCIAL CONDITION AND RESULTS OF OPERATIONS | 31 |
| Item 3. Quantitative and Qualitative Disclosures About Market Risk | 49 |
| Item 4. Controls and Procedures | 50 |
| PART II − OTHER INFORMATION | 51 |
| Item 1A. Risk Factors | 51 |
| Item 2. Unregistered Sales of Equity Securities and Use of Proceeds | 51 |
| Item 3. Defaults Upon Senior Securities | 51 |
| Item 4. Mine Safety Disclosures | 51 |
| Item 5. Other Information | 51 |
| Item 6. Exhibits | 51 |
| SIGNATURES | 52 |
| EXHIBIT 31.1 CERTIFICATIONS | |
| EXHIBIT 31.2 CERTIFICATIONS | |
| EXHIBIT 32.1 CERTIFICATION PURSUANT TO SECTION 906 OF THE SARBANES-OXLEY ACT OF 2002, 18 U.S.C. SECTION 1350 | |
| EXHIBIT 32.2 CERTIFICATION PURSUANT TO SECTION 906 OF THE SARBANES-OXLEY ACT OF 2002, 18 U.S.C. SECTION 1350 |
| 2 |
PART I – FINANCIAL INFORMATION
ZAIS GROUP HOLDINGS, INC. AND SUBSIDIARIES
Consolidated Statements of Financial Condition (Unaudited)
(Dollars in thousands)
| September 30, 2016 | December 31, 2015 | |||||||
| Assets | ||||||||
| Cash and cash equivalents | $ | 29,421 | $ | 44,351 | ||||
| Income and fees receivable | 5,311 | 2,529 | ||||||
| Investments, at fair value | — | 8,169 | ||||||
| Investments in affiliates, at fair value | 5,174 | 5,242 | ||||||
| Due from related parties | 912 | 748 | ||||||
| Prepaid expenses | 1,445 | 776 | ||||||
| Other assets | 458 | 310 | ||||||
| Fixed assets, net | 340 | 544 | ||||||
| Assets of Consolidated Funds | ||||||||
| Cash and cash equivalents | — | 33 | ||||||
| Investments, at fair value | 20,348 | 30,509 | ||||||
| Receivable for securities sold | 40,000 | — | ||||||
| Dividend receivable | 8,317 | — | ||||||
| Total Assets | $ | 111,726 | $ | 93,211 | ||||
| Liabilities and Equity | ||||||||
| Liabilities | ||||||||
| Notes payable | $ | 1,261 | $ | 1,255 | ||||
| Compensation payable | 5,672 | 3,575 | ||||||
| Due to related parties | 144 | 175 | ||||||
| Fees payable | — | 756 | ||||||
| Other liabilities | 973 | 1,546 | ||||||
| Liabilities of Consolidated Funds | ||||||||
| Payable for securities purchased | 20,348 | — | ||||||
| Other liabilities | 76 | 101 | ||||||
| Total Liabilities | 28,474 | 7,408 | ||||||
| Commitments and Contingencies (Note 12) | ||||||||
| Equity | ||||||||
| Preferred Stock, $0.0001 par value; 2,000,000 shares authorized; 0 shares issued and outstanding. | — | — | ||||||
| Class A Common Stock, $0.0001 par value; 180,000,000 shares authorized; 13,900,917 and 13,870,917 shares issued and outstanding at September 30, 2016 and December 31, 2015, respectively. | 1 | 1 | ||||||
| Class B Common Stock, $0.000001 par value; 20,000,000 shares authorized; 20,000,000 shares issued and outstanding at September 30, 2016 and December 31, 2015, respectively. | — | — | ||||||
| Additional paid-in capital | 62,809 | 60,817 | ||||||
| Retained earnings (Accumulated deficit) | (23,001 | ) | (13,805 | ) | ||||
| Accumulated other comprehensive income (loss) | (16 | ) | 158 | |||||
| Total stockholders’ equity, ZAIS Group Holdings, Inc. | 39,793 | 47,171 | ||||||
| Non-controlling interests in ZAIS Group Parent, LLC | 19,948 | 23,716 | ||||||
| Non-controlling interests in Consolidated Funds | 23,511 | 14,916 | ||||||
| Total Equity | 83,252 | 85,803 | ||||||
| Total Liabilities and Equity | $ | 111,726 | $ | 93,211 | ||||
The accompanying notes are an integral part of these condensed consolidated financial statements.
| 3 |
ZAIS GROUP HOLDINGS, INC. AND SUBSIDIARIES
Consolidated Statements of Comprehensive Income (Loss) (Unaudited)
(Dollars in thousands)
| Three Months Ended September 30, 2016 | Three Months Ended September 30, 2015 (1) | Nine Months Ended September 30, 2016 | Nine Months Ended September 30, 2015 (1) | |||||||||||||
| Revenues | ||||||||||||||||
| Management fee income | $ | 3,654 | $ | 4,175 | $ | 10,794 | $ | 12,009 | ||||||||
| Incentive income | 3,614 | 3,870 | 3,909 | 5,991 | ||||||||||||
| Other revenues | 79 | 81 | 238 | 218 | ||||||||||||
| Total Revenues | 7,347 | 8,126 | 14,941 | 18,218 | ||||||||||||
| Expenses | ||||||||||||||||
| Compensation and benefits | 6,908 | 6,488 | 23,914 | 20,418 | ||||||||||||
| General, administrative and other | 2,963 | 4,370 | 9,123 | 13,470 | ||||||||||||
| Depreciation | 79 | 445 | 206 | 654 | ||||||||||||
| Expenses of Consolidated Funds | 16 | — | 64 | — | ||||||||||||
| Total Expenses | 9,966 | 11,303 | 33,307 | 34,542 | ||||||||||||
| Other income (loss) | ||||||||||||||||
| Net gain (loss) on investments | 46 | (11 | ) | 83 | 34 | |||||||||||
| Other income (expense) | 53 | 83 | 745 | 88 | ||||||||||||
| Net gains (losses) of Consolidated Funds’ investments | 4,115 | — | 7,808 | — | ||||||||||||
| Total Other Income (Loss) | 4,214 | 72 | 8,636 | 122 | ||||||||||||
| Income (loss) before income taxes | 1,595 | (3,105 | ) | (9,730 | ) | (16,202 | ) | |||||||||
| Income tax (benefit) expense | (21 | ) | (1,528 | ) | (12 | ) | (4,111 | ) | ||||||||
| Consolidated net income (loss), net of tax | 1,616 | (1,577 | ) | (9,718 | ) | (12,091 | ) | |||||||||
| Other comprehensive income (loss), net of tax: | ||||||||||||||||
| Foreign currency translation adjustment | (61 | ) | (160 | ) | (262 | ) | 323 | |||||||||
| Total Comprehensive Income (Loss) | $ | 1,555 | $ | (1,737 | ) | $ | (9,980 | ) | $ | (11,768 | ) | |||||
| Allocation of Consolidated Net Income (Loss), net of tax | ||||||||||||||||
| Non-controlling interests in Consolidated Funds | $ | 1,902 | $ | — | $ | 3,688 | $ | — | ||||||||
| Stockholders’ equity, ZAIS Group Holdings, Inc. | (286 | ) | (568 | ) | (9,196 | ) | (4,337 | ) | ||||||||
| Non-controlling interests in ZAIS Group Parent, LLC | — | (1,009 | ) | (4,210 | ) | (7,754 | ) | |||||||||
| $ | 1,616 | $ | (1,577 | ) | $ | (9,718 | ) | $ | (12,091 | ) | ||||||
| Allocation of Total Comprehensive Income (Loss) | ||||||||||||||||
| Non-controlling interests in Consolidated Funds | $ | 1,902 | $ | — | $ | 3,688 | $ | — | ||||||||
| Stockholders’ equity, ZAIS Group Holdings, Inc. | (326 | ) | (674 | ) | (9,370 | ) | (4,122 | ) | ||||||||
| Non-controlling interests in ZAIS Group Parent, LLC | (21 | ) | (1,063 | ) | (4,298 | ) | (7,646 | ) | ||||||||
| $ | 1,555 | $ | (1,737 | ) | $ | (9,980 | ) | $ | (11,768 | ) | ||||||
| Consolidated Net Income (Loss), net of tax per Class A common share applicable to ZAIS Group Holdings, Inc. – Basic | $ | (0.02 | ) | $ | (0.04 | ) | $ | (0.66 | ) | $ | (0.43 | ) | ||||
| Consolidated Net Income (Loss), net of tax per Class A common share applicable to ZAIS Group Holdings, Inc. – Diluted | $ | (0.02 | ) | $ | (0.06 | ) | $ | (0.66 | ) | $ | (0.54 | ) | ||||
| Weighted average shares of Class A common stock outstanding: | ||||||||||||||||
| Basic | 13,900,917 | 13,870,917 | 13,887,997 | 10,009,416 | (3) | |||||||||||
| Diluted (2) | 20,900,917 | 20,870,917 | 20,887,997 | 17,009,416 | (3) | |||||||||||
| (1) | Subsequent to the filing of the 10-Q for the three months ended March 31, 2015, the Company elected to early adopt ASU 2015-02 with an effective date of January 1, 2015. As a result of this adoption, the majority of the ZAIS Managed Entities which were consolidated in the 10-Q for the three months ended March 31, 2015 were deconsolidated. Additionally, subsequent to the filing of the June 30, 2015 and September 30, 2015 10-Q’s, in December 2015 additional interpretations of ASU 2015-02 became available to the Company. As a result of these new interpretations, the Company reviewed its previous conclusions and determined that additional entities should be deconsolidated. There was no impact on the income (loss) allocated to ZAIS Group Holdings, Inc. Stockholders Equity as a result of this adoption. The September 30, 2015 figures above reflect the consolidated results of the Company for the three and nine months ended September 30, 2015, subsequent to the adoption of ASU 2015-02. |
| (2) | Number of diluted shares outstanding for periods after the Business Combination (as defined in Note 1) takes into account non-controlling interests in ZAIS Group Parent, LLC that may be exchanged for Class A common stock under certain circumstances. |
| (3) | Pro-rated based on the portion of the period preceding and following the Business Combination. |
The accompanying notes are an integral part of these condensed consolidated financial statements.
| 4 |
ZAIS GROUP HOLDINGS, INC. AND SUBSIDIARIES
Consolidated Statement of Changes in Equity
and Non-controlling Interests (Unaudited)
(Dollars in thousands except share amounts)
| Class
A Common Stock | Class B Common Stock | Additional paid-in-capital | Retained (Accumulated | Accumulated other comprehensive income (loss) | Non-controlling interests in ZAIS
Group | Non-controlling interests in Consolidated Funds | Total Equity | |||||||||||||||||||||||||||||||||
| Shares | Amount | Shares | Amount | |||||||||||||||||||||||||||||||||||||
| December 31, 2015 | 13,870,917 | $ | 1 | 20,000,000 | $ | - | $ | 60,817 | $ | (13,805 | ) | $ | 158 | $ | 23,716 | $ | 14,916 | $ | 85,803 | |||||||||||||||||||||
| Vesting of RSUs | 30,000 | - | - | - | - | - | - | - | - | - | ||||||||||||||||||||||||||||||
| Capital contributions | - | - | - | - | - | - | - | - | 4,907 | 4,907 | ||||||||||||||||||||||||||||||
| Capital distributions | - | - | - | - | - | - | - | (429 | ) | - | (429 | ) | ||||||||||||||||||||||||||||
| Equity-based compensation charges | - | - | - | - | 1,962 | - | - | 989 | - | 2,951 | ||||||||||||||||||||||||||||||
| Consolidated net income (loss) | - | - | - | - | - | (9,196 | ) | - | (4,210 | ) | 3,688 | (9,718 | ) | |||||||||||||||||||||||||||
| Rebalancing of ownership between the Company and non-controlling interest in ZAIS Group Parent, LLC | - | - | - | - | 30 | - | - | (30 | ) | - | - | |||||||||||||||||||||||||||||
| Other comprehensive income (loss) | - | - | - | - | - | - | (174 | ) | (88 | ) | - | (262 | ) | |||||||||||||||||||||||||||
| September 30, 2016 | 13,900,917 | $ | 1 | 20,000,000 | $ | - | $ | 62,809 | $ | (23,001 | ) | $ | (16 | ) | $ | 19,948 | $ | 23,511 | $ | 83,252 | ||||||||||||||||||||
The accompanying notes are an integral part of these condensed consolidated financial statements.
| 5 |
ZAIS GROUP HOLDINGS, INC. AND SUBSIDIARIES
Consolidated Statements of Cash Flows (Unaudited)
(Dollars in thousands)
| Nine Months Ended September 30, 2016 | Nine Months Ended September 30, 2015 | |||||||
| Cash Flows from Operating Activities | ||||||||
| Consolidated net income (loss) | $ | (9,718 | ) | $ | (12,091 | ) | ||
| Adjustments to reconcile consolidated net income (loss) to net cash provided by (used in) operating activities: | ||||||||
| Depreciation | 206 | 654 | ||||||
| Net (gain) loss on investments | (83 | ) | (34 | ) | ||||
| Non-cash equity-based compensation | 2,951 | 3,351 | ||||||
| Interest expense on notes payable | 6 | 3 | ||||||
| Operating cash flows due to changes in: | ||||||||
| Income and fees receivable | (2,781 | ) | 9,146 | |||||
| Due from related parties | (164 | ) | 120 | |||||
| Prepaid expenses | (669 | ) | (13 | )(2) | ||||
| Other assets | (157 | ) | 338 | |||||
| Deferred tax asset | — | (4,320 | ) | |||||
| Compensation payable | 2,097 | (3,633 | ) | |||||
| Due to related parties | (31 | ) | 142 | |||||
| Fees payable | (756 | ) | (151 | )(2) | ||||
| Other liabilities | (574 | ) | 117 | (2) | ||||
| Consolidated Funds related items: | ||||||||
| Purchases of investments in affiliated securities | (30,348 | ) | — | (1) | ||||
| Proceeds from sale of securities | 40,000 | — | (1) | |||||
| Change in unrealized (gain) loss on investments | 509 | — | (1) | |||||
| Change in cash and cash equivalents | 33 | — | (1) | |||||
| Change in receivable for securities sold | (40,000 | ) | — | (1) | ||||
| Change in dividend receivable | (8,317 | ) | — | (1) | ||||
| Change in payable for securities purchased | 20,348 | — | (1) | |||||
| Change in other liabilities | (25 | ) | — | (1) | ||||
| Net Cash Provided by (Used in) Operating Activities | (27,473 | ) | (6,371 | ) | ||||
| Cash Flows from Investing Activities | ||||||||
| Purchases of fixed assets | (17 | ) | (178 | ) | ||||
| Distributions from investments in affiliates | 165 | — | (2) | |||||
| Purchases of investments | (11 | ) | (11,152 | )(2) | ||||
| Proceeds from sales of investments | 8,174 | 16 | ||||||
| Net Cash Provided by (Used in) Investing Activities | 8,311 | (11,314 | ) | |||||
| Cash Flows from Financing Activities | ||||||||
| Net proceeds from Business Combination | — | 73,516 | ||||||
| Ending cash at HF2 Financial Management, Inc. | — | 2 | (2) | |||||
| Proceeds from issuance of notes payable | — | 1,250 | ||||||
| Contributions from non-controlling interests in Consolidated Funds | 4,907 | — | ||||||
| Distributions to non-controlling interests in ZGP | (429 | ) | (518 | ) | ||||
| Net Cash Provided by (Used in) Financing Activities | 4,478 | 74,250 | ||||||
| Net increase (decrease) in cash and cash equivalents denominated in foreign currency | (246 | ) | 326 | |||||
| Net increase (decrease) in cash and cash equivalents | (14,930 | ) | 56,891 | |||||
| Cash and cash equivalents, beginning of period | 44,351 | 7,664 | ||||||
| Cash and cash equivalents, end of period | $ | 29,421 | $ | 64,555 | ||||
| (1) | Subsequent to the filing of the 10-Q for the three months ended March 31, 2015, the Company elected to early adopt ASU 2015-02 with an effective date of January 1, 2015. As a result of this adoption, the majority of the ZAIS Managed Entities which were consolidated in the 10-Q for the three months ended March 31, 2015 were deconsolidated. Additionally, subsequent to the filing of the June 30, 2015 and September 30, 2015 10-Q’s, in December 2015 additional interpretations of ASU 2015-02 became available to the Company. As a result of these new interpretations, the Company reviewed its previous conclusions and determined that additional entities should be deconsolidated. There was no impact on the income (loss) allocated to ZAIS Group Holdings, Inc. Stockholders Equity as a result of this adoption. The September 30, 2015 figures above reflect the consolidated results of the Company for the nine months ended September 30, 2015, subsequent to the adoption of ASU 2015-02. |
| (2) | Amounts have been adjusted to conform to current period presentation. |
The accompanying notes are an integral part of these condensed consolidated financial statements.
| 6 |
ZAIS GROUP HOLDINGS, INC. AND SUBSIDIARIES
Notes to Condensed Consolidated Financial Statements
1. Organization
ZAIS Group Holdings, Inc. (“ZAIS”) is a holding company conducting substantially all of its operations through ZAIS Group, LLC (“ZAIS Group”), an investment advisory and asset management firm focused on specialized credit which commenced operations in July 1997 and is headquartered in Red Bank, New Jersey and has an office in London. ZAIS Group is a wholly-owned consolidated subsidiary of ZAIS Group Parent, LLC (“ZGP”), a majority-owned consolidated subsidiary of ZAIS. ZGP became the sole member and 100% equity owner of ZAIS Group on March 31, 2014 pursuant to a merger transaction which is described in detail in ZAIS’s Current Report on Form 8-K filed with the Securities and Exchange Commission (“SEC”) on March 23, 2015 (the “Closing 8-K”). References to the “Company” in these condensed consolidated financial statements refer to ZAIS, together with its consolidated subsidiaries.
ZAIS Group is an investment advisor registered with the SEC under the Investment Advisors Act of 1940 and is also registered with the Commodity Futures Trading Commission as a Commodity Pool Operator and Commodity Trading Advisor. ZAIS Group provides investment advisory and asset management services to private funds, separately managed accounts, structured vehicles and, through October 31, 2016, ZAIS Financial Corp. (“ZFC REIT”), a publicly traded mortgage real estate investment trust (collectively, the “ZAIS Managed Entities”).
ZAIS REIT Management, LLC (“ZAIS REIT Management”), a majority owned subsidiary of ZAIS Group, is the external investment advisor to ZFC REIT. On April 7, 2016, ZFC REIT announced that it had entered into an agreement and plan of merger (the “Merger Agreement”). The ZFC REIT merger closed on October 31, 2016. In connection with the Merger Agreement, ZAIS REIT Management entered into a termination agreement (the “Termination Agreement”), whereby the current advisory agreement under which ZAIS REIT Management receives management fees from ZFC REIT was terminated upon closing of the merger on October 31, 2016 (see Note 17, “Subsequent Events”).
The ZAIS Managed Entities predominantly invest in a variety of specialized credit instruments including bank loans, corporate credit instruments such as collateralized debt obligations (“CDOs”), collateralized loan obligations (together with CDOs referred to as “CLOs”) and various securities and instruments backed by these asset classes. ZAIS Group had approximately $3.844 billion of assets under management (“AUM”) as of September 30, 2016. As a result of the ZFC REIT merger (see above), ZAIS Group’s AUM related to mortgage strategies is expected to decrease by $0.589 billion, based on the REIT AUM at September 30, 2016.
ZAIS Group also serves as the general partner to certain ZAIS Managed Entities, which are generally organized as pass-through entities for U.S. federal income tax purposes.
The Company’s primary sources of revenues are (i) management fee income, which is based predominantly on the AUM of the ZAIS Managed Entities (ii) incentive income, which is based on the investment performance of the ZAIS Managed Entities and (iii) income of the consolidated ZAIS Managed Entities (the “Consolidated Funds”) which is based on the income generated from the portfolios of the Consolidated Funds, a portion of which is allocated to non-controlling interests in Consolidated Funds. All of the management fee income and incentive income earned by ZAIS Group from the Consolidated Funds is eliminated in consolidation.
On March 20, 2015, ZAIS made a decision to terminate the business operations of its Shanghai subsidiary. ZAIS Group ceased conducting regular business activities in Shanghai and the office is now closed. Final clearance from the relevant government authorities on the plan of liquidation is expected in the fourth quarter of 2016.
Recapitalization as a Result of a Business Combination
On October 5, 2012, HF2 Financial Management Inc. (“HF2”) was formed as a blank check company whose objective was to acquire, through a merger, share exchange, asset acquisition, stock purchase, recapitalization, reorganization or similar business combination, one or more businesses or entities. On September 16, 2014, HF2 entered into an Investment Agreement, as defined in the Closing 8-K, with ZGP and the members of ZGP (including Christian Zugel, the former managing member of ZGP and the founder and Chief Investment Officer of ZAIS Group, and certain related parties, collectively, the “ZGP Founder Members”), under which HF2 agreed to contribute cash to ZGP in exchange for newly issued Class A Units of ZGP (“Class A Units”) representing a majority financial interest in ZGP (the “Business Combination”) and to cause the transfer of all of its outstanding shares of Class B Common Stock, par value $0.000001 (the “Class B Common Stock”) to the ZGP Founder Members. All Class B Common Stock was then immediately deposited into a newly created irrevocable voting trust (the “ZGH Class B Voting Trust”), of which Mr. Zugel is the sole trustee. The Class B Common Stock has no economic rights and therefore is not considered participating securities for purposes of allocation of consolidated net income (loss).
On March 9, 2015, the stockholders of HF2 approved the Business Combination and the transaction closed on March 17, 2015 (the “Closing”). In connection with the Closing, HF2 changed its name to ZAIS Group Holdings, Inc. The Business Combination is described in detail in ZAIS’s Annual Report on Form 10-K for the fiscal year ended December 31, 2015 (the "Annual Report on Form 10-K”). Prior to the Closing, HF2 was a shell company with no operations. Upon the Closing, ZAIS became a holding company whose assets primarily consist of an approximate 66.5% interest in its majority-owned subsidiary, ZGP. Prior to the Closing, Christian Zugel served as the managing member of ZGP. Upon the Closing, ZAIS became the managing member of ZGP.
| 7 |
2. Basis of Presentation and Summary of Significant Accounting Policies
Basis of Presentation
The accompanying unaudited, interim, consolidated financial statements have been prepared in accordance with U.S. generally accepted accounting principles ("U.S. GAAP") as contained within the Financial Accounting Standards Board’s ("FASB") Accounting Standards Codification ("ASC") and the rules and regulations of the SEC for interim reporting. In the opinion of management, all adjustments considered necessary for a fair statement of the Company's financial position, results of operations and cash flows have been included and are of a normal and recurring nature. The operating results presented for the interim periods are not necessarily indicative of the results that may be expected for any other interim period or for the entire year. Certain information and note disclosures normally included in financial statements prepared in accordance with U.S. GAAP as contained in the ASC have been condensed or omitted from the unaudited interim condensed consolidated financial statements according to the SEC rules and regulations. The information and disclosures contained in these unaudited interim condensed consolidated financial statements and notes should be read in conjunction with the consolidated financial statements and notes thereto included in the Company's Annual Report on Form 10-K.
Segment Reporting
The Company currently is comprised of one reportable segment, the investment management segment, and substantially all of the Company’s operations are conducted through this segment. The investment management segment provides investment advisory and asset management services to the ZAIS Managed Entities.
Use of Estimates
The preparation of the consolidated financial statements in conformity with U.S. GAAP requires management to make estimates and assumptions that affect the reported amounts of assets and liabilities and disclosure of contingent assets and liabilities at the date of the consolidated financial statements and the reported amounts of revenues and expenses during the reporting period. While management believes that the estimates used in preparing the consolidated financial statements are reasonable and prudent, actual results may ultimately differ from those estimates.
Recent Accounting Pronouncements
Since May 2014, the FASB has issued ASU Nos. 2014-09, 2015-14, 2016-08, 2016-10 and 2016-12, "Revenue from Contracts with Customers". The objective of the guidance is to clarify the principles for recognizing revenue and supersedes most current revenue recognition guidance, including industry-specific guidance. The guidance is to be applied retrospectively to all prior periods presented or through a cumulative adjustment in the year of adoption, for interim and annual periods beginning after December 15, 2017. The Company is currently evaluating the impact of adopting this new standard.
In August 2014, the FASB issued ASU No. 2014-15, Presentation of Financial Statements – Going Concern (Subtopic 205-04) Disclosure of Uncertainties about an Entity's Ability to Continue as a Going Concern ("ASU 2014-15"), which requires management to evaluate whether there are conditions or events, considered in the aggregate, that raise substantial doubt about the Company's ability to continue as a going concern within one year after the date the financial statements are issued. If conditions or events indicate it is probable that an entity will be unable to meet its obligations as they become due within one year after the financial statements are issued, the update requires additional disclosures. The update is effective for periods ending after December 15, 2016 with early adoption permitted. Adoption of ASU 2014-15 is not expected to have a material effect on the Company's consolidated financial statements.
In February 2016, the FASB issued ASU No. 2016-02, Leases (Topic 428) (“ASU 2016-02”). Under the new guidance, lessees are required to recognize lease assets and lease liabilities on the balance sheet for those leases previously classified as operating leases. The amendments in ASU No. 2016-02 are effective for annual reporting periods beginning after December 15, 2018, including interim periods within that reporting period with early adoption permitted. Adoption of ASU 2016-02 is not expected to have a material effect on the Company's consolidated financial statements.
In March 2016, the FASB issued ASU No. 2016-09, Compensation-Stock Compensation (Topic 718): Improvements to Employee Share-Based Payment Accounting (“ASU 2016-09”). The objective of the guidance is to simplify several aspects of the accounting for employee share-based payment transactions, including income tax consequences, classification of awards as either equity or liabilities, and classification on the statement of cash flows. The update is effective for interim and annual periods beginning after December 15, 2016 with early adoption permitted. Adoption of ASU 2016-09 is not expected to have a material effect on the Company's consolidated financial statements.
| 8 |
In August 2016, the FASB issued ASU 2016-15, “Statement of Cash Flows (Topic 230): Classification of Certain Cash Receipts and Cash Payments” (“ASU 2016-15”). This ASU addresses the following eight specific cash flow issues: Debt prepayment or debt extinguishment costs; settlement of zero-coupon debt instruments or other debt instruments with coupon interest rates that are insignificant in relation to the effective interest rate of the borrowing; contingent consideration payments made after a business combination; proceeds from the settlement of insurance claims; proceeds from the settlement of corporate-owned life insurance policies (including bank-owned life insurance policies); distributions received from equity method investees; beneficial interests in securitization transactions; and separately identifiable cash flows and application of the predominance principle. ASU 2016-15 is effective for public business entities for fiscal years beginning after December 15, 2017, and interim periods within those fiscal years. Early application is permitted, including adoption in an interim period. Adoption of ASU 2016-15 is not expected to have a material effect on the Company's consolidated financial statements.
Principles of Consolidation
The consolidated financial statements included herein are the financial statements of ZAIS, its subsidiaries and certain funds that are required to be consolidated. All intercompany balances and transactions have been eliminated in consolidation, including ZAIS’s investment in ZGP and ZGP’s investment in ZAIS Group. The Company's fiscal year ends on December 31.
The consolidated financial statements include non-controlling interests in ZGP which are primarily comprised of Class A Units of ZGP held by the ZGP Founder Members.
Subsequent to the filing of the 10-Q for the three months ended March 31, 2015, the Company elected to early adopt ASU 2015-02, Consolidation (Topic 810): Amendments to the Consolidation Analysis (“ASU 2015-02”) with an effective date of January 1, 2015 modifying the analysis it must perform to determine whether it should consolidate certain types of legal entities. The guidance does not amend the existing disclosure requirements for variable interest entities (“VIEs”) or voting interest model entities. The guidance, however, modified the requirements to qualify under the voting interest model. Under the revised guidance, ZAIS Group and ZGP are variable interest entities of the Company. As these entities are already consolidated in the balance sheets of the Company, the identification of these entities as variable interest entities has no impact on the consolidated financial statements of the Company.
3. Investments in Affiliates
The Company applied the fair value option to its interests in the ZAIS Managed Entities that are not consolidated, and would have otherwise been subject to the equity or historical cost methods of accounting. The Company believes that reporting the fair value of these investments is more indicative of the Company’s financial position than historical cost.
At September 30, 2016 and December 31, 2015, the fair value of these investments was as follows:
| September 30, 2016 | December 31, 2015 | |||||
| (Dollars in thousands) | ||||||
| $ | 5,174 | $ | 5,242 | |||
The Company recorded a change in unrealized gain (loss) for three and nine months ended September 30, 2016 and September 30, 2015 associated with the investments still held at the end of each respective period as follows:
| Three Months Ended | Nine Months Ended | |||||||||||||
| September 30, 2016 | September 30, 2015 | September 30, 2016 | September 30, 2015 | |||||||||||
| (Dollars in thousands) | ||||||||||||||
| $ | (32 | ) | $ | (11 | ) | $ | (55 | ) | $ | 14 | ||||
Such amounts are included in net gain (loss) on investments in the consolidated statements of comprehensive income (loss).
At September 30, 2016 and December 31, 2015, no equity investment, individually or in the aggregate, held by the Company exceeded 10% of its total consolidated assets or income. As such, the Company did not present separate or summarized financial statements for any of its investees.
| 9 |
4. Fair Value of Investments
ASC 820 Fair Value Measurements defines fair value, establishes a framework for measuring fair value, and requires certain disclosures about fair value measurements under U.S. GAAP. Specifically, this guidance defines fair value based on exit price, or the price that would be received upon the sale of an asset or the transfer of a liability in an orderly transaction between market participants at the measurement date. Fair value under U.S. GAAP represents an exit price in the normal course of business, not a forced liquidation price. If the Company was forced to sell assets in a short period to meet liquidity needs, the prices it receives could be substantially less than their recorded fair values.
The Company follows the fair value measurement and disclosure guidance under U.S. GAAP, which establishes a hierarchical disclosure framework. This framework prioritizes and ranks the level of market price observability used in measuring investments at fair value. Market price observability is affected by a number of factors, including the type of investment, the characteristics specific to the investment and the state of the marketplace including the existence and transparency of transactions between market participants. Investments with readily available active quoted prices or for which fair value can be measured from actively quoted prices in an orderly market generally will have a higher degree of market price observability and a lesser degree of judgment used in measuring fair value. In all cases, an instrument’s level within the hierarchy is based upon the market pricing transparency of the instrument and does not necessarily correspond to the Company’s perceived risk or liquidity of the instrument.
The Company considers observable data to be market data which is readily available, regularly distributed or updated, reliable and verifiable, not proprietary, and provided by independent sources that are actively involved in the relevant market. In certain cases, the inputs used to measure fair value may fall into different levels of the fair value hierarchy. In such cases, the determination of which category within the fair value hierarchy is appropriate for any given investment is based on the lowest level of input that is significant to the fair value measurement. The Company’s assessment of the significance of a particular input to the fair value measurement in its entirety requires significant judgment and considers factors specific to the investment.
Assets and liabilities that are measured and reported at fair value are classified and disclosed in one of the following categories:
Level 1 — Fair value is determined based on quoted prices for identical assets or liabilities in an active market. Assets and liabilities included in Level 1 include listed securities. As required in the fair value measurement and disclosure guidance under U.S. GAAP, the Company does not adjust the quoted price for these investments. The hierarchy gives highest priority to Level 1.
Level 2 — Fair value is determined based on inputs other than quoted prices that are observable for the asset or liability either directly or indirectly as of the reporting date. Assets and liabilities which are generally included in this category include corporate bonds and loans, less liquid and restricted equity securities and certain over-the-counter derivatives, including foreign exchange forward contracts whose values are based on the following:
| · | Quoted prices for similar assets or liabilities in active markets. |
| · | Quoted prices for identical or similar assets or liabilities in non-active markets. |
| · | Pricing models whose inputs are observable for substantially the full term of the asset or liability. |
| · | Pricing models whose inputs are derived principally from or corroborated by observable market data for substantially the full term of the asset or liability. |
Level 3 — Fair value is determined based on inputs that are unobservable for the investment and includes situations where there is little, if any, market activity for the asset or liability. The inputs into the determination of fair value require significant management judgment or estimation and the Company may use models or other valuation methodologies to arrive at fair value. Investments that are included in this category generally include distressed debt, less liquid corporate debt securities, non-investment grade residual interests in securitizations, collateralized debt obligations and certain derivative contracts. The hierarchy gives the lowest priority to Level 3.
The Company has established a valuation process that applies for all levels of investments in the valuation hierarchy to ensure that the valuation techniques are consistent and verifiable. The valuation process includes discussions between the valuation team, portfolio management team and the valuation committee (the “Valuation Committee”). The Valuation Committee consists of senior members of ZAIS Group and is co-chaired by the Chief Risk Officer and Chief Financial Officer of ZAIS Group. The Valuation Committee meets to review and approve the results of the valuation process which are used in connection with the preparation of quarterly and annual financial statements. The Valuation Committee is responsible for oversight and review of the written valuation policies and procedures and ensuring that they are applied consistently.
The lack of an established, liquid secondary market for some of the Company’s holdings may have an adverse effect on the market value of those holdings and on the Company’s ability to dispose of them. Additionally, the public markets for the Company’s holdings may experience periods of volatility and periods of reduced liquidity and the Company’s holdings may be subject to certain other transfer restrictions that may further contribute to illiquidity. Such illiquidity may adversely affect the price and timing of liquidations of the Company’s holdings.
| 10 |
The following is a description of the valuation techniques used to measure fair value and the classification of these instruments pursuant to the fair value hierarchy:
Investments
The Company determines the fair value of investments in short term high investment grade mutual funds using quoted market prices and, accordingly, the Company classifies these investments as Level 1. Net gains or losses on investments are included in net gain (loss) on investments in the consolidated statements of comprehensive income (loss).
Collateralized Loan Obligation – Warehouses
A Collateralized Loan Obligation Warehouse ("CLO - Warehouse") is organized for the purpose of holding syndicate bank loans, also known as leveraged loans, during the warehouse period of an impending collateralized loan obligation vehicle. During the warehouse period, a CLO - Warehouse will secure investments and build a portfolio of primarily leveraged loans and other debt obligations. The warehouse period terminates when the collateralized loan obligation vehicle closes. At this time, the underlying assets held by a CLO - Warehouse are securitized into a collateralized loan obligation vehicle which then receives financing through the issuance of debt and equity securities and repays its bank financing.
The fair value of a CLO - Warehouse is determined by adding the excess spread (accrued interest plus interest received less financing cost) to the CLO - Warehouse equity contribution made by the Consolidated Funds, unless ZAIS Group determines that the securitization period will not be achieved, in which case, the fair value of a CLO - Warehouse will be established based on the fair value of the underlying bank loan positions which are valued in a manner consistent with ZAIS Group’s valuation policy and procedures. The net excess spread was 1.7% as of December 31, 2015. The Company did not have any investments in CLO-Warehouses at September 30, 2016.
CLO warehouses can be exposed to credit events, mark to market changes, rating agency downgrades and financing cost changes. Changes in the fair value of a CLO - Warehouse are reported in net gains (losses) of Consolidated Funds’ investments in the consolidated statements of comprehensive income (loss).
Investment in Affiliates
Under U.S. GAAP, the Company is permitted, as a practical expedient, to estimate the fair value of its investments in other investment companies using the NAV (or its equivalent) of the related investment company. Accordingly, the Company utilizes the practical expedient in valuing its investments in the unconsolidated ZAIS Managed Entities, which is an amount equal to the sum of the Company’s proportionate interest in the capital accounts of the affiliated funds at fair value. The fair value of the assets and liabilities of the ZAIS Managed Entities are determined by the Company in accordance with its valuation policies described above. Pursuant to ASU No. 2015-07, Fair Value Measurement (Topic 820): Disclosures for Investments in Certain Entities that Calculate Net Asset Value per Share (or its Equivalent) (“ASU 2015-07”), the Company no longer is required to categorize these investments within the fair value hierarchy. The resulting net gains or losses on investments are included in net gain (loss) on investments in the consolidated statements of comprehensive income (loss).
At September 30, 2016 and December 31, 2015, the Company held investments in five unconsolidated ZAIS Managed Entities. The valuation of the investments in these entities represents the amount the Company would receive at September 30, 2016 and December 31, 2015, respectively, if it were to liquidate its investments in these entities. ZAIS Group has the ability to liquidate its investments according to the provisions of the respective entities’ operative agreements.
The following tables summarize the Company’s assets measured at fair value on a recurring basis within the fair value hierarchy levels at September 30, 2016 and December 31, 2015:
| September 30, 2016 | ||||||||||||||||
| ( Dollars in thousands ) | ||||||||||||||||
| Level 1 | Level 2 | Level 3 | Total | |||||||||||||
| Assets, at fair value | ||||||||||||||||
| Investments in affiliates, at net asset value | $ | — | $ | — | — | $ | 5,174 | |||||||||
| Investments, at fair value | ||||||||||||||||
| ZAIS CLO 5, Limited | — | — | 20,348 | 20,348 | ||||||||||||
| Total assets, at fair value | $ | — | $ | — | 20,348 | $ | 25,522 | |||||||||
The fair value of ZAIS CLO 5, Limited (“ZAIS CLO 5”) was determined by a recent market transaction.
| December 31, 2015 | ||||||||||||||||
| ( Dollars in thousands ) | ||||||||||||||||
| Level 1 | Level 2 | Level 3 | Total | |||||||||||||
| Assets, at fair value | ||||||||||||||||
| Investments in affiliates, at net asset value | $ | — | $ | — | $ | — | $ | 5,242 | ||||||||
| Investments, at fair value | ||||||||||||||||
| Short term high investment grade mutual funds | 8,169 | — | — | 8,169 | ||||||||||||
| CLO – Warehouse | — | — | 30,509 | 30,509 | ||||||||||||
| Total investments, at fair value | 8,169 | — | 30,509 | 38,678 | ||||||||||||
| Total assets, at fair value | $ | 8,169 | $ | — | $ | 30,509 | $ | 43,920 | ||||||||
| 11 |
The following tables summarize the changes in the Company’s Level 3 assets for the nine months ended September 30, 2016 and year ended December 31, 2015:
| Nine Months Ended September 30, 2016 | ||||||||||||||||||||||||||||
| ( Dollars in thousands ) | ||||||||||||||||||||||||||||
| Beginning Balance January 1, 2016 | Purchases/ Issuances | Sales/ Redemptions/ Settlements | Total Realized and Change in Unrealized Gains (Losses) | Transfers to (from) Level 3 | Ending Balance September 30, 2016 | Change in Unrealized Gains/Losses Relating to Assets and Liabilities Still Held at September 30, 2016 | ||||||||||||||||||||||
| CLO - Warehouse | $ | 30,509 | $ | 10,000 | $ | (48,317 | ) | $ | 7,808 | $ | — | $ | — | $ | — | |||||||||||||
| ZAIS CLO 5 | — | 20,348 | — | — | — | 20,348 | — | |||||||||||||||||||||
| Total investments, at fair value | $ | 30,509 | $ | 30,348 | $ | (48,317 | ) | $ | 7,808 | $ | — | $ | 20,348 | $ | — | |||||||||||||
The following table summarizes the changes in the Company’s Level 3 assets for the year ended December 31, 2015:
| Year Ended December 31, 2015 | ||||||||||||||||||||||||||||
| ( Dollars in thousands ) | ||||||||||||||||||||||||||||
| Beginning Balance January 1, 2015 | Purchases/ Issuances | Sales/ Redemptions/ Settlements | Total Realized and Change in Unrealized Gains (Losses) | Transfers to (from) Level 3 | Ending Balance December 31, 2015 | Change in Unrealized Gains/Losses Relating to Assets and Liabilities Still Held at December 31, 2015 | ||||||||||||||||||||||
| CLO - Warehouse | $ | — | $ | 30,000 | $ | — | $ | 509 | $ | — | $ | 30,509 | $ | 509 | ||||||||||||||
| Total investments, at fair value | $ | — | $ | 30,000 | $ | — | $ | 509 | $ | — | $ | 30,509 | $ | 509 | ||||||||||||||
The Company’s policy is to record transfers between Level 1, Level 2 and Level 3, if any, at the beginning of the period. There were no transfers between Level 1, Level 2 and Level 3 during the nine months ended September 30, 2016 and the year ended December 31, 2015.
5. Variable Interest Entities (“VIEs”)
In the ordinary course of business, ZAIS Group sponsors the formation of VIEs that can be broadly classified into the following categories: hedge funds, hybrid private equity funds and securitized structures (CLOs). ZAIS Group generally serves as the investment advisor or collateral manager with certain investment-related, decision-making authority for these entities. The Company has not recorded any liabilities with respect to VIEs that are not consolidated. Certain ZAIS Managed Entities, including the CLOs, are VIEs. The Company applies the guidance of ASU 2015-02 when determining which ZAIS Managed Entities are required to be consolidated.
Funds
The Company has determined that the fee it receives from several of the hedge funds and hybrid private equity funds ZAIS Group manages does not represent a variable interest because under ASU 2015-02, ZAIS Group’s fee arrangements are commensurate with the level of effort performed and include only customary terms that do not represent variable interests. The Company considered investments its related parties have in these entities when determining if ZAIS Group’s fee represented a variable interest.
| 12 |
ZAIS Group owns 51% of a majority-owned affiliate, ZAIS Zephyr A-6, LP (“Zephyr A-6”), which was established to invest in CLOs, including at the warehouse stage of a CLO. As of September 30, 2016 and December 31, 2015, the Company has determined that ZAIS Group is the primary beneficiary of Zephyr A-6 which is consolidated in these unaudited consolidated financial statements. ZAIS Group is the primary beneficiary since it is deemed to have (i) the power to direct activities of the entity that most significantly impacts its economic performance and (ii) the obligation to absorb losses of the entity or the right to receive benefits from the entity that could potentially be significant to the entity.
At September 30, 2016, Zephyr A-6’s sole investment was an investment in ZAIS CLO 5. As of September 30, 2016, ZAIS CLO 5 continued to finance the majority of its loan purchases using the warehouse facility. At December 31, 2015, ZAIS CLO 5 was in the warehouse phase (“ZAIS CLO 5 Warehouse”). Zephyr A-6’s sole investment at December 31, 2015 was an investment in the ZAIS CLO 5 Warehouse.
ZAIS CLO 5
ZAIS CLO 5 priced on September 23, 2016 and closed on October 26, 2016 (see Note 17, “Subsequent Events”). ZAIS CLO 5 invests primarily in first lien senior secured bank loans and has a total capitalization of $408.5 million, which consists of debt of $368.0 million and equity of $40.5 million.
At September 30, 2016, Zephyr A-6 had (i) an investment of $20.3 million in debt and equity tranches in ZAIS CLO 5 and a corresponding payable of $20.3 million for its obligation to purchase the securities, (ii) a dividend receivable of $8.3 million which represents gains that were realized under the terms of the CLO Warehouse agreement, and (iii) a receivable for securities sold of $40.0 million for the return of its initial investment in ZAIS CLO 5 Warehouse. Such amounts are included in the consolidated statements of financial condition.
Zephyr A-6’s investment of $20.3 million in ZAIS CLO 5 represents approximately 2% economic interest in the debt tranches and approximately 32% economic interest in the equity tranche.
For the three and nine months ended September 30, 2016, net gains (losses) of Consolidated Funds’ investments is as follows:
| Three Months
Ended September 30, 2016 |
Nine Months Ended September 30, 2016 |
|||||||
| (Dollars in thousands) | ||||||||
| Change in unrealized gain or loss | $ | (4,202 | ) | $ | (509 | ) | ||
| Dividend income | 8,317 | 8,317 | ||||||
| Total | $ | 4,115 | $ | 7,808 | ||||
The change in unrealized gain or loss for the three months ended September 30, 2016 is related to the reversal of previously recognized unrealized gain or loss.
Securitized Structures
ZAIS Group and certain of its wholly owned subsidiaries act as collateral manager for CLOs that are VIEs. These CLOs are entities that issue collateralized notes which offer investors the opportunity for returns that vary commensurately with the risks they assume. The notes issued by the CLOs are generally backed by asset portfolios consisting of loans, other debt or other derivatives. For acting as the collateral manager for these structures, ZAIS Group receives collateral management fees comprised of senior collateral management fees, subordinated collateral management fees and incentive collateral management fees (subject to hurdle rates). In come cases, all the collateral management fees are waived in lieu of certain ZAIS Managed Entities owning equity tranches of the related CLO.
The Company has determined that the fee it receives from the CLOs does not represent a variable interest because under ASU 2015-02, ZAIS Group’s fee arrangements are commensurate with the level of effort performed and include only customary terms that do not represent variable interests. The Company considered investments its related parties have in the CLOs when determining if ZAIS Group’s fee represented a variable interest.
| 13 |
The Dodd-Frank credit risk retention rules will apply to any CLO that closes (or in certain cases are materially amended) on or after December 24, 2016. As currently drafted, the rules specify that for each such CLO, the relevant collateral manager must purchase and hold, unhedged, directly or through a majority-owned affiliate, either (i) 5% of each tranche of the CLO’s securities, (ii) an amount of the CLO’s equity equal to 5% of the aggregate fair value of all of the CLO’s securities or (iii) a combination of the two. The required risk must be retained until the latest of (i) the date that the CLO has paid down its securities to 33% of their original principal amount, (ii) the date that the CLO has sold down its assets to 33% of their original principal amount and (iii) the date that is two years after closing. The Company will continue to assess its investments in the CLOs to determine whether or not the Company will be required to consolidate the CLOs in its financial statements.
The Company determined that it is not the primary beneficiary of CLO – Warehouses, which are VIEs, because the financing counterparty must approve all significant financing requests and, as a result, the Company does not have the power to direct activities of the entity that most significantly impacts its economic performance.
VIEs
The following table presents the assets and liabilities of entities that are VIEs, and consolidated by the Company on a gross basis prior to eliminations due to consolidation at September 30, 2016 and December 31, 2015:
| September 30, 2016 | December 31, 2015 | |||||||
| (Dollars in thousands) | ||||||||
| Assets | ||||||||
| Assets of Consolidated Funds | ||||||||
| Cash and cash equivalents | $ | — | $ | 33 | ||||
| Investments, at fair value | 20,348 | 30,509 | ||||||
| Receivable for securities sold | 40,000 | — | ||||||
| Dividend receivable | 8,317 | — | ||||||
| Total Assets | $ | 68,665 | $ | 30,542 | ||||
| Liabilities | ||||||||
| Liabilities of Consolidated Funds | ||||||||
| Payable for securities purchased | $ | 20,348 | $ | — | ||||
| Other liabilities | 336 | 101 | ||||||
| Total Liabilities | $ | 20,684 | $ | 101 | ||||
The assets presented in the table above belong to the investors in Zephyr A-6, are available for use only by the entity to which they belong and are not available for use by the Company. The Consolidated Funds have no recourse to the general credit of ZAIS Group with respect to any liability.
ZAIS Group has a minimal direct ownership, if any, in the non-consolidated entities that are VIEs and its involvement is generally limited to providing asset management services. ZAIS Group’s exposure to loss from these entities is limited to a decrease in the management fees and incentive income that has been earned and accrued, as well as any direct equity ownership in the VIEs. The Company did not hold any material variable interests in unconsolidated VIEs at September 30, 2016 or December 31, 2015.
6. Management Fee Income and Incentive Income
ZAIS Group earns management fees for funds and accounts, monthly or quarterly, based on the net asset value of these funds and accounts prior to the accrual of incentive fees/allocations. Management fees earned for the CLOs which it manages are generally based on the par value of the collateral and cash held in the CLOs. Management fees earned by ZAIS Group from ZFC REIT, quarterly, are based on ZFC REIT's stockholders' equity, as defined in the amended and restated investment advisory agreement between ZAIS Group’s consolidated subsidiary ZAIS REIT Management and ZFC REIT. Twenty percent of the management fee income received from ZFC REIT is paid to holders of Class B interests in ZAIS REIT Management. The income is recorded as management fee income in the consolidated statements of comprehensive income (loss), and the portion of the management fees allocated to the holders of Class B interests in ZAIS REIT Management is included in the allocation of income (loss) to non-controlling interests in ZAIS Group Parent, LLC. The payment to the Class B interests in ZAIS REIT Management is recorded as distributions to non-controlling interests in ZAIS Group Parent, LLC.
Pursuant to the Termination Agreement, the current advisory agreement with ZAIS REIT Management was terminated on October 31, 2016. ZAIS REIT Management received a termination fee in the amount of $8,000,000 upon termination of the agreement (see Note 17, “Subsequent Events”). ZAIS REIT Management will recognize the termination fee as revenue upon termination of the agreement and the entire amount will be allocated to ZAIS Group.
In addition to the management fee income mentioned above, subordinated management fees may be earned from CLOs for which ZAIS Group and certain of its wholly owned subsidiaries act as collateral manager. The subordinated management fee is an additional payment for the same collateral management service, but has a lower priority in the CLOs’ cash flows. The subordinated management fee is contingent upon the economic performance of the respective CLO. If the CLOs experience a certain level of asset defaults, these fees may not be paid. There is no recovery by the CLOs of previously paid subordinated fees. ZAIS Group recognizes the subordinated management fee income when collection is reasonably assured and all related contingencies have been removed.
| 14 |
ZAIS Group manages certain funds and managed accounts from which it may earn incentive income based on hedge fund-style and private equity-style fee arrangements. Funds and accounts with hedge fund-style fee arrangements are those that pay ZAIS Group, on an annual basis, an incentive fee/allocation based on a percentage of net realized and unrealized profits attributable to each investor, subject to a hurdle (if any) set forth in each respective entity’s operative agreement. Additionally, all funds and accounts with hedge fund-style fee arrangements are subject to a perpetual loss carry forward, or perpetual “high-water mark,” meaning that the funds and accounts will not pay incentive fees/allocations with respect to positive investment performance generated for an investor in any year following negative investment performance until that loss is recouped, at which point an investor’s capital balance surpasses the high-water mark. The funds and accounts pay incentive fees/allocations on any net profits in excess of the high-water mark. Funds and accounts with private equity-style fee arrangements are those that pay an incentive fee/allocation based on a priority of payments under which investor capital must be returned and a preferred return, as specified in each fund’s operative agreement, must be paid to the investor prior to any payments of incentive-based income to ZAIS Group. For CLOs, incentive income is earned based on a percentage of cumulative profits, subject to the return of contributed capital (and subordinate management fees, if any), and a preferred inception to date return as specified in the respective CLOs’ collateral management agreements. The advisory agreement between ZAIS Group and ZFC REIT did not provide for incentive fees.
The following tables represent the gross amounts of management fee income and incentive income earned prior to eliminations due to consolidation of the Consolidated Funds and the net amount reported in the Company’s consolidated statements of comprehensive income (loss) for the three and nine months ended September 30, 2016 and September 30, 2015. September 30, 2015 amounts have been adjusted to conform to current period presentation:
| Three Months Ended September 30, 2016 | ||||||||||||||||
| (Dollars in thousands) | ||||||||||||||||
| Fee Range | Gross Amount | Elimination | Net Amount | |||||||||||||
| Management Fee Income | ||||||||||||||||
| Funds and accounts | 0.50% - 1.25% | $ | 2,669 | $ | (218 | ) | $ | 2,451 | ||||||||
| CLOs | 0.15% - 0.50% | 481 | — | 481 | ||||||||||||
| ZFC REIT | 1.50% | 722 | — | 722 | ||||||||||||
| Total | $ | 3,872 | $ | (218 | ) | $ | 3,654 | |||||||||
| Incentive Income (1) | ||||||||||||||||
| Funds and accounts | 10% - 20% | $ | 3,614 | $ | — | $ | 3,614 | |||||||||
| CLOs | 20% | — | — | — | ||||||||||||
| Total | $ | 3,614 | $ | — | $ | 3,614 | ||||||||||
| Three Months Ended September 30, 2015 | ||||||||||||||||
| (Dollars in thousands) | ||||||||||||||||
| Fee Range | Gross Amount | Elimination | Net Amount | |||||||||||||
| Management Fee Income | ||||||||||||||||
| Funds and accounts | 0.50% - 1.25% | $ | 3,007 | $ | — | $ | 3,007 | |||||||||
| CLOs | 0.15% - 0.50% | 408 | — | 408 | ||||||||||||
| ZFC REIT | 1.50% | 760 | — | 760 | ||||||||||||
| Total | $ | 4,175 | $ | — | $ | 4,175 | ||||||||||
| Incentive Income (1) | ||||||||||||||||
| Funds and accounts | 10% - 20% | $ | 3,870 | $ | — | $ | 3,870 | |||||||||
| CLOs | 20% | — | — | — | ||||||||||||
| Total | $ | 3,870 | $ | — | $ | 3,870 | ||||||||||
| 15 |
| Nine Months Ended September 30, 2016 | ||||||||||||||||
| (Dollars in thousands) | ||||||||||||||||
| Fee Range | Gross Amount | Elimination | Net Amount | |||||||||||||
| Management Fee Income | ||||||||||||||||
| Funds and accounts | 0.50% - 1.25% | $ | 7,438 | $ | (218 | ) | $ | 7,220 | ||||||||
| CLOs | 0.15% - 0.50% | 1,311 | — | 1,311 | ||||||||||||
| ZFC REIT | 1.50% | 2,263 | — | 2,263 | ||||||||||||
| Total | $ | 11,012 | $ | (218 | ) | $ | 10,794 | |||||||||
| Incentive Income (1) | ||||||||||||||||
| Funds and accounts | 10% - 20% | $ | 3,909 | $ | — | $ | 3,909 | |||||||||
| CLOs | 20% | — | — | — | ||||||||||||
| Total | $ | 3,909 | $ | — | $ | 3,909 | ||||||||||
| Nine Months Ended September 30, 2015 | ||||||||||||||||
| (Dollars in thousands) | ||||||||||||||||
| Fee Range | Gross Amount | Elimination | Net Amount | |||||||||||||
| Management Fee Income | ||||||||||||||||
| Funds and accounts | 0.50% - 1.25% | $ | 8,984 | $ | — | $ | 8,984 | |||||||||
| CLOs | 0.15% - 0.50% | 837 | — | 837 | ||||||||||||
| ZFC REIT | 1.50% | 2,188 | — | 2,188 | ||||||||||||
| Total | $ | 12,009 | $ | — | $ | 12,009 | ||||||||||
| Incentive Income (1) | ||||||||||||||||
| Funds and accounts | 10% - 20% | $ | 5,118 | $ | — | $ | 5,118 | |||||||||
| CLOs | 10% - 20% | 873 | — | 873 | ||||||||||||
| Total | $ | 5,991 | $ | — | $ | 5,991 | ||||||||||
| (1) | Incentive income earned for certain of the ZAIS Managed Entities is subject to a hurdle rate of return as specified in each respective ZAIS Managed Entities’ operative agreement. |
The management fee income and incentive income amounts above are net of the following credits:
| Three Months Ended | Nine Months Ended | |||||||||||||||
| September 30, 2016 | September 30, 2015 | September 30, 2016 | September 30, 2015 | |||||||||||||
| (Dollars in thousands) | ||||||||||||||||
| Management fee income credit | $ | 52 | $ | 61 | $ | 156 | $ | 165 | ||||||||
| Incentive income credit | $ | — | $ | — | $ | — | $ | 59 | ||||||||
Management fee income and incentive income which was accrued, but not received at September 30, 2016 and December 31, 2015 is as follows:
September
30, | December
31, | |||||||
| (Dollars in thousands) | ||||||||
| Management fee income | $ | 2,049 | $ | 1,670 | ||||
| Incentive income | 3,262 | 859 | ||||||
| Total | $ | 5,311 | $ | 2,529 | ||||
Such amounts are included in income and fees receivable in the consolidated statements of financial condition.
| 16 |
7. Debt Obligations
Notes Payable
On March 17, 2015, in conjunction with the closing of the Business Combination, ZAIS issued two promissory notes with an aggregate principal balance of $1,250,000 to EarlyBirdCapital, Inc. and Sidoti & Company, LLC. The notes accrue interest at an annual rate equal to the annual applicable federal rate as published by the Internal Revenue Service (“AFR”) until the principal amount of, and all accrued interest on, the notes have been paid in full. The notes mature on March 17, 2017 at which time the principal balance and accrued interest will be due and payable. The notes were issued in lieu of paying certain underwriting costs at the closing of the Business Combination and, accordingly, treated as a direct cost attributable to the Business Combination and capitalized to equity. The Company accrued interest on the notes for the three and nine months ended September 30, 2016 and September 30, 2015, which is included in other income (expense) in the consolidated statements of comprehensive income (loss).
8. Compensation
Employees are eligible to receive discretionary incentive cash compensation (the “Bonus Award”) on an annual basis. The amount of the Bonus Award is based on, among other factors, both individual performance and the financial results of ZAIS Group. For certain employees, as documented in an underlying agreement (the “Bonus Agreement”), the Bonus Award may be further subject to a retention-based payout schedule that generally provides for 30% of the Bonus Award to vest and be paid incrementally over a three-year period. The Company expenses all current cash incentive compensation award payments ratably in the first year. All future payments are amortized equally over the required service period over the remaining term of the Bonus Award as defined in the Bonus Award Agreements. In the event an award is forfeited pursuant to the terms of the Bonus Agreement, the corresponding accruals will be reversed.
On March 29, 2016, the Compensation Committee of the Board of Directors of ZAIS adopted a retention payment plan for certain employees of ZAIS Group (the "Retention Payment Plan"). The Retention Payment Plan applies to approximately 60 employees of ZAIS Group who have an annual base salary of less than $300,000. The purpose of the Retention Payment Plan is to enable ZAIS Group to retain the services of its employees in order to ensure that ZAIS Group is not disrupted or adversely affected by the possible loss of personnel or their commitment to ZAIS Group. Under the Retention Payment Plan, the participating employees are entitled to receive cash retention payments on each of April 15, 2016, August 15, 2016 and November 15, 2016, if the employee remains employed by ZAIS Group on such dates. The maximum aggregate amount of retention payments that may be paid to all participants under the Retention Payment Plan is approximately $4.5 million. All payments under the Retention Payment Plan will be amortized equally over the required service period ending on each of the three payment dates discussed above. In the event an award is forfeited pursuant to the terms of a respective Retention Payment Plan agreement, the corresponding accruals will be reversed.
The Company incurred the following expenses relating to the Retention Payment Plan for the three and nine months ended September 30, 2016:
Three
Months Ended | Nine
Months Ended | |||||
| (Dollars in thousands) | ||||||
| $ | 1,253 | $ | 4,309 | |||
Such amounts are included in compensation and benefits in the consolidated statements of comprehensive income (loss).
In addition, on March 1, 2016, the Compensation Committee of the Board of Directors of ZAIS approved a retention payment of $900,000 to Howard Steinberg, the Company's General Counsel, which was paid on March 15, 2016 and is included in compensation and benefits in the consolidated statements of comprehensive income (loss) for the nine months ended September 30, 2016.
ZAIS Group has entered into agreements with certain of its employees whereby certain employees and former employees have been granted rights to participate in a portion of the incentive income received from certain ZAIS Managed Entities (referred to as “Points”). There were no payments made or amounts accrued relating to Points for the three months ended September 30, 2016 and September 30, 2015 and the nine months ended September 30, 2016.
In 2013, ZAIS Group established the Income Unit Plan. Under the Income Unit Plan, certain employees were entitled to receive a fixed percentage of ZAIS Group’s distributable income, as defined in the Income Unit Plan agreement. Pursuant to the terms of the Income Unit Plan, a payout of 85% of the estimated award was made in December of the applicable performance year and the remaining balance was payable within 30 days of the issuance of ZAIS Group’s audit report for the prior year. An employee must have been actively employed by ZAIS Group on each scheduled payment date to have received their relevant payment. The Income Unit Plan was terminated effective December 31, 2014.
| 17 |
On March 8, 2016, the Company commenced a reduction in force and other restructuring which has resulted in a decrease of 23 employees of ZAIS Group. The Company has incurred total severance charges in the amount of approximately $762,000 relating to the reduction in force which was recognized during the six months ended June 30, 2016. The Company immediately recognized all severance expense for employees who were not required to provide services or those employees who were not being retained beyond the 60 day notification period. Conversely, for all employees who were required to provide services or those who were retained beyond the 60 day notification period, the related severance expense was amortized equally over the required service period.
The following table presents a detailed breakout of compensation expense recorded for the three and nine months ended September 30, 2016 and September 30, 2015:
| Three Months Ended September 30, 2016 | Three Months Ended September 30, 2015 | Nine Months Ended September 30, 2016 | Nine Months Ended September 30, 2015 | |||||||||||||
| (Dollars in thousands) | ||||||||||||||||
| Salaries | $ | 2,497 | $ | 3,572 | $ | 8,370 | $ | 10,587 | ||||||||
| Bonus (1) | 2,808 | 865 | 10,208 | 3,094 | ||||||||||||
| Points | — | — | — | 32 | ||||||||||||
| Commissions | — | 30 | 3 | 75 | ||||||||||||
| Income Unit Plan | — | — | — | 198 | ||||||||||||
| Equity-Based Compensation | 1,269 | 1,410 | 2,951 | 3,288 | ||||||||||||
| Severance | 27 | 113 | 789 | 1,087 | ||||||||||||
| Payroll taxes and benefits | 307 | 498 | 1,593 | 2,057 | ||||||||||||
| Total compensation and benefits | $ | 6,908 | $ | 6,488 | $ | 23,914 | $ | 20,418 | ||||||||
(1) Includes amounts incurred under the Retention Payment Plan.
Equity-Based Compensation
In conjunction with the closing of the Business Combination on March 17, 2015, ZGP authorized 1,600,000 Class B-0 Units eligible to be granted to certain employees of ZAIS Group. The Class B-0 Units are subject to a two year cliff-vesting provision, whereby all Class B-0 Units granted to an employee will be forfeited if the employee resigns or is terminated prior to the two year anniversary of the closing of the Business Combination. Subsequent to the two year anniversary of the Business Combination, an employee will only forfeit vested Class B-0 Units if the employee is terminated for cause. The Class B-0 Units are not entitled to any distributions from ZGP (and thus will not participate in, or be allocated any, income or loss) or other material rights until such Class B-0 Units vest. Upon vesting the Class B-0 Units will have the same rights as Class A Units of ZGP and are exchangeable on a one for one basis for Class A common shares subject to the restrictions set forth in the Exchange Agreement included in the Closing 8-K. In accordance with ASC 718, Compensation - Stock Compensation, the Company is measuring the compensation expense associated with these awards based on grant date fair value adjusted for estimated forfeitures. This compensation expense will be amortized equally over the two-year vesting period and will be cumulatively adjusted for changes in estimated forfeitures at each reporting date.
The following table presents the unvested Class B-0 Units’ activity during the nine months ended September 30, 2016:
| Number of B-0 Units | Weighted Average Grant Date Fair Value per Unit | |||||||
| Balance at December 31, 2015 | 1,337,486 | $ | 9.67 | |||||
| Granted | 100,000 | 6.34 | ||||||
| Forfeited | (321,600 | ) | 9.70 | |||||
| Vested | — | — | ||||||
| Balance at September 30, 2016 | 1,115,886 | $ | 9.36 | |||||
The Company incurred compensation expense relating to the Class B-0 Units for the three and nine months ended September 30, 2016 and September 30, 2015 as follows:
| Three Months Ended | Nine Months Ended | |||||||||||||
| September 30, 2016 | September 30, 2015 | September 30, 2016 | September 30, 2015 | |||||||||||
| (Dollars in thousands) | ||||||||||||||
| $ | 1,310 | $ | 1,336 | $ | 2,876 | $ | 3,164 | |||||||
| 18 |
The total compensation expense expected to be recognized in all future periods associated with the Class B-0 Units is $2,393,000 at September 30, 2016, which is expected to be recognized over the remaining weighted average period of 0.46 years. During the three months ended March 31, 2016, the Company increased its forfeiture estimate from 8% to 29.6%. This increase includes approximately a 17.2% increase relating to the reduction in force announced in the Company’s Current Report on Form 8-K filed on March 10, 2016 and approximately a 4.4% increase relating to the change in management’s estimated forfeitures based on actual forfeitures since the grant date. The cumulative impact of the increase in estimated forfeitures of $983,000 was recognized as a reduction in compensation and benefits for the nine months ended September 30, 2016. The expense relating to the Class B-0 Units is included in compensation and benefits on the consolidated statements of comprehensive income (loss).
Non-employee directors of ZAIS receive restricted stock units (“RSUs”) pursuant to ZAIS’s 2015 Stock Incentive Plan as a component of compensation for their service as directors of ZAIS. The awards are unvested at the time they are granted and, as such, are not entitled to any dividends or distributions from ZAIS or other material rights until such RSUs vest. The RSUs vest in full on the one-year anniversary of the grant date. Upon vesting ZAIS will issue the recipient shares of Class A Common Stock equal to the number of vested RSUs. In accordance with ASC 718, Compensation - Stock Compensation, the Company is measuring the expense associated with these awards based on the fair value on the grant date adjusted for estimated forfeitures. This expense is being amortized equally over the one-year vesting period and adjusted on a cumulative basis for changes in estimated forfeitures at each reporting date.
The following table presents the RSU activity during the nine months ended September 30, 2016:
| Number of RSUs | Weighted Average Grant Date Fair Value per Unit | |||||||
| Balance at December 31, 2015 | 30,000 | $ | 9.85 | |||||
| Granted | 30,942 | 3.22 | ||||||
| Forfeited | — | — | ||||||
| Vested | (30,000 | ) | 9.85 | |||||
| Balance at September 30, 2016 | 30,942 | $ | 3.22 | |||||
The Company incurred compensation expense relating to the RSUs for the three and nine months ended September 30, 2016 and September 30, 2015 as follows:
| Three Months Ended | Nine Months Ended | |||||||||||||
| September 30, 2016 | September 30, 2015 | September 30, 2016 | September 30, 2015 | |||||||||||
| (Dollars in thousands) | ||||||||||||||
| $ | (41 | ) | $ | 74 | $ | 75 | $ | 124 | ||||||
The total expense expected to be recognized in all future periods associated with the RSUs, considering estimated forfeitures of 0%, is $55,000 at September 30, 2016, which is expected to be recognized over the remaining weighted average period of 0.56 years. The expense relating to these RSUs is included in compensation and benefits on the consolidated statements of comprehensive income (loss).
9. Income Taxes
Prior to the closing of the Business Combination on March 17, 2015, ZGP and its subsidiaries were pass-through entities for U.S. income tax purposes and their earnings flowed through to the owners without being subject to entity level income taxes. Accordingly, no income tax (benefit) expense has been recorded for the period prior to the closing of the business combination other than that related to ZGP’s foreign subsidiaries, which are branches for U.S. income tax purposes but paid income taxes in their respective foreign jurisdictions.
Following the reorganization, while ZGP and its subsidiaries continue to operate as pass-through entities for U.S. income tax purposes not subject to entity level taxes, ZAIS is taxable as a corporation for U.S. tax purposes. Accordingly, the Company’s consolidated financial statements include U.S. federal, state and local income taxes on the ZAIS’ allocable share of the consolidated results of operations, as well as taxes payable to jurisdictions outside the U.S related to the foreign subsidiaries.
| 19 |
The Company recorded income tax (benefit) of $(21,000) and $(12,000) respectively for the three and nine months ended September 30, 2016, related solely to foreign taxes receivable from jurisdictions outside the U.S. related to the Company’s foreign subsidiaries. The Company recorded income tax (benefit) of $(1,528,000) and $(4,111,000) for the three and nine months ended September 30, 2015, related to foreign taxes payable to jurisdictions outside the U.S. related to the Company’s foreign subsidiaries, and U.S. federal, state and local income taxes on the Company’s allocable share of the consolidated results of operations as well as the Company’s net operating losses and development stage start-up expenses incurred during the period from its inception and prior to the closing of the Business Combination with ZGP.
As a result of the variations each quarter in the relationship between pre-tax income and income tax expense, the Company utilizes the actual effective tax rate for each interim period being presented to calculate the tax (benefit) or expense. The following is a reconciliation of the U.S. statutory federal income tax to the Company’s effective tax:
| Three Months Ended September 30, | Nine Months Ended September 30, | |||||||||||||||
| 2016 | 2015 | 2016 | 2015 | |||||||||||||
| (Dollars in thousands) | ||||||||||||||||
| Income tax (benefit) expense at the U.S. federal statutory income tax rate | $ | 542 | $ | (1,086 | ) | $ | (3,309 | ) | $ | (5,672 | ) | |||||
| State and local income tax, net of federal benefit | 13 | (134 | ) | (516 | ) | (506 | ) | |||||||||
| Foreign tax | (21 | ) | 189 | (12 | ) | 210 | ||||||||||
| Effect of permanent differences | — | — | 58 | — | ||||||||||||
| Income attributable to non-controlling interests in Consolidated Funds not subject to tax | (647 | ) | — | (1,254 | ) | — | ||||||||||
| Income attributable to non-controlling interests in ZGP not subject to tax | 2 | 287 | 1,433 | 2,641 | ||||||||||||
| Provision to return adjustment | 301 | 301 | ||||||||||||||
| Valuation allowance | (253 | ) | (784 | ) | 3,245 | (784 | ) | |||||||||
| Adjustment of tax rate used to value deferred taxes | 42 | — | 42 | — | ||||||||||||
| Total | $ | (21 | ) | $ | (1,528 | ) | $ | (12 | ) | $ | (4,111 | ) | ||||
The Company’s effective tax for the periods presented above includes a rate benefit attributable to the fact that the Company’s subsidiaries operate as limited liability companies and limited partnerships which are treated as pass-through entities for U.S. federal and state income tax purposes. Accordingly, the Company’s consolidated financial statements include U.S. federal, state and local income taxes on the Company’s allocable share of the consolidated results of operations. The tax liability or benefit related to the partnership income or loss not allocable to the Company rests with the equity holders owning such non-controlling interests in ZAIS subsidiaries.
For the three and nine months ended September 30, 2016, the net effective tax represents the taxes accrued related to the Company’s operations in jurisdictions outside the U.S. as a full valuation allowance has been established on the tax benefit related to U.S. federal, state and local income taxes on the Company’s allocable share of the consolidated results of operations as well as the Company’s net operating losses and development stage start-up expenses incurred during the period from its inception and prior to the closing of the Business Combination with ZGP. For the three and nine months ended September 30, 2015, the net effective tax represented a tax benefit related to the Company’s operations in jurisdictions outside the U.S. as well as a tax benefit related to U.S. federal, state and local income taxes on the Company’s allocable share of the consolidated results of operations as well as the Company’s net operating losses and development stage start-up expenses incurred during the period from its inception and prior to the closing of the Business Combination with ZGP.
Deferred income taxes are provided for the effects of temporary differences between the tax basis of an asset or liability and are reported in the accompanying consolidated statements of financial condition. These temporary differences result in taxable or deductible amounts in future years. Deferred tax assets are included in the accompanying consolidated statements of financial condition.
As of September 30, 2016 and December 31, 2015, the Company had total deferred tax assets of $8,313,000 and $5,068,000 respectively related to net operating losses and other temporary differences related to the Company’s allocable share of the consolidated results of operations as well as Company’s net operating losses and development stage start-up expenses incurred during the period from its inception and prior to the closing of the Business Combination with ZGP. The Company has established a full valuation allowance on the deferred tax asset as of September 30, 2016 and December 31, 2015.
| 20 |
As of September 30, 2016, the Company has estimated federal and state income tax net operating loss carryforwards of $13,806,000 which will expire as follows:
| Amount | ||||||
| (Dollars in thousands) | ||||||
| 2032 | $ | 1 | ||||
| 2033 | 83 | |||||
| 2034 | 122 | |||||
| 2035 | 5,990 | |||||
| 2036 | 7,610 | |||||
| Total | $ | 13,806 | ||||
As of each reporting date, management considers new evidence, both positive and negative, that could affect its view of the future realization of deferred tax assets. As of September 30, 2016, the Company has determined that the most recent management business forecasts do not support the realization of net deferred tax assets recorded for the Company. The Company has recorded a book loss for the three and nine months ended September 30, 2016 excluding income attributable to consolidated funds, and it is anticipated that expenses will continue to exceed revenues in 2016. Although management intends to pursue various initiatives with the potential to alter the operating loss trend, there is no specific plan that has been implemented at this point in time that will alter the negative earnings trend.
Accordingly, management continues to believe that it is not more likely than not that its deferred tax asset will be realized and the Company has continued to maintain a full valuation allowance against the deferred tax asset as of September 30, 2016. The Company has recorded a change in the valuation allowance of $(253,000) and $3,245,000 to the consolidated statements of comprehensive income (loss) in connection with the net operating losses and other temporary differences related to the Company’s allocable share of the consolidated results of operations for the three and nine months ended September 30, 2016. The Company intends to maintain a full valuation allowance on its deferred tax assets until there is sufficient evidence to support the reversal of all or some portion of these allowances.
The Company does not believe it has any significant uncertain tax positions. Accordingly, the Company did not record any adjustments or recognize interest expense for uncertain tax positions for the three and nine months ended September 30, 2016 and September 30, 2015, respectively. In the future, if uncertain tax positions arise, interest and penalties will be accrued and included in the income tax (benefit) expense on the consolidated statements of comprehensive income (loss).
10. Related Party Transactions
ZAIS Managed Entities
ZAIS Group offers a range of alternative and traditional investment strategies through the ZAIS Managed Entities. ZAIS Group earns substantially all of its management fee income and incentive income from the ZAIS Managed Entities, which are considered related parties as the Company manages the operations of, and makes investment decisions for, these entities. The Company considers ZAIS Group’s principals, executives, employees and all ZAIS Managed Entities to be affiliates and related parties.
ZAIS Group invests in its subsidiaries and some of the ZAIS Managed Entities. Investments in subsidiaries and certain ZAIS Managed Entities that are consolidated are eliminated. Investments in certain ZAIS Managed Entities not consolidated are further described in Note 3.
ZAIS Group did not charge management fees or earn incentive income on investments made in the ZAIS Managed Entities (excluding CLOs and ZFC REIT) by ZAIS Group’s principals, executives, employees and other related parties. The total amount of investors’ capital balances that are not being charged fees at September 30, 2016 and September 30, 2015 were approximately as follows:
| September 30, 2016 | September 30, 2015 | |||||
| (Dollars in thousands) | ||||||
| $ | 20,347 | $ | 29,082 | |||
Additionally, certain ZAIS Managed Entities, with existing fee arrangements, have investments representing 100% of the equity tranche of ZAIS CLO 1, Limited. (“ZAIS CLO 1”) and ZAIS CLO 2, Limited. (“ZAIS CLO 2”). Therefore, ZAIS Group did not charge management fees or earn incentive income on ZAIS CLO 1 and ZAIS CLO 2. The total amounts of AUM that are not being charged fees at September 30, 2016 and September 30, 2015 were approximately as follows:
| September 30, 2016 | September 30, 2015 | |||||
| (Dollars in thousands) | ||||||
| $ | 565,224 | $ | 560,206 | |||
| 21 |
From time to time, ZAIS Group may pay related party research and data services expenses directly to vendors, and subsequently invoice these costs to the respective ZAIS Managed Entities based upon certain criteria. At September 30, 2016 and December 31, 2015, the amounts due from the ZAIS Managed Entities as a result of this arrangement were as follows:
| September 30, 2016 | December 31, 2015 | |||||
| (Dollars in thousands) | ||||||
| $ | 817 | $ | 650 | |||
These amounts are included in due from related parties in the consolidated statements of financial condition.
The amounts due to ZAIS Group from the ZAIS Managed Entities and other related parties which were not as a result of this arrangement at September 30, 2016 and December 31, 2015 were as follows:
| September 30, 2016 | December 31, 2015 | |||||
| (Dollars in thousands) | ||||||
| $ | 46 | $ | 32 | |||
These amounts are included in due from related parties in the consolidated statements of financial condition.
RQSI, Ltd.
Certain affiliates of Mr. Neil Ramsey (“Mr. Ramsey”) are significant stockholders of ZAIS.
ZGP has entered into a two-year Consulting Agreement (the “Consulting Agreement”) with Mr. Ramsey through RQSI, Ltd., an entity controlled by Mr. Ramsey, under the terms of which, among other things, Mr. Ramsey will provide consulting services to ZGP, ZAIS Group’s senior management team and ZAIS, as requested by ZAIS, from time to time during the 24-month period beginning on the closing of the Business Combination. Mr. Ramsey may not compete against ZGP during the term of the Consulting Agreement, and for two years following its termination. In consideration for his undertakings under the Consulting Agreement, ZGP will pay Mr. Ramsey a consulting fee of $500,000 per annum payable in monthly installments. ZGP may terminate the Consulting Agreement for cause, as defined in the Consulting Agreement.
The Company has recorded the following expense related to the Consulting Agreement for the three and nine month periods ended September 30, 2016 and September 30, 2015:
| Three Months Ended | Nine Months Ended | |||||||||||||
| September 30, 2016 | September 30, 2015 | September 30, 2016 | September 30, 2015 | |||||||||||
| (Dollars in thousands) | ||||||||||||||
| $ | 125 | $ | 125 | $ | 375 | $ | 270 | |||||||
The expense is included in general, administrative and other expenses in the consolidated statements of total comprehensive income.
ZAIS Group has agreed to use certain statistical data generated by RQSI, Ltd. models. ZAIS Group will use this information for trading futures in one of the ZAIS Managed Entities.
ZAIS Group has entered into a month to month lease agreement with an affiliate of RQSI, Ltd to jointly occupy our UK office. The agreement is terminable upon 30 days’ notice. While there is currently no charge associated with the lease, the total market value of the agreement is approximately $13,000 per month.
Other
ZAIS Group is a party to a consulting agreement with Ms. Tracy Rohan (“Ms. Rohan”), Mr. Zugel’s sister-in-law, pursuant to which Ms. Rohan provides services to ZAIS Group relating to event planning, promotion, web and print branding and related services. Pursuant to the consulting agreement, Ms. Rohan earned the following amounts for her services for the three and nine months ended September 30, 2016 and September 30, 2015:
| 22 |
| Three Months Ended | Nine Months Ended | |||||||||||||
| September 30, 2016 | September 30, 2015 | September 30, 2016 | September 30, 2015 | |||||||||||
| (Dollars in thousands) | ||||||||||||||
| $ | 26 | $ | 29 | $ | 78 | $ | 87 | |||||||
The expense is included in general, administrative and other expenses in the consolidated statements of total comprehensive income.
At September 30, 2016 and December 31, 2015, the following amounts relating to employee loans were included in due from related parties in the consolidated statements of financial condition:
| September 30, 2016 | December 31, 2015 | |||||
| (Dollars in thousands) | ||||||
| $ | 48 | $ | 67 | |||
11. Fixed Assets
Fixed assets consist of the following:
| September 30, 2016 | December 31, 2015 | |||||||
| ( Dollars in thousands ) | ||||||||
| Office equipment | $ | 3,098 | $ | 3,088 | ||||
| Leasehold improvements | 691 | 853 | ||||||
| Furniture and fixtures | 572 | 574 | ||||||
| Software | 409 | 409 | ||||||
| 4,770 | 4,924 | |||||||
| Less accumulated depreciation | (4,430 | ) | (4,380 | ) | ||||
| Total | $ | 340 | $ | 544 | ||||
The Company recognized depreciation expense for the three and nine months ended September 30, 2016 and September 30, 2015 as follows:
| Three Months Ended | Nine Months Ended | |||||||||||||
| September 30, 2016 | September 30, 2015 | September 30, 2016 | September 30, 2015 | |||||||||||
| (Dollars in thousands) | ||||||||||||||
| $ | 79 | $ | 445 | $ | 206 | $ | 654 | |||||||
The change in accumulated depreciation also includes the change in foreign currency spot rates for each respective period presented. The change in leasehold improvements also includes a $16,000 reduction due to the translation of the functional currencies of the Company’s foreign subsidiaries. Additionally, the Company wrote-off leasehold improvement costs of approximately $143,000 and the related accumulated amortization of approximately $129,000, relating to the termination of a portion of its office space in New Jersey (see Note 12 – Commitments and Contingencies). The net expense of approximately $14,000 is included in depreciation expense in the consolidated statements of comprehensive income (loss) for the three and nine month periods ended September 30, 2016.
12. Commitments and Contingencies
Capital Commitments
As of September 30, 2016, a portion of the proceeds of the Business Combination had been committed to expand existing product lines. Up to $51.0 million of equity capital has been committed to the Consolidated Fund, Zephyr A-6, which would allow this Consolidated Fund to invest in ZAIS Group managed CLOs and thereby satisfy the risk retention requirements for CLO managers under the Securities Exchange Act of 1934. As of September 30, 2016, approximately $20.5 million in capital has been contributed to Zephyr A-6 by ZAIS Group.
| 23 |
Lease Obligations
ZAIS Group is obligated under operating lease agreements for office space in the New Jersey and London offices expiring through the end of October 2017. The Company recognizes expense related to its operating leases on a straight-line basis over the lease term. Aggregate future minimum annual rental payments for the periods subsequent to September 30, 2016 are approximately as follows:
| Period | Amount | |||||
| ( Dollars in thousands ) | ||||||
| Three Months Ending December 31, 2016 | $ | 206 | ||||
| Ten Months Ending October 31, 2017 | 490 | |||||
| $ | 696 | |||||
Effective September 30, 2016, the Company terminated a portion of its lease and reduced its square footage by approximately 2,600 square feet of office space in New Jersey. In connection with the lease termination, the Company paid a lease termination fee of approximately $20,000 pursuant to the terms of the lease. Such amount is included in general, administration and other expenses in the consolidated statements of comprehensive income (loss).
Rent expense is recognized on a straight-line basis and is included in general, administrative and other in the consolidated statements of comprehensive income (loss).
The Company incurred rent expense for the three and nine months ended September 30, 2016 and September 30, 2015 as follows:
| Three Months Ended | Nine Months Ended | |||||||||||||
| September 30, 2016 | September 30, 2015 | September 30, 2016 | September 30, 2015 | |||||||||||
| (Dollars in thousands) | ||||||||||||||
| $ | 270 | $ | 397 | $ | 777 | $ | 1,215 | |||||||
Litigation
From time to time, ZAIS Group may become involved in various claims, formal regulatory inquiries and legal actions arising in the ordinary course of business. The Company discloses information regarding such inquiries if disclosure is required pursuant to accounting and financial reporting standards. While we are currently involved in a formal regulatory inquiry, in management’s opinion, the matter is not appropriate for accrual or disclosure in the financial statements at September 30, 2016.
Other Contingencies
In the normal course of business, ZAIS Group enters into contracts that provide a variety of indemnifications. Such contracts include those with certain service providers, brokers and trading counterparties. Any exposure to ZAIS Group under these arrangements could involve future claims that may be made against ZAIS Group. Currently, no such claims exist or are expected to arise and, accordingly, the Company has not accrued any liability in connection with such indemnifications.
Gain Contingencies
In 2016 the Company received notification from one of its insurance providers that the Company’s claim for reimbursement of certain legal and other costs relating to a formal regulatory inquiry had been approved. The total approved claim reimbursement for all legal and other costs incurred in excess of the $500,000 deductible was approximately $873,000. Pursuant to the guidance under ASC 450, Contingencies – Gain Contingencies, approximately $578,000 of the insurance reimbursements receivable has been recorded to other income (expense) in the consolidated statements of total comprehensive income (loss) for the portion that related to the costs incurred for the year ended December 31, 2015 in excess of the Company’s insurance deductible and a corresponding amount has been recorded to other assets in the consolidated statements of financial position. The Company also recorded approximately $295,000 of the insurance reimbursements receivable to other assets in the consolidated statements of financial position and a corresponding offset to general, administrative and other expense in the consolidated statements of comprehensive income (loss) for the portion that related to legal costs incurred during the nine months ended September 30, 2016. During the three and nine months ended September 30, 2016, the Company received insurance reimbursements of approximately $41,000 and $738,000, respectively. At September 30, 2016, approximately $135,000 of insurance reimbursements receivable noted above is included in other assets in the consolidated statements of financial position.
| 24 |
13. Segment Reporting
The ZAIS Managed Entities segment is currently the Company’s only reportable segment, and represents the Company’s core business, as substantially all of the Company’s operations are conducted through this segment. The ZAIS Managed Entities segment provides investment advisory and asset management services to the ZAIS Managed Entities.
14. Stockholders’ Equity
Preferred Stock
The Company is authorized to issue 2,000,000 shares of preferred stock with a par value of $0.0001 per share with such designation, rights and preferences as may be determined time to time by the Company’s board of directors. At September 30, 2016 and December 31, 2015, there were no shares of preferred stock issued or outstanding.
Class A Common Stock
The Company is authorized to issue 180,000,000 shares of Class A Common Stock with a par value of $0.0001 per share. Holders of record of Class A Common Stock are entitled to one vote for each share held on all matters to be voted on by stockholders.
The Company issued 30,000 shares of Class A Common Stock during the nine months ended September 30, 2016 related to the RSUs which vested during the periods. There were no other issuances of Class A Common Stock during the three and nine months ended September 30, 2016 and September 30, 2015.
At September 30, 2016 and December 31, 2015, there were 13,900,917 and 13,870,917 shares of Class A Common Stock issued and outstanding, respectively.
Class B Common Stock
The Company is authorized to issue 20,000,000 shares of Class B Common Stock with a par value of $0.000001 per share. The Class B Common Stock has no economic rights and therefore is not considered participating securities for purposes of allocation of net income (loss). Holders of record of Class B Common Stock are entitled to ten votes for each share held on all matters to be voted on by stockholders. At September 30, 2016 and December 31, 2015, there were 20,000,000 shares of Class B Common Stock issued and outstanding, held by the ZGH Class B Voting Trust.
15. Earnings Per Share
Shares of Class B common stock have no impact on the calculation of consolidated net income (loss) per share of Class A common stock as holders of Class B common stock do not participate in net income or dividends, and thus, are not participating securities.
The following table presents a reconciliation of the earnings and shares used in calculating basic and diluted earnings per share:
| Three Months Ended September 30, | Nine Months Ended September 30, | |||||||||||||||
| 2016 | 2015 | 2016 | 2015 | |||||||||||||
| (Dollars in thousands, except shares and per share data) | ||||||||||||||||
| Numerator: | ||||||||||||||||
| Consolidated Net Income (Loss), net of tax, attributable to ZAIS Group Holdings, Inc. Class A common stockholders (Basic) | $ | (286 | ) | (568 | ) | (9,196 | ) | (4,337 | ) | |||||||
| Effect of dilutive securities: | ||||||||||||||||
| Consolidated Net Income (Loss), net of tax, attributable to non-controlling interests in ZGP | — | (1,009 | ) | (4,210 | ) | (7,754 | ) | |||||||||
Less: Consolidated Net (Income) Loss, net of tax, attributable to ZAIS REIT Management Class B interests (1) | (144 | ) | (144 | ) | (429 | ) | (426 | ) | ||||||||
| Income tax (benefit) expense (2) | — | 471 | — | 3,342 | ||||||||||||
Consolidated Net Income (Loss), net of tax, attributable to stockholders, after effect of dilutive securities | $ | (430 | ) | (1,250 | ) | (13,835 | ) | (9,175 | ) | |||||||
| Denominator: | ||||||||||||||||
| Weighted average number of shares of Class A Common Stock | 13,900,917 | 13,870,917 | 13,887,997 | 10,009,416 | ||||||||||||
| Effect of dilutive securities: | ||||||||||||||||
| Weighted average number of Class A Units of ZGP | 7,000,000 | 7,000,000 | 7,000,000 | 7,000,000 | ||||||||||||
| Dilutive number of Class B-0 Units and RSUs (3) | — | — | — | — | ||||||||||||
| Diluted weighted average shares outstanding (4) | 20,900,917 | 20,870,917 | 20,887,997 | 17,009,416 | ||||||||||||
| Consolidated Net Income (Loss), net of tax, per Class A common share – Basic | $ | (0.02 | ) | $ | (0.04 | ) | (0.66 | ) | (0.43 | ) | ||||||
| Consolidated Net Income (Loss), net of tax, per Class A common share – Diluted | $ | (0.02 | ) | $ | (0.06 | ) | (0.66 | ) | (0.54 | ) | ||||||
| 25 |
| (1) | – | Amount represents portion of the management fee income received from ZFC REIT that is payable to holders of Class B interests in ZAIS Group’s consolidated subsidiary ZAIS REIT Management. |
| (2) | – | Income tax (benefit) / expense for the three and nine months ended September 30, 2015 is calculated using an assumed tax rate of 40.85%. See Note 9, “Income Taxes” for details surrounding income taxes. |
| (3) | – | The treasury stock method is used to calculate incremental Class A common shares on potentially dilutive Class A common shares resulting from unvested Class B-0 Units granted in connection with and subsequent to the Business Combination and unvested RSUs granted to non-employee directors. These units are anti-dilutive and, consequently, have been excluded from the computation of diluted weighted average shares outstanding. |
| (4) | – | Number of diluted shares outstanding takes into account non-controlling interests of ZGP that may be exchanged for Class A Common Stock under certain circumstances. |
16. Supplemental Financial Information
The following supplemental financial information illustrates the consolidating effects of the Consolidated Funds on the Company’s financial position at September 30, 2016 and December 31, 2015, and results of operations for the three and nine months ended September 30, 2016 and September 30, 2015. Subsequent to the filing of the 10-Q for the three months ended March 31, 2015, the Company elected to early adopt ASU 2015-02 with an effective date of January 1, 2015. As a result of this adoption, the majority of the ZAIS Managed Entities which were consolidated in the 10-Q for the three months ended March 31, 2015 were deconsolidated. Additionally, subsequent to the filing of the June 30, 2015 and September 30, 2015 10-Q’s, in December 2015 additional interpretations of ASU 2015-02 became available to the Company. As a result of these new interpretations, the Company reviewed its previous conclusions and determined that additional entities should be deconsolidated. There was no impact on the income (loss) allocated to ZAIS Group Holdings, Inc. Stockholders Equity as a result of this adoption. The September 30, 2015 figures below reflect the consolidated results of the Company for the three and nine months ended September 30, 2015, subsequent to the adoption of ASU 2015-02 and the December 31, 2015 figures below reflect the consolidated results of the Company as of December 31, 2015, subsequent to the adoption of ASU 2015-02:
| September 30, 2016 | ||||||||||||||||
| ZAIS | Consolidated Funds | Eliminations | Consolidated | |||||||||||||
| ( Dollars in thousands ) | ||||||||||||||||
| Assets | ||||||||||||||||
| Cash and cash equivalents | $ | 29,421 | $ | — | $ | — | $ | 29,421 | ||||||||
| Income and fees receivable | 5,529 | — | (218 | ) | 5,311 | |||||||||||
| Investments in affiliates, at fair value | 29,645 | — | (24,471 | ) | 5,174 | |||||||||||
| Due from related parties | 953 | — | (41 | ) | 912 | |||||||||||
| Prepaid expenses | 1,445 | — | — | 1,445 | ||||||||||||
| Other assets | 458 | — | — | 458 | ||||||||||||
| Fixed assets, net | 340 | — | — | 340 | ||||||||||||
| Assets of Consolidated Funds | ||||||||||||||||
| Investments, at fair value | — | 20,348 | — | 20,348 | ||||||||||||
| Receivable for securities sold | — | 40,000 | — | 40,000 | ||||||||||||
| Dividend receivable | — | 8,317 | — | 8,317 | ||||||||||||
| Total Assets | $ | 67,791 | $ | 68,665 | $ | (24,730 | ) | $ | 111,726 | |||||||
| Liabilities and Equity | ||||||||||||||||
| Liabilities | ||||||||||||||||
| Notes payable | $ | 1,261 | $ | — | $ | — | $ | 1,261 | ||||||||
| Compensation payable | 5,672 | — | — | 5,672 | ||||||||||||
| Due to related parties | 144 | — | — | 144 | ||||||||||||
| Other liabilities | 973 | — | — | 973 | ||||||||||||
| Liabilities of Consolidated Funds | ||||||||||||||||
| Payable for securities purchased | — | 20,348 | — | 20,348 | ||||||||||||
| Other liabilities | — | 336 | (260 | ) | 76 | |||||||||||
| Total Liabilities | 8,050 | 20,684 | (260 | ) | 28,474 | |||||||||||
| Commitments and Contingencies (Note 12) | ||||||||||||||||
| Equity | ||||||||||||||||
| Preferred Stock | — | — | — | — | ||||||||||||
| Class A Common Stock | 1 | — | — | 1 | ||||||||||||
| Class B Common Stock | — | — | — | — | ||||||||||||
| Additional paid-in-capital | 62,809 | — | — | 62,809 | ||||||||||||
| Retained earnings (Accumulated deficit) | (23,001 | ) | — | — | (23,001 | ) | ||||||||||
| Accumulated other comprehensive income (loss) | (16 | ) | — | — | (16 | ) | ||||||||||
| Total stockholders’ equity, ZAIS Group Holdings, Inc. | 39,793 | — | — | 39,793 | ||||||||||||
| Non-controlling interests in ZAIS Group Parent, LLC | 19,948 | — | — | 19,948 | ||||||||||||
| Non-controlling interests in Consolidated Funds | — | 47,981 | (24,470 | ) | 23,511 | |||||||||||
| Total Equity | 59,741 | 47,981 | (24,470 | ) | 83,252 | |||||||||||
| Total Liabilities and Equity | $ | 67,791 | $ | 68,665 | $ | (24,730 | ) | $ | 111,726 | |||||||
| 26 |
| December 31, 2015 | ||||||||||||||||
| ZAIS | Consolidated Funds | Eliminations | Consolidated | |||||||||||||
| ( Dollars in thousands ) | ||||||||||||||||
| Assets | ||||||||||||||||
| Cash and cash equivalents | $ | 44,351 | $ | — | $ | — | $ | 44,351 | ||||||||
| Income and fees receivable | 2,529 | — | — | 2,529 | ||||||||||||
| Investments, at fair value | 8,169 | — | — | 8,169 | ||||||||||||
| Investments in affiliates, at fair value | 20,767 | — | (15,525 | ) | 5,242 | |||||||||||
| Due from related parties | 748 | — | — | 748 | ||||||||||||
| Prepaid expenses | 776 | — | — | 776 | ||||||||||||
| Other assets | 310 | — | — | 310 | ||||||||||||
| Fixed assets, net | 544 | — | — | 544 | ||||||||||||
| Assets of Consolidated Funds | ||||||||||||||||
| Cash and cash equivalents | — | 33 | — | 33 | ||||||||||||
| Investments, at fair value | — | 30,509 | — | 30,509 | ||||||||||||
| Total Assets | $ | 78,194 | $ | 30,542 | $ | (15,525 | ) | $ | 93,211 | |||||||
| Liabilities and Equity | ||||||||||||||||
| Liabilities | ||||||||||||||||
| Notes payable | $ | 1,255 | $ | — | $ | — | $ | 1,255 | ||||||||
| Compensation payable | 3,575 | — | — | 3,575 | ||||||||||||
| Due to related parties | 175 | — | — | 175 | ||||||||||||
| Fees payable | 756 | — | — | 756 | ||||||||||||
| Other liabilities | 1,546 | — | — | 1,546 | ||||||||||||
| Liabilities of Consolidated Funds | ||||||||||||||||
| Other liabilities | — | 101 | — | 101 | ||||||||||||
| Total Liabilities | 7,307 | 101 | — | 7,408 | ||||||||||||
| Commitments and Contingencies (Note 12) | ||||||||||||||||
| Equity | ||||||||||||||||
| Preferred Stock | — | — | — | — | ||||||||||||
| Class A Common Stock | 1 | — | — | 1 | ||||||||||||
| Class B Common Stock | — | — | — | — | ||||||||||||
| Additional paid-in-capital | 60,817 | — | — | 60,817 | ||||||||||||
| Retained earnings (Accumulated deficit) | (13,805 | ) | — | — | (13,805 | ) | ||||||||||
| Accumulated other comprehensive income (loss) | 158 | — | — | 158 | ||||||||||||
| Total stockholders’ equity, ZAIS Group Holdings, Inc. | 47,171 | — | — | 47,171 | ||||||||||||
| Non-controlling interests in ZAIS Group Parent, LLC | 23,716 | — | — | 23,716 | ||||||||||||
| Non-controlling interests in Consolidated Funds | — | 30,441 | (15,525 | ) | 14,916 | |||||||||||
| Total Equity | 70,887 | 30,441 | (15,525 | ) | 85,803 | |||||||||||
| Total Liabilities and Equity | $ | 78,194 | $ | 30,542 | $ | (15,525 | ) | $ | 93,211 | |||||||
| 27 |
| Three Months Ended September 30, 2016 | ||||||||||||||||
| ZAIS | Consolidated Funds | Eliminations | Consolidated | |||||||||||||
| ( Dollars in thousands ) | ||||||||||||||||
| Revenues | ||||||||||||||||
| Management fee income | $ | 3,872 | $ | — | $ | (218 | ) | $ | 3,654 | |||||||
| Incentive income | 3,614 | — | — | 3,614 | ||||||||||||
| Other revenues | 79 | — | — | 79 | ||||||||||||
| Total Revenues | 7,565 | — | (218 | ) | 7,347 | |||||||||||
| Expenses | ||||||||||||||||
| Compensation and benefits | 6,908 | — | — | 6,908 | ||||||||||||
| General, administrative and other | 2,963 | — | — | 2,963 | ||||||||||||
| Depreciation | 79 | — | — | 79 | ||||||||||||
| Expenses of Consolidated Funds | — | 234 | (218 | ) | 16 | |||||||||||
| Total Expenses | 9,950 | 234 | (218 | ) | 9,966 | |||||||||||
| Other Income (loss) | ||||||||||||||||
| Net gain (loss) on investments | 2,025 | — | (1,979 | ) | 46 | |||||||||||
| Other income (expense) | 53 | — | — | 53 | ||||||||||||
| Net gains (losses) of Consolidated Funds’ investments | — | 4,115 | — | 4,115 | ||||||||||||
| Total Other Income (Loss) | 2,078 | 4,115 | (1,979 | ) | 4,214 | |||||||||||
| Income (loss) before income taxes | (307 | ) | 3,881 | (1,979 | ) | 1,595 | ||||||||||
| Income tax (benefit) expense | (21 | ) | — | — | (21 | ) | ||||||||||
| Consolidated net income (loss), net of tax | (286 | ) | 3,881 | (1,979 | ) | 1,616 | ||||||||||
| Other Comprehensive Income (Loss), net of tax | ||||||||||||||||
| Foreign currency translation adjustment | (61 | ) | — | — | (61 | ) | ||||||||||
| Total Comprehensive Income (Loss) | $ | (347 | ) | $ | 3,881 | $ | (1,979 | ) | $ | 1,555 | ||||||
| Three Months Ended September 30, 2015 | ||||||||||||||||
| ZAIS | Consolidated Funds | Eliminations | Consolidated | |||||||||||||
| ( Dollars in thousands ) | ||||||||||||||||
| Revenues | ||||||||||||||||
| Management fee income | $ | 4,175 | $ | — | $ | — | $ | 4,175 | ||||||||
| Incentive income | 3,870 | — | — | 3,870 | ||||||||||||
| Other revenues | 81 | — | — | 81 | ||||||||||||
| Total Revenues | 8,126 | — | — | 8,126 | ||||||||||||
| Expenses | ||||||||||||||||
| Compensation and benefits | 6,488 | — | — | 6,488 | ||||||||||||
| General, administrative and other | 4,370 | — | — | 4,370 | ||||||||||||
| Depreciation | 445 | — | — | 445 | ||||||||||||
| Total Expenses | 11,303 | — | — | 11,303 | ||||||||||||
| Other Income (loss) | ||||||||||||||||
| Net gain (loss) on investments | (11 | ) | — | — | (11 | ) | ||||||||||
| Other income (expense) | 83 | — | — | 83 | ||||||||||||
| Total Other Income (Loss) | 72 | — | — | 72 | ||||||||||||
| Income (loss) before income taxes | (3,105 | ) | — | — | (3,105 | ) | ||||||||||
| Income tax (benefit) expense | (1,528 | ) | — | — | (1,528 | ) | ||||||||||
| Consolidated net income (loss), net of tax | (1,577 | ) | — | — | (1,577 | ) | ||||||||||
| Other Comprehensive Income (Loss), net of tax | — | — | ||||||||||||||
| Foreign currency translation adjustment | (160 | ) | — | — | (160 | ) | ||||||||||
| Total Comprehensive Income (Loss) | $ | (1,737 | ) | $ | — | $ | — | $ | (1,737 | ) | ||||||
| 28 |
| Nine Months Ended September 30, 2016 | ||||||||||||||||
| ZAIS | Consolidated Funds | Eliminations | Consolidated | |||||||||||||
| ( Dollars in thousands ) | ||||||||||||||||
| Revenues | ||||||||||||||||
| Management fee income | $ | 11,012 | $ | — | $ | (218 | ) | $ | 10,794 | |||||||
| Incentive income | 3,909 | — | — | 3,909 | ||||||||||||
| Other revenues | 238 | — | — | 238 | ||||||||||||
| Total Revenues | 15,159 | — | (218 | ) | 14,941 | |||||||||||
| Expenses | ||||||||||||||||
| Compensation and benefits | 23,914 | — | — | 23,914 | ||||||||||||
| General, administrative and other | 9,123 | — | — | 9,123 | ||||||||||||
| Depreciation | 206 | — | — | 206 | ||||||||||||
| Expenses of Consolidated Funds | — | 282 | (218 | ) | 64 | |||||||||||
| Total Expenses | 33,243 | 282 | (218 | ) | 33,307 | |||||||||||
| Other Income (loss) | ||||||||||||||||
| Net gain (loss) on investments | 3,921 | — | (3,838 | ) | 83 | |||||||||||
| Other income (expense) | 745 | — | — | 745 | ||||||||||||
| Net gains (losses) of Consolidated Funds’ investments | — | 7,808 | — | 7,808 | ||||||||||||
| Total Other Income (Loss) | 4,666 | 7,808 | (3,838 | ) | 8,636 | |||||||||||
| Income (loss) before income taxes | (13,418 | ) | 7,526 | (3,838 | ) | (9,730 | ) | |||||||||
| Income tax (benefit) expense | (12 | ) | — | — | (12 | ) | ||||||||||
| Consolidated net income (loss), net of tax | (13,406 | ) | 7,526 | (3,838 | ) | (9,718 | ) | |||||||||
| Other Comprehensive Income (Loss), net of tax | ||||||||||||||||
| Foreign currency translation adjustment | (262 | ) | — | — | (262 | ) | ||||||||||
| Total Comprehensive Income (Loss) | $ | (13,668 | ) | $ | 7,526 | $ | (3,838 | ) | $ | (9,980 | ) | |||||
| Nine Months Ended September 30, 2015 | ||||||||||||||||
| ZAIS | Consolidated Funds | Eliminations | Consolidated | |||||||||||||
| ( Dollars in thousands ) | ||||||||||||||||
| Revenues | ||||||||||||||||
| Management fee income | $ | 12,009 | $ | — | $ | — | $ | 12,009 | ||||||||
| Incentive income | 5,991 | — | — | 5,991 | ||||||||||||
| Other revenues | 218 | — | — | 218 | ||||||||||||
| Total Revenues | 18,218 | — | — | 18,218 | ||||||||||||
| Expenses | ||||||||||||||||
| Compensation and benefits | 20,418 | — | — | 20,418 | ||||||||||||
| General, administrative and other | 13,470 | — | — | 13,470 | ||||||||||||
| Depreciation | 654 | — | — | 654 | ||||||||||||
| Total Expenses | 34,542 | — | — | 34,542 | ||||||||||||
| Other Income (loss) | ||||||||||||||||
| Net gain (loss) on investments | 34 | — | — | 34 | ||||||||||||
| Other income (expense) | 88 | — | — | 88 | ||||||||||||
| Total Other Income (Loss) | 122 | — | — | 122 | ||||||||||||
| Income (loss) before income taxes | (16,202 | ) | — | — | (16,202 | ) | ||||||||||
| Income tax (benefit) expense | (4,111 | ) | — | — | (4,111 | ) | ||||||||||
| Consolidated net income (loss), net of tax | (12,091 | ) | — | — | (12,091 | ) | ||||||||||
| Other Comprehensive Income (Loss), net of tax | ||||||||||||||||
| Foreign currency translation adjustment | 323 | — | — | 323 | ||||||||||||
| Total Comprehensive Income (Loss) | $ | (11,768 | ) | $ | — | $ | — | $ | (11,768 | ) | ||||||
| 29 |
17. Subsequent Events
ZAIS CLO 5, which priced on September 23, 2016, closed on October 26, 2016 and has a maturity date of October 2028. At the CLO closing, the following amounts, which are included in the Company’s consolidated statement of financial position at September 30, 2016, were settled: (i) the payable for securities purchased of $20.3 million (ii) the receivable for securities sold of $40.0 million and (iii) the dividend receivable of $8.3 million. The Company is currently evaluating whether or not the investment in ZAIS CLO 5 will need to be consolidated in its financial statements in accordance with ASU 2015-02 Consolidation (Topic 810): Amendments to the Consolidation Analysis.
On October 31, 2016, the Company received an $8.0 million termination fee upon completion of ZFC REITs merger with Sutherland Asset Management Corp. pursuant to the Termination Agreement. As a result, ZAIS Group’s management fees and AUM related to mortgage strategies are expected to decrease by approximately $2.8 million, annually on a run-rate basis, and $0.589 billion, based on the REIT AUM at September 30, 2016, respectively.
On November 1, 2016 the Company issued 74,331 RSUs to the non-employee directors of ZAIS at a grant date fair value of $2.02 pursuant to ZAIS’s 2015 Stock Incentive Plan.
| 30 |
| Item 2. | MANAGEMENT’S DISCUSSION AND ANALYSIS OF FINANCIAL CONDITION AND RESULTS OF OPERATIONS |
In this Quarterly Report on Form 10-Q, references to (i) the “Company” refer to ZAIS Group Holdings, Inc. (“ZAIS”), together, as the context may require, with its consolidated subsidiaries, (ii) “ZAIS Group” refer to ZAIS Group, LLC, and (iii) “ZGP” refer to ZAIS Group Parent, LLC.
This discussion contains forward-looking statements and involves numerous known and unknown risks and uncertainties, including, but not limited to, those described in “Risk Factors” of the Annual Report on Form 10-K for the fiscal year ended December 31, 2015 (the “Annual Report on Form 10-K”) and in other reports filed with the U.S Securities and Exchange Commission (“SEC”). Actual results and the timing of events may differ materially from those contained in any forward-looking statements due to a number of factors, including those in the section entitled “Risk Factors” in the Company’s Annual Report on Form 10-K and in other SEC reports describing key risks associated with ZAIS and its subsidiaries’ business, operations and industry. Amounts and percentages presented throughout this management’s discussion and analysis of financial condition and results of operations may reflect rounding adjustments and as a result, totals may not appear to sum. The following discussion and analysis should be read in conjunction with the historical consolidated financial statements and related notes of the Company included elsewhere in this Quarterly Report on Form 10-Q.
Overview
ZAIS is a holding company conducting substantially all of its operations through ZAIS Group, a subsidiary of ZAIS’s majority-owned subsidiary, ZGP. ZAIS Group is an investment advisory and asset management firm focused on specialized credit. ZAIS Group is an investment advisor registered with the SEC under the Investment Advisers Act of 1940 and is also registered with the Commodity Futures Trading Commission as a Commodity Pool Operator and Commodity Trading Advisor. ZAIS Group provides investment advisory and asset management services to private funds, separately managed accounts, structured vehicles and, through October 31, 2016, ZAIS Financial Corp. (“ZFC REIT”), a publicly traded mortgage real estate investment trust (collectively, the “ZAIS Managed Entities”). The ZAIS Managed Entities predominantly invest in a variety of specialized credit instruments including bank loans, corporate credit instruments such as collateralized debt obligations (“CDOs”) and collateralized loan obligations (together with the CDOs referred to as “CLOs”) and various securities and instruments backed by these asset classes. ZAIS Group also serves as the general partner to certain ZAIS Managed Entities, which are generally organized as pass-through entities for U.S. federal income tax purposes. ZAIS Group had approximately $3.844 billion of assets under management (“AUM”) as of September 30, 2016 which is primarily comprised of (i) total assets for mark-to-market funds and separately managed accounts; (ii) uncalled capital commitments, if any, for funds that are not in liquidation; and (iii) for issued structured vehicles, all assets being managed calculated per the management fee basis methodology defined in the respective vehicles’ indenture, although in certain circumstances some or all of the referenced management fees may be waived. AUM also includes assets in the warehouse phase for new structured credit vehicles and is based on actual assets managed without reductions for leverage and most other liabilities and includes all assets regardless of whether management fees are being earned.
ZAIS REIT Management, LLC (“ZAIS REIT Management”), a majority owned subsidiary of ZAIS Group, is the external investment advisor to ZFC REIT. On April 7, 2016, ZFC REIT announced that it had entered into an agreement and plan of merger (the “Merger Agreement”). The ZFC REIT merger closed on October 31, 2016. In connection with the Merger Agreement, ZAIS REIT Management entered into a termination agreement (the “Termination Agreement”), whereby the current advisory agreement under which ZAIS REIT Management receives management fees from ZFC REIT was terminated upon closing of the merger on October 31, 2016. As a result, ZAIS Group’s management fees and AUM related to mortgage strategies are expected to decrease by approximately $2.8 million, annually on a run-rate basis, and $0.589 billion, based on the REIT AUM at September 30, 2016, respectively.
ZAIS Group commenced operations in July 1997, is headquartered in Red Bank, New Jersey and has an office in London. ZAIS Group is a wholly-owned consolidated subsidiary of ZGP, a majority-owned consolidated subsidiary of ZAIS. ZGP became the sole member and 100% equity owner of ZAIS Group on March 31, 2014 pursuant to a merger transaction which is described in detail in the Company’s Current Report on Form 8-K filed with the SEC on March 23, 2015 (the “Closing 8-K”).
The Company’s primary sources of revenues are (i) management fee income, which is based predominantly on the AUM of the ZAIS Managed Entities (ii) incentive income, which is based on the investment performance of the ZAIS Managed Entities and (iii) income of the consolidated ZAIS Managed Entities (the “Consolidated Funds”) which is based on the income generated from the portfolios of the Consolidated Funds, a portion of which is allocated to non-controlling interests in Consolidated Funds. All of the management fee income and incentive income earned by ZAIS Group from the Consolidated Funds is eliminated in consolidation.
ZAIS CLO 5, Limited (“ZAIS CLO 5”), closed on October 26, 2016. The CLO invests primarily in first lien senior secured bank loans and has a total capitalization of $408.5 million, which consists of debt of $368.0 million and equity of $40.5 million. ZAIS CLO 5 has a maturity date of October 2028. At September 30, 2016, ZAIS Zephyr A-6, LP, (“Zephyr A-6”) which is consolidated by the Company, has an initial investment of $20.3 million in ZAIS CLO 5 which represents approximately 2% economic interest in the debt tranches and approximately 32% economic interest in the equity of ZAIS CLO 5. The Company is currently evaluating whether or not the investment in ZAIS CLO 5 will need to be consolidated in its financial statements in accordance with ASU 2015-02 Consolidation (Topic 810): Amendments to the Consolidation Analysis (“ASU 2015-02”).
| 31 |
Organization Structure
The following diagram illustrates the Company’s current corporate structure:
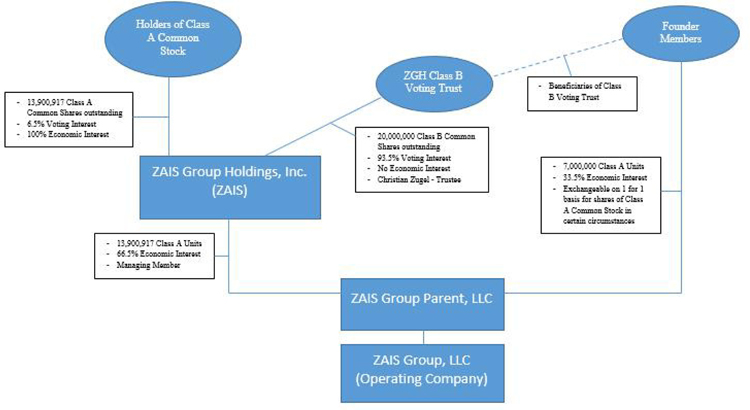
Recapitalization as a Result of a Business Combination
On October 5, 2012, ZAIS, formerly known as HF2 Financial Management Inc. (“HF2”) was formed as a blank check company whose objective was to acquire, through a merger, share exchange, asset acquisition, stock purchase, recapitalization, reorganization or similar business combination, one or more businesses or entities. On September 16, 2014, HF2 entered into an Investment Agreement, as defined in the Closing 8-K, with ZGP and the members of ZGP (including Christian Zugel, the former managing member of ZGP and the founder and Chief Investment Officer of ZAIS Group, and certain related parties, collectively, the “ZGP Founder Members”), under which HF2 agreed to contribute cash to ZGP in exchange for newly issued Class A Units of ZGP (“Class A Units”) representing a majority financial interest in ZGP (the “Business Combination”) and to cause the transfer of all of its outstanding shares of Class B Common Stock, par value $0.000001 (the “Class B Common Stock”) to the ZGP Founder Members. All Class B Common Stock was then immediately deposited into a newly created irrevocable voting trust (the “ZGH Class B Voting Trust”), of which Mr. Zugel is the sole trustee. The Class B Common Stock has no economic rights and therefore is not considered a participating security for purposes of allocation of net income (loss) of the Company.
On March 9, 2015, the stockholders of HF2 approved the Business Combination and the transaction closed on March 17, 2015 (the “Closing”). In connection with the Closing, HF2 changed its name to ZAIS Group Holdings, Inc. Please refer to Note 2 - "Business Combination" of the Company’s consolidated financial statements included in the Annual Report on Form 10-K for additional information. Prior to the Closing, HF2 was a shell company with no operations. Upon the Closing, ZAIS became a holding company whose assets primarily consist of an approximate 66.5% interest in its majority-owned subsidiary, ZGP. Prior to the Closing, Christian Zugel served as the managing member of ZGP. Upon the Closing, ZAIS became the managing member of ZGP.
Consolidation of ZAIS Managed Entities
The Company adopted ASU 2015-02 as of January 1, 2015. Pursuant to this guidance, the Company is required to consolidate certain of the ZAIS Managed Entities in which it holds a variable interest and is deemed to be the primary beneficiary. Subsequent to the filing of the 10-Q for the three months ended March 31, 2015, the Company elected to early adopt ASU 2015-02 with an effective date of January 1, 2015. As a result of this adoption, the majority of the ZAIS Managed Entities which were consolidated in the 10-Q for the three months ended March 31, 2015 were deconsolidated. Additionally, subsequent to the filing of the June 30, 2015 and September 30, 2015 10-Q’s, in December 2015 additional interpretations of ASU 2015-02 became available to the Company. As a result of these new interpretations, the Company reviewed its previous conclusions and determined that additional entities should be deconsolidated. There was no impact on the income (loss) allocated to ZAIS Group Holdings, Inc. Stockholders’ Equity as a result of this adoption. Accordingly, amounts included within this MD&A will differ from those within the 10Q for the three and nine months ended September 30, 2015.
| 32 |
When a ZAIS Managed Entity is consolidated, the assets, liabilities, revenues, expenses and cash flows of that entity are reflected on a gross basis, subject to eliminations in consolidation. The consolidation has no effect on the Company’s net income since its share of the earnings from these Consolidated Funds is included in equity. Additionally, the presentation of incentive income, compensation expense and other expenses associated with generating such reclassified revenue is not affected by the consolidation process.
The Dodd-Frank credit risk retention rules will apply to any CLO that closes (or in certain cases are materially amended) on or after December 24, 2016. As currently drafted, the rules specify that for each such CLO, the relevant collateral manager must purchase and hold, unhedged, directly or through a majority-owned affiliate, either (i) 5% of each tranche of the CLO’s securities, (ii) an amount of the CLO’s equity equal to 5% of the aggregate fair value of all of the CLO’s securities or (iii) a combination of the two. The required risk must be retained until the latest of (i) the date that the CLO has paid down its securities to 33% of their original principal amount, (ii) the date that the CLO has sold down its assets to 33% of their original principal amount and (iii) the date that is two years after closing. The Company will continue to assess its investments in the CLOs to determine whether or not the Company will be required to consolidate the CLOs in its financial statements.
Core Business
Revenues
The Company’s principal sources of revenues are management fees and incentive fees for investment advisory services provided to the ZAIS Managed Entities. For any given period, the Company’s revenues are influenced by the amount of AUM, the investment performance and the timing of when incentive income is recognized for certain of the ZAIS Managed Entities, as discussed below.
Management fees. ZAIS Group earns management fees for funds and accounts, monthly or quarterly or annually, based on the net asset value of these funds and accounts prior to the accrual of incentive fees/allocations. Management fees earned for the CLOs, it manages are generally based on the par value of the collateral and cash held in the CLOs. Management fees earned from ZFC REIT, quarterly, are based on ZFC REIT’s stockholders' equity, as defined in the amended and restated investment advisory agreement between ZAIS Group’s consolidated subsidiary ZAIS REIT Management and ZFC REIT. Twenty percent of the management fee income received from ZFC REIT is paid to holders of Class B interests in ZAIS REIT Management. The income is recorded as management fee income on the consolidated statements of comprehensive income (loss), and the portion of the management fees allocated to the holders of Class B interests in ZAIS REIT Management is included in the allocation of income (loss) to non-controlling interests in ZAIS Group Parent, LLC. The payment to the Class B interests in ZAIS REIT Management is recorded as distributions to non-controlling interests in ZAIS Group Parent, LLC. Pursuant to the Termination Agreement, the current advisory agreement under which ZAIS REIT Management receives management fees from ZFC REIT was terminated on October 31, 2016.
In addition to the management fee income mentioned above, subordinated management fees may be earned from CLOs for which ZAIS Group, or a wholly owned subsidiary of ZAIS Group, acts as collateral manager. The subordinated management fee is an additional payment for the same service, but has a lower priority in the CLO’s cash flows. The subordinated management fee is contingent upon the economic performance of the respective CLO assets. If the CLOs experience a certain level of asset defaults, these fees may not be paid. There is no recovery by the CLOs of previously paid subordinated fees. ZAIS Group recognizes the subordinated management fee income when collection is reasonably assured and all related contingencies have been removed.
Incentive income. Incentive income is recognized when it is (i) contractually receivable, (ii) fixed or determinable, also referred to as crystallized and (iii) all related contingencies have been removed and collection is reasonably assured, which generally occurs in the quarter of, or the quarter immediately prior to, the distribution of the income by the ZAIS Managed Entities. The criteria for revenue recognition are typically met only after all contributed capital and the preferred return, if any, on that capital have been distributed to the ZAIS Managed Entities’ investors for vehicles with private equity-style fee arrangements, and is typically met only after any profits exceed a high-water mark for vehicles with hedge fund-style fee arrangements.
For funds and accounts with hedge fund-style fee arrangements, incentive income is earned based on a percentage of the net realized and unrealized profits attributable to each investor, subject to a hurdle (if any) set forth in each respective entity’s operative agreement. Additionally, all funds and accounts with hedge fund-style fee arrangements are subject to a perpetual loss carry forward, or “perpetual high-water mark,” meaning that the funds and accounts will not pay incentive fees/allocations with respect to positive investment performance generated for an investor in any year following negative investment performance until that loss is recouped, at which point an investor’s capital balance surpasses the high-water mark. The funds and accounts pay incentive fees/allocations, generally on an annual basis, on any net profits in excess of the high-water mark, subject to a hurdle rate of return, where applicable. Funds and accounts with private equity-style fee arrangements are those that pay incentive fee/allocation based on a priority of payments under which investor capital must be returned and a preferred return, as specified in each fund’s operative agreement, must be paid to the investor prior to any payments of incentive-based income to ZAIS Group. For CLOs, incentive income is earned based on a percentage of cumulative profits, subject to the return of contributed capital (and subordinate management fees, if any), and a preferred inception to date return as specified in the respective CLOs’ collateral management agreements. The advisory agreement between ZAIS Group and ZFC REIT did not provide for incentive fees.
The management fees and incentive income from the Consolidated Funds are eliminated in consolidation, and therefore are not reflected as revenue in the Company’s consolidated financial statements. ZAIS Group’s share of the earnings from the consolidated ZAIS Managed Entities is increased by the amount of the management fees and incentive income that are eliminated in consolidation.
| 33 |
The following table presents the range of management and incentive fee rates on our funds and accounts, CLO’s and ZFC REIT during the respective periods presented:
| Three months ended September 30, | Nine months ended September 30, | |||||||||||
| 2016 | 2015 | 2016 | 2015 | |||||||||
| Management Fee Income | ||||||||||||
| Funds and accounts | 0.50% - 1.25% | 0.50% - 1.25% | 0.50% - 1.25% | 0.50% - 1.25% | ||||||||
| CLOs | 0.15% - 0.50% | 0.15% - 0.50% | 0.15% - 0.50% | 0.15% - 0.50% | ||||||||
| ZFC REIT | 1.50% | 1.50% | 1.50% | 1.50% | ||||||||
| Incentive Income (1) | ||||||||||||
| Funds and accounts | 10% - 20% | 10% - 20% | 10% - 20% | 10% - 20% | ||||||||
| CLOs | 20% | 20% | 20% | 10% - 20% | ||||||||
| (1) | Incentive income earned for certain of the ZAIS Managed Entities is subject to a hurdle rate of return as specified in each respective ZAIS Managed Entities’ operative agreement. |
Other revenues. Fees for consulting, data, funding and analytical services provided to outside parties and affiliated funds are accrued as earned.
Expenses
Compensation and benefits. Compensation and benefits expense is comprised of salaries, payroll taxes, employer contributions to welfare plans and discretionary and guaranteed cash bonuses, stock compensation, severance and other contractual compensation programs payable to employees and non-employee directors. Compensation and benefits expense is generally recognized over the related service period. On an annual basis, compensation and benefits comprise a significant portion of total expenses. Discretionary and guaranteed cash bonuses, stock compensation and other contractual compensation programs generally comprise a significant portion of total compensation and benefits. Levels of incentive compensation will vary to the extent they are tied to financial and operating performance of the Company and in some cases, to the performance of certain ZAIS Managed Entities.
The Company’s compensation plans include the following:
ZAIS Group, LLC Income Unit Plan
Under the Income Unit Plan, a portion of ZAIS Group’s net operating income (after making certain adjustments) was due to certain of ZAIS Group’s employees. These amounts were accrued as compensation expense in the period incurred. This plan was terminated effective December 31, 2014. No further amounts are payable under this plan.
Cash and Equity Based Awards
Compensation and benefits relating to the issuance of cash-based and equity-based awards to certain employees and non-employee directors is measured at fair value on the grant date. Compensation expense for awards that vest over a future service period is recognized over the relevant service period on a straight-line basis, adjusted for estimated forfeitures of awards not expected to vest. The compensation expense for awards that do not require future service is recognized immediately. Upon the end of the service period, compensation expense is adjusted to account for actual forfeiture rates.
On March 29, 2016, the Compensation Committee of the Board of Directors of ZAIS adopted a retention payment plan for certain employees of ZAIS Group (the "Retention Payment Plan"). The Retention Payment Plan applies to approximately 60 employees of ZAIS Group who have an annual base salary of less than $300,000. The purpose of the Retention Payment Plan is to enable ZAIS Group to retain the services of its employees in order to ensure that ZAIS Group is not disrupted or adversely affected by the possible loss of personnel or their commitment to ZAIS Group. Under the Retention Payment Plan, the participating employees are entitled to receive cash retention payments on each of April 15, 2016, August 15, 2016 and November 15, 2016, if the employee remains employed by ZAIS Group on such dates. The maximum aggregate amount of retention payments that may be paid to all participants under the Retention Payment Plan is $4.5 million. All payments under the Retention Payment Plan will be amortized equally over the required service period ending on each of the three payment dates discussed above. In the event an award is forfeited pursuant to the terms of a respective Retention Payment Plan agreement, the corresponding accruals will be reversed. In addition, on March 1, 2016, the Compensation Committee of the Board of Directors of ZAIS approved a retention payment of $900,000 to Howard Steinberg, the Company's General Counsel, which was paid on March 15, 2016 and is included in compensation and benefits in the consolidated statements of comprehensive income (loss) for the nine months ended September 30, 2016.
| 34 |
Compensation Directly Related to Incentive Income (also referred to as “Points”)
ZAIS Group previously entered into agreements with employees to share with them a percentage of income generated from certain ZAIS Managed Entities (“Points Agreements”). Under existing Points Agreements, ZAIS Group has an obligation to pay a fixed percentage of the incentive income earned from the referenced entities, including income from the Consolidated Funds that is eliminated in consolidation, to certain employees and former employees. Amounts payable pursuant to the Points Agreements are recorded as compensation expense when they become probable and reasonably estimable. The determination of when the Points become probable and reasonably estimable so that Points expense should be recorded is based on the assessment of numerous factors, particularly those related to the profitability, realizations, distribution status, investment profile and commitments or contingencies of certain ZAIS Managed Entities for which Points Agreements have been awarded. Points are expensed no later than the period in which the underlying income is recognized. Payment of the Points generally occurs later than when the related income is received. Recipients’ rights to receive payments related to their Points Agreement are subject to forfeiture risks. ZAIS Group does not anticipate entering into additional Points Agreements.
General, administrative and other. General, administrative and other expenses are related to professional services, research services, occupancy and equipment, technology, travel and entertainment, insurance and other miscellaneous expenses.
Net gain (loss) on investments. Net gain (loss) on investments primarily consists of net gains and losses on the Company’s investments in the ZAIS Managed Entities.
Allocation of consolidated net income (loss) to non-controlling interests in Consolidated Funds. Portion of consolidated net income (loss) attributable to investors in the Consolidated Funds that do not have the right to redeem their interests.
Consolidated Funds
Income of Consolidated Funds. Revenues consist primarily of interest income and dividend income which is recognized on an effective interest rate method.
Expenses of Consolidated Funds. Expenses consist of interest expense, fund operating expenses and other miscellaneous expenses.
Net gains of Consolidated Funds’ investments. Net gains consist of net realized and unrealized gains and losses on investments held by the Consolidated Funds.
Trends Affecting Our Business
AUM has been trending downward since 2007. This trend results from the wind-up and liquidation of a number of private equity-style and structured vehicles combined with challenges ZAIS Group has faced in raising new capital in the recent investment environment of lower interest rates and changing regulations. Structured credit products have been disfavored by many investors and European investors have generally reduced investments in certain securitized investment vehicles due to increased capital regulatory requirements.
The reduction in AUM has decreased the Company’s management fees and incentive fees, which are the Company’s two principal sources of operating cash flow. As a result of this reduction, in 2015 and for the nine months ended September 30, 2016 revenues and operating cash flow were insufficient to cover operating expenses, and excess working capital needs were funded by the proceeds of the Business Combination. It is currently expected that this negative working capital trend is likely to continue through the end of 2016. Additionally, as a result of the completion of the merger between ZFC REIT and Sutherland Asset Management Corp, ZAIS Group’s management fees and AUM related to mortgage strategies are expected to decrease by approximately $2.8 million, annually on a run-rate basis, and $0.589 billion, based on the REIT AUM at September 30, 2016, respectively. The decrease in management fees for this fiscal year will be offset by the receipt of the termination fee in the amount of $8.0 million pursuant to the Termination Agreement on October 31, 2016.
Non-GAAP Financial Measures
Net income (loss) (excluding Consolidated Funds of ZAIS Group) and Adjusted EBITDA
The Company’s management reviews its results on both a Net income (loss) (excluding Consolidated Funds of ZAIS Group) and an Adjusted EBITDA basis. Net income (loss) (excluding Consolidated Funds of ZAIS Group) and Adjusted EBITDA are key performance measures used by management when making operating decisions, assessing financial performance and allocating capital resources. Net income (loss) (excluding Consolidated Funds of ZAIS Group) and Adjusted EBITDA are non-GAAP financial measures that exclude the adjustments described below that are required for presentation of the Company’s results on a GAAP basis These measures supplement and should be considered in addition to and not in lieu of the results of operations prepared in accordance with GAAP:
| 35 |
Adjustments to Net income (loss) to derive Net income (loss) (excluding Consolidated Funds of ZAIS Group):
| · | Consolidating effects of the Consolidated Funds. Amounts related to the Consolidated Funds, including the related eliminations of management fees, incentive income, other revenues and gain (loss) on investments. Management fees from the Consolidated Funds are accrued as earned and are calculated and paid monthly, quarterly or semi-annually, depending on the individual agreements, consistent with the revenue recognition policy for the funds the Company does not consolidate. The Company also defers the recognition of incentive income from certain funds that the Company does not consolidate until it is (i) contractually receivable, (ii) fixed or determinable (“crystallized”), and (iii) all related contingencies have been removed and collection is reasonably assured, consistent with the revenue recognition policy for the Consolidated Funds. |
Adjustments to Net income (loss) (excluding Consolidated Funds of ZAIS Group) to derive Adjusted EBITDA:
| · | Compensation expense related to the Income Unit Plan. The Income Unit Plan was implemented in 2013 and was designed to deliver equity-like participation in ZAIS Group’s pre-tax income to key employees. Payments under the Income Unit Plan were recognized as compensation under GAAP. The Income Unit Plan was terminated effective December 31, 2014. |
| · | Compensation expense related to Points awards recorded before related incentive income being recognized. This adjustment reclassifies certain incentive compensation expenses into the accounting periods in which the associated incentive income was received and recognized. Certain of ZAIS Group’s legacy incentive compensation programs provided incentive compensation payments equal to a fixed percentage of incentive income received by ZAIS Group and were due and payable in the period ZAIS Group received the incentive income. Under GAAP, a portion of these incentive compensation payments are required to be recognized in accounting periods prior to the accounting periods in which the related incentive income was received and recognized. Currently there is only one incentive compensation program that may cause similar timing mismatch issues for financial statements prepared in accordance with GAAP. |
| · | Equity-based compensation. Management does not consider these non-cash expenses to be reflective of operating performance. |
| · | Severance. Management does not consider these expenses to be reflective of ongoing operating performance. |
| · | Impairment loss on goodwill. Management does not consider these expenses to be reflective of ongoing operating performance. |
| · | Certain other non-cash and non-operating items. |
| · | Any applicable taxes, interest expense, foreign currency translation adjustments and depreciation expenses. |
The calculation of Adjusted EBITDA may not be directly comparable to other similar non-GAAP financial measures reported by other asset managers. The Company believes that Adjusted EBITDA is a useful benchmark for measuring its performance. Management also believes that investors should review the same supplemental financial measures that management uses to analyze the business. Management also reviews management fee income, incentive income, other revenues, compensation and benefits, non-compensation expenses and net gain (loss) on investments on an Adjusted EBITDA basis after excluding the adjustments described above. As a result, the metrics are also considered non-GAAP financial measures.
Previously, the Company decided to eliminate Distributable Earnings and use only Net income (loss) (excluding Consolidated Funds of ZAIS Group) and Adjusted EBITDA as its primary non-GAAP measures. This change was made because management believed the differences between Distributable Earnings and Adjusted EBITDA were not significant, and that Net income (loss) (excluding Consolidated Funds of ZAIS Group) and Adjusted EBITDA were more meaningful measures of performance. In addition, the calculation of Adjusted EBITDA was modified in order to better reflect how management views our operating results. The measure now incorporates the investment income of its general partner investments, and eliminates the impact of severance and foreign currency adjustments that management does not consider to be reflective of on-going operating performance.
Results of Operations
Three Months Ended September 30, 2016 Compared to Three Months Ended September 30, 2015
| Three Months Ended September 30, | Change | |||||||||||||||
| 2016 | 2015 | $ | % | |||||||||||||
| (dollars in thousands) | ||||||||||||||||
| Consolidated net income (loss), net of tax | $ | 1,616 | $ | (1,577 | ) | $ | 3,193 | 202 | % | |||||||
| Net income (loss) (excluding Consolidated Funds of ZAIS Group) – Non-GAAP | $ | (286 | ) | $ | (1,577 | ) | $ | 1,291 | 82 | % | ||||||
| Adjusted EBITDA - Non-GAAP | $ | 1,068 | $ | (1,137 | ) | $ | 2,205 | 194 | % | |||||||
| 36 |
Revenues
| Three Months Ended September 30, | Change | |||||||||||||||
| 2016 | 2015 | $ | % | |||||||||||||
| (dollars in thousands) | ||||||||||||||||
| Management fee income | $ | 3,654 | $ | 4,175 | $ | (521 | ) | -12 | % | |||||||
| Incentive income | 3,614 | 3,870 | (256 | ) | -7 | % | ||||||||||
| Other revenues | 79 | 81 | (2 | ) | -2 | % | ||||||||||
| Total Revenues | $ | 7,347 | $ | 8,126 | $ | (779 | ) | -10 | % | |||||||
Total revenues decreased by $0.8 million primarily due to:
| · | A $0.5 million decrease in management fees was primarily due to the year-over-year reduction in average AUM of $0.383 billion. |
| · | A $0.3 million decrease in incentive income primarily due to incentive income recognized during the three months ended September 30, 2015 relating to a managed account which liquidated in 2015 and residual incentive income received which related to 2014 fund performance, offset by an increase in incentive income recognized during the three months ended September 30, 2016 related to a fund in which incentive income crystallized on September 30, 2016 and a managed account which liquidated on September 30, 2016. |
The following adjustments to revenue have been made when calculating Adjusted EBITDA – Non-GAAP for the three months ended September 30, 2016:
| · | $0.2 million of management fee elimination is added back to management fee income. |
There were no adjustments to revenues when calculating Adjusted EBITDA – Non-GAAP for the three months ended September 30, 2015.
The following table details the changes to our AUM for three months ended September 30, 2016 and September 30, 2015. The methodology for calculating AUM is described in the Overview section.
| Three Months Ended September 30, 2016 | ||||||||||||||||
| (dollars in billions) | ||||||||||||||||
| Corporate Credit Funds | Mortgage Related Strategies | Multi-Strategy Funds and Accounts | Total | |||||||||||||
| Beginning of Period AUM (1) | $ | 2.002 | $ | 1.229 | $ | 0.718 | $ | 3.949 | ||||||||
| Contributions (2) | 0.213 | (11) | — | 0.001 | 0.214 | |||||||||||
| Distributions (3) | (0.107 | ) | (0.004 | ) | — | (0.111 | ) | |||||||||
| Redemptions (4) | (0.002 | ) | (0.090 | ) | (0.012 | ) | (0.104 | ) | ||||||||
| Gain & Loss (5) | 0.016 | 0.033 | 0.069 | 0.118 | ||||||||||||
| Other (6) | (0.200 | ) | (0.016 | ) | (0.006 | ) | (0.222 | ) | ||||||||
| End of Period AUM (7) | $ | 1.922 | $ | 1.152 | $ | 0.770 | $ | 3.844 | ||||||||
| Average AUM (8) | $ | 1.962 | $ | 1.191 | $ | 0.744 | $ | 3.897 | ||||||||
| Three Months Ended September 30, 2015 | ||||||||||||||||
| (dollars in billions) | ||||||||||||||||
| Corporate Credit Funds | Mortgage Related Strategies | Multi-Strategy Funds and Accounts | Total | |||||||||||||
| Beginning of Period AUM (9) | $ | 1.843 | $ | 1.575 | $ | 0.941 | $ | 4.359 | ||||||||
| Contributions (2) | 0.007 | — | 0.008 | 0.015 | ||||||||||||
| Distributions (3) | (0.087 | ) | (0.002 | ) | — | (0.089 | ) | |||||||||
| Redemptions (4) | (0.015 | ) | — | (0.001 | ) | (0.016 | ) | |||||||||
| Gain & Loss (5) | (0.003 | ) | (0.012 | ) | (0.036 | ) | (0.051 | ) | ||||||||
| Other (6) | 0.010 | (0.020 | ) | (0.007 | ) | (0.017 | ) | |||||||||
| End of Period AUM (10) | $ | 1.755 | $ | 1.541 | $ | 0.905 | $ | 4.201 | ||||||||
| Average AUM (8) | $ | 1.799 | $ | 1.558 | $ | 0.923 | $ | 4.280 | ||||||||
| 37 |
| (1) | AUM uses values for: Euro Epics and Galleria CDO V, Ltd. (“Galleria V”) as of June 10, 2016, ZAIS Investment Grade Limited IX (“ZING IX”) as of June 3, 2016, ZAIS CLO 1, Limited (“CLO 1”) as of June 6, 2016, ZAIS CLO 2, Limited (“CLO 2”) as of June 16, 2016, ZAIS CLO 3, Limited (“CLO 3”) as of June 15, 2016, and ZAIS CLO 4, Limited (“CLO 4”) as of May 27, 2016. |
| (2) | Contributions related to funds, managed accounts and structured vehicles. |
| (3) | Distributions related to funds, managed accounts and structured vehicles. |
| (4) | Redemptions related to funds and managed accounts. |
| (5) | Gain & Loss related to funds and managed accounts. |
| (6) | Other represents changes primarily related to (i) leverage and other operating liabilities for funds and managed accounts and (ii) leverage, aggregate principal balance and other items for structured vehicles. Change in aggregate principal balance is primarily due to defaults, write downs, pay downs and collateral purchase/sales. |
| (7) | AUM uses values for: Euro Epics as of September 8, 2016, Galleria V as of September 9, 2016, ZING IX as of September 2, 2016, CLO 1 and CLO 3 as of September 6, 2016, CLO 2 as of September 15, 2016 and CLO 4 as of September 29, 2016. |
| (8) | Average is based on the beginning and ending balance for the period presented. |
| (9) | AUM uses values for: Euro Epics as of June 10, 2015, Galleria V as of June 9, 2015, ZING IX as of June 3, 2015, CLO 1 as of June 4, 2015 and CLO 2 as of June 16, 2015. |
| (10) | AUM uses values for: Euro Epics and Galleria V as of September 10, 2015, ZING IX as of September 2, 2015, CLO 1 and CLO 3 as of September 3, 2015 and CLO 2 as of September 16, 2015. |
| (11) | Amount primarily consists of $212.7 million of assets related to ZAIS CLO 5. In connection with the pricing of CLO 5, there was (i) a reduction in leverage of $153.4 million for the obligation to repay the ZAIS CLO 5 related warehouse financing and (ii) an $8.3 million distribution to the equity investor in the warehouse phase. These amounts are included in the Other and Distributions rows in the above table. There was also $0.6 million of reductions related to change in aggregate principal balance and other items for ZAIS CLO 5 during the period which is included in Other in the table above. |
Expenses
| Three Months Ended September 30, | Change | |||||||||||||||
| 2016 | 2015 | $ | % | |||||||||||||
| (dollars in thousands) | ||||||||||||||||
| Compensation and benefits | $ | 6,908 | $ | 6,488 | $ | 420 | 6 | % | ||||||||
| General, administrative and other | 2,963 | 4,370 | (1,407 | ) | -32 | % | ||||||||||
| Depreciation | 79 | 445 | (366 | ) | -82 | % | ||||||||||
| Expenses of Consolidated Funds | 16 | — | 16 | — | % | |||||||||||
| Total Expenses | $ | 9,966 | $ | 11,303 | $ | (1,337 | ) | -12 | % | |||||||
Total expenses decreased by $1.3 million primarily due to:
| · | A $0.4 million increase in compensation and benefits primarily due to: a $2.0 million increase in incentive compensation primarily relating to the accrual for year-end bonuses in 2016 and the payment of retention bonuses during the three months ended September 30, 2016; offset by a $1.3 million decrease in salaries and associated payroll taxes and other employee benefits due to the reduction in force and other restructuring; a $0.1 million decrease in severance costs; and a $0.1 million decrease in equity compensation relating to an increase in the estimated forfeiture rate on the Company’s B-0 units. |
| · | A $1.4 million decrease in general, administrative and other expenses, primarily due to: a $0.8 million decrease in professional fees and a $0.6 million decrease relating to a focused expense reduction. |
The following adjustments to expenses have been made when calculating Adjusted EBITDA – Non-GAAP for the three months ended September 30, 2016 and September 30, 2015:
| · | $0.02 million of expenses of Consolidated Funds is added back for the three months ended September 30, 2016. |
| · | Equity compensation of $1.3 million and severance costs of $0.03 million are added back to compensation and benefits for the three months ended September 30, 2016. Equity compensation of $1.4 million and severance costs of $0.1 million are added back to compensation and benefits for the three months ended September 30, 2015. |
| · | Depreciation expense of $0.08 million and $0.4 million are added back to total expenses for the three months ended September 30, 2016 and September 30, 2015, respectively. |
| 38 |
ZAIS Group’s results of operations depend, in part, on the level of ZAIS Group’s expenses, which can vary from period to period. The Company currently anticipates that its expenses will exceed its revenues in 2016, as they did in 2015 and the three months ended September 30, 2016. While the Company is seeking to reduce the expense imbalance by increasing revenue with new business growth and reducing expenses, there can be no assurances that ZAIS Group will correct this expense imbalance in 2016 or beyond.
Other Income (Loss)
| Three Months Ended September 30, | Change | |||||||||||||||
| 2016 | 2015 | $ | % | |||||||||||||
| (dollars in thousands) | ||||||||||||||||
| Net gain (loss) on investments | $ | 46 | $ | (11 | ) | $ | 57 | 518 | % | |||||||
| Other income (expense) | 53 | 83 | (30 | ) | -36 | % | ||||||||||
| Net gains (losses) on Consolidated Funds’ investments | 4,115 | — | 4,115 | — | % | |||||||||||
| Total Other Income (Loss) | $ | 4,214 | $ | 72 | $ | 4,142 | 5,753 | % | ||||||||
| · |
Total other income increased by $4.1 million primarily due to a $4.1 million increase in net gains (losses) on Consolidated Funds’ investments related to Zephyr A-6, a new Consolidated Fund which launched in the fourth quarter 2015. This Consolidated Fund is solely invested in a CLO, which is categorized as a Level 3 asset in the fair value hierarchy. For more information on the Company's valuation policy for Level 3 assets, see Note 4, “Fair Value of Investments”, to the Company's condensed consolidated financial statements.
$4.1 million of net gain (loss) on Consolidated Fund’s investments is removed from other income (loss) to derive Adjusted EBITDA – Non-GAAP for the three months ended September 30, 2016. This amount is offset by $2.0 million of net gain (loss) on investments attributable to the Company’s investment in the Consolidated Fund which is added back to other income (loss) to derive Adjusted EBITDA – Non-GAAP for the three months ended September 30, 2016. |
Income Taxes
| Three Months Ended September 30, | Change | |||||||||||||||
| 2016 | 2015 | $ | % | |||||||||||||
| (dollars in thousands) | ||||||||||||||||
| Income tax (benefit) expense | $ | (21 | ) | $ | (1,528 | ) | $ | 1,507 | 99 | % | ||||||
Income tax (benefit) expense decreased by $1.5 million due to the full valuation allowance booked on the Company’s deferred tax asset during the three months ended September 30, 2016.
As of each reporting date, management considers new evidence, both positive and negative, that could affect its view of the future realization of deferred tax assets. As of September 30, 2016, the Company has determined that the most recent management business forecasts do not support the realization of net deferred tax assets recorded for the Company. The Company has recorded a book loss for the three months ended September 30, 2016 and it is anticipated that expenses will continue to exceed revenues in 2016. Although management intends to pursue various initiatives with potential to alter the operating loss trend, there is no specific plan that has been implemented at this point in time that will alter the negative earnings trend.
Accordingly, management continues to believe that it is not more likely than not that the Company’s deferred tax asset will be realized, and the Company has continued to maintain the full valuation allowance against the deferred tax asset of as of September 30, 2016. The Company has recorded a reduction in its valuation allowance of $0.3 million in its consolidated statements of comprehensive income (loss) relating to the net operating losses and other temporary differences related to the Company’s allocable share of the consolidated results of operations for the three months ended September 30, 2016. The Company intends to maintain a full valuation allowance on its deferred tax assets until there is sufficient evidence to support the reversal of all or some portion of these allowances.
See Note 9, “Income Taxes” to the Company’s condensed consolidated financial statements for further information regarding the items affecting the Company’s effective income tax.
As of and for the three months ended September 30, 2016 and September 30, 2015, the Company was not required to establish a liability for uncertain tax positions.
| 39 |
Foreign currency translation adjustment
| Three Months Ended September 30, | Change | |||||||||||||||
| 2016 | 2015 | $ | % | |||||||||||||
| (dollars in thousands) | ||||||||||||||||
| Foreign currency translation adjustment | $ | (61 | ) | $ | (160 | ) | $ | 99 | 62 | % | ||||||
Changes in the foreign currency translation adjustment are due to fluctuations in the exchange rates prevailing at the end of each reporting period that the Company uses to translate the assets and liabilities of its foreign subsidiaries.
Net Income (Loss) Allocated to Non-controlling Interests
The following table presents the components of the net income (loss) allocated to non-controlling interests in Consolidated Funds and to non-controlling interests in ZGP:
| Three Months Ended September 30, | Change | |||||||||||||||
| 2016 | 2015 | $ | % | |||||||||||||
| (dollars in thousands) | ||||||||||||||||
| Non-controlling interests in Consolidated Funds | $ | 1,902 | $ | — | $ | 1,902 | — | % | ||||||||
| Non-controlling interests in ZAIS Group Parent, LLC | $ | — | $ | (1,009 | ) | $ | 1,009 | 100 | % | |||||||
| · | A $1.9 million increase in the net income allocated to non-controlling interests in Consolidated Funds related to Zephyr A-6, a new Consolidated Fund which was launched in the fourth quarter of 2015. |
| · | A $1.0 million decrease in net loss allocated to non-controlling interests in ZGP is driven primarily by the quarter-over-quarter reduction in expenses and the increase in unrealized gains on investments, partially offset by the reduction in management fees and incentive income. |
Net Income (Loss) Attributable to ZAIS Group Holdings, Inc. Stockholders’ Equity
| Three Months Ended September 30, | Change | |||||||||||||||
| 2016 | 2015 | $ | % | |||||||||||||
| (dollars in thousands) | ||||||||||||||||
| ZAIS Group Holdings, Inc. Stockholders’ Equity | $ | (286 | ) | $ | (568 | ) | 282 | 50 | % | |||||||
The decrease in net loss attributable to ZAIS Group Holdings, Inc. stockholders’ equity is driven primarily by the decrease in deferred tax assets as the Company continues to maintain the full valuation allowance which was originally established at December 31, 2015 and the quarter over quarter reduction in management fees and incentive income, partially offset by the reduction in expenses and the increase in unrealized gains on investments.
Reconciliations of Non-GAAP Financial Measures
The following table presents the reconciliation of the Company’s consolidated GAAP net income, net of tax to its non-GAAP financial measure of net income (loss) (excluding Consolidated Funds of ZAIS Group) for the three months ended September 30, 2016 and September 30, 2015:
| Three Months Ended September 30, | ||||||||
| 2016 | 2015 | |||||||
| (dollars in thousands) | ||||||||
| Consolidated net income, net of tax (GAAP Net Income) | $ | 1,616 | $ | (1,577 | ) | |||
| Add back: Elimination of Management fee income | 218 | — | ||||||
| Add back: Elimination of Net gain (loss) on investments | 1,979 | — | ||||||
| Add back: Expenses of Consolidated Funds | 16 | — | ||||||
| Net (gain) loss on Consolidated Funds’ investments | (4,115 | ) | — | |||||
| Net income (loss) (excluding Consolidated Funds of ZAIS Group) – Non-GAAP | $ | (286 | ) | $ | (1,577 | ) | ||
| 40 |
The following table presents the reconciliations of the Company’s GAAP pre-tax consolidated net income to its non-GAAP financial measures of Adjusted EBITDA for the three months ended September 30, 2016 and September 30, 2015:
| Three Months Ended September 30, | ||||||||
| 2016 | 2015 | |||||||
| (dollars in thousands) | ||||||||
| Adjusted EBITDA - Non GAAP | ||||||||
| Pre-tax Consolidated Net Income (loss) (GAAP pre-tax net income (loss)) | $ | 1,595 | $ | (3,105 | ) | |||
| Add back: Elimination of Management fee income | 218 | — | ||||||
| Add back: Elimination of Net gain (loss) on investments | 1,979 | — | ||||||
| Add back: Expenses of Consolidated Funds | 16 | — | ||||||
| Net (gain) loss on Consolidated Funds’ investments | (4,115 | ) | — | |||||
| Add back: Compensation attributable to equity compensation | 1,269 | 1,410 | ||||||
| Add back: Severance costs | 27 | 113 | ||||||
| Add back: Depreciation | 79 | 445 | ||||||
| Adjusted EBITDA – Non-GAAP | $ | 1,068 | $ | (1,137 | ) | |||
Nine Months Ended September 30, 2016 Compared to Nine Months Ended September 30, 2015
| Nine Months Ended September 30, | Change | |||||||||||||||
| 2016 | 2015 | $ | % | |||||||||||||
| (dollars in thousands) | ||||||||||||||||
| Consolidated net income (loss), net of tax | $ | (9,718 | ) | $ | (12,091 | ) | $ | 2,373 | 20 | % | ||||||
| Net income (loss) (excluding Consolidated Funds of ZAIS Group) – Non-GAAP | $ | (13,406 | ) | $ | (12,091 | ) | $ | (1,315 | ) | -11 | % | |||||
| Adjusted EBITDA - Non-GAAP | $ | (9,472 | ) | $ | (11,173 | ) | $ | 1,701 | 15 | % | ||||||
Revenues
| Nine Months Ended September 30, | Change | |||||||||||||||
| 2016 | 2015 | $ | % | |||||||||||||
| (dollars in thousands) | ||||||||||||||||
| Management fee income | $ | 10,794 | $ | 12,009 | $ | (1,215 | ) | -10 | % | |||||||
| Incentive income | 3,909 | 5,991 | (2,082 | ) | -35 | % | ||||||||||
| Other revenues | 238 | 218 | 20 | 9 | % | |||||||||||
| Total Revenues | $ | 14,941 | $ | 18,218 | $ | (3,277 | ) | -18 | % | |||||||
Total revenues decreased by $3.3 million primarily due to:
| · | A $1.2 million decrease in management fees primarily due to the year-over-year reduction in average AUM of $.202 billion. |
| · | A $2.1 million decrease in incentive income primarily due to residual incentive income recognized during the nine months ended September 30, 2015 relating to CLO’s and funds which liquidated in 2014 and early 2015 offset by an increase in incentive income recognized during the nine months ended September 30, 2016 related to a managed account in which incentive income is crystallized monthly, a fund which crystalized on September 30, 2016 and a managed account which liquidated on September 30, 2016. |
The following adjustments to revenue have been made when calculating Adjusted EBITDA – Non-GAAP for the nine months ended September 30, 2016:
| · | $0.2 million of management fee elimination is added back to management fee income. |
| 41 |
There were no adjustments to revenues when calculating Adjusted EBITDA – Non-GAAP for the nine months ended September 30, 2015.
The following table details the changes to our AUM for nine months ended September 30, 2016 and September 30, 2015. The methodology for calculating AUM is described in the Overview section.
| Nine Months Ended September 30, 2016 | ||||||||||||||||
| (dollars in billions) | ||||||||||||||||
| Corporate Credit Funds | Mortgage Related Strategies | Multi-Strategy Funds and Accounts | Total | |||||||||||||
| Beginning of Period AUM (1) | $ | 1.914 | $ | 1.494 | $ | 0.749 | $ | 4.157 | ||||||||
| Contributions (2) | 0.497 | (8) | — | 0.002 | 0.499 | |||||||||||
| Distributions (3) | (0.133 | ) | (0.025 | ) | — | (0.158 | ) | |||||||||
| Redemptions (4) | (0.129 | ) | (0.090 | ) | (0.022 | ) | (0.241 | ) | ||||||||
| Gain & Loss (5) | 0.025 | 0.047 | 0.092 | 0.164 | ||||||||||||
| Other (6) | (0.252 | ) | (0.274 | ) | (0.051 | ) | (0.577 | ) | ||||||||
| End of Period AUM (7) | $ | 1.922 | $ | 1.152 | $ | 0.770 | $ | 3.844 | ||||||||
| Average AUM (9) | $ | 1.919 | $ | 1.323 | $ | 0.760 | $ | 4.001 | ||||||||
| Nine Months Ended September 30, 2015 | ||||||||||||||||
| (dollars in billions) | ||||||||||||||||
| Corporate Credit Funds | Mortgage Related Strategies | Multi-Strategy Funds and Accounts | Total | |||||||||||||
| Beginning of Period AUM (10) | $ | 1.931 | $ | 1.505 | $ | 0.771 | $ | 4.206 | ||||||||
| Contributions (2) | 0.440 | (11) | — | 0.011 | 0.451 | |||||||||||
| Distributions (3) | (0.147 | ) | (0.012 | ) | — | (0.159 | ) | |||||||||
| Redemptions (4) | (0.288 | ) | — | (0.001 | ) | (0.289 | ) | |||||||||
| Gain & Loss (5) | (0.008 | ) | 0.013 | (0.004 | ) | 0.001 | ||||||||||
| Other (6) | (0.173 | ) | 0.036 | 0.128 | 0.009 | |||||||||||
| End of Period AUM (12) | $ | 1.755 | $ | 1.541 | $ | 0.905 | $ | 4.201 | ||||||||
| Average AUM (9) | $ | 1.843 | $ | 1.523 | $ | 0.838 | $ | 4.203 | ||||||||
| (1) | AUM uses values for: Euro Epics and Galleria V as of December 10, 2015, ZING IX as of December 3, 2015, CLO 1 as of December 4, 2015, CLO 2 as of December 16, 2015 and CLO 3 as of December 15, 2015. |
| (2) | Contributions related to funds, managed accounts and structured vehicles. |
| (3) | Distributions related to funds, managed accounts and structured vehicles. |
| (4) | Redemptions related to funds and managed accounts. |
| (5) | Gain & Loss related to funds and managed accounts. |
| (6) | Other represents changes primarily related to (i) leverage and other operating liabilities for funds and managed accounts and (ii) leverage, aggregate principal balance and other items for structured vehicles. Change in aggregate principal balance is primarily due to defaults, write downs, pay downs and collateral purchase/sales. |
| (7) | AUM uses values for: Euro Epics as of September 8, 2016, Galleria V as of September 9, 2016, ZING IX as of September 2, 2016, CLO 1 and CLO 3 as of September 6, 2016, CLO 2 as of September 15, 2016 and CLO 4 as of September 29, 2016. |
| (8) |
Amount includes $212.7 million and $269.4 million of assets related to ZAIS CLO 5 and CLO 4, respectively. In connection with the pricing of ZAIS CLO 5, there was a (i) reduction in leverage of $153.4 million for the obligation to repay the ZAIS CLO 5 warehouse financing and (ii) an $8.3 million distribution to the equity investor in the warehouse phase. These amounts are included in the Other and Distributions rows in the table above. There was also $0.6 million of reductions related to change in aggregate principal balance and other items for CLO 5 during the period which is included in Other in the table above.
In connection with the pricing of CLO 4, there was a reduction in leverage of $93.5 million for the obligation to repay the CLO 4 warehouse financing and (ii) $23 million of redemptions for amounts returned to the equity investors in the warehouse phase. These amounts are included in the Other and Redemptions rows in the table above. There was also a $0.6 million increase related to change in aggregate principal balance and other items for CLO 4 during the period which is included in Other in the table above. |
| (9) | Average is based on the beginning and ending balance for the period presented. |
| (10) | AUM uses values for: ZAIS Value-Added Real Estate Fund I, L.P. (“ZVAREF”) as of September 30, 2014, EPICS I Ltd. ("Epics") and CO-EPICS I Ltd. ("Co-Epics") as of December 22, 2014, Euro Epics and Galleria V as of December 10, 2014, ZING IX as of December 3, 2014, CLO 1 as of December 4, 2014 and CLO 2 as of December 16, 2014. |
| (11) |
Amount includes $403.8 million of assets related to CLO 3, respectively. In connection with the pricing of CLO 3, there was a (i) reduction in leverage of $253.3 million for the obligation to repay the ZAIS CLO 5 warehouse financing (ii) $30 million of distributions for amounts returned to the equity investors in the warehouse phase. These amounts are included in the Other and Distributions rows in the table above. There was also $14.2 million of reductions related to change in aggregate principal balance and other items for CLO 3 during the period which is included in Other in the table above. |
| (12) | AUM uses values for: Euro Epics and Galleria V as of September 10, 2015, ZING IX as of September 2, 2015, CLO 1 and CLO 3 as of September 3, 2015 and CLO 2 as of September 16, 2015. |
| 42 |
Expenses
| Nine Months Ended September 30, | Change | |||||||||||||||
| 2016 | 2015 | $ | % | |||||||||||||
| (dollars in thousands) | ||||||||||||||||
| Compensation and benefits | $ | 23,914 | $ | 20,418 | $ | 3,496 | 17 | % | ||||||||
| General, administrative and other | 9,123 | 13,470 | (4,347 | ) | -32 | % | ||||||||||
| Depreciation | 206 | 654 | (448 | ) | -69 | % | ||||||||||
| Expenses of Consolidated Funds | 64 | — | 64 | — | % | |||||||||||
| Total Expenses | $ | 33,307 | $ | 34,542 | $ | (1,235 | ) | -4 | % | |||||||
Total expenses decreased by $1.2 million primarily due to:
| · | A $3.5 million increase in compensation and benefits primarily due to: a $7.0 million increase in incentive compensation primarily relating to the accrual for year-end bonuses in 2016 and the payment of retention and sign-on bonuses during the nine months ended September 30, 2016; offset by a $2.7 million decrease in salaries and associated payroll taxes and other employee benefits due to the reduction in force and other restructuring; a $0.3 million decrease in equity compensation due to the increase in the estimated forfeiture rate relating to the reduction in force in March 2016 and a $0.3 million decrease in severance costs. |
| · |
A $4.3 million decrease in general, administrative and other expenses, primarily due to: a $2.7 million decrease in professional fees primarily due to transaction expenses incurred relating to the Business Combination in 2015; a $0.5 million decrease in occupancy and utilities related to the closure of the Shanghai office; and a $1.1 million decrease due to a focused expense reduction. |
The following adjustments to expenses have been made when calculating Adjusted EBITDA – Non-GAAP for the nine months ended September 30, 2016 and September 30, 2015:
| · | Equity compensation of $3.0 million and severance costs of $0.8 million are added back for the nine months ended September 30, 2016. Equity compensation of $3.3 million and severance costs of $1.1 million are added back to compensation and benefits for the nine months ended September 30, 2015. |
| · | Depreciation expense of $0.2 million and $0.7 million are added back to total expenses for the nine months ended September 30, 2016 and September 30, 2015, respectively. |
ZAIS Group’s results of operations depend, in part, on the level of ZAIS Group’s expenses, which can vary from period to period. The Company currently anticipates that its expenses will exceed its revenues in 2016, as they did in 2015 and the nine months ended September 30, 2016. While the Company is seeking to reduce the expense imbalance by increasing revenue with new business growth and reducing expenses, there can be no assurances that ZAIS Group will correct this expense imbalance in 2016 or beyond.
Other Income (Loss)
| Nine Months Ended September 30, | Change | |||||||||||||||
| 2016 | 2015 | $ | % | |||||||||||||
| (dollars in thousands) | ||||||||||||||||
| Net gain (loss) on investments | $ | 83 | $ | 34 | $ | 49 | 144 | % | ||||||||
| Other income (expense) | 745 | 88 | 657 | 747 | % | |||||||||||
| Net gains (losses) on Consolidated Funds’ investments | 7,808 | — | 7,808 | — | % | |||||||||||
| Total Other Income (Loss) | $ | 8,636 | $ | 122 | $ | 8,514 | 6,979 | % | ||||||||
| 43 |
Total other income (loss) increased by $8.5 million primarily due to:
| · | A $0.7 million increase in other income (expense) due to $0.6 million of income relating to an insurance reimbursement for legal and other costs incurred during the year ended December 31, 2015. |
| · |
A $7.8 million increase in net gains (losses) on Consolidated Funds’ investments related to Zephyr A-6, a new Consolidated Fund which launched in the fourth quarter 2015. This Consolidated Fund is solely invested in a CLO, which is categorized as a Level 3 asset in the fair value hierarchy. For more information on the Company's valuation policy for Level 3 assets, see Note 4, “Fair Value of Investments”, to the Company's condensed consolidated financial statements.
$7.8 million of net gain (loss) on Consolidated Fund’s investments is removed from other income (loss) to derive Adjusted EBITDA – Non-GAAP for the nine months ended September 30, 2016. This amount is offset by $3.8 million of net gain (loss) on investments attributable to the Company’s investment in the Consolidated Fund is added back to other income (loss) to derive Adjusted EBITDA – Non-GAAP for the nine months ended September 30, 2016. |
Income Taxes
| Nine Months Ended September 30, | Change | |||||||||||||||
| 2016 | 2015 | $ | % | |||||||||||||
| (dollars in thousands) | ||||||||||||||||
| Income tax (benefit) expense | $ | (12 | ) | $ | (4,111 | ) | $ | 4,099 | 100 | % | ||||||
Income tax (benefit) expense decreased by $4.1 million due to the full valuation allowance established for the Company’s deferred tax asset at December 31, 2015.
As of each reporting date, management considers new evidence, both positive and negative, that could affect its view of the future realization of deferred tax assets. As of September 30, 2016, the Company has determined that the most recent management business forecasts do not support the realization of net deferred tax assets recorded for the Company. The Company has recorded a book loss for the nine months ended September 30, 2016 and it is anticipated that expenses will continue to exceed revenues in 2016. Although management intends to pursue various initiatives with potential to alter the operating loss trend, there is no specific plan that has been implemented at this point in time that will alter the negative earnings trend.
Accordingly, management continues to believe that it is not more likely than not that the Company’s deferred tax asset will be realized, and the Company has continued to maintain the full valuation allowance against the deferred tax asset of as of September 30, 2016. The Company has recorded an additional $3.2 million charge to its consolidated statements of comprehensive income (loss) relating to the net operating losses and other temporary differences related to the Company’s allocable share of the consolidated results of operations for the nine months ended September 30, 2016. The Company intends to maintain a full valuation allowance on its deferred tax assets until there is sufficient evidence to support the reversal of all or some portion of these allowances.
See Note 9, “Income Taxes” to the Company’s condensed consolidated financial statements for further information regarding the items affecting the Company’s effective income tax.
As of and for the nine months ended September 30, 2016 and September 30, 2015, the Company was not required to establish a liability for uncertain tax positions.
Foreign currency translation adjustment
| Nine Months Ended September 30, | Change | |||||||||||||||
| 2016 | 2015 | $ | % | |||||||||||||
| (dollars in thousands) | ||||||||||||||||
| Foreign currency translation adjustment | $ | (262 | ) | $ | 323 | $ | (585 | ) | -181 | % | ||||||
Changes in the foreign currency translation adjustment are due to fluctuations in the exchange rates prevailing at the end of each reporting period that the Company uses to translate the assets and liabilities of its foreign subsidiaries.
| 44 |
Net Income (Loss) Allocated to Non-controlling Interests
The following table presents the components of the net income (loss) allocated to non-controlling interests in Consolidated Funds and to non-controlling interests in ZGP:
| Nine Months Ended September 30, | Change | |||||||||||||||
| 2016 | 2015 | $ | % | |||||||||||||
| (dollars in thousands) | ||||||||||||||||
| Non-controlling interests in Consolidated Funds | $ | 3,688 | $ | — | $ | 3,688 | — | % | ||||||||
| Non-controlling interests in ZAIS Group Parent, LLC | $ | (4,210 | ) | $ | (7,754 | ) | $ | 3,544 | 46 | % | ||||||
| · | A $3.7 million increase in the net income allocated to non-controlling interests in Consolidated Funds related to Zephyr A-6, a new Consolidated Fund which was launched in the fourth quarter of 2015. |
| · | A $3.5 million decrease in net loss allocated to non-controlling interests in ZGP is primarily due to the timing of the Business Combination, which did not close until March 17, 2015. Accordingly, the non-controlling interests in ZGP were allocated a larger portion of the losses during the nine months ended September 30, 2015. |
Net Income (Loss) Attributable to ZAIS Group Holdings, Inc. Stockholders’ Equity
| Nine Months Ended September 30, | Change | |||||||||||||||
| 2016 | 2015 | $ | % | |||||||||||||
| (dollars in thousands) | ||||||||||||||||
| ZAIS Group Holdings, Inc. Stockholders’ Equity | $ | (9,196 | ) | $ | (4,337 | ) | $ | (4,859 | ) | -112 | % | |||||
The increase in net loss attributable to ZAIS Group Holdings, Inc. equity is primarily due to the timing of the Business Combination, which did not close until March 17, 2015. Accordingly, the stockholders’ of ZAIS Group Holdings, Inc. were allocated a smaller portion of the losses during the nine months ended September 30, 2015. Additionally, the increase in net loss was due to a decrease in deferred tax assets as the Company continues to maintain the full valuation allowance which was originally established at December 31, 2015 and the reduction in management fees and incentive income, partially offset by the reduction in expenses and the increase in unrealized gains on investments.
Reconciliations of Non-GAAP Financial Measures
The following table presents the reconciliation of the Company’s consolidated GAAP net income, net of tax to its non-GAAP financial measure of net income (loss) (excluding Consolidated Funds of ZAIS Group) for the nine months ended September 30, 2016 and September 30, 2015:
| Nine Months Ended September 30, | ||||||||
| 2016 | 2015 | |||||||
| (dollars in thousands) | ||||||||
| Consolidated net income, net of tax (GAAP Net Income) | $ | (9,718 | ) | $ | (12,091 | ) | ||
| Add back: Elimination of Management fee income | 218 | — | ||||||
| Add back: Elimination of net gain (loss) on investments | 3,838 | — | ||||||
| Add back: Expenses of Consolidated Funds | 64 | — | ||||||
| Net (gain) loss on Consolidated Funds’ investments | (7,808 | ) | — | |||||
| Net income (loss) (excluding Consolidated Funds of ZAIS Group) – Non-GAAP | $ | (13,406 | ) | $ | (12,091 | ) | ||
The following table presents the reconciliations of the Company’s GAAP pre-tax consolidated net income to its non-GAAP financial measures of Adjusted EBITDA for the nine months ended September 30, 2016 and September 30, 2015:
| Nine Months Ended September 30, | ||||||||
| 2016 | 2015 | |||||||
| (dollars in thousands) | ||||||||
| Adjusted EBITDA - Non GAAP | ||||||||
| Pre-tax Consolidated Net Income (loss) (GAAP pre-tax net income (loss)) | $ | (9,730 | ) | $ | (16,202 | ) | ||
| Add back: Elimination of Management fee income | 218 | — | ||||||
| Add back: Elimination of Net gain (loss) on investments | 3,838 | — | ||||||
| Add back: Expenses of Consolidated Funds | 64 | — | ||||||
| Net (gain) loss on Consolidated Funds’ investments | (7,808 | ) | — | |||||
| Add back: Compensation attributable to equity compensation | 2,951 | 3,288 | ||||||
| Add back: Severance costs | 789 | 1,087 | ||||||
| Add back: Depreciation | 206 | 654 | ||||||
| Adjusted EBITDA – Non-GAAP | $ | (9,472 | ) | $ | (11,173 | ) | ||
| 45 |
Performance of ZAIS Group’s Funds
ZAIS Group currently manages various funds and managed accounts. The below table sets forth unaudited net performance returns for the month ended September 30, 2016, year-to-date (“YTD”) and inception-to-date (“ITD”) through September 30, 2016 for the following funds.
| Fund Name (1) | Net Asset Value as of September 30, | Net Return for Month September 30, | Net YTD Return September | Net ITD Return September | ||||||||||||
| ZAIS Opportunity Fund (3) (4) | $ | 430,383,492 | 1.30 | % | 13.83 | % | 419.70 | % | ||||||||
| ZAIS INARI Fund | $ | 400,193,006 | 0.95 | % | 10.95 | %(5) | 39.03 | % | ||||||||
| (1) | The performance data in the tables above reflect unaudited net returns as of the close of business on the last day of the relevant period. These net returns reflect performance after taking into account management fees, expenses, and incentive fees/allocations, as applicable. Results reflect the reinvestments of dividends, interest and earnings. Past performance is not a guarantee, prediction or indicator of future returns and no representation is made that any investor will or is likely to achieve results comparable to those shown or will make any profit or will be able to avoid incurring substantial losses. An individual investor's return may vary based on timing of capital transactions, differences in fund expenses and lower or no management fees and incentive fees/allocations. |
| (2) | The month end, YTD and ITD net returns represent unaudited actual returns as of the date hereof, for performance of the above referenced funds through the date indicated. The YTD and ITD net returns represent the cumulative effect of compounding the monthly returns for the relevant time period. |
| (3) | The month end, YTD and ITD net returns reflect an investment in ZAIS Opportunity Domestic Feeder Fund, LP (‘‘Domestic Feeder’’) Series A Interests that are subject to advisory fees and incentive allocation. Returns would differ for an investment in Domestic Feeder Series B and ZAIS Opportunity Fund, Ltd. (“Offshore Feeder”) Series A and Series B. Effective April 1, 2012, management fee rates were reduced from 1.50% to 1.25% for Series A and from 1.00% to 0.75% for Series B. Effective January 1, 2013, incentive fees or allocation rates were reduced from 25% to 20% for Series A and from 20% to 15% for Series B. The Domestic Feeder’s returns for January 2009 and February 2011 have been adjusted to account for an increase of capital resulting from redemption penalties retained in the fund for the benefit of the remaining investors. Due to this adjustment, inception-to-date GAAP returns for years after 2008 would be lower than the adjusted returns presented. |
| (4) | The net asset value includes the net assets of the Domestic Feeder and Offshore Feeder. |
| (5) | Actual Net YTD return is based on a calendar year end, although this fund operates on a September 30th fiscal year end. |
Liquidity and Capital Resources
Historical Liquidity and Capital Resources
ZAIS Group has managed its historical liquidity and capital requirements by focusing on cash flows before giving effect to consolidation of the Consolidated Funds. ZAIS Group’s primary cash flow activities on an unconsolidated basis involve: (1) generating cash flow from operations, which largely includes management fee income and incentive income, offset by operating expenses; (2) realizations generated from investments in ZAIS Managed Entities; (3) funding capital commitments that ZAIS Group has made to its funds; and (4) prior to the Business Combination, making distributions to its sole member. At September 30, 2016 and September 30, 2015, the Company’s cash and cash equivalents were $29.4 million and $64.6 million, respectively, including investments in money market funds and United States government obligations.
| 46 |
The Company’s material sources of cash from ZAIS Group’s operations include: (1) management fee income, which is collected monthly or quarterly; (2) incentive income, which can be less predictable as to amount and timing; and (3) distributions related to investments in certain ZAIS Managed Entities. ZAIS Group primarily uses cash flow from operations to pay compensation and benefits, general, administrative and other expenses and foreign taxes. ZAIS Group’s cash flows are also used to fund investments in limited partnerships, fixed assets and other capital items. If cash flow from operations continues to be insufficient to fund operating expenses or such investments, ZAIS Group will continue to fund its business requirements with the proceeds from the Business Combination. For the nine months ended September 30, 2016, the Company’s stand-alone (excluding the activities of the Consolidated Funds) net cash used in operations was $17.5 million. The sources of operating cash flow were insufficient to cover operating expenses, and the excess working capital needs were funded by operating cash balances and the proceeds of the Business Combination. While the fourth quarter of 2016 will benefit from the receipt of the REIT termination fee of $8.0 million, current projections indicate that 2016 annual results will generate negative working capital, and we expect to continue to draw from operating cash balances and the proceeds from our business combination to fund our operations and working capital for the foreseeable future.
At September 30, 2016 the consolidated financial statements reflect the cash flows of ZAIS’s operating businesses and Zephyr A-6, the only ZAIS Managed Entity required to be consolidated under ASU 2015-02. The assets of ZAIS Group’s Consolidated Funds have an effect on ZAIS Group’s reported cash flows. The primary cash flow activities of the Consolidated Funds include: (1) raising capital from third party investors, which is reflected as non-controlling interests in the Consolidated Funds when required to be consolidated into the Company’s consolidated financial statements; (2) purchasing and selling investment securities; (3) generating cash through the realization of certain investments; and (4) distributing cash to investors. The Consolidated Funds are treated as investment companies under U.S. GAAP; therefore, the character and classification of all Consolidated Fund transactions are presented as cash flows from operations.
As of September 30, 2016, $25.5 million of the proceeds of the Business Combination had been deployed to expand existing product lines. This amount includes a $20.5 million contribution to Zephyr A-6, a majority owned subsidiary of ZAIS Group, which has been established to invest in ZAIS Group managed CLO vehicles and thereby satisfy the risk retention requirements for CLO managers under the Securities Exchange Act of 1934. Up to $56.0 million of equity capital has been committed to Zephyr A-6, and another ZAIS Managed Entity which carries first loss risk. There is no assurance that the full $56.0 million committed will be used or as to the period of time during which this utilization may be required. ZAIS Group serves as the general partner of Zephyr A-6 and determines when, and to what extent, capital will be called.
The Company continues to review its business and fund activities with a view towards improving our profitability through organic growth, reduction in expenses, acquisitions, dispositions of assets or the sale or termination of product lines. Subsequent to the end of the quarter the Company terminated its management agreement with ZFC REIT upon completion of the merger between ZFC REIT and Sutherland Asset Management Corp on October 31, 2016. As a result, ZAIS Group’s management fees and AUM related to mortgage strategies are expected to decrease by approximately $2.8 million, annually on a run-rate basis, and $0.589 billion, respectively. The decrease in management fees for this fiscal year will be offset by the receipt of the termination fee in the amount of $8.0 million pursuant to the Termination Agreement.
Debt Obligations
On March 17, 2015, in conjunction with the closing of the Business Combination, ZAIS issued two promissory notes with an aggregate principal balance of $1,250,000 to EarlyBirdCapital, Inc. and Sidoti & Company, LLC. The notes accrue interest at an annual rate equal to the annual applicable federal rate as published by the Internal Revenue Service (“AFR”) until the principal amount of, and all accrued interest on, the notes have been paid in full. The notes mature on March 17, 2017 at which time the principal balance and accrued interest will be due and payable. The notes were issued in lieu of paying certain underwriting costs at the closing of the Business Combination and, accordingly, treated as a direct cost attributable to the Business Combination and capitalized to equity.
Cash Flows
The significant amounts from the Company’s consolidated financial statements, which include the effects of the Consolidated Funds in accordance with GAAP, are summarized below. Negative amounts represent a net outflow, or use of cash.
| Nine Months Ended September 30, | ||||||||
| 2016 | 2015 | |||||||
| (dollars in thousands) | ||||||||
| Statements of cash flows data | ||||||||
| Net cash provided by (used in) operating activities | $ | (27,473 | ) | $ | (6,371 | ) | ||
| Net cash provided by (used in) investing activities | 8,311 | (11,314 | ) | |||||
| Net cash provided by (used in) financing activities | 4,478 | 74,250 | ||||||
| Change in cash and cash equivalents denominated in foreign currency | (246 | ) | 326 | |||||
| Net change in cash and cash equivalents | $ | (14,930 | ) | $ | (56,891 | ) | ||
| 47 |
Operating Activities
Net cash provided by (used in) operating activities is primarily driven by ZAIS Group’s earnings in the respective periods after adjusting for non-cash compensation and fee income, net realized (gain) loss on investments and net change in unrealized (appreciation) depreciation on investments that are included in net income. Cash used to purchase investments and the proceeds from the sale of such investments are also reflected in the Company’s operating activities as investing activities of the Consolidated Funds.
Net cash flow used in operating activities was $27.5 million for the nine months ended September 30, 2016. This amount primarily includes (i) net operating losses of $9.7 million; (ii) purchase of investments in affiliated securities by the Consolidated Funds of $30.3 million; (iii) increase in dividend receivable of the Consolidated Funds of $8.3 million; (iv) increase in income and fees receivable of $2.8 million; partially offset by (v) an increase in payable for securities purchased of Consolidated Funds of $20.3 million; (vi) an increase in non-cash equity-based compensation of $3.0 million; and (vii) an increase in compensation payable of $2.1 million.
Net cash flow used in operating activities was $6.4 million for the nine months ended September 30, 2015. This amount primarily includes (i) net operating losses of $12.1 million; (ii) a decrease in compensation payable of $3.6 million, and (iii) an increase in deferred tax assets of $4.3 million, partially offset by a decrease in income and fees receivable of $9.1 million and an increase in non-cash equity-based compensation of $3.4 million.
Investing Activities
The Company’s net cash provided by investing activities was $8.3 million for the nine months ended September 30, 2016. This amount primarily includes proceeds from sales of investments.
The Company’s net cash used in investing activities was $11.3 million for the nine months ended September 30, 2015. This amount primarily includes purchases of investments.
Financing Activities
The Company’s net cash provided by financing activities was $4.5 million for the nine months ended September 30, 2016. This amount primarily includes contributions from non-controlling interests in Consolidated Funds of $4.9 million partially offset by $0.4 million of distributions to non-controlling interests in ZGP.
The Company’s net cash provided by financing activities was $74.3 million for the nine months ended September 30, 2015. This amount primarily includes net proceeds from the Business Combination of $73.5 million and proceeds from the issuance of notes payable of $1.3 million.
Future Sources and Uses of Liquidity
The Company’s current sources of liquidity are (1) cash on hand, (2) cash flows from operations, including management fee income and incentive income and (3) realizations on its investments in ZAIS Managed Entities. ZAIS believes that these sources of liquidity will be sufficient to fund the Company’s working capital requirements and to meet the Company’s current commitments. The Company’s primary liquidity needs will be comprised of cash to (1) fund the Company’s operations; (2) provide capital to facilitate the growth of ZAIS Group’s existing investment advisory and asset management business, including the expansion of ZAIS Group’s CLO management business, which has become more capital-intensive in light of current European Union and United States risk retention rules; (3) fund ZAIS Group’s potential commitments to new and existing funds that it may advise; (4) provide capital to facilitate its expansion into businesses that are complimentary to ZAIS Group’s existing investment management business; and (5) pay income taxes.
Gain Contingencies
In 2016 the Company received notification from one of its insurance providers that the Company’s claim for reimbursement of certain legal and other costs relating to a formal regulatory inquiry had been approved. The total approved claim reimbursement for all legal and other costs incurred in excess of the $0.5 million deductible was approximately $0.9 million. Pursuant to the guidance under ASC 450, "Contingencies – Gain Contingencies” , approximately $0.6 million of the insurance reimbursements receivable has been recorded to other income (expense) in the consolidated statements of total comprehensive income (loss) for the portion that related to the costs incurred for the year ended December 31, 2015 in excess of the Company’s insurance deductible and a corresponding amount has been recorded to other assets in the consolidated statements of financial position. The Company also recorded approximately $0.3 million of the insurance reimbursements receivable to other assets in the consolidated statements of financial position and a corresponding amount to general, administrative and other expense in the consolidated statements of comprehensive income (loss) for the portion that related to legal costs incurred during the nine months ended September 30, 2016. During the three and nine months ended September 30, 2016, the Company received insurance reimbursements of $0.04 million and $0.7 million, respectively. At September 30, 2016, approximately $0.1 million of insurance reimbursements receivable noted above is included in other assets in the consolidated statements of financial position.
Off-Balance Sheet Arrangements
As of September 30, 2016 and December 31, 2015, the Company did not have any off-balance sheet arrangements.
| 48 |
Critical Accounting Policies and Estimates
Critical accounting policies are those that require the Company to make significant judgments, estimates or assumptions that affect amounts reported in its consolidated financial statements or the notes thereto. The Company bases its judgments, estimates and assumptions on current facts, historical experience and various other factors that it believes to be reasonable and prudent. Actual results may differ materially from these estimates. See Note 2, “Basis of Presentation and Summary of Significant Accounting Policies,” to the Company’s consolidated financial statements incorporated by reference in this Form 10-Q for a description of the Company’s critical accounting policies.
Recent Accounting Pronouncements
See Note 2, “Basis of Presentation and Summary of Significant Accounting Policies,” to the Company’s consolidated financial statements incorporated by reference in this Form 10-Q for a description of recent accounting pronouncements and their impact on the Company.
Item 3. Quantitative and Qualitative Disclosures About Market Risk
Our predominant exposure to market risk is related to ZAIS Group’s investments in the ZAIS Managed Entities and its role as general partner or investment manager for the ZAIS Managed Entities, and the sensitivities to movements in the fair value of their investments that may adversely affect our net gain (loss) on investments, management fees and incentive income.
Fair value of the financial assets and liabilities of the ZAIS Managed Entities may fluctuate in response to changes in the value of investments, foreign currency exchange rates, commodity prices and interest rates. The fair value changes in the assets and liabilities of the ZAIS Managed Entities affect the net gain (loss) on investments, management fees and incentive income ZAIS Group may earn from the ZAIS Managed Entities.
With regards to the Consolidated Funds, effective January 1, 2015 and subsequent to the adoption of ASU 2015-02, ZAIS Group now consolidates one ZAIS Managed Entity in which it has a majority ownership interest and, accordingly, changes in fair value of the Consolidated Fund could have a material impact on the Company’s allocable share of consolidated net income (loss) of this fund.
Credit Risk
All of the asset types held within the ZAIS Managed Entities are exposed to many risks, including credit risk. Credit risk arises in two forms; (1) debt issuers in the underlying ZAIS Managed Entities may fail to fulfill their obligations or the collateral value may become inadequate to cover our exposure and the market value of the instrument declines in price; and (2) the ZAIS Managed Entities may also face counterparty risk whereby the ZAIS Managed Entities have posted collateral in support of a derivative or repurchase contract and the counterparty becomes insolvent. Credit risk is monitored on an ongoing basis by the ZAIS Group risk management group who works with the ZAIS Group portfolio management team if it detects situations where economic performance is declining or a position does not conform to internal risk tolerances. The ZAIS Group risk management group manages counterparty risk by limiting term credit risk to highly rated financial institutions and by requiring additional collateral where appropriate.
Market Risk
Market risk is monitored on an ongoing basis by the ZAIS Group risk management group that conducts monthly stress tests for the asset types held within certain of our funds and separately managed accounts using five scenarios — base, modest upside, strong upside, modest downside and severe downside risk scenarios. At September 30, 2016, the severe downside market stress scenario shows that the three year annualized downside return would be -9.33%.
A 7.97% decline in the fair market value of the AUM for ZAIS Managed Entities at September 30, 2016 would have a negative impact on ZAIS Group’s management fee income by approximately $0.3 million. Additionally, ZAIS Group could receive no incentive income due to a decline in the fair market value due the respective ZAIS Managed Entities high-water mark. A decline in the fair market value of the AUM for ZAIS Group’s structured vehicles at September 30, 2016 would not impact ZAIS Group’s management fee income because the management fee on these vehicles is based on notional par value, not market value except in the case where assets may be distressed or defaulted in which case the trustee would price these respective assets at the lower of the market value or their expected recovery rate provided by the rating agencies.
Investments in ZAIS Managed Entities
In 2015, ZAIS Group committed approximately $56.0 million to be invested in two ZAIS Managed Entities, of which approximately $25.5 million had been funded through September 30, 2016. These investments differ from other risks because ZAIS Group is exposed to the direct risk of loss of principal versus a decline in AUM and resultant lower management fees. Both of these investments are in ZAIS Managed Entities which employ a high degree of financial leverage (either directly or indirectly through its underlying investments) and carry first loss risk. The estimated risk of loss for these investments in a severe market downturn could reach as high as 90% or approximately $23.0 million (based on amounts funded through September 30, 2016). ZAIS Group also holds general partner investments in certain ZAIS Managed Entities which are also exposed to direct risk of loss of principal.
| 49 |
Exchange Rate Risk
Certain of ZAIS Managed Entities hold investments denominated in non-U.S. dollar currencies which may be affected by movements in the rate of exchange between the U.S. dollar and foreign currencies. However, our foreign currency exposure is hedged with forward foreign exchange contracts which substantially offset the risk of foreign currency movements against the U.S. dollar. We estimate that as of September 30, 2016, a 10% weakening or strengthening of the U.S. dollar against all or any combination of currencies to which certain of ZAIS Managed Entities have exposure to exchange rates would impact the asset values of these entities in the aggregate of plus or minus 0.038% and would not significantly impact our management fees. Additionally, ZAIS Group is exposed to exchange rate risk on the balances and operations of its wholly-owned foreign subsidiaries. The Company has determined that this risk would not significantly impact the consolidated financial statements due to the size of its foreign operations.
Interest Rate Risk
Certain of ZAIS Managed Entities have financing arrangements and hold credit instruments that accrue interest at variable rates linked to LIBOR. Interest rate changes may therefore impact the amount of interest payments, future earnings and cash flows. In the event LIBOR, and rates directly or indirectly tied to LIBOR, were to increase by 10.0% over LIBOR as of September 30, 2016, we estimate that the net effect on the net asset value of certain ZAIS Managed Entities would be a decline of approximately 0.122% which would not significantly impact our management fees.
Item 4. Controls and Procedures
Evaluation of Disclosure Controls and Procedures
Under the supervision and with the participation of our management, including our principal executive and financial officer, we conducted an evaluation of the effectiveness of our disclosure controls and procedures as of the end of the fiscal quarter ended September 30, 2016, as such term is defined in Rules 13a-15(e) and 15d-15(e) under the Exchange Act. Based on this evaluation, our principal executive officer and principal financial officer have concluded that during the period covered by this report, our disclosure controls and procedures were effective.
Disclosure controls and procedures are designed to ensure that information required to be disclosed by us in our Exchange Act reports is recorded, processed, summarized, and reported within the time periods specified in the SEC’s rules and forms, and that such information is accumulated and communicated to our management, including our principal executive officer and principal financial officer or persons performing similar functions, as appropriate to allow timely decisions regarding required disclosure.
Changes in Internal Control over Financial Reporting
There was no change in our internal control over financial reporting that occurred during the fiscal quarter of 2016 covered by this Quarterly Report on Form 10-Q that has materially affected, or is reasonably likely to materially affect, our internal control over financial reporting.
| 50 |
Factors that could cause our actual results to differ materially from those in this Report are any of the risks described in our Annual Report on Form 10-K filed with the SEC on March 10, 2016. Any of these factors could result in a significant or material adverse effect on our results of operations or financial condition. Additional risk factors not presently known to us or that we currently deem immaterial may also impair our business or results of operations.
As of the date of this Report, there have been no identified material changes in the risk factors in our Annual Report on Form 10-K.
Item 2. Unregistered Sales of Equity Securities and Use of Proceeds
None.
Item 3. Defaults Upon Senior Securities
None.
Item 4. Mine Safety Disclosures
None.
None.
The Exhibit index that appears following the signature page is incorporated herein by reference.
| 51 |
Pursuant to the requirements of the Securities Exchange Act of 1934, the registrant has duly caused this report to be signed on its behalf by the undersigned, thereunto duly authorized.
| ZAIS GROUP HOLDINGS, INC. | ||
| By: | /s/ Michael F. Szymanski | |
| Michael F. Szymanski | ||
| Chief Executive Officer, President and Director | ||
| By: | /s/ Donna Blank | |
| Donna Blank | ||
| Chief Financial Officer | ||
| Date: November 4, 2016 | ||
| 52 |
EXHIBIT INDEX
| Exhibit Number | Description of Document | |
| 31.1 | Certification of Chief Executive Officer pursuant to Section 302 of the Sarbanes-Oxley Act of 2002. | |
| 31.2 | Certification of Chief Financial Officer pursuant to Section 302 of the Sarbanes-Oxley Act of 2002. | |
| 32.1 | Certification of Chief Executive Officer pursuant to Section 906 of the Sarbanes-Oxley Act of 2002. | |
| 32.2 | Certification of Chief Financial Officer pursuant to Section 906 of the Sarbanes-Oxley Act of 2002. | |
| 101.INS | XBRL Instance Document | |
| 101.SCH | XBRL Taxonomy Extension Schema Document | |
| 101.CAL | XBRL Taxonomy Extension Calculation Linkbase Document | |
| 101.DEF | XBRL Taxonomy Extension Definition Linkbase Document | |
| 101.LAB | XBRL Taxonomy Extension Labels Linkbase Document | |
| 101.PRE | XBRL Taxonomy Extension Presentation Linkbase Document |
| 53 |