Attached files
| file | filename |
|---|---|
| EX-31.2 - EXHIBIT 31.2 - FLOTEK INDUSTRIES INC/CN/ | ex312_10kx14.htm |
| EX-32.1 - EXHIBIT 32.1 - FLOTEK INDUSTRIES INC/CN/ | ex321_10kx14.htm |
| EX-21 - EXHIBIT 21 - FLOTEK INDUSTRIES INC/CN/ | ex21_10kx14.htm |
| EX-31.1 - EXHIBIT 31.1 - FLOTEK INDUSTRIES INC/CN/ | ex311_10kx14.htm |
| EX-23 - EXHIBIT 23 - FLOTEK INDUSTRIES INC/CN/ | ex23_10kx14.htm |
| EX-32.2 - EXHIBIT 32.2 - FLOTEK INDUSTRIES INC/CN/ | ex322_10kx14.htm |
| EXCEL - IDEA: XBRL DOCUMENT - FLOTEK INDUSTRIES INC/CN/ | Financial_Report.xls |
UNITED STATES
SECURITIES AND EXCHANGE COMMISSION
Washington, D.C. 20549
FORM 10-K
ý | ANNUAL REPORT PURSUANT TO SECTION 13 OR 15(d) OF THE SECURITIES EXCHANGE ACT OF 1934 |
or
¨ | TRANSITION REPORT PURSUANT TO SECTION 13 OR 15(d) OF THE SECURITIES EXCHANGE ACT OF 1934 |
For the transition period from to
Commission File Number 1-13270

FLOTEK INDUSTRIES, INC.
(Exact name of registrant as specified in its charter)
Delaware | 90-0023731 | |
(State or other jurisdiction of incorporation or organization) | (I.R.S. Employer Identification No.) | |
10603 W. Sam Houston Parkway N. #300 Houston, TX | 77064 | |
(Address of principal executive offices) | (Zip Code) | |
(713) 849-9911
(Registrant’s telephone number, including area code)
Securities registered pursuant to Section 12(b) of the Act:
Title of each class | Name of each exchange on which registered | |
Common Stock, $0.0001 par value | New York Stock Exchange, Inc. | |
Securities registered pursuant to Section 12(g) of the Act:
None
Indicate by check mark:
• if the registrant is a well-known seasoned issuer, as defined in Rule 405 of the Securities Act. Yes ý No ¨
• if the registrant is not required to file reports pursuant to Section 13 or Section 15(d) of the Act. Yes ¨ No ý
• whether the registrant (1) has filed all reports required to be filed by Section 13 or 15(d) of the Securities Exchange Act of 1934 during the preceding 12 months (or for such shorter period that the registrant was required to file such reports), and (2) has been subject to such filing requirements for the past 90 days. Yes ý No ¨
• whether the registrant has submitted electronically and posted on its corporate Website, if any, every Interactive Data File required to be submitted and posted pursuant to Rule 405 of Regulation S-T (§232.405 of this chapter) during the preceding 12 months (or for such shorter period that the registrant was required to submit and post such files). Yes ý No ¨
• if disclosure of delinquent filers pursuant to Item 405 of Regulation S-K (§229.405 of this chapter) is not contained herein, and will not be contained, to the best of registrant’s knowledge, in definitive proxy or information statements incorporated by reference in Part III of this Form 10-K or any amendment to this Form 10-K. ¨
• whether the registrant is a large accelerated filer, an accelerated filer, a non-accelerated filer, or a smaller reporting company. See the definitions of “large accelerated filer,” “accelerated filer” and “smaller reporting company” in Rule 12b-2 of the Exchange Act.
Large accelerated filer ý Accelerated filer ¨ Non-accelerated filer ¨ (Do not check if a smaller reporting company) Smaller reporting company ¨
• whether the registrant is a shell company (as defined in Rule 12b-2 of the Exchange Act). Yes ¨ No ý
The aggregate market value of voting stock held by non-affiliates of the registrant as of June 30, 2014 (based on the closing market price on the NYSE Composite Tape on June 30, 2014) was approximately $1,527,000,000. At January 16, 2015, there were 53,364,905 outstanding shares of the registrant’s common stock, $0.0001 par value.
DOCUMENTS INCORPORATED BY REFERENCE
The information required in Part III of the Annual Report on Form 10-K is incorporated by reference to the registrant’s definitive proxy statement to be filed pursuant to Regulation 14A for the registrant’s 2015 Annual Meeting of Stockholders.
TABLE OF CONTENTS
Item 1. | ||
Item 1A. | ||
Item 1B. | ||
Item 2. | ||
Item 3. | ||
Item 4. | ||
Item 5. | ||
Item 6. | ||
Item 7. | ||
Item 7A. | ||
Item 8. | ||
Item 9. | ||
Item 9A. | ||
Item 9B. | ||
Item 10. | ||
Item 11. | ||
Item 12. | ||
Item 13. | ||
Item 14. | ||
Item 15. | ||
i
FORWARD-LOOKING STATEMENTS
This Annual Report on Form 10-K (the “Annual Report”), and in particular, Part II, Item 7 – “Management’s Discussion and Analysis of Financial Condition and Results of Operations,” contains “forward-looking statements” within the meaning of the safe harbor provisions, 15 U.S.C. § 78u-5, of the Private Securities Litigation Reform Act of 1995. Forward-looking statements are not historical facts but instead represent the Company’s current assumptions and beliefs regarding future events, many of which, by their nature, are inherently uncertain and outside the Company’s control. The forward-looking statements contained in this Annual Report are based on information available as of the date of this Annual Report. The forward looking statements relate to future industry trends and economic conditions, forecast performance or results of current and future initiatives and the outcome of contingencies and other uncertainties that may have a significant impact on the Company’s business, future operating results and liquidity. These forward-looking statements generally are identified by words such as “anticipate,” “believe,” “estimate,” “continue,” “intend,” “expect,” “plan,” “forecast,” “project” and similar expressions, or future-tense or conditional constructions such as “will,” “may,” “should,” “could” and “would,” or the negative thereof or other variations thereon or comparable terminology. The Company cautions that these statements are merely predictions and are not to be considered guarantees of future performance. Forward-looking statements are based upon current expectations and assumptions that are subject to risks and uncertainties that can cause actual results to differ materially from those projected, anticipated or implied. A detailed discussion of potential risks and uncertainties that could cause actual results and events to differ materially from forward-looking statements include, but are not limited to, those discussed in Part I, Item 1A – “Risk Factors” in this Annual Report and periodically in future reports filed with the Securities and Exchange Commission (the “SEC”).
The Company has no obligation to publicly update or revise any forward-looking statements, whether as a result of new information or future events, except as required by law.
ii
PART I
Item 1. Business.
General
Flotek Industries, Inc. (“Flotek” or the “Company”) is a global diversified, technology-driven company that develops and supplies oilfield products, services and equipment to the oil, gas and mining industries, and high value compounds to companies that make cleaning products, cosmetics, food and beverages and other products that are sold in consumer and industrial markets.
The Company was originally incorporated in the Province of British Columbia on May 17, 1985. In October 2001, the Company moved the corporate domicile to Delaware and effected a 120 to 1 reverse stock split by way of a reverse merger with CESI Chemical, Inc. (“CESI”). Since then, the Company has grown through a series of acquisitions and organic growth.
In December 2007, the Company’s common stock began trading on the New York Stock Exchange (“NYSE”) under the stock ticker symbol “FTK.” Annual reports on Form 10-K, quarterly reports on Form 10-Q, current reports on Form 8-K, and amendments to those reports filed or furnished pursuant to Section 13(a) or 15(d) of the Securities Exchange Act of 1934, (the “Exchange Act”) are posted to the Company’s website, www.flotekind.com, as soon as practicable subsequent to electronically filing or furnishing to the SEC. Information contained in the Company’s website is not to be considered as part of any regulatory filing. As used herein, “Flotek,” the “Company,” “we,” “our” and “us” refers to Flotek Industries, Inc. and/or the Company’s wholly owned subsidiaries. The use of these terms is not intended to connote any particular corporate status or relationship.
Recent Developments
In May 2013, the Company acquired Florida Chemical Company, Inc. ("Florida Chemical") for a total purchase price of $106.4 million. Florida Chemical is one of the world's largest processors of citrus oils and is a pioneer in solvent, chemical synthesis, and flavor and fragrance applications from citrus oils. Florida Chemical has been an innovator in creating high performance, bio-based products for a variety of industries, including applications in the oil and gas industry. This acquisition brings a portfolio of high performance renewable and sustainable chemistries that perform well in the oil and gas industry as well as non-energy related markets. The acquisition expands the Company's business into consumer and industrial chemical technologies which provide products for the flavor and fragrance industry and the specialty chemical industry. These technologies are used by food and beverage companies, fragrance companies, and companies providing household and industrial cleaning products.
In November 2013, the Company signed a shareholder agreement with Tasneea Oil and Gas Technologies, LLC (“Tasneea”) an Omani Limited Liability Company, to form Omani based Flotek Gulf, LLC (“Flotek Gulf”) and Flotek Gulf Research, LLC (“Flotek Gulf Research”). During the fourth quarter of 2014, Flotek and Tasneea transferred initial capital into Flotek Gulf and Flotek Gulf Research. Flotek Gulf and Flotek Gulf Research will develop and market specialty chemistries for the oil and gas industry throughout the Middle East and North Africa. In the coming year, Flotek Gulf expects to construct a manufacturing facility designed to produce chemical products including Flotek's patented and proprietary products for distribution throughout the region.
In January 2014, the Company acquired 100% of the membership interest in Eclipse IOR Services, LLC ("EOGA"), a leading Enhanced Oil Recovery design and injection firm. The Company paid $5.3 million, net of cash received, in cash consideration and 94,354 shares of the Company's Common Stock. EOGA's enhanced oil recovery processes and its use of polymers to improve the performance of EOR projects has been combined with the Company's existing EOR products and services.
In April 2014, the Company acquired 100% of the membership interests in SiteLark, LLC ("SiteLark") for $0.4 million and 5,327 shares of the Company's common stock. SiteLark provides reservoir engineering and modeling services for a variety of hydrocarbon applications. Its services include proprietary software which assists engineers with reservoir simulation, reservoir engineering and waterflood optimization.
In May 2014, the Company launched its patent pending FracMaxTM software technology that allows the Company to quantitatively demonstrate the benefits associated with the use of the Company’s patented and proprietary Complex nano-FluidTM chemistries. The Company has integrated the use of the FracMaxTM software technology into its sales and marketing activities resulting in a significant increase in interest in the Company's Complex nano-FluidTM chemistries.
Description of Operations and Segments
Flotek operates in over 20 domestic and international markets, including the Gulf Coast, Southwest, West Coast, Rocky Mountains, Northeastern and Mid-Continental regions of the United States (the "U.S."), Canada, Mexico, Central America, South America, Europe, Africa, Middle East, Australia and Asia-Pacific.
1
The Company has four strategic business segments: Energy Chemical Technologies, Consumer and Industrial Chemical Technologies, Drilling Technologies and Production Technologies. The Company offers competitive products and services derived from technological advances, some of which are patented, that are reactive to industry demands in both domestic and international markets.
Financial information about operating segments and geographic concentration is provided in Note 17 – "Segment and Geographic Information" and in Part II, Item 8 – "Financial Statements and Supplementary Data” in this annual report.
Information about the Company's four operating segments is below.
Energy Chemical Technologies
The Energy Chemical Technologies segment designs, develops, manufactures, packages and markets chemicals for use in oil and gas ("O&G") well drilling, cementing, completion, stimulation and production activities designed to maximize recovery in both new and mature fields, including enhanced and improved oil recovery markets. These specialty chemicals possess enhanced performance characteristics and are manufactured to withstand a broad range of downhole pressures, temperatures and other well-specific conditions to be compliant with customer specifications. This segment has two operational laboratories: (1) a technical services laboratory and (2) a research and innovation laboratory. Each focuses on design improvements, development and viability testing of new chemical formulations, and continued enhancement of existing products. Chemicals branded Complex nano-Fluid® technologies (“CnF® products”) are patented both domestically and internationally and are proven strategically cost-effective performance additives within both oil and natural gas markets. The CnF® products mixtures are environmentally friendly, stable mixtures of oil, water and surface active agents which organize molecules into nano structures. The combined advantage of solvents, surface active agents and water and the resultant nano structures improves well treatment results as compared to the independent use of solvents and surface active agents. CnF® products are composed of renewable, plant derived, cleaning ingredients and oils that are certified as biodegradable. Certain CnF® products have been approved for use in the North Sea, which has some of the most stringent oil field environmental standards in the world. CnF® chemistries have also helped achieve improved operational and financial results for the Company's customers in low permeability sand and shale reservoirs.
The Logistics division of the Company's Energy Chemical Technologies segment designs, operates and manages automated bulk material handling and loading facilities. The bulk facilities handle dry cement and additives for oil and natural gas well cementing, and supply materials used in oilfield operations.
The segment launched its patent pending FracMaxTM software technology in 2014. The FracMaxTM application is an innovative software technology that allows the Company to quantitatively demonstrate the benefits associated with the use of the segment’s patented and proprietary Complex nano-Fluid® chemistries.
Consumer and Industrial Chemical Technologies
The Consumer and Industrial Chemicals Technologies ("CICT") segment, was added in conjunction with the acquisition of Florida Chemical in May 2013. This segment sources citrus oil domestically and internationally and is one of the largest processors of citrus oils in the world. Products produced from processed citrus oil include (1) high value compounds used as additives by companies in the flavors and fragrances markets and (2) environmentally friendly chemicals for use in the oil & gas industry and numerous other industries around the world. The CICT segment designs, develops and manufactures products that are sold to companies in the flavor and fragrance industry and specialty chemical industry. These technologies are used within food and beverage, fragrance, and household and industrial cleaning products industries.
Drilling Technologies
The Drilling Technologies segment is a leading provider of downhole drilling tools for use in oilfield, mining, water-well and industrial drilling activities. This segment manufactures, rents, sells, inspects and assembles specialized equipment used in drilling, completion, production, and work-over activities. Established tool rental operations are strategically located throughout the United States (the “U.S.”) and in a number of international markets. Rental tools include stabilizers, drill collars, reamers, wipers, jars, shock subs, wireless survey, measurement while drilling (“MWD”) tools, Stemulator® tools and mud-motors. Equipment sold primarily includes mining equipment, cementing accessories and drilling motor components. The Company remains focused on product marketing for this segment in all regions of the U.S., as well as in select international markets through both direct and agent-based sales.
Production Technologies
The Production Technologies segment provides pumping system components, electric submersible pumps (“ESPs”), gas separators, production valves, and complementary services. These artificial lift products satisfy the requirements of traditional oil and natural gas production and coal bed methane markets by assisting natural gas, oil and other fluids movement from the producing horizon
2
to the surface. Patented products within the Company’s PetrovalveTM product line optimize pumping efficiency in horizontal well completions as well as in heavy oil wells and wells with high liquid to gas ratios. PetrovalveTM products placed horizontally increase flow per stroke and eliminate gas locking of traditional ball and seat valves that traditionally require more maintenance. The patented gas separation technology is particularly effective in coal bed methane production, efficiently separating gas and water downhole as well as ensuring solution gas is not lost in water production. The Company's products are sourced internationally and domestically, assembled at domestic locations and distributed globally.
Seasonality
Overall, operations are not significantly affected by seasonality. While certain working capital components build and recede throughout the year in conjunction with established purchasing and selling cycles that can impact operations and financial position, these cycles have not been significant to date. The performance of certain services within each of the Company’s segments, however, is susceptible to both weather and naturally occurring phenomena, including, but not limited to the following:
• | the severity and duration of winter temperatures in North America, which impacts natural gas storage levels, drilling activity and commodity prices; |
• | the timing and duration of the Canadian spring thaw and resulting restrictions that impact activity levels; |
• | the timing and impact of hurricanes upon coastal and offshore operations; |
• | certain Federal land drilling restrictions during identified breeding seasons of protected bird species in key Rocky Mountain coal bed methane producing regions. These restrictions generally have a negative impact on Production Technologies operations in the first or second quarters of the year; and |
• | adverse weather in Florida and Brazil can impact the availability of citrus oils for the CICT business unit. |
Product Demand and Marketing
Demand for the Company’s products and services is dependent on levels of conventional and non-conventional oil and natural gas well drilling and production, both domestically and internationally. Products are marketed directly to customers through the Company's direct sales force and through certain contractual agency arrangements. Established customer relationships provide repeat sales opportunities within all segments. While the Company's primary marketing efforts remain focused in North America, a growing amount of resources and effort are focused on emerging international markets, especially in the Middle East and North Africa ("MENA") as well as South America. In addition to direct marketing and relationship development, the Company also markets products and services through the use of third party agents in Mexico, Central America, South America, Europe, Africa, the Middle East, Australia, and Asia-Pacific.
Customers
The Company’s customers primarily include major integrated oil and natural gas companies, oilfield service companies, independent oil and natural gas companies, pressure pumping service companies, international supply chain management companies, national and state-owned oil companies, household and commercial cleaning product companies, fragrance and cosmetic companies, and food manufacturing companies. For the year ended December 31, 2014, the Company had three customers that accounted for 16%, 7% and 6% of consolidated revenue, respectively. For the years ended December 31, 2013 and 2012, the Company had a single customer that accounted for 16% and 16% of consolidated revenue, respectively. In aggregate, the Company’s largest three customers collectively accounted for 29%, 30% and 35% of consolidated revenue for the years ended December 31, 2014, 2013 and 2012, respectively.
Research and Innovation
The Company is engaged in research and innovation activities focused on the improvement of existing products and services, the design of reservoir specific, customized chemistries, and the development of new products, processes and services. For the years ended December 31, 2014, 2013 and 2012, the Company incurred $5.0 million, $3.8 million and $3.2 million, respectively, of research and innovation expense. In 2014, research and innovation expense was approximately 1.1% of consolidated revenue. The Company expects that its 2015 research and innovation investment will increase commensurate with the growth of the business.
Backlog
Due to the nature of the Company’s contractual customer relationships and the way they operate, the Company has historically not had significant backlog order activity.
3
Intellectual Property
The Company’s policy is to protect its intellectual property, both within and outside of the U.S. The Company pursues patent protection for all products and methods deemed to have commercial significance and that qualify for patent protection. The decision to pursue patent protection is dependent upon several factors, including whether patent protection can be obtained, cost-effectiveness and alignment with operational and commercial interests. The Company believes its patent and trademark portfolio, combined with confidentiality agreements, trade secrets, proprietary designs, manufacturing and operational expertise, are necessary and appropriate to protect its intellectual property and ensure continued strategic advantages. The Company currently has 15 issued patents and over four dozen pending patent applications on various chemical compositions and methods as well as various downhole tools, including its ProSeries™ tools. In addition, the Company also has several registered trademarks and pending trademark applications covering a variety of its goods and services.
Competition
The ability to compete in the oilfield services industry and the consumer and industrial markets is dependent upon the Company’s ability to differentiate products and services, provide superior quality and service, and maintain a competitive cost structure. Activity levels in the oil field services industry are impacted by current and expected oil and natural gas prices, vertical and horizontal drilling rig count, other oil and natural gas drilling activity, production levels and customer drilling and production designated capital spending. Domestic and international regions in which Flotek operates are highly competitive. The unpredictability of the energy industry and commodity price fluctuations create both increased risk and opportunity for the services of both the Company and its competitors.
Certain oil and natural gas service companies competing with the Company are larger and have access to more resources. Such competitors could be better situated to withstand industry downturns, compete on the basis of price, and acquire and develop new equipment and technologies; all of which could affect the Company’s revenue and profitability. Oil and natural gas service companies also compete for customers and strategic business opportunities. Thus, competition could have a detrimental impact upon the Company’s business.
The d-Limonene citrus-based terpene is a major feedstock for many of the Company’s CnF® chemistries. In addition, the Company utilizes terpenes from other natural sources when it determines the efficacy of such formulas is appropriate. The Company is currently examining the potential of varying terpene streams in several proprietary chemistries. It is also assessing the viability of removing trace amounts of “BTEX” (benzene, toluene, ethylbenzene, and xylene) compounds from such terpenes to ensure they meet Flotek’s rigorous environmental standards.
The Company faces competition from other citrus processors and other solvent sources. Other terpenes can provide an effective substitute to the Company’s citrus-based terpenes, although, without refinement, are generally of lower quality. Such terpenes can be cheaper than citrus terpenes, but, as noted above, can contain “BTEX” compounds (benzene, toluene, ethylbenzene, and xylenes), and other volatile organic compounds that have varying degrees of toxicity. The Company’s chemistries are intended to replace these undesirable qualities. Management believes that environmental constituents will continue to promote “BTEX” substitutes, which diminishes the threat of substitution in ecologically sensitive applications from these competitors.
Raw Materials
Materials and components used in the Company’s servicing and manufacturing operations, as well as those purchased for sale, are generally available on the open market from multiple sources. Collection and transportation of raw materials to Company facilities, however, could be adversely affected by extreme weather conditions. Additionally, certain raw materials used by the Chemicals segments are available from limited sources. Disruptions to suppliers could materially impact sales. The prices paid for raw materials vary based on energy, steel, citrus, and other commodity price fluctuations, tariffs, duties on imported materials, foreign currency exchange rates, business cycle position and global demand. Higher prices for chemicals, steel, citrus, and other raw materials could adversely impact future sales and contract fulfillments.
The Company is diligent in its efforts to identify alternate suppliers, in its contingency planning for potential supply shortages, and in its proactive efforts to reduce costs through competitive bidding practices. The Drilling Technologies and Production Technologies segments purchase raw materials and steel on the open market from numerous suppliers. When able, the Company uses multiple suppliers, both domestically and internationally, for all raw materials purchases.
Drilling Technologies maintains a three to six month supply of mud-motor inventory parts sourced from international and domestic suppliers, and Drilling Technologies and Production Technologies maintain parts necessary to meet forecast demand. The Company’s inventory levels are maintained to accommodate the lead time required to secure parts to avoid disruption of service to customers.
4
Government Regulations
The Company is subject to federal, state and local environmental, occupational safety and health laws and regulations within the U.S. and other countries in which the Company does business. The Company strives to ensure full compliance with all regulatory requirements and is unaware of any material instances of noncompliance. In the U.S., the Company must comply with laws and regulations which include, among others:
• | the Comprehensive Environmental Response, Compensation and Liability Act; |
• | the Resource Conservation and Recovery Act; |
• | the Federal Water Pollution Control Act; |
• | the Toxic Substances Control Act; and |
• | the Affordable Care Act. |
In addition to U.S. federal laws and regulations, the Company does business in other countries which have extensive environmental, legal, and regulatory requirements. Laws and regulations strictly govern the manufacture, storage, handling, transportation, use and sale of chemical products. The Company evaluates the environmental impact of its actions and attempts to quantify the cost of remediating contaminated property in order to maintain compliance with regulatory requirements and identify and avoid potential liability. Several products of the Energy Chemicals Technologies’ and Consumer and Industrial Chemical Technologies’ segments are considered hazardous or flammable. In the event of a leak or spill in association with Company operations, the Company could be exposed to risk of material cost, net of insurance proceeds, to remediate any contamination.
From time to time, the Company may be party in environmental litigation and claims, including remediation of properties owned or operated. No environmental litigation or claims are currently being litigated. The Company does not expect that costs related to known remediation requirements will have a significant adverse effect on the Company’s consolidated financial position or results of operations.
Employees
At December 31, 2014, the Company had 561 employees, exclusive of existing worldwide agency relationships. None of the Company’s employees are covered by a collective bargaining agreement and labor relations are generally positive. Certain international locations have staffing or work arrangements that are contingent upon local work councils or other regulatory approvals.
Available Information and Website
The Company’s website is accessible at www.flotekind.com. Annual reports on Form 10-K, quarterly reports on Form 10-Q, current reports on Form 8-K and amendments to reports filed or furnished pursuant to Section 13(a) or 15(d) of the Exchange Act are available (see the “Investor Relations” section of the Company’s website), as soon as reasonably practicable, subsequent to electronically filing or otherwise providing reports to the SEC. Corporate governance materials, guidelines, by-laws, and code of business conduct and ethics are also available on the website. A copy of corporate governance materials is available upon written request to the Company.
All material filed with the SEC’s “Public Reference Room” at 100 F Street NE, Washington, DC 20549 is available to be read or copied. Information regarding the “Public Reference Room” can be obtained by contacting the SEC at 1-800-SEC-0330. Further, the SEC maintains the www.sec.gov website, which contains reports and other registrant information filed electronically with the SEC.
The 2014 Annual Chief Executive Officer Certification required by the NYSE was submitted on May 13, 2014. The certification was not qualified in any respect. Additionally, the Company has filed all principal executive officer and financial officer certifications as required under Sections 302 and 906 of the Sarbanes-Oxley Act of 2002 with this Annual Report. Information with respect to the Company’s executive officers and directors is incorporated herein by reference to information to be included in the proxy statement for the Company’s 2015 Annual Meeting of Stockholders.
The Company has disclosed and will continue to disclose any changes or amendments to the Company’s code of business conduct and ethics as well as waivers to the code of ethics applicable to executive management by posting such changes or waivers on the Company’s website.
5
Item 1A. Risk Factors.
The Company’s business, financial condition, results of operations and cash flows are subject to various risks and uncertainties. Readers of this report should not consider any descriptions of these risk factors to be a complete set of all potential risks that could affect Flotek. These factors should be carefully considered together with the other information contained in this Report and the other reports and materials filed by us with the SEC. Further, many of these risks are interrelated and could occur under similar business and economic conditions, and the occurrence of certain of them may in turn cause the emergence or exacerbate the effect of others. Such a combination could materially increase the severity of the impact of these risks on our business, results of operations, financial condition, or liquidity.
This Annual Report contains “forward-looking statements,” as defined in the Private Securities Litigation Reform Act of 1995, that involve risks and uncertainties. Forward-looking statements discuss Company prospects, expected revenue, expenses and profits, strategic operational initiatives and other activity. Forward-looking statements also contain suppositions regarding future oil and natural gas industry conditions within both domestic and international market economies. The Company’s results could differ materially from those anticipated in the forward-looking statements as a result of a variety of factors, including risks described below and elsewhere. See “Forward-Looking Statements” at the beginning of this Annual Report.
Risks Related to the Company’s Business
The Company’s business is dependent upon domestic and international oil and natural gas industry spending. Spending could be adversely affected by industry conditions or by new or increased governmental regulations beyond the Company’s control.
The Company is dependent upon customers’ willingness to make operating and capital expenditures for exploration, development and production of oil and natural gas in both the North American and global markets. Customers’ expectations of a decline in future oil and natural gas market prices could curtail spending thereby reducing demand for the Company’s products and services. Industry conditions are influenced by numerous factors over which the Company has no control, including the supply of and demand for oil and natural gas, domestic and international economic conditions, political instability in oil and natural gas producing countries and merger and divestiture activity among oil and natural gas producers. The volatility of oil and natural gas prices and the consequential effect on exploration and production activity could adversely impact the Company’s customers' activity levels. One indicator of drilling and production spending is fluctuation in rig count which the Company actively monitors to gauge market conditions and forecast product and service demand. A reduction in drilling activity could cause a decline in the demand for, or negatively affect the price of, some of the Company’s products and services. Domestic demand for oil and natural gas could also be uniquely affected by public attitude regarding drilling in environmentally sensitive areas, vehicle emissions and other environmental standards, alternative fuels, taxation of oil and gas, perception of “excess profits” of oil and gas companies, and anticipated changes in governmental regulation and policy.
Demand for a significant number of Company products and service is dependent on the level of expenditures within the oil and natural gas industry. If current global economic conditions and the availability of credit worsen or oil and natural gas prices weaken for an extended period of time, reductions in levels of customers’ expenditures could have a significant adverse effect on revenue, margins and overall operating results.
The global credit and economic environment could impact worldwide demand for energy. Crude oil and natural gas prices continue to be volatile. A substantial or extended decline in oil or natural gas prices could impact customers’ spending for products and services. Demand for a significant number of the Company’s products and services is dependent upon the level of expenditures within the oil and gas industry for exploration, development and production of crude oil and natural gas reserves. Expenditures are sensitive to oil and natural gas prices, as well as the industry’s outlook regarding future oil and natural gas prices. Increased competition could also exert downward pressure on prices charged for Company products and services. Volatile economic conditions could weaken customer exploration and production expenditures, causing reduced demand for Company products and services and a significant adverse effect on the Company’s operating results. It is difficult to predict the pace of any industry growth, the direction of oil and natural gas prices, whether the economy will worsen, and to what extent these conditions could affect the Company.
Reduced cash flow and capital availability could adversely impact the financial condition of the Company’s customers, which could result in customer project modifications, delays or cancellations, general business disruptions, and delay in, or nonpayment of, amounts that are owed to the Company. This could cause a negative impact on the Company’s results of operations and cash flows.
If certain of the Company’s suppliers were to experience significant cash flow constraints or become insolvent as a result of such conditions, a reduction or interruption in supplies or a significant increase in the price of supplies could occur, and adversely impact the Company’s results of operations and cash flows.
6
The price for oil and natural gas is subject to a variety of factors, including:
• | demand for energy reactive to worldwide population growth, economic development and general economic and business conditions; |
• | the ability of the Organization of Petroleum Exporting Countries (“OPEC”) to set and maintain production levels; |
• | production of oil and gas by non-OPEC countries; |
• | availability and quantity of natural gas storage; |
• | import volume and pricing of Liquefied Natural Gas; |
• | pipeline capacity to critical markets; |
• | political and economic uncertainty and socio-political unrest; |
• | cost of exploration, production and transport of oil and natural gas; |
• | technological advances impacting energy consumption; and |
• | weather conditions. |
The Company’s revolving credit facility and term loan have variable interest rates that could increase.
At December 31, 2014, the Company had a $75 million revolving credit facility commitment, of which $8.5 million was drawn. The interest rate on advances under the revolving credit facility varies based on the level of borrowing. Rates range (a) between PNC Bank's base lending rate plus 0.5% to 1.0% or (b) between the London Interbank Offered Rate (LIBOR) plus 1.5% to 2.0%. PNC Bank's base lending rate was 3.25% at December 31, 2014. The Company is required to pay a monthly facility fee of 0.25% on any unused amount under the commitment based on daily averages. The current credit facility remains in effect until May 10, 2018.
The Company borrowed $50.0 million under a term loan on May 10, 2013. The interest rate on the term loan varies based on the level of borrowing under the revolving credit facility. Rates range (a) between PNC Bank's base lending rate plus 1.25% to 1.75% or (b) between the London Interbank Lending Rate (LIBOR) plus 2.25% to 2.75%. PNC Bank's base lending rate was 3.25% at December 31, 2014. At December 31, 2014, $35.5 million was outstanding under the term loan.
There can be no assurance that the revolving credit facility and the term loan will not experience significant interest rate increases.
Network disruptions, security threats and activity related to global cyber crime pose risks to our key operational, reporting and communication systems.
The company relies on access to information systems for its operations. Failures of or interference with access to these systems, such as network communications disruptions could have an adverse effect on our ability to conduct operations or directly impact consolidated reporting. Security breaches pose a risk to confidential data and intellectual property which could result in damages to our competitiveness and reputation. The company has policies and procedures in place, including system monitoring and data back-up processes, to prevent or mitigate the effects of these potential disruptions or breaches, however there can be no assurance that existing or emerging threats will not have an adverse impact on our systems or communications networks.
If the Company does not manage the potential difficulties associated with expansion successfully, the Company’s operating results could be adversely affected.
The Company has grown over the last several years through internal growth, strategic alliances, and, to a lesser extent, strategic business/asset acquisitions. The Company believes future success will depend, in part, on the Company’s ability to adapt to market opportunities and changes and to successfully integrate the operations of any businesses acquired. The following factors could result in strategic business difficulties:
• | lack of experienced management personnel; |
• | increased administrative burdens; |
• | lack of customer retention; |
• | technological obsolescence; |
• | infrastructure, technological, communication and logistical problems associated with large, expansive operations; and |
• | failure to effectively integrate acquisitions, joint ventures or strategic alliances. |
If the Company fails to manage potential difficulties successfully, including increased costs associated with growth, the Company’s operating results could be adversely impacted.
7
The Company’s ability to grow and compete could be adversely affected if adequate capital is not available.
The ability of the Company to grow and compete is reliant on the availability of adequate capital. Access to capital is dependent, in large part, on the Company’s cash flows from operations and the availability of equity and debt financing. The Company’s term and revolving loan agreements with its bank also restrict the Company’s various capital transactions or participation in various business acquisitions and combinations. The Company cannot guarantee cash flows from operations will be sufficient, or that the Company will continue to be able to obtain equity or debt financing on acceptable terms, or at all, in order to realize growth strategies. As a result, the Company may not be able to finance strategic growth plans, take advantage of business opportunities, or to respond to competitive pressures.
The Company’s future success and profitability may be adversely affected if the Company fails to develop and/or introduce new and innovative products and services.
The oil and natural gas drilling industry is characterized by technological advancements that have historically resulted in, and will likely continue to result in, substantial improvements in the scope and quality of oilfield chemicals, drilling and artificial lift products and services function and performance. Consequently, the Company’s future success is dependent, in part, upon the Company’s continued ability to timely develop innovative products and services. Increasingly sophisticated customer needs and the ability to timely anticipate and respond to technological and operational advances in the oil and natural gas drilling industry is critical. If the Company fails to successfully develop and introduce innovative products and services that appeal to customers, or if new market entrants or competitors develop superior products and services, the Company’s revenue and profitability could suffer.
Consumer and industrial chemical markets that purchase the Company’s citrus based products are largely influenced by consumer preference and regulatory requirements. While citrus based beverage flavorings, retail cleaning products, and fine fragrances perpetually rank high in consumer surveys, the Company’s continued success requires new product innovation to keep pace with consumer trends and regulatory issues. If the Company fails to provide innovative products and services to its customers or to introduce performance products that comply with new environmental regulations, the Company’s financial performance could be impacted.
The Company may pursue strategic acquisitions, which could have an adverse impact on the Company’s business.
The Company’s historical and potential acquisitions involve risks that could adversely affect the Company’s business. Negotiations of potential acquisitions or integration of newly acquired businesses could divert management’s attention from other business concerns as well as be cost prohibitive and time consuming. Acquisitions could also expose the Company to unforeseen liabilities or risks associated with new markets or businesses. Unforeseen operational difficulties related to acquisitions could result in diminished financial performance or require a disproportionate amount of the Company’s management’s attention and resources. Additional acquisitions could result in the commitment of capital resources without the realization of anticipated returns.
Unforeseen contingencies such as litigation could adversely affect the Company’s financial condition.
The Company is, and from time to time may become, a party to legal proceedings incidental to the Company’s business involving alleged injuries arising from the use of Company products, exposure to hazardous substances, patent infringement, employment matters, and commercial disputes. The defense of these lawsuits may require significant expenses, divert management’s attention, and may require the Company to pay damages that could adversely affect the Company’s financial condition. In addition, any insurance or indemnification rights that the Company may have may be insufficient or unavailable to protect against potential loss exposures.
The Company’s current insurance policies may not adequately protect the Company’s business from all potential risks.
The Company’s operations are subject to risks inherent in the oil and natural gas industry, such as, but not limited to, accidents, blowouts, explosions, fires, severe weather, oil and chemical spills, and other hazards. These conditions can result in personal injury or loss of life, damage to property, equipment and the environment, as well as suspension of customers’ oil and gas operations. Litigation arising from any catastrophic occurrence where the Company’s equipment, products or services are being used could result in the Company being named as a defendant in lawsuits asserting large claims. The Company maintains insurance coverage it believes is adequate and customary to the oil and natural gas industry to mitigate liabilities associated with these potential hazards. The Company does not have insurance against all foreseeable risks, either because insurance is not available or is cost-prohibitive. Consequently, losses and liabilities arising from uninsured or underinsured events could have an adverse effect on the Company’s business, financial condition, and results of operations.
8
The Company is subject to complex foreign, federal, state and local environmental, health and safety laws and regulations, which expose the Company to liabilities that could adversely affect the Company’s business, financial condition, and results of operations.
The Company’s operations are subject to foreign, federal, state, and local laws and regulations related to, among other things, the protection of natural resources, injury, health and safety considerations, waste management, and transportation of waste and other hazardous materials. The Energy Chemicals Technologies segment exposes the company to risks of environmental liability that could result in fines, penalties, remediation, property damage, and personal injury liability. In order to remain compliant with laws and regulations, the Company maintains permits, authorizations and certificates as required from regulatory authorities. Sanctions for noncompliance with such laws and regulations could include assessment of administrative, civil and criminal penalties, revocation of permits, and issuance of corrective action orders.
The Company could incur substantial costs to ensure compliance with existing and future laws and regulations. Laws protecting the environment have generally become more stringent and are expected to continue to evolve and become more complex and restrictive into the future. Failure to comply with applicable laws and regulations could result in material expense associated with future environmental compliance and remediation. The Company’s costs of compliance could also increase if existing laws and regulations are amended or reinterpreted. Such amendments or reinterpretations of existing laws or regulations, or the adoption of new laws or regulations, could curtail exploratory or developmental drilling for, and production of, oil and natural gas which, in turn, could limit demand for the Company’s products and services. Some environmental laws and regulations could also impose joint and strict liability, meaning that the Company could be exposed in certain situations to increased liabilities as a result of the Company’s conduct that was lawful at the time it occurred or conduct of, or conditions caused by, prior operators or other third parties. Remediation expense and other damages arising as a result of such laws and regulations could be substantial and have a material adverse effect on the Company’s financial condition and results of operations.
Material levels of the Company’s revenue are derived from customers engaged in hydraulic fracturing services, a process that creates fractures extending from the well bore through the rock formation to enable natural gas or oil to flow more easily through the rock pores to a production well. Some states have adopted regulations which require operators to publicly disclose certain non-proprietary information. These regulations could require the reporting and public disclosure of the Company's proprietary chemical formulas. The adoption of any future federal or state laws or local requirements, or the implementation of regulations imposing reporting obligations on, or otherwise limiting, the hydraulic fracturing process, could increase the difficulty of oil and natural gas well production activity and could have an adverse effect on the Company’s future results of operations.
Regulation of greenhouse gases and/or climate change could have a negative impact on the Company’s business.
Certain scientific studies have suggested that emissions of certain gases, commonly referred to as “greenhouse gases,” which include carbon dioxide and methane, may be contributory to the warming effect of the Earth’s atmosphere and other climatic changes. In response to such studies, the issue of climate change and the effect of greenhouse gas emissions, in particular emissions from fossil fuels, is attracting increasing worldwide attention. Legislative and regulatory measures to address greenhouse gas emissions have not yet been finalized as of the date of this Annual Report but remain impactive across international, national, regional, and state levels.
Existing or future laws, regulations, treaties, or international agreements related to greenhouse gases and climate change, including energy conservation or alternative energy incentives, could have a negative impact on the Company’s operations, if regulations resulted in a reduction in worldwide demand for oil and natural gas or global economic activity. Other results could be increased compliance costs and additional operating restrictions, each of which would have a negative impact on the Company’s operations.
Changes in regulatory compliance obligations of critical suppliers may adversely impact our operations.
The Dodd-Frank Wall Street Reform and Consumer Protection Act (“Dodd-Frank Act”), signed into law on July 21, 2010, includes Section 1502, which requires the Securities and Exchange Commission to adopt additional disclosure requirements related to certain minerals sourced from the Democratic Republic of Congo and surrounding countries, or “conflict minerals,” for which such conflict minerals are necessary to the functionality of a product manufactured, or contracted to be manufactured, by an SEC-reporting company. The metals covered by these rules, which were adopted on August 22, 2012, include tin, tantalum, tungsten and gold. The Company and Company suppliers use some of these materials in their production processes.
In 2014, the Company established management systems and processes and completed due diligence in compliance with the requirements of Section 1502. In May 2014 the Company filed its first annual Conflict Minerals Report with the SEC. Future requirements for conducting Conflict Minerals due diligence may result in significant increased costs to the Company. Furthermore, failure of key suppliers to provide evidence of conflict free materials could impact the Company’s ability to acquire key raw materials and/or result is higher costs for those raw materials.
9
If the Company is unable to adequately protect intellectual property rights or is found to infringe upon the intellectual property rights of others, the Company’s business is likely to be adversely affected.
The Company relies on a combination of patents, trademarks, non-disclosure agreements, and other security measures to establish and protect the Company’s intellectual property rights. Although the Company believes that existing measures are reasonably adequate to protect intellectual property rights, there is no assurance that the measures taken will prevent misappropriation of proprietary information or dissuade others from independent development of similar products or services. Moreover, there is no assurance that the Company will be able to prevent competitors from copying, reverse engineering, or otherwise obtaining and/or using the Company’s technology and proprietary rights for products. The Company may not be able to enforce intellectual property rights outside of the U.S. Furthermore, the laws of certain countries in which the Company’s products and services are manufactured or marketed may not protect the Company’s proprietary rights to the same extent as do the laws of the U.S. Finally, parties may challenge, invalidate, or circumvent the Company’s patents, trademarks, copyrights and trade secrets. In each case, the Company’s ability to compete could be significantly impaired.
A portion of the Company’s products are without patent protection. The issuance of a patent does not guarantee validity or enforceability. Company patents may not be valid or enforceable against third parties. The issuance of a patent does not guarantee that the Company has the right to use the patented invention. Third parties may have blocking patents that could be used to prevent the Company from marketing the Company’s own patented products and utilizing our patented technology.
The Company is exposed to allegations of patent and other intellectual property infringement. Furthermore, the Company could become involved in costly litigation or proceedings regarding patents or other intellectual property rights. If any such claims are asserted against the Company, the Company could seek to obtain a license under the third party’s intellectual property rights in order to mitigate exposure. In the event the Company cannot obtain a license, affected parties could file lawsuits against the Company seeking damages (including treble damages) or an injunction against the sale of the Company’s products. These could result in the Company having to discontinue the sale of certain products, increase the cost of selling products, or result in damage to the Company’s reputation. The award of damages, including material royalty payments, or the entry of an injunction order against the manufacture and sale of any of the Company’s products, could have an adverse effect on the Company’s results of operations and ability to compete.
The Company and the Company’s customers are subject to risks associated with doing business outside of the U.S., including political risk, foreign exchange risk and other uncertainties.
Revenue from the sale of products to customers outside the U.S. was approximately 17.6% of the Company’s 2014 annual revenue. The Company and its customers are subject to risks inherent in doing business outside of the U.S., including:
• | governmental instability; |
• | corruption; |
• | war and other international conflicts; |
• | civil and labor disturbances; |
• | requirements of local ownership; |
• | partial or total expropriation or nationalization; |
• | currency devaluation; and |
• | foreign laws and policies, each of which can limit the movement of assets or funds or result in the deprivation of contractual rights or appropriation of property without fair compensation. |
Collections and recovery of rental tools from international customers and agents could also prove difficult due to inherent uncertainties in foreign law and judicial procedures. The Company could experience significant difficulty with collections or recovery due to the political or judicial climate in foreign countries where Company operations occur or in which the Company’s products are used.
The Company’s international operations must be compliant with the Foreign Corrupt Practices Act (the “FCPA”) and other applicable U.S. laws. The Company could become liable under these laws for actions taken by employees or agents. Compliance with international laws and regulations could become more complex and expensive thereby creating increased risk as the Company’s international business portfolio grows. Further, the U.S. periodically enacts laws and imposes regulations prohibiting or restricting trade with certain nations. The U.S. government could also change these laws or enact new laws that could restrict or prohibit the Company from doing business in identified foreign countries. The Company conducts, and will continue to conduct business in currencies other than the U.S. dollar. Historically, the Company has not hedged against foreign currency fluctuations. Accordingly, the Company’s profitability could be affected by fluctuations in foreign exchange rates.
The Company has no control over, and can provide no assurances that future laws and regulations will not materially impact the Company’s ability to conduct international business.
10
The loss of key customers could have an adverse impact on the Company’s results of operations and could result in a decline in the Company’s revenue.
The Company has critical customer relationships which are dependent upon production and development activity related to a handful of customers. Revenue derived from the Company's three largest customers as a percentage of consolidated revenue for the years ended December 31, 2014, 2013 and 2012, totaled 29%, 30% and 35%, respectively. Customer relationships are historically governed by purchase orders or other short-term contractual obligations as opposed to long-term contracts. The loss of one or more key customers could have an adverse effect on the Company’s results of operations and could result in a decline in the Company’s revenue.
Failure to collect for goods and services sold to key customers could have an adverse effect on the Company’s financial results, liquidity and cash flows.
The Company performs credit analysis on potential domestic customers, however credit analysis does not provide full assurance that customers will be willing and/or able to pay for goods and services purchased from the Company. Furthermore, collectability of international sales can be subject to the laws of foreign countries which may provide more limited protection to the Company in the event of a dispute over payment. Since sales to domestic and international customers are generally made on an unsecured basis, there can be no assurance of collectability. If one or more major customers are unwilling or unable to pay its debts to the Company, it could have an adverse effect of the Company’s financial results, liquidity and cash flows.
Loss of key suppliers, the inability to secure raw materials on a timely basis, or the Company’s inability to pass commodity price increases on to customers could have an adverse effect on the Company’s ability to service customer’s needs and could result in a loss of customers.
Materials used in servicing and manufacturing operations as well as those purchased for sale are generally available on the open market from multiple sources. Acquisition costs and transportation of raw materials to Company facilities have historically been impacted by extreme weather conditions. Certain raw materials used by the Energy Chemicals Technologies segment are available only from limited sources; accordingly, any disruptions to critical suppliers’ operations could adversely impact the Company’s operations. Prices paid for raw materials could be affected by energy, steel and other commodity prices; tariffs and duties on imported materials; foreign currency exchange rates; phases of the general business cycle and global demand. The Drilling Technologies and Production Technologies segments purchase critical raw materials on the open market and, where able, from multiple suppliers, both domestically and internationally.
The Company maintains a three- to six-month supply of critical mud-motor inventory parts that the Company sources from China. This inventory stock position approximates the lead time required to secure these parts in order to avoid disruption of service to the Company’s customers. The Company’s inability to secure reasonably priced critical inventory parts in a timely manner would adversely affect the Company’s ability to provide service to potential customers. The Company sources the vast majority of motor parts from a national supplier. As part of the 2015 business plan, the Company is actively managing and developing relationships with back-up parts and service suppliers.
The Company currently does not hedge commodity prices. The Company may be unable to pass along price increases to its customers, which could result in a decline in revenue or operating profits.
The Company’s inability to develop new products or differentiate existing products could have an adverse effect on its ability to be responsive to customers’ needs and could result in a loss of customers.
The Company’s ability to compete within the oilfield services business is dependent upon the ability to differentiate products and services, provide superior quality and service, and maintain a competitive cost structure. Activity levels in the Company’s operations are driven by current and forecast commodity prices, drilling rig count, oil and natural gas production levels, and customer capital spending for drilling and production. The regions in which the Company operates are highly competitive. The Company is also smaller than many other oil and natural gas service companies and has fewer resources as compared to these competitors. The large competitors may be better positioned to withstand industry downturns, compete on the basis of price, and acquire new equipment and technologies, all of which could affect the Company’s revenue and profitability. The Company competes for both customers and acquisition opportunities. Competition could adversely affect the Company’s operating profit. The Company believes that competition for products and services will continue to be intense into the foreseeable future.
11
If the Company loses the services of key members of management, the Company may not be able to manage operations and implement growth strategies.
The Company depends on the continued service of the Chief Executive Officer and President, the Chief Financial Officer, the Executive Vice President, Operations, and the Executive Vice President, Research and Development, who possess significant expertise and knowledge of the Company’s business and industry. Furthermore, the Chief Executive Officer and President serves as Chairman of the Board of Directors. The Company has entered into employment agreements with all of these key members; however, at December 31, 2014 the Company only carries key man life insurance for the Chief Executive Officer and the Executive Vice President of Operations. Any loss or interruption of the services of key members of the Company’s management could significantly reduce the Company’s ability to manage operations effectively and implement strategic business initiatives. The Company can provide no assurance that appropriate replacements for key positions could be found should the need arise.
Failure to maintain effective disclosure controls and procedures and internal controls over financial reporting could have an adverse effect on the Company’s operations and the trading price of the Company’s common stock.
Effective internal controls are necessary for the Company to provide reliable financial reports, effectively prevent fraud and operate successfully as a public company. If the Company cannot provide reliable financial reports or effectively prevent fraud, the Company’s reputation and operating results could be harmed. If the Company is unable to maintain effective disclosure controls and procedures and internal controls over financial reporting, the Company may not be able to provide reliable financial reports, which in turn could affect the Company's operating results or cause the Company to fail to meet its reporting obligations. Ineffective internal controls could also cause investors to lose confidence in reported financial information, which could negatively affect the trading price of the Company’s common stock, limit the ability of the Company to access capital markets in the future, and require additional costs to improve internal control systems and procedures.
Risks Related to the Company’s Industry
General economic declines (recessions) and limits to credit availability could have an adverse effect on exploration and production activity and result in lower demand for the Company’s products and services.
Continued worldwide financial and credit uncertainty can reduce the availability of liquidity and credit markets to fund the continuation and expansion of industrial business operations worldwide. The shortage of liquidity and credit combined with pressure on worldwide equity markets could continue to impact the worldwide economic climate. Unrest in the Middle East may also impact demand for the Company’s products and services both domestically and internationally.
Demand for the Company’s products and services is dependent on oil and natural gas industry activity and expenditure levels that are directly affected by trends in oil and natural gas prices. Demand for the Company’s products and services is particularly sensitive to levels of exploration, development, and production activity of, and the corresponding capital spending by, oil and natural gas companies, including national oil companies. One indication of drilling and production activity and spending is rig count, which the Company monitors to gauge market conditions. Any prolonged reduction in oil and natural gas prices or drop in rig count could depress current levels of exploration, development, and production activity. Perceptions of longer-term lower oil and natural gas prices by oil and natural gas companies could similarly reduce or defer major expenditures given the long-term nature of many large-scale development projects. Lower levels of activity could result in a corresponding decline in the demand for the Company’s oil and natural gas well products and services, which could have a material adverse effect on the Company’s revenue and profitability.
The Company’s consumer and industrial customers would be adversely effected if economic activity decreased dramatically. The Company’s primary product is often used to replace less desirable solvents in numerous consumer and industrial applications and is more expensive than other materials. As economic activity decreases, consumer and industrial companies not only consume less solvent, they also may relax their environmental mandates and purchase cheaper solvents. The Company’s revenue and profitability could be negatively impacted if demand softens because of weak economic activity.
Events in global credit markets can significantly impact the availability of credit and associated financing costs for many of the Company’s customers. Many of the Company’s customers finance their drilling and production programs through third-party lenders or public debt offerings. Lack of available credit or increased costs of borrowing could cause customers to reduce spending on drilling programs, thereby reducing demand and potentially resulting in lower prices for the Company’s products and services. Also, the credit and economic environment could significantly impact the financial condition of some customers over a prolonged period, leading to business disruptions and restricted ability to pay for the Company’s products and services. The Company’s forward-looking statements assume that the Company’s lenders, insurers, and other financial institutions will be able to fulfill their obligations under various credit agreements, insurance policies, and contracts. If any of the Company’s significant lenders, insurers and others are unable to perform under such agreements, and if the Company was unable to find suitable replacements at a reasonable cost, the Company’s results of operations, liquidity, and cash flows could be adversely impacted.
12
A prolonged period of depressed oil and natural gas prices could result in reduced demand for the Company’s products and services and adversely affect the Company’s business, financial condition, and results of operations.
The markets for oil and natural gas have historically been volatile. Such volatility in oil and natural gas prices, or the perception by the Company’s customers of unpredictability in oil and natural gas prices, could adversely affect spending. The oil and natural gas markets may be volatile in the future. The demand for the Company’s products and services is, in large part, driven by general levels of exploration and production spending and drilling activity by its customers. Decrease in oil and natural gas prices could cause a decline in exploration and drilling activities. This, in turn, could result in lower demand for the Company’s products and services and could result in lower prices for the Company’s products and services. A prolonged decline in oil or natural gas prices could adversely affect the Company’s business, financial condition, and results of operations.
New and existing competitors within the Company’s industries could have an adverse effect on results of operations.
The oil and natural gas industry is highly competitive. The Company’s principal competitors include numerous small companies capable of competing effectively in the Company’s markets on a local basis, as well as a number of large companies that possess substantially greater financial and other resources than does the Company. Larger competitors may be able to devote greater resources to developing, promoting and selling products and services. The Company may also face increased competition due to the entry of new competitors including current suppliers that decide to sell their products and services directly to the Company’s customers. As a result of this competition, the Company could experience lower sales or greater operating costs, which could have an adverse effect on the Company’s margins and results of operations.
Regulatory pressures, environmental activism, and legislation could result in reduced demand for the Company’s products and services and adversely affect the Company’s business, financial condition, and results of operations.
Regulations restricting volatile organic compounds ("VOC") exist in many states and/or communities which limit demand for certain products. Although citrus oil is considered a VOC, its health, safety, and environmental profile is preferred over other solvents (e.g., BTEX), which is currently creating new market opportunities around the world. Changes in the perception of citrus oils as a preferred VOC, increased consumer activism against hydraulic fracturing or other regulatory or legislative actions by governments could potentially result in materially reduced demand for the Company’s products and services and could adversely affect the Company’s business, financial condition, and results of operations.
The Company’s industry has a high rate of employee turnover. Difficulty attracting or retaining personnel or agents could adversely affect the Company’s business.
The Company operates in an industry that has historically been highly competitive in securing qualified personnel with the required technical skills and experience. The Company’s services require skilled personnel able to perform physically demanding work. Due to industry volatility and the demanding nature of the work, workers could choose to pursue employment opportunities that offer a more desirable work environment at wages competitive with the Company’s. As a result, the Company may not be able to find qualified labor, which could limit the Company’s growth. In addition, the cost of attracting and retaining qualified personnel has increased over the past several years due to competitive pressures. The Company expects labor costs will continue to increase into the foreseeable future. In order to attract and retain qualified personnel, the Company may be required to offer increased wages and benefits. If the Company is unable to increase the prices of products and services to compensate for increases in compensation, or is unable to attract and retain qualified personnel, operating results could be adversely affected.
Severe weather could have an adverse impact on the Company’s business.
The Company’s business could be materially and adversely affected by severe weather conditions. Hurricanes, tropical storms, flash floods, blizzards, cold weather and other severe weather conditions could result in curtailment of services, damage to equipment and facilities, interruption in transportation of products and materials, and loss of productivity. If the Company’s customers are unable to operate or are required to reduce operations due to severe weather conditions, and as a result curtail purchases of the Company’s products and services, the Company’s business could be adversely affected.
A terrorist attack or armed conflict could harm the Company’s business.
Terrorist activities, anti-terrorist efforts, and other armed conflicts involving the U.S. could adversely affect the U.S. and global economies and could prevent the Company from meeting financial and other obligations. The Company could experience loss of business, delays or defaults in payments from payors, or disruptions of fuel supplies and markets if pipelines, production facilities, processing plants, or refineries are direct targets or indirect casualties of an act of terror or war. Such activities could reduce the overall demand for oil and natural gas which, in turn, could also reduce the demand for the Company’s products and services. Terrorist activities and the threat of potential terrorist activities and any resulting economic downturn could adversely affect the Company’s results of operations, impair the ability to raise capital, or otherwise adversely impact the Company’s ability to realize certain business strategies.
13
Risks Related to the Company’s Securities
The market price of the Company’s common stock has been and may continue to be volatile.
The market price of the Company’s common stock has historically been subject to significant fluctuations. The following factors, among others, could cause the price of the Company’s common stock to fluctuate significantly:
• | variations in the Company’s quarterly results of operations; |
• | changes in market valuations of companies in the Company’s industry; |
• | fluctuations in stock market prices and volume; |
• | fluctuations in oil and natural gas prices; |
• | issuances of common stock or other securities in the future; |
• | additions or departures of key personnel; and |
• | announcements by the Company or the Company’s competitors of new business, acquisitions, or joint ventures. |
The stock market has experienced unusual price and volume fluctuations in recent years that have significantly affected the price of common stock of companies within many industries including the oil and natural gas industry. Further changes can occur without regard to specific operating performance. The price of the Company’s common stock could fluctuate based upon factors that have little to do with the Company’s operational performance, and these fluctuations could materially reduce the Company’s stock price. The Company could be a defendant in a legal case related to a significant loss of value for the shareholders. This could be expensive and divert management’s attention and Company resources, as well as have an adverse effect on the Company’s business, financial condition, and results of operations.
An active market for the Company’s common stock may not continue to exist or may not continue to exist at current trading levels.
Trading volume for the Company’s common stock historically has been very volatile when compared to companies with larger market capitalizations. The Company cannot presume that an active trading market for the Company’s common stock will continue or be sustained. Sales of a significant number of shares of the Company’s common stock in the public market could lower the market price of the Company’s stock.
The Company has no plans to pay dividends on the Company’s common stock, and, therefore, investors will have to look to stock appreciation for return on investments.
The Company does not anticipate paying any cash dividends on the Company’s common stock within the foreseeable future. The Company currently intends to retain all future earnings to fund the development and growth of the Company’s business and to meet current debt obligations. Any payment of future dividends will be at the discretion of the Company’s board of directors and will depend, among other things, on the Company’s earnings, financial condition, capital requirements, level of indebtedness, statutory and contractual restrictions applying to the payment of dividends, and other considerations deemed relevant by the board of directors. Additionally, should the Company seek future financing or refinancing of indebtedness, covenants could restrict the payment of dividends without the prior written consent of lenders. Investors must rely on sales of common stock held after price appreciation, which may never occur, in order to realize a return on their investment.
Certain anti-takeover provisions of the Company’s charter documents and applicable Delaware law could discourage or prevent others from acquiring the Company, which may adversely affect the market price of the Company’s common stock.
The Company’s certificate of incorporation and bylaws contain provisions that:
• | permit the Company to issue, without stockholder approval, up to 100,000 shares of preferred stock, in one or more series and, with respect to each series, to fix the designation, powers, preferences and rights of the shares of the series; |
• | prohibit stockholders from calling special meetings; |
• | limit the ability of stockholders to act by written consent; |
• | prohibit cumulative voting; and |
• | require advance notice for stockholder proposals and nominations for election to the board of directors to be acted upon at meetings of stockholders. |
In addition, Section 203 of the Delaware General Corporation Law limits business combinations with owners of more than 15% of the Company’s stock without the approval of the board of directors. Aforementioned provisions and other similar provisions make it more difficult for a third party to acquire the Company exclusive of negotiation. The Company’s board of directors could choose not to negotiate with an acquirer deemed not beneficial to or synergistic with the Company’s strategic outlook. If an acquirer were discouraged from offering to acquire the Company or prevented from successfully completing a hostile acquisition by these anti-takeover measures, stockholders could lose the opportunity to sell their shares at a favorable price.
14
Future issuance of additional shares of common stock could cause dilution of ownership interests and adversely affect the Company’s stock price.
The Company may, in the future, issue previously authorized and unissued shares of common stock, which would result in the dilution of current stockholders ownership interests. The Company is currently authorized to issue 80,000,000 shares of common stock. Additional shares are subject to issuance through various equity compensation plans or through the exercise of currently outstanding options. The potential issuance of additional shares of common stock may create downward pressure on the trading price of the Company’s common stock. The Company may also issue additional shares of common stock or other securities that are convertible into or exercisable for common stock in order to raise capital or effectuate other business purposes. Future sales of substantial amounts of common stock, or the perception that sales could occur, could have an adverse effect on the price of the Company’s common stock.
The Company may issue shares of preferred stock or debt securities with greater rights than the Company’s common stock.
Subject to the rules of the NYSE, the Company’s certificate of incorporation authorizes the board of directors to issue one or more additional series of preferred stock and to set the terms of the issuance without seeking approval from holders of common stock. Currently, there are 100,000 preferred shares authorized, with no shares currently outstanding. Any preferred stock that is issued may rank senior to common stock in terms of dividends, priority and liquidation premiums, and may have greater voting rights than holders of common stock.
The Company’s ability to use net operating loss carryforwards and tax attribute carryforwards to offset future taxable income may be limited as a result of transactions involving the Company’s common stock.
Under section 382 of the Internal Revenue Code of 1986, as amended, a corporation that undergoes an “ownership change” is subject to limitations on the Company’s ability to utilize pre-change net operating losses (“NOLs”), and certain other tax attributes to offset future taxable income. In general, an ownership change occurs if the aggregate stock ownership of certain stockholders increases by more than 50 percentage points over such stockholders’ lowest percentage ownership during the testing period (generally three years). An ownership change could limit the Company’s ability to utilize existing NOLs and tax attribute carryforwards for taxable years including or following an identified “ownership change.” Transactions involving the Company’s common stock, even those outside the Company’s control, such as purchases or sales by investors, within the testing period could result in an “ownership change.” Limitations imposed on the ability to use NOLs and tax credits to offset future taxable income could require the Company to pay U.S. federal income taxes in excess of that which would otherwise be required if such limitations were not in effect. Net operating losses and tax attributes could expire unused, in each instance reducing or eliminating the benefit of the NOLs and tax attributes. Similar rules and limitations may apply for state income tax purposes.
Disclaimer of Obligation to Update
Except as required by applicable law or regulation, the Company assumes no obligation (and specifically disclaims any such obligation) to update these risk factors or any other forward-looking statement contained in this Annual Report to reflect actual results, changes in assumptions or other factors affecting such forward-looking statements.
Item 1B. Unresolved Staff Comments.
Not applicable.
15
Item 2. Properties.
At December 31, 2014, the Company operated 36 manufacturing and warehouse facilities in 11 U.S. states. The Company owns 15 of these facilities and the remainder are leased with lease terms that expire from 2015 through 2031. In addition, the Company's corporate office is a leased facility located in Houston, Texas. The following table sets forth facility locations:
Segment | Owned/Leased | Location |
Energy Chemical Technologies | Owned | Marlow, Oklahoma |
Owned | Carthage, Texas | |
Owned | Wheeler, Texas | |
Leased | Raceland, Louisiana | |
Leased | The Woodlands, Texas | |
Owned | Waller, Texas | |
Owned | Healdton, Oklahoma | |
Leased | Plano, Texas | |
Leased | Keller, Texas | |
Leased | Coahoma, Texas | |
Leased | Natoma, Kansas | |
Drilling Technologies | Owned | Oklahoma City, Oklahoma |
Owned | Houston, Texas | |
Owned | Midland, Texas | |
Owned | Robstown, Texas | |
Owned | Vernal, Utah | |
Owned | Evanston, Wyoming | |
Leased | Bossier City, Louisiana | |
Leased | New Iberia, Louisiana | |
Leased | Pocola, Oklahoma | |
Leased | Grand Prairie, Texas | |
Leased | Houston, Texas | |
Leased | Midland, Texas | |
Leased | Odessa, Texas | |
Leased | Pittsburgh, Pennsylvania | |
Leased | Wysox, Pennsylvania | |
Leased | Woodward, Oklahoma | |
Leased | Casper, Wyoming | |
Leased | Bryan, Texas | |
Production Technologies | Owned | Gillette, Wyoming |
Owned | Dickinson, North Dakota | |
Owned | Vernal, Utah | |
Leased | Farmington, New Mexico | |
Leased | Gillette, Wyoming | |
Leased | Denver, Colorado | |
Consumer and Industrial Chemical Technologies | Owned | Winter Haven, Florida |
The Company considers owned and leased facilities to be in good condition and suitable for the conduct of business.
Item 3. Legal Proceedings.
From time to time, the Company may be party to routine litigation and other claims that arise in the normal course of business. Management is not aware of any pending or threatened lawsuits or proceedings that are expected to have a material effect on the Company’s financial position, results of operations or liquidity.
Item 4. Mine Safety Disclosures.
Not applicable.
16
PART II
Item 5. Market for Registrant’s Common Equity, Related Stockholder Matters and Issuer Purchases of Equity Securities.
The Company’s common stock began trading on the NYSE on December 27, 2007 under the stock ticker symbol “FTK.” As of the close of business on January 16, 2015, there were 53,364,905 shares of common stock outstanding held by approximately 14,750 holders of record. The Company's closing sale price of the common stock on the NYSE on January 16, 2015 was $16.31. The Company has never declared or paid cash dividends on common stock. While the Company regularly assesses the dividend policy, the Company has no current plans to declare dividends on common stock, and intends to continue to use earnings and other cash in the maintenance and expansion of its business. Further, the Company’s credit facility contains provisions that limit its ability to pay cash dividends on its common stock.
The following table sets forth, on a per share basis for the periods indicated, the high and low closing sales prices of common stock as reported by the NYSE. These prices do not include retail mark-ups, mark-downs or commissions.
Fiscal quarter ended: | 2014 | 2013 | ||||||
High | Low | High | Low | |||||
March 31, | $28.19 | $18.67 | $16.35 | $12.54 | ||||
June 30, | $32.66 | $26.98 | $18.00 | $14.57 | ||||
September 30, | $32.22 | $25.65 | $23.08 | $17.85 | ||||
December 31, | $25.23 | $16.11 | $23.46 | $19.01 | ||||
Stock Performance Graph
The performance graph below illustrates a five year comparison of cumulative total returns based on an initial investment of $100 in the Company’s common stock, as compared with the Russell 2000 Index and the Philadelphia Oil Services Index for the period beginning December 31, 2009 through December 31, 2014. The performance graph assumes $100 invested on December 31, 2009 in each of the Company’s common stock, the Russell 2000 Index and the Philadelphia Oil Service Index, and that all dividends were reinvested.
The following graph should not be deemed to be filed as part of this Annual Report, does not constitute soliciting material and should not be deemed filed or incorporated by reference into any other filing of the Company under the Securities Act of 1933, as amended, or the Exchange Act, as amended, except to the extent the Company specifically incorporates the graph by reference.
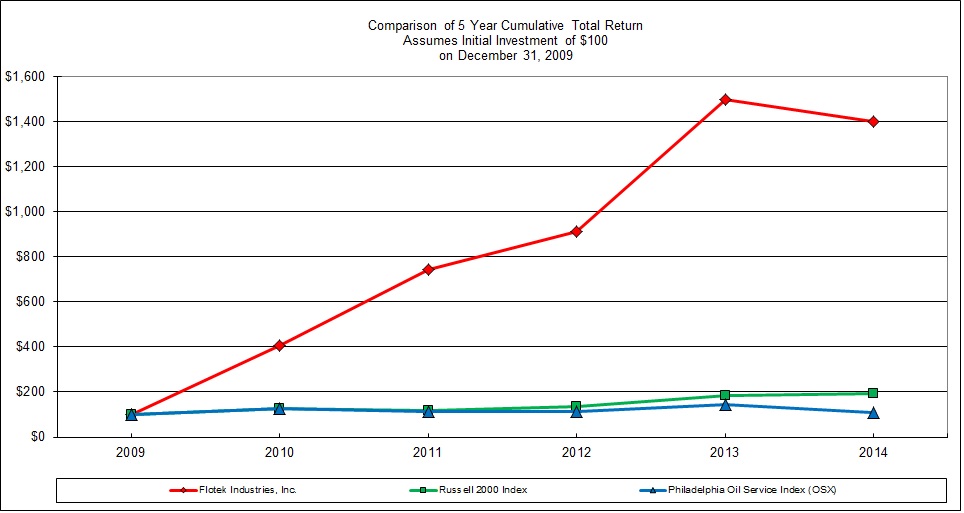
17
December 31, | ||||||||||||||||||||||||
2009 | 2010 | 2011 | 2012 | 2013 | 2014 | |||||||||||||||||||
Flotek Industries, Inc. | $ | 100 | $ | 407 | $ | 743 | $ | 910 | $ | 1,498 | $ | 1,389 | ||||||||||||
Russell 2000 Index | $ | 100 | $ | 125 | $ | 118 | $ | 136 | $ | 186 | $ | 193 | ||||||||||||
Philadelphia Oil Service Index (OSX) | $ | 100 | $ | 126 | $ | 111 | $ | 113 | $ | 144 | $ | 108 | ||||||||||||
Securities Authorized for Issuance Under Equity Compensation Plans
The following table summarizes equity compensation plan information regarding equity securities authorized for issuance under individual stock option compensation agreements.
Plan category | Number of Securities to be Issued Upon Exercise of Outstanding Options, Warrants and Rights | Weighted-Average Exercise Price of Outstanding Options, Warrants and Rights | Number of Securities Remaining Available for Future Issuance Under Equity Compensation Plans (Excluding Securities Reflected in the Column(a)) | |||||||
(a) | (b) | (c) | ||||||||
Equity compensation plans approved by security holders | 2,723,732 | $ | 11.98 | 2,269,585 | ||||||
Equity compensation plans not approved by security holders | — | — | — | |||||||
Total | 2,723,732 | $ | 11.98 | 2,269,585 | ||||||
Issuer Purchases of Equity Securities
In November 2012, the Company's Board of Directors authorized the repurchase of up to $25 million of the Company's common stock. Repurchases may be made in open market or privately negotiated transactions. Through December 31, 2014, the Company has repurchased $10.4 million of its common stock under this repurchase program and $14.6 million may yet be used to purchase shares.
Total Number of Shares Purchased (1) | Average Price Paid per Share | Total Number of Shares Purchased as Part of Publicly Announced Plans or Programs | Maximum Dollar Value of Shares that May Yet be Purchased Under the Plans or Programs | |||||||||||
October 1 to October 31, 2014 | 10,482 | $ | 21.07 | — | $ | 25,000,000 | ||||||||
November 1 to November 30, 2014 | 1,090 | $ | 21.90 | — | $ | 25,000,000 | ||||||||
December 1 to December 31, 2014 | 621,374 | $ | 16.74 | 621,176 | $ | 14,604,569 | ||||||||
Total | 632,946 | $ | 16.82 | 621,176 | $ | 14,604,569 | ||||||||
(1) The Company purchased shares of its common stock (a) to satisfy tax withholding requirements and payment remittance obligations related to period vesting of restricted shares and exercise of non-qualified stock options, (b) to satisfy payments required for common stock upon the exercise of stock options, and (c) as part of a publicly announced repurchase program.
18
Item 6. Selected Financial Data.
The following table sets forth certain selected historical financial data and should be read in conjunction with Part II, Item 7. “Management’s Discussion and Analysis of Financial Condition and Results of Operations” and Part II, Item 8. “Financial Statements and Supplementary Data” in this Annual Report. The selected operating and financial position data as of and for each of the five years presented have been derived from audited consolidated Company financial statements, some of which appear elsewhere in this Annual Report.
During 2014, the Company made two small acquisitions and incurred insignificant non-recurring charges. The net income and non-recurring charges related to these acquisitions do not materially affect comparability. During 2013, the Company acquired Florida Chemical Company, Inc. for purchase consideration of $106.4 million.
During 2012, the Company recorded a reduction in the valuation allowance for deferred tax assets of $16.5 million. The Company incurred significant non-recurring charges during 2010 through 2012. During 2012, 2011 and 2010, the Company incurred losses on the extinguishment of debt of $7.3 million, $3.2 million and $1.0 million, respectively. During 2010, the Company recorded fixed asset and other intangible impairment charges of $9.3 million. Additionally, during 2012, 2011 and 2010, the Company recorded a change in the fair value of warrant liability of $2.6 million income, $9.6 million income, and $21.5 million expense, respectively.
As of and for the year ended December 31, | |||||||||||||||||||
2014 | 2013 | 2012 | 2011 | 2010 | |||||||||||||||
(in thousands, except per share data) | |||||||||||||||||||
Operating Data | |||||||||||||||||||
Revenue | $ | 449,157 | $ | 371,065 | $ | 312,828 | $ | 258,785 | $ | 146,982 | |||||||||
Income (loss) from operations | 80,888 | 58,726 | 58,621 | 48,888 | (6,267 | ) | |||||||||||||
Net income (loss) | 53,603 | 36,178 | 49,791 | 31,408 | (43,465 | ) | |||||||||||||
Earnings (loss) per share – Basic | $ | 0.98 | $ | 0.70 | $ | 1.03 | $ | 0.60 | $ | (1.94 | ) | ||||||||
Earnings (loss) per share – Diluted | $ | 0.97 | $ | 0.67 | $ | 0.97 | $ | 0.56 | $ | (1.94 | ) | ||||||||
Financial Position Data | |||||||||||||||||||
Total assets | $ | 423,276 | $ | 375,581 | $ | 219,867 | $ | 232,012 | $ | 184,807 | |||||||||
Convertible senior notes, long-term | |||||||||||||||||||
debt and capital lease obligations, | |||||||||||||||||||
less discount and current portion | 25,398 | 35,690 | 22,455 | 100,613 | 126,682 | ||||||||||||||
Stockholders’ equity (deficit) | 306,003 | 249,752 | 154,730 | 78,298 | (3,453 | ) | |||||||||||||
19
Item 7. Management’s Discussion and Analysis of Financial Condition and Results of Operations.
The following discussion and analysis should be read in conjunction with the Consolidated Financial Statements and the related Notes to the Consolidated Financial Statements included elsewhere in this Annual Report. The following information contains forward-looking statements, which are subject to risks and uncertainties. Should one or more of these risks or uncertainties materialize, actual results could differ from those expressed or implied by the forward-looking statements. See “Forward-Looking Statements” at the beginning of this Annual Report.
Executive Summary
Flotek is a global diversified, technology-driven company that develops and supplies oilfield products, services and equipment to the oil, gas and mining industries, and high value compounds to companies that make cleaning products, cosmetics, food and beverages, and other products that are sold in consumer and industrial markets.
The Company’s oilfield businesses include specialty chemicals and logistics, down-hole drilling tools and production-related tools. Flotek’s technologies enable customers to drill wells more efficiently, increase well production and decrease well operating costs. The Company also provides automated bulk material handling, loading facilities and blending capabilities. The Company sources citrus oil domestically and internationally and is one of the largest processors of citrus oil in the world. Products produced from processed citrus oil include (1) high value compounds used as additives by companies in the flavors and fragrances markets and (2) environmentally friendly chemicals for use in numerous industries around the world, specifically the O&G industry.
Flotek operates in over 20 domestic and international markets, including the Gulf Coast, Southwest, Rocky Mountains, Northeastern and Mid-Continental regions of the U.S., Canada, Mexico, Central America, South America, Europe, Africa, Middle East, Australia and Asia-Pacific. Customers include major integrated O&G companies, oilfield services companies, independent O&G companies, pressure-pumping service companies, national and state-owned oil companies, and international supply chain management companies. The Company also serves customers who purchase non-energy-related citrus oil and related products, including household and commercial cleaning product companies, fragrance and cosmetic companies, and food manufacturing companies.
The operations of the Company are categorized into four reportable segments: Energy Chemical Technologies, Consumer and Industrial Chemical Technologies, Drilling Technologies and Production Technologies (previously referred to as Artificial Lift Technologies).
• | Energy Chemical Technologies designs, develops, manufactures, packages and markets specialty chemicals used in O&G well drilling, cementing, completion, stimulation and production. In addition, the Company's chemistries are used in specialized enhanced and improved oil recovery markets ("EOR" or "IOR"). Activities in this segment also include construction and management of automated material handling facilities and management of loading facilities and blending operations for oilfield services companies. |
• | Consumer and Industrial Chemical Technologies designs, develops and manufactures products that are sold to companies in the flavor and fragrance industries and specialty chemical industry. These technologies are used by beverage and food companies, fragrance companies, and companies providing household and industrial cleaning products. |
• | Drilling Technologies rents, sells, inspects, manufactures and markets down-hole drilling equipment used in energy, mining, water well and industrial drilling activities. |
• | Production Technologies assembles and markets production-related equipment, including the Petrovalve™ product line of rod pump components, electric submersible pumps, gas separators, valves and services that support natural gas and oil production activities. |
Market Conditions
The Company’s success is sensitive to a number of factors, which include, but are not limited to, drilling activity, customer demand for its advanced technology products, market prices for raw materials and governmental actions.
Drilling activity levels are influenced by a number of factors, including the number of rigs in operation, the geographical areas of rig activity, and drill rig efficiency (rig days required per well). Additional factors that influence the level of drilling activity include:
• | Historical, current, and anticipated future O&G prices, |
20
• | Federal, State and local governmental actions that may encourage or discourage drilling activity, |
• | Customers’ strategies relative to capital funds allocations, |
• | Weather conditions, and |
• | Technological changes to drilling methods and economics. |
Historical North American drilling activity is reflected in “TABLE A” below:
Customers’ demand for advanced technology products and services provided by the Company are dependent on their recognition of the value of:
• | Chemistries that improve the economics of their O&G operations, |
• | Drilling products that improve drilling operations and efficiencies, |
• | Chemistries that are economically viable, socially responsible and ecologically sound, and |
• | Production technologies that improve production and production efficiencies in maturing wells. |
Market prices for citrus oils can be influenced by:
• | Historical, current, and anticipated future production levels of the global citrus (primarily orange) crop, |
• | Weather related risks, |
• | Health and condition of citrus trees (e.g., disease and pests), and |
• | International competition and pricing pressures resulting from natural and artificial pricing influences. |
Governmental actions may restrict the future use of hazardous chemicals, including but not limited to, the following industrial applications:
• | O&G drilling and completion operations, |
• | O&G production operations, and |
• | Non-O&G industrial solvents. |
TABLE A | |||||||||||||||
2014 | 2013 | 2012 | 2014 vs. 2013 % Change | 2013 vs. 2012 % Change | |||||||||||
Average North American Active Drilling Rigs | |||||||||||||||
United States | 1,862 | 1,761 | 1,919 | 5.7 | % | (8.2 | )% | ||||||||
Canada | 379 | 353 | 364 | 7.4 | % | (3.0 | )% | ||||||||
Total | 2,241 | 2,114 | 2,283 | 6.0 | % | (7.4 | )% | ||||||||
Average U.S. Active Drilling Rigs by Type | |||||||||||||||
Vertical | 376 | 435 | 552 | (13.6 | )% | (21.2 | )% | ||||||||
Horizontal | 1,275 | 1,102 | 1,151 | 15.7 | % | (4.3 | )% | ||||||||
Directional | 211 | 224 | 216 | (5.8 | )% | 3.7 | % | ||||||||
Total | 1,862 | 1,761 | 1,919 | 5.7 | % | (8.2 | )% | ||||||||
Oil vs. Natural Gas North American Drilling Rigs | |||||||||||||||
Oil | 1,745 | 1,606 | 1,621 | 8.7 | % | (0.9 | )% | ||||||||
Natural Gas | 496 | 508 | 662 | (2.4 | )% | (23.3 | )% | ||||||||
Total North America | 2,241 | 2,114 | 2,283 | 6.0 | % | (7.4 | )% | ||||||||
US Average Wells Drilled per Rig | 5.20 | 5.23 | 4.92 | (0.6 | )% | 6.3 | % | ||||||||
Source: Rig count: Baker Hughes, Inc. (www.bakerhughes.com); Rig counts are the annual average of the reported weekly rig count activity.
Well count: Baker Hughes, Inc. (www.bakerhughes.com); Well counts are the annual average of the reported quarterly wells/rig activity.
During year ended 2014, total North American active drilling rig count saw an increase when compared to the comparable periods of 2013 but a decrease compared to 2012. The increase in 2014 was primarily in horizontal rig types and rigs drilling in oil fields. While the U.S. drilling activity decreased by (8.2)% from 2012 to 2013, it increased by 5.7% in 2014 compared to 2013. However, the number of wells drilled per rig per quarter in 2014 has decreased to 5.20 from 5.23 for the same period in 2013.
21
Outlook for 2015
During the second half of 2014 the price of crude oil declined dramatically with the decline continuing in early 2015. As a result, most North American exploration and production companies - many of which are Flotek clients - have announced plans to significantly reduce their exploration and drilling activity in 2015. The Company expects the reduction in activity to create a more challenging environment in which to market its broad range of energy technologies, from chemistry to drilling and production technologies. Although the Company expects demand for its oil and gas related products and services in North America to be impacted by these industry conditions, the Company plans to continue aggressive marketing of its oil and gas based products and services including its Complex nano-Fluid® chemistries, Teledrift® product line, recently introduced Stemulator® product line and growing line of production technologies. While international markets may react differently than North American markets to the decline in crude prices, the Company expects similar market challenges around the globe. However, the Company believes there are a number of new market opportunities that remain available in the current price environment.
The Company expects capital spending to be approximately $25 million in 2015, inclusive of approximately $10 million for construction of major facilities, including the Company’s previously announced Global Research & Innovation headquarters in Houston and the Company’s chemistry manufacturing and research facility near Sohar, Oman, through its joint venture with Gulf Energy. The Company believes construction of these facilities should generate substantial value in 2016 and beyond. The Company will remain nimble in its core capital expenditure plans, adjusting as market conditions warrant.
The Company’s new Global Research & Innovation headquarters in Houston will not only allow for the development of new energy chemistries but will allow expanded collaboration between clients, leaders from academia and Company scientists. The company believes these collaborative opportunities will become an important and distinguishing capability within the industry. The Company also plans to continue to expand the capabilities and use of its patent pending FracMaxTM software which should continue to enhance the Company’s sales and marketing efforts by validating the production and economic benefits of the Company’s core Complex nano-Fluid® chemistries.
The Company continues to pursue selected strategic relationships, both domestically and internationally, to expand its business:
In January, 2014, the Company acquired Eclipse IOR Services, LLC (“EOGA”), a leading enhanced oil recovery design and injection firm. EOGA’s expertise in enhanced oil recovery processes and the use of polymers to improve the performance of EOR projects have been combined with the Company’s previously existing EOR products and services.
In April, 2014, the Company acquired 100% of the membership interests in SiteLark, LLC (“SiteLark”). SiteLark provides reservoir engineering and modeling services for a variety of hydrocarbon applications. Its service assists engineers with reservoir simulation, reservoir engineering and waterflood optimization.
The outlook for the Company’s consumer and industrial chemistries will be driven by availability and demand for citrus oils and other bio-based raw materials. Current inventory and crop expectations are sufficient to meet the Company’s needs to supply its flavor and fragrance business as well as the industrial markets. However, market price volatility may result in revenue and margin fluctuations from quarter to quarter.
Changes to global geo-political, global economic and industry events could have an impact, either positive or negative, on the Company’s business. In the event of significant adverse changes to the demand for oil and gas production and/or the market price for oil and gas, the market conditions affecting the Company could change quickly and materially. Should such adverse changes to market conditions occur, management believes the Company has adequate liquidity to withstand the impact of such changes while continuing to make strategic capital investments and acquisitions if and when opportunities arise. In addition, management believes the Company is well-positioned to take advantage of significant increases in demand for its products should market conditions improve dramatically in the near term.
22
Results of Operations (in thousands):
Year ended December 31, | ||||||||||||
2014 | 2013 | 2012 | ||||||||||
Revenue | $ | 449,157 | $ | 371,065 | $ | 312,828 | ||||||
Cost of revenue | 266,198 | 223,538 | 181,209 | |||||||||
Gross margin | 182,959 | 147,527 | 131,619 | |||||||||
Gross margin % | 40.7 | % | 39.8 | % | 42.1 | % | ||||||
Selling, general and administrative costs | 87,146 | 78,197 | 66,415 | |||||||||
Selling, general and administrative costs % | 19.4 | % | 21.1 | % | 21.2 | % | ||||||
Depreciation and amortization | 9,738 | 7,273 | 4,410 | |||||||||
Research and innovation costs | 4,976 | 3,752 | 3,182 | |||||||||
Gain on disposal of long-lived assets | 211 | (421 | ) | (1,009 | ) | |||||||
Income from operations | 80,888 | 58,726 | 58,621 | |||||||||
Income from operations % | 18.0 | % | 15.8 | % | 18.7 | % | ||||||
Change in fair value of warrant liability | — | — | 2,649 | |||||||||
Interest and other expense, net | (2,004 | ) | (1,776 | ) | (15,812 | ) | ||||||
Income before income taxes | 78,884 | 56,950 | 45,458 | |||||||||
Income tax (expense) benefit | (25,281 | ) | (20,772 | ) | 4,333 | |||||||
Net income | $ | 53,603 | $ | 36,178 | $ | 49,791 | ||||||
Net income % | 11.9 | % | 9.7 | % | 15.9 | % | ||||||
Results for 2014 compared to 2013—Consolidated
Consolidated revenue for the year ended December 31, 2014 increased $78.1 million or 21.0%, from the prior corresponding period. The increase in revenue was primarily due to increased sales of stimulation chemical additives in our Energy Chemical Technologies segment and the incremental revenue from the acquisition of Florida Chemical in the second quarter of 2013 and the 2014 acquisition of EOGA.
Consolidated gross margin for the year ended December 31, 2014 increased $35.4 million, or 24.0%, from the prior corresponding period. Gross margin as a percentage of revenue increased to 40.7% for the year ended December 31, 2014 from 39.8% from the prior corresponding period, primarily attributable to improved margins in the drilling technologies segment.
Selling, general and administrative (“SG&A”) expenses are not directly attributable to products sold or services provided. SG&A costs as a percentage of revenue declined from 21.1% to 19.4% for the year ended December 31, 2014 compared to the prior corresponding period as revenues grew faster than SG&A costs. SG&A costs increased $8.9 million, or 11.4%, for the year ended December 31, 2014 from the prior corresponding period primarily due to SG&A costs for the acquired companies discussed above and increased headcount and associated costs related to the pursuit of growth opportunities.
Depreciation and amortization expense not included in gross margin, for the year ended December 31, 2014 increased by $2.5 million, or 33.9% from the prior corresponding period. This increase was primarily attributable to the depreciation and amortization of assets recognized as part of the acquisition of Florida Chemical in the second quarter of 2013 and the acquisition of EOGA in the first quarter of 2014.
Research and Innovation ("R&I") expense for the year ended December 31, 2014 increased $1.2 million or 32.6% for the year ended December 31, 2014 from the prior corresponding period. The increase in R&I is primarily attributable to new product innovation and Flotek's commitment to remaining responsive to customer needs, increased demand and continued growth of our existing product lines.
Interest and other expense increased $0.2 million, or 12.8% for the year ended December 31, 2014 compared to the prior corresponding period.
The Company recorded an income tax provision of $25.3 million, yielding an effective tax rate of 32.0% for the year ended December 31, 2014 compared to an income tax provision of $20.8 million yielding an effective tax rate of 36.5% in the prior corresponding period. The change in the effective tax rate from 2013 to 2014 was primarily due to changes in state apportionment factors including the effect on state deferred tax assets and liabilities.
23
Results for 2013 compared to 2012—Consolidated
Consolidated revenue for the year ended December 31, 2013 increased $58.2 million, or 18.6%, from the prior corresponding period. The increase in revenue was primarily due to the acquisition of Florida Chemical, which contributed incremental revenue of $50.9 million during 2013. Excluding the impact of the acquisition, 2013 revenues increased $7.3 million or 2.3% when compared with 2012, while the total average North American drilling rig count decreased by 7.4%. Revenue increases in the Energy Chemical Technologies and Production Technologies segments were partially offset by revenue declines in the Drilling Technologies segment.
Consolidated gross margin for the year ended December 31, 2013 increased $15.9 million, or 12.1%, from the prior corresponding period. The increase in gross margin was primarily due to the increase in revenue. The gross margin percentage decline was primarily attributable to portfolio mix resulting from the inclusion of Florida Chemical in 2013 results and proportionately higher sales of non-proprietary products in the Energy Chemical Technologies segment and increasing costs of actuated tools in the Drilling Technologies segment. This decrease was partially offset by supply chain benefits from the Florida Chemical acquisition and proportionately higher sales of technology tools in the Drilling Technologies segment.
Selling, general and administrative (“SG&A”) expenses are not directly attributable to products sold or services provided. SG&A costs for the year ended December 31, 2013 increased by $11.8 million, or 17.7% from the prior corresponding period. Excluding incremental SG&A costs of $4.9 million associated with the Florida Chemical business acquired, SG&A costs increased $6.9 million primarily due to costs incurred in 2013 related to executive severance ($1.0 million), implementation of the Company's new ERP system ($0.8 million), and expenses related to the pursuit of acquisitions and major initiatives in international markets ($1.7 million). Excluding these items and the incremental SG&A costs of the Florida Chemical business, SG&A costs increased $3.4 million or 5.1% primarily due to increases in headcount, general insurance, and travel related costs. SG&A costs as a percentage of revenue decreased from 21.2% to 21.1% for the year ended December 31, 2013 compared to the prior corresponding period.
Depreciation and amortization expense not included in gross margin, for the year ended December 31, 2013 increased by $2.9 million or 64.9% from the prior corresponding period. This increase was primarily attributable to incremental depreciation and amortization of assets recognized as part of the acquisition of Florida Chemical.
R&I expense for the year ended December 31, 2013 increased $0.6 million or 17.9% from the prior corresponding period. The increase in R&I is primarily attributable to new product innovation, and Flotek's commitment to remaining responsive to increased demand and continued growth of our product lines.
Interest and other expense for the year ended December 31, 2013 decreased by $14.0 million, or 88.8% from the prior corresponding period. The decline in interest expense was primarily due to the repayment of the Company's convertible notes of $50.3 million at the end of the fourth quarter of 2012 and $5.2 million during the first quarter of 2013.
The Company recorded an income tax provision of $20.8 million yielding an effective tax rate of 36.5% for the year ended December 31, 2013, compared to an income tax benefit of $4.3 million reflecting an effective tax rate of (9.5)% for the prior corresponding period. The Company's effective tax rate in 2012 was affected primarily by an $18.6 million decrease in the valuation allowance against a deferred tax asset. Additionally, fluctuations in effective tax rates have historically been impacted by non-cash changes in the fair value of the Company’s warrant liability and permanent tax differences.
Results by Segment
Year ended December 31, | ||||||||||||
Energy Chemical Technologies (dollars in thousands) | 2014 | 2013 | 2012 | |||||||||
Revenue | $ | 268,761 | $ | 200,932 | $ | 183,986 | ||||||
Gross margin | $ | 117,867 | $ | 88,536 | $ | 81,438 | ||||||
Gross margin % | 43.9 | % | 44.1 | % | 44.3 | % | ||||||
Income from operations | $ | 84,846 | $ | 65,396 | $ | 65,440 | ||||||
Income from operations % | 31.6 | % | 32.5 | % | 35.6 | % | ||||||
Results for 2014 compared to 2013—Energy Chemical Technologies
Energy Chemical Technologies revenue for the year ended December 31, 2014 increased $67.8 million, or 33.8%, from the prior corresponding period. Excluding the incremental revenue impact of the Florida Chemical, EOGA and SiteLark acquisitions of $10.5 million, revenue increased $57.3 million, or 28.5%, compared with the prior corresponding period, primarily due to the
24
increased sales of stimulation chemical additives, largely the result of the introduction of the Company’s proprietary, patent-pending FracMax™ software which statistically demonstrates the positive production and economic impact of using Flotek’s CnF® chemistries in unconventional well completions. The FracMaxTM software has led to a record number of new validation projects and accelerated commercial acceptance of the Company’s CnF® completion chemistries.
Energy Chemical Technologies gross margin for the year ended December 31, 2014 increased $29.3 million, or 33.1%, from the prior corresponding period primarily due to the increase in product sales revenue. Gross margin as a percentage of revenue for the year ended December 31, 2014 was essentially unchanged at 43.9% compared to the prior corresponding period.
Income from operations for the Energy Chemical Technologies segment increased $19.5 million, or 29.7% for year ended December 31, 2014 compared to the prior corresponding period. This increase is primarily attributable to an increase in gross margin, partially offset by increased sales and marketing efforts in pursuit of growth opportunities and the Company’s continued commitment to its research and innovation efforts within Energy Chemical Technologies.
Results for 2013 compared to 2012—Energy Chemical Technologies
Energy Chemical Technologies revenue for year ended December 31, 2013 increased $16.9 million, or 9.2%, from the prior corresponding period. Excluding the incremental revenue impact of the Florida Chemical acquisition of $8.0 million, revenue increased $8.9 million, or 4.9% from the prior corresponding period. The increase in 2013 revenue excluding the Florida Chemical acquisition was primarily due to an increase in sales of stimulation chemicals of $7.5 million, or 4.6%. Throughout the year, customers increased usage of stimulation chemicals in the Rockies, South Texas and other North American basins.
Energy Chemical Technologies’ gross margin for the year ended December 31, 2013 increased $7.1 million, or 8.7% from the prior corresponding period. Gross margin percentage for 2013 declined 0.2% compared to the prior corresponding period primarily attributable to product portfolio mix resulting from proportionately higher sales of non-proprietary products partially offset by the supply chain benefits of the Florida Chemical acquisition.
Income from operations for the Energy Chemical Technologies segment was relatively flat for the year ended December 31, 2013 compared to 2012. Income from operations percentage for 2013 decreased 3.1% compared to the 2012. The decrease in income from operations percentage is primarily related to increased R&I, sales staff and travel costs incurred in pursuit of growth opportunities.
Year ended December 31, | ||||||||||||
Consumer and Industrial Chemical Technologies (dollars in thousands) | 2014 | 2013 | 2012 | |||||||||
Revenue | $ | 51,091 | $ | 42,927 | $ | — | ||||||
Gross margin | $ | 12,897 | $ | 10,659 | $ | — | ||||||
Gross margin % | 25.2 | % | 24.8 | % | — | % | ||||||
Income from operations | $ | 6,558 | $ | 6,260 | $ | — | ||||||
Income from operations % | 12.8 | % | 14.6 | % | — | % | ||||||
Results for 2014 compared to 2013—Consumer and Industrial Chemical Technologies
CICT revenue for the year ended December 31, 2014 increased $8.2 million or 19.0%, from the prior corresponding period, as the segment was created in the second quarter of 2013 upon the acquisition of Florida Chemical.
CICT gross margin for the year ended December 31, 2014 increased $2.2 million, or 21.0% from the prior corresponding period primarily due to the segment being created in the second quarter of 2013 upon the acquisition of Florida Chemical. Gross margin as a percentage of revenue increased to 25.2% for the year ended December 31, 2014 compared to 24.8% from the prior corresponding period.
Income from operations for the CICT segment increased $0.3 million, or 4.8%, for the year ended December 31, 2014 from the prior corresponding period primarily due to the increased revenue between the two periods.
Results for 2013 compared to 2012—Consumer and Industrial Chemical Technologies
CICT revenue for the year ended December 31, 2013 was $42.9 million. Revenue for the year ended December 31, 2013 is incremental to the Company for the period as this is a new segment acquired during the second quarter of 2013. CICT revenue is
25
primarily driven by demand for d-Limonene and other bio-based chemistries produced for a multitude of industries, as well as from citrus isolates produced for the flavor and fragrance industry. Revenue for CICT is subject to market seasonality and availability of raw materials.
CICT gross margin for the year to date period ended December 31, 2013 contributed incrementally to the Company's overall consolidated margin as part of the new segment of business acquired in May 2013. The primary drivers of the margins of the CICT segment are demand for the Company's bio-based chemistries and the high value flavor and fragrance isolates. The general direction of the citrus oil markets and seasonality of flavor compounds can also impact margin results.
Income from operations for year to date period ended December 31, 2013 contributed incrementally to the Company's overall consolidated income from operations over the comparable period of 2012.
Year ended December 31, | ||||||||||||
Drilling Technologies (dollars in thousands) | 2014 | 2013 | 2012 | |||||||||
Revenue | $ | 113,302 | $ | 112,406 | $ | 116,736 | ||||||
Gross margin | $ | 45,651 | $ | 43,156 | $ | 45,709 | ||||||
Gross margin % | 40.3 | % | 38.4 | % | 39.2 | % | ||||||
Income from operations | $ | 19,022 | $ | 18,306 | $ | 22,282 | ||||||
Income from operations % | 16.8 | % | 16.3 | % | 19.1 | % | ||||||
Results for 2014 compared to 2013—Drilling Technologies
Drilling Technologies revenue for the year ended December 31, 2014 increased $0.9 million, or 0.8% from the prior corresponding period primarily due to an increase in actuated tool rentals.
• | Rental revenue for the year ended December 31, 2014 increased by $3.7 million, or 6.0% from the prior corresponding period. Leading the increase was motor rentals which rose 52.9% along with growth of 96.5% in Stemulator® tool activity. This was partially offset by a decrease of 32.0% in other tool rental types and flat activity for Teledrift® year over year. |
• | Product sales revenue for the year ended December 31, 2014 decreased by $2.5 million, or 6.8%, from the prior corresponding period, primarily due to decreased domestic float and motor product sales revenue and decreased international drill pipe sales. |
• | Service revenue for the year ended December 31, 2014 decreased $0.3 million, or 2.0%, from the prior corresponding period primarily related to decreased rig service jobs and inspections. |
Drilling Technologies gross margin for the year ended December 31, 2014 increased $2.5 million, or 5.8%, from the prior corresponding period and increased to 40.3% as a percentage of revenue compared to 38.4% from year end 2013. This was primarily due to increased material margins on the actuated tool rentals as a direct result of repair cost decreases and direct expense controls put in place during 2014.
Drilling Technologies income from operations for the year ended December 31, 2014 increased by $0.7 million or 3.9% from the prior corresponding period. Income from operations as a percentage of revenue increased to 16.8% for the year ended December 31, 2014 from 16.3% in the prior corresponding period. These increases were also due to increased material margins and direct expense controls mentioned above.
Results for 2013 compared to 2012—Drilling Technologies
Drilling Technologies revenue for the year ended December 31, 2013 decreased $4.3 million or 3.7% from the prior corresponding period. Revenue declines can be primarily attributed to a decline in actuated tool rentals. A 21% decline in vertical wells in 2013 compared to 2012 has limited the opportunities for renting tools directly to operators.
• | Product Revenue: Product revenue was relatively flat for the year ended December 31, 2013 compared to the prior corresponding period, increasing by $0.6 million or 1.7% due to improved sales of motor equipment that was a result of higher sales to existing customers |
• | Rental Revenue: Rental revenue for the year ended December 31, 2013 decreased by $6.1 million or 9.0% in comparison to the 2012 period. This decline is due to an $11.1 million or 42.0% decrease in actuated tool rentals caused by increased |
26
competition, competitive pricing pressure, strategic selection of higher margin rental jobs, and the above mentioned decline in vertical wells. Partially offsetting the actuated tool decrease was an increase in Teledrift® and Pro Series MWD rentals where international growth of 31.0% in South America, the Middle East, Canada and Kazakhstan mitigated the loss of revenue in the US. Also offsetting the actuated tool decline was revenue growth for the new Stemulator® tool, which was introduced in the last half of 2013, as well as existing drilling tool rentals (stabilizers, reamers, collars, etc.)
• | Service Revenue: The service revenue for the year ended December 31, 2013 increased $1.1 million, or 8.7% from the prior corresponding period. The increased service revenue was primarily related to increased rig installations, inspections and increased pricing of services offered in the market |
Drilling Technologies gross margin for the year ended December 31, 2013 decreased by $2.6 million, or 5.6%, from the prior corresponding period due to the sales decrease and actuated tool cost increases. As a percentage of revenue gross margin declined by only 0.8% as a result of actuated tool cost increases partially offset by an improved product mix resulting from proportionately higher sales of higher margin Teledrift® series tools, Stemulator® tool and other drilling tools and services.
Drilling Technologies income from operations for the year ended December 31, 2013 decreased by $4.0 million, or 17.8% and by 2.8% as a percentage of revenue from the prior corresponding period. This decline was primarily due to the lower revenue and gross margins, increased sales force related costs, medical costs, and general insurance expenses.
Year ended December 31, | ||||||||||||
Production Technologies (dollars in thousands) | 2014 | 2013 | 2012 | |||||||||
Revenue | $ | 16,003 | $ | 14,800 | $ | 12,106 | ||||||
Gross margin | $ | 6,544 | $ | 5,176 | $ | 4,472 | ||||||
Gross margin % | 40.9 | % | 35.0 | % | 36.9 | % | ||||||
Income from operations | $ | 3,246 | $ | 3,060 | $ | 3,395 | ||||||
Income from operations % | 20.3 | % | 20.7 | % | 28.0 | % | ||||||
Results for 2014 compared to 2013—Production Technologies
Revenue for the Production Technologies segment for the year ended December 31, 2014 revenue increased by $1.2 million, or 8.1% from the prior corresponding period as sales of PetrovalveTM tools and lifting units rose by $4.6 million, or 152.9% in 2014. Offsetting those revenue increases was a decrease in equipment sales and related services of $3.5 million, or 31.1% in coal-bed methane related business.
Production Technologies gross margin increased by $1.4 million, or 26.4% for the year ended December 31, 2104. Gross margin as a percentage of revenue increased to 40.9% compared to 35.0%, from the prior corresponding period, primarily due to the higher margins associated with the international valve sales and slight improvement in margins on pump equipment.
Income from operations increased by $0.2 million, or 6.1% for the year ended December 31, 2014, from the prior corresponding period, primarily due to the increased material margins mentioned above partially offset by SG&A expenses which increased by 55.6% due to costs attributable to employee-related expenses as the segment continues to refocus and reposition for growth in the market.
Results for 2013 compared to 2012—Production Technologies
Production Technologies revenue is primarily derived from coal bed methane (“CBM”) drilling activity, and is impacted by the price of natural gas; although the segment is starting to diversify into more oil related equipment sales and service. Revenue for the Production Technologies segment for the year ended December 31, 2013 increased by $2.7 million, or 22.3% from the prior corresponding period. The introduction of SSI Lift Systems in the second half of 2013; as well as increased pump and pump equipment sales led to the revenue increase. This increase is due to a slight rebound in the gas workover drilling market, additional installations in 2013, and more oil related equipment sales.
Production Technologies gross margins increased for the year ended December 31, 2013 by $0.7 million or 15.7% from the prior corresponding period due to the increased sales. As a percentage of revenue, gross margin has declined by 1.9% from the prior corresponding period as the increase in revenue in 2013 is almost entirely made up of oil related surface pump equipment which carries much lower margins than the international valve sales, which were flat year over year.
27
Income from operations decreased $0.3 million or 9.9%, for the year ended December 31, 2013 from the prior corresponding period. Operating income in 2013 would have remained the same as 2012 without the onetime gain on disposal of an operational asset included in 2012 operating results.
Capital Resources and Liquidity
Overview
The Company's ongoing capital requirements arise from the Company's needs to service debt, acquire and maintain equipment, fund working capital requirements and when the opportunities arise, to make strategic acquisitions. The Company funds its operating and capital requirements through operating cash flows and debt financing.
The Company's primary source of debt financing is its Credit Facility with PNC Bank. This Credit Facility contains provisions for a revolving credit facility of up to $75 million and a term loan secured by substantially all of the Company's domestic real and personal property, including accounts receivable, inventory, land, buildings, equipment and other intangible assets. As of December 31, 2014, the Company had $8.5 million in outstanding borrowings under the revolving credit facility and $35.5 million outstanding under the term loan. At December 31, 2014, the Company was in compliance with all debt covenants. Significant terms of the Company's credit facility are discussed in Part II, Item 8 - "Financial Statements and Supplementary Data" in Note 10 of "Notes to Consolidated Financial Statements" herein.
At December 31, 2014, the Company remained compliant with the continued listing standards of the NYSE.
Cash and cash equivalents totaled $1.3 million at December 31, 2014. During 2014, the Company generated $48.8 million of cash inflows from operations (net of $28.9 million expended in working capital), received gross proceeds of $357.2 million from the issuance of new debt and received $4.6 million in proceeds related to lost-in-hole and asset sales activity. Offsetting these cash inflows, the Company paid $5.7 million associated with the purchases of EOGA and SiteLark, paid down $375.2 million of debt, used $19.9 million in capital expenditures and $10.4 million to repurchase common stock.
Liquidity
The Company plans to spend approximately $25 million for committed and planned capital expenditures, inclusive of approximately $10 million for major facilities in R & I and Oman that will be initiated in 2015. The Company expects to generate sufficient cash from operations to fund its capital expenditures and make required payments on the term loan, including any prepayments that may be required under the credit facility agreement. If necessary, the Company will utilize its available capacity under the revolving credit agreement to fulfill its liquidity needs. Any excess cash generated may be used to pay down the level of debt, repurchase company stock or be retained for future use. The Company may pursue acquisitions when strategic opportunities arise and may access external financing to fund those acquisitions, if needed.
Cash Flows
Cash flow metrics from the consolidated statements of cash flows are as follows (in thousands):
Year ended December 31, | ||||||||||||
2014 | 2013 | 2012 | ||||||||||
Net cash provided by operating activities | $ | 48,822 | $ | 39,548 | $ | 49,515 | ||||||
Net cash used in investing activities | (21,703 | ) | (62,700 | ) | (15,200 | ) | ||||||
Net cash (used in) provided by financing activities | (28,440 | ) | 23,501 | (78,301 | ) | |||||||
Effect of changes in exchange rates on cash and cash equivalents | (143 | ) | (319 | ) | 4 | |||||||
Net (decrease) increase in cash and cash equivalents | $ | (1,464 | ) | $ | 30 | $ | (43,982 | ) | ||||
Operating Activities
During 2014, 2013 and 2012, cash from operating activities totaled $48.8 million, $39.5 million and $49.5 million, respectively. Consolidated net earnings for 2014 totaled $53.6 million, compared to consolidated net earnings of $36.2 million for 2013 and consolidated net earnings of $49.8 million for 2012.
Noncash items recognized in 2014 totaled $24.2 million, consisting primarily of depreciation and amortization expense ($17.8 million), stock compensation expense ($10.5 million), changes to deferred income taxes ($1.5 million) and provisions related to accounts receivables and inventories ($0.8 million) partially offset by gain on sale of assets ($3.4 million) and excess tax benefit related to share-based awards ($3.4 million).
28
Noncash items recognized in 2013 totaled $22.7 million, consisting primarily of depreciation and amortization expense ($15.1 million), stock compensation expense ($10.9 million), provisions related to accounts receivables and inventories ($1.9 million) partially offset by gains on the sale of assets ($4.6 million) and excess tax benefit related to share-based awards ($1.7 million).
Noncash items recognized in 2012 totaled $10.4 million, consisting primarily of depreciation and amortization expense ($11.6 million), amortization of deferred financing costs and accretion of debt discount ($4.7 million), share-based compensation expense ($13.4 million) and non-cash losses on the early extinguishment of debt ($4.8 million), partially offset by deferred income taxes ($18.7 million) net gains on asset disposals ($4.8 million) and changes in the fair value of the warrant liability ($2.6 million).
During 2014 changes in working capital used $28.9 million, primarily consisting of increased inventories ($23.1 million), higher receivables ($13.7 million), increased other current assets ($6.4 million), partially offset by higher payables ($13.1 million) and higher income taxes payables ($1.4 million).
During 2013 changes in working capital used $19.3 million in cash, primarily consisting of lower payables ($21.3 million), higher receivables ($9.9 million), partially offset by lower inventories ($4.5 million), higher accrued liabilities ($4.1 million) and higher income taxes payables ($2.2 million).
During 2012 changes in working capital used $10.6 million in cash. Changes in working capital during 2012 reflected our increased activity levels, with the use being driven primarily by increased inventories ($9.4 million), increased other current assets ($2.1 million) accrued liabilities ($1.9 million) and interest payable ($2.0 million), partially offset by decreased accounts receivable ($1.8 million) and increased accounts payable ($2.5 million), and a decrease in income taxes payable ($0.4 million).
Investing Activities
During 2014 investing activities used cash of $21.7 million, including $19.9 million in capital expenditures and $5.7 million associated with the purchase of Eclipse IOR Services, LLC and SiteLark, LLC, partially offset by proceeds from sales of assets ($4.6 million).
During 2013 investing activities used cash of $62.7 million, including ($53.4) million associated with the purchase of Florida Chemical, ($15.0) million in capital expenditures partially offset by proceeds from sales of assets ($5.8 million). Capital expenditures for 2013 decreased when compared to 2012 primarily due to lower spending on both drilling technologies facilities expansion and the Company’s new ERP system.
During 2012, investing activities used cash of $15.2 million. Capital expenditures were $20.7 million and were partially offset with proceeds from the sale of assets of $5.5 million.
Financing Activities
During 2014, financing activities used cash of $28.4 million primarily related to the net repayment of the revolving line of credit ($7.8 million), payments on the term loan ($10.3 million) and net equity related transactions ($10.0 million) primarily the repurchase of common stock.
During 2013, financing activities generated $23.5 million primarily related to borrowings under the Company’s term loan ($26.2 million), and revolving line of credit ($16.3 million), partially offset by debt payments ($13.2 million) and equity related transactions ($4.5 million) primarily purchase of treasury stock. The increase borrowings under the term loan and the revolving line of credit were related to the Company’s acquisition of Florida Chemical.
Financing activities used $78.3 million in cash during 2012 for the payments on capital lease obligations and the retirement of convertible notes ($102.4 million) and the purchases of treasury stock for tax withholding purposes ($2.0 million). Cash outflows for financing activities were partially offset by proceeds from the issuance of our 2012 Term Loan ($25.0 million).
Although the Company has no immediate intention to access the capital markets, the Company intends to file a "universal" shelf registration with the Securities and Exchange Commission in the future. This shelf registration statement will register the issuance and sale from time to time of various securities by the Company, including but not limited to senior notes, subordinated notes, preferred stock, common stock, and warrants. Once this shelf registration statement is filed with the Securities and Exchange Commission and becomes effective, the Company will have the financial flexibility to access the capital markets quickly and efficiently from time to time as the need may arise.
Off-Balance Sheet Arrangements
There have been no transactions that generate relationships with unconsolidated entities or financial partnerships, such as entities often referred to as “structured finance” or “special purpose entities” (“SPEs”), established for the purpose of facilitating off-
29
balance sheet arrangements or other contractually narrow or limited purposes. As of December 31, 2014, the Company was not involved in any unconsolidated SPEs.
The Company has not made any guarantees to customers or vendors nor does the Company have any off-balance sheet arrangements or commitments that have, or are reasonably likely to have, a current or future effect on the Company’s financial condition, change in financial condition, revenue, expenses, results of operations, liquidity, capital expenditures or capital resources that are material to investors.
Contractual Obligations
Cash flows from operations are dependent on a variety of factors, including fluctuations in operating results, accounts receivable collections, inventory management, and the timing of payments for goods and services. Correspondingly, the impact of contractual obligations on the Company’s liquidity and capital resources in future periods is analyzed in conjunction with such factors.
Material contractual obligations consist of repayment of amounts borrowed under the Company's Credit Facility and payment of operating lease obligations. Contractual obligations at December 31, 2014 are as follows (in thousands):
Payments Due by Period | ||||||||||||||||||||
Total | Less than 1 year | 1 - 3 years | 3 -5 years | More than 5 years | ||||||||||||||||
Term loan | 35,541 | 10,143 | 14,286 | 11,112 | — | |||||||||||||||
Estimated interest expense on term loan (1) | 3,262 | 1,369 | 1,696 | 197 | — | |||||||||||||||
Borrowings under revolving credit facility (2) | 8,500 | 8,500 | — | — | — | |||||||||||||||
Operating lease obligations | 25,208 | 2,440 | 4,921 | 3,929 | 13,918 | |||||||||||||||
Total | $ | 72,511 | $ | 22,452 | $ | 20,903 | $ | 15,238 | $ | 13,918 | ||||||||||
(1) | For the purpose of this calculation, interest rates on variable rate obligations remain unchanged from December 31, 2014. |
(2) | The borrowing is classified as current debt. The weighted-average interest rate was 3.75% at December 31, 2014. |
Critical Accounting Policies and Estimates
The Company’s consolidated financial statements have been prepared in accordance with accounting principles generally accepted in the United States of America (“GAAP”). Preparation of these statements requires management to make judgments, estimates and assumptions that affect the amounts of assets and liabilities in the financial statements and revenue and expenses during the reporting period. Significant accounting policies are described in Note 2 "Summary of Significant Accounting Policies" in the Notes to the Consolidated Financial Statements. The Company believes the following accounting policies are critical due to the significant, subjective and complex judgments and estimates required when preparing the consolidated financial statements. The Company regularly reviews judgments, assumptions and estimates to the critical accounting policies.
Revenue Recognition
Revenue for product sales and services is recognized when all of the following criteria have been met: (a) persuasive evidence of an arrangement exists, (b) products are shipped or services rendered to the customer and all significant risks and rewards of ownership have passed to the customer, (c) the price to the customer is fixed and determinable, and (d) collectability is reasonably assured. The Company’s products and services are sold based on a purchase order and/or contract and have fixed or determinable prices. There is typically no right of return or any significant post-delivery obligations. Probability of collection is assessed on a customer-by-customer basis.
Revenue and associated accounts receivable in the Energy Chemicals technologies, Consumer and Industrial Chemical Technologies, Drilling Technologies and Production Technologies segments are recorded at the agreed price when the aforementioned conditions are met. Generally a signed proof of obligation is obtained from the customer (delivery ticket or field bill for usage). Deposits and other funds received in advance of delivery are deferred until the transfer of ownership is complete.
The Logistics division of chemicals recognizes revenue related to design and construction oversight contracts using the percentage-of-completion method of accounting, measured by the percentage of costs incurred to date proportionate to the total estimated costs of completion. This calculated percentage is applied to the total estimated revenue at completion to calculate revenue earned to date. Contract costs include all direct labor and material costs, as well as indirect costs related to manufacturing and construction operations. General and administrative costs are charged to expense as incurred. Changes in job performance metrics and estimated profitability, including those arising from contract bonus and penalty provisions and final contract settlements, may periodically result in revisions to revenue and expenses and are recognized in the period in which such revisions become probable. Known or anticipated losses on contracts are recognized when such amounts become probable and estimable.
30
Within the Drilling segment, revenue is recognized upon receipt of a signed and dated field billing ticket from the customer. Customers are charged contractually agreed amounts for oilfield rental equipment damaged or lost-in-hole (“LIH”). LIH proceeds are recognized as revenue and the associated carrying value is charged to cost of sales.
Revenue for equipment sold by the Production Technologies segment is recorded net of any credit issued for return of an item for refurbishment under the equipment exchange program.
Sales tax collected from customers is not included in revenue but rather is accrued as a liability for future remittance to the respective taxing authorities.
Allowance for Doubtful Accounts
The Company performs ongoing credit evaluations of customers and grants credit based upon historical payment history, financial condition and industry expectations as available. Determination of the collectability of amounts due from customers requires the Company to use estimates and make judgments regarding future events and trends, including monitoring customers’ payment history and current credit worthiness in order to determine that collectability is reasonably assured. The Company also considers the overall business climate in which its customers operate.
These uncertainties require the Company to make frequent judgments and estimates regarding a customers’ ability to pay amounts due in order to assess and quantify an appropriate allowance for doubtful accounts. The primary factors used to quantify the allowance are customer delinquency, bankruptcy, and the Company’s estimate of its ability to collect outstanding receivables based on the number of days a receivable has been outstanding.
The majority of the Company’s customers operate in the energy industry. The cyclical nature of the industry may affect customers’ operating performance and cash flows, which could impact the Company’s ability to collect on these obligations. Additionally, some customers are located in international areas that are inherently subject to risks of economic, political and civil instability.
The Company continues to monitor the economic climate in which its customers operate and the aging of its accounts receivable. The allowance for doubtful accounts is based on the aging of accounts and an individual assessment of each invoice. At December 31, 2014, the allowance was 1.1% of gross accounts receivable, compared to an allowance of 1.3% a year earlier. While credit losses have historically been within expectations and the provisions established, should actual write-offs differ from estimates, revisions to the allowance would be required.
Inventory Reserves
Inventories consist of raw materials, work-in-process and finished goods and are stated at the lower of cost or market, using the weighted-average cost method. Finished goods inventories include raw materials, direct labor and production overhead. The Company’s inventory reserve represents the excess of the inventory carrying value over the amount expected to be realized from the ultimate sale or other disposal of the inventory.
The Company regularly reviews inventory quantities on hand and records provisions or impairments for excess or obsolete inventory based on the Company’s forecast of product demand, historical usage of inventory on hand, market conditions, production and procurement requirements and technological developments. Significant or unanticipated changes in market conditions or Company forecasts could affect the amount and timing of provisions for excess and obsolete inventory and inventory impairments.
Significant changes have not been made in the methodology used to estimate the reserve for excess and obsolete inventory or impairments during the past three years. Specific assumptions are updated at the date of each evaluation to consider Company experience and current industry trends. Significant judgment is required to predict the potential impact which the current business climate and evolving market conditions could have on the Company’s assumptions. Changes which may occur in the energy industry are hard to predict and they may occur rapidly. To the extent that changes in market conditions result in adjustments to management assumptions, impairment losses could be realized in future periods.
At December 31, 2014, the Company recorded impairments for all inventory items recognized in the allowance for excess and obsolete inventory.
Business Combinations
The Company allocates the fair value of purchase consideration to the assets acquired, liabilities assumed, and any non-controlling interests in the acquired entity generally based on their fair values at the acquisition date. The excess of the fair value of purchase consideration over the fair value of these assets acquired, liabilities assumed and any non-controlling interests in the acquired entity is recorded as goodwill. The primary items that generate goodwill include the value of the synergies between the acquired company and Flotek and the value of the acquired assembled workforce. Acquisition-related expenses are recognized separately from the business acquisition and are recognized as expenses as incurred.
31
The purchase price allocation process requires the management to make significant estimates and assumptions at the acquisition date with the respect to the fair value of:
• | intangible assets acquired from the acquiree; |
• | tax assets and liabilities assumed from the acquiree; |
• | stock awards assumed from the acquiree that are included in the purchase price; and |
• | pre-acquisition obligations and contingencies assumed from the acquiree. |
Although the Company believes the assumptions and estimates it has made in the past have been reasonable and appropriate, they are based in part or historical experience and information obtained from the management of the acquired companies and are inherently uncertain.
Goodwill
Goodwill is not subject to amortization, but is tested for impairment annually during the fourth quarter, or more frequently if an event occurs or circumstances change that would indicate a potential impairment. These circumstances may include, but are not limited to, a significant adverse change in the business climate, unanticipated competition, or a change in projected operations or results of a reporting unit. Goodwill is tested for impairment at a reporting unit level. At December 31, 2014, only three reporting units, Energy Chemical Technologies, Consumer and Industrial Chemical Technologies and Drilling Technologies, have a goodwill balance.
During annual goodwill impairment testing in 2014, 2013 and 2012, the Company first assessed qualitative factors to determine whether it was necessary to perform the two-step goodwill impairment test that the Company has historically used. Based on its qualitative assessment, the Company concluded that there was no indication of the need for an impairment of goodwill as of the fourth quarter of 2014, 2013 or 2012, and therefore no further testing was required.
If impairment testing is required, the Company uses a two-step process. The first step is to compare the estimated fair value of each reporting unit which has goodwill to its carrying amount, including goodwill. To determine fair value estimates, the Company uses the income approach based on discounted cash flow analyses, combined with a market-based approach. The market-based approach considers valuation comparisons of recent public sale transactions of similar businesses and earnings multiples of publicly traded businesses operating in industries consistent with the reporting unit. If the fair value of a reporting unit is less than its carrying value, the second step of the impairment test is performed to determine the amount of impairment, if any. The second step compares the implied fair value of the reporting unit goodwill with the carrying amount of the goodwill. If the carrying amount of the reporting unit’s goodwill exceeds its implied value, an impairment loss is recognized in an amount equal to that excess.
The Company determines fair value using widely accepted valuation techniques, including discounted cash flows and market multiples analyses, and through use of independent fixed asset valuation firms, as appropriate. These types of analyses contain uncertainties as they require management to make assumptions and to apply judgments regarding industry economic factors and the profitability of future business strategies. The Company’s policy is to conduct impairment testing based on current business strategies, taking into consideration current industry and economic conditions, as well as the Company’s future expectations. Key assumptions used in the discounted cash flow valuation model include, among others, discount rates, growth rates, cash flow projections and terminal value rates. Discount rates and cash flow projections are the most sensitive and susceptible to change as they require significant management judgment. Discount rates are determined using a weighted average cost of capital (“WACC”). The WACC considers market and industry data, as well as Company-specific risk factors for each reporting unit in determining the appropriate discount rate to be used. The discount rate utilized for each reporting unit is indicative of the return an investor would expect to receive for investing in a similar business. Management uses industry considerations and Company-specific historical and projected results to develop cash flow projections for each reporting unit. Additionally, as part of the market multiples approach, the Company utilizes market data from publicly traded entities whose businesses operate in industries comparable to the Company’s reporting units, adjusted for certain factors that increase comparability.
The Company cannot predict the occurrence of events or circumstances that could adversely affect the fair value of goodwill. Such events may include, but are not limited to, deterioration of the economic environment, increases in the Company’s weighted average cost of capital, material negative changes in relationships with significant customers, reductions in valuations of other public companies in the Company’s industry, or strategic decisions made in response to economic and competitive conditions. If actual results are not consistent with the Company’s current estimates and assumptions, impairment of goodwill could be required.
32
Long-Lived Assets Other than Goodwill
Long-lived assets other than goodwill consist of property and equipment and intangible assets that have determinable and indefinite lives. The Company makes judgments and estimates regarding the carrying value of these assets, including amounts to be capitalized, depreciation and amortization methods to be applied, estimated useful lives and possible impairments. Property and equipment and intangible assets with determinable lives are tested for impairment whenever events or changes in circumstances indicate the carrying value of the asset may not be recoverable.
For property and equipment, events or circumstances indicating possible impairment may include a significant decrease in market value or a significant change in the business climate. An impairment loss is recognized when the carrying amount of an asset exceeds the estimated undiscounted future cash flows expected to result from the use of the asset and its eventual disposition. The amount of the impairment loss is the excess of the asset’s carrying value over its fair value. Fair value is generally determined using an appraisal by an independent valuation firm or by using a discounted cash flow analysis.
For intangible assets with definite lives, events or circumstances indicating possible impairment may include an adverse change in the extent or manner in which the asset is being used or a change in the assessment of future operations. The Company assesses the recoverability of the carrying amount by preparing estimates of future revenue, margins and cash flows. If the sum of expected future cash flows (undiscounted and without interest charges) is less than the carrying amount, an impairment loss is recognized. The impairment loss recognized is the amount by which the carrying amount exceeds the fair value. Fair value of these assets may be determined by a variety of methodologies, including discounted cash flows.
Intangible assets with indefinite lives are not subject to amortization, but are tested for impairment annually during the fourth quarter, or more frequently if an event occurs or circumstances change that would indicate a potential impairment. These circumstances may include, but are not limited to, a significant adverse change in the business climate, unanticipated competition, or a change in projected operations or results of a reporting unit.
In 2014, while testing annual indefinite lived intangible assets for impairment, the Company first assessed qualitative factors to determine whether it was necessary to perform the impairment test. Based on its qualitative assessment, the Company concluded that there was no indication of the need for an impairment of indefinite lived intangibles as of the fourth quarter of 2014, and therefore no further testing was required.
If impairment testing for the indefinite lived intangible assets is required, the Company then performs the quantitative impairment test. The quantitative impairment test for an indefinite-lived intangible asset consists of a comparison of the fair value of the asset with its carrying amount. If the carrying amount of an intangible asset exceeds its fair value, an impairment loss is recognized in an amount equal to that excess. Fair value of these assets may be determined by a variety of methodologies, including discounted cash flows.
The development of future net undiscounted cash flow projections requires management projections of future sales and profitability trends and the estimation of remaining useful lives of assets. These projections are consistent with those projections the Company uses to internally manage operations. When potential impairment is identified, a discounted cash flow valuation model similar to that used to value goodwill at the reporting unit level, incorporating discount rates commensurate with risks associated with each asset, is used to determine the fair value of the asset in order to measure potential impairment. Discount rates are determined by using a WACC. Estimated revenue and WACC assumptions are the most sensitive and susceptible to change in the long-lived asset analysis as they require significant management judgment. The Company believes the assumptions used are reflective of what a market participant would have used in calculating fair value.
Valuation methodologies utilized to evaluate long-lived assets other than goodwill for impairment were consistent with prior periods. Specific assumptions discussed above are updated at each test date to consider current industry and Company-specific risk factors from the perspective of a market participant. The current business climate is subject to evolving market conditions and requires significant management judgment to interpret the potential impact to the Company’s assumptions. To the extent that changes in the current business climate result in adjustments to management projections, impairment losses may be recognized in future periods.
No impairment was recorded for property and equipment and intangible assets with indefinite or determinable lives during 2014, 2013 and 2012.
Warrant Liability
Prior to June 2012, the Company used the Black-Scholes option-pricing model to estimate the fair value of its warrant liability. On June 14, 2012, provisions in the Company’s outstanding warrants were amended to eliminate anti-dilution price adjustment provisions as well as cash settlement provisions of a change of control event. Upon amendment the warrants met the requirements for classification as equity. All fluctuations in the fair value of the warrant liability prior to June 2012 were recognized as non-
33
cash income or expense items within the Statement of Operations. Historical non-cash fair value accounting methodology for the warrant liability is no longer required due to the contractual amendment.
Fair Value Measurements
Fair value is defined as the amount that would be received for the sale of an asset or paid for the transfer of a liability in an orderly transaction between unrelated third party market participants at the measurement date. In determination of fair value measurements for assets and liabilities the Company considers the principal, or most advantageous market, and assumptions that market participants would use when pricing the asset or liability. The Company categorizes financial assets and liabilities using a three-tiered fair value hierarchy, based upon the nature of the inputs used in the determination of fair value. Inputs refer broadly to the assumptions that market participants would use in pricing an asset or liability and may be observable or unobservable. Significant judgments and estimates are required, particularly when inputs are based on pricing for similar assets or liabilities, pricing in non-active markets or when unobservable inputs are required.
Income Taxes
The Company’s tax provision is subject to judgments and estimates necessitated by the complexity of existing regulatory tax statutes and the effect of these upon the Company due to operations in multiple tax jurisdictions. Income tax expense is based on taxable income, statutory tax rates and tax planning opportunities available in the various jurisdictions in which the Company operates. The Company’s income tax expense will fluctuate from year to year as the amount of pretax income fluctuates. Changes in tax laws, and the Company’s profitability within and across the jurisdictions may impact the Company’s tax liability. While the annual tax provision is based on the best information available to the Company at the time of preparation, several years may elapse before the ultimate tax liabilities are determined.
The Company uses the liability method in accounting for income taxes. Deferred tax assets and liabilities are recognized for temporary differences between financial statement carrying amounts and the tax bases of assets and liabilities, and are measured using the tax rates expected to be in effect when the differences reverse. Deferred tax assets are also recognized for operating loss and tax credit carry forwards. The effect on deferred tax assets and liabilities of a change in tax rates is recognized in the results of operations in the period that includes the enactment date. A valuation allowance is used to reduce deferred tax assets when uncertainty exists regarding their realization.
A valuation allowance is recorded to reduce previously recorded tax assets when it becomes more-likely-than-not such assets will not be realized. The Company evaluates, at least annually, net operating loss carry forwards and other net deferred tax assets and considers all available evidence, both positive and negative, to determine whether, a valuation allowance is necessary relative to net operating loss carry forwards and other net deferred tax assets. In making this determination, the Company considers cumulative losses in recent years as significant negative evidence. The Company considers recent years to mean the current year plus the two preceding years. The Company considers the recent cumulative income or loss position of its filings groups as objectively verifiable evidence for the projection of future income, which consists primarily of determining the average of the pre-tax income of the current and prior two years after adjusting for certain items not indicative of future performance. Based on this analysis, the Company determines whether a valuation allowance is necessary.
In 2009, general economic deterioration and, in particular, a downturn in the oil and gas industry had a negative impact on earnings. The Company incurred losses and, during the three months ended September 30, 2009, it violated certain debt covenants. As a result, the Company disclosed that it might not be able to continue as a going concern if it was unable to secure additional financing and successfully implement corrective actions to remain listed on the NYSE. The Company was unable to project income from future events or the consideration of tax planning strategies. Accordingly, at September 30, 2009, management determined it was appropriate to record a full valuation allowance against its deferred tax assets.
The Company’s tax filing group with net operating loss carryforwards continued to have operating losses during each quarter of 2010. Beginning with the first quarter of 2011, this tax filing group returned to profitability. Profits continued during each subsequent quarter of 2011 and during each quarter of 2012. As of December 31, 2012, this tax filing group was no longer in a cumulative loss position for the most recent 12-quarter period. The calculated average annual income for this 12-quarter period, adjusted for a nonrecurring impairment of fixed assets in 2010, was $3 million. The calculated average annual income was projected for future years in the loss carryforward period. This projection of income and reversing temporary differences demonstrated that the net operating loss would be fully utilized during the carryforward period.
The Company weighed the negative evidence of the existence of a recent cumulative loss more heavily than the positive evidence of a return to profitability during 2011 and 2012. Not being in a cumulative loss position as of December 31, 2012 removed the significant negative evidence. In addition, the tax filing group now had eight consecutive quarters of profitability, and projections of income based on objectively verifiable positive evidence provided additional positive evidence. The Company also considered
34
other factors, including a determination that there were no unsettled circumstances that, if unfavorably resolved, would adversely affect future operations or profit levels in future years and the fact that the Company does not operate in a traditionally cyclical business. Based on the weight of the above positive evidence and a lack of negative evidence, the Company removed the valuation allowance for deferred tax assets of $16.5 million at December 31, 2012 and recognized a reduction of deferred federal income tax expense.
The tax filing group was in a cumulative loss position for the most recent 12-quarter periods ended on March 31, June 30 and September 30, 2012.
The Company periodically identifies and evaluates uncertain tax positions. This process considers the amounts and probability of various outcomes that could be realized upon final settlement. Liabilities for uncertain tax positions are based on a two-step process. The actual benefits ultimately realized may differ from the Company’s estimates. Changes in facts, circumstances, and new information may require a change in recognition and measurement estimates for certain individual tax positions. Any changes in estimates are recorded in results of operations in the period in which the change occurs. At December 31, 2014, the Company performed an evaluation of its various tax positions and concluded that it did not have significant uncertain tax positions requiring disclosure. The Company's policy is to record interest and penalties related to income tax matters as income tax expense.
Share-Based Compensation
The Company has stock-based incentive plans which are authorized to issue stock options, restricted stock and other incentive awards. Stock-based compensation expense for stock options and restricted stock is determined based upon estimated grant-date fair value. This fair value for the stock options is calculated using the Black-Scholes option-pricing model and is recognized as expense over the requisite service period. The option-pricing model requires the input of highly subjective assumptions, including expected stock price volatility and expected option life. For all stock-based incentive plans, the Company estimates an expected forfeiture rate and recognizes expense only for those shares expected to vest. The estimated forfeiture rate is based on historical experience. To the extent actual forfeiture rates differ from the estimate, stock-based compensation expense is adjusted accordingly.
Loss Contingencies
The Company is subject to a variety of loss contingencies that could arise during the Company’s conduct of business. Management considers the likelihood of a loss or the impairment of an asset or the incurrence of a liability, as well as the Company’s ability to reasonably estimate the amount of loss in determining potential loss contingencies. An estimated loss contingency is accrued when it is probable that a liability has been incurred or an asset has been impaired and the amount of loss can be reasonably estimated. Accruals for loss contingencies have not been recorded during the past three years. The Company regularly evaluates current information available to determine whether such accruals should be made or adjusted.
Recent Accounting Pronouncements
Recent accounting pronouncements which may impact the Company are described in Part II, Item 8.—“Financial Statements and Supplementary Data,” Note 2—Summary of Significant Accounting Policies in Notes to Consolidated Financial Statements.
35
Item 7A. Quantitative and Qualitative Disclosures About Market Risk.
The Company is exposed to market risk from changes in interest rates, and to a limited extent, commodity prices and foreign currency exchange rates. Market risk is measured as the potential negative impact on earnings, cash flows or fair values resulting from a hypothetical change in interest rates, commodity prices or foreign currency exchange rates over the next year. The Company manages exposure to market risks at the corporate level. The portfolio of interest-sensitive assets and liabilities is monitored and adjusted to provide liquidity necessary to satisfy anticipated short-term needs. The Company’s risk management policies allow the use of specified financial instruments for hedging purposes only. Speculation on interest rates or foreign currency rates is not permitted. The Company does not consider any of these risk management activities to be material.
Interest Rate Risk
The Company is exposed to the impact of interest rate changes on any outstanding indebtedness under the revolving credit facility agreement and the term loan agreement both of which have a variable interest rate. The interest rate on advances under the revolving credit facility varies based on the level of borrowing under the revolving credit facility. Rates range (a) between PNC Bank's base lending rate plus 0.5% to 1.0% or (b) between the London Interbank Offered Rate (LIBOR) plus 1.5% to 2.0%. PNC Bank's base lending rate was 3.25% at December 31, 2014 and would have permitted borrowing at rates ranging between 3.75% and 4.25%. The Company is required to pay a monthly facility fee of 0.25% on any unused amount under the commitment based on daily averages. At December 31, 2014, $8.5 million was outstanding under the revolving credit facility as base rate loans at an interest rate of 3.75%.
The Company increased borrowing to $50.0 million under the term loan on May 10, 2013. Monthly principal payments of $0.6 million are required. The unpaid balance of the term loan is due May 10, 2018. The interest rate on the term loan varies based on the level of borrowing under the revolving credit facility. Rates range (a) between PNC Bank's base lending rate plus 1.25% to 1.75% or (b) between the London Interbank Offered Rate (LIBOR) plus 2.25% to 2.75%. At December 31, 2014, $35.5 million was outstanding under the term loan, with $0.5 million borrowed as base rate loans at an interest rate of 4.50% and $35.0 million borrowed as LIBOR loans at an interest rate of 2.41%.
Foreign Currency Exchange Risk
The Company presently has limited exposure to foreign currency risk. During 2014, less than 1% of revenue was demarcated in non-US dollar currencies, and virtually all assets and liabilities of the Company are denominated in US dollars. However, as the Company expands its international operations, non-US denominated activity is likely to increase. The Company has historically performed no swaps and no foreign currency hedges. The Company may utilize swaps or foreign currency hedges in the future.
Commodity Risk
The Company is one of the largest processors of citrus oils in the world, and therefore has a commodity risk inherent in orange harvests. In recent years, citrus greening has disrupted citrus fruit production in Florida and Brazil which caused raw material feedstock cost to increase. The Company believes that adequate global supply is available to meet the Company’s needs and the needs of general chemistry markets at this time. The Company relies upon diverse, long-term strategic supply relationships to meet its raw material needs which are expected to remain in place for the foreseeable future. Price increases have been passed along to the Company's customers. The Company presently does not have any futures contracts and it does not plan to utilize these in the foreseeable future.
36
Item 8. Financial Statements and Supplementary Data.
REPORT OF INDEPENDENT REGISTERED PUBLIC ACCOUNTING FIRM
To the Board of Directors and Stockholders
Flotek Industries, Inc.
We have audited Flotek Industries, Inc.’s internal control over financial reporting as of December 31, 2014, based on criteria established in Internal Control-Integrated Framework issued by the Committee of Sponsoring Organizations of the Treadway Commission in 2013. Flotek Industries, Inc.’s management is responsible for maintaining effective internal control over financial reporting and for its assessment of the effectiveness of internal control over financial reporting included in the accompanying Management’s Report on Internal Control Over Financial Reporting. Our responsibility is to express an opinion on the company’s internal control over financial reporting based on our audit.
We conducted our audit in accordance with the standards of the Public Company Accounting Oversight Board (United States). Those standards require that we plan and perform the audit to obtain reasonable assurance about whether effective internal control over financial reporting was maintained in all material respects. Our audit included obtaining an understanding of internal control over financial reporting, assessing the risk that a material weakness exists, and testing and evaluating the design and operating effectiveness of internal control based on the assessed risk. Our audit also included performing such other procedures as we considered necessary in the circumstances. We believe that our audit provides a reasonable basis for our opinion.
A company’s internal control over financial reporting is a process designed to provide reasonable assurance regarding the reliability of financial reporting and the preparation of financial statements for external purposes in accordance with generally accepted accounting principles. A company’s internal control over financial reporting includes those policies and procedures that (a) pertain to the maintenance of records that, in reasonable detail, accurately and fairly reflect the transactions and dispositions of the assets of the company; (b) provide reasonable assurance that transactions are recorded as necessary to permit preparation of financial statements in accordance with generally accepted accounting principles, and that receipts and expenditures of the company are being made only in accordance with authorizations of management and directors of the company; and (c) provide reasonable assurance regarding prevention or timely detection of unauthorized acquisition, use, or disposition of the company’s assets that could have a material effect on the financial statements.
Because of its inherent limitations, internal control over financial reporting may not prevent or detect misstatements. Also, projections of any evaluation of effectiveness to future periods are subject to the risk that controls may become inadequate because of changes in conditions, or that the degree of compliance with the policies or procedures may deteriorate.
In our opinion, Flotek Industries, Inc. maintained in all material respects, effective internal control over financial reporting as of December 31, 2014, based on criteria established in Internal Control-Integrated Framework issued by the Committee of Sponsoring Organizations of the Treadway Commission in 2013.
We have also audited, in accordance with the standards of the Public Company Accounting Oversight Board (United States), the consolidated balance sheets of Flotek Industries, Inc. and subsidiaries as of December 31, 2014 and 2013, and the related consolidated statements of operations, comprehensive income, equity and cash flows for each of the three years in the period ended December 31, 2014, and our report dated January 27, 2015 expressed an unqualified opinion.
/s/ HEIN & ASSOCIATES LLP
Houston, Texas
January 27, 2015
37
REPORT OF INDEPENDENT REGISTERED PUBLIC ACCOUNTING FIRM
To the Board of Directors and Stockholders
Flotek Industries, Inc.
We have audited the accompanying consolidated balance sheets of Flotek Industries, Inc. and subsidiaries as of December 31, 2014 and 2013, and the related consolidated statements of operations, comprehensive income, equity and cash flows for each of the three years in the period ended December 31, 2014. These financial statements are the responsibility of the company’s management. Our responsibility is to express an opinion on these financial statements based on our audits.
We conducted our audits in accordance with the standards of the Public Company Accounting Oversight Board (United States). Those standards require that we plan and perform the audit to obtain reasonable assurance about whether the financial statements are free of material misstatement. An audit includes examining, on a test basis, evidence supporting the amounts and disclosures in the financial statements. An audit also includes assessing the accounting principles used and significant estimates made by management, as well as evaluating the overall financial statement presentation. We believe that our audits provide a reasonable basis for our opinion.
In our opinion, the consolidated financial statements referred to above present fairly, in all material respects, the financial position of Flotek Industries, Inc. and subsidiaries as of December 31, 2014 and 2013, and the results of their operations and their cash flows for each of the three years in the period ended December 31, 2014, in conformity with U.S. generally accepted accounting principles.
We have also audited, in accordance with the standards of the Public Company Accounting Oversight Board (United States), Flotek Industries, Inc. and subsidiaries’ internal control over financial reporting as of December 31, 2014, based on criteria established in Internal Control-Integrated Framework issued by the Committee of Sponsoring Organizations of the Treadway Commission in 2013, and our report dated January 27, 2015 expressed an unqualified opinion on the effectiveness of Flotek Industries, Inc.’s internal control over financial reporting.
/s/ HEIN & ASSOCIATES LLP
Houston, Texas
January 27, 2015
38
FLOTEK INDUSTRIES, INC.
CONSOLIDATED BALANCE SHEETS
(in thousands, except share data)
December 31, | |||||||
2014 | 2013 | ||||||
ASSETS | |||||||
Current assets: | |||||||
Cash and cash equivalents | $ | 1,266 | $ | 2,730 | |||
Accounts receivable, net of allowance for doubtful accounts of $847 and $872 at December 31, 2014 and 2013, respectively | 78,624 | 65,016 | |||||
Inventories, net | 85,958 | 63,132 | |||||
Deferred tax assets, net | 2,696 | 2,522 | |||||
Other current assets | 11,055 | 4,261 | |||||
Total current assets | 179,599 | 137,661 | |||||
Property and equipment, net | 86,111 | 79,114 | |||||
Goodwill | 71,131 | 66,271 | |||||
Deferred tax assets, net | 12,907 | 15,012 | |||||
Other intangible assets, net | 73,528 | 77,523 | |||||
TOTAL ASSETS | $ | 423,276 | $ | 375,581 | |||
LIABILITIES AND EQUITY | |||||||
Current liabilities: | |||||||
Accounts payable | $ | 33,185 | $ | 19,899 | |||
Accrued liabilities | 12,314 | 12,778 | |||||
Income taxes payable | 1,307 | 3,361 | |||||
Interest payable | 93 | 111 | |||||
Current portion of long-term debt | 18,643 | 26,415 | |||||
Total current liabilities | 65,542 | 62,564 | |||||
Long-term debt, less current portion | 25,398 | 35,690 | |||||
Deferred tax liabilities, net | 25,982 | 27,575 | |||||
Total liabilities | 116,922 | 125,829 | |||||
Commitments and contingencies | |||||||
Equity: | |||||||
Cumulative convertible preferred stock, $0.0001 par value, 100,000 shares authorized; no shares issued and outstanding | — | — | |||||
Common stock, $0.0001 par value, 80,000,000 shares authorized; 54,633,726 shares issued and 53,357,811 shares outstanding at December 31, 2014; 58,265,911 shares issued and 51,804,078 shares outstanding at December 31, 2013 | 5 | 6 | |||||
Additional paid-in capital | 254,233 | 266,122 | |||||
Accumulated other comprehensive income (loss) | (502 | ) | (359 | ) | |||
Retained earnings (accumulated deficit) | 52,762 | (841 | ) | ||||
Treasury stock, at cost; 449,397 and 5,394,178 shares at December 31, 2014 and 2013, respectively | (495 | ) | (15,176 | ) | |||
Flotek Industries, Inc. stockholders' equity | 306,003 | 249,752 | |||||
Noncontrolling interests | 351 | — | |||||
Total equity | 306,354 | 249,752 | |||||
TOTAL LIABILITIES AND EQUITY | $ | 423,276 | $ | 375,581 | |||
See accompanying Notes to Consolidated Financial Statements.
39
FLOTEK INDUSTRIES, INC.
CONSOLIDATED STATEMENTS OF OPERATIONS
(in thousands, except per share data)
Year ended December 31, | |||||||||||
2014 | 2013 | 2012 | |||||||||
Revenue | $ | 449,157 | $ | 371,065 | $ | 312,828 | |||||
Cost of revenue | 266,198 | 223,538 | 181,209 | ||||||||
Gross margin | 182,959 | 147,527 | 131,619 | ||||||||
Expenses: | |||||||||||
Selling, general and administrative | 87,146 | 78,197 | 66,415 | ||||||||
Depreciation and amortization | 9,738 | 7,273 | 4,410 | ||||||||
Research and development | 4,976 | 3,752 | 3,182 | ||||||||
Loss (gain) on disposal of long-lived assets | 211 | (421 | ) | (1,009 | ) | ||||||
Total expenses | 102,071 | 88,801 | 72,998 | ||||||||
Income from operations | 80,888 | 58,726 | 58,621 | ||||||||
Other income (expense): | |||||||||||
Loss on extinguishment of debt | — | — | (7,257 | ) | |||||||
Change in fair value of warrant liability | — | — | 2,649 | ||||||||
Interest expense | (1,610 | ) | (2,092 | ) | (8,103 | ) | |||||
Other income (expense), net | (394 | ) | 316 | (452 | ) | ||||||
Total other income (expense) | (2,004 | ) | (1,776 | ) | (13,163 | ) | |||||
Income before income taxes | 78,884 | 56,950 | 45,458 | ||||||||
Income tax (expense) benefit | (25,281 | ) | (20,772 | ) | 4,333 | ||||||
Net income | $ | 53,603 | $ | 36,178 | $ | 49,791 | |||||
Earnings per common share: | |||||||||||
Basic earnings per common share | $ | 0.98 | $ | 0.70 | $ | 1.03 | |||||
Diluted earnings per common share | $ | 0.97 | $ | 0.67 | $ | 0.97 | |||||
Weighted average common shares: | |||||||||||
Weighted average common shares used in computing basic earnings per common share | 54,511 | 51,346 | 48,185 | ||||||||
Weighted average common shares used in computing diluted earnings per common share | 55,526 | 53,841 | 53,554 | ||||||||
See accompanying Notes to Consolidated Financial Statements.
40
FLOTEK INDUSTRIES, INC.
CONSOLIDATED STATEMENTS OF COMPREHENSIVE INCOME
(in thousands)
Year ended December 31, | |||||||||||
2014 | 2013 | 2012 | |||||||||
Net income | $ | 53,603 | $ | 36,178 | $ | 49,791 | |||||
Other comprehensive income (loss): | |||||||||||
Foreign currency translation adjustment | (143 | ) | (319 | ) | 4 | ||||||
Comprehensive income | $ | 53,460 | $ | 35,859 | $ | 49,795 | |||||
See accompanying Notes to Consolidated Financial Statements.
41
FLOTEK INDUSTRIES, INC.
CONSOLIDATED STATEMENTS OF EQUITY
(in thousands)
Common Stock | Treasury Stock | Additional Paid-in Capital | Accumulated Other Comprehensive Income (Loss) | Retained Earnings (Accumulated Deficit) | Non-controlling Interests | Total Equity | |||||||||||||||||||||||||||
Shares Issued | Par Value | Shares | Cost | ||||||||||||||||||||||||||||||
Balance, December 31, 2011 | 51,958 | $ | 5 | 1,358 | $ | (1,667 | ) | $ | 166,814 | $ | (44 | ) | $ | (86,810 | ) | $ | — | $ | 78,298 | ||||||||||||||
Net income | — | — | — | — | — | — | 49,791 | — | 49,791 | ||||||||||||||||||||||||
Foreign currency translation adjustment | — | — | — | — | — | 4 | — | — | 4 | ||||||||||||||||||||||||
Fair value of warrant liability reclassified to additional paid-in capital | — | — | — | — | 13,973 | — | — | — | 13,973 | ||||||||||||||||||||||||
Stock issued under employee stock purchase plan | — | — | (15 | ) | — | 161 | — | — | — | 161 | |||||||||||||||||||||||
Stock warrants exercised | 348 | — | — | — | 421 | — | — | — | 421 | ||||||||||||||||||||||||
Stock options exercised | 68 | — | — | — | 167 | — | — | — | 167 | ||||||||||||||||||||||||
Restricted stock granted | 750 | — | — | — | — | — | — | — | — | ||||||||||||||||||||||||
Restricted stock forfeited | — | — | 30 | — | — | — | — | — | — | ||||||||||||||||||||||||
Treasury stock purchased | — | — | 166 | (2,034 | ) | — | — | — | — | (2,034 | ) | ||||||||||||||||||||||
Excess tax benefit related to share-based awards | — | — | — | — | 528 | — | — | — | 528 | ||||||||||||||||||||||||
Stock compensation expense | — | — | — | — | 13,421 | — | — | — | 13,421 | ||||||||||||||||||||||||
Return of borrowed shares under share lending agreement | — | — | 659 | — | — | — | — | — | — | ||||||||||||||||||||||||
Balance, December 31, 2012 | 53,124 | $ | 5 | 2,198 | $ | (3,701 | ) | $ | 195,485 | $ | (40 | ) | $ | (37,019 | ) | $ | — | $ | 154,730 | ||||||||||||||
Net income | — | — | — | — | — | — | 36,178 | — | 36,178 | ||||||||||||||||||||||||
Foreign currency translation adjustment | — | — | — | — | — | (319 | ) | — | — | (319 | ) | ||||||||||||||||||||||
Issuance cost of preferred stock and detachable warrants | — | — | — | — | (200 | ) | — | — | — | (200 | ) | ||||||||||||||||||||||
Stock issued under employee stock purchase plan | — | — | (44 | ) | — | 824 | — | — | — | 824 | |||||||||||||||||||||||
Stock warrants exercised | 267 | — | — | — | 323 | — | — | — | 323 | ||||||||||||||||||||||||
Stock options exercised | 572 | — | — | — | 4,397 | — | — | — | 4,397 | ||||||||||||||||||||||||
Restricted stock granted | 802 | — | — | — | — | — | — | — | — | ||||||||||||||||||||||||
Restricted stock forfeited | — | — | 115 | — | — | — | — | — | — | ||||||||||||||||||||||||
Stock granted in incentive performance plan | 217 | — | — | — | — | — | — | — | — | ||||||||||||||||||||||||
Treasury stock purchased | — | — | 448 | (7,568 | ) | — | — | — | — | (7,568 | ) | ||||||||||||||||||||||
Excess tax benefit related to share-based awards | — | — | — | — | 1,668 | — | — | — | 1,668 | ||||||||||||||||||||||||
Stock surrendered for exercise of stock options | — | — | 237 | (3,907 | ) | — | — | — | — | (3,907 | ) | ||||||||||||||||||||||
Stock compensation expense | — | — | — | — | 10,914 | — | — | — | 10,914 | ||||||||||||||||||||||||
Stock issued in Florida Chemical Company acquisition | 3,284 | 1 | — | — | 52,711 | — | — | — | 52,712 | ||||||||||||||||||||||||
Return of borrowed shares under share lending agreement | — | — | 2,440 | — | — | — | — | — | — | ||||||||||||||||||||||||
Balance, December 31, 2013 | 58,266 | $ | 6 | 5,394 | $ | (15,176 | ) | $ | 266,122 | $ | (359 | ) | $ | (841 | ) | $ | — | $ | 249,752 | ||||||||||||||
Net income | — | — | — | — | — | — | 53,603 | — | 53,603 | ||||||||||||||||||||||||
Foreign currency translation adjustment | — | — | — | — | — | (143 | ) | — | — | (143 | ) | ||||||||||||||||||||||
Stock issued under employee stock purchase plan | — | — | (43 | ) | — | 906 | — | — | — | 906 | |||||||||||||||||||||||
Common stock issued in payment of accrued liability | 27 | — | — | — | 600 | — | — | — | 600 | ||||||||||||||||||||||||
Stock warrants exercised | 1,277 | — | — | — | 1,545 | — | — | — | 1,545 | ||||||||||||||||||||||||
Stock options exercised | 312 | — | — | — | 1,660 | — | — | — | 1,660 | ||||||||||||||||||||||||
Restricted stock granted | 526 | — | — | — | — | — | — | — | — | ||||||||||||||||||||||||
Restricted stock forfeited | — | — | 61 | — | — | — | — | — | — | ||||||||||||||||||||||||
Stock granted in incentive performance plan | — | — | — | — | — | — | — | — | — | ||||||||||||||||||||||||
Treasury stock purchased | — | — | 243 | (6,294 | ) | — | — | — | — | (6,294 | ) | ||||||||||||||||||||||
Stock surrendered for exercise of stock options | — | — | 46 | (1,198 | ) | — | — | — | — | (1,198 | ) | ||||||||||||||||||||||
Excess tax benefit related to share-based awards | — | — | — | — | 3,448 | — | — | — | 3,448 | ||||||||||||||||||||||||
Stock compensation expense | — | — | — | — | 10,476 | — | — | — | 10,476 | ||||||||||||||||||||||||
Investment in Flotek Gulf, LLC and Flotek Gulf Research, LLC | — | — | — | — | — | — | — | 351 | 351 | ||||||||||||||||||||||||
Stock issued in EOGA acquisition | 94 | — | — | — | 1,894 | — | — | — | 1,894 | ||||||||||||||||||||||||
Stock issued in SiteLark acquisition | 5 | — | — | — | 149 | — | — | — | 149 | ||||||||||||||||||||||||
Repurchase of Common Stock | — | — | 621 | (10,395 | ) | — | — | — | — | (10,395 | ) | ||||||||||||||||||||||
Retirement of Treasury Stock | (5,873 | ) | (1 | ) | (5,873 | ) | 32,568 | (32,567 | ) | — | — | — | — | ||||||||||||||||||||
Balance, December 31, 2014 | 54,634 | $ | 5 | 449 | $ | (495 | ) | $ | 254,233 | $ | (502 | ) | $ | 52,762 | $ | 351 | $ | 306,354 | |||||||||||||||
See accompanying Notes to Consolidated Financial Statements.
42
FLOTEK INDUSTRIES, INC.
CONSOLIDATED STATEMENTS OF CASH FLOWS
(in thousands)
Year ended December 31, | |||||||||||
2014 | 2013 | 2012 | |||||||||
Cash flows from operating activities: | |||||||||||
Net income | $ | 53,603 | $ | 36,178 | $ | 49,791 | |||||
Adjustments to reconcile net income to net cash provided by operating activities: | |||||||||||
Change in fair value of warrant liability | — | — | (2,649 | ) | |||||||
Depreciation and amortization | 17,848 | 15,109 | 11,583 | ||||||||
Amortization of deferred financing costs | 343 | 169 | 946 | ||||||||
Accretion of debt discount | — | 55 | 3,710 | ||||||||
Provision for doubtful accounts | 481 | 570 | 512 | ||||||||
Provision for inventory reserves and market adjustments | 358 | 1,330 | 2,079 | ||||||||
Gain on sale of assets | (3,407 | ) | (4,565 | ) | (4,819 | ) | |||||
Stock compensation expense | 10,476 | 10,914 | 13,421 | ||||||||
Deferred income tax provision (benefit) | 1,502 | 793 | (18,746 | ) | |||||||
Excess in tax benefit related to share-based awards | (3,448 | ) | (1,668 | ) | (528 | ) | |||||
Non-cash loss on extinguishment of debt | — | — | 4,841 | ||||||||
Changes in current assets and liabilities: | |||||||||||
Restricted cash | — | 150 | — | ||||||||
Accounts receivable | (13,749 | ) | (9,862 | ) | 1,796 | ||||||
Inventories | (23,096 | ) | 4,523 | (9,368 | ) | ||||||
Other current assets | (6,388 | ) | 936 | (2,073 | ) | ||||||
Accounts payable | 13,147 | (21,326 | ) | 2,527 | |||||||
Accrued liabilities | (224 | ) | 4,053 | (1,894 | ) | ||||||
Income taxes payable | 1,394 | 2,194 | 369 | ||||||||
Interest payable | (18 | ) | (5 | ) | (1,983 | ) | |||||
Net cash provided by operating activities | 48,822 | 39,548 | 49,515 | ||||||||
Cash flows from investing activities: | |||||||||||
Capital expenditures | (19,907 | ) | (15,007 | ) | (20,701 | ) | |||||
Proceeds from sale of assets | 4,639 | 5,788 | 5,521 | ||||||||
Payments for acquisitions, net of cash acquired | (5,704 | ) | (53,396 | ) | — | ||||||
Purchase of patents and other intangible assets | (731 | ) | (85 | ) | (20 | ) | |||||
Net cash used in investing activities | (21,703 | ) | (62,700 | ) | (15,200 | ) | |||||
Cash flows from financing activities: | |||||||||||
Repayments of indebtedness | (10,292 | ) | (13,206 | ) | (102,438 | ) | |||||
Proceeds from borrowings | — | 26,190 | 25,000 | ||||||||
Borrowings on revolving credit facility | 357,183 | 313,396 | — | ||||||||
Repayments on revolving credit facility | (364,955 | ) | (297,124 | ) | — | ||||||
Debt issuance costs | (399 | ) | (1,293 | ) | (106 | ) | |||||
Issuance costs of preferred stock and detachable warrants | — | (200 | ) | — | |||||||
Excess tax benefit related to share-based awards | 3,448 | 1,668 | 528 | ||||||||
Purchase of treasury stock | (6,294 | ) | (7,568 | ) | (2,034 | ) | |||||
Proceeds from sale of common stock | 906 | 824 | 161 | ||||||||
Repurchase of common stock | (10,395 | ) | — | — | |||||||
Proceeds from exercise of stock options | 462 | 491 | 167 | ||||||||
Proceeds from exercise of warrants | 1,545 | 323 | 421 | ||||||||
Proceeds from noncontrolling interest | 351 | — | — | ||||||||
Net cash (used in) provided by financing activities | (28,440 | ) | 23,501 | (78,301 | ) | ||||||
Effect of changes in exchange rates on cash and cash equivalents | (143 | ) | (319 | ) | 4 | ||||||
Net (decrease) increase in cash and cash equivalents | (1,464 | ) | 30 | (43,982 | ) | ||||||
Cash and cash equivalents at beginning of year | 2,730 | 2,700 | 46,682 | ||||||||
Cash and cash equivalents at end of year | $ | 1,266 | $ | 2,730 | $ | 2,700 | |||||
See accompanying Notes to Consolidated Financial Statements.
43
FLOTEK INDUSTRIES, INC.
NOTES TO CONSOLIDATED FINANCIAL STATEMENTS
Note 1 — Organization and Nature of Operations
Flotek Industries, Inc. (“Flotek” or the “Company”) is a global, diversified, technology-driven supplier of energy chemicals and consumer and industrial chemicals and is a global developer and supplier of drilling, completion and production technologies and related services.
Flotek's strategic focus, and that of its diversified subsidiaries (collectively referred to as the “Company”), includes energy related chemical technologies, drilling and production technologies, and consumer and industrial chemical technologies. Within energy technologies, the Company provides oilfield specialty chemicals and logistics, down-hole drilling tools and production related tools used in the energy and mining industries. Flotek's products and services enable customers to drill wells more efficiently, to realize increased production from both new and existing wells and to decrease future well operating costs. Major customers include leading oilfield service providers, pressure-pumping service companies, onshore and offshore drilling contractors, and major and independent oil and gas exploration and production companies. Within consumer and industrial chemical technologies, the Company provides products for the flavor and fragrance industry and the industrial chemical industry. Major customers include food and beverage companies, fragrance companies, and companies providing household and industrial cleaning products.
The Company is headquartered in Houston, Texas, with operating locations in Colorado, Florida, Louisiana, New Mexico, North Dakota, Oklahoma, Pennsylvania, Texas, Utah, Wyoming, Canada, the Netherlands and the Middle East. Flotek’s products are marketed both domestically and internationally, with international presence and/or initiatives in over 20 countries.
Flotek was initially incorporated under the laws of the Province of British Columbia on May 17, 1985. On October 23, 2001, Flotek changed its corporate domicile to the state of Delaware.
Note 2 — Summary of Significant Accounting Policies
Basis of Presentation
The Company’s consolidated financial statements have been prepared in accordance with the accounting principles generally accepted in the United States of America ("GAAP”).
The consolidated financial statements include the accounts of Flotek Industries, Inc. and all wholly-owned subsidiary corporations. Where Flotek owns less than 100% of the share capital of its subsidiaries, but is still considered to have sufficient ownership to control the business, results of the business operations are consolidated within the Company's financial statements. The ownership interests held by other parties are shown as noncontrolling interests.
All significant intercompany accounts and transactions have been eliminated in consolidation. The Company does not have investments in any unconsolidated subsidiaries.
Cash Equivalents
Cash equivalents consist of highly liquid investments with maturities of three months or less at the date of purchase.
Cash Management
The Company uses a controlled disbursement account for its main cash account. Under this system, outstanding checks can be in excess of the cash balances at the bank before the disbursement account is funded, creating a book overdraft. Book overdrafts on this account are presented as a current liability in accounts payable in the consolidated balance sheets.
Accounts Receivable and Allowance for Doubtful Accounts
Accounts receivable arise from product sales, product rentals and services and are stated at estimated net realizable value. This value incorporates an allowance for doubtful accounts to reflect any loss anticipated on accounts receivable balances. The Company regularly evaluates its accounts receivable to estimate amounts that will not be collected and records the appropriate provision for doubtful accounts as a charge to operating expenses. The allowance for doubtful accounts is based on a combination of the age of the receivables, individual customer circumstances, credit conditions and historical write-offs and collections. The Company writes off specific accounts receivable when they are determined to be uncollectible.
The majority of the Company’s customers are engaged in the energy industry. The cyclical nature of the energy industry may affect customers’ operating performance and cash flows, which directly impact the Company’s ability to collect on outstanding obligations. Additionally, certain customers are located in international areas that are inherently subject to risks of economic, political and civil instability, which can impact the collectability of receivables.
44
FLOTEK INDUSTRIES, INC.
NOTES TO CONSOLIDATED FINANCIAL STATEMENTS
Changes in the allowance for doubtful accounts are as follows (in thousands):
Year ended December 31, | |||||||||||
2014 | 2013 | 2012 | |||||||||
Balance, beginning of year | $ | 872 | $ | 714 | $ | 571 | |||||
Charged to provision for doubtful accounts | 481 | 570 | 512 | ||||||||
Write-offs | (506 | ) | (412 | ) | (369 | ) | |||||
Balance, end of year | $ | 847 | $ | 872 | $ | 714 | |||||
Inventories
Inventories consist of raw materials, work-in-process and finished goods and are stated at the lower of cost, determined using the weighted-average cost method, or market. Finished goods inventories include raw materials, direct labor and production overhead. The Company regularly reviews inventories on hand and current market conditions to determine if the cost of finished goods inventories exceed current market prices and impairs the cost basis of the inventory accordingly. Historically, the Company recorded a provision for excess and obsolete inventory. Impairment or provisions are based primarily on forecasts of product demand, historical trends, market conditions, production or procurement requirements and technological developments and advancements.
Property and Equipment
Property and equipment are stated at cost. The cost of ordinary maintenance and repair is charged to operating expense, while replacement of critical components and major improvements are capitalized. Depreciation or amortization of property and equipment, including assets held under capital leases, is calculated using the straight-line method over the asset’s estimated useful life as follows:
Buildings and leasehold | |
improvements | 2-30 years |
Machinery, equipment and rental | |
tools | 7-10 years |
Furniture and fixtures | 3 years |
Transportation equipment | 2-5 years |
Computer equipment and software | 3-7 years |
Property and equipment are reviewed for impairment on an annual basis or whenever events or changes in circumstances indicate the carrying value of an asset or asset group may not be recoverable. Indicative events or circumstances include, but are not limited to, matters such as a significant decline in market value or a significant change in business climate. An impairment loss is recognized when the carrying value of an asset exceeds the estimated undiscounted future cash flows from the use of the asset and its eventual disposition. The amount of impairment loss recognized is the excess of the asset’s carrying value over its fair value. Assets to be disposed of are reported at the lower of the carrying value or the fair value less cost to sell. Upon sale or other disposition of an asset, the Company recognizes a gain or loss on disposal measured as the difference between the net carrying value of the asset and the net proceeds received.
Internal Use Computer Software Costs
Direct costs incurred to purchase and develop computer software for internal use are capitalized during the application development and implementation stages. These software costs have been for enterprise-level business and finance software that is customized to meet the Company’s specific operational needs. Capitalized costs are included in property and equipment and are amortized on a straight-line basis over the estimated useful life of the software beginning when the software project is substantially complete and placed in service. Costs incurred during the preliminary project stage and costs for training, data conversion and maintenance are expensed as incurred.
45
FLOTEK INDUSTRIES, INC.
NOTES TO CONSOLIDATED FINANCIAL STATEMENTS
The Company amortizes software costs using the straight-line method over the expected life of the software, generally 3 to 7 years. The unamortized amount of capitalized software was $4.1 million at December 31, 2014.
Goodwill
Goodwill is the excess of cost of an acquired entity over the amounts assigned to identifiable assets acquired and liabilities assumed in a business combination. Goodwill is not subject to amortization, but is tested for impairment annually during the fourth quarter, or more frequently if an event occurs or circumstances change that would indicate a potential impairment. These circumstances may include an adverse change in the business climate or a change in the assessment of future operations of a reporting unit.
The Company assesses whether a goodwill impairment exists using both qualitative and quantitative assessments. The qualitative assessment involves determining whether events or circumstances exist that indicate it is more likely than not that the fair value of a reporting unit is less than its carrying amount, including goodwill. If, based on this qualitative assessment, it is determined that it is not more likely than not that the fair value of a reporting unit is less than its carrying amount, the Company does not perform a quantitative assessment.
If the qualitative assessment indicates that it is more likely than not that the fair value of a reporting unit is less than its carrying amount or if the Company elects not to perform a qualitative assessment, a quantitative assessment or two-step impairment test is performed to determine whether goodwill impairment exists at the reporting unit.
The first step is to compare the estimated fair value of each reporting unit with goodwill to its carrying amount, including goodwill. To determine fair value estimates, the Company uses the income approach based on discounted cash flow analyses, combined with a market-based approach. The market-based approach considers valuation comparisons of recent public sale transactions of similar businesses and earnings multiples of publicly traded businesses operating in industries consistent with the reporting unit. If the fair value of a reporting unit is less than its carrying amount, the second step of the impairment test is performed to determine the amount of impairment loss, if any. The second step compares the implied fair value of the reporting unit goodwill with the carrying amount of that goodwill. If the carrying amount of the reporting unit’s goodwill exceeds its implied fair value, an impairment loss is recognized in an amount equal to that excess.
Other Intangible Assets
The Company’s other intangible assets have finite and indefinite lives and consist of customer relationships, trademarks and brand names and purchased patents.
The cost of intangible assets with finite lives is amortized using the straight-line method over the estimated period of economic benefit, ranging from 2 to 20 years. Asset lives are adjusted whenever there is a change in the estimated period of economic benefit. No residual value has been assigned to these intangible assets.
Intangible assets with finite lives are tested for impairment whenever events or changes in circumstances indicate the carrying value may not be recoverable. These conditions may include a change in the extent or manner in which the asset is being used or a change in future operations. The Company assesses the recoverability of the carrying amount by preparing estimates of future revenue, margins and cash flows. If the sum of expected future cash flows (undiscounted and without interest charges) is less than the carrying amount, an impairment loss is recognized. The impairment loss recognized is the amount by which the carrying amount exceeds the fair value. Fair value of these assets may be determined by a variety of methodologies, including discounted cash flow models.
Intangible assets with indefinite lives are not subject to amortization, but are tested for impairment annually during the fourth quarter, or more frequently if an event occurs or circumstances change that would indicate a potential impairment. These circumstances may include, but are not limited to, a significant adverse change in the business climate, unanticipated competition, or a change in projected operations or results of a reporting unit.
The Company assesses whether an indefinite lived intangible impairment exists using both qualitative and quantitative assessments. The qualitative assessment involves determining whether events or circumstances exist that indicate it is more likely than not that the fair value of the indefinite lived intangible is less than its carrying amount. If, based on this qualitative assessment, it is determined that it is not more likely than not that the fair value of the indefinite lived intangible is less than its carrying amount, the Company does not perform a quantitative assessment.
46
FLOTEK INDUSTRIES, INC.
NOTES TO CONSOLIDATED FINANCIAL STATEMENTS
If the qualitative assessment indicates that it is more likely than not that the indefinite-lived intangible asset is impaired or if the Company elects to not perform a qualitative assessment, the Company then performs the quantitative impairment test. The quantitative impairment test for an indefinite-lived intangible asset consists of a comparison of the fair value of the asset with its carrying amount. If the carrying amount of an intangible asset exceeds its fair value, an impairment loss is recognized in an amount equal to that excess. Fair value of these assets may be determined by a variety of methodologies, including discounted cash flows.
Warrant Liability
Prior to June 2012, the Company used the Black-Scholes option-pricing model to estimate the fair value of its warrant liability. On June 14, 2012, provisions in the Company’s outstanding warrants were amended to eliminate anti-dilution price adjustment provisions and remove cash settlement provisions in the event of a change of control. Upon amendment, the warrants met the requirements for classification as equity. All fluctuations in the fair value of the warrant liability prior to June 2012 were recognized as non-cash income or expense items within the statement of operations. The fair value accounting methodology for the warrant liability is no longer required.
Business Combinations
The Company includes the results of operations of its acquisitions in its consolidated results, prospectively from the date of acquisition. Acquisitions are accounted for by applying the acquisitions method. The Company allocates the fair value of purchase consideration to the assets acquired, liabilities assumed, and any non-controlling interests in the acquired entity generally based on their fair values at the acquisition date. The excess of the fair value of purchase consideration over the fair value of these assets acquired, liabilities assumed and any non-controlling interests in the acquired entity is recorded as goodwill. The primary items that generate goodwill include the value of the synergies between the acquired company and Flotek and the value of the acquired assembled workforce. Acquisition-related expenses are recognized separately from the business acquisition and are recognized as expenses as incurred.
Fair Value Measurements
The Company categorizes financial assets and liabilities using a three-tier fair value hierarchy, based on the nature of the inputs used to determine fair value. Inputs refer broadly to assumptions market participants would use to value an asset or liability and may be observable or unobservable. The hierarchy gives the highest priority to quoted prices in active markets for identical assets or liabilities (level 1) and the lowest priority to unobservable inputs (level 3). “Level 1” measurements are measurements using quoted prices in active markets for identical assets and liabilities. “Level 2” measurements are measurements using quoted prices in markets that are not active or that are based on quoted prices for similar assets or liabilities. “Level 3” measurements are measurements that use significant unobservable inputs which require a company to develop its own assumptions. When determining the fair value of assets and liabilities, the Company uses the most reliable measurement available.
Revenue Recognition
Revenue for product sales and services is recognized when all of the following criteria have been met: (i) persuasive evidence of an arrangement exists, (ii) products are shipped or services rendered to the customer and significant risks and rewards of ownership have passed to the customer, (iii) the price to the customer is fixed and determinable and (iv) collectability is reasonably assured. Products and services are sold with fixed or determinable prices and do not include right of return provisions or other significant post-delivery obligations. Deposits and other funds received in advance of delivery are deferred until the transfer of ownership is complete. Shipping and handling costs are reflected in cost of revenue. Taxes collected are not included in revenue, rather taxes are accrued for future remittance to governmental authorities.
The Logistics division of chemicals recognizes revenue from design and construction oversight contracts under the percentage-of-completion method of accounting, measured by the percentage of “costs incurred to date” to the “total estimated costs of completion.” This percentage is applied to the “total estimated revenue at completion” to calculate proportionate revenue earned to date. Contracts for services are inclusive of direct labor and material costs, as well as, indirect costs of operations. General and administrative costs are charged to expense as incurred. Changes in job performance metrics and estimated profitability, including contract bonus or penalty provisions and final contract settlements, are recognized in the period such revisions appear probable. Known or anticipated losses on contracts are recognized in full when amounts are probable and estimable. Bulk material loading revenue is recognized as services are performed.
Drilling revenue is recognized upon receipt of a signed and dated field billing ticket from the customer. Customers are charged contractually agreed amounts for oilfield rental equipment damaged or lost-in-hole (“LIH”). LIH proceeds are recognized as revenue and the associated carrying value is charged to cost of sales. LIH revenue totaled $4.7 million, $5.9 million and $4.2 million for the years ended December 31, 2014, 2013 and 2012, respectively.
47
FLOTEK INDUSTRIES, INC.
NOTES TO CONSOLIDATED FINANCIAL STATEMENTS
The Company generally is not contractually obligated to accept returns, except for defective products. Typically products determined to be defective are replaced or the customer is issued a credit memo. Based on historical return rates, no provision is made for returns at the time of sale. All costs associated with product returns are expensed as incurred.
Foreign Currency Translation
Financial statements of foreign subsidiaries are prepared using the currency of the primary economic environment of the foreign subsidiaries, as the functional currency. Assets and liabilities of foreign subsidiaries are translated into U.S. dollars at exchange rates in effect as of the end of identified reporting periods. Revenue and expense transactions are translated using the average monthly exchange rate for the reporting period. Resultant translation adjustments are recognized as other comprehensive income (loss) within stockholders’ equity.
Comprehensive Income (Loss)
Comprehensive income (loss) encompasses all changes in stockholders’ equity except those arising from investments from, and distributions to stockholders. The Company’s comprehensive income (loss) includes net income and foreign currency translation adjustments.
Research and Development Costs
Expenditures for research activities relating to product development and improvement are charged to expense as incurred.
Income Taxes
The Company has two U.S. tax filing groups which file separate U.S. Federal tax returns. Taxable income of one return cannot be offset by tax attributes, including net operating losses, of the other return.
The Company uses the liability method in accounting for income taxes. Deferred tax assets and liabilities are recognized for temporary differences between financial statement carrying amounts and the tax bases of assets and liabilities, and are measured using the tax rates expected to be in effect when the differences reverse. Deferred tax assets and liabilities are recognized related to the anticipated future tax effects of temporary differences between the financial statement basis and the tax basis of the Company’s assets and liabilities using statutory tax rates at the applicable year end. Deferred tax assets are also recognized for operating loss and tax credit carry forwards. The effect on deferred tax assets and liabilities of a change in tax rates is recognized in the results of operations in the period that includes the enactment date. A valuation allowance is used to reduce deferred tax assets when uncertainty exists regarding their realization.
A valuation allowance is recorded to reduce previously recorded tax assets when it becomes more-likely-than-not that such assets will not be realized. The Company evaluates, at least annually, net operating loss carry forwards and other net deferred tax assets and considers all available evidence, both positive and negative, to determine whether a valuation allowance is necessary relative to net operating loss carry forwards and other net deferred tax assets. In making this determination, the Company considers cumulative losses in recent years as significant negative evidence. The Company considers recent years to mean the current year plus the two preceding years. The Company considers the recent cumulative income or loss position of its filings groups as objectively verifiable evidence for the projection of future income, which consists primarily of determining the average of the pre-tax income of the current and prior two years after adjusting for certain items not indicative of future performance. Based on this analysis, the Company determines whether a valuation allowance is necessary.
U.S. Federal income taxes are not provided on unremitted earnings of subsidiaries operating outside the U.S. because it is the Company’s intention to permanently reinvest undistributed earnings in the subsidiary. These earnings would become subject to income tax if they were remitted as dividends or loaned to a U.S. affiliate. Determination of the amount of unrecognized deferred U.S. income tax liability on these unremitted earnings is not practicable.
The Company has performed an evaluation and concluded that there are no significant uncertain tax positions requiring recognition in the Company’s financial statements.
The Company’s policy is to record interest and penalties related to income tax matters as income tax expense.
48
FLOTEK INDUSTRIES, INC.
NOTES TO CONSOLIDATED FINANCIAL STATEMENTS
Earnings Per Share
Basic earnings per common share is calculated by dividing net income available to common stockholders by the weighted average number of common shares outstanding for the period. Diluted earnings per share is calculated by dividing net income attributable to common stockholders, adjusted for the effect of assumed conversions of convertible notes and preferred stock, by the weighted average number of common shares outstanding, including potentially dilutive common share equivalents, if the effect is dilutive. Potentially dilutive common shares equivalents consist of incremental shares of common stock issuable upon exercise of stock options and warrants, settlement of restricted stock units, and conversion of convertible notes and convertible preferred stock.
Debt Issuance Costs
Costs related to debt issuance are capitalized and amortized as interest expense over the term of the related debt using the straight-line method, which approximates the effective interest method. Upon the repayment of debt, the Company accelerates the recognition of an appropriate amount of the costs as interest expense.
Capitalization of Interest
Interest costs are capitalized for qualifying in-process software development projects. Capitalization of interest commences when activities to prepare the asset are in progress, and expenditures and borrowing costs are being incurred. Interest costs are capitalized until the assets are ready for their intended use. Capitalized interest is added to the cost of the underlying assets and amortized over the estimated useful lives of the assets. During the year ended December 31, 2012, $0.1 million of interest was capitalized.
Stock-Based Compensation
Stock-based compensation expense for share-based payments, related to stock option and restricted stock awards, is recognized based on their grant-date fair values. The Company recognizes compensation expense, net of estimated forfeitures, on a straight-line basis over the requisite service period of the award. Estimated forfeitures are based on historical experience.
Use of Estimates
The preparation of financial statements in conformity with GAAP requires management to make estimates and assumptions that affect reported amounts of assets and liabilities, disclosure of contingent assets and liabilities and reported amounts of revenue and expenses. Actual results could differ from these estimates.
Significant items subject to estimates and assumptions include application of the percentage-of-completion method of revenue recognition, the carrying amount and useful lives of property and equipment and intangible assets, impairment assessments, share-based compensation expense and valuation allowances for accounts receivable, inventories, and deferred tax assets.
Reclassifications
Certain prior year amounts have been reclassified to conform to the current year presentation. The reclassifications did not impact net income.
New Accounting Pronouncements
(a) Application of New Accounting Standards
Effective January 1, 2014, the Company adopted the accounting guidance in Accounting Standards Update ("ASU") No. 2013-11, "Presentation of an Unrecognized Tax Benefit When a Net Operating Loss Carryforward, a Similar Tax Loss, or a Tax Credit Carryforward Exists," which provides guidance for reporting unrecognized tax benefits when a net operating loss carryforward, a similar tax loss, or a tax credit carryforward exists at the reporting date. The guidance requires an unrecognized tax benefit to be presented as a decrease in a deferred tax asset where a net operating loss, a similar tax loss, or a tax credit carryforward exists and certain criteria are met. Implementation of this standard did not have a material effect on the consolidated financial statements.
(b) New Accounting Requirements and Disclosures
In April 2014, the Financial Accounting Standards Board ("FASB") issued ASU No. 2014-08, "Presentation of Financial Statements and Property, Plant, and Equipment - Reporting Discontinued Operations and Disclosures of Disposals of Components of an Entity," which amends the definition of a discontinued operation by raising the threshold for a disposal to qualify as discontinued operations. The ASU will also require entities to provide additional disclosures about discontinued operations as well as disposal transactions that do not meet the discontinued operations criteria. The pronouncement is effective prospectively for all disposals (except disposals classified as held for sale before the adoption date) of components initially classified as held for sale in periods
49
FLOTEK INDUSTRIES, INC.
NOTES TO CONSOLIDATED FINANCIAL STATEMENTS
beginning on or after December 15, 2014. Early adoption is permitted. The Company is currently evaluating this guidance and does not expect that adoption will have a material effect on the consolidated financial statements.
In May 2014, the FASB issued ASU No. 2014-09, "Revenue from Contracts with Customers." The ASU will supersede most of the existing revenue recognition requirements in U.S. GAAP and will require entities to recognize revenue at an amount that reflects the consideration to which the Company expects to be entitled in exchange for transferring goods or services to a customer. The new standard also requires significantly expanded disclosures regarding the qualitative and quantitative information of an entity's nature, amount, timing, and uncertainty of revenue and cash flows arising from contracts with customers. The pronouncement is effective for annual reporting periods beginning after December 15, 2016, including interim periods within that reporting period and is to be applied retrospectively, with early application not permitted. The Company is currently evaluating the impact the pronouncement will have on the consolidated financial statements and related disclosures.
In June 2014, the FASB issued ASU No. 2014-12, "Accounting for Share-Based Payments When the Terms of an Award Provide That a Performance Target Could Be Achieved after the Requisite Service Period." The ASU requires that a performance target that affects vesting and that could be achieved after the requisite service period be treated as a performance condition. As such, the performance target should not be reflected in estimating the grant-date fair value of the award. The ASU is effective for annual reporting periods beginning after December 15, 2015, with early adoption permitted. The Company is evaluating the potential impacts of the new standard on its existing stock-based compensation plans.
In November 2014, the FASB issued ASU No. 2014-17, "Business Combinations: Pushdown Accounting." This ASU provides companies with the option to apply pushdown accounting in its separate financial statements upon occurrence of an event in which an acquirer obtains control of the acquired entity. The election to apply pushdown accounting can be made either in the period in which the change of control occurred, or in a subsequent period. This ASU is effective on November 18, 2014. Implementation of this standard is not expected to have a material effect on the consolidated financial statements.
50
FLOTEK INDUSTRIES, INC.
NOTES TO CONSOLIDATED FINANCIAL STATEMENTS
Note 3 — Acquisitions
On May 10, 2013, the Company acquired Florida Chemical Company, Inc. ("Florida Chemical"), one of the world's largest processors of citrus oils and a pioneer in solvent, chemical synthesis, and flavor and fragrance applications from citrus oils. Florida Chemical has been an innovator in creating high performance, bio-based products for a variety of industries, including applications in the oil and gas industry. The acquisition brings a portfolio of high performance renewable and sustainable chemistries that perform well in the oil and gas industry as well as non-energy related markets. This expands the Company's business into consumer and industrial chemical technologies which provide products for the flavor and fragrance industry and the specialty chemical industry. These technologies are used by beverage and food companies, fragrance companies, and companies providing household and industrial cleaning products.
The Company acquired 100% of the outstanding shares of Florida Chemical's common stock. The purchase consideration transferred was as follows (in thousands):
Cash | $ | 49,500 | ||
Common stock (3,284,180 shares) | 52,711 | |||
Repayment of debt | 4,227 | |||
Total purchase price | $ | 106,438 | ||
The allocation of the purchase consideration was based upon the estimated fair value of the tangible and identifiable intangible assets acquired and liabilities assumed in the acquisition. The allocation was made to major categories of assets and liabilities based on management's best estimates, supported by independent third-party analyses. The excess of the purchase price over the estimated fair value of tangible and identifiable intangible assets acquired, and liabilities assumed was allocated to goodwill. The allocation of purchase consideration is as follows (in thousands):
Cash | $ | 331 | ||
Net working capital, net of cash | 15,574 | |||
Property and equipment: | ||||
Personal property | 13,400 | |||
Real property | 6,750 | |||
Other assets | 205 | |||
Other intangible assets: | ||||
Customer relationships | 29,270 | |||
Trade names | 12,670 | |||
Proprietary technology | 14,080 | |||
Goodwill | 39,328 | |||
Deferred tax impact of valuation adjustment | (25,170 | ) | ||
Total purchase price allocation | $ | 106,438 | ||
The following unaudited pro forma financial information presents results of operations as if the acquisition had occurred as of January 1, 2012. This financial information does not purport to represent the results of operations which would actually have been obtained had the acquisition been completed as of January 1, 2012, or the results of operations that may be obtained in the future. Also, this financial information does not reflect the cost of any integration activities or benefits from the merger and synergies that may be derived from any integration activities, both of which may have a material effect on the consolidated results of operations in the periods following the completion of the merger.
51
FLOTEK INDUSTRIES, INC.
NOTES TO CONSOLIDATED FINANCIAL STATEMENTS
Pro forma financial information is as follows (in thousands, except per share data):
Year ended December 31, | ||||||||
2013 | 2012 | |||||||
Revenue | $ | 395,407 | $ | 391,786 | ||||
Net income | 38,271 | 53,902 | ||||||
Earnings per common share: | ||||||||
Basic | $ | 0.73 | $ | 1.05 | ||||
Diluted | $ | 0.70 | $ | 0.98 | ||||
Pro forma adjustments include, but are not limited to, adjustments for amortization expense for acquired finite lived intangible assets, depreciation expense for the fair value of acquired property and equipment, interest expense for increased long-term debt and revolving credit facility borrowings required for the acquisition, and income tax expense on Florida Chemical income before income taxes. In addition, pro forma adjustments eliminate historical amortization, depreciation, and interest expense from the pro forma results of operations.
The acquisition was financed through increased long term debt of $25 million, additional borrowings on the Company's revolving credit facility of $28.7 million and the issuance of 3.3 million shares of the Company's common stock. Results of Florida Chemical's operations are included in the Company's consolidated financial statements from the date of acquisition. The Company's consolidated statements of operations for the year ended December 31, 2013 include $50.9 million of revenue and $10.0 million of income from operations related to the operations of Florida Chemical.
The Company incurred $1.4 million of acquisition costs in connection with the transaction which have been expensed as incurred and included in selling, general and administrative expenses.
During the quarter ended September 30, 2014, the Company identified and recorded a final adjustment related to the acquisition of Florida Chemical. Current deferred tax assets were increased by $1.2 million with a corresponding decrease to goodwill within the consumer and industrial chemical technologies reporting unit. This final adjustment was not significant relative to the total consideration paid for Florida Chemical and, therefore, the final adjustment has not been retrospectively applied to the Company's balance sheet as of December 31, 2013. This adjustment, if recorded in 2013, would have had no impact on the 2013 consolidated statements of operations and cash flows.
On January 1, 2014, the Company acquired 100% of the membership interests in Eclipse IOR Services, LLC ("EOGA"), a leading Enhanced Oil Recovery ("EOR") design and injection firm, for $5.3 million in cash consideration, net of cash received, and 94,354 shares of the Company's common stock. EOGA’s enhanced oil recovery processes and its use of polymers to improve the performance of EOR projects has been combined with the Company’s existing EOR products and services.
On April 1, 2014, the Company acquired 100% of the membership interests in SiteLark, LLC ("SiteLark") for $0.4 million in cash and 5,327 shares of the Company's common stock. SiteLark provides reservoir engineering and modeling services for a variety of hydrocarbon applications. Its services include proprietary software which assists engineers with reservoir simulation, reservoir engineering and waterflood optimization.
52
FLOTEK INDUSTRIES, INC.
NOTES TO CONSOLIDATED FINANCIAL STATEMENTS
Note 4 — Supplemental Cash Flow Information
Supplemental cash flow information is as follows (in thousands):
Year ended December 31, | |||||||||||
2014 | 2013 | 2012 | |||||||||
Supplemental non-cash investing and financing activities: | |||||||||||
Value of common stock issued in acquisitions | $ | 2,043 | $ | 52,711 | $ | — | |||||
Final Florida Chemical acquisition adjustment | 1,162 | — | — | ||||||||
Fair value of warrant liability reclassified to additional paid-in capital | — | — | 13,973 | ||||||||
Value of common stock issued in payment of accrued liability | 600 | — | — | ||||||||
Equipment acquired through capital leases | — | 754 | 1,263 | ||||||||
Exercise of stock options by common stock surrender | 1,198 | 3,907 | — | ||||||||
Supplemental cash payment information: | |||||||||||
Interest paid | $ | 1,285 | $ | 1,859 | $ | 5,521 | |||||
Income taxes paid | 22,389 | 17,783 | 14,049 | ||||||||
Note 5 — Revenue
The Company differentiates revenue and cost of revenue based on whether the source of revenue is attributable to products, rentals or services. Revenue and cost of revenue by source are as follows (in thousands):
Year ended December 31, | |||||||||||
2014 | 2013 | 2012 | |||||||||
Revenue: | |||||||||||
Products | $ | 354,356 | $ | 282,639 | $ | 224,777 | |||||
Rentals | 65,549 | 62,042 | 67,938 | ||||||||
Services | 29,252 | 26,384 | 20,113 | ||||||||
$ | 449,157 | $ | 371,065 | $ | 312,828 | ||||||
Cost of Revenue: | |||||||||||
Products | $ | 214,417 | $ | 180,800 | $ | 135,367 | |||||
Rentals | 31,285 | 24,987 | 30,618 | ||||||||
Services | 12,385 | 9,916 | 8,051 | ||||||||
Depreciation | 8,111 | 7,835 | 7,173 | ||||||||
$ | 266,198 | $ | 223,538 | $ | 181,209 | ||||||
53
FLOTEK INDUSTRIES, INC.
NOTES TO CONSOLIDATED FINANCIAL STATEMENTS
Note 6 — Inventories
Inventories are as follows (in thousands):
December 31, | |||||||
2014 | 2013 | ||||||
Raw materials | $ | 31,581 | $ | 13,953 | |||
Work-in-process | 3,129 | 1,904 | |||||
Finished goods | 51,248 | 50,019 | |||||
Inventories | 85,958 | 65,876 | |||||
Less reserve for excess and obsolete inventory | — | (2,744 | ) | ||||
Inventories, net | $ | 85,958 | $ | 63,132 | |||
Changes in the reserve for excess and obsolete inventory are as follows (in thousands):
Year ended December 31, | |||||||||||
2014 | 2013 | 2012 | |||||||||
Balance, beginning of year | $ | 2,744 | $ | 2,752 | $ | 2,679 | |||||
Charged to costs and expenses | 358 | 1,330 | 882 | ||||||||
Deductions | (3,102 | ) | (1,338 | ) | (809 | ) | |||||
Balance, end of the year | $ | — | $ | 2,744 | $ | 2,752 | |||||
At December 31, 2014, the Company recorded a $2.0 million write-down of inventory to recognize impairment of all items identified and included in the reserve for excess and obsolete inventory. At December 31, 2012, the Company recorded a $1.2 million write-down of inventory with a market value less than its cost.
Note 7 — Property and Equipment
Property and equipment are as follows (in thousands):
December 31 | |||||||
2014 | 2013 | ||||||
Land | $ | 6,780 | $ | 5,088 | |||
Buildings and leasehold improvements | 33,765 | 32,269 | |||||
Machinery, equipment and rental tools | 80,731 | 71,073 | |||||
Equipment in progress | 7,299 | 4,601 | |||||
Furniture and fixtures | 2,528 | 2,400 | |||||
Transportation equipment | 6,566 | 6,340 | |||||
Computer equipment and software | 7,605 | 7,617 | |||||
Property and equipment | 145,274 | 129,388 | |||||
Less accumulated depreciation | (59,163 | ) | (50,274 | ) | |||
Property and equipment, net | $ | 86,111 | $ | 79,114 | |||
Depreciation expense, including expense recorded in cost of revenue, totaled $13.1 million, $11.2 million and $9.5 million for the years ended December 31, 2014, 2013 and 2012, respectively.
During the years ended December 31, 2014, 2013 and 2012, no impairments were recognized related to property and equipment.
54
FLOTEK INDUSTRIES, INC.
NOTES TO CONSOLIDATED FINANCIAL STATEMENTS
Note 8 — Goodwill
The Company had five reporting units, Energy Chemical Technologies, Consumer and Industrial Chemical Technologies, Drilling Tools, Teledrift®, and Production Technologies, of which only three had an existing goodwill balance at December 31, 2014. For segment reporting purposes, Downhole Tools and the Teledrift® reporting units are included within the Drilling Technologies segment.
During May 2013, as a result of the Florida Chemical acquisition, the Company recognized $39.3 million of goodwill. During the fair value assessment process, the Company identified two separate reporting units, one of which was consolidated within the Energy Chemical Technologies segment and the other was identified as the Consumer and Industrial Chemical Technologies reporting unit and segment. The Company recognized $18.7 million of additional goodwill within the Energy Chemical Technologies reporting unit and $20.6 million of goodwill within the Consumer and Industrial Chemical Technologies reporting unit. During the year ended December 31, 2014, the Company recorded a final adjustment related to the acquisition of Florida Chemical that reduced goodwill by $1.2 million (see Note 3). The net addition to goodwill will not be deductible for income tax purposes.
Goodwill is tested for impairment annually in the fourth quarter, or more frequently if circumstances indicate a potential impairment. During annual goodwill impairment testing during the years ended December 31, 2014, 2013 and 2012, the Company first assessed qualitative factors to determine whether it was necessary to perform the two-step goodwill impairment test that the Company has historically used. The Company concluded that it was not more-likely-than-not that goodwill was impaired as of the fourth quarter of each year, and therefore, further testing was not required.
Changes in the carrying value of goodwill for each reporting unit are as follows (in thousands):
Energy Chemical Technologies | Consumer and Industrial Chemical Technologies | Downhole Tools | Teledrift® | Production Technologies | Total | ||||||||||||||||||
Balance at December 31, 2012: | |||||||||||||||||||||||
Goodwill | $ | 11,610 | $ | — | $ | 43,009 | $ | 46,396 | $ | 5,861 | $ | 106,876 | |||||||||||
Accumulated impairment losses | — | — | (43,009 | ) | (31,063 | ) | (5,861 | ) | (79,933 | ) | |||||||||||||
Goodwill balance, net | 11,610 | — | — | 15,333 | — | 26,943 | |||||||||||||||||
Activity during the year 2013: | |||||||||||||||||||||||
Goodwill impairment recognized | — | — | — | — | — | — | |||||||||||||||||
Acquisition goodwill recognized | 18,686 | 20,642 | — | — | — | 39,328 | |||||||||||||||||
Balance at December 31, 2013: | |||||||||||||||||||||||
Goodwill | 30,296 | 20,642 | 43,009 | 46,396 | 5,861 | 146,204 | |||||||||||||||||
Accumulated impairment losses | — | — | (43,009 | ) | (31,063 | ) | (5,861 | ) | (79,933 | ) | |||||||||||||
Goodwill balance, net | 30,296 | 20,642 | — | 15,333 | — | 66,271 | |||||||||||||||||
Activity during the year 2014: | |||||||||||||||||||||||
Goodwill impairment recognized | — | — | — | — | — | — | |||||||||||||||||
Acquisition goodwill recognized | 6,022 | (1,162 | ) | — | — | — | 4,860 | ||||||||||||||||
Balance at December 31, 2014: | |||||||||||||||||||||||
Goodwill | 36,318 | 19,480 | 43,009 | 46,396 | 5,861 | 151,064 | |||||||||||||||||
Accumulated impairment losses | — | — | (43,009 | ) | (31,063 | ) | (5,861 | ) | (79,933 | ) | |||||||||||||
Goodwill balance, net | $ | 36,318 | $ | 19,480 | $ | — | $ | 15,333 | $ | — | $ | 71,131 | |||||||||||
55
FLOTEK INDUSTRIES, INC.
NOTES TO CONSOLIDATED FINANCIAL STATEMENTS
Note 9 — Other Intangible Assets
Other intangible assets are as follows (in thousands):
December 31, | |||||||||||||||
2014 | 2013 | ||||||||||||||
Cost | Accumulated Amortization | Cost | Accumulated Amortization | ||||||||||||
Finite lived intangible assets: | |||||||||||||||
Patents and technology | $ | 20,061 | $ | 4,569 | $ | 18,996 | $ | 3,244 | |||||||
Customer lists | 52,607 | 11,829 | 52,607 | 9,018 | |||||||||||
Trademarks and brand names | 7,191 | 2,706 | 7,191 | 2,053 | |||||||||||
Other | — | — | 191 | — | |||||||||||
Total finite lived intangible assets acquired | 79,859 | 19,104 | 78,985 | 14,315 | |||||||||||
Deferred financing costs | 1,655 | 512 | 1,392 | 169 | |||||||||||
Total amortizable intangible assets | 81,514 | $ | 19,616 | 80,377 | $ | 14,484 | |||||||||
Indefinite lived intangible assets: | |||||||||||||||
Trademarks and brand names | 11,630 | 11,630 | |||||||||||||
Total other intangible assets | $ | 93,144 | $ | 92,007 | |||||||||||
Carrying value: | |||||||||||||||
Other intangible assets, net | $ | 73,528 | $ | 77,523 | |||||||||||
With the acquisition of Florida Chemical on May 10, 2013, the Company recorded increases in finite lived intangible assets of $14.1 million in patents and technology, $29.3 million in customer lists and $1.0 million in trademarks and brand names. In addition, the Company recorded $11.6 million in indefinite lived trademarks and brand names. These acquired intangible assets were recorded at fair value as of the date of acquisition. Amortization of these other intangible assets will not be deductible for income tax purposes.
Intangible assets acquired are amortized on a straight-line basis over two to 20 years. Amortization of intangible assets acquired totaled $4.8 million, $3.9 million and $2.1 million for the years end ended December 31, 2014, 2013 and 2012, respectively.
Amortization of deferred financing costs totaled $0.3 million, $0.2 million and $0.9 million for the years ended December 31, 2014, 2013 and 2012, respectively. During the years ended December 31, 2013 and 2012, the carrying value of deferred financing costs was reduced by less than $0.1 million and by $1.8 million, respectively, upon repayments of the Company’s convertible senior notes.
Estimated future amortization expense for other intangible assets, including deferred financing costs, at December 31, 2014 is as follows (in thousands):
Year ending December 31, | |||
2015 | $ | 5,104 | |
2016 | 4,872 | ||
2017 | 4,718 | ||
2018 | 4,457 | ||
2019 | 4,247 | ||
Thereafter | 38,500 | ||
Other intangible assets, net | $ | 61,898 | |
During the years ended December 31, 2014, 2013 and 2012, no impairments were recognized related to other intangible assets.
56
FLOTEK INDUSTRIES, INC.
NOTES TO CONSOLIDATED FINANCIAL STATEMENTS
Note 10 — Long-Term Debt and Credit Facility
Long-term debt is as follows (in thousands):
December 31, | |||||||
2014 | 2013 | ||||||
Long-term debt: | |||||||
Borrowings under revolving credit facility | $ | 8,500 | $ | 16,272 | |||
Term loan | 35,541 | 45,833 | |||||
Total long-term debt | 44,041 | 62,105 | |||||
Less current portion of long-term debt | (18,643 | ) | (26,415 | ) | |||
Long-term debt, less current portion | $ | 25,398 | $ | 35,690 | |||
Credit Facility
On May 10, 2013, the Company and certain of its subsidiaries (the “Borrowers”) entered into an Amended and Restated Revolving Credit, Term Loan and Security Agreement (the “Credit Facility”) with PNC Bank, National Association (“PNC Bank”). The Company may borrow under the Credit Facility for working capital, permitted acquisitions, capital expenditures and other corporate purposes. Under terms of the Credit Facility, as amended, the Company (a) may borrow up to $75 million under a revolving credit facility and (b) has borrowed $50 million under a term loan.
The Credit Facility is secured by substantially all of the Company's domestic real and personal property, including accounts receivable, inventory, land, buildings, equipment and other intangible assets. The Credit Facility contains customary representations, warranties, and both affirmative and negative covenants, including a financial covenant to maintain consolidated earnings before interest, taxes, depreciation and amortization (“EBITDA”) to debt ratio of 1.10 to 1.00, a financial covenant to maintain a ratio of funded debt to adjusted EBITDA of not greater than 4.0 to 1.0, and an annual limit on capital expenditures of approximately $36 million. The Credit Facility restricts the payment of cash dividends on common stock. In the event of default, PNC Bank may accelerate the maturity date of any outstanding amounts borrowed under the Credit Facility.
The Credit Facility includes a provision that 25% of EBITDA minus cash paid for taxes, dividends, debt payments and unfunded capital expenditures, not to exceed $3.0 million for any year, be paid within 60 days of the fiscal year end. For the year ended December 31, 2014, the excess cash flow exceeded $3.0 million. Consequently, the Company will pay $3.0 million on its term loan balance to PNC Bank by March 2, 2015. This amount is classified as current debt at December 31, 2014.
Each of the Company’s domestic subsidiaries is fully obligated for Credit Facility indebtedness as a borrower or as a guarantor.
(a) Revolving Credit Facility
Under the revolving credit facility, the Company may borrow up to $75 million through May 10, 2018. This includes a sublimit of $10 million that may be used for letters of credit. The revolving credit facility is secured by substantially all the Company's domestic accounts receivable and inventory.
At December 31, 2014, eligible accounts receivable and inventory securing the revolving credit facility provided availability of $66.3 million under the revolving credit facility. Available borrowing capacity, net of outstanding borrowings, was $57.8 million at December 31, 2014.
The interest rate on borrowings under the revolving credit facility varies based on the level of borrowing under the Credit Facility. Rates range (a) between PNC Bank's base lending rate plus 0.5% to 1.0% or (b) between the London Interbank Offered Rate (LIBOR) plus 1.5% to 2.0%. PNC Bank's base lending rate was 3.25% at December 31, 2014. The Company is required to pay a monthly facility fee of 0.25% on any unused amount under the commitment based on daily averages. At December 31, 2014, $8.5 million was outstanding under the revolving credit facility, borrowed as base rate loans at an interest rate of 3.75%.
Borrowings under the revolving credit facility are classified as current debt as a result of the required lockbox arrangement and the subjective acceleration clause.
(b) Term Loan
The Company increased borrowing to $50 million under the term loan on May 10, 2013. Monthly principal payments of $0.6 million are required. The unpaid balance of the term loan is due on May 10, 2018. Prepayments are permitted, and may be required
57
FLOTEK INDUSTRIES, INC.
NOTES TO CONSOLIDATED FINANCIAL STATEMENTS
in certain circumstances. Amounts repaid under the term loan may not be reborrowed. The term loan is secured by substantially all of the Company's domestic land, buildings, equipment and other intangible assets.
The interest rate on the term loan varies based on the level of borrowing under the Credit Facility. Rates range (a) between PNC Bank's base lending rate plus 1.25% to 1.75% or (b) between LIBOR plus 2.25% to 2.75%. At December 31, 2014, $35.5 million was outstanding under the term loan, with $0.5 million borrowed as base rate loans at an interest rate of 4.50% and $35.0 million borrowed as LIBOR loans at an interest rate of 2.41%.
Repaid Convertible Notes
The Company’s convertible notes have consisted of Convertible Senior Unsecured Notes (“2008 Notes”) and Convertible Senior Secured Notes (“2010 Notes”). During 2012, the Company repurchased $65.3 million of the outstanding 2008 Notes and all $36.0 million of the outstanding 2010 Notes for cash equal to the original principal amount and a total premium of $2.1 million, plus accrued and unpaid interest. As a result of these transactions, the Company recognized a loss on extinguishment of debt of $7.3 million, consisting of the cash premium and the write-off of unaccreted discount and unamortized debt financing costs.
On February 15, 2013, the Company repurchased the remaining $5.2 million of outstanding 2008 Notes for cash equal to the original principal amount, plus accrued and unpaid interest. These 2008 Notes were either tendered by the holder pursuant to the Company's tender offer or were redeemed by the Company pursuant to provisions of the indenture for the 2008 Notes. Following this repurchase, the Company no longer has any outstanding convertible senior notes.
The convertible notes were guaranteed by substantially all of the Company’s wholly owned subsidiaries. Flotek Industries, Inc., the parent company, is a holding company with no independent assets or operations. The guarantees provided by the Company’s subsidiaries were full and unconditional, and joint and several. Any subsidiaries of the Company that were not guarantors were deemed to be “minor” subsidiaries in accordance with SEC Regulation S-X, Rule 3-10, “Financial Statements of Guarantors and Issuers of Guaranteed Securities Registered or Being Registered.”
Share Lending Agreement
Concurrent with the offering of the 2008 Notes, the Company entered into a share lending agreement (the “Share Lending Agreement”) with the underwriter (the “Borrower”). The Company loaned 3.8 million shares of its common stock (the “Borrowed Shares”) to the Borrower for a period commencing February 11, 2008 and ending on the date the 2008 Notes were paid. The Borrower was permitted to use the Borrowed Shares only for the purpose of directly or indirectly facilitating the sale of the 2008 Notes and for the establishment of hedge positions by holders of the 2008 Notes. The Company did not require collateral to mitigate any inherent or associated risk of the Share Lending Agreement.
The Company did not receive any proceeds for the Borrowed Shares, but did receive a nominal loan fee of $0.0001 for each share loaned. The Borrower retained all proceeds from sales of Borrowed Shares pursuant to the Share Lending Agreement. Upon conversion or replacement of the 2008 Notes, the number of Borrowed Shares proportionate to the converted or repaid notes were to be returned to the Company. The Borrowed Shares were issued and outstanding for corporate law purposes. Accordingly, holders of Borrowed Shares possessed all of the rights of a holder of the Company’s outstanding shares, including the right to vote the shares on all matters submitted to a vote of stockholders and the right to receive any dividends or other distributions declared or paid on outstanding shares of common stock. Under the Share Lending Agreement, the Borrower agreed to pay to the Company, within one business day after a payment date, an amount equal to any cash dividends that the Company paid on the Borrowed Shares, and to pay or deliver to the Company, upon termination of the loan of Borrowed Shares, any other distribution, in liquidation or otherwise, that the Company made on the Borrowed Shares.
To the extent the Borrowed Shares loaned under the Share Lending Agreement were not sold or returned to the Company, the Borrower agreed to not vote any borrowed shares of which the Borrower was the owner of record. The Borrower also agreed, under the Share Lending Agreement, to not transfer or dispose of any borrowed shares unless such transfer or disposition was pursuant to a registration statement that was effective under the Securities Act of 1933, as amended. Investors that purchased shares from the Borrower, and all subsequent transferees of such purchasers, were entitled to the same voting rights, with respect to owned shares, as any other holder of common stock.
Through December 31, 2012, the Borrower returned 1,360,442 shares of the Company’s borrowed common stock. On January 22, 2013, the remaining 2,439,558 shares of the Company's common stock were returned to the Company and the Share Lending Agreement was terminated. No consideration was paid by the Company for the return of the Borrowed Shares.
Shares that had been loaned under the Share Lending Agreement were not considered outstanding for the purpose of computing and reporting earnings per common share.
58
FLOTEK INDUSTRIES, INC.
NOTES TO CONSOLIDATED FINANCIAL STATEMENTS
Debt Maturities
Maturities of long-term debt at December 31, 2014 are as follows (in thousands):
Year ending December 31, | Revolving Credit Facility | Term Loan | Total | |||||||||
2015 | $ | 8,500 | $ | 10,143 | $ | 18,643 | ||||||
2016 | — | 7,143 | 7,143 | |||||||||
2017 | — | 7,143 | 7,143 | |||||||||
2018 | — | 11,112 | 11,112 | |||||||||
Total | $ | 8,500 | $ | 35,541 | $ | 44,041 | ||||||
Note 11 — Fair Value Measurements
Fair value is defined as the amount that would be received for selling an asset or paid to transfer a liability in an orderly transaction between market participants at the measurement date. The Company categorizes financial assets and liabilities into the three levels of the fair value hierarchy. The hierarchy prioritizes the inputs to valuation techniques used to measure fair value and bases categorization within the hierarchy on the lowest level of input that is available and significant to the fair value measurement.
• | Level 1 — Quoted prices in active markets for identical assets or liabilities; |
• | Level 2 — Observable inputs other than Level 1, such as quoted prices for similar assets or liabilities, quoted prices in markets that are not active, or other inputs that are observable or can be corroborated by observable market data for substantially the full term of the assets or liabilities; and |
• | Level 3 — Significant unobservable inputs that are supported by little or no market activity or that are based on the reporting entity’s assumptions about the inputs. |
Liabilities Measured at Fair Value on a Recurring Basis
At December 31, 2014 and 2013, no liabilities were required to be measured at fair value on a recurring basis. There were no transfers in or out of either Level 1 or Level 2 fair value measurements during the years ended December 31, 2014 and 2013. During the year ended December 31, 2012, $2.6 million of non-cash gains were recognized as fair value adjustments within Level 3 of the fair value measurement hierarchy. The change resulted from the change in the fair value of the exercisable and contingent warrants outstanding.
On June 14, 2012, provisions in the Company’s Exercisable and Contingent Warrant Certificates were amended to eliminate anti-dilution price adjustment provisions and remove cash settlement provisions of a change of control event. Upon amendment, the warrants met the requirements for classification as equity. All fluctuations in the fair value of the warrant liability prior to June 2012, estimated using a Black-Scholes option pricing model, were recognized as non-cash income or expense items within the statement of operations. The fair value accounting methodology for the warrant liability is no longer required following the contractual amendment.
During the years ended December 31, 2014 and 2013, there were no transfers in or out of the Level 3 hierarchy.
Assets Measured at Fair Value on a Nonrecurring Basis
The Company’s non-financial assets, including property and equipment, goodwill and other intangible assets are measured at fair value on a non-recurring basis and are subject to fair value adjustment in certain circumstances. No impairment of any of these assets was recognized during the years ended December 31, 2014, 2013 and 2012.
Fair Value of Other Financial Instruments
The carrying amounts of certain financial instruments, including cash and cash equivalents, accounts receivable, accounts payable and accrued expenses, approximate fair value due to the short-term nature of these accounts. The Company had no cash equivalents at December 31, 2014 or 2013.
59
FLOTEK INDUSTRIES, INC.
NOTES TO CONSOLIDATED FINANCIAL STATEMENTS
The carrying value and estimated fair value of the Company’s long-term debt are as follows (in thousands):
December 31, | |||||||||||||||
2014 | 2013 | ||||||||||||||
Carrying Value | Fair Value | Carrying Value | Fair Value | ||||||||||||
Borrowings under revolving credit facility | $ | 8,500 | $ | 8,500 | $ | 16,272 | $ | 16,272 | |||||||
Term loan | 35,541 | 35,541 | 45,833 | 45,833 | |||||||||||
The carrying value of borrowings under the revolving credit facility and the term loan approximate their fair value because the interest rate is variable.
Note 12 — Earnings Per Share
Basic earnings per common share is calculated by dividing net income by the weighted average number of common shares outstanding for the period. Diluted earnings per common share is calculated by dividing net income, adjusted for the effect of assumed conversion of convertible notes, by the weighted average number of common shares outstanding combined with dilutive common share equivalents outstanding, if the effect is dilutive.
In connection with the sale of the 2008 Notes, the Company entered into a Share Lending Agreement for 3.8 million shares of the Company’s common stock (see Note 10). Contractual undertakings of the Borrower had the effect of substantially eliminating the economic dilution that otherwise would result from the issuance of the Borrowed Shares, and all shares outstanding under the Share Lending Agreement were contractually obligated to be returned to the Company. As a result, shares loaned under the Share Lending Agreement were not considered outstanding for the purpose of computing and reporting earnings per common share. The Share Lending Agreement was terminated on January 22, 2013 upon the return of all Borrowed Shares to the Company.
On February 15, 2013, the Company repurchased the remaining $5.2 million of outstanding 2008 Notes for cash. Following this repurchase, the Company no longer has any outstanding convertible senior notes. For the year ended December 31, 2013, the Company's convertible notes were excluded from the calculation of diluted earnings per common share as inclusion was anti-dilutive. In addition, for the years ended December 31, 2013 and 2012, approximately 0.1 million stock options with an exercise price in excess of the average market price of the Company’s common stock were excluded from the calculation of diluted earnings per common share.
Basic and diluted earnings per common share are as follows (in thousands, except per share data):
Year ended December 31, | |||||||||||
2014 | 2013 | 2012 | |||||||||
Net income attributable to common stockholders - Basic | $ | 53,603 | $ | 36,178 | $ | 49,791 | |||||
Impact of assumed conversions: | |||||||||||
Interest on convertible notes | — | — | 1,959 | ||||||||
Net income attributable to common stockholders - Diluted | $ | 53,603 | $ | 36,178 | $ | 51,750 | |||||
Weighted average common shares outstanding - Basic | 54,511 | 51,346 | 48,185 | ||||||||
Assumed conversions: | |||||||||||
Incremental common shares from warrants | 121 | 1,355 | 1,560 | ||||||||
Incremental common shares from stock options | 880 | 1,133 | 992 | ||||||||
Incremental common shares from restricted stock units | 14 | 7 | 116 | ||||||||
Incremental common shares from convertible senior notes | — | — | 2,701 | ||||||||
Weighted average common shares outstanding - Diluted | 55,526 | 53,841 | 53,554 | ||||||||
Basic earnings per common share | $ | 0.98 | $ | 0.70 | $ | 1.03 | |||||
Diluted earnings per common share | $ | 0.97 | $ | 0.67 | $ | 0.97 | |||||
60
FLOTEK INDUSTRIES, INC.
NOTES TO CONSOLIDATED FINANCIAL STATEMENTS
Note 13 — Income Taxes
Components of the income tax expense (benefit) are as follows (in thousands):
Year ended December 31, | |||||||||||
2014 | 2013 | 2012 | |||||||||
Current: | |||||||||||
Federal | $ | 21,468 | $ | 15,225 | $ | 12,072 | |||||
State | 684 | 3,322 | 1,450 | ||||||||
Foreign | 1,627 | 1,432 | 891 | ||||||||
Total current | 23,779 | 19,979 | 14,413 | ||||||||
Deferred: | |||||||||||
Federal | 2,573 | 1,336 | (18,836 | ) | |||||||
State | (1,071 | ) | (543 | ) | 90 | ||||||
Total deferred | 1,502 | 793 | (18,746 | ) | |||||||
Income tax expense (benefit) | $ | 25,281 | $ | 20,772 | $ | (4,333 | ) | ||||
A reconciliation of the U.S. federal statutory tax rate to the effective income tax rate is as follows:
Year ended December 31, | ||||||||
2014 | 2013 | 2012 | ||||||
Federal statutory tax rate | 35.0 | % | 35.0 | % | 35.0 | % | ||
State income taxes, net of federal benefit | 2.3 | 2.8 | 2.3 | |||||
Return to accrual adjustments | (0.9 | ) | 0.2 | (1.3 | ) | |||
Change in valuation allowance | — | — | (41.0 | ) | ||||
Warrant liability fair value adjustment | — | — | (2.0 | ) | ||||
Domestic production activities deduction | (2.5 | ) | (2.6 | ) | (3.0 | ) | ||
Other | (1.9 | ) | 1.1 | 0.5 | ||||
Effective income tax rate | 32.0 | % | 36.5 | % | (9.5 | )% | ||
Fluctuations in effective tax rates have historically been impacted by permanent tax differences with no associated income tax impact and existing deferred tax asset valuation allowances. The change in the effective tax rate in 2014 resulted primarily from changes in state apportionment factors, including the effect on state deferred tax assets and liabilities.
61
FLOTEK INDUSTRIES, INC.
NOTES TO CONSOLIDATED FINANCIAL STATEMENTS
Deferred income taxes reflect the tax effect of temporary differences between the carrying value of assets and liabilities for financial reporting purposes and the value reported for income tax purposes, at the enacted tax rates expected to be in effect when the differences reverse. The components of deferred tax assets and liabilities are as follows (in thousands):
December 31, | |||||||
2014 | 2013 | ||||||
Deferred tax assets: | |||||||
Net operating loss carryforwards | $ | 10,183 | $ | 11,665 | |||
Allowance for doubtful accounts | 369 | 383 | |||||
Inventory valuation reserves | 1,896 | 1,503 | |||||
Equity compensation | 4,146 | 3,693 | |||||
Accrued compensation | 75 | 598 | |||||
Other | 1 | 1 | |||||
Total gross deferred tax assets | 16,670 | 17,843 | |||||
Valuation allowance | (809 | ) | (856 | ) | |||
Total deferred tax assets, net | 15,861 | 16,987 | |||||
Deferred tax liabilities: | |||||||
Property and equipment | (12,066 | ) | (12,374 | ) | |||
Intangible assets and goodwill | (9,823 | ) | (9,587 | ) | |||
Convertible debt | (4,126 | ) | (5,020 | ) | |||
Prepaid insurance and other | (225 | ) | (47 | ) | |||
Total gross deferred tax liabilities | (26,240 | ) | (27,028 | ) | |||
Net deferred tax (liabilities) assets | $ | (10,379 | ) | $ | (10,041 | ) | |
Deferred taxes are presented in the balance sheets as follows (in thousands):
December 31, | |||||||
2014 | 2013 | ||||||
Current deferred tax assets | $ | 2,696 | $ | 2,522 | |||
Non-current deferred tax assets | 12,907 | 15,012 | |||||
Non-current deferred tax liabilities | (25,982 | ) | (27,575 | ) | |||
Net deferred tax (liabilities) assets | $ | (10,379 | ) | $ | (10,041 | ) | |
During the year ended December 31, 2014, the Company recorded a final adjustment related to the acquisition of Florida Chemical that increased current deferred tax assets by $1.2 million (see Note 3).
As of December 31, 2014, the Company had U.S. net operating loss carryforwards of $26.3 million, expiring in various amounts in 2028 through 2030. The ability to utilize net operating losses and other tax attributes could be subject to a significant limitation if the Company were to undergo an “ownership change” for purposes of Section 382 of the Tax Code.
The Company’s corporate organizational structure requires the filing of two separate consolidated U.S. Federal income tax returns. Taxable income of one group ("Group A") cannot be offset by tax attributes, including net operating losses of the other group ("Group B"). The Company considers all available evidence, both positive and negative, to determine whether a valuation allowance is necessary. The Company considers cumulative losses in recent years as significant negative evidence. The Company considers recent years to mean the current year plus the two preceding years.
Prior to December 31, 2012, the Company did not have sufficient positive evidence to overcome the existence of a cumulative loss in Group B and thus, prior to December 31, 2012, maintained a full valuation allowance against deferred tax assets of that group. As of December 31, 2012, Group B was no longer in a cumulative loss position. Accordingly, the Company considered the objectively verifiable positive evidence for projecting future income, which included primarily determining the average of the pre-tax income of the current and prior two years after adjusting for certain items not indicative of future performance. Based on this analysis, the Company determined a valuation allowance was no longer necessary for the group's U.S. federal deferred tax
62
FLOTEK INDUSTRIES, INC.
NOTES TO CONSOLIDATED FINANCIAL STATEMENTS
assets. Accordingly, the Company decreased its valuation allowance by $16.5 million at December 31, 2012 and recognized a reduction of deferred federal income tax expense. As Group B continues to be in a cumulative loss position as of December 31, 2014 in certain state jurisdictions, the Company has determined that a valuation allowance of $0.8 million is required for deferred tax assets.
The Company has not calculated U.S. taxes on unremitted earnings of certain non-U.S. subsidiaries due to the Company’s intent to reinvest the unremitted earnings of the non-U.S. subsidiaries. At December 31, 2014, the Company had approximately $2.9 million in unremitted earnings outside the U.S. which were not included for U.S. tax purposes. U.S. income tax liability would be incurred if these funds were remitted to the U.S. It is not practicable to estimate the amount of the deferred tax liability on such unremitted earnings.
The Company has performed an evaluation and concluded that there are no significant uncertain tax positions requiring recognition in the Company’s financial statements. The evaluation was performed for the tax years which remain subject to examination by tax jurisdictions as of December 31, 2014 which are the years ended December 31, 2011 through December 31, 2014 for U.S. federal taxes and the years ended December 31, 2010 through December 31, 2014 for state tax jurisdictions.
The Company’s policy is to record penalties and interest related to income tax matters as income tax expense.
Note 14 — Convertible Preferred Stock and Stock Warrants
In August 2009, the Company sold convertible preferred stock with detachable warrants to purchase shares of the Company's common stock. In February 2011, the Company exercised its contractual right to mandatorily convert all outstanding shares of convertible preferred stock into shares of common stock. Currently, the Company has no issued or outstanding shares of preferred stock.
Due to the anti-dilution price adjustment provisions established at the issuance date, the warrants were deemed to be a liability and were recorded at fair value at the date of issuance. The warrant liability was adjusted to fair value at the end of each reporting period through the statement of operations during the period the anti-dilution price adjustment provisions were in effect. On June 14, 2012, contractual provisions within the Company's warrant agreements were modified to eliminate the anti-dilution price adjustment provisions of the warrants and remove the cash settlement provisions in the event of a change of control. The amended warrants then qualified to be classified as equity. Accordingly, the Company revalued the warrants as of June 14, 2012, the date of contractual amendment. The change in fair value of the warrant liability compared to the fair value on December 31, 2011, $2.6 million, was recognized in income during 2012. The revalued warrant liability of $14.0 million was reclassified to additional paid-in capital on June 14, 2012. There were no longer fair value adjustments because the warrants continued to meet the criteria for equity classification.
The Company used the Black-Scholes option-pricing model to estimate the fair value of the warrant liability for each reporting period. On June 14, 2012, the date the warrants were amended, inputs into the fair value calculation included the actual remaining term of the warrants, a volatility rate of 58.1%, a risk-free rate of return of 0.36%, and an assumed dividend rate of zero.
During the years ended December 31, 2013 and 2012, warrants were exercised to purchase 267,000 shares and 348,350 shares, respectively, of the Company’s common stock for which the Company received cash proceeds of $0.3 million and $0.4 million, respectively.
On February 7, 2014, warrants were exercised to purchase 1,277,250 shares of the Company’s common stock at $1.21 per share. The Company received cash proceeds of $1.5 million in connection with the warrants exercised. Following this exercise, the Company no longer has any outstanding warrants.
63
FLOTEK INDUSTRIES, INC.
NOTES TO CONSOLIDATED FINANCIAL STATEMENTS
Note 15 — Common Stock
The Company’s Certificate of Incorporation, as amended November 9, 2009, authorizes the Company to issue up to 80 million shares of common stock, par value $0.0001 per share, and 100,000 shares of one or more series of preferred stock, par value $0.0001 per share.
A reconciliation of the changes in common shares issued is as follows:
Year ended December 31, | |||||
2014 | 2013 | ||||
Shares issued at the beginning of the year | 58,265,911 | 53,123,978 | |||
Issued in purchase of Florida Chemical Company, Inc. | — | 3,284,180 | |||
Issued in purchases of Eclipse IOR Services, LLC and SiteLark, LLC | 99,681 | — | |||
Issued in payment of accrued liability | 27,101 | — | |||
Issued upon exercise of warrants | 1,277,250 | 267,000 | |||
Issued from restricted stock units | — | 217,089 | |||
Issued as restricted stock award grants | 525,120 | 802,164 | |||
Issued upon exercise of stock options | 311,954 | 571,500 | |||
Retirement of treasury shares | (5,873,291 | ) | — | ||
Shares issued at the end of the year | 54,633,726 | 58,265,911 | |||
Stock-Based Incentive Plans
Stockholders approved long term incentive plans in 2014, 2010, 2007, 2005 and 2003 (the "2014 Plan," the “2010 Plan,” the “2007 Plan,” the “2005 Plan” and the “2003 Plan,” respectively) under which the Company may grant equity awards to officers, key employees, and non-employee directors in the form of stock options, restricted stock and certain other incentive awards. The maximum number of shares that may be issued under the 2014 Plan, 2010 Plan, 2007 Plan and 2005 Plan are 2.7 million, 6.0 million, 2.2 million and 1.9 million, respectively. A December 31, 2014, the Company had a total of 2.3 million shares remaining to be granted under the 2014 Plan, 2010 Plan, 2007 Plan and 2005 Plan. Shares may no longer be granted under the 2003 Plan.
Stock Options
All stock options are granted with an exercise price equal to the market value of the Company’s common stock on the date of grant. Options expire no later than ten years from the date of grant and generally vest in four years or less. Proceeds received from stock option exercises are credited to common stock and additional paid-in capital, as appropriate. The Company uses historical data to estimate pre-vesting option forfeitures. Estimates are adjusted when actual forfeitures differ from the estimate. Stock-based compensation expense is recorded for all equity awards expected to vest.
The fair value of stock options at the date of grant is calculated using the Black-Scholes option pricing model. The risk free interest rate is based on the implied yield of U.S. Treasury zero-coupon securities that correspond to the expected life of the option. Volatility is estimated based on historical and implied volatilities of the Company’s stock and of identified companies considered to be representative peers of the Company. The expected life of awards granted represents the period of time the options are expected to remain outstanding. The Company uses the “simplified” method which is permitted for companies that cannot reasonably estimate the expected life of options based on historical share option exercise experience. The Company does not expect to pay dividends on common stock. No options were granted to employees during 2014, 2013 or 2012.
The Black-Scholes option valuation model was developed to estimate the fair value of traded options that have no vesting restrictions and are fully-transferable. Because option valuation models require the use of subjective assumptions, changes in these assumptions can materially affect the fair value calculation. The Company’s options are not characteristic of traded options; therefore, the option valuation models do not necessarily provide a reliable measure of the fair value of options.
64
FLOTEK INDUSTRIES, INC.
NOTES TO CONSOLIDATED FINANCIAL STATEMENTS
Stock option activity for the year ended December 31, 2014 is as follows:
Options | Shares | Weighted-Average Exercise Price | Weighted-Average Remaining Contractual Term (in years) | Aggregate Intrinsic Value | |||||||||
Outstanding as of January 1, 2014 | 1,864,042 | $ | 4.95 | ||||||||||
Exercised | (311,954 | ) | 5.32 | ||||||||||
Forfeited | (7,128 | ) | 17.58 | ||||||||||
Expired | — | — | |||||||||||
Outstanding as of December 31, 2014 | 1,544,960 | $ | 4.81 | 1.81 | $ | 21,497,484 | |||||||
Vested or expected to vest at | |||||||||||||
December 31, 2014 | 1,544,960 | $ | 4.81 | 1.81 | $ | 21,497,484 | |||||||
Options exercisable as of | |||||||||||||
December 31, 2014 | 1,544,960 | $ | 4.81 | 1.81 | $ | 21,497,484 | |||||||
The total intrinsic value of stock options exercised during the years ended December 31, 2014, 2013 and 2012 was $6.0 million, $5.6 million and $0.6 million, respectively. The total fair value of stock options vesting during the years ended December 31, 2014 was less than $0.1 million, and was $4.2 million and $0.5 million for the years ended December 31, 2013 and 2012, respectively.
At December 31, 2014, the Company had recognized all compensation expense related to stock options.
Restricted Stock
The Company grants employees either time-vesting or performance-based restricted shares in accordance with terms specified in the Restricted Stock Agreements ("RSAs"). Time-vesting restricted shares vest after a stipulated period of time has elapsed subsequent to the date of grant, generally three to four years. Certain time-vested shares have also been issued with a portion of the shares granted vesting immediately. Performance-based restricted shares are issued with performance criteria defined over a designated performance period and vest only when, and if, the outlined performance criteria are met. During the year ended December 31, 2014, approximately 62% of the restricted shares granted were time-vesting and the remainder were performance-based. Grantees of restricted shares retain voting rights for the granted shares.
Restricted stock share activity for the year ended December 31, 2014 is as follows:
Restricted Stock Shares | Shares | Weighted- Average Fair Value at Date of Grant | |||||
Non-vested at January 1, 2014 | 1,067,655 | $ | 12.78 | ||||
Granted | 349,544 | 27.29 | |||||
RSAs converted from 2013 restricted stock units | 175,576 | 16.35 | |||||
Vested | (705,566 | ) | 13.65 | ||||
Forfeited | (60,691 | ) | 14.89 | ||||
Non-vested at December 31, 2014 | 826,518 | $ | 18.78 | ||||
The weighted-average grant-date fair value of restricted stock granted during the years ended December 31, 2014, 2013 and 2012 was $27.29, $15.17 and $11.03 per share, respectively. The total fair value of restricted stock that vested during the years ended December 31, 2014, 2013 and 2012 was $10.2 million, $8.4 million and $5.4 million, respectively.
At December 31, 2014, there was $10.7 million of unrecognized compensation expense related to non-vested restricted stock. The unrecognized compensation expense is expected to be recognized over a weighted-average period of 1.8 years.
65
FLOTEK INDUSTRIES, INC.
NOTES TO CONSOLIDATED FINANCIAL STATEMENTS
Restricted Stock Units
During the year ended December 31, 2014, the Company granted performance-based restricted stock units ("RSUs") that will be converted into 352,254 shares of common stock. These shares, which will be issued as RSAs, will vest in equal one-half tranches on December 31, 2015 and 2016.
Restricted stock unit share activity for the year ended December 31, 2014 is as follows:
Restricted Stock Unit Shares | Shares | Weighted- Average Fair Value at Date of Grant | |||||
RSU share equivalents at January 1, 2014 | 175,576 | $ | 16.35 | ||||
2013 RSUs converted to RSAs in 2014 | (175,576 | ) | 16.35 | ||||
Share equivalents earned in 2014 | 352,254 | 24.66 | |||||
RSU share equivalents at December 31, 2014 | 352,254 | $ | 24.66 | ||||
At December 31, 2014, there was $6.8 million of unrecognized compensation expense related to 2014 restricted stock units. The unrecognized compensation expense is expected to be recognized over a weighted-average period of 2.0 years.
Employee Stock Purchase Plan
The Company's Employee Stock Purchase Plan (ESPP) was approved by stockholders on May 18, 2012. The Company registered 500,000 shares of its common stock, currently held as treasury shares, for issuance under the ESPP. The purpose of the ESPP is to provide employees with an opportunity to purchase shares of the Company's common stock through accumulated payroll deductions. The ESPP allows participants to purchase common stock at a purchase price equal to 85% of the fair market value of the common stock on the last business day of a three-month offering period which coincides with calendar quarters. The first quarterly offering period began on October 1, 2012. Payroll deductions may not exceed 10% of an employee's compensation and participants may not purchase more than 1,000 shares in any one offering period. The fair value of the discount associated with shares purchased under the plan is recognized as share-based compensation expense and was $0.2 million, $0.1 million and less than $0.1 million during the years ended December 31, 2014, 2013 and 2012, respectively. The total fair value of the shares purchased under the plan during the years ended December 31, 2014, 2013 and 2012 was $1.1 million, $0.9 million and $0.2 million, respectively. The employee payment associated with participation in the plan was satisfied through payroll deductions.
Share-Based Compensation Expense
Non-cash share-based compensation expense related to stock options, restricted stock, restricted stock unit grants and stock purchased under the Company's ESPP was $10.5 million, $10.9 million and $13.4 million during the years ended December 31, 2014, 2013 and 2012, respectively.
Treasury Stock
The Company accounts for treasury stock using the cost method and includes treasury stock as a component of stockholders’ equity. During the years ended December 31, 2014 and 2013, the Company purchased 243,005 shares and 448,121 shares, respectively, of the Company’s common stock at market value as payment of income tax withholding owed by employees upon the vesting of restricted shares and the exercise of stock options. Shares issued as restricted stock awards to employees that were forfeited are accounted for as treasury stock. During the years ended December 31, 2014 and 2013, shares surrendered for the exercise of stock options were 46,208 and 237,267, respectively. These surrendered shares are also accounted for as treasury stock.
During the year ended December 31, 2013, JP Morgan Chase & Co. returned 2,439,558 shares of the Company’s common stock that had been borrowed under the Share Lending Agreement. These shares were then included in treasury stock.
Retirement of Treasury Stock
On December 31, 2014, the Company retired 5,873,291 shares of its treasury stock with an aggregate cost of $32.6 million. The retirement was recorded as reductions of $32.6 million in treasury stock, $1,000 in common stock and $32.6 million in additional paid-in capital.
All retired treasury shares are canceled and returned to the status of authorized but unissued shares. The retirement of treasury stock had no impact on the Company's total consolidated stockholder's equity.
66
FLOTEK INDUSTRIES, INC.
NOTES TO CONSOLIDATED FINANCIAL STATEMENTS
Stock Repurchase Program
In November 2012, the Company's Board of Directors authorized the repurchase of up to $25 million of the Company's common stock. Repurchases may be made in the open market or through privately negotiated transactions. In December 2014, the Company repurchased 621,176 shares of its outstanding common stock on the open market at a cost of $10.4 million, inclusive of transaction costs, or an average price of $16.74 per share.
As of December 31, 2014, the Company has $14.6 million remaining under its share repurchase program.
Note 16 — Commitments and Contingencies
Litigation
The Company is subject to routine litigation and other claims that arise in the normal course of business. Management is not aware of any pending or threatened lawsuits or proceedings that are expected to have a material effect on the Company’s financial position, results of operations or liquidity.
Operating Lease Commitments
The Company has operating leases for office space, vehicles and equipment. Future minimum lease payments under operating leases at December 31, 2014 are as follows (in thousands):
Year ending December 31, | Minimum Lease Payments | |||
2015 | $ | 2,440 | ||
2016 | 2,647 | |||
2017 | 2,274 | |||
2018 | 2,060 | |||
2019 | 1,869 | |||
Thereafter | 13,918 | |||
Total | $ | 25,208 | ||
Rent expense under operating leases totaled $2.2 million, $1.7 million and $1.9 million during the years ended December 31, 2014, 2013 and 2012, respectively.
401(k) Retirement Plan
The Company maintains a 401(k) retirement plan for the benefit of eligible employees in the U.S. All employees are eligible to participate in the plan upon employment. The Company matches 100% of employee 401(k) contributions of up to 2% of qualified compensation. During the years ended December 31, 2014, 2013 and 2012, compensation expense included $0.7 million, $0.6 million and $0.5 million, respectively, related to the Company’s 401(k) match.
Concentrations and Credit Risk
The majority of the Company’s revenue is derived from the oil and gas industry. Customers include major oilfield services companies, major integrated oil and natural gas companies, independent oil and natural gas companies, pressure pumping service companies and state-owned national oil companies. This concentration of customers in one industry increases credit and business risks.
The Company is subject to significant concentrations of credit risk within trade accounts receivable as the Company does not generally require collateral as support for trade receivables. In addition, the majority of the Company’s cash is maintained at a major financial institution and balances often exceed insurable amounts.
67
FLOTEK INDUSTRIES, INC.
NOTES TO CONSOLIDATED FINANCIAL STATEMENTS
Note 17 — Business Segment, Geographic and Major Customer Information
Segment Information
Operating segments are defined as components of an enterprise for which separate financial information is available that is regularly evaluated by chief operating decision-makers in deciding how to allocate resources and assess performance. The operations of the Company are categorized into four reportable segments: Energy Chemical Technologies, Consumer and Industrial Chemical Technologies, Drilling Technologies and Production Technologies.
• | Energy Chemical Technologies designs, develops, manufactures, packages and markets specialty chemicals used in oil and natural gas well drilling, cementing, completion, stimulation, and production. In addition, the Company's chemistries are used in specialized enhanced and improved oil recovery markets ("EOR" or "IOR"). Activities in this segment also include construction and management of automated material handling facilities and management of loading facilities and blending operations for oilfield services companies. |
• | Consumer and Industrial Chemical Technologies designs, develops and manufactures products that are sold to companies in the flavor and fragrance industry and the specialty chemical industry. These technologies are used by beverage and food companies, fragrance companies, and companies providing household and industrial cleaning products. |
• | Drilling Technologies rents, inspects, manufactures and markets downhole drilling equipment used in energy, mining, water well and industrial drilling activities. |
• | Production Technologies assembles and markets production-related equipment, including the PetrovalveTM product line of rod pump components, electric submersible pumps, gas separators, valves and services that support natural gas and oil production activities. |
The Company evaluates performance based upon a variety of criteria. The primary financial measure is segment operating income. Various functions, including certain sales and marketing activities and general and administrative activities, are provided centrally by the corporate office. Costs associated with corporate office functions, other corporate income and expense items, and income taxes, are not allocated to reportable segments.
68
FLOTEK INDUSTRIES, INC.
NOTES TO CONSOLIDATED FINANCIAL STATEMENTS
Summarized financial information of the reportable segments is as follows (in thousands):
As of and for the year ended December 31, | Energy Chemical Technologies | Consumer and Industrial Chemical Technologies | Drilling Technologies | Production Technologies | Corporate and Other | Total | ||||||||||||||||||
2014 | ||||||||||||||||||||||||
Net revenue from external customers | $ | 268,761 | $ | 51,091 | $ | 113,302 | $ | 16,003 | $ | — | $ | 449,157 | ||||||||||||
Gross margin | 117,867 | 12,897 | 45,651 | 6,544 | — | 182,959 | ||||||||||||||||||
Income (loss) from operations | 84,846 | 6,558 | 19,022 | 3,246 | (32,784 | ) | 80,888 | |||||||||||||||||
Depreciation and amortization | 4,401 | 2,138 | 9,808 | 327 | 1,174 | 17,848 | ||||||||||||||||||
Total assets | 156,596 | 87,412 | 147,584 | 21,843 | 9,841 | 423,276 | ||||||||||||||||||
Capital expenditures | 6,983 | 115 | 9,626 | 942 | 2,241 | 19,907 | ||||||||||||||||||
2013 | ||||||||||||||||||||||||
Net revenue from external customers | $ | 200,932 | $ | 42,927 | $ | 112,406 | $ | 14,800 | $ | — | $ | 371,065 | ||||||||||||
Gross margin | 88,536 | 10,659 | 43,156 | 5,176 | — | 147,527 | ||||||||||||||||||
Income (loss) from operations | 65,396 | 6,260 | 18,306 | 3,060 | (34,296 | ) | 58,726 | |||||||||||||||||
Depreciation and amortization | 3,160 | 1,126 | 9,632 | 250 | 941 | 15,109 | ||||||||||||||||||
Total assets | 127,119 | 86,640 | 135,738 | 16,647 | 9,437 | 375,581 | ||||||||||||||||||
Capital expenditures | 5,225 | 183 | 6,326 | 1,749 | 1,524 | 15,007 | ||||||||||||||||||
2012 | ||||||||||||||||||||||||
Net revenue from external customers | $ | 183,986 | $ | — | $ | 116,736 | $ | 12,106 | $ | — | $ | 312,828 | ||||||||||||
Gross margin | 81,438 | — | 45,709 | 4,472 | — | 131,619 | ||||||||||||||||||
Income (loss) from operations | 65,440 | — | 22,282 | 3,395 | (32,496 | ) | 58,621 | |||||||||||||||||
Depreciation and amortization | 1,765 | — | 9,115 | 206 | 497 | 11,583 | ||||||||||||||||||
Total assets | 59,195 | — | 118,771 | 11,189 | 30,712 | 219,867 | ||||||||||||||||||
Capital expenditures | 3,553 | — | 12,264 | 77 | 4,807 | 20,701 | ||||||||||||||||||
Geographic Information
Revenue by country is based on the location where services are provided and products are used. No individual country other than the United States ("U.S.") accounted for more than 10% of revenue. Revenue by geographic location is as follows (in thousands):
Year ended December 31, | |||||||||||
2014 | 2013 | 2012 | |||||||||
U.S. | $ | 370,087 | $ | 319,649 | $ | 272,945 | |||||
Other countries | 79,070 | 51,416 | 39,883 | ||||||||
Total | $ | 449,157 | $ | 371,065 | $ | 312,828 | |||||
Long-lived assets held in countries other than the U.S. are not considered material to the consolidated financial statements.
69
FLOTEK INDUSTRIES, INC.
NOTES TO CONSOLIDATED FINANCIAL STATEMENTS
Major Customers
Revenue from major customers, as a percentage of consolidated revenue, is as follows:
Year ended December 31, | |||||
2014 | 2013 | 2012 | |||
Customer A | 16.1% | 16.2% | 15.6% | ||
Customer B | * | * | 10.0% | ||
*This customer did not account for more than 10% of revenue.
Over 94% of the revenue from major customers noted above was from the Energy Chemical Technologies segment.
Note 18 — Quarterly Financial Data (Unaudited)
First Quarter | Second Quarter | Third Quarter | Fourth Quarter | Total | |||||||||||||||
(in thousands, except per share data) | |||||||||||||||||||
2014 | |||||||||||||||||||
Revenue | $ | 102,575 | $ | 105,318 | $ | 116,761 | $ | 124,503 | $ | 449,157 | |||||||||
Gross margin | 43,681 | 42,310 | 46,078 | 50,890 | 182,959 | ||||||||||||||
Net income | 12,018 | 11,041 | 14,272 | 16,272 | 53,603 | ||||||||||||||
Earnings per share (1): | |||||||||||||||||||
Basic | $ | 0.22 | $ | 0.20 | $ | 0.26 | $ | 0.30 | $ | 0.98 | |||||||||
Diluted | $ | 0.22 | $ | 0.20 | $ | 0.26 | $ | 0.29 | $ | 0.97 | |||||||||
2013 | |||||||||||||||||||
Revenue | $ | 78,243 | $ | 93,586 | $ | 98,388 | $ | 100,848 | $ | 371,065 | |||||||||
Gross margin | 32,630 | 37,594 | 37,502 | 39,801 | 147,527 | ||||||||||||||
Net income | 7,765 | 8,440 | 8,968 | 11,005 | 36,178 | ||||||||||||||
Earnings per share (1): | |||||||||||||||||||
Basic | $ | 0.16 | $ | 0.17 | $ | 0.17 | $ | 0.21 | $ | 0.70 | |||||||||
Diluted | $ | 0.15 | $ | 0.16 | $ | 0.16 | $ | 0.20 | $ | 0.67 | |||||||||
(1) The sum of the quarterly earnings per share (basic and diluted) may not agree to the earnings per share for the year due to the timing of common stock issuances.
70
Item 9. Changes in and Disagreements With Accountants on Accounting and Financial Disclosure.
Not applicable.
Item 9A. Controls and Procedures.
Evaluation of Disclosure Controls and Procedures
The Company's disclosure controls and procedures are designed to ensure that information required to be disclosed by the Company in reports filed or submitted under the Securities Exchange Act of 1934, as amended (the “Exchange Act”), is recorded, processed, summarized and reported within the time periods specified in the SEC's rules and forms. The Company's disclosure controls and procedures are also designed to ensure such information is accumulated and communicated to management, including the principal executive and principal financial officers, as appropriate to allow timely decisions regarding required disclosures. There are inherent limitations to the effectiveness of any system of disclosure controls and procedures, including the possibility of human error and the circumvention or overriding of controls and procedures. Accordingly, even effective disclosure controls and procedures can only provide reasonable assurance that control objectives are attained. The Company's disclosure controls and procedures are designed to provide such reasonable assurance.
The Company's management, with the participation of the principal executive and principal financial officers, evaluated the effectiveness of the design and operation of the Company's disclosure controls and procedures as of December 31, 2014, as required by Rule 13a-15(e) of the Exchange Act. Based upon that evaluation, the principal executive and principal financial officers have concluded that the Company's disclosure controls and procedures were effective as of December 31, 2014.
Management’s Report on Internal Control over Financial Reporting
The Company's management is responsible for establishing and maintaining adequate internal control over financial reporting, as defined in Rule 13a-15(f) of the Exchange Act. The Company's management, including the principal executive and principal financial officers, assessed the effectiveness of internal control over financial reporting as of December 31, 2014, based on criteria issued by the Committee of Sponsoring Organizations of the Treadway Commission (2013 Framework) ("COSO") in “Internal Control – Integrated Framework.” Upon evaluation, the Company's management has concluded that the Company's internal control over financial reporting was effective in connection with the preparation of the consolidated financial statements as of December 31, 2014.
The effectiveness of the Company's internal control over financial reporting as of December 31, 2014 has been audited by Hein & Associates LLP, an independent registered public accounting firm, as stated in their report which is included herein.
Changes in Internal Control Over Financial Reporting
There have been no changes in the Company's system of internal control over financial reporting during the three months ended December 31, 2014 that have materially affected, or are reasonably likely to materially affect, the Company's internal control over financial reporting.
Item 9B. Other Information.
None.
71
PART III
Item 10. Directors, Executive Officers and Corporate Governance.
The information required by this Item is incorporated by reference to the Company’s Definitive Proxy Statement for the 2015 Annual Meeting of Stockholders to be filed with the SEC within 120 days of year end.
Item 11. Executive Compensation.
The information required by this Item is incorporated by reference to the Company’s Definitive Proxy Statement for the 2015 Annual Meeting of Stockholders to be filed with the SEC within 120 days of year end.
Item 12. Security Ownership of Certain Beneficial Owners and Management and Related Stockholder Matters.
The information required by this Item is incorporated by reference to the Company’s Definitive Proxy Statement for the 2015 Annual Meeting of Stockholders to be filed with the SEC within 120 days of year end.
Item 13. Certain Relationships and Related Transactions, and Director Independence.
The information required by this Item is incorporated by reference to the Company’s Definitive Proxy Statement for the 2015 Annual Meeting of Stockholders to be filed with the SEC within 120 days of year end.
Item 14. Principal Accountant Fees and Services.
The information required by this Item is incorporated by reference to the Company’s Definitive Proxy Statement for the 2015 Annual Meeting of Stockholders to be filed with the SEC within 120 days of year end.
72
PART IV
Item 15. Exhibits and Financial Statement Schedules.
EXHIBIT INDEX
Exhibit Number | Exhibit Title | |
2.1 | Agreement and Plan of Merger dated May 10, 2013, by and among Flotek Industries, Inc., Flotek Acquisition Inc. and Florida Chemical Company, Inc. (incorporated by reference to Exhibit 2.1 to the Company's Form 8-K filed on May 13, 2013). | |
3.1 | Amended and Restated Certificate of Incorporation (incorporated by reference to Exhibit 3.1 to the Company’s Form 10-Q for the quarter ended September 30, 2007). | |
3.2 | Certificate of Designations for Series A Cumulative Convertible Preferred Stock dated August 11, 2009 (incorporated by reference to Exhibit 3.1 to the Company’s Form 8-K filed on August 17, 2009). | |
3.3 | Certificate of Amendment to the Amended and Restated Certificate of Incorporation (incorporated by reference to Exhibit 3.1 to the Company’s Form 10-Q for the quarter ended September 30, 2009). | |
3.4 | Amended and Restated Bylaws, dated December 9, 2014 (incorporated by reference to Exhibit 3.1 to the Company's Form 8-K filed on December 10, 2014). | |
4.1 | Form of Certificate of Common Stock (incorporated by reference to Appendix E to the Company’s Definitive Proxy Statement filed on September 27, 2001). | |
4.2 | Form of Certificate of Series A Cumulative Convertible Preferred Stock (incorporated by reference to Exhibit A to the Certificate of Designations for Series A Cumulative Convertible Preferred Stock filed as Exhibit 3.1 to the Company’s Form 8-K filed on August 17, 2009). | |
4.3 | Form of Warrant to Purchase Common Stock of the Company, dated August 31, 2000 (incorporated by reference to Exhibit 4.3 to the Company’s Registration Statement on Form SB-2 (File no. 333-129308) filed on October 28, 2005). | |
4.4 | Form of Exercisable Warrant, dated August 11, 2009 (incorporated by reference to Exhibit 4.1 to the Company’s Form 8-K filed on August 17, 2009). | |
4.5 | Form of Contingent Warrant, dated August 11, 2009 (incorporated by reference to Exhibit 4.2 to the Company’s Form 8-K filed on August 17, 2009). | |
4.6 | Amendment to Warrant to Purchase Common Stock, dated June 14, 2012, by and among the Company and each of the holders party thereto (incorporated by reference to Exhibit 10.1 to the Company's Form 8-K filed on June 18, 2012). | |
4.7 | Amendment to Amended and Restated Warrant to Purchase Common Stock, dated as of February 5, 2014 (incorporated by reference to Exhibit 10.1 to the Company's Form 8-K filed on February 11, 2014). | |
10.1 | 2003 Long-Term Incentive Plan (incorporated by reference to Exhibit 10.1 to the Company’s Registration Statement on Form S-8 filed on October 27, 2005). | |
10.2 | 2005 Long-Term Incentive Plan (incorporated by reference to Exhibit 10.2 to the Company’s Registration Statement on Form S-8 filed on October 27, 2005). | |
10.3 | 2007 Long-Term Incentive Plan (incorporated by reference to Exhibit 10.6 to the Company’s Form 10-K for the year ended December 31, 2007). | |
10.4 | Exclusive License Agreement, dated April 3, 2006, among the Company, USA Petrovalve, Inc. and Total Well Solutions, LLC (incorporated by reference to Exhibit 10.2 to the Company’s Form 10-QSB for the quarter ended June 30, 2006). | |
10.5 | Form of Unit Purchase Agreement, dated August 11, 2009 (incorporated by reference to Exhibit 10.1 to the Company’s Form 8-K filed on August 12, 2009). | |
10.6 | Indenture, dated as of March 31, 2010, among the Company, the subsidiary guarantors named therein and U.S. Bank National Association (incorporated by reference to Exhibit 4.1 to the Company’s Form 8-K filed on April 6, 2010). | |
10.7 | 2010 Long-Term Incentive Plan (incorporated by reference to Appendix A to the Company’s Definitive Proxy Statement filed on July 13, 2010). | |
10.8 | Form of Subscription Agreement (incorporated by reference to Exhibit 4.7 to the Company’s Registration Statement on Form S-3 (File No. 333-174199) filed on May 13, 2011). | |
10.9 | Non-Qualified Stock Option Agreement, dated April 8, 2011, between the Company and Steve Reeves (incorporated by reference to Exhibit 10.5 to the Company’s Form 10-Q for the quarter ended June 30, 2011). | |
10.10 | Non-Qualified Stock Option Agreement, dated April 8, 2011, between the Company and John W. Chisholm (incorporated by reference to Exhibit 10.7 to the Company’s Form 10-Q for the quarter ended June 30, 2011). | |
73
Exhibit Number | Exhibit Title | |
10.11 | Revolving Credit and Security Agreement dated as of September 23, 2011 (incorporated by reference to Exhibit 10.1 to the Company’s Form 8-K filed on September 26, 2011). | |
10.12 | Guaranty dated September 23, 2011 (incorporated by reference to Exhibit 10.2 to the Company’s Form 8-K filed on September 26, 2011). | |
10.13 | Security Agreement dated September 23, 2011 (incorporated by reference to Exhibit 10.3 to the Company’s Form 8-K filed on September 26, 2011). | |
10.14 | Intellectual Property Security Agreement dated September 23, 2011 (incorporated by reference to Exhibit 10.4 to the Company’s Form 8-K filed on September 26, 2011). | |
10.15 | Lien Subordination and Intercreditor Agreement dated as of September 23, 2011 (incorporated by reference to Exhibit 10.5 to the Company’s Form 8-K filed on September 26, 2011). | |
10.16 | Third Amended and Restated Service Agreement, dated as of March 5, 2012, by and among the Company, Protechnics II, Inc. and Chisholm Management, Inc. (incorporated by reference to Exhibit 10.1 to the Company's Form 8-K filed on March 12, 2012). | |
10.17 | Employment Agreement, dated June 1, 2012, between the Company and Steve Reeves (incorporated by reference to Exhibit 10.1 to the Company's Form 8-K filed on May 21, 2012). | |
10.18 | Second Amendment to Revolving Credit and Security Agreement dated as of November 12, 2012 (incorporated by reference to Exhibit 10.1 to the Company's Form 8-K filed on November 14, 2012). | |
10.19 | Third Amendment to Revolving Credit and Security Agreement dated as of December 14, 2012 (incorporated by reference to Exhibit 10.1 to the Company's Form 8-K filed on December 17, 2012). | |
10.20 | Fourth Amendment to Revolving Credit Security Agreement dated as of December 27, 2012 (incorporated by reference to Exhibit 10.1 to the Company's Form 8-K filed on December 28, 2012). | |
10.21 | Employment Agreement, dated effective March 13, 2013 between the Company and H. Richard Walton (incorporated by reference to Exhibit 10.1 to the Company's Form 8-K filed on March 15, 2013). | |
10.22 | Restricted Stock Agreement, dated effective March 13, 2013 between the Company and H. Richard Walton (incorporated by reference to Exhibit 10.2 to the Company's Form 8-K filed on March 15, 2013). | |
10.23 | Fourth Amended and Restated Service Agreement, dated as of April 1, 2013 between the Company, Protechnics II, Inc. and Chisholm Management, Inc. (incorporated by reference to Exhibit 10.1 to the Company's Form 8-K filed on April 3, 2013). | |
10.24 | Letter Agreement, dated as of April 1, 2013 between the Company and John Chisholm (incorporated by reference to Exhibit 10.2 to the Company's Form 8-K filed on April 3, 2013). | |
10.25 | Registration Rights Agreement dated May 10, 2013, by and among Flotek Industries, Inc. and the stockholders party thereto (incorporated by reference to Exhibit 10.1 to the Company's Form 8-K filed on May 13, 2013). | |
10.26 | Amended and Restated Revolving Credit, Term Loan and Security Agreement dated May 10, 2013 (incorporated by reference to Exhibit 10.2 to the Company's Form 8-K filed on May 13, 2013). | |
10.27 | Amendment to Employment Agreement dated June 1, 2012 between the Company and Steven A. Reeves, effective June 23, 2013 (incorporated by reference to Exhibit 10.5 to the Company’s Form 10-Q for the quarter ended June 30, 2013). | |
10.28 | Amendment to Employment Agreement dated November 10, 2011 between the Company and Kevin Fisher, effective June 23, 2013 (incorporated by reference to Exhibit 10.6 to the Company’s Form 10-Q for the quarter ended June 30, 2013). | |
10.29 | First Amendment to Amended and Restated Revolving Credit, Term Loan and Security Agreement dated December 31, 2013 (incorporated by reference to Exhibit 10.1 to the Company's Form 8-K filed on January 7, 2014). | |
10.30 | Employment Agreement, dated effective February 5, 2014 between the Company and Joshua A. Snively, Sr. (incorporated by reference to Exhibit 10.2 to the Company's Form 8-K filed on February 11, 2014). | |
10.31 | Restricted Stock Agreement, dated effective February 5, 2014 between the Company and Joshua A. Snively, Sr. (incorporated by reference to Exhibit 10.3 to the Company's Form 8-K filed on February 11, 2014). | |
10.32 | 2014 Long-Term Incentive Plan (incorporated by reference to Exhibit A to the Company's Definitive Proxy Statement filed on April 18, 2014). | |
10.33 | Fifth Amended and Restated Service Agreement, dated as of April 15, 2014, between the Company, Protechnics II, Inc. and Chisholm Management, Inc. (incorporated by reference to Exhibit 10.1 to the Company's Form 8-K filed on April 21, 2014). | |
10.34 | Letter Agreement, dated as of April 15, 2014, between the Company and John Chisholm (incorporated by reference to Exhibit 10.2 to the Company's Form 8-K filed on April 21, 2014). | |
74
Exhibit Number | Exhibit Title | |
10.35 | Second Amendment to Amended and Restated Revolving Credit, Term Loan and Security Agreement dated December 5, 2014 (incorporated by reference to Exhibit 10.1 to the Company's Form 8-K filed on December 10, 2014). | |
10.36 | Employment Agreement, dated effective December 31, 2014 between the Company and Steve Reeves (incorporated by reference to Exhibit 10.1 to the Company's Form 8-K filed on January 7, 2015). | |
21* | List of Subsidiaries. | |
23* | Consent of Hein & Associates LLP. | |
31.1* | Rule 13a-14(a) Certification of Principal Executive Officer. | |
31.2* | Rule 13a-14(a) Certification of Principal Financial Officer. | |
32.1* | Section 1350 Certification of Principal Executive Officer. | |
32.2* | Section 1350 Certification of Principal Financial Officer. | |
101.INS** | XBRL Instance Document. | |
101.SCH** | XBRL Schema Document. | |
101.CAL** | XBRL Calculation Linkbase Document. | |
101.LAB** | XBRL Label Linkbase Document. | |
101.PRE** | XBRL Presentation Linkbase Document. | |
101.DEF** | XBRL Definition Linkbase Document. | |
* Filed herewith.
** Furnished with this Form 10-K, not filed.
75
SIGNATURES
Pursuant to the requirements of Section 13 or 15(d) of the Securities Exchange Act of 1934, the registrant has duly caused this report to be signed on its behalf by the undersigned, thereunto duly authorized.
FLOTEK INDUSTRIES, INC. | ||
By: | /s/ JOHN W. CHISHOLM | |
John W. Chisholm | ||
President, Chief Executive Officer and Chairman of the Board | ||
Date: January 27, 2015
Pursuant to the requirements of the Securities Exchange Act of 1934, this report has been signed below by the following persons on behalf of the registrant and in the capacities and on the dates indicated.
Signature | Title | Date | ||
/s/ JOHN W. CHISHOLM | President, Chief Executive Officer and Chairman of the Board | January 27, 2015 | ||
John W. Chisholm | (Principal Executive Officer) | |||
/s/ H. RICHARD WALTON | Chief Financial Officer | January 27, 2015 | ||
H. Richard Walton | (Principal Financial Officer and Principal Accounting Officer) | |||
/s/ KENNETH T. HERN | Director | January 27, 2015 | ||
Kenneth T. Hern | ||||
/s/ JOHN S. REILAND | Director | January 27, 2015 | ||
John S. Reiland | ||||
/s/ L.V. "BUD" MCGUIRE | Director | January 27, 2015 | ||
L.V. “Bud” McGuire | ||||
/s/ L. MELVIN COOPER | Director | January 27, 2015 | ||
L. Melvin Cooper | ||||
/s/ CARLA S. HARDY | Director | January 27, 2015 | ||
Carla S. Hardy | ||||
/s/ TED D. BROWN | Director | January 27, 2015 | ||
Ted D. Brown | ||||
76