Attached files
| file | filename |
|---|---|
| 8-K - NEW JERSEY RESOURCES CORP | c79894_8k.htm |
| EX-99.2 - NEW JERSEY RESOURCES CORP | c79894_ex99-2.htm |
Exhibit 99.1

January 21, 2015

2 - for - 1 Stock Split » Record date: February 6, 2015 » Entitles all shareowners to receive one share for every share owned » Action taken in response to excellent earnings and stock price performance » Shares to begin trading at post - split price March 4, 2015 1

ANNUAL SHAREOWNERS MEETING January 21, 2015

Regarding Forward - Looking Statements 3 Certain statements contained in this presentation are forward - looking statements within the meaning of the Private Securities Litigation Reform Act of 1995 . New Jersey Resources (NJR or the Company) cautions readers that the assumptions forming the basis for forward - looking statements include many factors that are beyond NJR’s ability to control or estimate precisely, such as estimates of future market conditions and the behavior of other market participants . Words such as “anticipates,” “estimates,” “expects,” “projects,” “may,” “will,” “intends,” “plans,” “believes,” “should” and similar expressions may identify forward - looking information and such forward - looking statements are made based upon management’s current expectations and beliefs as of this date concerning future developments and their potential effect upon NJR . There can be no assurance that future developments will be in accordance with management’s expectations or that the effect of future developments on NJR will be those anticipated by management . Forward - looking information in this presentation includes, but is not limited to, certain statements regarding NJR's NFE guidance for fiscal 2015 , forecasted contribution of business segments to fiscal 2015 NFE and to NFE beyond fiscal 2015 , long - term benefits of increased NFE, forecasted dividend growth and payout ratio, future NJNG customer growth, expected contribution by new customers of NJNG to utility gross margin, future capital expenditures and infrastructure investments, NJNG incremental utility gross margin growth, the long - term outlook for NJRCEV, diversification of NJRCEV’s strategy, SREC prices and inventory levels, NJRCEV’s future solar and wind projects, and the PennEast Pipeline project . The factors that could cause actual results to differ materially from NJR’s expectations include, but are not limited to, weather and economic conditions ; demographic changes in the NJNG service territory and their effect on NJNG's customer growth ; volatility of natural gas and other commodity prices and their impact on NJNG customer usage, NJNG's Basic Gas Supply Service incentive programs, NJRES' operations and on the Company's risk management efforts ; changes in rating agency requirements and/or credit ratings and their effect on availability and cost of capital to the Company ; the impact of volatility in the credit markets ; the ability to comply with debt covenants ; the impact to the asset values and resulting higher costs and funding obligations of NJR's pension and post employment benefit plans as a result of downturns in the financial markets, a lower discount rate, and impacts associated with the Patient Protection and Affordable Care Act ; accounting effects and other risks associated with hedging activities and use of derivatives contracts ; commercial and wholesale credit risks, including the availability of creditworthy customers and counterparties and liquidity in the wholesale energy trading market ; regulatory approval of NJNG’s planned infrastructure programs ; the ability to obtain governmental and regulatory approvals, land - use rights, electric grid interconnection (in the case of distributed power projects) and/or financing for the construction, development and operation of NJR’s energy investments and NJNG’s infrastructure projects in a timely manner ; risks associated with the management of the Company's joint ventures and partnerships ; risks associated with our investments in distributed power projects, including the availability of regulatory and tax incentives, the availability of viable projects and NJR's eligibility for ITCs and PTCs, the future market for SRECs (including the pace of solar project development in New Jersey), and operational risks related to projects in service ; timing of qualifying for ITCs and PTCs due to delays or failures to complete planned solar and wind energy projects and the resulting effect on our effective tax rate and earnings ; the level and rate at which NJNG's costs and expenses are incurred and the extent to which they are allowed to be recovered from customers through the regulatory process ; access to adequate supplies of natural gas and dependence on third - party storage and transportation facilities for natural gas supply ; operating risks incidental to handling, storing, transporting and providing customers with natural gas ; risks related to our employee workforce ; the regulatory and pricing policies of federal and state regulatory agencies ; the costs of compliance with present and future environmental laws, including potential climate change - related legislation ; risks related to changes in accounting standards ; the disallowance of recovery of environmental - related expenditures and other regulatory changes ; environmental - related and other litigation and other uncertainties ; risks related to cyber - attack or failure of information technology systems ; and the impact of natural disasters, terrorist activities, and other extreme events on our operations and customers, including any impacts to utility gross margin, and restoration costs resulting from Superstorm Sandy . The aforementioned factors are detailed in the “Risk Factors” sections of our Annual Report on Form 10 - K filed on November 25 , 2014 , as filed with the Securities and Exchange Commission (SEC), which is available on the SEC’s website at sec . gov . Information included in this presentation is representative as of today only and while NJR periodically reassesses material trends and uncertainties affecting NJR's results of operations and financial condition in connection with its preparation of management's discussion and analysis of results of operations and financial condition contained in its Quarterly and Annual Reports filed with the SEC, NJR does not, by including this statement, assume any obligation to review or revise any particular forward - looking statement referenced herein in light of future events .

Disclaimer Regarding Non - GAAP Financial Measures 4 This presentation includes the non - GAAP measures net financial earnings (NFE), utility gross margin and financial margin . As indicators of the Company’s operating performance, these measures should not be considered alternatives to, or more meaningful than, GAAP measures, such as cash flow, net income, operating income or earnings per share . NFE (loss) and financial margin exclude unrealized gains or losses on derivative instruments related to the company’s unregulated subsidiaries and certain realized gains and losses on derivative instruments related to natural gas that has been placed into storage at NJRES . Volatility associated with the change in value of these financial and physical commodity contracts is reported in the income statement in the current period . In order to manage its business, NJR views its results without the impacts of the unrealized gains and losses, and certain realized gains and losses, caused by changes in value of these financial instruments and physical commodity contracts prior to the completion of the planned transaction because it shows changes in value currently as opposed to when the planned transaction ultimately is settled . An annual estimated effective tax rate is calculated for NFE purposes and any necessary quarterly tax adjustment is applied to NJRCEV, as such adjustment is related to tax credits generated by NJRCEV . NJNG’s utility gross margin represents the results of revenues less natural gas costs, sales and other taxes and regulatory rider expenses, which are key components of the company’s operations that move in relation to each other . Natural gas costs, sales and other taxes and regulatory rider expenses are passed through to customers and, therefore, have no effect on gross margin . Management uses NFE, utility gross margin and financial margin as supplemental measures to other GAAP results to provide a more complete understanding of the Company’s performance . Management believes these non - GAAP measures are more reflective of the Company’s business model, provide transparency to investors and enable period - to - period comparability of financial performance . For a full discussion of our non - GAAP financial measures, please see NJR’s most recent Form 10 - K, Item 7 . This information has been provided pursuant to the requirements of SEC Regulation G .
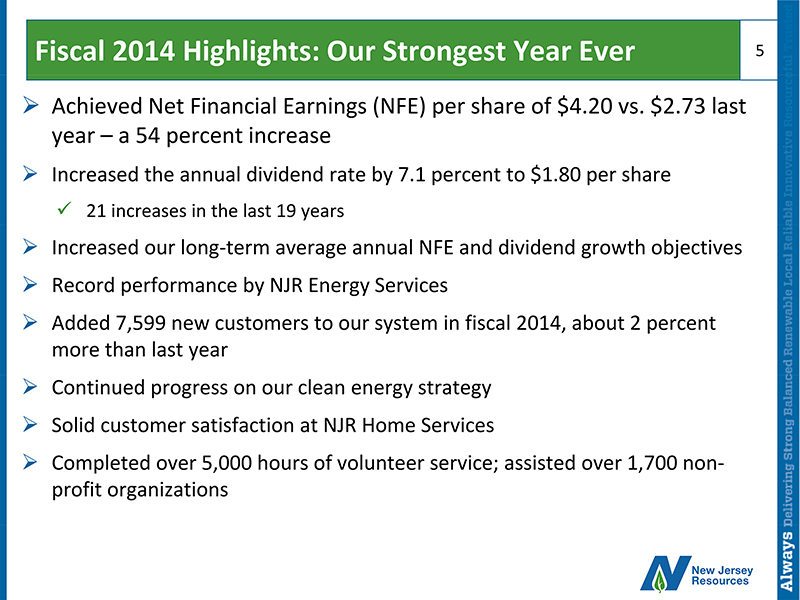
Fiscal 2014 Highlights: Our Strongest Year Ever » Achieved Net Financial Earnings ( NFE ) per share of $4.20 vs. $2.73 last year – a 54 percent increase » Increased the annual dividend rate by 7.1 percent to $ 1.80 per share x 21 increases in the last 19 years » Increased our long - term average annual NFE and dividend growth objectives » Record performance by NJR Energy Services » Added 7,599 new customers to our system in fiscal 2014, about 2 percent more than last year » Continued progress on our clean energy strategy » Solid customer satisfaction at NJR Home Services » Completed over 5,000 hours of volunteer service; assisted over 1,700 non - profit organizations 5

Safety and Reliability: Our Top Priority » Invested more than $65 million in our system in fiscal 2014 x More than $337 million since 2010 » Plan to spend nearly $80 million in fiscal 2015 » Lowest number of leaks per mile of any local d istribution c ompany in New Jersey » Safety performance acknowledged by Northeast Gas Association and the American Gas Association Best Practices Program 6
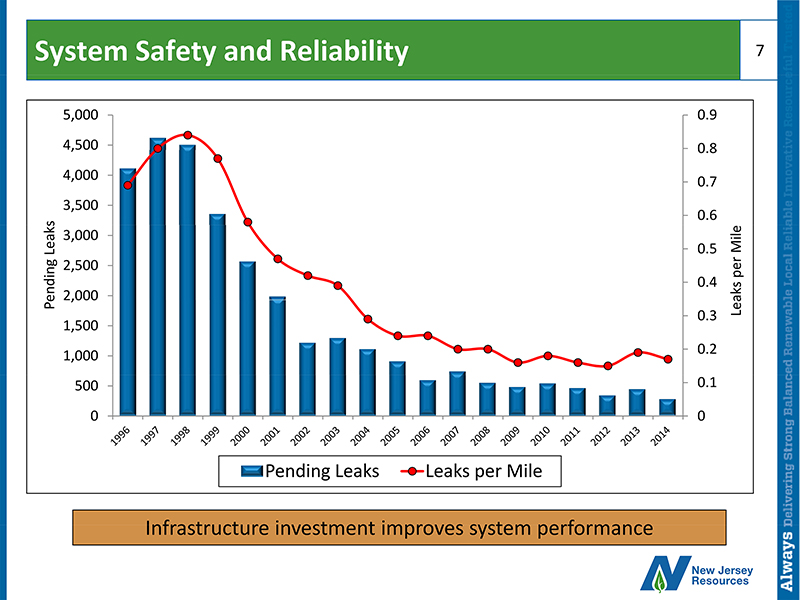
System Safety and Reliability 0 0.1 0.2 0.3 0.4 0.5 0.6 0.7 0.8 0.9 0 500 1,000 1,500 2,000 2,500 3,000 3,500 4,000 4,500 5,000 Leaks per Mile Pending Leaks Pending Leaks Leaks per Mile 7 Infrastructure investment improves system performance

Consistent Financial Performance 8 $1.00 $1.50 $2.00 $2.50 $3.00 $3.50 $4.00 $4.50 2004 2005 2006 2007 2008 2009 2010 2011 2012 2013 2014 $1.73 $1.84 $1.88 $2.11 $2.24 $2.40 $2.46 $2.58 $2.71 $2.73 $4.20 Net Financial Earnings Per Share

Fiscal 2015 NFE Per Share Guidance - $ 2.90 to $3.10 9 New Jersey Natural Gas 60 - 70% NJR Midstream 5 - 10% NJR Clean Energy Ventures 10 - 20% NJR Home Services 2 - 5% NJR Energy Services 5 - 15% Regulated businesses expected to contribute 65 - 80 percent of total NFE

Dividend Growth and Payout Ratio 10 Dividend growth objective of 6 to 8 percent annually * Current annual rate ** Based on the midpoint of NFE guidance 30% 35% 40% 45% 50% 55% 60% 65% 70% 2010 2011 2012 2013 2014 2015E** 55 % 56 % 57 % 59 % 41% 60% $1.00 $1.25 $1.50 $1.75 $2.00 2010 2011 2012 2013 2014 2015* $1.36 $1.44 $1.54 $1.62 $1.71 $1.80 Payout Ratio on an NFE Basis Dividend Growth

New Jersey Natural Gas: The Foundation of Our Business » Growing customer base – primarily residential and commercial » Commitment to environmental stewardship » Collaborative regulatory relations » High customer satisfaction 11 Our primary focus is on safe, reliable service
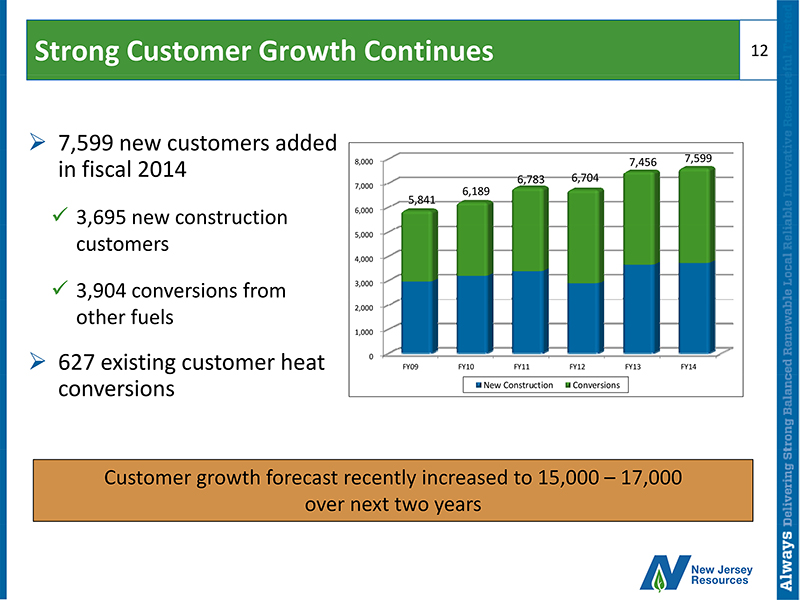
Strong Customer Growth Continues 12 0 1,000 2,000 3,000 4,000 5,000 6,000 7,000 8,000 FY09 FY10 FY11 FY12 FY13 FY14 7,599 5,841 6,189 6,783 6,704 7,456 New Construction Conversions » 7,599 new customers added in fiscal 2014 x 3,695 new construction customers x 3,904 conversions from other fuels » 627 existing customer heat conversions Customer growth forecast recently increased to 15,000 – 17,000 over next two years

Key Trends Support Future Customer Growth 13 0.0% 5.0% 10.0% 15.0% N.J. Morris Monmouth Ocean 1.2% 6.2% 2.3% 14.1% Population Change 2000 - 2013 1 2014 - 2016 10,200 Beyond 2017 - 78,206 New Construction 3 3 . Source: A.D. Little $0.00 $1.00 $2.00 $3.00 $4.00 $5.00 NJNG Fuel Oil Propane Electricity $0.92 $2.39 $3.95 $4.10 Equivalent Customer Cost 2 Non Heat 6,900 On Main 36,322 Near Main 28,974 Off Main 47,840 Conversions 4 4. Source: Harte Hanks 2 . Source: US Energy Information Administration Data as January 2015. Based on 100,000 comparable BTUs 1. Source: US Census data, 2013 estimates
The SAVEGREEN Project ® 14 » Investment in high - efficiency equipment » Encourages energy savings » Plan to invest approximately $138 million in grants and financial incentives over current life of the program » Since inception: x Assisted nearly 32,000 customers in reducing energy usage and lowering their bills x Nearly $248 million in economic activity x 2,097 contractors now participating Constructive regulatory environment and support of public policy objectives create growth opportunities for NJNG
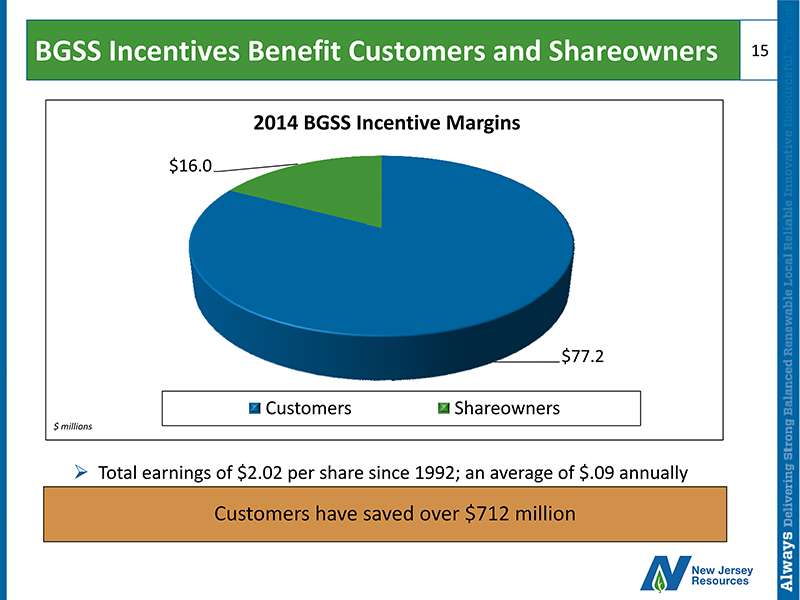
BGSS Incentives Benefit Customers and Shareowners 15 $77.2 $16.0 2014 BGSS Incentive Margins Customers Shareowners $ millions Customers have saved over $712 million » Total earnings of $2.02 per share since 1992; an average of $.09 annually

Meeting Customer Needs 16 0.00 0.50 1.00 1.50 2.00 2.50 3.00 3.50 4.00 ACE SJG PSEG ETG NJNG 3.7 3.5 1.7 1.5 0.6 BPU Inquiries per 1,000 Customers NJNG had the highest customer satisfaction rate of any major utility in New Jersey for the 22 nd consecutive year » 6.1 million meter reads » 1.1 million customer calls handled » 69,000 walk - in payments processed » 50,500 web transactions Fiscal 2014 Customer Transactions

NJNG : Most Trusted Brand in the East* » Engaged Customer Relationship score of 740 ( O n a 1,000 point scale) x Highest overall score in the East Region that included 33 natural gas, electric and combination gas/electric companies x Ranked highest in the East on “Operational Satisfaction,” “Product Experience” and “Brand Trust” including: • Commitment to Safety and Reliability • Comprehensive Variety of High - Quality Customer P rograms • C ustomer Care » Ranked eighth in the nation among the survey’s 125 natural gas, electric and combination gas/electric companies 17 * According to the 2014 Residential Utility Trusted Brand and Engagement Study by Cogent™ Energy Reports, a division of Market Strategies International

NJRES: Profitable Every Year Since 1995* » Contributed $79.7 million to NFE in fiscal 2014 » Diverse portfolio of physical natural gas assets x Firm storage (About 40 Bcf in the US and Canada) x Firm transportation (About 1.5 Bcf/day) » Services include: x Transporting natural gas x Selling storage gas during peak periods x Asset management x Producer Services • Fee - based services; located primarily in the Marcellus 18 $0 $20 $40 $60 $80 $100 $120 $140 $160 $180 $200 2009 2010 2011 2012 2013 2014 $MM Financial Margin NFE * On an NFE basis
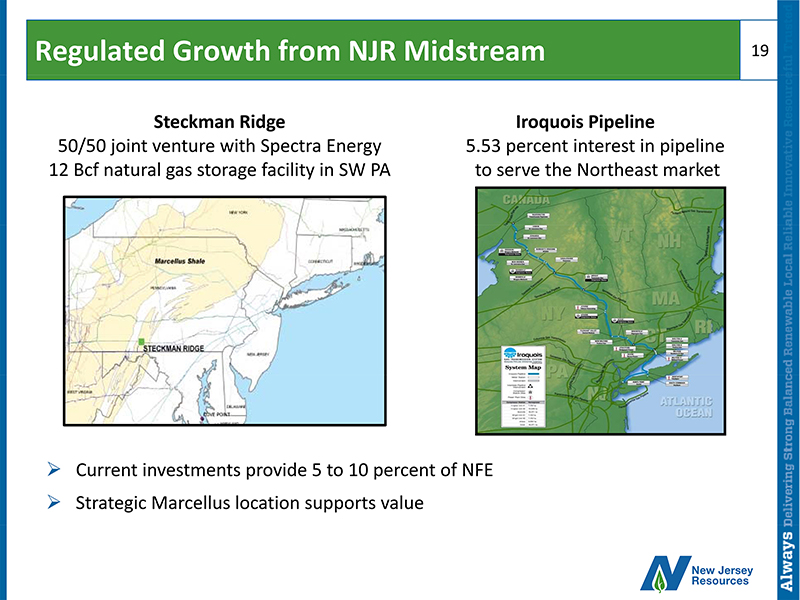
Regulated Growth from NJR Midstream 19 » Current investments provide 5 to 10 percent of NFE » Strategic Marcellus location supports value Iroquois Pipeline 5.53 percent interest in pipeline to serve the Northeast market Steckman Ridge 50/50 joint venture with Spectra Energy 12 Bcf natural gas storage facility in SW PA

PennEast Pipeline 20 » 108 - mile, 36 - inch pipeline » Connecting Marcellus supply to Northeast markets » Contracted volume up to 1,000,000 dth /day » Pre - filed with FERC October 2014 » Commercial operation expected in late 2017

NJRCEV : Renewable Portfolio Diversification Commercial Solar » 17 project sites » 55.9 megawatts (MW) » Projects include roof - top and ground - mounted installations, both grid connected and net metered Residential Solar - The Sunlight Advantage ® » 3,135 customers added since inception » 27.3 MW On - shore Wind » 9.7 MW wind f arm in service; Two Dot, Montana » Two Projects under construction x Carroll Area – 20 MW, Carroll County, Iowa x Alexander Wind Farm – 48 MW, Alexander, Kansas 21 Total of 92.9 MW installed through fiscal 2014

NJR Home Services: M eeting Customers Needs » Contributed $2.5 million to NFE in fiscal 2014 x Majority of earnings derived from service contracts • Approximately 118,000 service contract customers » Expanded services x E lectric and plumbing contracts x Standby generator contracts x Air conditioning x Generators » Strong brand recognition supports high customer satisfaction 22

Making a Difference in Our Communities 23 ▪ Employees and retirees work to make a difference in our communities and have contributed thousands of hours of service since its inception in 1995 ▪ Supports learning opportunities for all ages and helps students succeed in school and beyond ▪ Partnership with Interfaith Neighbors and other nonprofit groups in our service territory to provide home ownership opportunities to families who would otherwise be unable to afford one Over 5,000 hours of volunteer service in fiscal 2014; helped over 1,700 non - profit organizations
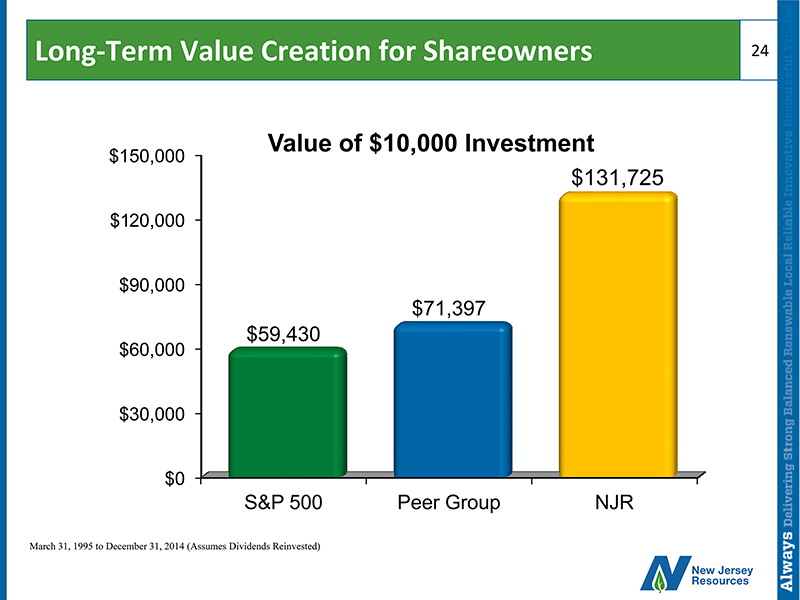
Long - Term Value Creation for Shareowners 24 $0 $30,000 $60,000 $90,000 $120,000 $150,000 S&P 500 Peer Group NJR $59,430 $71,397 $131,725 Value of $10,000 Investment March 31, 1995 to December 31, 2014 (Assumes Dividends Reinvested)

ANNUAL SHAREOWNERS MEETING January 21, 2015