Attached files
| file | filename |
|---|---|
| 8-K - 8-K - HOME BANCORP, INC. | d837153d8k.htm |
  December 15, 2014
3
rd
Quarter 2014
Investor Presentation
Exhibit 99.1 |
  Forward Looking Statements
Certain comments in this presentation contain certain forward looking statements
(as defined in the Securities Exchange Act of 1934 and the regulations
hereunder). Forward looking statements are not historical facts but instead represent only the
beliefs, expectations or opinions of Home Bancorp, Inc. and its management
regarding future events, many of which, by their nature, are inherently
uncertain. Forward looking statements may be identified by the use of such
words as: “believe”, “expect”, “anticipate”,
“intend”, “plan”, “estimate”, or words of similar meaning, or future or conditional terms such as “will”,
“would”, “should”, “could”, “may”,
“likely”, “probably”, or “possibly.” Forward
looking statements include, but are not limited to, financial projections
and estimates and their underlying assumptions; statements regarding plans, objectives and
expectations with respect to future operations, products and services; and
statements regarding future performance. Such statements are subject to
certain risks, uncertainties and assumption, many of which are difficult to predict and generally are
beyond the control of Home Bancorp, Inc. and its management, that could cause
actual results to differ materially from those expressed in, or implied or
projected by, forward looking statements. The following factors, among others, could cause actual
results to differ materially from the anticipated results or other expectations
expressed in the forward looking statements: (1) economic and competitive
conditions which could affect the volume of loan originations, deposit flows and real estate values;
(2) the levels of non-interest income and expense and the amount of loan
losses; (3) competitive pressure among depository institutions increasing
significantly; (4) changes in the interest rate environment causing reduced interest margins; (5) general
economic conditions, either nationally or in the markets in which Home Bancorp,
Inc. is or will be doing business, being less favorable than expected; (6)
political and social unrest, including acts of war or terrorism; or (7) legislation or changes in
regulatory requirements adversely affecting the business in which Home Bancorp,
Inc. is engaged. Home Bancorp, Inc. undertakes no obligation to update
these forward looking statements to reflect events or circumstances that occur after the
date on which such statements were made.
As used in this report, unless the context otherwise requires, the terms
“we,” “our,”
“us,”
or the “Company”
refer to Home
Bancorp, Inc. and the term the “Bank”
refers to Home Bank, a federally chartered savings bank and wholly owned
subsidiary of the Company. In addition, unless the context otherwise
requires, references to the operations of the Company include the
operations of the Bank.
For a more detailed description of the factors that may affect Home
Bancorp’s operating results or the outcomes described in these
forward-looking statements, we refer you to our filings with the Securities and Exchange Commission, including our
annual report on Form 10-K for the year ended December 31, 2013. Home Bancorp
assumes no obligation to update the forward-looking statements made
during this presentation. For more information, please visit our website
www.home24bank.com.
2 |
  Our
Company •
Bank chartered in 1908 –
106 years strong
•
Headquartered in Lafayette, Louisiana
•
Federal Savings Bank Charter
•
IPO completed in October 2008
•
Ticker symbol: HBCP (Nasdaq Global)
3 |
  Significant Asset Growth Since IPO
4
138% asset increase
CAGR = 16% |
  Acquisitions
•
Britton & Koontz Bank –
February 2014
–
Baton Rouge, Natchez & Vicksburg, Mississippi
–
Cash Deal @ 88% of book value
•
$301 MM Assets, $170MM Loans, $216MM Deposits
•
Guaranty Savings Bank –
July 2011
–
Greater New Orleans
–
Cash Deal @ 95% of book value
•
$257 MM Assets, $184MM Loans, $193MM Deposits
•
Statewide Bank –
March 2010
–
Northshore of Lake Ponchartrain/New Orleans
–
FDIC assisted
•
$199MM Assets, $157MM Loss Share Loans, $206MM Deposits
5 |
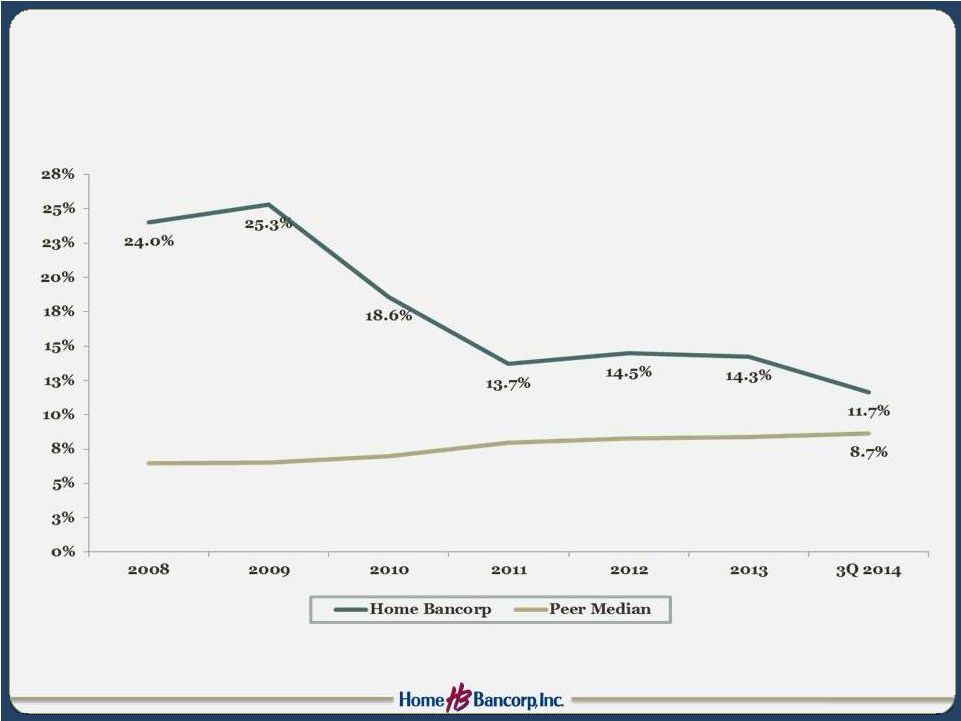  Tangible Common Equity Ratio
6
Peer = BHCs $1-$3 billion in assets. Peer data as of 6/30/2014.
Source: ffiec.gov |
  Share
Repurchase Activity 7
21% of IPO shares
repurchased |
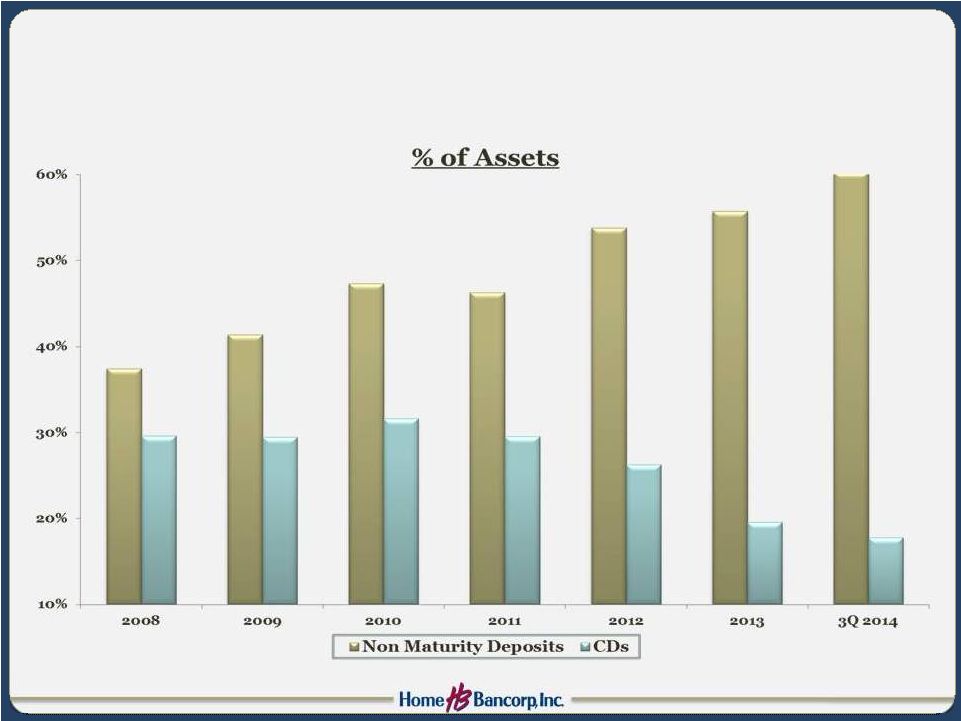
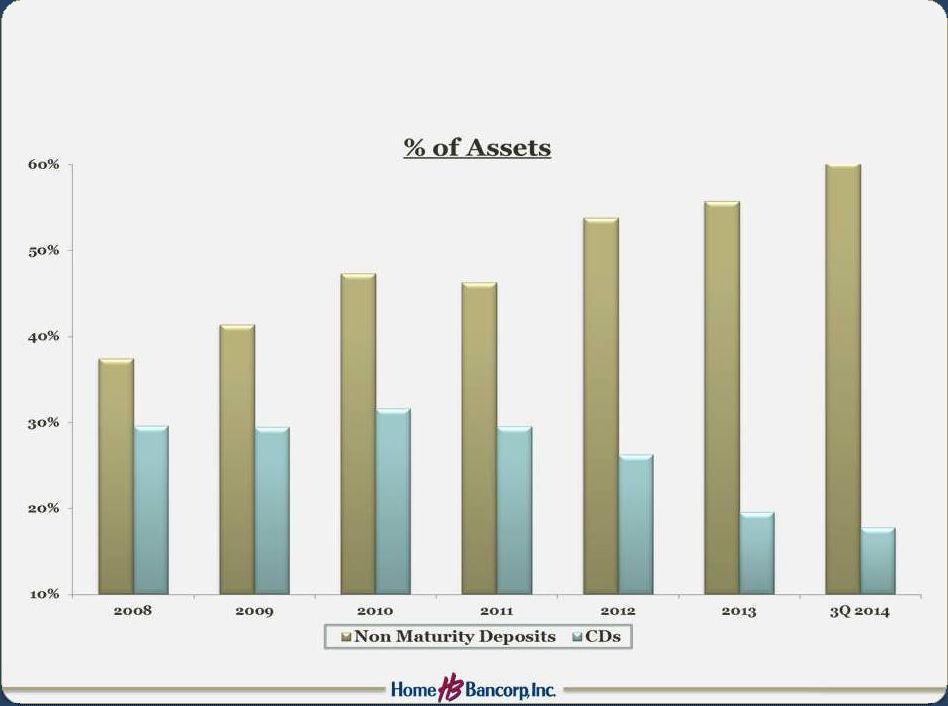
  Favorable Balance Sheet Mix Change
(% of assets)
8
2008
2009
2010
2011
2012
2013
3Q 2014
Cash & Equivalents
9%
5%
6%
4%
4%
4%
5%
Investments
22%
23%
18%
16%
17%
16%
15%
Total Loans net
63%
64%
63%
69%
70%
71%
72%
Other Assets
6%
8%
13%
11%
9%
9%
8%
Non Maturity Deposits
38%
41%
47%
46%
54%
56%
60%
CDs
29%
30%
32%
30%
26%
19%
18%
Borrowings & Other
9%
4%
2%
10%
5%
10%
10%
Equity
24%
25%
19%
14%
15%
14%
12%
•
Strong organic loan growth
•
Shrinking investment portfolio (as % of assets)
•
Deposit growth has offset capital deployment |
  Our
Locations 9
Source: snl.com |
  Unemployment Rate by Market
September 2014
10
Sources: bls.gov, mdes.ms.gov |
  •
Low unemployment (4.4%)
•
1
st
overall mid-size city (8
th
overall) for manufacturing jobs
(New Geography 2013)
•
5
th
best mid-size city (17
th
overall)
in Leading Locations for
Economic & Job Growth (Area
Development 2014)
•
5
th
best mid-size city (27
th
overall)
Best Cities for Jobs, Forbes 2014
•
Home to most affordable
university in Louisiana (U.S.
Department of Education 2013)
11
2013
Rank
Institution
Deposits
in Market
($000)
Parish
Market
Share %
1
Iberiabank
1,634,275
29.08
2
JP Morgan
1,053,938
18.75
3
Home Bank
489,351
8.71
4
Hancock
487,052
8.67
5
Capital One
469,405
8.35
Lafayette Market
Source: snl.com |
  •
1
st
overall metro area for
Economic Growth Potential
(Business Facilities 2013)
•
1
st
overall most rapidly recovering
housing market (National
Association of Home Builders)
•
Top 5 emerging entrepreneurial
cities (Entrepreneur Magazine
2013)
•
7
th
overall best city for
information jobs (Forbes 2013)
•
Top 25 best places to retire
(Forbes 2013)
12
2013
Rank
Institution
Deposits
in Market
($000)
Parish
Market
Share %
1
JP Morgan
6,770,803
47.3
2
Capital One
2,660,497
18.6
3
Regions
1,444,723
10.1
4
Hancock
1,365,528
9.5
5
Iberiabank
555,857
3.9
12
Home Bank
73,660
0.5
Baton Rouge Market
Source: snl.com |
  •
1
st
overall in US for working age
In-migration of Prime Workers
(Forbes 2014)
•
1
st
Most Economical mid-size city
for business (KPMG 2014)
•
1
st
overall for the decade for Major
Economical Development Wins in
the South (Southern Business &
Development)
•
1
st
in US for Exports per capita
(New Geography 2013)
•
2
nd
overall in US Post Recession
Performance (Brookings Institute
2013)
13
2013
Rank
Institution
Deposits in
Market
($000)
Fed
Market
Share %
1
Capital One
10,390,696
32.4
2
Hancock
4,927,007
15.4
3
JP Morgan
4,707,911
14.7
4
Regions
2,380,213
7.4
5
First NBC
2,289,444
7.1
16
Home Bank
228,476
0.7
New Orleans/Northshore Market
Source: snl.com |
  •
Strong, stable deposit base
•
25% non-interest-bearing deposits
•
Limited large bank competition
•
Tuscaloosa Shale opportunity
14
2013
Rank
Institution
Deposits in
Market
($000)
County
Market
Share %
1
BancorpSouth
240,245
32.1
2
Trustmark
215,151
28.7
3
RiverHills
133,296
17.8
4
Regions
124,974
16.7
5
Guaranty B&T
20,639
2.8
6
Home Bank
14,353
1.9
2013
Rank
Institution
Deposits in
Market
($000)
County
Market
Share %
1
Home Bank
171,768
27.8
2
United Miss.
170,737
27.6
3
Regions
147,509
23.9
4
Concordia
127,968
20.7
Vicksburg
Natchez
Western Mississippi Market
Source: snl.com |
  15
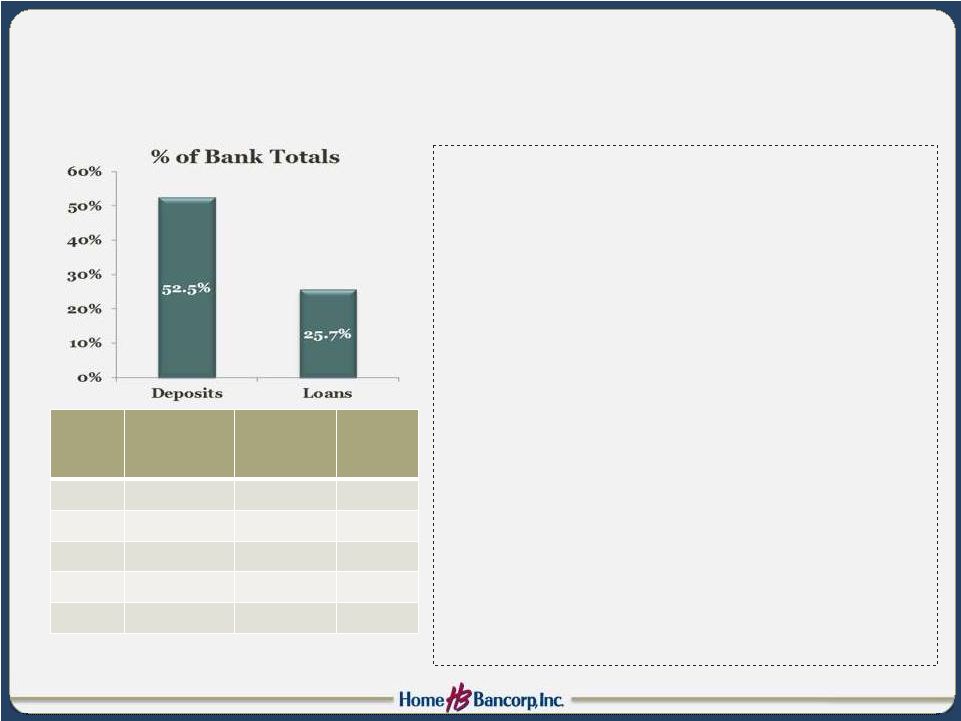
Market Diversification
September 30, 2014
Loans
Deposits
In 2008, virtually 100% of loans and deposits were located in Lafayette
Market |
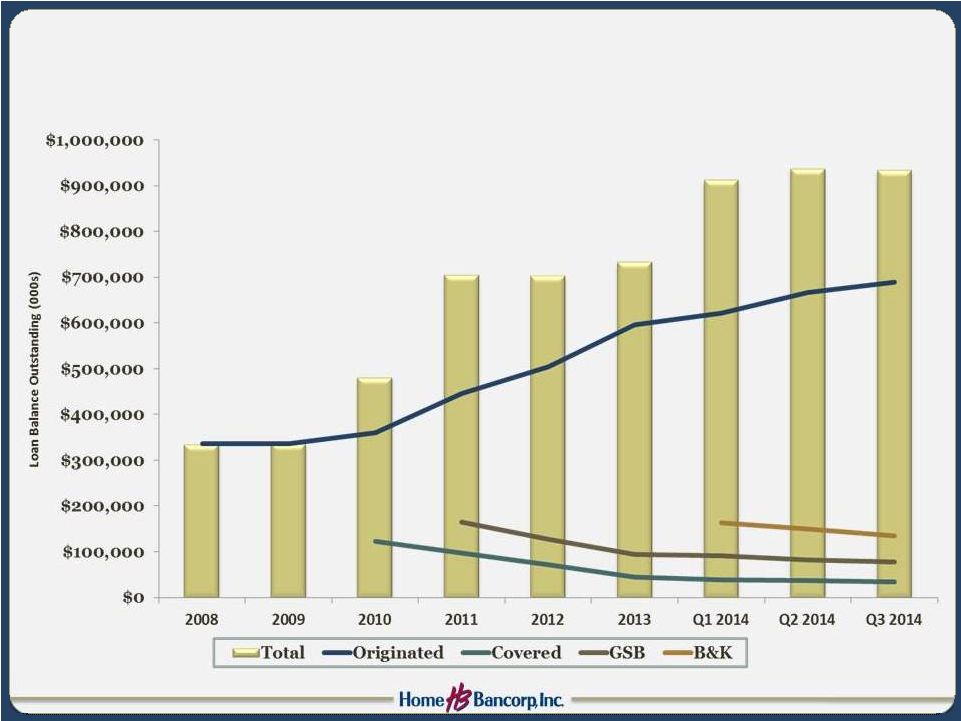  Strong Organic Loan Growth
(excludes acquisition accounting discounts)
16 |
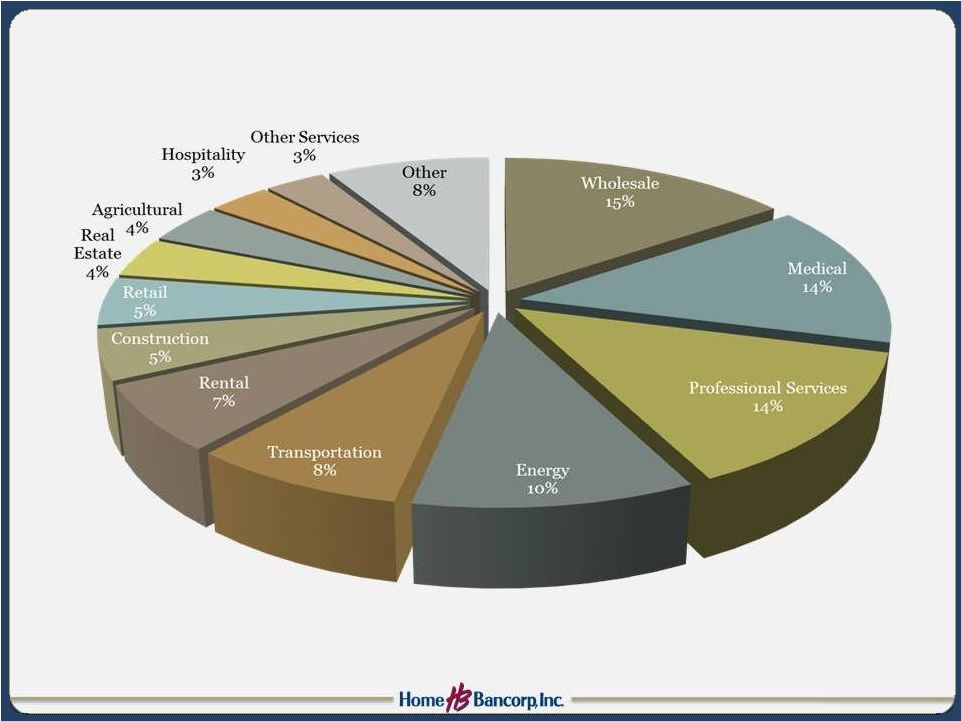
  Loan
Portfolio Composition 17
12/31/08 balance:
$336 million
9/30/14 balance:
$907 million
Direct Energy Exposure = 3% of
Total Loans |
  Commercial Real Estate Portfolio
18
9/30/14 balance:
$330 million |
  Construction and Land Portfolio
19
9/30/14 balance:
$123 million |
  C&I Portfolio
20
9/30/14 balance:
$96 million |
  1-4 Family First Mortgage Portfolio
21
9/30/14 balance:
$234 million
Original Term
Mortgage Portion |
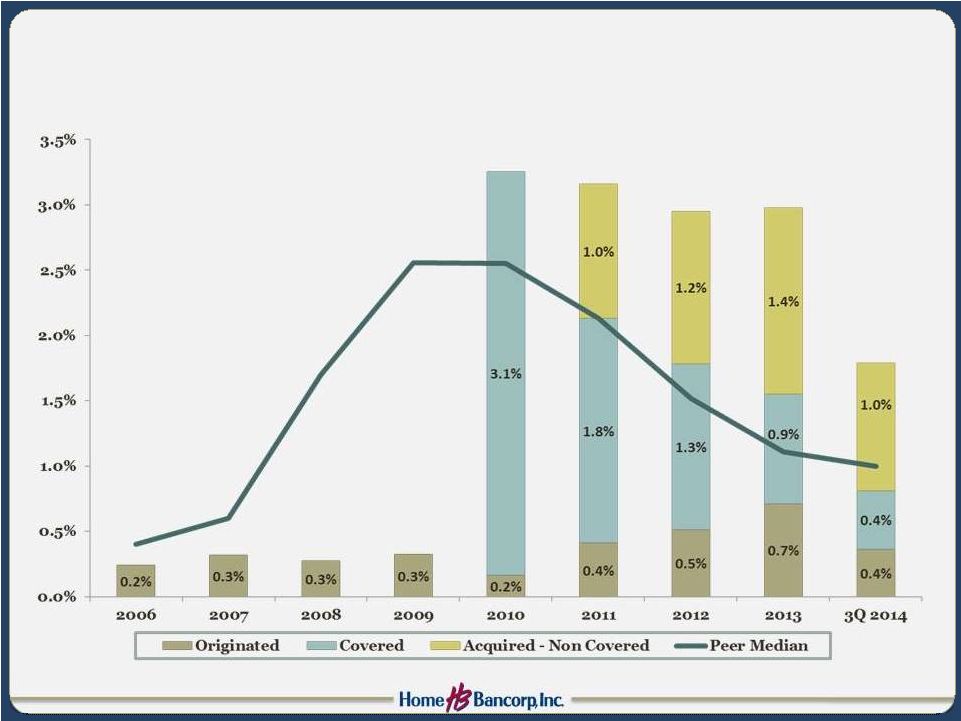 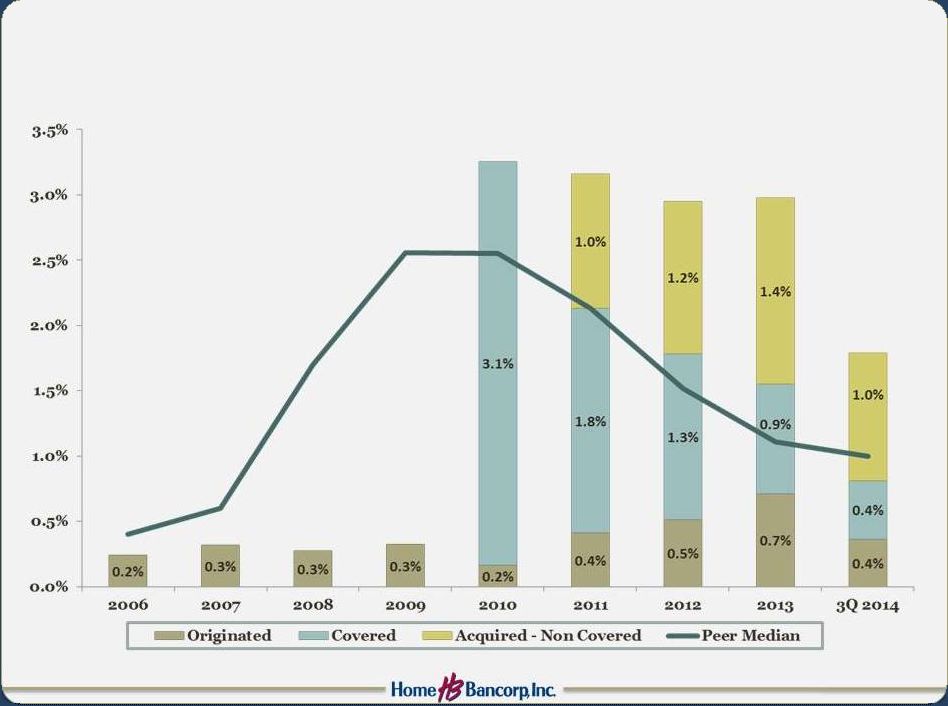 Non
Performing Assets / Assets 22 |
  •
Reported ALLL / Gross Loans = 0.82%
–
Peer Median = 1.34%
23
ALLL and Loan Discounts |
  Deposit Growth and Composition
24
Non-Interest Deposits / Assets
Home Bank = 20%
Peer Median = 15% |
  Strong Non-Maturity Deposit Growth
25 |
  Quarterly Performance Metrics
26
3Q 2013
4Q 2013
1Q 2014
2Q 2014
3Q 2014
Reported Net Income
$2,482,747
$1,705,649
$1,433,456
$2,752,625
$2,876,517
Merger Adjusted Net Income
(1)
$2,482,747
$1,905,406
$2,790,488
$2,889,045
$2,888,065
EPS -
Diluted
(1)
$0.37
$0.28
$0.40
$0.42
$0.41
ROA
(1)
1.04%
0.79%
1.00%
0.93%
0.93%
ROE
(1)
7.14%
5.39%
7.90%
7.87%
7.70%
Efficiency Ratio
(1)
65.4%
71.6%
69.1%
66.2%
64.0%
NIM (TE)
4.79%
4.60%
4.72%
4.64%
4.63%
TCE Ratio
14.4%
14.2%
11.3%
11.4%
11.7%
Tangible Book Value/Share
$19.47
$19.72
$19.65
$20.20
$20.58
Ending Share Price
$18.06
$18.85
$20.99
$22.02
$22.71
NPAs/Assets
2.9%
3.0%
2.3%
2.1%
1.8%
Originated NPAs
(2)
/Originated Assets
0.7%
0.8%
0.5%
0.5%
0.4%
(1)
Excludes merger-related costs (see Table 2 in appendix)
(2)
Excludes acquired NPAs |
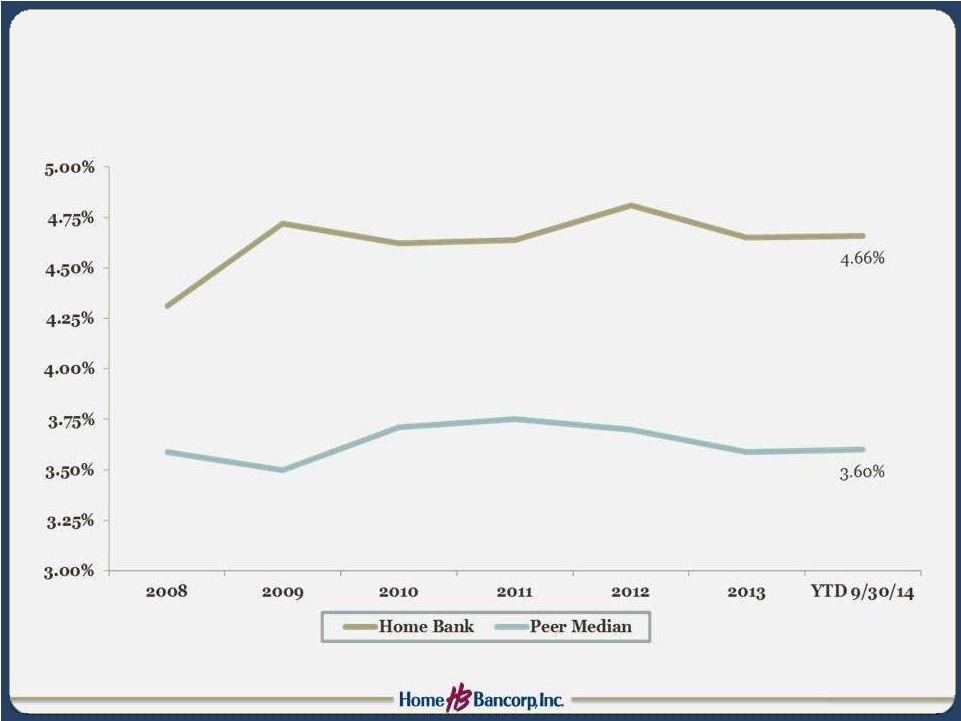  Net
Interest Margin (TE) 27 |
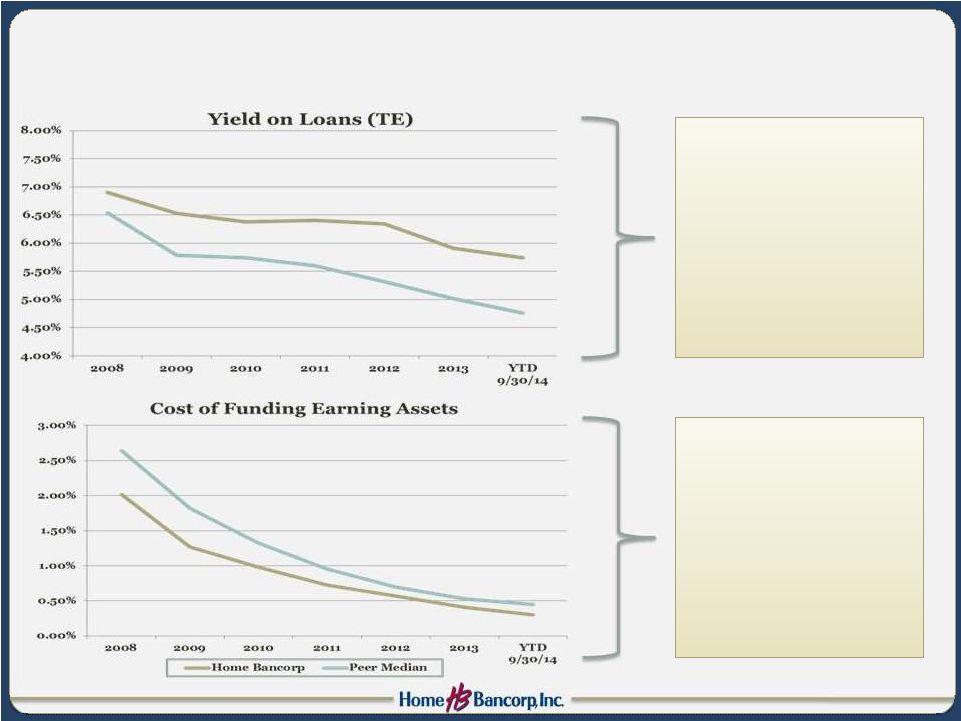  Net
Interest Margin Drivers 28
•
Strong loan/asset ratio
(71
st
percentile)
•
Loan discount balance
and accretion
•
C&D loans
•
Maintained lower costs
than peers even after
capital was deployed
•
Increased balances of
Non-interest deposits
•
Lower reliance on CDs |
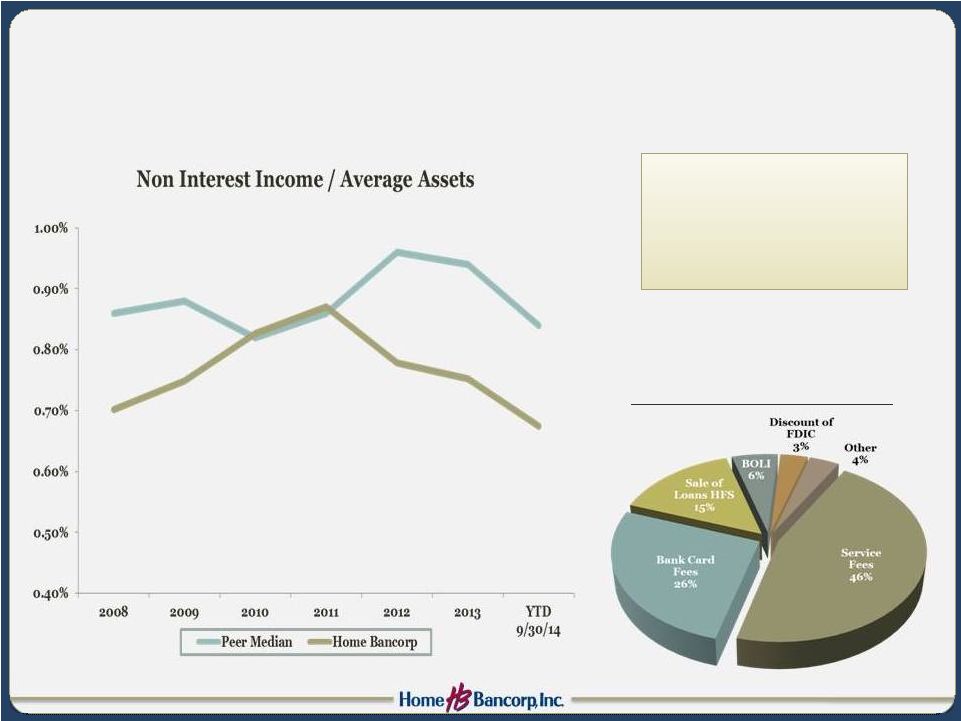  Non-Interest Income
29
2014 YTD Non-Interest Income
•
New retail leadership
•
Mortgage
•
Brokerage |
  Non-Interest Expense
(excluding merger-related costs)
(1)
30
2014 YTD Non-Interest Expense
(1)
•
Investments in
commercial and
retail bankers
•
Infrastructure to
support continued
growth
•
Focus on efficiency
(1)
Excludes merger-related costs (see Table 2 in appendix)
|
  Interest Rate Risk
Change in Interest Rates
(1)
% Change in NII at 9/30/14
(2)
+100
-0.2%
+200
-0.7%
+300
-1.3%
31
1)
Assumes instantaneous and parallel shift in interest rates.
2)
The actual impact of changes in interest rates will depend on many factors
including but not limited to: the Company’s ability to maintain
desired mix of interest-earning assets and interest-bearing
liabilities, actual timing of asset and liability repricing, and
competitor reaction to deposit and loan pricing.
•
Slightly liability sensitive
•
Effective duration of investment portfolio = 2.8 years
|
  Total Return Since 2008
32
Source: SNL. Data as of 12/09/2014 |
  Share Information
33
4Q 2013
1Q 2014
2Q 2014
3Q 2014
12 Months
EPS –
GAAP
$0.25
$0.21
$0.40
$0.41
$1.27
EPS –
Merger Adjusted
(1)
$0.28
$0.40
$0.42
$0.41
$1.51
Ending Share Price
$18.85
$20.99
$22.02
$22.71
Dividend Yield
0.0%
0.0%
0.0%
0.0%
P/BV
94%
103%
106%
107%
P/TBV
96%
107%
109%
110%
Price / Earnings (12 months prior)
P/EPS –
GAAP
17.86x
P/EPS –
Merger Adjusted
(1)
14.96x
(1)
Excludes merger-related costs (see Table 1 in appendix)
$0.07 Dividend declared in
4
th
quarter (1.2% Yield) |
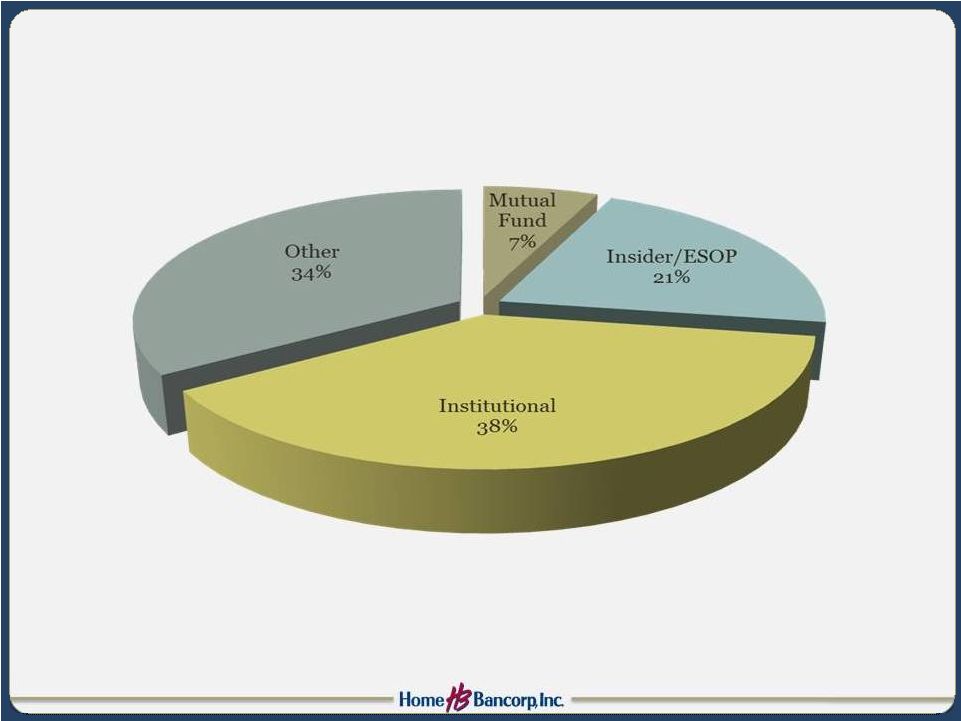  HBCP
Ownership 34
Source: SNL (data as of 12/09/2014)
Fully Diluted Insider Ownership = 26% |
  Investment Perspective
•
Consistently superior organic asset quality
•
Deep customer relationships –
106 years
•
Successful acquirer; experienced deal team
•
Strong capital base
–
Disciplined deployment
–
Well positioned for further acquisitions
•
Vibrant economies
•
Trading at 110% of tangible book value
35 |
 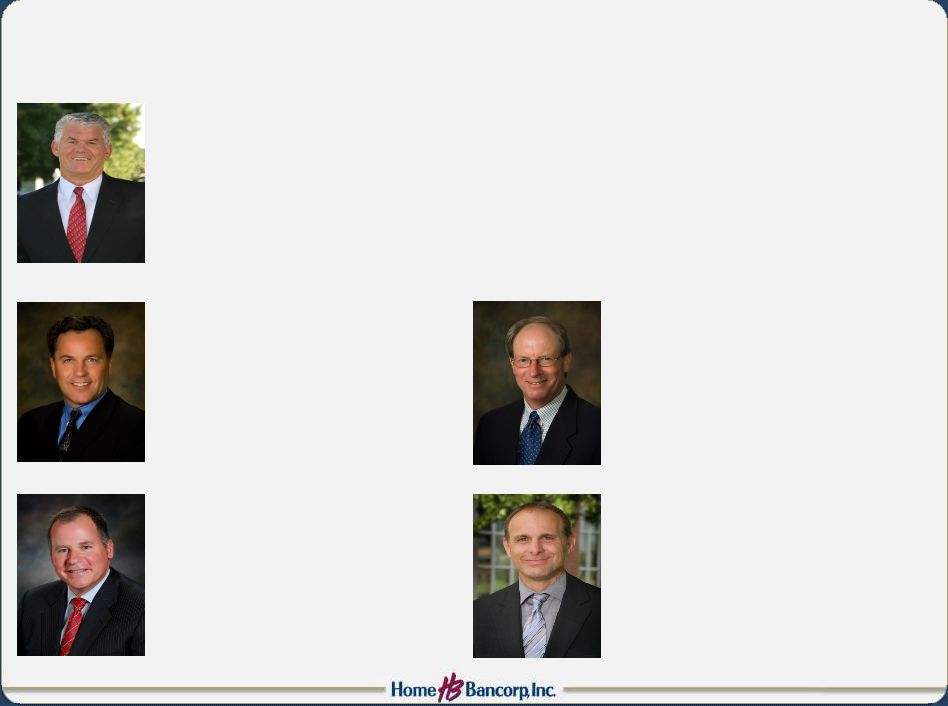 Executive Leadership
36
Scott Sutton, Chief Operations Officer
Joined Home Bank in 2008. Previously
served as Senior Vice President of
Operations of Teche Federal Bank and
as Senior Vice President of Iberiabank.
Darren Guidry, Chief Credit Officer
Joined Home Bank in 1993.
Previously served as Chief Lending
Officer.
Scott Ridley, Chief Banking Officer
Joined Home Bank in 2013.
Previously served as Group
Executive for Louisiana Business
Banking for Capital One Bank.
Joseph Zanco, Chief Financial Officer
Joined Home Bank in 2008. Previously
served as Corporate Controller and
Principal Accounting Officer for
Iberiabank.
John Bordelon, President and Chief Executive Officer
Has led Home Bank since 1993. Previously served in various management and other
positions since joining the Bank in 1981. Former Chairman of the
following organizations:
Greater
Lafayette
Chamber
of
Commerce,
University
of
Louisiana
Alumni Association, Community Bankers of Louisiana, and Ragin Cajun Athletic
Foundation |
  Appendix
Non-GAAP Reconciliation
37
(dollars in thousands)
3Q 2013
4Q 2013
1Q 2014
2Q 2014
3Q 2014
Reported non-interest expense
7,890
$
8,774
$
11,257
$
10,370
$
9,968
$
Less: Merger-related expenses
-
(307)
(1,955)
(207)
(128)
Non-GAAP non-interest expense
7,890
$
8,467
$
9,302
$
10,163
$
9,840
$
Reported Net Income
2,483
1,706
1,433
2,753
2,877
Add: Merger-related expenses (after tax)
-
200
1,357
136
12
Non-GAAP Net Income
2,483
1,906
2,790
2,889
2,889
Diluted EPS
0.37
$
0.25
$
0.21
$
0.40
$
0.41
$
Add: Merger-related expenses
-
0.03
0.19
0.02
-
Non-GAAP EPS
0.37
$
0.28
$
0.40
$
0.42
$
0.41
$
TABLE 1
Reported non-interest expense
24,373
$
31,002
$
32,763
$
33,205
$
31,595
$
Less: Merger-related expenses
(1,000)
(2,053)
-
(307)
(2,290)
Non-GAAP noninterest expense
23,373
$
28,949
$
32,763
$
32,898
$
29,305
$
TABLE 2
Nine months
ended
9/30/14
2013
2011
2012
2010
(dollars in thousands) |
  |