Attached files
| file | filename |
|---|---|
| 8-K - 8-K - ClubCorp Holdings, Inc. | holdings-20141210x8k.htm |
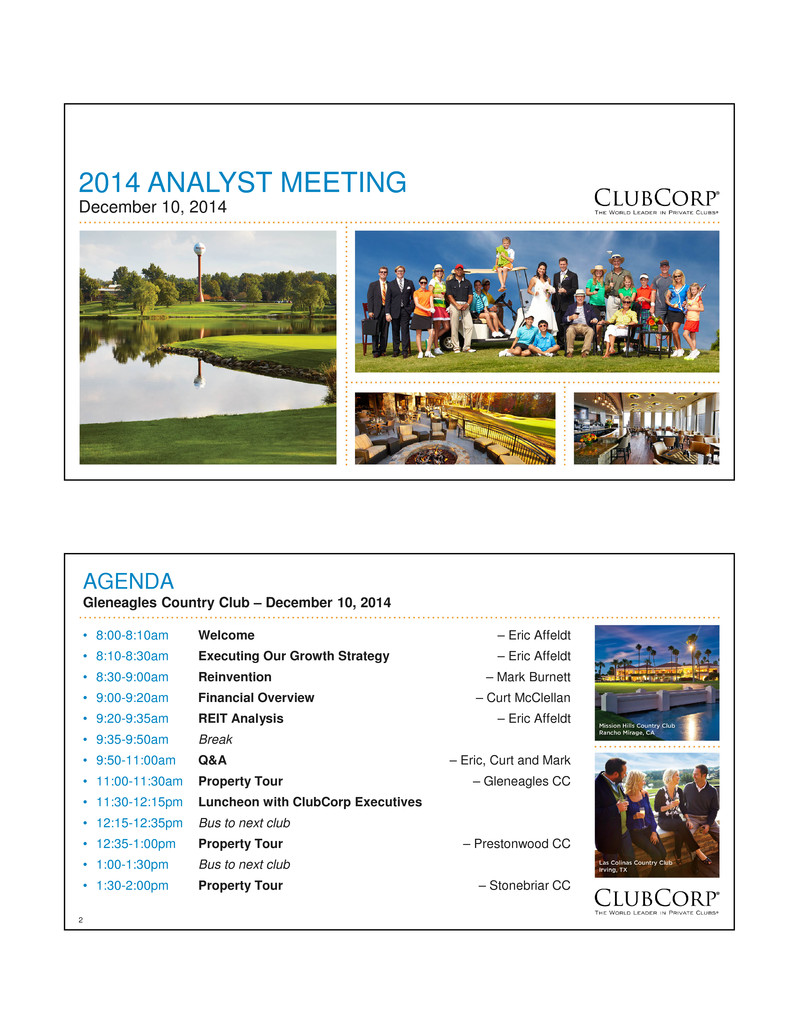
1 2014 ANALYST MEETING December 10, 2014 2 AGENDA • 8:00-8:10am Welcome – Eric Affeldt • 8:10-8:30am Executing Our Growth Strategy – Eric Affeldt • 8:30-9:00am Reinvention – Mark Burnett • 9:00-9:20am Financial Overview – Curt McClellan • 9:20-9:35am REIT Analysis – Eric Affeldt • 9:35-9:50am Break • 9:50-11:00am Q&A – Eric, Curt and Mark • 11:00-11:30am Property Tour – Gleneagles CC • 11:30-12:15pm Luncheon with ClubCorp Executives • 12:15-12:35pm Bus to next club • 12:35-1:00pm Property Tour – Prestonwood CC • 1:00-1:30pm Bus to next club • 1:30-2:00pm Property Tour – Stonebriar CC Gleneagles Country Club – December 10, 2014

3 CAUTIONARY STATEMENTS Forward-Looking Statements Certain statements in this presentation may be considered forward-looking statements. Forward-looking statements generally relate to future events or our future financial or operating performance. In some cases, you can identify forward-looking statements by terminology such as ‘‘may’’, ‘‘should’’, ‘‘expect’’, ‘‘intend’’, ‘‘will’’, ‘‘estimate’’, ‘‘anticipate’’, ‘‘believe’’, ‘‘predict’’, ‘‘potential’’ or ‘‘continue’’ or the negative of these words or other similar terms or expressions that concern our expectations, strategy, plans or intentions. Such forward-looking statements are subject to risks, uncertainties, and other factors which could cause actual results to differ materially from those expressed or implied by such forward looking statements. These forward-looking statements are based upon estimates and assumptions that, while considered reasonable by the Company and its management, are inherently uncertain. Factors that may cause actual results to differ materially from current expectations include, but are not limited to, those factors identified in the Company’s 2013 Annual Report on Form 10-K and in the Company’s Quarterly Report on Form 10-Q for the third fiscal quarterly period ended September 9, 2014 in the sections titled “Risk Factors” and “Management’s Discussion and Analysis of Financial Condition and Results of Operations.” Nothing in this presentation should be regarded as a representation by any person that the forward-looking statements set forth herein will be achieved or that any of the contemplated results of such forward-looking statements will be achieved. You should not place undue reliance on forward-looking statements, which speak only as of the date they are made. The Company undertakes no duty to update these forward-looking statements. Non-GAAP Financial Measures In our presentation, we may refer to certain non-GAAP financial measures. To the extent we disclose non-GAAP financial measures, please refer to footnotes where presented on each page of this presentation or to the appendix found at the end of this presentation for a reconciliation of these measures to what we believe are the most directly comparable GAAP measures. 4 EXECUTING OUR GROWTH STRATEGY Eric Affeldt, President and CEO

5 Revenue Mix(1) EXECUTING OUR GROWTH STRATEGY Our three-pronged growth strategy builds on our resilient membership business Dues-Based Membership Business Organic Growth Reinvention Acquisitions 1 2 3 46% Dues 29% Food & Beverage 16% Golf Ops 9% Other (1) 3Q14 LTM, does not include addition of Sequoia Golf. 6 WE’RE IN THE MEMBERSHIP BUSINESS Predictable dues-based membership business with stable and growing membership base Golf & Country Clubs (GCC)… » +5.3% y/y membership growth* » ~84% membership retention » Second year of record membership overall Business, Sports & Alumni Clubs (BSA)… » +1.9% y/y membership growth* » Membership has stabilized and beginning to see modest growth » First year of membership growth since 2006 83,724 81,986 80,024 79,656 80,619 81,744 84,438 90,179 86% 83% 83% 83% 84% 84% 84% 2007 2008 2009 2010 2011 2012 2013 3Q14* GCC Membership Trends Membership Counts Annual Retention Rate 79,383 73,160 67,032 63,967 62,953 62,046 61,405 63,070 77% 73% 73% 76% 77% 77% 77% 2007 2008 2009 2010 2011 2012 2013 3Q14* BSA Membership Trends Membership Counts Annual Retention Rate * 3Q14 membership does not include addition of Sequoia Golf. Sequoia Golf represents an additional ~27k memberships

7 RESILIENT MEMBERSHIP BASE Tied to healthier, mass affluent consumer A more resilient consumer… » Targeting mass affluent demographic with average annual household income in excess of $150k with significant annual discretionary income » Strong member retention plus meaningful percentage of highly visible recurring revenue makes our dues-based business model resilient across economic cycles » Additionally, proximity increases usage and retention … these clubs are located in Member’s communities 9% 13% 18% 46% <$150k $150-175k $175-200k >$200 Average Household Income(1) (GCC surrounding population demographics) 4% 19% 18% 45% <$250k $250-500k $500-750k $750k+ Average Primary Home Value(1) (GCC surrounding population demographics) 1% 32% 37% 15% 25-35 36-50 51-65 65+ Average Age(1) (GCC surrounding population demographics) (1) Source: Mosaic demographic analysis of GCC members within Buxton database 8 TODAY’S PRIVATE CLUB EXPERIENCE Membership is a lifestyle choice Appeals to multi-generational group of families or individuals seeking nearby, multi-faceted “sports resort” for recreational, leisure and social activities Traditional private club experience… » Exclusivity and status » Golf-centered recreation » Formal fine-dining rooms » No work, no cell phones, no jeans … and sometimes no kids » Stuffy, dated amenities that are out of fashion and out of touch » Capital assessments Today’s club members desire… » Trend is toward experiences, rich programming, and personal enrichment » Multi-generational, family-centric » Amenities that facilitate networking and building relationships » Emphasis on overall fitness, wellness, and fun, not just golf » Improved golf practice facilities and more golf training for all ages » Family friendly amenities
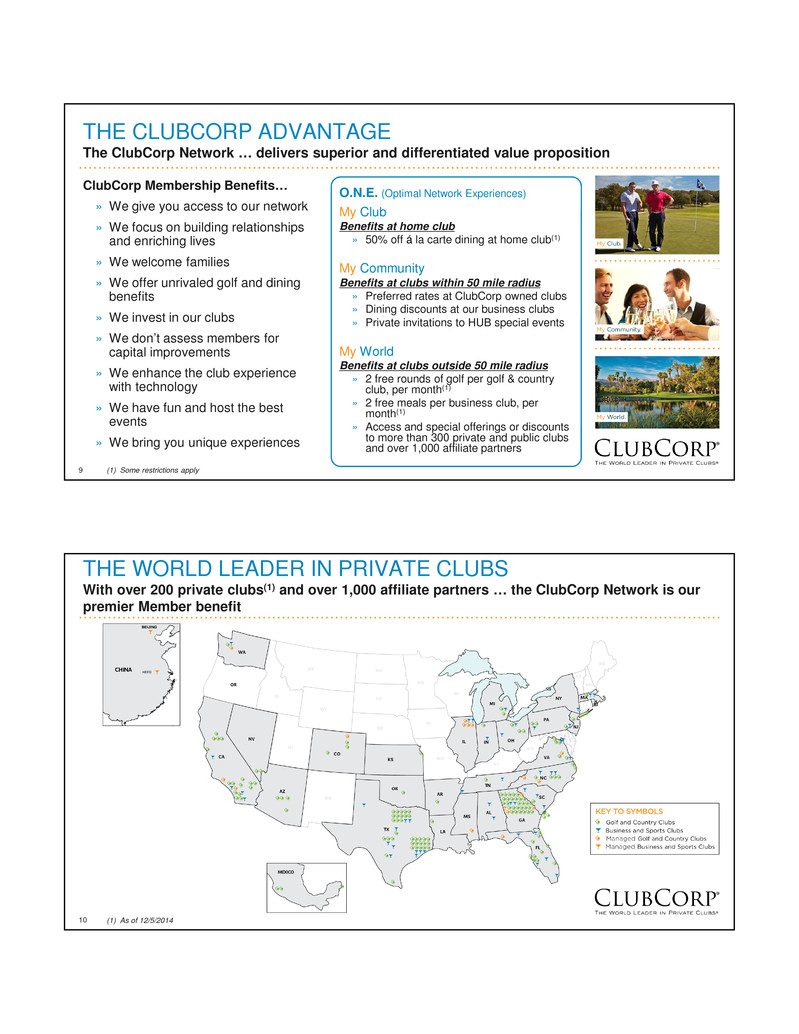
9 THE CLUBCORP ADVANTAGE The ClubCorp Network … delivers superior and differentiated value proposition ClubCorp Membership Benefits… » We give you access to our network » We focus on building relationships and enriching lives » We welcome families » We offer unrivaled golf and dining benefits » We invest in our clubs » We don’t assess members for capital improvements » We enhance the club experience with technology » We have fun and host the best events » We bring you unique experiences O.N.E. (Optimal Network Experiences) My Club Benefits at home club » 50% off á la carte dining at home club(1) My Community Benefits at clubs within 50 mile radius » Preferred rates at ClubCorp owned clubs » Dining discounts at our business clubs » Private invitations to HUB special events My World Benefits at clubs outside 50 mile radius » 2 free rounds of golf per golf & country club, per month(1) » 2 free meals per business club, per month(1) » Access and special offerings or discounts to more than 300 private and public clubs and over 1,000 affiliate partners (1) Some restrictions apply 10 THE WORLD LEADER IN PRIVATE CLUBS With over 200 private clubs(1) and over 1,000 affiliate partners … the ClubCorp Network is our premier Member benefit (1) As of 12/5/2014

11 THE VALUE OF THE CLUBCORP NETWORK Our O.N.E. product is unmatched in the industry The O.N.E. product… » Introduced in 2010, offered at 88 clubs(1) today with significant opportunity to expand » O.N.E. pricing is average $50-75 per month(1) above base dues » Upgrade dues represent annual revenue of ~$37 million (up +12% y/y)(1) » Increases revenue without increasing fixed costs » Drives increased club utilization 35% 42% 43% 44% 45% 46% 2010 3Q13 4Q13 1Q14 2Q14 3Q14 Adoption of O.N.E. and Other Upgrade Products(1) (1) As of 3Q14, before addition of Sequoia clubs 12 ORGANIC GROWTH STRATEGY IN ACTION Solid and consistent same store growth • Three primary revenue streams: » Membership dues » Food & beverage » Golf operations • Same Store Dues have grown from increases in rate, membership growth, and O.N.E. penetration • Same Store F&B has grown from increases in member usage (i.e. á la carte cover counts), average á la carte check per member, and size and pricing of private events • Same Store Golf Ops revenue experiences some mild seasonal impact 2.1% 3.1% 6.2% 5.9% 2011 2012 2013 (53wks) 3Q14 LTM (53 wks) Dues (growth year-over-year) 3.9% 4.5% 5.1% 4.8% 2011 2012 2013 (53wks) 3Q14 LTM (53 wks) Revenue (growth year-over-year) 7.0% 6.3% 5.8% 6.5% 2011 2012 2013 (53wks) 3Q14 LTM (53 wks) Food & Beverage (growth year-over-year) 3.9% 7.5% 5.1% 6.3% 2011 2012 2013 (53wks) 3Q14 LTM (53 wks) Adj. EBITDA(1) (growth year-over-year) (1) Adjusted EBITDA is a non-GAAP measure. See Appendix for a reconciliation to the most comparable financial measure calculated in accordance with GAAP.
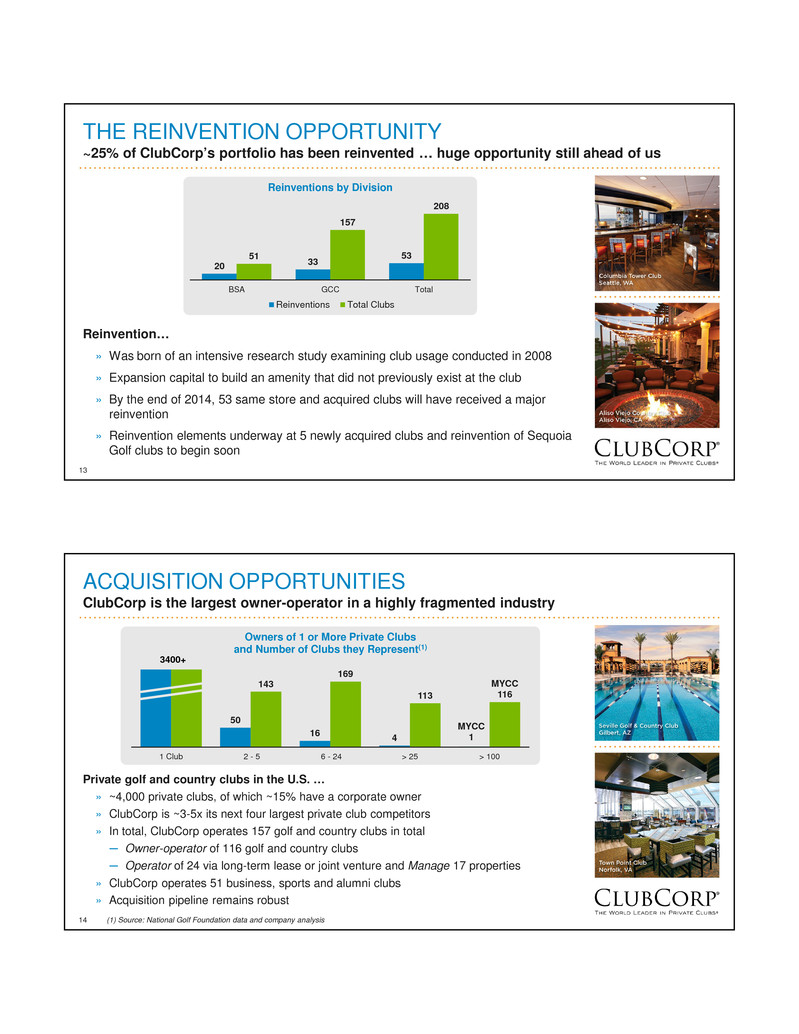
13 THE REINVENTION OPPORTUNITY ~25% of ClubCorp’s portfolio has been reinvented … huge opportunity still ahead of us Reinvention… » Was born of an intensive research study examining club usage conducted in 2008 » Expansion capital to build an amenity that did not previously exist at the club » By the end of 2014, 53 same store and acquired clubs will have received a major reinvention » Reinvention elements underway at 5 newly acquired clubs and reinvention of Sequoia Golf clubs to begin soon 20 33 5351 157 208 BSA GCC Total Reinventions by Division Reinventions Total Clubs 14 ACQUISITION OPPORTUNITIES ClubCorp is the largest owner-operator in a highly fragmented industry Private golf and country clubs in the U.S. … » ~4,000 private clubs, of which ~15% have a corporate owner » ClubCorp is ~3-5x its next four largest private club competitors » In total, ClubCorp operates 157 golf and country clubs in total ─ Owner-operator of 116 golf and country clubs ─ Operator of 24 via long-term lease or joint venture and Manage 17 properties » ClubCorp operates 51 business, sports and alumni clubs » Acquisition pipeline remains robust 50 16 4 MYCC 1 143 169 113 MYCC 116 1 Club 2 - 5 6 - 24 > 25 > 100 Owners of 1 or More Private Clubs and Number of Clubs they Represent(1) 3400+ (1) Source: National Golf Foundation data and company analysis

15 ACQUISITION STRATEGY Scope, scale and expertise to successfully acquire and consolidate fragmented industry Successful acquisitions g3404 g2188 sourcing strategy, post−acquisition synergies Sourcing… » Population density within a 10-15 mile radius » Affluence within 10-15 mile radius » Existing membership and revenue base » Other intangibles: ─ Undermanaged ─ Undercapitalized ─ Unnatural owner (lender, developer, equity clubs) Post-acquisition synergies… » Introduce ClubCorp leadership familiar with ClubCorp standards » Apply ClubCorp economies of scale ─ Avendra procurement ─ Adopt ClubCorp menu mgmt ─ Largest purchaser of turf equipment and golf carts » Immediately invest in reinvention » Introduce O.N.E. product – unmatched portfolio advantage » Invest in new member programming 16 ACQUISITION TRACK RECORD Price per club vastly below replacement cost Single Store acquisitions… » 14 single store acquisitions since 2010 » ~$5.5 million average purchase price » ~$5.1 million average purchase price per 18 hole equivalent » ~$2 million additional one-time reinvention capital per acquired club Portfolio acquisitions… » Sequoia Golf added 50 clubs and 990 holes of golf » ~9x trailing LTM EBITDA » ~$15 million in additional one-time reinvention capital invested in 2015 Date Club Name State Purchase Price # of Clubs # of Holes 2010 Country Club of the South GA $7.6M1 18 2011 The Hamlet Golf & Country Club Willow Creek Golf & Country Club Wind Watch Golf & Country Club NY $20.0M3 54 Canterwood Golf & Country Club WA $4.0M1 18 2012 Hartefeld National Golf Club PA $3.8M1 18 Chantilly National Golf & Country Club VA $4.6M1 18 TPC Piper Glen NC $3.8M1 18 TPC Michigan MI $3.0M1 18 Total Single Store Acquisitions $76.5M14 270 Prestonwood Country Club TX $11.2M22014 36 Oro Valley AZ $2.9M1 18 Sequoia Golf Portfolio Various $265M50 990 Total Portfolio Acquisitions $265M50 990 2013 Oak Tree Country Club OK $10.0M1 36 (1) Cherry Valley Country Club NJ $5.6M1 18 (2) (1) Includes purchase price of $5.0M plus assumption of $5.0M debt. (2) Includes purchase price of $6.9M less cash received of $1.3M. Total Acquisitions ~$342M64 1,260

17 ACQUISITION CASE STUDY Single store acquisition economics … significant profit improvement and membership growth Single Store acquisitions… » Case study example: ─ Under prior ownership… gross revenue was ~$8 million and Adj. EBITDA margin was ~15% ─ Under ClubCorp ownership… significant membership growth and increased utilization has led to significant improvement in overall club profitability » Pro forma target 10-15% unlevered cash on cash returns by yr. 3 » Look-back multiple of ~6x EBITDA in a 3-5 yr. period 28% 28% 30% 32% 34% 10% 14% 16% 18% 22% Yr. 1 Yr. 2 Yr. 3 Yr. 4 Yr. 5 Adj. EBITDA % and Cash-on-Cash Return(1) Adj. EBITDA % Cash on Cash Return 187 229 271 312 354 8 38 68 98 128 Yr. 1 Yr. 2 Yr. 3 Yr. 4 Yr. 5 Incremental Membership Growth(1) Current Projection Pro forma (1) Company analysis on current newly acquired club 18 SEQUOIA GOLF Largest acquisition in company’s 58 year history … transformational opportunity Sequoia Golf… » Portfolio of 30 owned, three leased and 17 managed properties (44 private clubs, 5 public, 1 sports club) » Approximately 27,000 memberships serving over 60,000 members » Solidifies ClubCorp’s industry-leading network of private clubs » Solidifies market penetration in Atlanta, GA and Houston, TX » Enhances value of ClubCorp’s O.N.E. offering to new and participating members » Increases industry-leading economies of scale, further driving procurement, operational and corporate cost efficiencies » Collection of owned private clubs that will respond well to reinvention » Potential to grow a geographically diverse property management platform

19 ACQUISITION STRATEGY IN ACTION Significant upside from Sequoia Golf acquisition … The Woodlands is an example The New Woodlands Experience We’re investing millions to make your club experience even better. PALMER CLUBHOUSE • Complete clubhouse reinvention including updated designs, and dedicated Member dining area, bar and lounge with innovative wine display, new cuvenee wine system and media area with big-screen TVs • Elegant dedicated private event space • Expanded fitness center with state-of-the-art equipment and group exercise room • Refreshed outdoor dining area with fire pits and new media area • Upgraded WiFi with enhanced clubhouse coverage TOURNAMENT CLUBHOUSE • New furniture and fixtures at the grille • Refreshed patio with updated lounge area outside the grille • Upgraded WiFi with enhanced clubhouse coverage PLAYER CLUBHOUSE • Clubhouse refresh with enhanced dining area • New shaded patio with soft seating and the best view in The Woodlands GOLF COURSE IMPROVEMENTS • New short game area at the Tournament Course • New tee amenities, signage and maintenance equipment • Enhanced driving range amenities • New golf cart fleet in 2016 TENNIS UPGRADES • Additional hard courts, resurfaced clay courts and new lighting RESORT-STYLE POOL EXPERIENCE • Cabanas, new pool furniture and new family features We’re just getting started! 20 WHY CLUBCORP? Resilient business model … coupled with significant incremental growth opportunities Predictable dues-based membership business with growing membership base Solid organic growth … linked to healthier, mass affluent consumer Attractive returns on expansion capital, particularly from reinvention Financial strength, scope, scale and expertise to acquire and consolidate fragmented industry Upside from recent Sequoia Golf acquisition

21 REINVENTION Mark Burnett, COO 22 Reinvention Design REINVENTION How Members engage and utilize their club are at the core of reinvention design Design Purpose Food & Beverage Service Programming Networking Technology 2008 psychographic Member study… » During 2008, we conducted an in depth behavioral study to analyze how (past, current and prospective) Members utilize their clubs » We were able to segment Members based on behavior by how Members engage and utilize their club » It was clear there was an opportunity to enhance the traditional club experience and align them with Members needs for a more innovative and immersive experience » We now design clubs in a manner that caters to different Members needs for leisure, recreation or business … whether those events are spontaneous or a planned private event
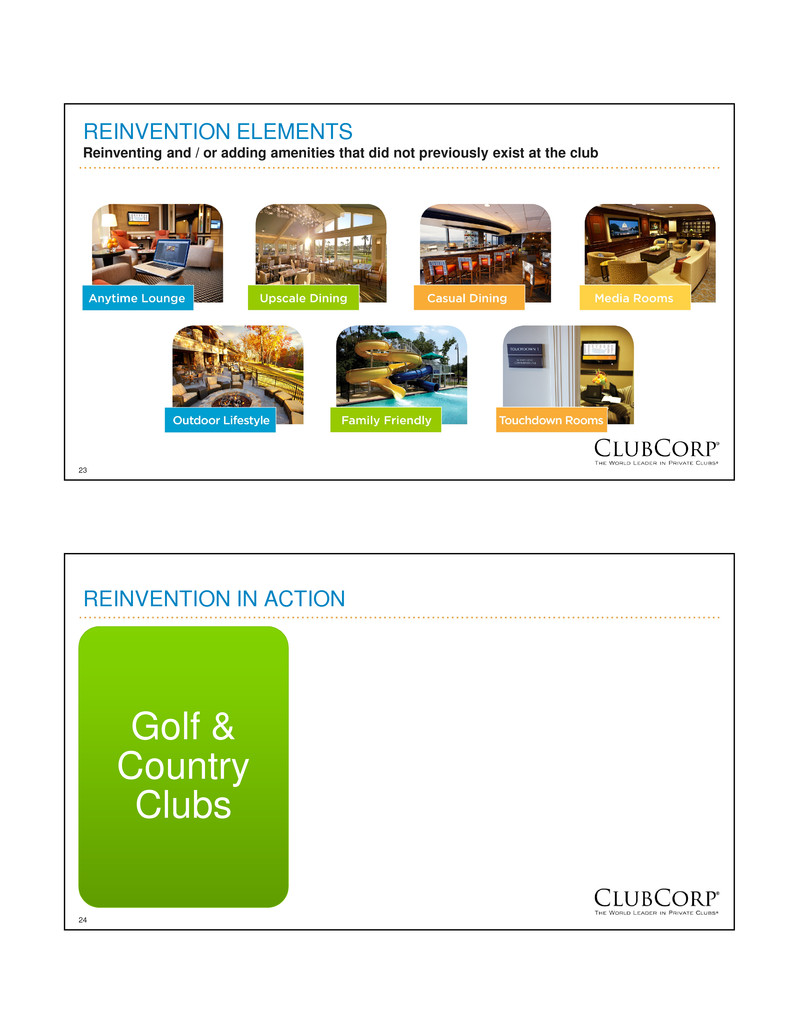
23 REINVENTION ELEMENTS Reinventing and / or adding amenities that did not previously exist at the club 24 REINVENTION IN ACTION Golf & Country Clubs

25 LAS COLINAS COUNTRY CLUB Irving, TX Dated, tired Modern, openTake advantage of view 26 MORGAN RUN CLUB & RESORT Rancho Santa Fe, CA Dated, stuffy, formal Warm, welcomingOutdoor amenity

27 THE CLUBS OF KINGWOOD Kingwood, TX Service bar Integrated, focal point of roomFamily friendly 28 STONEBRIAR COUNTRY CLUB Frisco, TX Formal, stuffy, dated Modern, casual diningEnhanced fitness facilities

29 GLENEAGLES COUNTRY CLUB Plano, TX Dated, undersized bar Integrated, modern, private experienceEnhanced fitness facilities 30 GLENEAGLES COUNTRY CLUB Plano, TX – GOLF PRACTICE FACILITIES
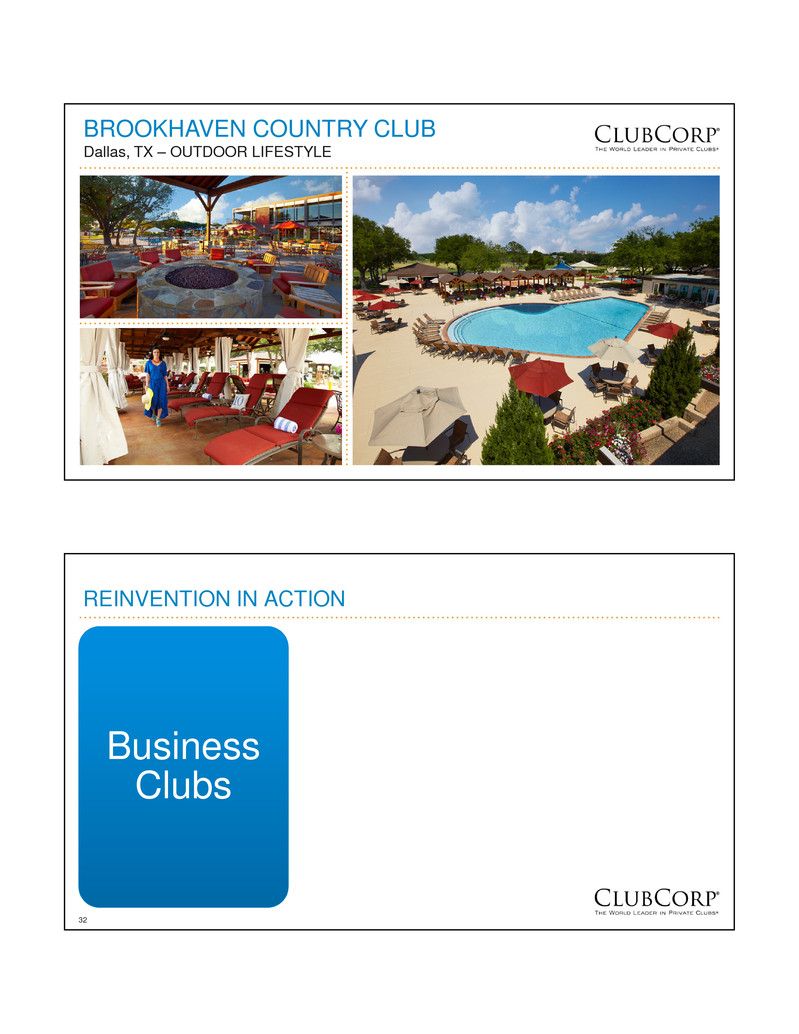
31 BROOKHAVEN COUNTRY CLUB Dallas, TX – OUTDOOR LIFESTYLE 32 REINVENTION IN ACTION Business Clubs

33 CITY CLUB LOS ANGELES Los Angeles, CA Formal, stuffy, traditional Modern dining, take advantage of viewWarm entry lobby 34 COLUMBIA TOWER CLUB Seattle, WA Formal, stuffy Integrated, casual diningAnytime lounge / media room
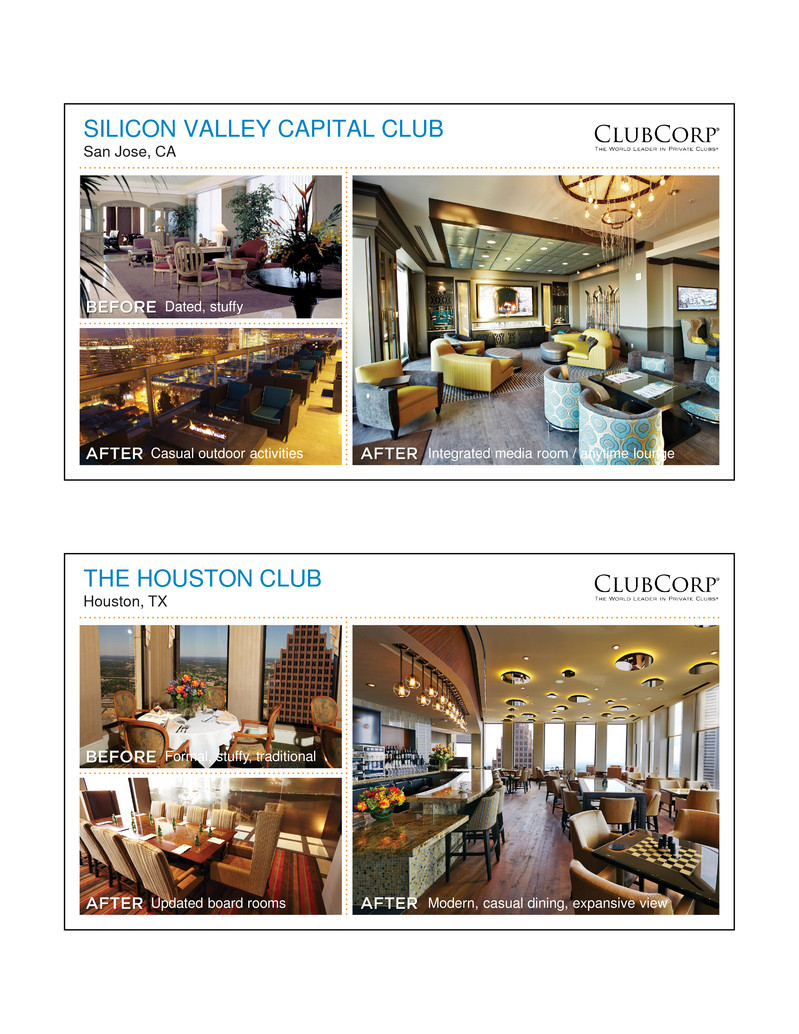
35 SILICON VALLEY CAPITAL CLUB San Jose, CA Dated, stuffy Integrated media room / anytime loungeCasual outdoor activities 36 THE HOUSTON CLUB Houston, TX Formal, stuffy, traditional Modern, casual dining, expansive viewUpdated board rooms

37 CITY CLUB RALEIGH Raleigh, NC Service bar Integrated, focal point of roomCasual dining 38 REINVENTION OFFSHOOTS … ADJACENT BUSINESS Alumni Clubs

39 THE UNIVERSITY OF TEXAS CLUB Austin, TX 40 BAYLOR CLUB Waco, TX
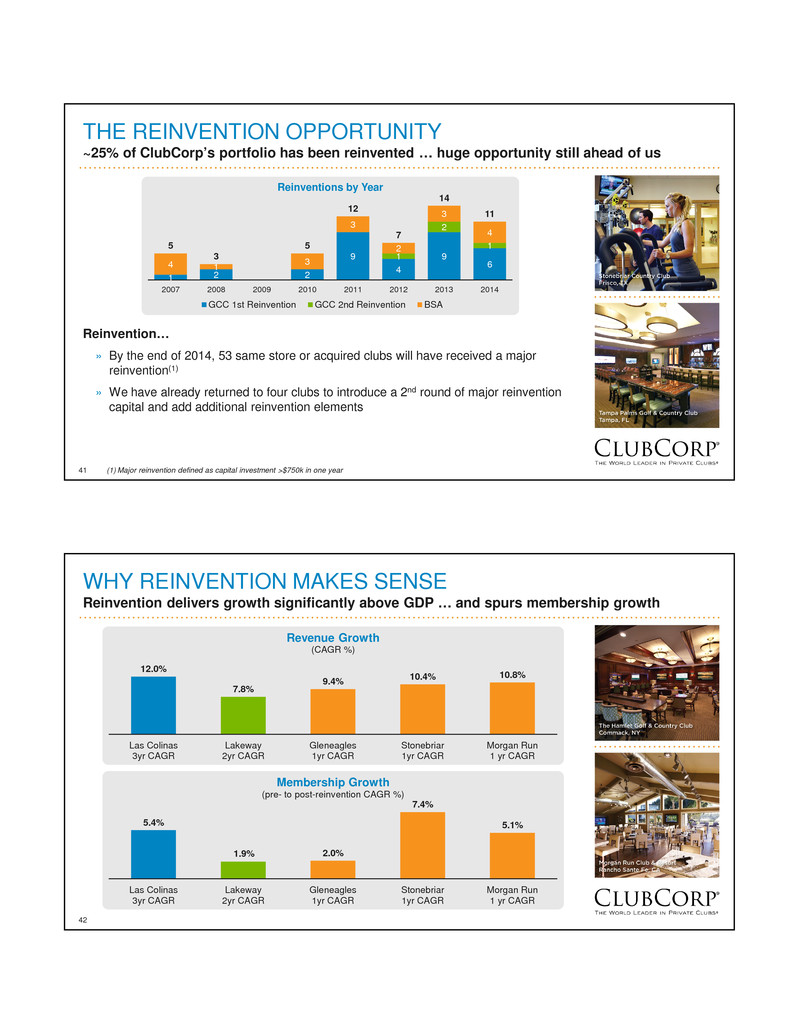
41 THE REINVENTION OPPORTUNITY ~25% of ClubCorp’s portfolio has been reinvented … huge opportunity still ahead of us Reinvention… » By the end of 2014, 53 same store or acquired clubs will have received a major reinvention(1) » We have already returned to four clubs to introduce a 2nd round of major reinvention capital and add additional reinvention elements 1 2 2 9 4 9 6 1 2 1 4 1 3 3 2 3 4 5 3 5 12 7 14 11 2007 2008 2009 2010 2011 2012 2013 2014 Reinventions by Year GCC 1st Reinvention GCC 2nd Reinvention BSA (1) Major reinvention defined as capital investment >$750k in one year 42 WHY REINVENTION MAKES SENSE Reinvention delivers growth significantly above GDP … and spurs membership growth 12.0% 7.8% 9.4% 10.4% 10.8% Las Colinas 3yr CAGR Lakeway 2yr CAGR Gleneagles 1yr CAGR Stonebriar 1yr CAGR Morgan Run 1 yr CAGR Revenue Growth (CAGR %) 5.4% 1.9% 2.0% 7.4% 5.1% Las Colinas 3yr CAGR Lakeway 2yr CAGR Gleneagles 1yr CAGR Stonebriar 1yr CAGR Morgan Run 1 yr CAGR Membership Growth (pre- to post-reinvention CAGR %)

43 WHY REINVENTION MAKES SENSE Attractive returns on expansion capital … that significantly exceeds our cost of capital Reinvention… » ~$60 million invested in major reinvention capital(2) since 2010 » In aggregate, these reinventions are contributing a run rate of $11+ million in incremental Adj. EBITDA this year(1) » Pro forma target 10-15% unlevered cash on cash returns by yr. 3 ─ Average historical cash on cash returns for GCC > 20% by yr. 3 and BSA >15% by yr. 3 4% 16% 22% 25% 26% Yr. 1 Yr. 2 Yr. 3 Yr. 4 Yr. 5 GCC Cash on Cash Returns(1) Projected -8% 9% 16% 18% 19% Yr. 1 Yr. 2 Yr. 3 Yr. 4 Yr. 5 BSA Cash on Cash Returns(1) Projected (1) Cash on cash determined as incremental Adj. EBITDA over base case projection for the same club assuming no reinvention investment divided by capital investment for project. (2) Major reinvention capital defined as projects where expansion capital exceeds $750k 44 THE VALUE OF REINVENTION Reinvention driving above GDP growth in our GCC business ... acquisitions cycle through Membership and ancillary spend growth is directly proportional to our ability and flexibility to reinvent clubs » Same store dues = g1858(membership, rate, O.N.E. penetration, reinvention) » Same store F&B = g1858(membership, a la carte covers, a la carte average check, private events, reinvention) » Same store golf ops = g1858(membership, member rounds, paid rounds and outings, reinvention) » Acquisitions = g1858(sourcing, cost synergies, revenue synergies, reinvention) $607 $661 $2$18 +6.6% $10 +7.3% $4 +2.6% $24 3Q'13 LTM Same Store Dues Same Store F&B Same Store Golf Ops Other Acquisitions 3Q'14 LTM GCC Revenue Bridge YTD ($ millions, growth year-over-year) $177 $191$10+5.9% $4 3Q'13 LTM Same Store Acquisitions 3Q'14 LTM GCC Adj. EBITDA(1) Bridge YTD ($ millions, growth year-over-year) (1) Adjusted EBITDA is a non-GAAP measure. See Appendix for the definition of Adjusted EBITDA and a reconciliation to the most comparable financial measure calculated in accordance with GAAP. (2) Acquisitions made in 2013 and 2014, and does not include Sequoia Golf (2)(2)

45 REINVENTION AT CLUBCORP Strengthens ClubCorp’s value proposition and increases the company’s intrinsic value Relevant amenities and programming create tangible Member benefit that enriches the Member experience Reinvention design is aligned with how Members use the club … making the club relevant, practical and family friendly ClubCorp has significant reinvention opportunities … acquisitions add to the reinvention pipeline Revenue growth at reinvented clubs is significantly above GDP growth Returns on incremental invested capital are multiples above the ClubCorp’s weighted average cost of capital 46 FINANCIAL OVERVIEW Curt McClellan, CFO
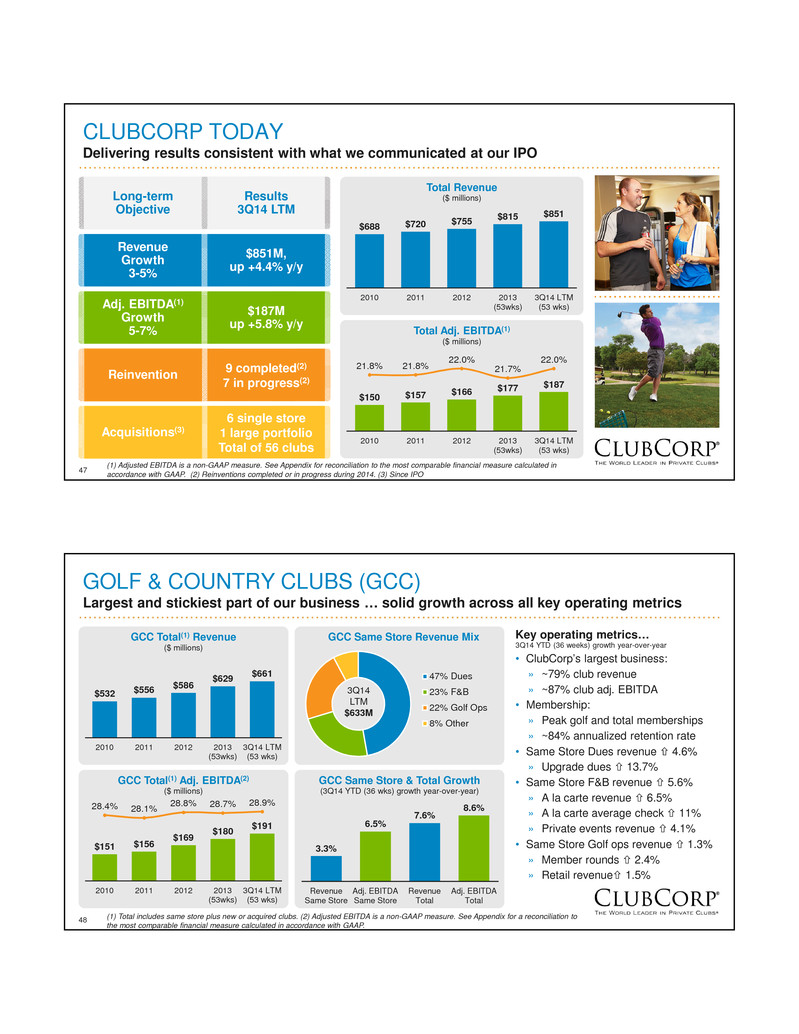
47 CLUBCORP TODAY Delivering results consistent with what we communicated at our IPO $688 $720 $755 $815 $851 2010 2011 2012 2013 (53wks) 3Q14 LTM (53 wks) Total Revenue ($ millions) $150 $157 $166 $177 $187 21.8% 21.8% 22.0% 21.7% 22.0% 2010 2011 2012 2013 (53wks) 3Q14 LTM (53 wks) Total Adj. EBITDA(1) ($ millions) Adj. EBITDA(1) Growth 5-7% $187M up +5.8% y/y Reinvention 9 completed (2) 7 in progress(2) Revenue Growth 3-5% $851M, up +4.4% y/y Long-term Objective Results 3Q14 LTM Acquisitions(3) 6 single store 1 large portfolio Total of 56 clubs (1) Adjusted EBITDA is a non-GAAP measure. See Appendix for reconciliation to the most comparable financial measure calculated in accordance with GAAP. (2) Reinventions completed or in progress during 2014. (3) Since IPO 48 GOLF & COUNTRY CLUBS (GCC) Largest and stickiest part of our business … solid growth across all key operating metrics $532 $556 $586 $629 $661 2010 2011 2012 2013 (53wks) 3Q14 LTM (53 wks) GCC Total(1) Revenue ($ millions) $151 $156 $169 $180 $191 28.4% 28.1% 28.8% 28.7% 28.9% 2010 2011 2012 2013 (53wks) 3Q14 LTM (53 wks) GCC Total(1) Adj. EBITDA(2) ($ millions) 3.3% 6.5% 7.6% 8.6% Revenue Same Store Adj. EBITDA Same Store Revenue Total Adj. EBITDA Total GCC Same Store & Total Growth (3Q14 YTD (36 wks) growth year-over-year) Key operating metrics… 3Q14 YTD (36 weeks) growth year-over-year • ClubCorp’s largest business: » ~79% club revenue » ~87% club adj. EBITDA • Membership: » Peak golf and total memberships » ~84% annualized retention rate • Same Store Dues revenue bup 4.6% » Upgrade dues bup 13.7% • Same Store F&B revenue bup 5.6% » A la carte revenue bup 6.5% » A la carte average check bup 11% » Private events revenue bup 4.1% • Same Store Golf ops revenue bup 1.3% » Member rounds bup 2.4% » Retail revenuebup 1.5% GCC Same Store Revenue Mix 47% Dues 23% F&B 22% Golf Ops 8% Other 3Q14 LTM $633M (1) Total includes same store plus new or acquired clubs. (2) Adjusted EBITDA is a non-GAAP measure. See Appendix for a reconciliation to the most comparable financial measure calculated in accordance with GAAP.

49 BUSINESS, SPORTS & ALUMNI CLUBS (BSA) Stable business … moderate revenue growth and improving profitability $168 $172 $174 $180 $184 2010 2011 2012 2013 (53wks) 3Q14 LTM (53 wks) BSA Total(1) Revenue ($ millions) $30 $33 $34 $35 $3618.1% 19.0% 19.6% 19.1% 19.6% 2010 2011 2012 2013 (53wks) 3Q14 LTM (53 wks) BSA Total(1) Adj. EBITDA(2) ($ millions) 3.1% 9.9% 3.4% 8.5% Revenue Same Store Adj. EBITDA Same Store Revenue Total Adj. EBITDA Total BSA Same Store & Total Growth (3Q14 YTD (36 wks) growth year-over-year) Key operating metrics… 3Q14 YTD (36 weeks) growth year-over-year • ClubCorp’s BSA business: » ~21% club revenue » ~13% club adj. EBITDA • Membership: » Flat overall with modest increase in the 3Q14 • Same Store Dues revenue bup 1.6% » Upgrade dues bup 1.7% • Same Store F&B revenue bup 5.2% » A la carte revenue bup 0.9% » A la carte covers bup 14.9% » Private events revenue bup 6.8% BSA Same Store Revenue Mix 43% Dues 50% F&B 7% Other 3Q14 LTM $184M (1) Total includes same store plus new or acquired clubs. (2) Adjusted EBITDA is a non-GAAP measure. See Appendix for a reconciliation to the most comparable financial measure calculated in accordance with GAAP. 50 CAPITAL STRUCTURE Strong balance sheet Pro-forma capitalization ($ millions, except share price) Capitalization 3Q14 Adj. PF 3Q14 Common Shares 64.4 64.4 Share Price @ 12/5/2014 $19.91 $19.91 Total Equity Capitalization $1,282 $1,282 Term Loan $651 $250 $901 Revolver 0 0 Mortgage Notes 38 38 Other Debt 2 2 Capital Leases 33 3 36 Total Debt(1) $724 $977 Less Cash Equivalents (66) 5 (61) Net Debt $658 $916 Total Capitalization $1,940 $2,198 Non-controlling interest 11 11 Total Enterprise Value $1,951 $2,209 Capital Structure and Liquidity… • Preservation of strong balance sheet • Incremental $250 million senior secured term loans, creating one fungible term loan tranche of ~$900 million priced at L+350 bps, with a 1% LIBOR floor that will mature on July 24, 2020 • Sr. Secured leverage ratio increases from ~3.7x to ~4.3x • No near term debt maturities through 2020 • Earlier in the year, full redemption of $270M in 10% sr. unsecured notes, replaced by $350M in sr. secured term loan (1) Total debt excludes $12M of notes payable related to certain non-core development entities and $2M discount on term loan

51 FREE CASH FLOW AND CAPEX Attractive FCF generation … continued investment in business $72.7 $70.7 $77.0 $83.2 $87.6 $99.6 2Q13 LTM 3Q13 LTM 4Q13 LTM 1Q14 LTM 2Q14 LTM 3Q14 LTM Levered FCF ($ millions) Free Cash Flow… • +41% y/y increase in LTM levered FCF • Reduced interest expense and cash taxes throughout the year » Anticipated 2014 interest expense of $39 million » Anticipated 2014 cash tax expense of $12 million • Paid ~$30 million in dividends over the last twelve months $24.9 $25.1 $16.7 $23.8 $28.2 $18.0 $22.8 $37.5 $35.7 $44.4 2010 2011 2012 2013 3Q14 LTM Capital Expenditures ($ millions) Maintenance Capex ROI Capex 52 2015 OUTLOOK Guidance indicates upside from Sequoia Golf acquisition Sequoia Golf acquisition… » Cost synergies: ─ Reduction in duplicative corporate overhead ─ Procurement synergies » Upside from revenue synergies: ─ Introduction of O.N.E. product ─ Reinvention elements will be phased in over the next two years (~$15M in yr. 1) » Track performance as newly acquired clubs Core business… » Stable margins » Attractive FCF generation » 2nd year ramp of 2014 reinventions » New class of 2015 reinventions Adj. EBITDA(1) $225M to $235M Reinvention Capex $42M to 44M Revenue $1,000M to $1,030M Metric 2015 Outlook Dividend (full year) Increase +8% $0.52 / share (1) Adjusted EBITDA is a non-GAAP measure. See Appendix for a reconciliation to the most comparable financial measure calculated in accordance with GAAP.

53 CLUBCORP VALUATION Continued strong execution fuels stock price growth … and should yield multiple expansion $14.00 $15.09 $15.31 $17.94 $18.39 $17.98 $19.07 IPO 3Q13 4Q13 1Q14 2Q14 3Q14 4Q14 MYCC Quarterly Average Stock Price Low-end of 2015 Outlook » Member growth slows, reducing future member dues and ancillary revenue » Realized Sequoia Golf cost and revenue synergies are below expectations » Returns on invested reinvention or acquisition capital are lower than they have been historically Midpoint of 2015 Outlook » Solid same store growth across all three primary revenue streams: dues, F&B and golf operations » All Sequoia Golf cost and revenue synergies are inline or above company projections » Strong member retention and consistent new member growth High-end of 2015 Outlook » Adoption of O.N.E. among Sequoia Golf members exceeds company projections » ROI from club reinventions and acquisitions are realized on an accelerated basis » Economy grows at a faster rate, membership growth accelerates » Acquisition strategy accelerates (1) 4Q14 quarterly average stock price as of 12/3/2014 (1) 54 LONG-TERM OBJECTIVE ClubCorp’s growth strategy validates our ability to grow revenue and Adj. EBITDA above GDP Organic Growth Reinvention Acquisitions 1 2 3 Revenue Growth 3-5% Adj. EBITDA(1) Growth 5-7% Long- term objective (1) Adjusted EBITDA is a non-GAAP measure. See Appendix for the definition of Adjusted EBITDA and a reconciliation to the most comparable financial measure calculated in accordance with GAAP.

55 REIT ANALYSIS Eric Affeldt, President and CEO 56 REIT EVALUATION PROCESS Relentless focus on long-term creation of shareholder value Real estate holdings are a valuable asset ClubCorp is a unique and differentiated business relative to most other real estate intensive businesses Engaged top-tier advisors in finance, tax and law for comprehensive review of strategic options Comprehensive analysis of strategic options Structure that complements execution of ClubCorp’s growth strategy (reinvention and acquisitions) Evaluated strategic and financial implications of five REIT structures including WholeCo conversion and OpCo / PropCo G u id in g pr in ci pl es Si tu at io n Pr o ce ss

57 CONSIDERATIONS OF A WHOLECO CONVERSION Current political environment makes this structure unlikely » Allows company to continue to execute existing business plan and operate a fully integrated owner/operator business model and pursue its acquisition and reinvention growth strategy » Company retains capital markets flexibility and cost of capital advantage to acquire new clubs » Company benefits from significant tax savings If we could, we would likely pursue a WholeCo conversion … This option is not available today » The company’s business activities do not generate rental income in a traditional way like most REITs even though the company believes in the merits of recognizing dues as rents » A whole company REIT conversion would require an IRS Private Letter Ruling (“PLR”), which is not available today If this structure becomes an option in the future, the Board would revisit a WholeCo conversion 58 CONSIDERATIONS OF AN OPCO/PROPCO STRUCTURE From an operational, growth, and long-term value perspective, ClubCorp current model superior O pe ra tio n al / G ro w th Fi n an ci al » Current single owner-operator model is superior because it provides a stronger platform for reinvention and growth through future acquisitions » Tax savings on structure are largely offset by additional costs resulting from added G&A and likely higher borrowing costs » Reduced retained cash flow reduces ability to fund growth (resulting from REIT tax requirements) Sh ar eh o ld er va lu e cr ea tio n » Risk of multiple degradation on OpCo due to higher leverage, reduced scale, and loss of real estate » ClubCorp REIT may not achieve full valuation available to triple net leased REITs » Downward stock price pressure resulting from impediments to long-term growth strategy C-Corp integrated structure is currently the best structure for ClubCorp

59 CONSIDERATIONS OF AN OPCO/PROPCO STRUCTURE ClubCorp’s integrated owner/operator model is superior to OpCo/PropCo Structure ClubCorp C-corp OpCo PropCo Growth Strategy Organic Reinvention Acquisitions Capital Structure & Liquidity Flexible balance sheet Access to capital Leverage Financial Tax efficiency(1) Free cash flow / retained earnings Operational efficiency / G&A costs (1) Not significant payer of cash taxes in 2014, but cash taxes will increase in 2015 Most favorable Least favorableModerately favorable 60 KEY REIT VALUATION CRITERIA A ClubCorp REIT does not have the same characteristics as best-in-class REIT peers Highly valued public triple-net REITs ClubCorp REIT Property portfolio Diverse tenant base Single tenant / operator concentration Diversity of portfolio Lack of industry diversification Alternative use of real estate Limited alternate use of real-estate Credit quality of tenant base Small-cap non-investment grade tenant Key investor objectives Management Ability to attract REIT management uncertain Independence PropCo dependent on OpCo G&A burden Fixed overhead relative to scale Dividend track record To be established over time Other considerations Long REIT track record To be established over time Low balance sheet leverage Increased leverage, reliant on OpCo Opportunities for growth Uncertain diversification strategy Size/scale Limited universe of potential investors Inclusion in REIT indices RMZ index inclusion uncertain Most favorable Least favorableModerately favorable
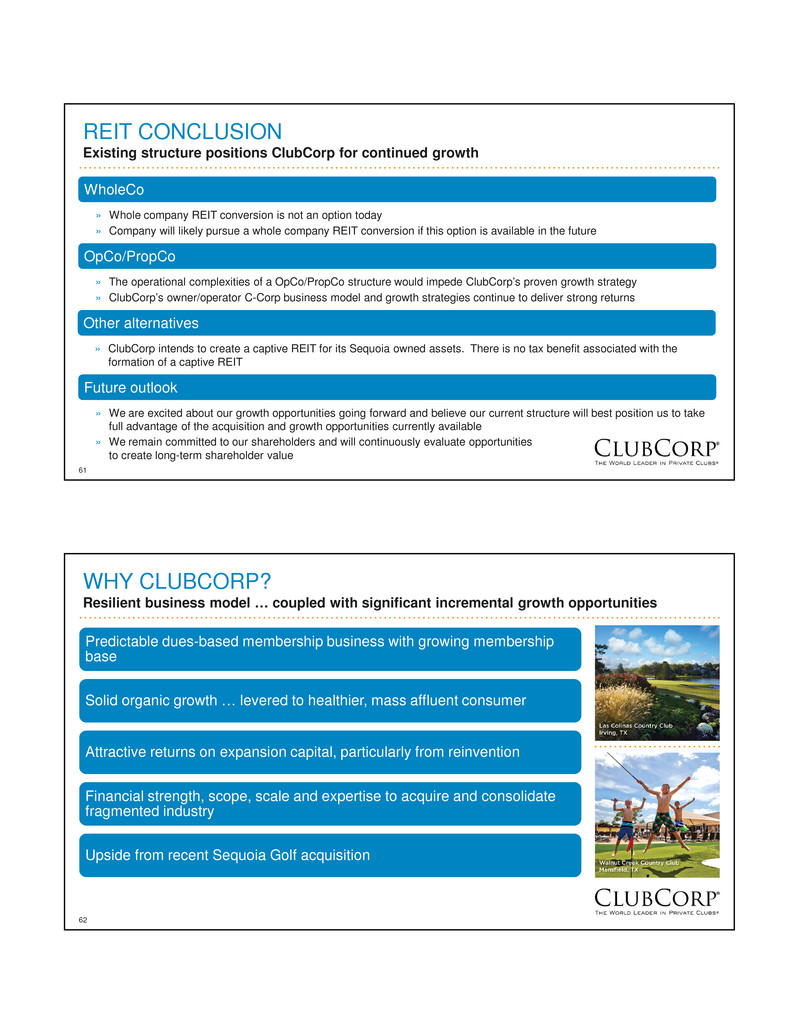
61 REIT CONCLUSION Existing structure positions ClubCorp for continued growth » Whole company REIT conversion is not an option today » Company will likely pursue a whole company REIT conversion if this option is available in the future WholeCo » The operational complexities of a OpCo/PropCo structure would impede ClubCorp’s proven growth strategy » ClubCorp’s owner/operator C-Corp business model and growth strategies continue to deliver strong returns OpCo/PropCo » We are excited about our growth opportunities going forward and believe our current structure will best position us to take full advantage of the acquisition and growth opportunities currently available » We remain committed to our shareholders and will continuously evaluate opportunities to create long-term shareholder value Future outlook » ClubCorp intends to create a captive REIT for its Sequoia owned assets. There is no tax benefit associated with the formation of a captive REIT Other alternatives 62 WHY CLUBCORP? Resilient business model … coupled with significant incremental growth opportunities Predictable dues-based membership business with growing membership base Solid organic growth … levered to healthier, mass affluent consumer Attractive returns on expansion capital, particularly from reinvention Financial strength, scope, scale and expertise to acquire and consolidate fragmented industry Upside from recent Sequoia Golf acquisition
63 64 APPENDIX

65 NET INCOME TO ADJUSTED EBITDA RECONCILIATION OF NON-GAAP MEASURES TO CLOSEST GAAP MEASURE (1) Includes non-cash impairment charges related to property and equipment, liquor licenses, mineral rights, loss on disposals of assets and net loss or income from discontinued operations and divested clubs that do not quality as discontinued operations. (2) Includes loss on extinguishment of debt calculated in accordance with GAAP. (3) Includes non-cash items related to purchase accounting associated with the acquisition of ClubCorp, Inc. ("CCI") in 2006 by affiliates of KSL and expense recognized for our long-term incentive plan related to fiscal years 2011 through 2013. (4) Represents adjustments permitted by the credit agreement governing ClubCorp's secured credit facilities including cash distributions from equity method investments less equity in earnings recognized for said investments, income or loss attributable to non-controlling equity interests of continuing operations, franchise taxes, adjustments to accruals for unclaimed property settlements, acquisition costs, debt amendment costs, equity offering costs, other charges incurred in connection with the ClubCorp Formation (as defined in our Annual Report on Form 10-K filed with the SEC on March 21, 2014) and management fees, termination fee and expenses paid to an affiliate of KSL. (5) Includes equity-based compensation expense, calculated in accordance with GAAP, related to awards held by certain employees, executives and directors. (6) Represents estimated deferred revenue using current membership life estimates related to initiation payments that would have been recognized in the applicable period but for the application of purchase accounting in connection with the acquisition of CCI in 2006. 2Q13 3Q13 4Q13 1Q14 2Q14 3Q14 LTM LTM LTM LTM LTM LTM Net (loss) (18,818)$ (11,454)$ (40,680)$ (33,977)$ (58,576)$ (50,269)$ Interest expense 88,348 87,771 83,669 79,815 75,820 69,265 Income tax (benefit) expense (11,619) (6,131) 1,681 612 (4,506) (2,497) Interest and investment income (1,299) (1,350) (345) (352) (370) (1,656) Depreciation and amortization 74,419 73,857 72,073 72,364 72,851 72,981 EBITDA 131,031 142,693 116,398 118,462 85,219 87,824 Impairments, disposition of assets and income (loss) from discontinued operations and divested clubs (1) 30,275 19,903 14,364 15,206 14,352 13,360 Loss on extinguishment of debt (2) - - 16,856 16,856 48,354 48,354 Non-cash adjustments (3) 3,536 3,903 3,929 3,581 3,201 2,545 Other adjustments (4) 3,991 6,229 10,134 8,565 13,674 14,932 Equity-based compensation expense (5) - - 14,217 15,049 16,305 17,254 Acquisition adjustment (6) 2,357 1,985 1,306 1,776 2,400 3,136 Adjusted EBITDA 171,190$ 174,713$ 177,204$ 179,495$ 183,505$ 187,405$ 66 CALCULATION OF FREE CASH FLOW RECONCILIATION OF NON-GAAP MEASURES TO CLOSEST GAAP MEASURE (1) See the Adjusted EBITDA reconciliation in the preceding "Reconciliation of Non-GAAP Measures to Closest GAAP Measure" table. (2) Interest on long-term debt excludes accretion of discount on member deposits, amortization of debt issuance costs, amortization of term loan discount and interest on notes payable related to certain realty interests which we define as “Non-Core Development Entities”. 2Q13 3Q13 4Q13 1Q14 2Q14 3Q14 LTM LTM LTM LTM LTM LTM Adjusted EBITDA (1) 171,190$ 174,713$ 177,204$ 179,495$ 183,505$ 187,405$ LESS: Interest expense and principal amortization on long-term debt (2) 65,758 64,758 61,317 56,660 51,776 44,370 Cash paid for income taxes 3,051 3,521 3,187 3,192 4,162 2,796 Maintenance capital expenditures 18,361 24,135 23,831 24,279 27,730 28,162 Capital lease principal & interest expense 11,350 11,644 11,885 12,190 12,197 12,436 Free Cash Flow 72,670$ 70,655$ 76,984$ 83,174$ 87,640$ 99,641$

67 THANK YOU! Go Enjoy a Club! 68
