Attached files
| file | filename |
|---|---|
| 8-K - 8-K - CARPENTER TECHNOLOGY CORP | a14-25554_18k.htm |
Exhibit 99.1
|
|
Credit Suisse Global Industrials Conference Tony Thene Senior Vice President and Chief Financial Officer December 3, 2014 New York, NY |

|
|
2 Cautionary Statement Forward-Looking Statements This presentation contains forward-looking statements within the meaning of the Private Securities Litigation Act of 1995. These forward-looking statements are subject to risks and uncertainties that could cause actual results to differ from those projected, anticipated or implied. The most significant of these uncertainties are described in Carpenter’s filings with the Securities and Exchange Commission including its annual report on Form 10-K for the year ended June 30, 2014, the Form 10-Q issued for the quarter ending September 30, 2014 and the exhibits attached to those filings. They include but are not limited to: (1) the cyclical nature of the specialty materials business and certain end-use markets, including aerospace, defense, industrial, transportation, consumer, medical, and energy, or other influences on Carpenter’s business such as new competitors, the consolidation of competitors, customers, and suppliers or the transfer of manufacturing capacity from the United States to foreign countries; (2) the ability of Carpenter to achieve cash generation, growth, profitability, cost savings, productivity improvements or process changes; (3) the ability to recoup increases in the cost of energy, raw materials, freight or other factors; (4) domestic and foreign excess manufacturing capacity for certain metals; (5) fluctuations in currency exchange rates; (6) the degree of success of government trade actions; (7) the valuation of the assets and liabilities in Carpenter’s pension trusts and the accounting for pension plans; (8) possible labor disputes or work stoppages; (9) the potential that our customers may substitute alternate materials or adopt different manufacturing practices that replace or limit the suitability of our products; (10) the ability to successfully acquire and integrate acquisitions; (11) the availability of credit facilities to Carpenter, its customers or other members of the supply chain; (12) the ability to obtain energy or raw materials, especially from suppliers located in countries that may be subject to unstable political or economic conditions; (13) Carpenter’s manufacturing processes are dependent upon highly specialized equipment located primarily in facilities in Reading, Latrobe and Athens for which there may be limited alternatives if there are significant equipment failures or a catastrophic event; (14) the ability to hire and retain key personnel, including members of the executive management team, management, metallurgists and other skilled personnel; and (15) share repurchases are at Carpenter’s discretion and could be affected by changes in Carpenter’s share price, operating results, capital spending, cash flows, inventory, acquisitions, investments, tax laws, and general market conditions. Any of these factors could have an adverse and/or fluctuating effect on Carpenter’s results of operations. The forward-looking statements in this document are intended to be subject to the safe harbor protection provided by Section 27A of the Securities Act of 1933, as amended, and Section 21E of the Securities Exchange Act of 1934, as amended. Carpenter undertakes no obligation to update or revise any forward-looking statements. Non-GAAP Financial Measures Some of the information included in this presentation is derived from Carpenter’s consolidated financial information but is not presented in Carpenter’s financial statements prepared in accordance with U.S. Generally Accepted Accounting Principles (GAAP). Certain of these data are considered “non-GAAP financial measures” under SEC rules. These non-GAAP financial measures supplement our GAAP disclosures and should not be considered an alternative to the GAAP measure. Reconciliations to the most directly comparable GAAP financial measures and management’s rationale for the use of the non-GAAP financial measures can be found in the Appendix to this presentation. |

|
|
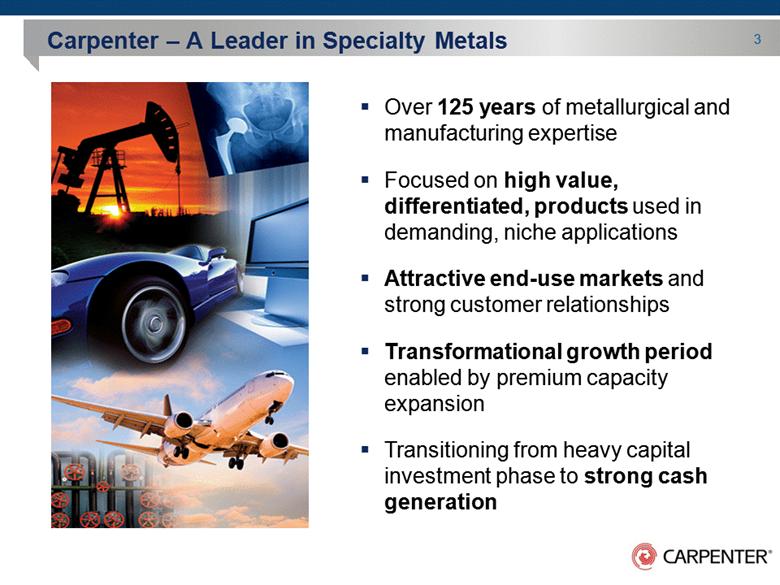
3 Carpenter – A Leader in Specialty Metals Over 125 years of metallurgical and manufacturing expertise Focused on high value, differentiated, products used in demanding, niche applications Attractive end-use markets and strong customer relationships Transformational growth period enabled by premium capacity expansion Transitioning from heavy capital investment phase to strong cash generation |
|
|
4 Carpenter Targets High End of Specialty Steel Market Carpenter Focus Global Steel Production (volume) Other Alloy Steels 69% Stainless Flat 20% Bearing 5% Stainless Long 4% Special Alloy <2% Ni 0.2% Specialty Steel Market 9% Source: SMR GmbH, 2012 (Note: Excludes Ti and Powder Metal) Increasing Volume Increasing Value <1% of total steel market Specialty Steel Market 0% 10% 20% 30% 40% 50% 60% 70% 80% 90% 100% Carbon Steel 91% |

|
|
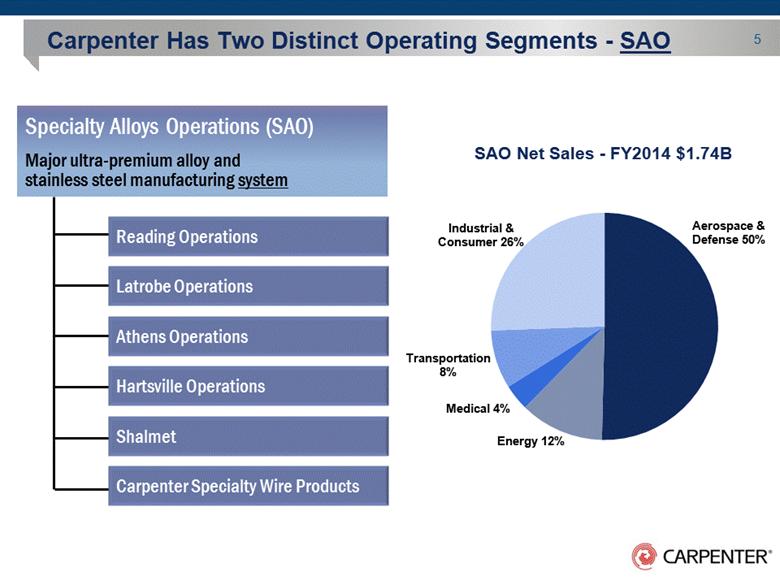
5 Carpenter Has Two Distinct Operating Segments - SAO Specialty Alloys Operations (SAO) Major ultra-premium alloy and stainless steel manufacturing system Reading Operations Latrobe Operations Athens Operations Shalmet Carpenter Specialty Wire Products Hartsville Operations SAO Net Sales - FY2014 $1.74B |
|
|
6 Carpenter Has Two Distinct Operating Segments - PEP Performance Engineered Products (PEP) Differentiated operations Amega West Carpenter Powder Products Specialty Steel Supply Dynamet Latrobe Specialty Distribution PEP Net Sales - FY2014 $0.50B |

|
|
Carpenter Participates in Attractive End Markets FY2014 Net Sales of $2.2B 7 |

|
|
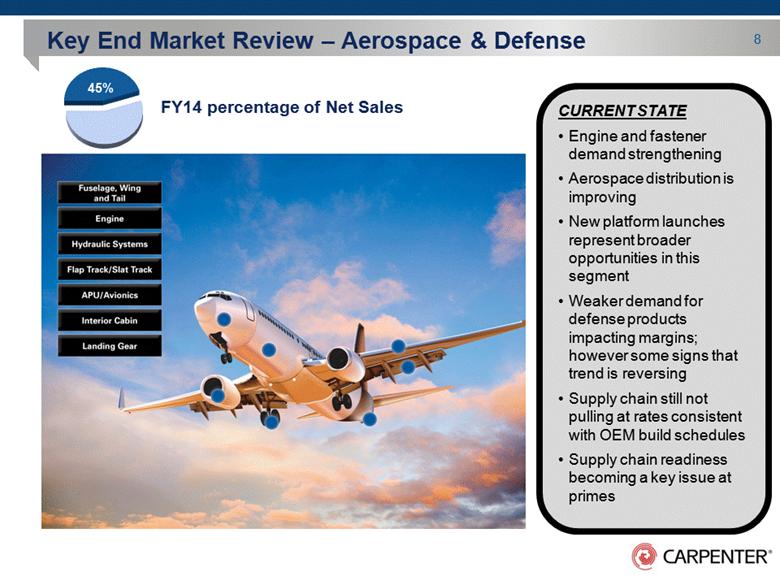
8 Key End Market Review – Aerospace & Defense CURRENT STATE Engine and fastener demand strengthening Aerospace distribution is improving New platform launches represent broader opportunities in this segment Weaker demand for defense products impacting margins; however some signs that trend is reversing Supply chain still not pulling at rates consistent with OEM build schedules Supply chain readiness becoming a key issue at primes 45% FY14 percentage of Net Sales |
|
|
9 Key End Market Review – Energy CURRENT STATE Strong growth in oil & gas drilling/exploration products as well as completions Directional rig count continues to grow year over year New drilling technologies are utilizing more specialty steels with differentiated attributes Dropping crude prices could have a negative impact on demand Athens capacity is enabling incremental growth Distribution channels now engaged in re-stocking 14% FY14 percentage of Net Sales |

|
|
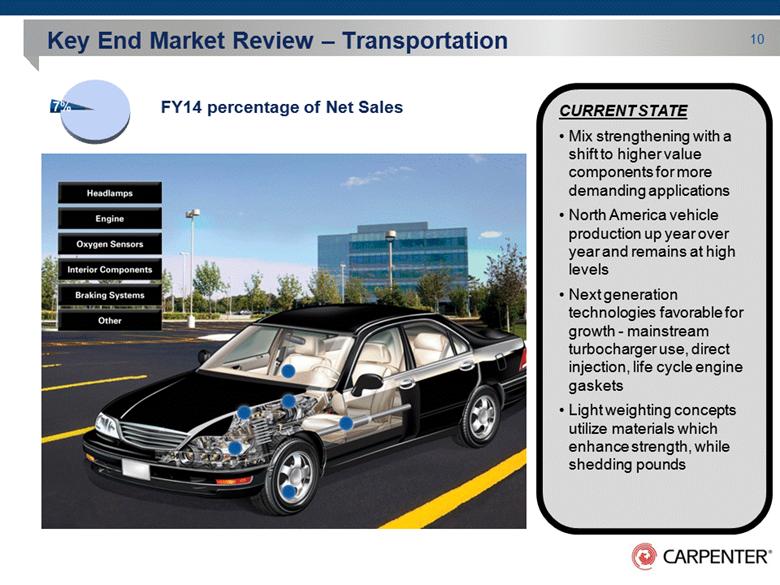
10 Key End Market Review – Transportation CURRENT STATE Mix strengthening with a shift to higher value components for more demanding applications North America vehicle production up year over year and remains at high levels Next generation technologies favorable for growth - mainstream turbocharger use, direct injection, life cycle engine gaskets Light weighting concepts utilize materials which enhance strength, while shedding pounds 7% FY14 percentage of Net Sales |
|
|
11 Key End Market Review – Medical CURRENT STATE OEMs have resumed more normalized buying patterns as supply chain inventories have stabilized Sales are increasing year over year but at a weaker mix – stainless vs. titanium cobalt Environment is very competitive reacting to changes in health care and insurance policies Medical instrumentation and diagnostic equipment represent growth areas in this segment 14% 5% FY14 percentage of Net Sales |

|
|
Backlog Revenue Backlog Mix Lead Times Takeaways Backlog Revenue – Higher level of orders and improved mix Backlog Mix – Profitability in backlog has grown since July Lead Times – Increasing for high temp forge products 12 Current Market Indicators Improving |

|
|
13 Athens Facility Expected to be an Industry Game-Changer 27K tons of incremental premium capacity Latest technology and automation permits straight-through processing and reduced cost per ton Enables shorter customer lead times and efficient inventory management Low break-even volumes for cash and earnings |

|
|
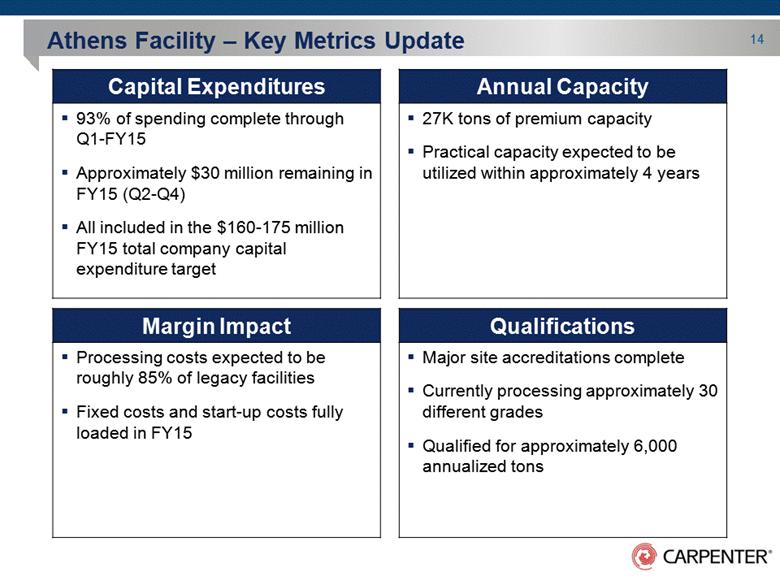
Capital Expenditures Annual Capacity 93% of spending complete through Q1-FY15 Approximately $30 million remaining in FY15 (Q2-Q4) All included in the $160-175 million FY15 total company capital expenditure target 27K tons of premium capacity Practical capacity expected to be utilized within approximately 4 years Margin Impact Qualifications Processing costs expected to be roughly 85% of legacy facilities Fixed costs and start-up costs fully loaded in FY15 Major site accreditations complete Currently processing approximately 30 different grades Qualified for approximately 6,000 annualized tons 14 Athens Facility – Key Metrics Update |
|
|
PROCESS VALIDATE & DEVELOP PRODUCT VALIDATE & QUALIFY PRODUCT QUALIFY Athens Qualification Process Phase I Data Requirements Press ESR, VAR Phase II Phase III INTERNAL EXTERNAL 15 |

|
|
Athens Qualification Process On-Track Current Commercially operational and providing some capacity relief at Reading and Latrobe Supporting some aerospace applications that require base industry specifications Producing stainless directional drilling products for oil and gas exploration and corrosion resistant products for chemical processing industry 6-12 Months Achieve qualifications which will fully support the oil and gas nickel superalloy demand for down hole tools, well completions and subsea applications. Achieve additional, more stringent qualifications from the aerospace segment 12-36 Months Achieve the most stringent aerospace engine parts approvals from the primes and their risk sharing partners This will complete the full integration of our specialty steels portfolio Achieve maximum manufacturing flexibility and add the ultimate net volume output to our system 16 |

|
|
17 Estimated Range ($160 - $175) Athens ($67) Heavy Investment Phase Nearly Complete Target of Approximately $120M per Year Capital Expenditures Millions |

|
|
18 Working Capital Identified as an Opportunity * See appendix for details of calculation. Days Working Capital* |

|
|
Strong Liquidity Position and Solid Capital Structure Aggregate Debt Level Revolver 7.02% 5.20% 4.45% 19 |

|
|
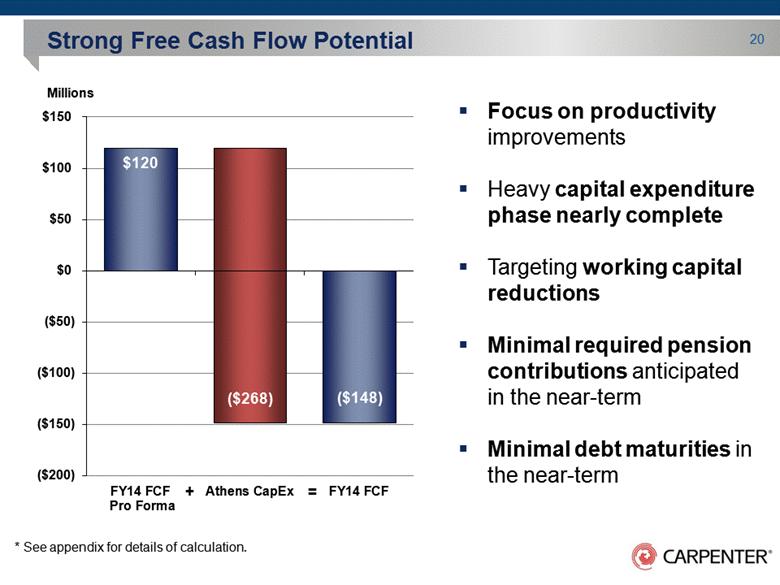
20 Strong Free Cash Flow Potential * See appendix for details of calculation. Focus on productivity improvements Heavy capital expenditure phase nearly complete Targeting working capital reductions Minimal required pension contributions anticipated in the near-term Minimal debt maturities in the near-term Millions = + |
|
|
Share Repurchase Authorization Reaffirms Confidence 21 |

|
|
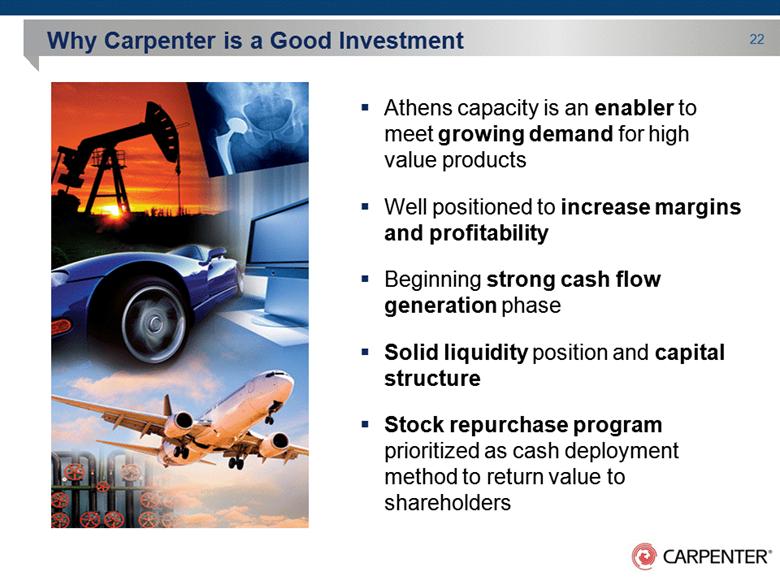
22 Why Carpenter is a Good Investment Athens capacity is an enabler to meet growing demand for high value products Well positioned to increase margins and profitability Beginning strong cash flow generation phase Solid liquidity position and capital structure Stock repurchase program prioritized as cash deployment method to return value to shareholders |
|
|
Appendix of Supplemental Schedules |

|
|
24 Days Working Capital Calculations FY08 FY09 FY10 FY11 FY12 FY13 FY14 ($ in millions) Accounts receivable, net $ 285.1 $ 130.8 $ 188.5 $ 259.4 $ 354.2 $ 342.0 $ 339.6 Inventory, net 209.0 185.4 203.6 328.6 642.0 659.2 699.2 LIFO reserve 448.0 305.8 331.8 355.4 279.8 222.4 195.7 Gross inventory 657.0 491.2 535.4 684.0 921.8 881.6 894.9 Accounts payable (158.4) (70.2) (130.5) (170.5) (236.1) (252.7) (278.1) Net working capital $ 783.7 $ 551.8 $ 593.4 $ 772.9 $ 1,039.9 $ 970.9 $ 956.4 Net sales - Q4 $ 556.3 $ 256.9 $ 364.2 $ 483.6 $ 643.7 $ 611.8 $ 604.6 Days working capital 126.8 193.3 146.6 143.8 145.4 142.8 142.4 |

|
|
25 Free Cash Flow FY 14 Net cash provided from operating activities $ 239.6 Purchases of property, equipment and software (349.2) Dividends paid (38.5) Proceeds from disposals of plant and equipment 0.3 Free cash flow $ (147.8) Management believes that the presentation of free cash flow provides useful information to investors regarding the Company’s financial condition because it is a measure of cash generated which management evaluates for alternative uses. Free cash flow is not a U.S. GAAP financial measure and should not be considered in isolation of, or as a substitute for, cash flows calculated in accordance with U.S. GAAP. |
