Attached files
| file | filename |
|---|---|
| 8-K - 8-K - SELECT MEDICAL HOLDINGS CORP | a14-25260_18k.htm |
Exhibit 99.1
|
|
Bank of America Merrill Lynch 2014 Leveraged Finance Conference December 2, 2014 |
|
|
This presentation may contain forward-looking statements based on current management expectations. Numerous factors, including those related to market conditions and those detailed from time-to-time in the Company’s filings with the Securities and Exchange Commission, may cause results to differ materially from those anticipated in the forward-looking statements. Many of the factors that will determine the Company’s future results are beyond the ability of the Company to control or predict. These statements are subject to risks and uncertainties and, therefore, actual results may differ materially. Readers should not place undue reliance on forward-looking statements, which reflect management’s views only as of the date hereof. The Company undertakes no obligation to revise or update any forward-looking statements, or to make any other forward-looking statements, whether as a result of new information, future events or otherwise. All references to “Select” used throughout this presentation refer to Select Medical Holdings Corporation and its subsidiaries. Forward-Looking Statements |

|
|
113 LTAC Hospitals 1,023 Outpatient Rehab Clinics Founded – 1996 129 specialty hospitals, 1,023 outpatient clinics, operations in 44 states plus D.C. $3.0 Billion Net Revenue LTM Q3 2014 $371 Million Adjusted EBITDA LTM Q3 2014(1) 31,600 Employees 16 Inpatient Rehab Hospitals 471 Contract Therapy Note: Statistics as of September 30, 2014 (1) See Slide 28 for non-GAAP reconciliation Select Medical Overview Specialty Hospitals Segment Outpatient Rehabilitation Segment |

|
|
Strategy Be the “preferred” provider of post acute services in our markets Structured partnerships Hospital in hospital model Outpatient critical mass |
|
|
2013 Highlights LTAC Hospitals patient criteria legislation Rehab Joint Ventures OhioHealth Scottsdale Health San Antonio UCLA/Cedar Sinai (executed) LTACH Joint Venture Emory Health System (executed) |
|
|
2014 Highlights Pricing/Amendment to Term Loans completed March 4, 2014 $110.0M Sr. Note add-on priced @ 101.5 on March 11, 2014 Share Repurchases 10 million shares @ $10.95/share on March 13, 2014 1.3 million shares @ $14.00/share on May 21, 2014 Dividend Payments $.10/share on March 10, 2014 $.10/share on May 28, 2014 $.10/share on August 29, 2014 $.10/share declared and to be paid December 1, 2014 Rehab Joint Ventures Cleveland Clinic Emory Health Systems Tri Health Pinnacle Health |
|
|
Specialty Hospitals Long Term Acute Care |

|
|
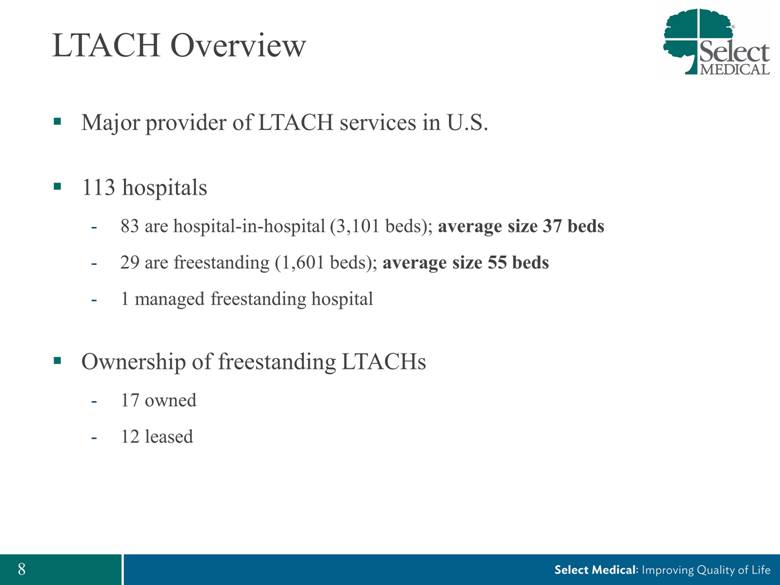
LTACH Overview Major provider of LTACH services in U.S. 113 hospitals 83 are hospital-in-hospital (3,101 beds); average size 37 beds 29 are freestanding (1,601 beds); average size 55 beds 1 managed freestanding hospital Ownership of freestanding LTACHs 17 owned 12 leased |
|
|
LTACH Legislation Passed in late December 2013 as part of Budget bill and SGR Bill provides Full LTACH DRG rates for patients 3 day prior short term hospital ICU stay or Ventilation patients for > 96 hours in the LTACH Other patients receive “site neutral” rate which is lesser IPPS per diem (capped at the IPPS DRG amount plus outlier payment) or 100% cost |

|
|
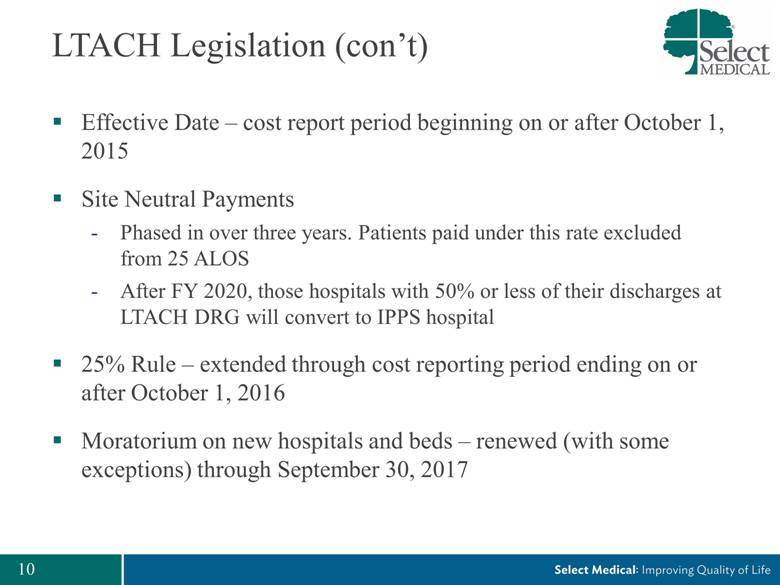
LTACH Legislation (con’t) Effective Date – cost report period beginning on or after October 1, 2015 Site Neutral Payments Phased in over three years. Patients paid under this rate excluded from 25 ALOS After FY 2020, those hospitals with 50% or less of their discharges at LTACH DRG will convert to IPPS hospital 25% Rule – extended through cost reporting period ending on or after October 1, 2016 Moratorium on new hospitals and beds – renewed (with some exceptions) through September 30, 2017 |
|
|
LTACH Legislation – Select Impact Positives: Degree of segment certainty with phase-in 25% Rule extension Select high CMI HiH Strategy Neutral: Moratorium Negatives: Loss of some volume Reduced rates for IPPS patients |

|
|
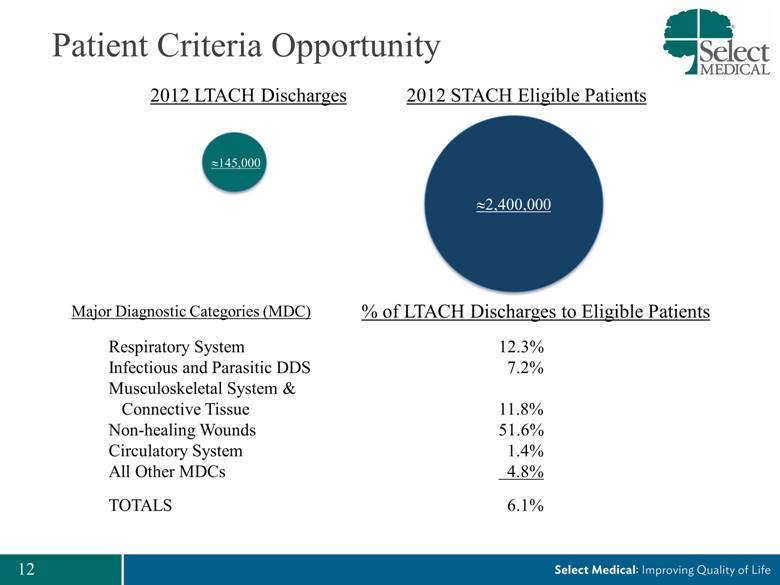
Patient Criteria Opportunity 2012 LTACH Discharges 2012 STACH Eligible Patients Major Diagnostic Categories (MDC) % of LTACH Discharges to Eligible Patients 2,400,000 145,000 Respiratory System 12.3% Infectious and Parasitic DDS 7.2% Musculoskeletal System & Connective Tissue 11.8% Non-healing Wounds 51.6% Circulatory System 1.4% All Other MDCs 4.8% TOTALS 6.1% 145,000 |
|
|
Specialty Hospitals Inpatient Rehabilitation |
|
|
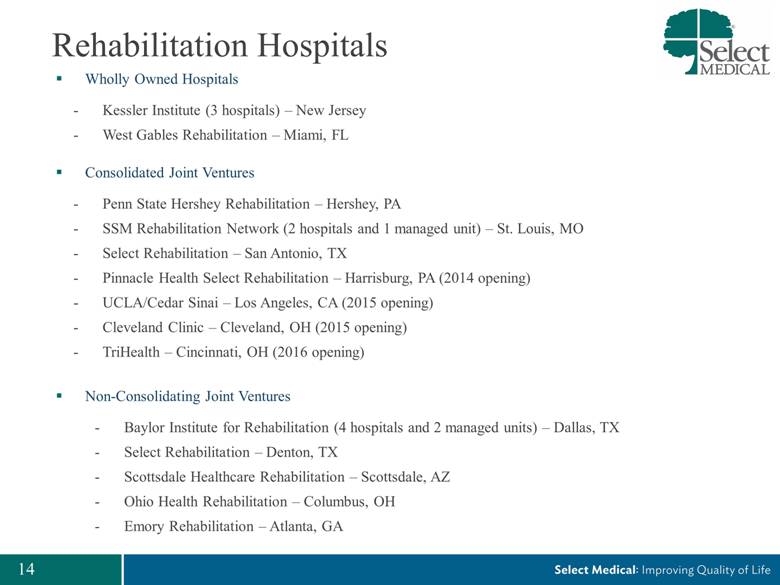
Wholly Owned Hospitals Kessler Institute (3 hospitals) – New Jersey West Gables Rehabilitation – Miami, FL Consolidated Joint Ventures Penn State Hershey Rehabilitation – Hershey, PA SSM Rehabilitation Network (2 hospitals and 1 managed unit) – St. Louis, MO Select Rehabilitation – San Antonio, TX Pinnacle Health Select Rehabilitation – Harrisburg, PA (2014 opening) UCLA/Cedar Sinai – Los Angeles, CA (2015 opening) Cleveland Clinic – Cleveland, OH (2015 opening) TriHealth – Cincinnati, OH (2016 opening) Non-Consolidating Joint Ventures Baylor Institute for Rehabilitation (4 hospitals and 2 managed units) – Dallas, TX Select Rehabilitation – Denton, TX Scottsdale Healthcare Rehabilitation – Scottsdale, AZ Ohio Health Rehabilitation – Columbus, OH Emory Rehabilitation – Atlanta, GA Rehabilitation Hospitals |
|
|
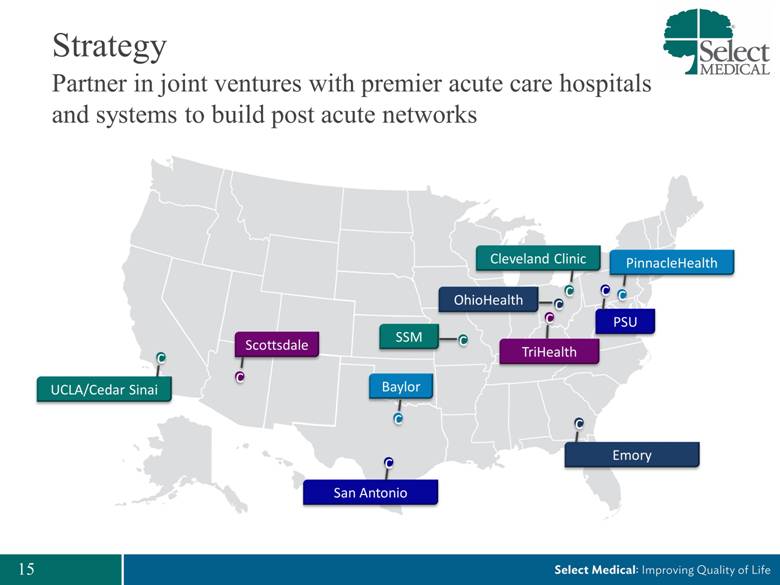
Strategy Partner in joint ventures with premier acute care hospitals and systems to build post acute networks c Scottsdale c UCLA/Cedar Sinai San Antonio Emory Baylor OhioHealth PSU SSM c c c c c TriHealth c PinnacleHealth c c Cleveland Clinic c |
|
|
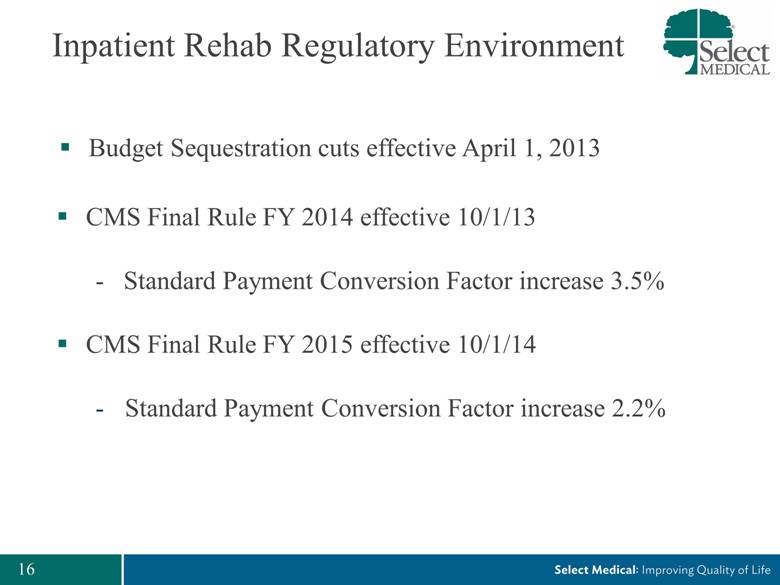
Inpatient Rehab Regulatory Environment CMS Final Rule FY 2014 effective 10/1/13 - Standard Payment Conversion Factor increase 3.5% CMS Final Rule FY 2015 effective 10/1/14 Standard Payment Conversion Factor increase 2.2% Budget Sequestration cuts effective April 1, 2013 |
|
|
Outpatient Rehabilitation Outpatient Rehab Clinics |
|
|
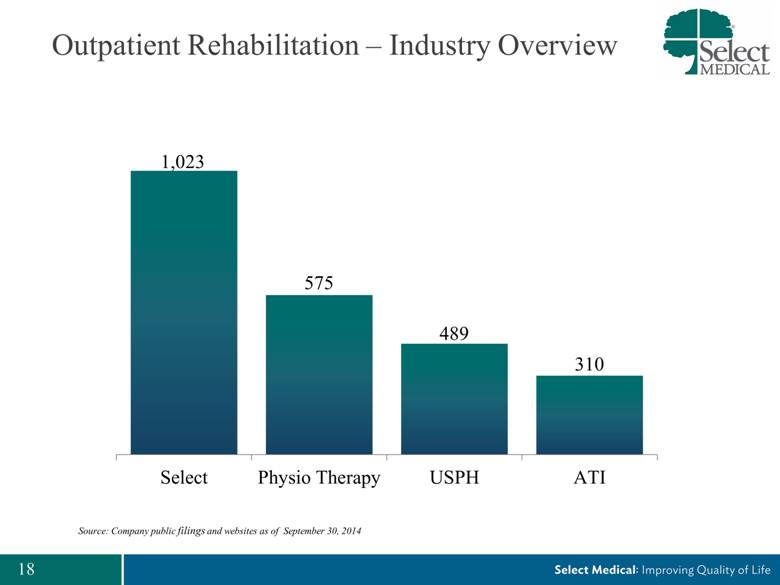
Outpatient Rehabilitation – Industry Overview Source: Company public filings and websites as of September 30, 2014 |
|
|
2014 Outpatient Initiatives Continued growth in workers’ comp business by illustrating historical ROI benefits of working with Select Payors Employers Expand hand therapy services to more clinics Expand concussion management program Continued development of start-up clinics |
|
|
Outpatient Rehab Regulatory Environment Commercial - Stable Medicare MPPR changes to therapy payments (effective April 2013) 25% reductions increased to 50% reductions to practice expense component for 2nd and subsequent codes |
|
|
Strategic Priorities Use of capital – opportunisticAcquisitions Dividends Special dividend $1.50/share @ 12/2012 Dividend payments totaling $.30/share in 2013 Dividend payments (paid and declared) totaling $.40/share in 2014 Stock buyback – $129.5M in 2011-13 (avg. price $7.75) – $127.5M in 2014 (10M, 1.3M share blocks) - Debt repayment – net leverage of 4.1x @ 9/30/14 |
|
|
Financial Overview |
|
|
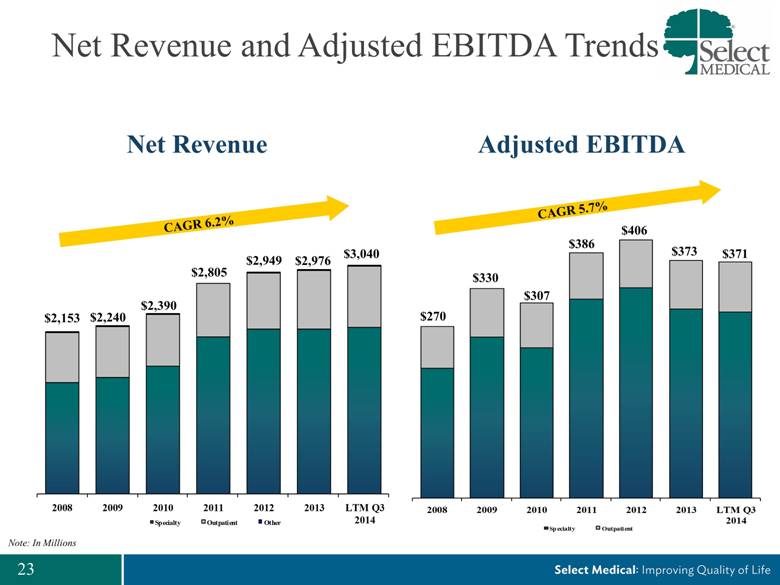
$2,390 $2,240 Note: In Millions CAGR 6.2% CAGR 5.7% $307 $330 Net Revenue Adjusted EBITDA $2,805 $386 Net Revenue and Adjusted EBITDA Trends $2,949 $406 $2,976 $373 $3,040 $371 $2,153 $270 2008 2009 2010 2011 2012 2013 LTM Q3 2014 Specialty Outpatient Other 2008 2009 2010 2011 2012 2013 LTM Q3 2014 Specialty Outpatient |
|
|
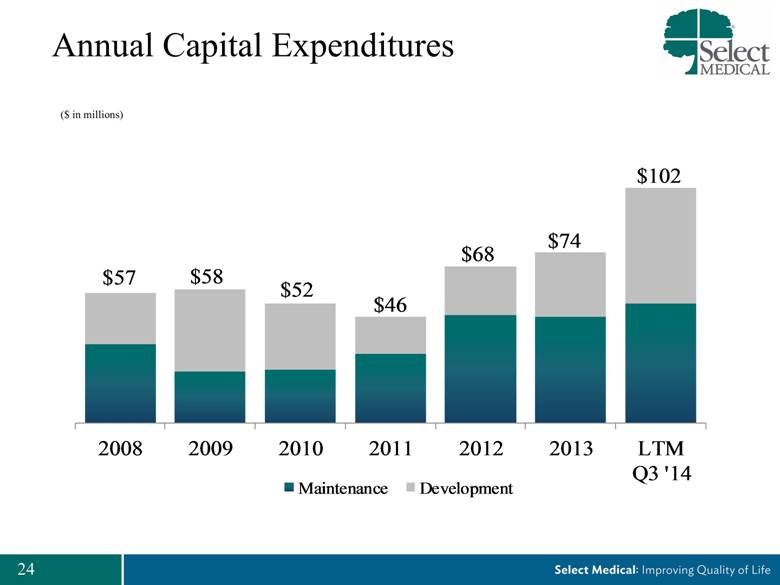
Annual Capital Expenditures ($ in millions) 2008 2009 2010 2011 2012 2013 LTM Q3 '14 Maintenance Development $52 $46 $58 $68 $74 $57 $102 |
|
|
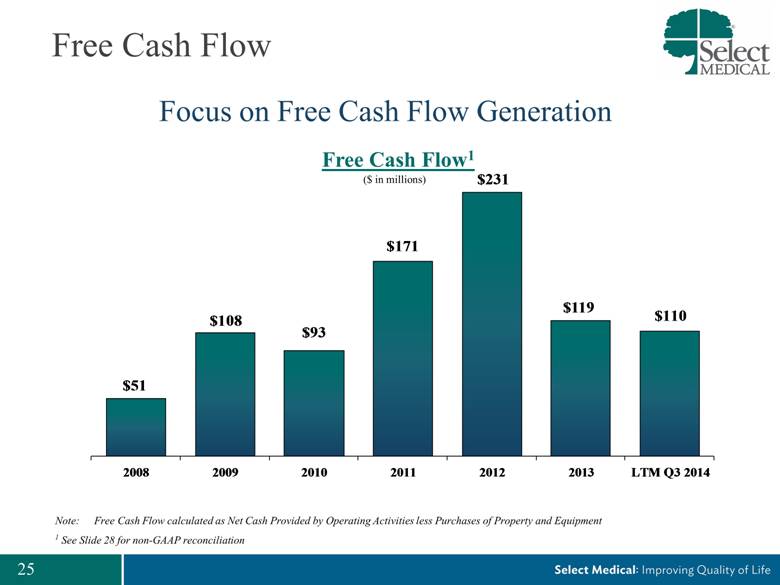
Free Cash Flow Free Cash Flow1 ($ in millions) Note: Free Cash Flow calculated as Net Cash Provided by Operating Activities less Purchases of Property and Equipment 1 See Slide 28 for non-GAAP reconciliation Focus on Free Cash Flow Generation $51 $108 $171 $231 $119 $93 2008 2009 2010 2011 2012 2013 LTM Q3 2014 $110 |
|
|
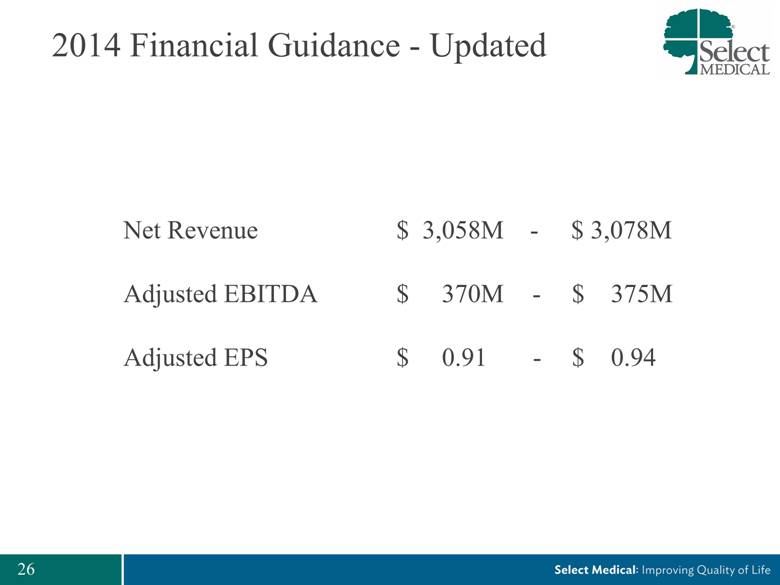
2014 Financial Guidance - Updated Net Revenue $ 3,058M - $ 3,078M Adjusted EBITDA $ 370M - $ 375M Adjusted EPS $ 0.91 - $ 0.94 |
|
|
Appendix: Additional Materials |
|
|
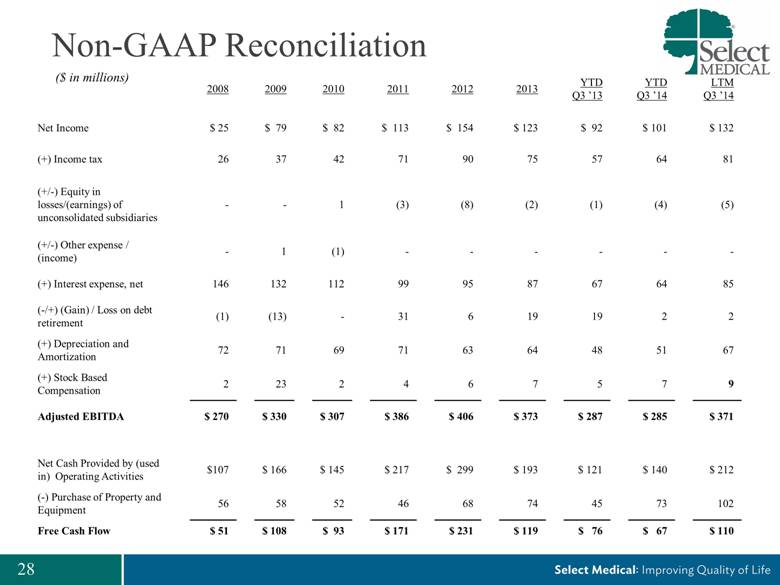
Non-GAAP Reconciliation 2008 2009 2010 2011 2012 2013 YTD Q3 ’13 YTD Q3 ’14 LTM Q3 ’14 Net Income $ 25 $ 79 $ 82 $ 113 $ 154 $ 123 $ 92 $ 101 $ 132 (+) Income tax 26 37 42 71 90 75 57 64 81 (+/-) Equity in losses/(earnings) of unconsolidated subsidiaries - - 1 (3) (8) (2) (1) (4) (5) (+/-) Other expense / (income) - 1 (1) - - - - - - (+) Interest expense, net 146 132 112 99 95 87 67 64 85 (-/+) (Gain) / Loss on debt retirement (1) (13) - 31 6 19 19 2 2 (+) Depreciation and Amortization 72 71 69 71 63 64 48 51 67 (+) Stock Based Compensation 2 23 2 4 6 7 5 7 9 Adjusted EBITDA $ 270 $ 330 $ 307 $ 386 $ 406 $ 373 $ 287 $ 285 $ 371 Net Cash Provided by (used in) Operating Activities $107 $ 166 $ 145 $ 217 $ 299 $ 193 $ 121 $ 140 $ 212 (-) Purchase of Property and Equipment 56 58 52 46 68 74 45 73 102 Free Cash Flow $ 51 $ 108 $ 93 $ 171 $ 231 $ 119 $ 76 $ 67 $ 110 ($ in millions) |
|
|
[LOGO] |
