Attached files
| file | filename |
|---|---|
| 8-K - 8-K - Research Solutions, Inc. | v395202_8k.htm |
Exhibit 99.1
On - Demand Access to Scientific, Technical, and Medical Information Corporate Presentation December 2014 OTCQB: RSSS

OTCQB:RSSS IMPORTANT CAUTIONS REGARDING FORWARD LOOKING STATEMENTS This presentation contains forward - looking statements that relate to future activities, events or developments. All statements, other than statements of fact, that address activities, events or developments that the company or its management expect, project, believe or anticipate will or may occur in the future, or that relate to historical periods that will be reported in future filings with the Securities and Exchange Commission, are forward - looking statements. Forward - looking statements are made based on management’s assumptions and assessments in light of past experience and trends, current conditions, expected future developments and other relevant factors. Forward - looking statements are not guarantees of performance, and actual results, developments and business decisions may differ from those envisaged by these forward - looking statements. These forward - looking statements are also subject to risks and uncertainties which can affect the company’s performance in both the near - and long - term. The company identifies many of these risks and uncertainties that could affect its performance in its SEC filings, including its most recent reports on Form 10 - K and Form 10 - Q, particularly under the heading "Risk Factors." Copies of these filings are available online from the SEC or at the company’s website. The company undertakes no duty to update any statement in light of new information or future events, or for any other reason. © 2014 Research Solutions, Inc. – All Rights Reserved 2

OTCQB:RSSS Revenue Transitio n: Print to Digital 1 Key Stats (OTCQB: RSSS) 3 Stock Price (11/25/14) $0.77 52 Week Low - High $2.45 - $0.51 Avg. Daily Vol. (3 mo.) 5,257 Shares Outstanding 18.0M Float (est.) 7.9M Insider Holdings ~54% Institutional Holdings ~37% Market Cap $13.8M Enterprise Value $13.0M Date Founded 2006 Employee Count 92 Data sources: Yahoo! Finance, S&P Capital IQ, company estimates (ttm) = trailing twelve months as of Sept. 30, 2014 (mrq) = most recent quarter as of Sept. 30, 2014 1) Excludes discontinued operations. Total Revenue (ttm) ¹ $29.4M Net Income (ttm) ¹ $(1.0)M EPS (ttm) ¹ $(0.06) EV/Revenue 0.4x Cash & Equiv. (mrq) $1.5M Total Assets (mrq) $6.5M Total Debt (mrq) $0.0M Total Liabilities (mrq) $5.7M Total Equity $0.8M 6.2 9.8 11.7 15.1 16.8 18.7 19.4 8.5 15.2 18.0 16.0 18.4 9.8 10.0 FY09 FY10 FY11 FY12 FY13 FY14 TTM 9/14 Reprints (Print) Article Galaxy (Digital) $ Millions Fiscal year ending June 30
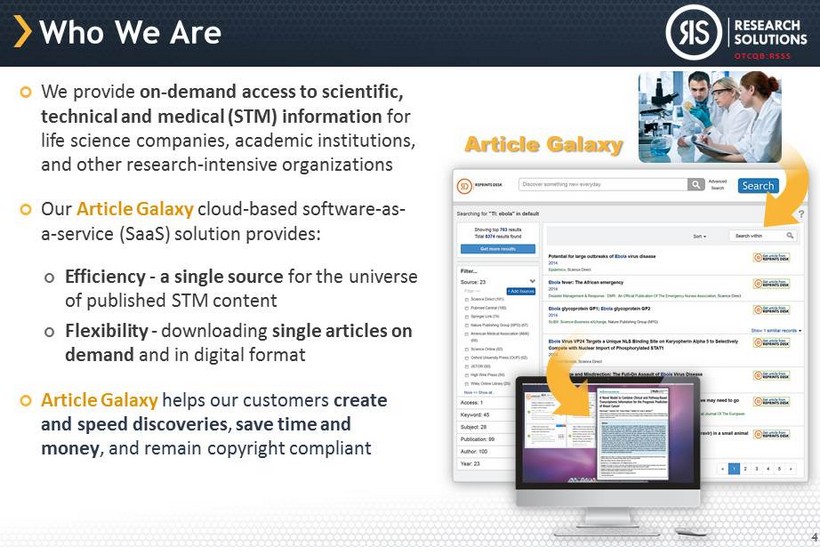
OTCQB:RSSS Who We Are We provide on - demand access to scientific, technical and medical (STM) information for life science companies, academic institutions, and other research - intensive organizations Our Article Galaxy cloud - based software - as - a - service (SaaS) solution provides: Efficiency - a single source for the universe of published STM content Flexibility - downloading single articles on demand and in digital format Article Galaxy helps our customers create and speed discoveries , save time and money , and remain copyright compliant 4 Article Galaxy

OTCQB:RSSS How We’re Different 5 Our 100% focus on Scientific, Technical and Medical (STM) Research distinguishes us from LexisNexis and Bloomberg SCIENTIFIC RESEARCH Articles from Scientific , Technical, and Medical Journals Laws, Legal Cases and Opinions Annual Reports and Financial Market Data FINANCIAL RESEARCH LEGAL RESEARCH

OTCQB:RSSS Our Market Segments Annual Growth 1 Information Industry Segments 1 2013 Revenue (Billions) % Growth 2013 2014 - 16 CAGR Forecast B2B Trade $30.6 3.1% 3.4% Market Research, Reports and Services $41.2 3.6% 3.4% Market Automation, Analytics and CRM $23.4 12.1% 10.9% Marketing Services $113.2 3.0% 3.0% Credit and Financial $52.8 3.8% 5.1% Governance, Risk and Compliance $43.0 5.5% 7.1% Legal and Regulatory $20.4 3.6% 4.4% Education Content, Technology and HCM $111.4 5.4% 4.3% Scientific, Technical and Medical $32.5 3.7% 4.4% Search, Aggregation and Syndication $86.9 17.0% 8.6% Consumer Books and Magazines $82.9 0.9% 0.8% News $78.3 - 5.1% - 5.1% Yellow Pages and Directories $21.7 - 11.7% - 8.0% Total Information Industry $738.3 3.7% 3.4% $63B $74B $87B $30B $31B $33B $94B $105B $119B 2011 2012 2013 We Address two Fast - Growing Segments of the $738 Billion Information Industry 6 The overall Information Industry grew 3.7% to $738 billion in 2013 , accelerating from 3.5 % in 2012 1 Market segments with a greater emphasis on technology and services growing “much faster” 1 Our addressable market of STM Subscription and Syndication Services is a cross - segment of two high - growth market segments totaling $119 billion : Search, Aggregation and Syndication (SAS): $87 billion, growing at 17.0% 1 Science, Technical and Medical (STM): $33 billion, growing at 3.7% 1 1) Market estimates by Outsell , Inc ., Jan. 2014 and Nov. 2014
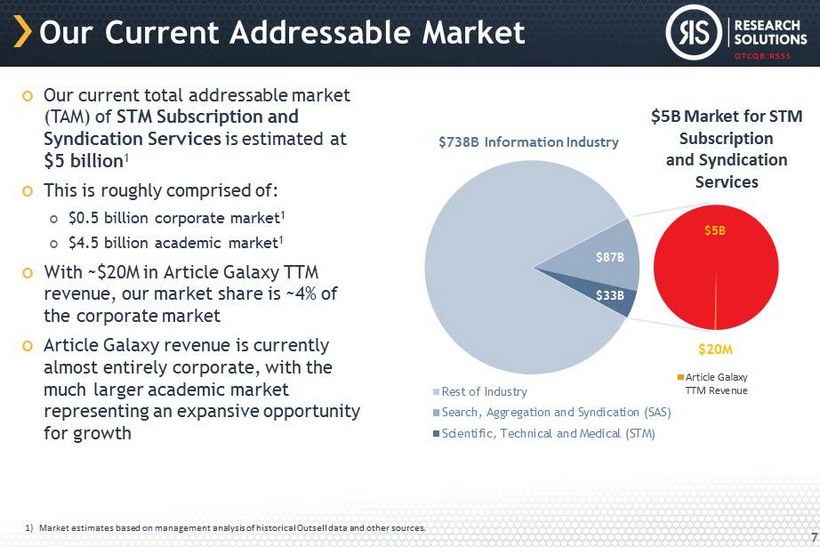
OTCQB:RSSS $87B $33B Rest of Industry Search, Aggregation and Syndication (SAS) Scientific, Technical and Medical (STM) Our Current Addressable Market 7 Our current total addressable market (TAM) of STM Subsc ription and Syndication Services is estimated at $5 billion 1 This is roughly comprised of: $0.5 billion corporate market 1 $4.5 billion academic market 1 With ~$20M in Article Galaxy TTM revenue, our market share is ~4% of the corporate market Article Galaxy revenue is currently almost entirely corporate, with the much larger academic market representing an expansive opportunity for growth $20M $5B Article Galaxy TTM Revenue $5B Market for STM Subscription and Syndication Services $ 738B Information Industry 1) Market estimates based on management analysis of historical Outsell data and other sources.
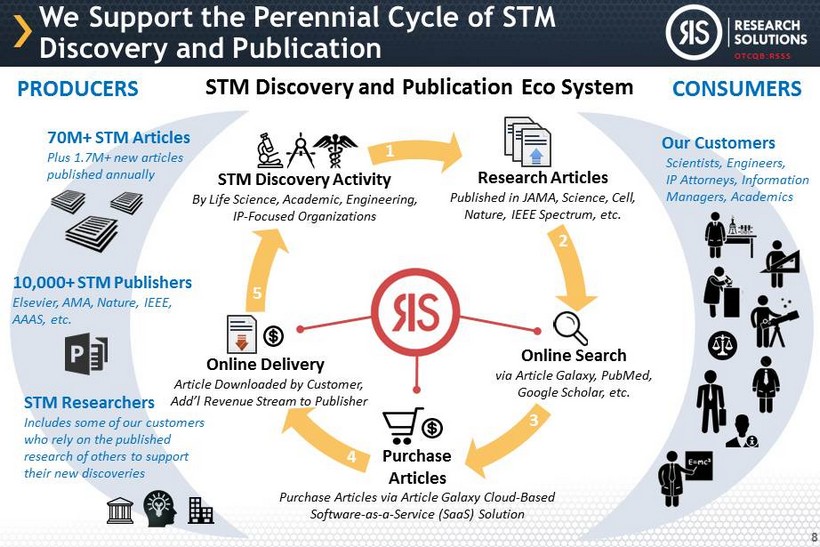
OTCQB:RSSS We Support the Perennial Cycle of STM Discovery and Publication 8 70M + STM Articles Plus 1.7M+ new articles published annually Our Customers Scientists, Engineers, IP Attorneys, Information Managers, Academics STM Discovery and Publication Eco System STM Discovery Activity By Life Science, Academic , Engineering, IP - Focused Organizations Research Articles Published in JAMA , Science, Cell, Nature, IEEE Spectrum, etc. Online Search via Article Galaxy, PubMed, Google Scholar, etc. Purchase Articles Purchase Articles via Article Galaxy Cloud - Based Software - as - a - Service (SaaS) Solution Online Delivery Article Downloaded by Customer, Add’l Revenue Stream to Publisher 10,000 + STM Publishers Elsevier, AMA, Nature, IEEE, AAAS, etc. 5 1 2 3 4 PRODUCERS CONSUMERS STM Researchers Includes some of our customers who rely on the published research of others to support their new discoveries

OTCQB:RSSS Information Industry Revenue by Source 65.8% Print 34.4% 29.9% Electronic 61.7% 4.3% In Person 3.9% 2003 2004 2005 2006 2007 2008 2009 2010 2011 2012 2013 The Industry Transition to Digital Media 9 We are Uniquely Positioned to Benefit from the Continued Transition from Print to Digital Source : Outsell Information Industry Providers Database; Outsell analysis 2012

OTCQB:RSSS Our Revenue Mix 1 Strategic Transformation Underway Research Solutions is Evolving into a More Profitable, Higher Growth, Digital - based Company ▪ Print - Bulk Physcial Reprints ▪ Manual Process, Commoditized ▪ Highly Competitive, Low Margin ▪ Volatile Revenue ▪ Digital – Article Galaxy, Automated Processes ▪ Compelling Value - Add, Unique Features ▪ Higher Growth, Higher Margin ▪ Sticky, Stable, Acts Like Subscription Revenue 0% 20% 40% 60% 80% 100% FY08 FY09 FY10 FY11 FY12 FY13 FY14 Print Digital 10 1) Excludes discontinued operations.
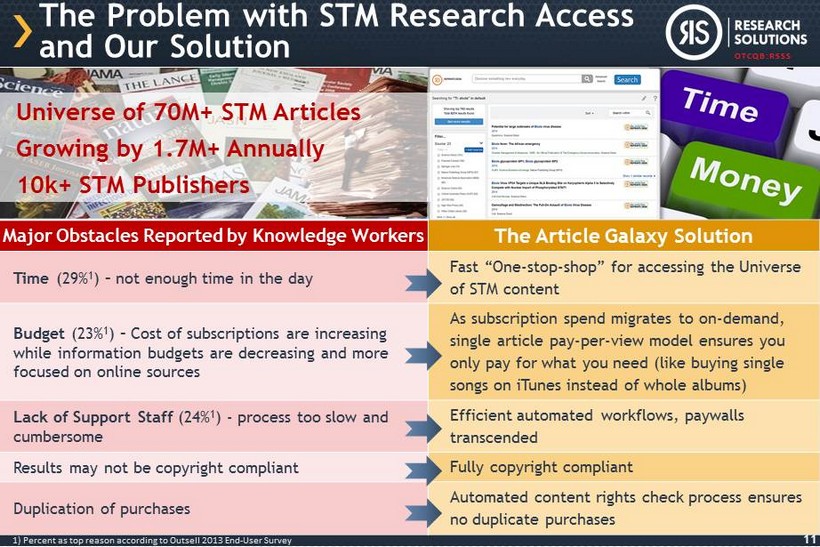
OTCQB:RSSS 1) Percent as top reason according to Outsell 2013 End - User Survey The Problem with STM Research Access and Our Solution Major Obstacles Reported by Knowledge Workers The Article Galaxy Solution Time (29% 1 ) – not enough time in the day Fast “One - stop - shop” for accessing the Universe of STM content Budget (23% 1 ) – Cost of subscriptions are increasing while information budgets are decreasing and more focused on online sources As subscription spend migrates to on - demand, single article pay - per - view model ensures you only pay for what you need (like buying single songs on iTunes instead of whole albums) Lack of Support Staff (24% 1 ) - process too slow and cumbersome Efficient automated workflows, paywalls transcended Results may not be copyright compliant Fully copyright compliant Duplication of purchases Automated content rights check process ensures no duplicate purchases Universe of 70M+ STM Articles Growing by 1.7M+ Annually 10k+ STM Publishers 11

OTCQB:RSSS Web - based, Easy - to - Use SaaS Platform 12 Select it (and see what you already have) Find it ( on our site or others) 1 Buy or Rent it Download it 1) Use the Article Galaxy Widget browser plug - in to select articles on 50+ third - party websites/tools, like PubMed, Google Scholar , Elsevier ScienceDirect, IEEE Xplore, Nature, Informaworld, AMA, SAGE, Lancet, etc.
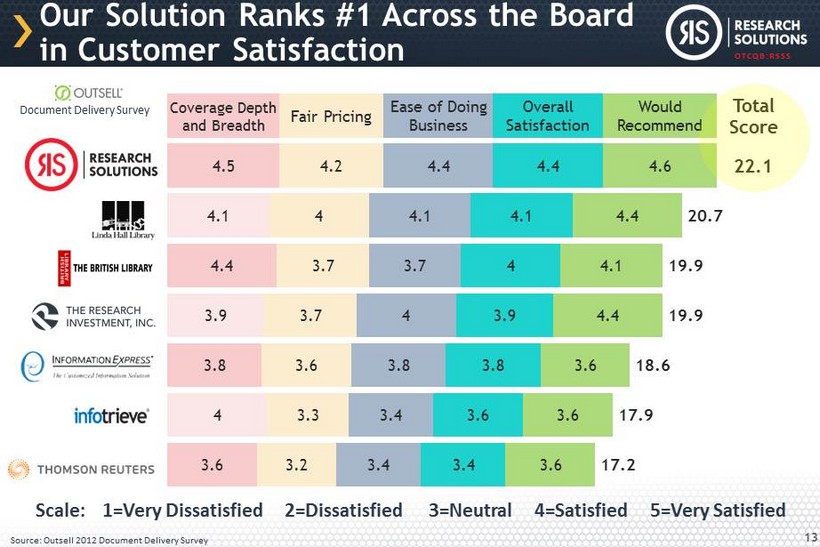
OTCQB:RSSS Our Solution Ranks #1 Across the Board in Customer Satisfaction 13 Source: Outsell 2012 Document Delivery Survey Scale: 1=Very Dissatisfied 2=Dissatisfied 3=Neutral 4=Satisfied 5=Very Satisfied 3.6 4 3.8 3.9 4.4 4.1 4.5 Coverage Depth and Breadth 3.2 3.3 3.6 3.7 3.7 4 4.2 Fair Pricing 3.4 3.4 3.8 4 3.7 4.1 4.4 Ease of Doing Business 3.4 3.6 3.8 3.9 4 4.1 4.4 Overall Satisfaction 3.6 3.6 3.6 4.4 4.1 4.4 4.6 Would Recommend 17.2 17.9 18.6 19.9 19.9 20.7 22.1 Total Score Document Delivery Survey

OTCQB:RSSS Loyal Marquee Customer Base Stable and growing base of Article Galaxy customers; virtually zero top customer churn Client Composition 4 out of 5 of the Top 5 Drug Companies ranked by R&D performance 1 50% of the Global Top 10 Biotech and Pharmaceutical Companies ranked by revenue 2 36% of the Top 50 3 and 50% of the Top 20 2 Global Pharmaceutical Companies ranked by revenue #1 ranking FMCG (fast - moving consumer goods) company worldwide ranked by net sales 2 Article Galaxy revenue concentrations Top customer: ~7% of revenue Top 10 customers: ~25% of revenue Top 35 customers: ~50% of revenue 1) Forbes 2) Statista 3) RankingTheBrands.com 14

OTCQB:RSSS We’re Partnered with Leading, Long - Established STM Publishers 15 Our partners publish the articles we sell, and we help them monetize and protect their content.
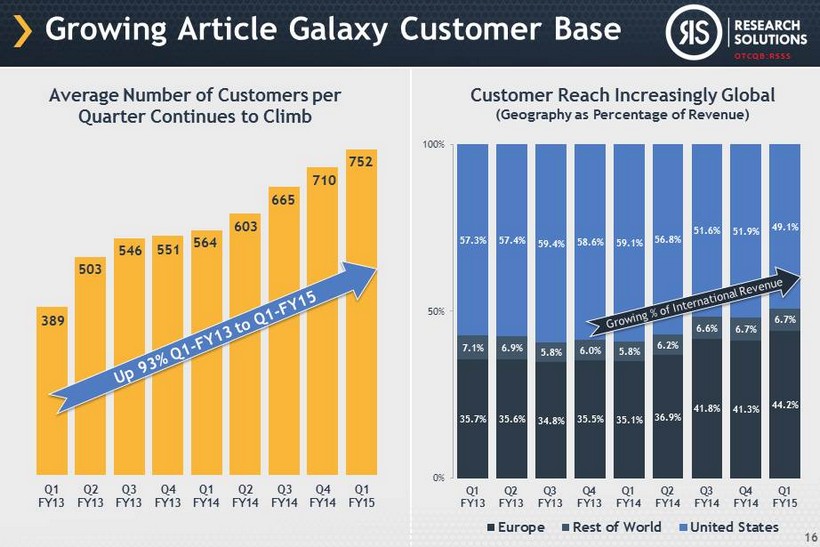
OTCQB:RSSS Growing Article Galaxy Customer Base 16 Average Number of Customers per Quarter Continues to Climb Customer Reach Increasingly Global (Geography as Percentage of Revenue ) 389 503 546 551 564 603 665 710 752 Q1 FY13 Q2 FY13 Q3 FY13 Q4 FY13 Q1 FY14 Q2 FY14 Q3 FY14 Q4 FY14 Q1 FY15 35.7% 35.6% 34.8% 35.5% 35.1% 36.9% 41.8% 41.3% 44.2% 7.1% 6.9% 5.8% 6.0% 5.8% 6.2% 6.6% 6.7% 6.7% 57.3% 57.4% 59.4% 58.6% 59.1% 56.8% 51.6% 51.9% 49.1% 0% 50% 100% Q1 FY13 Q2 FY13 Q3 FY13 Q4 FY13 Q1 FY14 Q2 FY14 Q3 FY14 Q4 FY14 Q1 FY15 Europe Rest of World United States

OTCQB:RSSS “Stable and sticky” revenue from Article Galaxy recurring transactions How it’s sticky: While single article delivery services are charged on a transactional basis, customer order volume tends to be consistent from month - to - month. This is mostly due to consistent orders of larger customers that require the integration of our services into their work flow. A transaction is defined as an order for a unit of copyrighted content fulfilled or managed in Article Galaxy Average revenue per transaction is about $37, with single article delivery services generating substantially all of the revenue attributable to Article Galaxy ARTICLE GALAXY REVENUE MODEL 17 $15.8 $16.3 $16.8 $17.3 $17.7 $18.2 $18.7 $19.3 402K 419K 441K 461K 475K 487K 498K 517K TTM 12/31/12 TTM 3/31/13 TTM 6/30/13 TTM 6/30/13 TTM 12/31/13 TTM 3/31/14 TTM 6/30/14 TTM 9/30/14 Article Galaxy Performance TTM Revenue ($ Millions) TTM Transactions

OTCQB:RSSS Financial Results and Pro Forma Model Excludes Discontinued Operations FY2012 FY2013 FY2014 TTM 9/30/2014 Pro Forma Article Galaxy Revenue Doubles Revenue Article Galaxy/Digital 15,104,395 16,779,889 18,673,515 19,429,511 38,859,022 Reprints/Print 15,969,589 18,418,038 9,809,660 9,989,630 9,989,630 Total Revenue 31,073,984 35,197,927 28,483,175 29,419,141 48,848,652 Gross Profit Article Galaxy/Digital 3,590,308 3,885,224 4,504,887 4,781,864 10,563,728 % of Revenue 23.77% 23.15% 24.12% 24.61% 27.18% Reprints/Print (193,786) 1,504,449 948,625 973,750 973,750 % of Revenue - 1.21% 8.17% 9.67% 9.75% 9.75% Total Gross Profit 3,396,522 5,389,673 5,453,512 5,755,614 11,537,478 % of Revenue 10.93% 15.31% 19.15% 19.56% 23.62% Operating Expenses 6,999,214 5,361,260 6,492,166 6,692,858 7,138,409 % of Revenue 22.52% 15.23% 22.79% 22.75% 14.61% Income from Operations (3,602,692) 28,413 (1,038,654) (937,244) 4,399,069 % of Revenue - 11.59% 0.08% - 3.65% - 3.19% 9.01% Other Income (Expense) 59,533 (98,653) (45,478) (56,774) (56,774) Net Income (Loss) (3,543,159) (70,240) (1,084,132) (994,018) 4,342,295 % of Revenue - 11.40% - 0.20% - 3.81% - 3.38% 8.89% Net Income (Loss) Per Share $ (0.21) $ (0.00) $ (0.06) $ (0.06) $ 0.25 Reconciliation of Net Income to Adjusted EBITDA Net Income (Loss) (3,543,159) (70,240) (1,084,132) (994,018) 4,342,295 Add (Deduct): Other Income (Expense) (59,533) 98,653 45,478 56,774 56,774 Depreciation and Amortization 433,205 262,836 219,934 244,471 244,471 Stock - based Compensation 203,540 386,563 355,220 369,825 369,825 Gain (Loss) on Sale of Equipment 315 (20,980) - - - Loss on Sublease - 233,015 - - - Impairment Charges 911,523 - - - - Adjusted EBITDA (2,054,109) 889,847 (463,500) (322,948) 5,013,365 % of Revenue - 6.61% 2.53% - 1.63% - 1.10% 10.26% 18 Our highly - scalable platform means limited increases in operating expenses as our topline grows. We could achieve a 5x increase in adjusted EBITDA with only a 2x increase in Article Galaxy revenue. Leverage in Model: 2x Article Galaxy Revenue = 5x Adjusted EBITDA

OTCQB:RSSS Growth Drivers Continued migration from subscriptions to on - demand content from current customers Further penetrate current corporate customer focus – convert customers from competitors Expansion to the largely untapped academic market Opportunistic rollups/acquisitions Article Galaxy platform sales beginning – high margin annual subscription revenue 19 Largely untapped academic market for STM Subscription and Syndication Services represents a $ 4.5B opportunity
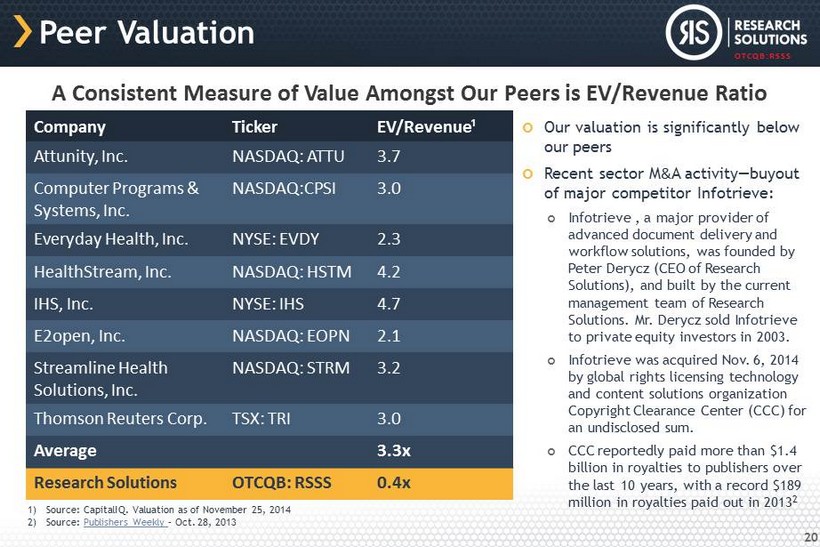
OTCQB:RSSS Peer Valuation Our valuation is significantly below our peers Recent sector M & A activity — buyout of major competitor Infotrieve: Infotrieve , a major provider of advanced document delivery and workflow solutions, was founded by Peter Derycz (CEO of Research Solutions), and built by the current management team of Research Solutions. Mr. Derycz sold Infotrieve to private equity investors in 2003. Infotrieve was acquired Nov. 6, 2014 by global rights licensing technology and content solutions organization Copyright Clearance Center (CCC) for an undisclosed sum. CCC reportedly paid more than $1.4 billion in royalties to publishers over the last 10 years, with a record $189 million in royalties paid out in 2013 2 Company Ticker EV/Revenue¹ Attunity, Inc. NASDAQ: ATTU 3.7 Computer Programs & Systems, Inc. NASDAQ:CPSI 3.0 Everyday Health, Inc. NYSE: EVDY 2.3 HealthStream, Inc. NASDAQ: HSTM 4.2 IHS, Inc. NYSE: IHS 4.7 E2open, Inc. NASDAQ: EOPN 2.1 Streamline Health Solutions, Inc. NASDAQ: STRM 3.2 Thomson Reuters Corp. TSX: TRI 3.0 Average 3.3x Research Solutions OTCQB: RSSS 0.4x 1) Source: CapitalIQ. Valuation as of November 25, 2014 2) Source: Publishers Weekly – Oct. 28, 2013 A Consistent M easure of Value A mongst Our Peers is EV/Revenue Ratio 20
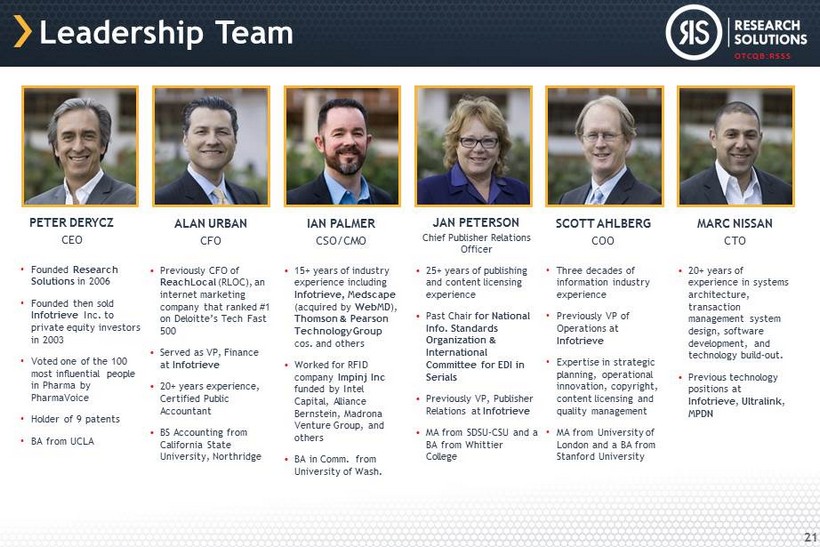
OTCQB:RSSS PETER DERYCZ CEO • Founded Research Solutions in 2006 • Founded then sold Infotrieve Inc. to private equity investors in 2003 • Voted one of the 100 most influential people in Pharma by PharmaVoice • Holder of 9 patents • BA from UCLA ALAN URBAN CFO • Previously CFO of ReachLocal (RLOC), an internet marketing company that ranked #1 on Deloitte’s Tech Fast 500 • Served as VP, Finance at Infotrieve • 20+ years experience, Certified Public Accountant • BS Accounting from California State University, Northridge IAN PALMER CSO/CMO • 15+ years of industry experience including Infotrieve, Medscape (acquired by WebMD ), Thomson & Pearson Technology Group cos. and others • Worked for RFID company Impinj Inc funded by Intel Capital, Alliance Bernstein, Madrona Venture Group, and others • BA in Comm. from University of Wash. JAN PETERSON Chief Publisher Relations Officer • 25+ years of publishing and content licensing experience • Past Chair for National Info. Standards Organization & International Committee for EDI in Serials • Previously VP, Publisher Relations at Infotrieve • MA from SDSU - CSU and a BA from Whittier College SCOTT AHLBERG COO • Three decades of information industry experience • Previously VP of Operations at Infotrieve • Expertise in strategic planning, operational innovation, copyright, content licensing and quality management • MA from University of London and a BA from Stanford University MARC NISSAN CTO • 20+ years of experience in systems architecture, transaction management system design, software development, and technology build - out. • Previous technology positions at Infotrieve , Ultralink , MPDN Leadership Team 21

OTCQB:RSSS Revenue Transitio n: Print to Digital 1 6.2 9.8 11.7 15.1 16.8 18.7 19.4 FY09 FY10 FY11 FY12 FY13 FY14 TTM 9/14 Reprints (Print) Article Galaxy (Digital) $ Millions Key Takeaways Unmet demand with growing spend on digital content Recurring transactional revenue model Minimal competition and high barrier to entry Existing high value customer, publisher and technology assets to leverage Proven management team, uniquely positioned to execute Leverage in financial model 22 Fiscal year ending June 30 1) Excludes discontinued operations. Customers Publishers
OTCQB:RSSS 23 Contact Us Peter Derycz, Chairman & CEO Alan Urban, CFO Research Solutions, Inc. 5435 Balboa Blvd., Suite 202 Encino, California 91316 For more information, please visit: www.researchsolutions.com Investor Relations Contact: Chris Tyson Managing Director Liolios Group 949 - 574 - 3860 RSSS@liolios.com 23

Appendix 24

OTCQB:RSSS 25 2012 Article Galaxy Digital Journal Article platform launched Evolution of Research Solutions: From Print to Digital 2013 Discontinuation of domestic commercial printer 2006 Reprints Desk founded by Peter Derycz to provide bulk paper reprints to pharma/biotech companies 2012 Outsell ranks Reprints Desk #1 2006 Derycz Scientific formed, absorbs Reprints Desk and raises $4.5M in private placement 2014 Discontinuation of European commercial printer 2007 Single article delivery service launched 2011 Derycz Scientific raises $3M in private placement 2011 Acquisition of European commercial printer to support bulk paper reprints 2012 Monterey, Mexico back office fully operational 2007 Acquisition of domestic commercial printer to support bulk paper reprints 2013 Derycz Scientific changes name to Research Solutions symbol RSSS 2014 Engage Liolios Group to lead IR program 2014 2012 2006 2007 2009 2011 2013 2009 Derycz Scientific lists on OTC symbol DYSC 2013 Reprints Desk named to eContent ‘s top 100 companies in the digital content industry Transition from Print to Digital 25

OTCQB:RSSS 1) 400,000 warrants with a weighted average exercise price of $2.08 expiring on 12/21/2014 Capitalization Table SECURITY AS OF NOVEMBER 30, 2014 WEIGHTED AVERAGE EXERCISE PRICE PERCENTAGE FULLY DILUTED Common Stock Outstanding 17,971,302 N/A 87.1% Stock Options 1,954,501 $1.25 9.5% Warrants 1 705,000 $1.73 3.4% Fully Diluted Shares Outstanding 20,630,803 100.0% INSIDER SHAREHOLDERS AS OF NOVEMBER 30, 2014 SECURITY PERCENTAGE OF COMMON STOCK OUTSTANDING Bristol Investment Fund, Ltd. 2 4,783,910 Common Stock 26.6% Peter Derycz, CEO 4,143,627 Common Stock 23.1% Other Management and Employees 843,220 Common Stock 4.7% Total Insider Holdings 9,770,757 54.4% 2) Paul Kessler exercises investment and voting control over the shares held by Bristol Investment Fund, Ltd. Mr. Kessler is a Director and the brother - in - law of Peter Derycz. 26

OTCQB:RSSS What Our Customers Are Saying… 27