Attached files
| file | filename |
|---|---|
| 8-K - NEW JERSEY RESOURCES CORP | c79359_8k.htm |
| EX-99.1 - NEW JERSEY RESOURCES CORP | c79359_ex99-1.htm |
FISCAL 2014 FOURTH QUARTER AND YEAR END UPDATE November 25, 2014

Regarding Forward - Looking Statements 1 Certain statements contained in this presentation are forward - looking statements within the meaning of the Private Securities Litigation Reform Act of 1995 . New Jersey Resources (NJR or the Company) cautions readers that the assumptions forming the basis for forward - looking statements include many factors that are beyond NJR’s ability to control or estimate precisely, such as estimates of future market conditions and the behavior of other market participants . Words such as “anticipates,” “estimates,” “expects,” “projects,” “may,” “will,” “intends,” “plans,” “believes,” “should” and similar expressions may identify forward - looking information and such forward - looking statements are made based upon management’s current expectations and beliefs as of this date concerning future developments and their potential effect upon NJR . There can be no assurance that future developments will be in accordance with management’s expectations or that the effect of future developments on NJR will be those anticipated by management . Forward - looking information in this presentation includes, but is not limited to, certain statements regarding NJR's NFE guidance for fiscal 2015 , forecasted contribution of business segments to fiscal 2015 NFE and to NFE beyond fiscal 2015 , long - term benefits of increased NFE, forecasted dividend growth and payout ratio, future NJNG customer growth, expected contribution by new customers of NJNG to utility gross margin, future capital expenditures and infrastructure investments, NJNG incremental utility gross margin growth, the long - term outlook for NJRCEV, diversification of NJRCEV’s strategy, SREC prices and inventory levels, NJRCEV’s future solar and wind projects, and the PennEast Pipeline project . The factors that could cause actual results to differ materially from NJR’s expectations include, but are not limited to, weather and economic conditions ; demographic changes in the NJNG service territory and their effect on NJNG's customer growth ; volatility of natural gas and other commodity prices and their impact on NJNG customer usage, NJNG's Basic Gas Supply Service incentive programs, NJRES' operations and on the Company's risk management efforts ; changes in rating agency requirements and/or credit ratings and their effect on availability and cost of capital to the Company ; the impact of volatility in the credit markets ; the ability to comply with debt covenants ; the impact to the asset values and resulting higher costs and funding obligations of NJR's pension and post employment benefit plans as a result of downturns in the financial markets, a lower discount rate, and impacts associated with the Patient Protection and Affordable Care Act ; accounting effects and other risks associated with hedging activities and use of derivatives contracts ; commercial and wholesale credit risks, including the availability of creditworthy customers and counterparties and liquidity in the wholesale energy trading market ; regulatory approval of NJNG’s planned infrastructure programs ; the ability to obtain governmental and regulatory approvals, land - use rights, electric grid interconnection (in the case of distributed power projects) and/or financing for the construction, development and operation of NJR’s energy investments and NJNG’s infrastructure projects in a timely manner ; risks associated with the management of the Company's joint ventures and partnerships ; risks associated with our investments in distributed power projects, including the availability of regulatory and tax incentives, the availability of viable projects and NJR's eligibility for ITCs and PTCs, the future market for SRECs (including the pace of solar project development in New Jersey), and operational risks related to projects in service ; timing of qualifying for ITCs and PTCs due to delays or failures to complete planned solar and wind energy projects and the resulting effect on our effective tax rate and earnings ; the level and rate at which NJNG's costs and expenses are incurred and the extent to which they are allowed to be recovered from customers through the regulatory process ; access to adequate supplies of natural gas and dependence on third - party storage and transportation facilities for natural gas supply ; operating risks incidental to handling, storing, transporting and providing customers with natural gas ; risks related to our employee workforce ; the regulatory and pricing policies of federal and state regulatory agencies ; the costs of compliance with present and future environmental laws, including potential climate change - related legislation ; risks related to changes in accounting standards ; the disallowance of recovery of environmental - related expenditures and other regulatory changes ; environmental - related and other litigation and other uncertainties ; risks related to cyber - attack or failure of information technology systems ; and the impact of natural disasters, terrorist activities, and other extreme events on our operations and customers, including any impacts to utility gross margin, and restoration costs resulting from Superstorm Sandy . The aforementioned factors are detailed in the “Risk Factors” sections of our Annual Report on Form 10 - K to be filed on November 25 , 2014 , as filed with the Securities and Exchange Commission (SEC), which is available on the SEC’s website at sec . gov . Information included in this presentation is representative as of today only and while NJR periodically reassesses material trends and uncertainties affecting NJR's results of operations and financial condition in connection with its preparation of management's discussion and analysis of results of operations and financial condition contained in its Quarterly and Annual Reports filed with the SEC, NJR does not, by including this statement, assume any obligation to review or revise any particular forward - looking statement referenced herein in light of future events .
Disclaimer Regarding Non - GAAP Financial Measures 2 This presentation includes the non - GAAP measures net financial earnings (NFE), utility gross margin and financial margin . As indicators of the Company’s operating performance, these measures should not be considered alternatives to, or more meaningful than, GAAP measures, such as cash flow, net income, operating income or earnings per share . NFE (loss) and financial margin exclude unrealized gains or losses on derivative instruments related to the company’s unregulated subsidiaries and certain realized gains and losses on derivative instruments related to natural gas that has been placed into storage at NJRES . Volatility associated with the change in value of these financial and physical commodity contracts is reported in the income statement in the current period . In order to manage its business, NJR views its results without the impacts of the unrealized gains and losses, and certain realized gains and losses, caused by changes in value of these financial instruments and physical commodity contracts prior to the completion of the planned transaction because it shows changes in value currently as opposed to when the planned transaction ultimately is settled . An annual estimated effective tax rate is calculated for NFE purposes and any necessary quarterly tax adjustment is applied to NJRCEV, as such adjustment is related to tax credits generated by NJRCEV . NJNG’s utility gross margin represents the results of revenues less natural gas costs, sales and other taxes and regulatory rider expenses, which are key components of the company’s operations that move in relation to each other . Natural gas costs, sales and other taxes and regulatory rider expenses are passed through to customers and, therefore, have no effect on gross margin . Management uses NFE, utility gross margin and financial margin as supplemental measures to other GAAP results to provide a more complete understanding of the Company’s performance . Management believes these non - GAAP measures are more reflective of the Company’s business model, provide transparency to investors and enable period - to - period comparability of financial performance . For a full discussion of our non - GAAP financial measures, please see NJR’s most recent Form 10 - K, Item 7 and most recent Form 10 - Q, Item 2 . This information has been provided pursuant to the requirements of SEC Regulation G .
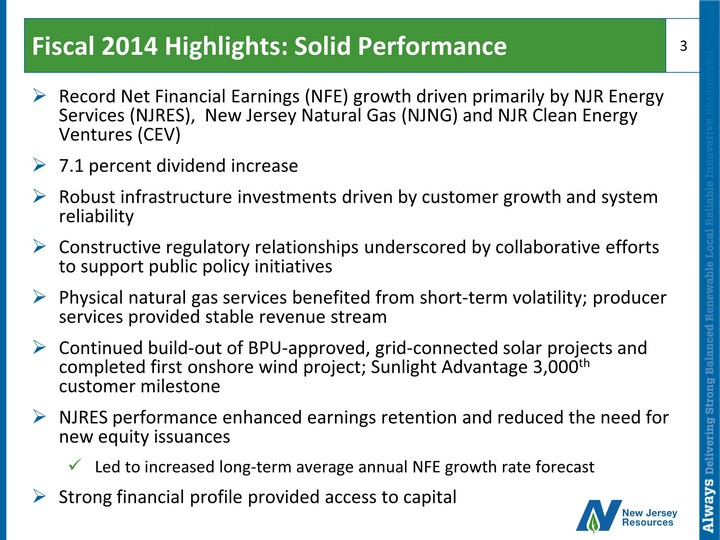
Fiscal 2014 Highlights: Solid Performance » Record Net Financial Earnings (NFE) growth driven primarily by NJR Energy Services (NJRES), New Jersey Natural Gas (NJNG) and NJR Clean Energy Ventures (CEV) » 7.1 percent dividend increase » Robust infrastructure investments driven by customer growth and system reliability » Constructive regulatory relationships underscored by collaborative efforts to support public policy initiatives » Physical natural gas services benefited from short - term volatility; producer services provided stable revenue stream » Continued build - out of BPU - approved, grid - connected solar projects and completed first onshore wind project; Sunlight Advantage 3,000 th customer milestone » NJRES performance enhanced earnings retention and reduced the need for new equity issuances x Led to increased long - term average annual NFE growth rate forecast » Strong financial profile provided access to capital 3
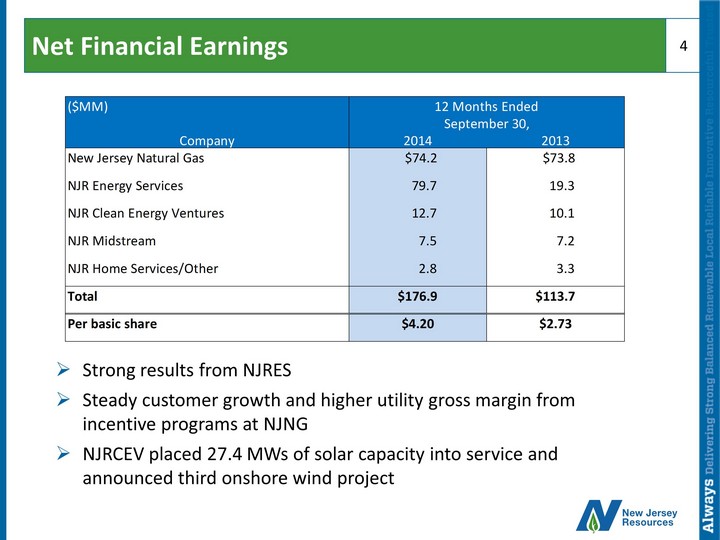
Net Financial Earnings 4 ($MM) Company 2014 2013 New Jersey Natural Gas $74.2 $73.8 NJR Energy Services 79.7 19.3 NJR Clean Energy Ventures 12.7 10.1 NJR Midstream 7.5 7.2 NJR Home Services/Other 2.8 3.3 Total $176.9 $113.7 Per basic share $4.20 $2.73 12 Months Ended September 30, » Strong results from NJRES » Steady customer growth and higher utility gross margin from incentive programs at NJNG » NJRCEV placed 27.4 MWs of solar capacity into service and announced third onshore wind project
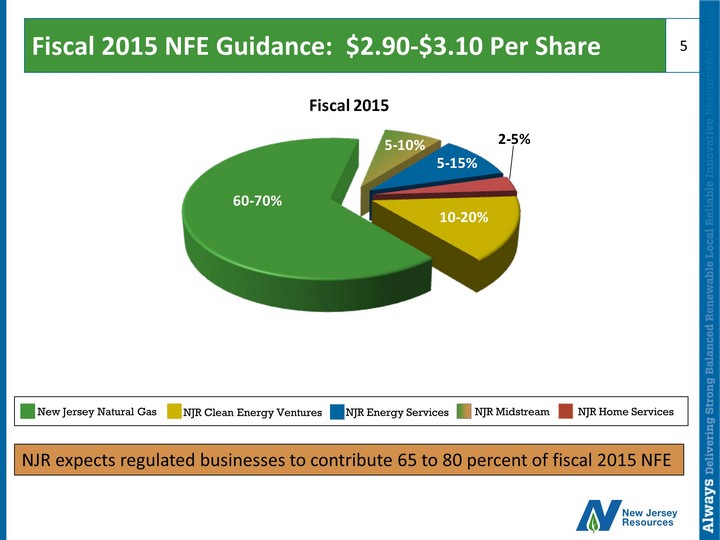
Fiscal 2015 NFE Guidance: $2.90 - $3.10 Per Share 5 Fiscal 2015 60 - 70% 10 - 20% 5 - 15% 5 - 10% 2 - 5% NJR expects regulated businesses to contribute 65 to 80 percent of fiscal 2015 NFE New Jersey Natural Gas NJR Clean Energy Ventures NJR Energy Services NJR Midstream NJR Home Services
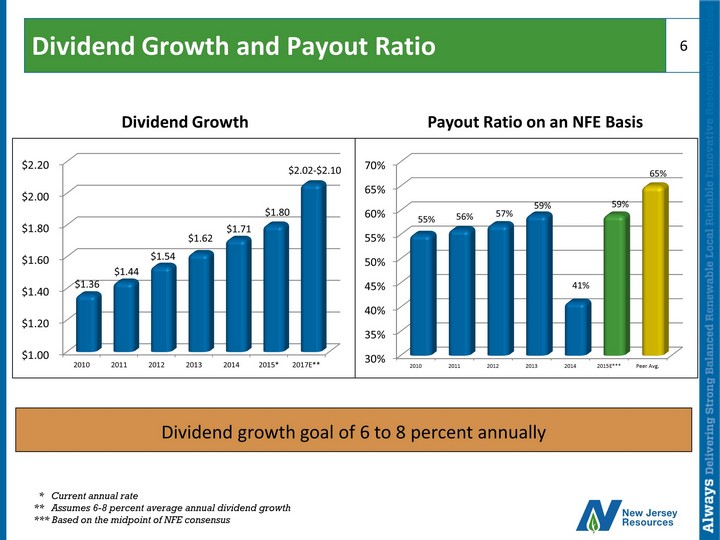
Dividend Growth and Payout Ratio 6 Dividend growth goal of 6 to 8 percent annually * Current annual rate ** Assumes 6 - 8 percent average annual dividend growth *** Based on the midpoint of NFE consensus 30% 35% 40% 45% 50% 55% 60% 65% 70% 2010 2011 2012 2013 2014 2015E*** Peer Avg. 55 % 56 % 57 % 59 % 41% 65% 59% $1.00 $1.20 $1.40 $1.60 $1.80 $2.00 $2.20 2010 2011 2012 2013 2014 2015* 2017E** $1.36 $1.44 $1.54 $1.62 $1.71 $1.80 $2.02 - $2.10 Payout Ratio on an NFE Basis Dividend Growth
Our Growth Strategy Long - term average annual NFE growth g oal r emains 5 to 9 percent » Increased regulated infrastructure investments support safe, reliable service and anchor our business portfolio x NJNG drives our long - term growth x PennEast Pipeline » Provide customers with cost - efficient renewable electricity, while reducing ITC reliance x Portfolio diversification x Improving SREC fundamentals » Provide physical and producer services to a variety of natural gas market participants 7
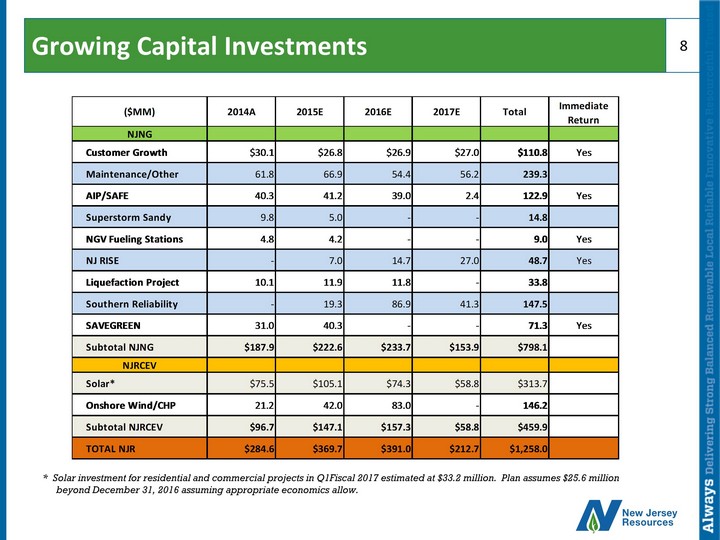
Growing Capital Investments 8 ($MM) 2014A 2015E 2016E 2017E Total Immediate Return NJNG Customer Growth $30.1 $26.8 $26.9 $27.0 $110.8 Yes Maintenance/Other 61.8 66.9 54.4 56.2 239.3 AIP/SAFE 40.3 41.2 39.0 2.4 122.9 Yes Superstorm Sandy 9.8 5.0 - - 14.8 NGV Fueling Stations 4.8 4.2 - - 9.0 Yes NJ RISE - 7.0 14.7 27.0 48.7 Yes Liquefaction Project 10.1 11.9 11.8 - 33.8 Southern Reliability - 19.3 86.9 41.3 147.5 SAVEGREEN 31.0 40.3 - - 71.3 Yes Subtotal NJNG $187.9 $222.6 $233.7 $153.9 $798.1 NJRCEV Solar* $75.5 $105.1 $74.3 $58.8 $313.7 Onshore Wind/CHP 21.2 42.0 83.0 - 146.2 Subtotal NJRCEV $96.7 $147.1 $157.3 $58.8 $459.9 TOTAL NJR $284.6 $369.7 $391.0 $212.7 $1,258.0 * Solar investment for residential and commercial projects in Q1Fiscal 2017 estimated at $33.2 million. Plan assumes $25.6 million beyond December 31, 2016 assuming appropriate economics allow.
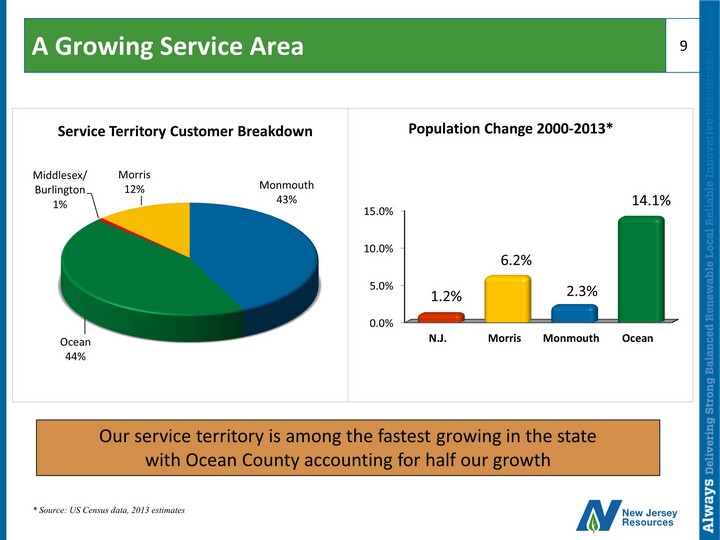
A Growing Service Area 9 0.0% 5.0% 10.0% 15.0% N.J. Morris Monmouth Ocean 1.2% 6.2% 2.3% 14.1% Population Change 2000 - 2013* Monmouth 43% Ocean 44% Middlesex/ Burlington 1% Morris 12% Service Territory Customer Breakdown Our service territory is among the fastest growing in the state w ith Ocean County accounting for half our growth * Source: US Census data, 2013 estimates
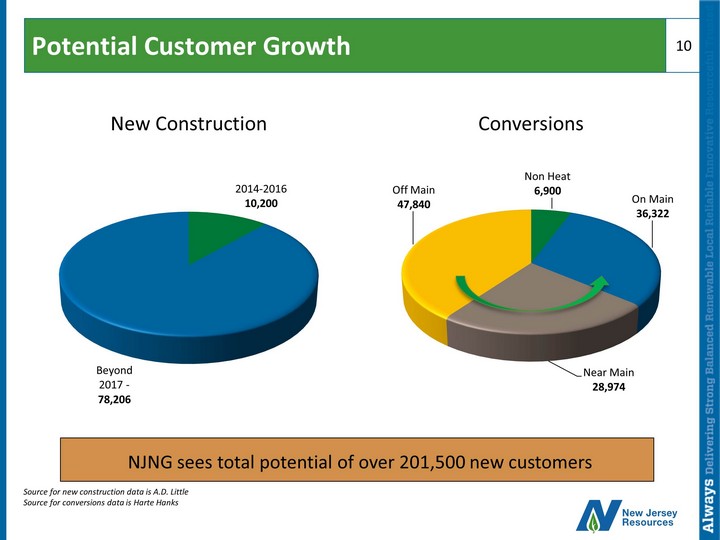
Potential Customer Growth 10 2014 - 2016 10,200 Beyond 2017 - 78,206 New Construction Non Heat 6,900 On Main 36,322 Near Main 28,974 Off Main 47,840 Conversions NJNG sees total potential of over 201,500 new customers Source for new construction data is A.D. Little Source for conversions data is Harte Hanks
Collaborative Regulatory Relationships 11 Regulatory and Incentive Programs » Basic Gas Supply Service Incentives (BGSS) - 1992 » Conservation Incentive Program (CIP) - 2006 » Accelerated Infrastructure Program (AIP) - 2008 » The SAVEGREEN Project® - 2009 » The NGV Advantage - 2012 » Safety Acceleration and Facility Enhancement Program (SAFE) - 2012 » New Jersey Reinvestment in System Enhancement (NJ RISE) - 2014
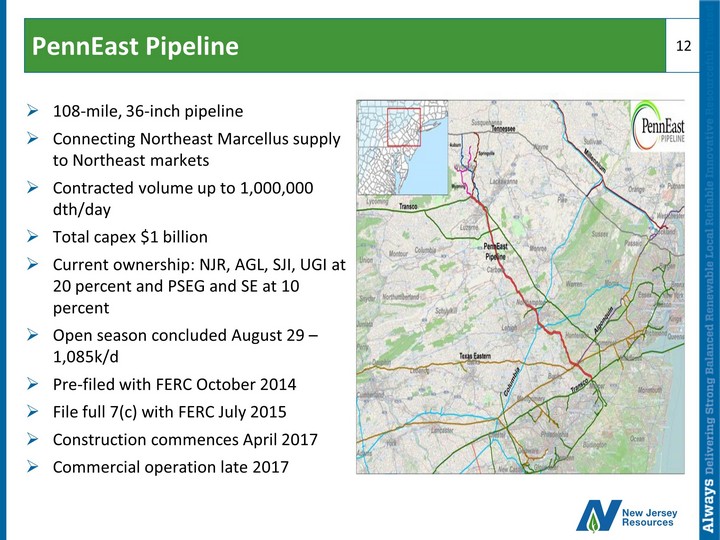
PennEast Pipeline 12 » 108 - mile, 36 - inch pipeline » Connecting Northeast Marcellus supply to Northeast markets » Contracted volume up to 1,000,000 dth/day » Total capex $1 billion » Current ownership: NJR , AGL, SJI, UGI at 20 percent and PSEG and SE at 10 percent » Open season concluded August 29 – 1,085k/d » Pre - filed with FERC October 2014 » File full 7(c) with FERC July 2015 » Construction commences April 2017 » Commercial operation late 2017
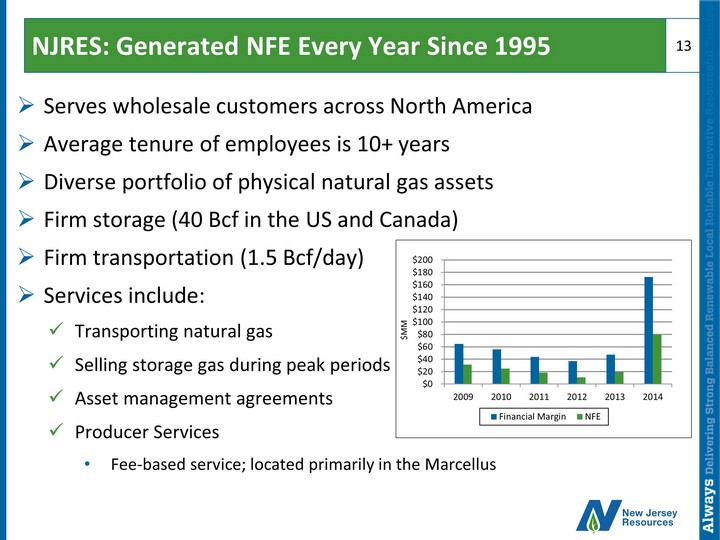
NJRES: Generated NFE Every Year Since 1995 » Serves wholesale customers across North America » Average tenure of employees is 10+ years » Diverse portfolio of physical natural gas assets » Firm storage ( 40 Bcf in the US and Canada) » Firm transportation ( 1.5 Bcf/day) » Services include: x Transporting natural gas x Selling storage gas during peak periods x Asset management agreements x Producer Services • Fee - based service; located primarily in the Marcellus 13 $0 $20 $40 $60 $80 $100 $120 $140 $160 $180 $200 2009 2010 2011 2012 2013 2014 $MM Financial Margin NFE
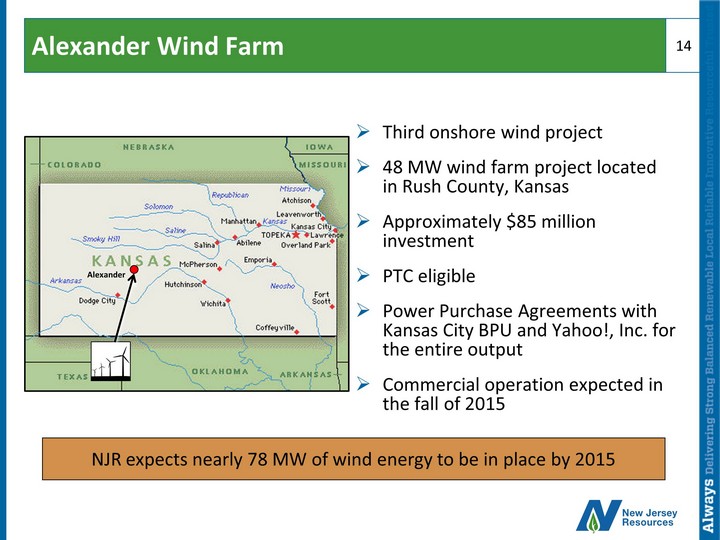
Alexander Wind Farm » Third onshore wind project » 48 MW wind farm project located in Rush County, Kansas » Approximately $85 million investment » PTC eligible » Power Purchase Agreements with Kansas City BPU and Yahoo !, Inc. for the entire output » Commercial operation expected in the fall of 2015 14 Alexander NJR expects nearly 78 MW of wind energy to be in place by 2015
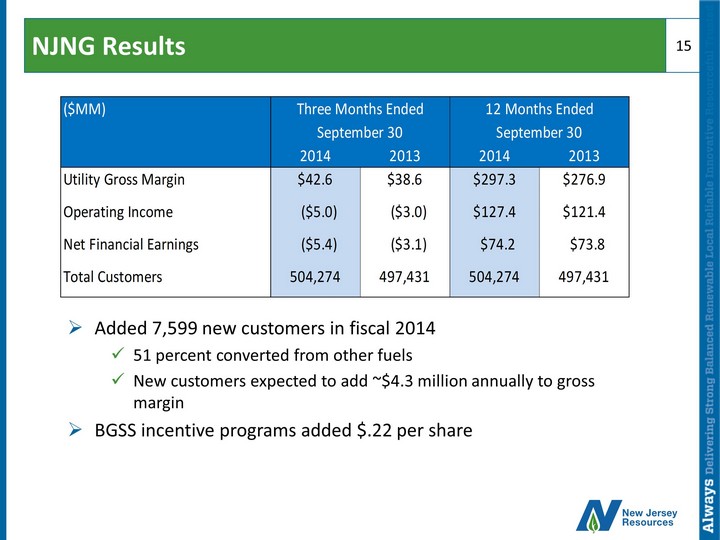
NJNG Results 15 ($MM) 2014 2013 2014 2013 Utility Gross Margin $42.6 $38.6 $297.3 $276.9 Operating Income ($5.0) ($3.0) $127.4 $121.4 Net Financial Earnings ($5.4) ($3.1) $74.2 $73.8 Total Customers 504,274 497,431 504,274 497,431 12 Months EndedThree Months Ended September 30 September 30 » Added 7,599 new customers in fiscal 2014 x 51 percent converted from other fuels x New customers expected to add ~$4.3 million annually to gross margin » BGSS incentive programs added $.22 per share
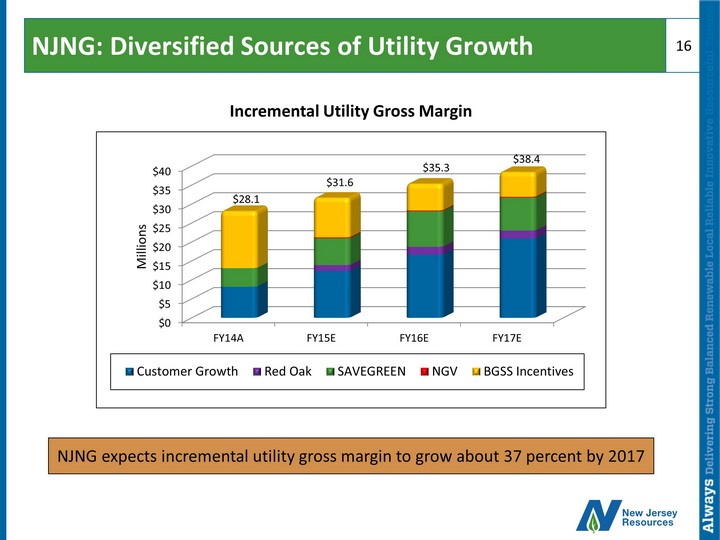
NJNG: Diversified Sources of Utility Growth 16 NJNG expects incremental utility gross margin to grow about 37 percent by 2017 $0 $5 $10 $15 $20 $25 $30 $35 $40 FY14A FY15E FY16E FY17E $28.1 $31.6 $35.3 $38.4 Millions Customer Growth Red Oak SAVEGREEN NGV BGSS Incentives Incremental Utility Gross Margin
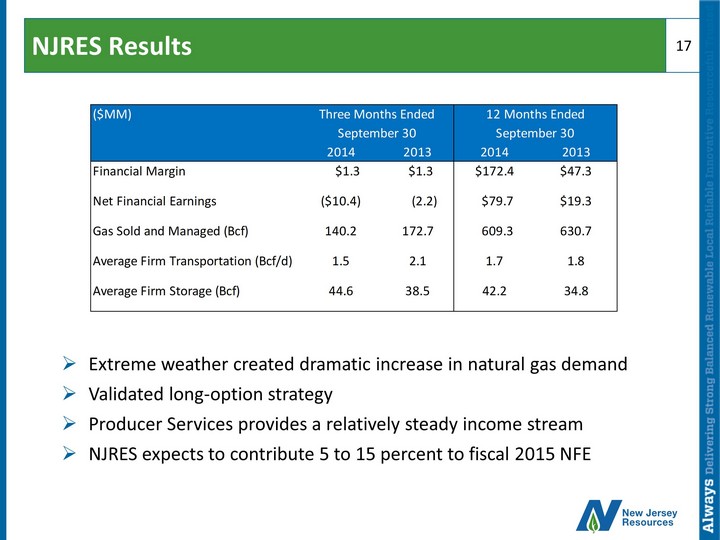
NJRES Results 17 ($MM) 2014 2013 2014 2013 Financial Margin $1.3 $1.3 $172.4 $47.3 Net Financial Earnings ($10.4) (2.2) $79.7 $19.3 Gas Sold and Managed (Bcf) 140.2 172.7 609.3 630.7 Average Firm Transportation (Bcf/d) 1.5 2.1 1.7 1.8 Average Firm Storage (Bcf) 44.6 38.5 42.2 34.8 12 Months EndedThree Months Ended September 30 September 30 » Extreme weather created dramatic increase in natural gas demand » Validated long - option strategy » Producer Services provides a relatively steady income stream » NJRES expects to contribute 5 to 15 percent to fiscal 2015 NFE
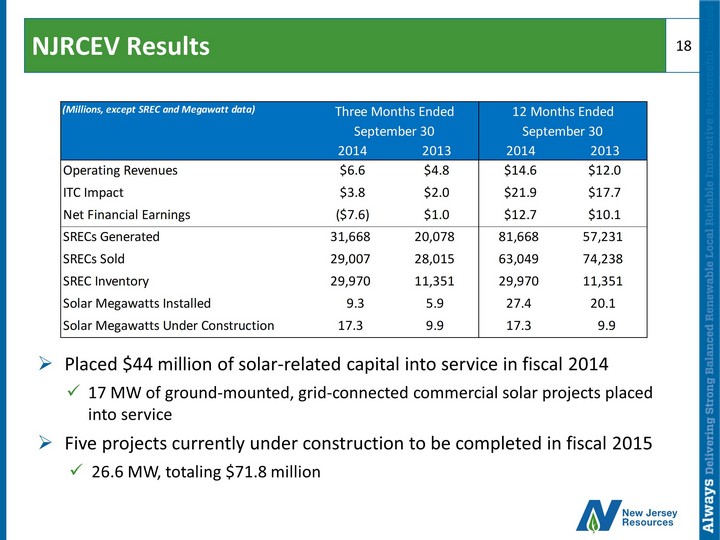
NJRCEV Results 18 (Millions, except SREC and Megawatt data) 2014 2013 2014 2013 Operating Revenues $6.6 $4.8 $14.6 $12.0 ITC Impact $3.8 $2.0 $21.9 $17.7 Net Financial Earnings ($7.6) $1.0 $12.7 $10.1 SRECs Generated 31,668 20,078 81,668 57,231 SRECs Sold 29,007 28,015 63,049 74,238 SREC Inventory 29,970 11,351 29,970 11,351 Solar Megawatts Installed 9.3 5.9 27.4 20.1 Solar Megawatts Under Construction 17.3 9.9 17.3 9.9 12 Months EndedThree Months Ended September 30 September 30 » Placed $44 million of solar - related capital into service in fiscal 2014 x 17 MW of ground - mounted, grid - connected commercial solar projects placed into service » Five projects currently under construction to be completed in fiscal 2015 x 26.6 MW, totaling $71.8 million
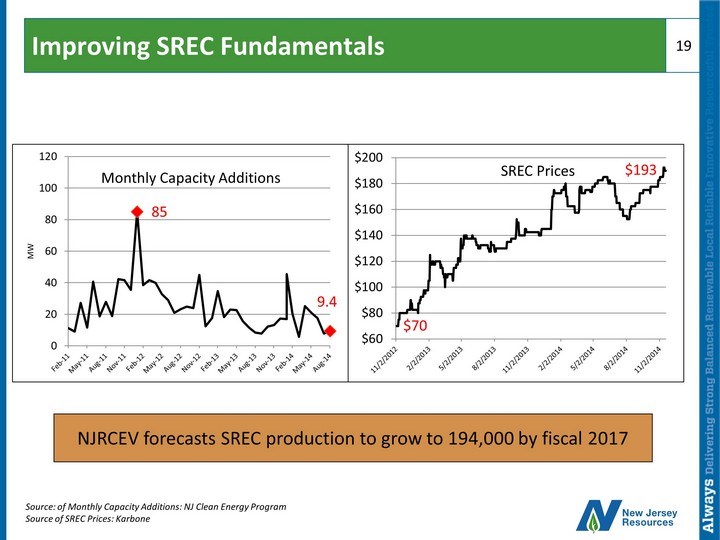
Improving SREC Fundamentals 19 Source: of Monthly Capacity Additions: NJ Clean Energy Program Source of SREC Prices: Karbone $60 $80 $100 $120 $140 $160 $180 $200 SREC Prices $70 $193 0 20 40 60 80 100 120 MW Monthly Capacity Additions 85 9.4 NJRCEV forecasts SREC production to grow to 194,000 by fiscal 2017
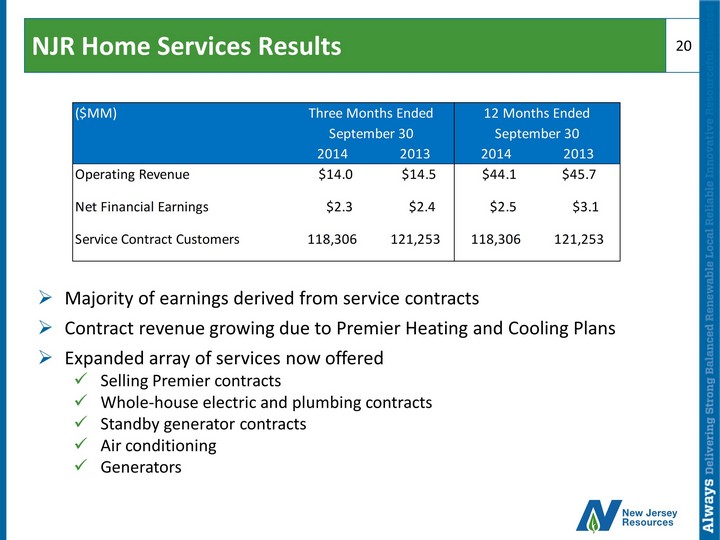
NJR Home Services Results 20 ($MM) 2014 2013 2014 2013 Operating Revenue $14.0 $14.5 $44.1 $45.7 Net Financial Earnings $2.3 $2.4 $2.5 $3.1 Service Contract Customers 118,306 121,253 118,306 121,253 12 Months EndedThree Months Ended September 30 September 30 » Majority of earnings derived from service contracts » Contract revenue growing due to Premier Heating and Cooling Plans » Expanded array of services now offered x Selling Premier contracts x Whole - house electric and plumbing contracts x Standby generator contracts x Air conditioning x Generators
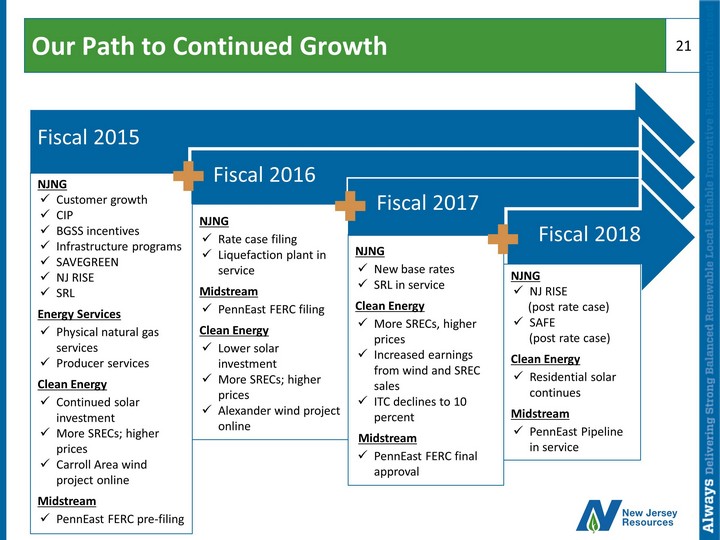
Our Path to Continued Growth 21 Fiscal 2015 NJNG x Customer growth x CIP x BGSS incentives x Infrastructure programs x SAVEGREEN x NJ RISE x SRL Energy Services x Physical natural gas services x Producer services Clean Energy x Continued solar investment x More SRECs; higher prices x Carroll Area wind project online Midstream x PennEast FERC pre - filing Fiscal 2016 NJNG x Rate case filing x Liquefaction plant in service Midstream x PennEast FERC filing Clean Energy x Lower solar investment x More SRECs; higher prices x Alexander wind project online Fiscal 2017 NJNG x New base rates x SRL in service Clean Energy x More SRECs, higher prices x Increased earnings from wind and SREC sales x ITC declines to 10 percent Midstream x PennEast FERC final approval Fiscal 2018 NJNG x NJ RISE (post rate case) x SAFE ( post rate case) Clean Energy x Residential solar continues Midstream x PennEast Pipeline in service