Attached files
| file | filename |
|---|---|
| EXCEL - IDEA: XBRL DOCUMENT - Otter Tail Corp | Financial_Report.xls |
| EX-10.6 - EXHIBIT 10.6 - Otter Tail Corp | ex10-6.htm |
| EX-32.2 - EXHIBIT 32.2 - Otter Tail Corp | ex32-2.htm |
| EX-10.5 - EXHIBIT 10.5 - Otter Tail Corp | ex10-5.htm |
| EX-10.3 - EXHIBIT 10.3 - Otter Tail Corp | ex10-3.htm |
| EX-31.2 - EXHIBIT 31.2 - Otter Tail Corp | ex31-2.htm |
| EX-31.1 - EXHIBIT 31.1 - Otter Tail Corp | ex31-1.htm |
| EX-10.4 - EXHIBIT 10.4 - Otter Tail Corp | ex10-4.htm |
| EX-32.1 - EXHIBIT 32.1 - Otter Tail Corp | ex32-1.htm |
UNITED STATES SECURITIES AND EXCHANGE COMMISSION
Washington, D.C. 20549
FORM 10-Q
(Mark One)
|
x
|
QUARTERLY REPORT PURSUANT TO SECTION 13 OR 15(d) OF THE SECURITIES EXCHANGE ACT OF 1934
|
|
For the quarterly period ended
|
September 30, 2014
|
OR
|
o
|
TRANSITION REPORT PURSUANT TO SECTION 13 OR 15(d) OF THE SECURITIES EXCHANGE ACT OF 1934
|
|
For the transition period from
|
to
|
|
Commission file number
|
0-53713
|
|
OTTER TAIL CORPORATION
|
|
(Exact name of registrant as specified in its charter)
|
|
Minnesota
|
27-0383995
|
|
(State or other jurisdiction of
|
(I.R.S. Employer
|
|
incorporation or organization)
|
Identification No.)
|
|
215 South Cascade Street, Box 496, Fergus Falls, Minnesota
|
56538-0496
|
|
(Address of principal executive offices)
|
(Zip Code)
|
|
866-410-8780
|
|
(Registrant’s telephone number, including area code)
|
|
(Former name, former address and former fiscal year, if changed since last report)
|
Indicate by check mark whether the registrant (1) has filed all reports required to be filed by Section 13 or 15(d) of the Securities Exchange Act of 1934 during the preceding 12 months (or for such shorter period that the registrant was required to file such reports), and (2) has been subject to such filing requirements for the past 90 days. Yes x No o
Indicate by check mark whether the registrant has submitted electronically and posted on its corporate Web site, if any, every Interactive Data File required to be submitted and posted pursuant to Rule 405 of Regulation S-T (§ 232.405 of this chapter) during the preceding 12 months (or for such shorter period that the registrant was required to submit and post such files). Yes x No o
Indicate by check mark whether the registrant is a large accelerated filer, an accelerated filer, a non-accelerated filer, or a smaller reporting company. See the definitions of “large accelerated filer,” “accelerated filer” and “smaller reporting company” in Rule 12b-2 of the Exchange Act.:
| Large accelerated filer x | Accelerated filer o |
| Non-accelerated filer o | Smaller reporting company o |
| (Do not check if a smaller reporting company) |
Indicate by check mark whether the registrant is a shell company (as defined by Rule 12b-2 of the Exchange Act). Yes o No x
Indicate the number of shares outstanding of each of the issuer’s classes of Common Stock, as of the latest practicable date:
October 31, 2014 – 36,806,160 Common Shares ($5 par value)
OTTER TAIL CORPORATION
INDEX
|
|
Page No.
|
|
|
2 & 3
|
||
|
4
|
||
|
5
|
||
|
6
|
||
|
7-36
|
||
|
37-56
|
||
|
57
|
||
|
57
|
||
|
58
|
||
|
58
|
||
|
58
|
||
|
59
|
||
| 1 |
|
Otter Tail Corporation
|
||||||||
|
(not audited)
|
||||||||
|
(in thousands)
|
September 30,
2014
|
December 31,
2013
|
||||||
|
ASSETS
|
||||||||
|
Current Assets
|
||||||||
|
Cash and Cash Equivalents
|
$ | -- | $ | 1,150 | ||||
|
Accounts Receivable:
|
||||||||
|
Trade—Net
|
105,119 | 83,572 | ||||||
|
Other
|
13,687 | 9,790 | ||||||
|
Inventories
|
78,939 | 72,681 | ||||||
|
Deferred Income Taxes
|
47,228 | 35,452 | ||||||
|
Unbilled Revenues
|
15,804 | 18,157 | ||||||
|
Costs and Estimated Earnings in Excess of Billings
|
6,271 | 4,063 | ||||||
|
Regulatory Assets
|
19,947 | 17,940 | ||||||
|
Other
|
10,779 | 7,747 | ||||||
|
Assets of Discontinued Operations
|
10 | 38 | ||||||
|
Total Current Assets
|
297,784 | 250,590 | ||||||
|
Investments
|
8,706 | 9,362 | ||||||
|
Other Assets
|
29,856 | 28,834 | ||||||
|
Goodwill
|
38,808 | 38,971 | ||||||
|
Other Intangibles—Net
|
12,595 | 13,328 | ||||||
|
Deferred Debits
|
||||||||
|
Unamortized Debt Expense
|
4,147 | 4,188 | ||||||
|
Regulatory Assets
|
73,725 | 83,730 | ||||||
|
Total Deferred Debits
|
77,872 | 87,918 | ||||||
|
Plant
|
||||||||
|
Electric Plant in Service
|
1,521,948 | 1,460,884 | ||||||
|
Nonelectric Operations
|
197,767 | 194,872 | ||||||
|
Construction Work in Progress
|
234,342 | 187,461 | ||||||
|
Total Gross Plant
|
1,954,057 | 1,843,217 | ||||||
|
Less Accumulated Depreciation and Amortization
|
705,393 | 676,201 | ||||||
|
Net Plant
|
1,248,664 | 1,167,016 | ||||||
|
Total Assets
|
$ | 1,714,285 | $ | 1,596,019 | ||||
See accompanying condensed notes to consolidated financial statements.
| 2 |
|
Otter Tail Corporation
|
||||||||
|
Consolidated Balance Sheets
|
||||||||
|
(not audited)
|
||||||||
|
(in thousands, except share data)
|
September 30,
2014
|
December 31,
2013
|
||||||
|
LIABILITIES AND EQUITY
|
||||||||
|
Current Liabilities
|
||||||||
|
Short-Term Debt
|
$ | 39,000 | $ | 51,195 | ||||
|
Current Maturities of Long-Term Debt
|
198 | 188 | ||||||
|
Accounts Payable
|
107,307 | 113,457 | ||||||
|
Accrued Salaries and Wages
|
21,679 | 19,903 | ||||||
|
Billings In Excess Of Costs and Estimated Earnings
|
2,508 | 13,707 | ||||||
|
Accrued Taxes
|
10,998 | 12,491 | ||||||
|
Derivative Liabilities
|
6,520 | 11,782 | ||||||
|
Other Accrued Liabilities
|
8,286 | 6,532 | ||||||
|
Liabilities of Discontinued Operations
|
3,300 | 3,637 | ||||||
|
Total Current Liabilities
|
199,796 | 232,892 | ||||||
|
Pensions Benefit Liability
|
50,799 | 69,743 | ||||||
|
Other Postretirement Benefits Liability
|
46,083 | 45,221 | ||||||
|
Other Noncurrent Liabilities
|
21,890 | 25,209 | ||||||
|
Commitments and Contingencies (note 9)
|
||||||||
|
Deferred Credits
|
||||||||
|
Deferred Income Taxes
|
229,148 | 195,603 | ||||||
|
Deferred Tax Credits
|
26,927 | 28,288 | ||||||
|
Regulatory Liabilities
|
76,942 | 73,926 | ||||||
|
Other
|
918 | 718 | ||||||
|
Total Deferred Credits
|
333,935 | 298,535 | ||||||
|
Capitalization
|
||||||||
|
Long-Term Debt, Net of Current Maturities
|
498,540 | 389,589 | ||||||
|
Cumulative Preferred Shares– Authorized 1,500,000 Shares Without Par Value;
Outstanding - None
|
-- | -- | ||||||
|
Cumulative Preference Shares – Authorized 1,000,000 Shares Without Par Value;
Outstanding - None
|
-- | -- | ||||||
|
Common Shares, Par Value $5 Per Share—Authorized, 50,000,000 Shares;
|
||||||||
|
Outstanding, 2014—36,797,438 Shares; 2013—36,271,696 Shares
|
183,987 | 181,358 | ||||||
|
Premium on Common Shares
|
267,346 | 255,759 | ||||||
|
Retained Earnings
|
113,569 | 99,441 | ||||||
|
Accumulated Other Comprehensive Loss
|
(1,660 | ) | (1,728 | ) | ||||
|
Total Common Equity
|
563,242 | 534,830 | ||||||
|
Total Capitalization
|
1,061,782 | 924,419 | ||||||
|
Total Liabilities and Equity
|
$ | 1,714,285 | $ | 1,596,019 | ||||
See accompanying condensed notes to consolidated financial statements.
| 3 |
|
Otter Tail Corporation
|
||||||||||||||||
|
Consolidated Statements of Income
|
||||||||||||||||
|
(not audited)
|
||||||||||||||||
|
Three Months Ended
September 30,
|
Nine Months Ended
September 30,
|
|||||||||||||||
|
(in thousands, except share and per-share amounts)
|
2014
|
2013
|
2014
|
2013
|
||||||||||||
|
Operating Revenues
|
||||||||||||||||
|
Electric
|
$ | 89,376 | $ | 86,275 | $ | 301,328 | $ | 270,089 | ||||||||
|
Product Sales
|
107,149 | 95,984 | 304,527 | 281,102 | ||||||||||||
|
Construction Services
|
45,846 | 47,509 | 111,599 | 108,920 | ||||||||||||
|
Total Operating Revenues
|
242,371 | 229,768 | 717,454 | 660,111 | ||||||||||||
|
Operating Expenses
|
||||||||||||||||
|
Production Fuel - Electric
|
15,121 | 18,785 | 49,754 | 52,341 | ||||||||||||
|
Purchased Power - Electric System Use
|
10,710 | 8,691 | 48,971 | 36,575 | ||||||||||||
|
Electric Operation and Maintenance Expenses
|
33,346 | 30,626 | 107,742 | 98,878 | ||||||||||||
|
Cost of Products Sold (depreciation included below)
|
85,384 | 74,477 | 239,501 | 214,601 | ||||||||||||
|
Cost of Construction Revenues Earned (depreciation included below)
|
37,767 | 40,998 | 94,010 | 96,873 | ||||||||||||
|
Other Nonelectric Expenses
|
13,421 | 12,857 | 42,086 | 38,811 | ||||||||||||
|
Depreciation and Amortization
|
15,122 | 15,039 | 44,871 | 44,794 | ||||||||||||
|
Property Taxes - Electric
|
3,178 | 3,163 | 9,536 | 9,088 | ||||||||||||
|
Total Operating Expenses
|
214,049 | 204,636 | 636,471 | 591,961 | ||||||||||||
|
Operating Income
|
28,322 | 25,132 | 80,983 | 68,150 | ||||||||||||
|
Interest Charges
|
7,687 | 6,574 | 21,909 | 20,431 | ||||||||||||
|
Other Income
|
494 | 1,401 | 3,175 | 2,958 | ||||||||||||
|
Income Before Income Taxes—Continuing Operations
|
21,129 | 19,959 | 62,249 | 50,677 | ||||||||||||
|
Income Tax Expense—Continuing Operations
|
5,476 | 5,133 | 15,250 | 13,113 | ||||||||||||
|
Net Income from Continuing Operations
|
15,653 | 14,826 | 46,999 | 37,564 | ||||||||||||
|
Discontinued Operations
|
||||||||||||||||
|
Income - net of Income Tax Expense (Benefit) of
$116, $39, $166 and ($35) for the respective periods
|
172 | 312 | 249 | 428 | ||||||||||||
|
Gain on Disposition - net of Income Tax Expense of
$6 for the nine months ended September 30, 2013
|
-- | -- | -- | 210 | ||||||||||||
|
Net Income from Discontinued Operations
|
172 | 312 | 249 | 638 | ||||||||||||
|
Net Income
|
15,825 | 15,138 | 47,248 | 38,202 | ||||||||||||
|
Preferred Dividend Requirements and Other Adjustments
|
-- | -- | -- | 513 | ||||||||||||
|
Earnings Available for Common Shares
|
$ | 15,825 | $ | 15,138 | $ | 47,248 | $ | 37,689 | ||||||||
|
Average Number of Common Shares Outstanding—Basic
|
36,596,396 | 36,179,507 | 36,415,500 | 36,141,664 | ||||||||||||
|
Average Number of Common Shares Outstanding—Diluted
|
36,838,990 | 36,381,900 | 36,658,257 | 36,344,063 | ||||||||||||
|
Basic Earnings Per Common Share:
|
||||||||||||||||
|
Continuing Operations (net of preferred dividend requirement and other adjustments)
|
$ | 0.43 | $ | 0.41 | $ | 1.29 | $ | 1.02 | ||||||||
|
Discontinued Operations
|
-- | 0.01 | 0.01 | 0.02 | ||||||||||||
| $ | 0.43 | $ | 0.42 | $ | 1.30 | $ | 1.04 | |||||||||
|
Diluted Earnings Per Common Share:
|
||||||||||||||||
|
Continuing Operations (net of preferred dividend requirement and other adjustments)
|
$ | 0.43 | $ | 0.41 | $ | 1.28 | $ | 1.02 | ||||||||
|
Discontinued Operations
|
-- | 0.01 | 0.01 | 0.02 | ||||||||||||
| $ | 0.43 | $ | 0.42 | $ | 1.29 | $ | 1.04 | |||||||||
|
Dividends Declared Per Common Share
|
$ | 0.3025 | $ | 0.2975 | $ | 0.9075 | $ | 0.8925 | ||||||||
See accompanying condensed notes to consolidated financial statements.
| 4 |
|
Otter Tail Corporation
|
||||||||||||||||
|
Consolidated Statements of Comprehensive Income
|
||||||||||||||||
|
(not audited)
|
||||||||||||||||
|
Three Months Ended
September 30,
|
Nine Months Ended
September 30,
|
|||||||||||||||
|
(in thousands)
|
2014
|
2013
|
2014
|
2013
|
||||||||||||
|
Net Income
|
$ | 15,825 | $ | 15,138 | $ | 47,248 | $ | 38,202 | ||||||||
|
Other Comprehensive Income:
|
||||||||||||||||
|
Unrealized Gain on Available-for-Sale Securities:
|
||||||||||||||||
|
Reversal of Previously Recognized Gains Realized on Sale of
Investments and Included in Other Income During Period
|
-- | -- | (17 | ) | (25 | ) | ||||||||||
|
(Losses) Gains Arising During Period
|
(37 | ) | 19 | (18 | ) | (66 | ) | |||||||||
|
Income Tax Benefit (Expense)
|
13 | (7 | ) | 12 | 32 | |||||||||||
|
Change in Unrealized Gains on Available-for-Sale Securities – net-of-tax
|
(24 | ) | 12 | (23 | ) | (59 | ) | |||||||||
|
Pension and Postretirement Benefit Plans:
|
||||||||||||||||
|
Amortization of Unrecognized Postretirement Benefit Losses
and Costs (note 12)
|
50 | 145 | 151 | 436 | ||||||||||||
|
Income Tax (Expense)
|
(20 | ) | (58 | ) | (60 | ) | (175 | ) | ||||||||
|
Pension and Postretirement Benefit Plans – net-of-tax
|
30 | 87 | 91 | 261 | ||||||||||||
|
Total Other Comprehensive Income
|
6 | 99 | 68 | 202 | ||||||||||||
|
Total Comprehensive Income
|
$ | 15,831 | $ | 15,237 | $ | 47,316 | $ | 38,404 | ||||||||
See accompanying condensed notes to consolidated financial statements.
| 5 |
|
Otter Tail Corporation
|
||||||||
|
Consolidated Statements of Cash Flows
|
||||||||
|
(not audited)
|
||||||||
|
Nine Months Ended
September 30,
|
||||||||
|
(in thousands)
|
2014
|
2013
|
||||||
|
Cash Flows from Operating Activities
|
||||||||
|
Net Income
|
$ | 47,248 | $ | 38,202 | ||||
|
Adjustments to Reconcile Net Income to Net Cash Provided by Operating Activities:
|
||||||||
|
Net Gain from Sale of Discontinued Operations
|
-- | (210 | ) | |||||
|
Net Income from Discontinued Operations
|
(249 | ) | (428 | ) | ||||
|
Depreciation and Amortization
|
44,871 | 44,794 | ||||||
|
Deferred Tax Credits
|
(1,361 | ) | (1,422 | ) | ||||
|
Deferred Income Taxes
|
20,824 | 15,215 | ||||||
|
Change in Deferred Debits and Other Assets
|
4,299 | 9,817 | ||||||
|
Discretionary Contribution to Pension Plan
|
(20,000 | ) | (10,000 | ) | ||||
|
Change in Noncurrent Liabilities and Deferred Credits
|
(1,336 | ) | 7,318 | |||||
|
Allowance for Equity/Other Funds Used During Construction
|
(1,180 | ) | (1,462 | ) | ||||
|
Change in Derivatives Net of Regulatory Deferral
|
214 | 120 | ||||||
|
Stock Compensation Expense—Equity Awards
|
1,126 | 1,116 | ||||||
|
Other—Net
|
(1,303 | ) | 813 | |||||
|
Cash (Used for) Provided by Current Assets and Current Liabilities:
|
||||||||
|
Change in Receivables
|
(23,651 | ) | (9,775 | ) | ||||
|
Change in Inventories
|
(6,298 | ) | (3,323 | ) | ||||
|
Change in Other Current Assets
|
(1,769 | ) | (252 | ) | ||||
|
Change in Payables and Other Current Liabilities
|
(15,094 | ) | 4,170 | |||||
|
Change in Interest and Income Taxes Receivable/Payable
|
1,028 | 1,156 | ||||||
|
Net Cash Provided by Continuing Operations
|
47,369 | 95,849 | ||||||
|
Net Cash Used in Discontinued Operations
|
(341 | ) | (2,499 | ) | ||||
|
Net Cash Provided by Operating Activities
|
47,028 | 93,350 | ||||||
|
Cash Flows from Investing Activities
|
||||||||
|
Capital Expenditures
|
(125,164 | ) | (109,690 | ) | ||||
|
Net Proceeds from Disposal of Noncurrent Assets
|
3,262 | 2,615 | ||||||
|
Net Increase in Other Investments
|
(2,148 | ) | (680 | ) | ||||
|
Net Cash Used in Investing Activities - Continuing Operations
|
(124,050 | ) | (107,755 | ) | ||||
|
Net Proceeds from Sale of Discontinued Operations
|
-- | 12,842 | ||||||
|
Net Cash Provided by Investing Activities - Discontinued Operations
|
284 | 505 | ||||||
|
Net Cash Used in Investing Activities
|
(123,766 | ) | (94,408 | ) | ||||
|
Cash Flows from Financing Activities
|
||||||||
|
Net Short-Term (Repayments) Borrowings
|
(12,195 | ) | 40,335 | |||||
|
Proceeds from Issuance of Common Stock
|
13,331 | 1,496 | ||||||
|
Common Stock Issuance Expenses
|
(412 | ) | -- | |||||
|
Payments for Retirement of Capital Stock
|
(459 | ) | (15,723 | ) | ||||
|
Proceeds from Issuance of Long-Term Debt
|
150,000 | 40,900 | ||||||
|
Short-Term and Long-Term Debt Issuance Expenses
|
(516 | ) | (126 | ) | ||||
|
Payments for Retirement of Long-Term Debt
|
(41,039 | ) | (25,266 | ) | ||||
|
Dividends Paid and Other Distributions
|
(33,119 | ) | (33,027 | ) | ||||
|
Net Cash Provided by Financing Activities - Continuing Operations
|
75,591 | 8,589 | ||||||
|
Net Cash Used in Financing Activities - Discontinued Operations
|
-- | -- | ||||||
|
Net Cash Provided by Financing Activities
|
75,591 | 8,589 | ||||||
|
Net Change in Cash and Cash Equivalents - Discontinued Operations
|
(3 | ) | (776 | ) | ||||
|
Net Change in Cash and Cash Equivalents
|
(1,150 | ) | 6,755 | |||||
|
Cash and Cash Equivalents at Beginning of Period
|
1,150 | 52,362 | ||||||
|
Cash and Cash Equivalents at End of Period
|
$ | -- | $ | 59,117 | ||||
See accompanying condensed notes to consolidated financial statements.
| 6 |
OTTER TAIL CORPORATION
(not audited)
In the opinion of management, Otter Tail Corporation (the Company) has included all adjustments (including normal recurring accruals) necessary for a fair presentation of the consolidated financial statements for the periods presented. The consolidated financial statements and condensed notes thereto should be read in conjunction with the consolidated financial statements and notes included in the Company’s Annual Report on Form 10-K for the fiscal year ended December 31, 2013. Because of seasonal and other factors, the earnings for the three and nine month periods ended September 30, 2014 should not be taken as an indication of earnings for all or any part of the balance of the year.
The following notes are numbered to correspond to numbers of the notes included in the Company’s Annual Report on Form 10-K for the fiscal year ended December 31, 2013.
1. Summary of Significant Accounting Policies
Revenue Recognition
Due to the diverse business operations of the Company, revenue recognition depends on the product produced and sold or service performed. The Company recognizes revenue when the earnings process is complete, evidenced by an agreement with the customer, there has been delivery and acceptance, and the price is fixed or determinable. In cases where significant obligations remain after delivery, revenue recognition is deferred until such obligations are fulfilled. Provisions for sales returns and warranty costs are recorded at the time of the sale based on historical information and current trends. In the case of derivative instruments, such as Otter Tail Power Company (OTP) forward energy contracts, marked-to-market and realized gains and losses are recognized on a net basis in revenue in accordance with the Financial Accounting Standards Board (FASB) Accounting Standards Codification (ASC) Topic 815, Derivatives and Hedging. Gains and losses on forward energy contracts subject to regulatory treatment, if any, are deferred and recognized on a net basis in revenue in the period realized.
For the Company’s operating companies recognizing revenue on certain products when shipped, those operating companies have no further obligation to provide services related to such product. The shipping terms used in these instances are FOB shipping point.
The companies in the Construction segment enter into fixed-price construction contracts. Revenues under these contracts are recognized on a percentage-of-completion basis. The method used to determine the progress of completion is based on the ratio of costs incurred to total estimated costs on construction projects. Following are the percentages of the Company’s consolidated revenues recorded under the percentage-of-completion method:
|
Three Months Ended September 30,
|
Nine Months Ended September 30,
|
|||||||||||
|
2014
|
2013
|
2014
|
2013
|
|||||||||
|
Percentage-of-Completion Revenues
|
16.0% | 20.6% | 13.3% | 16.4% | ||||||||
The following table summarizes costs incurred and billings and estimated earnings recognized on uncompleted contracts:
|
September 30,
|
December 31,
|
|||||||
|
(in thousands)
|
2014
|
2013
|
||||||
|
Costs Incurred on Uncompleted Contracts
|
$ | 418,588 | $ | 361,487 | ||||
|
Less Billings to Date
|
(429,830 | ) | (377,608 | ) | ||||
|
Plus Estimated Earnings Recognized
|
15,005 | 6,477 | ||||||
|
Net Costs in Excess of Billings plus Estimated Earnings on Uncompleted Contracts
|
$ | 3,763 | $ | (9,644 | ) | |||
The following amounts are included in the Company’s consolidated balance sheets:
|
September 30,
|
December 31,
|
|||||||
|
(in thousands)
|
2014
|
2013
|
||||||
|
Costs and Estimated Earnings in Excess of Billings on Uncompleted Contracts
|
$ | 6,271 | $ | 4,063 | ||||
|
Billings in Excess of Costs and Estimated Earnings on Uncompleted Contracts
|
(2,508 | ) | (13,707 | ) | ||||
|
Net Costs in Excess of Billings plus Estimated Earnings on Uncompleted Contracts
|
$ | 3,763 | $ | (9,644 | ) | |||
| 7 |
The Company has a standard quarterly Estimate at Completion process in which management reviews the progress and performance of the Company’s contracts accounted for under percentage-of-completion accounting. As part of this process, management reviews include, but are not limited to, any outstanding key contract matters, progress towards completion and the related program schedule, identified risks and opportunities, and the related changes in estimates of revenues and costs. The risks and opportunities include management’s judgment about the ability and cost to achieve the schedule, technical requirements and other contract requirements. Management must make assumptions regarding labor productivity and availability, the complexity of the work to be performed, the availability of materials, the length of time to complete the contract, and performance by subcontractors, among other variables. Based on this analysis, any adjustments to net sales, costs of sales, and the related impact to operating income are recorded as necessary in the period they become known. These adjustments may result from positive program performance and an increase in operating profit during the performance of individual contracts if management determines it will be successful in mitigating risks surrounding the technical, schedule, and cost aspects of those contracts or realizing related opportunities. Likewise, these adjustments may result in a decrease in operating profit if management determines it will not be successful in mitigating these risks or realizing related opportunities. Changes in estimates of net sales, costs of sales, and the related impact to operating income are recognized using a cumulative catch-up, which recognizes, in the current period, the cumulative effect of the changes on current and prior periods based on a contract’s percent complete. A significant change in one or more of these estimates could affect the profitability of one or more of the Company’s contracts. If a loss is indicated at a point in time during a contract, a projected loss for the entire contract is estimated and recognized.
Warranty Reserves
The Company establishes reserves for estimated product warranty costs at the time revenue is recognized based on historical warranty experience and additionally for any known product warranty issues. Certain Company products carry one to fifteen year warranties. Although the Company engages in extensive product quality programs and processes, the Company’s warranty obligations have been and may in the future be affected by product failure rates, repair or field replacement costs and additional development costs incurred in correcting product failures. The warranty reserve balance as of December 31, 2013 and September 30, 2014 relates entirely to products produced by the Company’s former wind tower and waterfront equipment manufacturing companies and is included in liabilities of discontinued operations. See note 17 to consolidated financial statements.
Retainage
Accounts Receivable include the following amounts, billed under contracts by the Company’s construction subsidiaries, that have been retained by customers pending project completion:
|
September 30,
|
December 31,
|
|||||||
|
(in thousands)
|
2014
|
2013
|
||||||
|
Accounts Receivable Retained by Customers
|
$ | 7,854 | $ | 7,125 | ||||
Fair Value Measurements
The Company follows ASC Topic 820, Fair Value Measurements and Disclosures (ASC 820), for recurring fair value measurements. ASC 820 provides a single definition of fair value, requires enhanced disclosures about assets and liabilities measured at fair value and establishes a hierarchal framework for disclosing the observability of the inputs utilized in measuring assets and liabilities at fair value. The three levels defined by the hierarchy and examples of each level are as follows:
Level 1 – Quoted prices are available in active markets for identical assets or liabilities as of the reported date. The types of assets and liabilities included in Level 1 are highly liquid and actively traded instruments with quoted prices, such as equities listed by the New York Stock Exchange and commodity derivative contracts listed on the New York Mercantile Exchange (NYMEX).
Level 2 – Pricing inputs are other than quoted prices in active markets, but are either directly or indirectly observable as of the reported date. The types of assets and liabilities included in Level 2 are typically either comparable to actively traded securities or contracts, such as treasury securities with pricing interpolated from recent trades of similar securities, or priced with models using highly observable inputs, such as commodity options priced using observable forward prices and volatilities.
Level 3 – Significant inputs to pricing have little or no observability as of the reporting date. The types of assets and liabilities included in Level 3 are those with inputs requiring significant management judgment or estimation and may include complex and subjective models and forecasts.
| 8 |
The following tables present, for each of the hierarchy levels, the Company’s assets and liabilities that are measured at fair value on a recurring basis as of September 30, 2014 and December 31, 2013:
|
September 30, 2014 (in thousands)
|
Level 1
|
Level 2
|
Level 3
|
|||||||||
|
Assets:
|
||||||||||||
|
Current Assets – Other:
|
||||||||||||
|
Forward Energy Contracts
|
$ | -- | $ | -- | $ | 2,016 | ||||||
|
Money Market and Mutual Funds - Nonqualified Retirement Savings Plan
|
120 | |||||||||||
|
Investments:
|
||||||||||||
|
Corporate Debt Securities – Held by Captive Insurance Company
|
7,128 | |||||||||||
|
U.S. Government Debt Securities – Held by Captive Insurance Company
|
1,254 | |||||||||||
|
Other Assets:
|
||||||||||||
|
Money Market and Mutual Funds - Nonqualified Retirement Savings Plan
|
582 | |||||||||||
|
Total Assets
|
$ | 702 | $ | 8,382 | $ | 2,016 | ||||||
|
Liabilities:
|
||||||||||||
|
Derivative Liabilities - Forward Gasoline Purchase Contracts
|
$ | -- | $ | 37 | $ | -- | ||||||
|
Derivative Liabilities - Forward Energy Contracts
|
6,483 | |||||||||||
|
Total Liabilities
|
$ | -- | $ | 37 | $ | 6,483 | ||||||
|
December 31, 2013 (in thousands)
|
Level 1
|
Level 2
|
Level 3
|
|||||||||
|
Assets:
|
||||||||||||
|
Current Assets – Other:
|
||||||||||||
|
Forward Energy Contracts
|
$ | -- | $ | -- | $ | 338 | ||||||
|
Forward Gasoline Purchase Contracts
|
62 | |||||||||||
|
Money Market and Mutual Funds - Nonqualified Retirement Savings Plan
|
110 | |||||||||||
|
Investments:
|
||||||||||||
|
Corporate Debt Securities – Held by Captive Insurance Company
|
7,671 | |||||||||||
|
U.S. Government Debt Securities – Held by Captive Insurance Company
|
1,271 | |||||||||||
|
Other Assets:
|
||||||||||||
|
Money Market and Mutual Funds - Nonqualified Retirement Savings Plan
|
866 | |||||||||||
|
Total Assets
|
$ | 976 | $ | 9,004 | $ | 338 | ||||||
|
Liabilities:
|
||||||||||||
|
Derivative Liabilities - Forward Energy Contracts
|
$ | -- | $ | 103 | $ | 11,679 | ||||||
|
Total Liabilities
|
$ | -- | $ | 103 | $ | 11,679 | ||||||
The valuation techniques and inputs used for the Level 2 fair value measurements in the table above are as follows:
Forward Energy Contracts – Prices used for the fair valuation of these forward purchases and sales of electricity, which have illiquid trading points, are indexed to a price at an active market.
Forward Gasoline Purchase Contracts – These contracts are priced based on NYMEX quoted prices for Reformulated Blendstock for Oxygenate Blending (RBOB) Gasoline contracts. Prices used for the fair valuation of these contracts are based on NYMEX daily reporting date quoted prices for RBOB contracts with the same settlement periods.
Corporate and U.S. Government Debt Securities Held by the Company’s Captive Insurance Company – Fair values are determined on the basis of valuations provided by a third-party pricing service which utilizes industry accepted valuation models and observable market inputs to determine valuation. Some valuations or model inputs used by the pricing service may be based on broker quotes.
Fair values for OTP’s forward energy contracts with delivery points that are not at an active trading hub included in Level 3 of the fair value hierarchy in the table above as of September 30, 2014 and December 31, 2013, are based on prices indexed to observable prices at an active trading hub. Prices at illiquid trading points are based on a basis spread between that trading point and more liquid trading hub prices. These basis spreads are determined based on available market price information and the use of forward price curve models. The September 30, 2014 Level 3 forward electric basis spreads ranged from $1.58 to $7.25 per megawatt-hour under the active trading hub price. The weighted average price was $38.67 per megawatt-hour.
| 9 |
In the table above, the fair value of the Level 3 forward energy contracts in derivative asset and derivative liability positions as of September 30, 2014 are related to power purchase contracts where OTP intends to take or has taken physical delivery of the energy under the contract. When OTP takes physical delivery of the energy purchased under these contracts the costs incurred are subject to recovery in base rates and through fuel clause adjustments. Any derivative assets or liabilities and related gains or losses recorded as a result of the fair valuation of these power purchase contracts will not be realized and are 100% offset by regulatory liabilities and assets related to fuel clause adjustment treatment of purchased power costs. Therefore, the net impact of any recorded fair valuation gains or losses related to these contracts on the Company’s consolidated net income is $0 and the net income impact of any future fair valuation adjustments of these contracts will be $0. When energy is delivered under these contracts, they will be settled at the original contract price and any fair valuation gains or losses and related derivative assets or liabilities recorded over the life of the contracts will be reversed along with any offsetting regulatory liabilities or assets. Because of regulatory accounting treatment, any price volatility related to the fair valuation of these contracts had no impact on the Company’s reported consolidated net income for the three and nine month periods ended September 30, 2014 and 2013.
The following table presents changes in Level 3 forward energy contract derivative asset and liability fair valuations for the nine-month periods ended September 30, 2014 and 2013:
|
Nine Months Ended
|
||||||||
|
September 30,
|
||||||||
|
(in thousands)
|
2014
|
2013
|
||||||
|
Forward Energy Contracts - Fair Values Beginning of Period
|
$ | (11,341 | ) | $ | (17,782 | ) | ||
|
Less: Amounts Reversed on Settlement of Contracts Entered into in Prior Periods
|
1,252 | 5,066 | ||||||
|
Changes in Fair Value of Contracts Entered into in Prior Periods
|
5,622 | 325 | ||||||
|
Cumulative Fair Value Adjustments of Contracts Entered into in Prior Years at End of Period
|
(4,467 | ) | (12,391 | ) | ||||
|
Net Change in Value of Open Contracts Entered into in Current Period
|
-- | -- | ||||||
|
Forward Energy Contracts - Net Derivative Liability Fair Values End of Period
|
$ | (4,467 | ) | $ | (12,391 | ) | ||
Inventories
Inventories consist of the following:
|
September 30,
|
December 31,
|
|||||||
|
(in thousands)
|
2014
|
2013
|
||||||
|
Finished Goods
|
$ | 22,177 | $ | 20,649 | ||||
|
Work in Process
|
12,193 | 9,942 | ||||||
|
Raw Material, Fuel and Supplies
|
44,569 | 42,090 | ||||||
|
Total Inventories
|
$ | 78,939 | $ | 72,681 | ||||
Goodwill and Other Intangible Assets
In the first quarter of 2014, Aevenia, Inc. (Aevenia) recorded a $289,000 gain on the sale of its data communication installation and services business which, over the years of its existence, did not provide a materially significant impact to Aevenia’s operating results. In connection with this sale, Aevenia disposed of $163,000 in goodwill associated with the purchase of this business in May 2004.
The following table summarizes changes to goodwill by business segment during 2014:
|
(in thousands)
|
Gross Balance
December 31,
2013
|
Accumulated Impairments
|
Balance (net of impairments)
December 31,
2013
|
Adjustments
to Goodwill
in 2014
|
Balance (net of impairments)
September 30,
2014
|
|||||||||||||||
|
Manufacturing
|
$ | 12,186 | $ | -- | $ | 12,186 | $ | -- | $ | 12,186 | ||||||||||
|
Plastics
|
19,302 | -- | 19,302 | -- | 19,302 | |||||||||||||||
|
Construction
|
7,483 | -- | 7,483 | 163 | 7,320 | |||||||||||||||
|
Total
|
$ | 38,971 | $ | -- | $ | 38,971 | $ | 163 | $ | 38,808 | ||||||||||
| 10 |
Intangible assets with finite lives are amortized over their estimated useful lives and reviewed for impairment in accordance with requirements under ASC 360-10-35, Property, Plant, and Equipment—Overall—Subsequent Measurement. The following table summarizes the components of the Company’s intangible assets at September 30, 2014 and December 31, 2013:
|
September 30, 2014 (in thousands)
|
Gross Carrying Amount
|
Accumulated Amortization
|
Net Carrying
Amount
|
Remaining
Amortization
Periods
|
|||||||||
|
Amortizable Intangible Assets:
|
|||||||||||||
|
Customer Relationships
|
$ | 16,811 | $ | 5,572 | $ | 11,239 |
63-163 months
|
||||||
|
Other Intangible Assets
|
639 | 383 | 256 |
24 months
|
|||||||||
|
Total
|
$ | 17,450 | $ | 5,955 | $ | 11,495 | |||||||
|
Indefinite-Lived Intangible Assets:
|
|||||||||||||
|
Trade Name
|
$ | 1,100 | -- | $ | 1,100 | ||||||||
|
December 31, 2013 (in thousands)
|
|||||||||||||
|
Amortizable Intangible Assets:
|
|||||||||||||
|
Customer Relationships
|
$ | 16,811 | $ | 4,935 | $ | 11,876 |
72-172 months
|
||||||
|
Other Intangible Assets Including Contracts
|
825 | 473 | 352 |
33 months
|
|||||||||
|
Total
|
$ | 17,636 | $ | 5,408 | $ | 12,228 | |||||||
|
Indefinite-Lived Intangible Assets:
|
|||||||||||||
|
Trade Name
|
$ | 1,100 | -- | $ | 1,100 | ||||||||
The amortization expense for these intangible assets was:
|
Three Months Ended
|
Nine Months Ended
|
|||||||||||||||
|
September 30,
|
September 30,
|
|||||||||||||||
|
(in thousands)
|
2014
|
2013
|
2014
|
2013
|
||||||||||||
|
Amortization Expense – Intangible Assets
|
$ | 245 | $ | 245 | $ | 733 | $ | 733 | ||||||||
The estimated annual amortization expense for these intangible assets for the next five years is:
|
(in thousands)
|
2014
|
2015
|
2016
|
2017
|
2018
|
|||||||||||||||
|
Estimated Amortization Expense – Intangible Assets
|
$ | 977 | $ | 977 | $ | 945 | $ | 849 | $ | 849 | ||||||||||
Supplemental Disclosures of Cash Flow Information
|
As of September 30,
|
||||||||
|
(in thousands)
|
2014
|
2013
|
||||||
|
Noncash Investing Activities:
|
||||||||
|
Accounts Payable Outstanding Related to Capital Additions1
|
$ | 21,512 | $ | 25,133 | ||||
|
Accounts Receivable Outstanding Related to Joint Plant Owner’s Share of Capital Additions2
|
$ | 5,058 | $ | 5,172 | ||||
|
1Amounts are included in cash used for capital expenditures in subsequent periods when payables are settled.
2Amounts are deducted from cash used for capital expenditures in subsequent periods when cash is received.
|
||||||||
| 11 |
Coyote Station Lignite Supply Agreement – Variable Interest Entity
In October 2012, the Coyote Station owners, including OTP, entered into a lignite sales agreement (LSA) with Coyote Creek Mining Company, L.L.C. (CCMC), a subsidiary of The North American Coal Corporation, for the purchase of coal to meet the coal supply requirements of Coyote Station for the period beginning in May 2016 and ending in December 2040. The price per ton to be paid by the Coyote Station owners under the LSA will reflect the cost of production, along with an agreed profit and capital charge. CCMC was formed for the purpose of mining lignite coal to meet the coal fuel supply requirements of Coyote Station from May 2016 through December 2040 and, based on the terms of the LSA, is considered a variable interest entity (VIE) due to the transfer of all operating and economic risk to the Coyote Station owners, as the agreement is structured so that the price of the coal would cover all costs of operations as well as future reclamation costs. The Coyote Station owners are also providing a guarantee of the value of the assets of CCMC as they would be required to buy the assets at book value should they terminate the contract prior to the end of the contract term and are providing a guarantee of the value of the equity of CCMC in that they are required to buy the entity at the end of the contract term at equity value. Under current accounting standards, the primary beneficiary of a VIE is required to include the assets, liabilities, results of operations and cash flows of the VIE in its consolidated financial statements. No single owner of Coyote Station owns a majority interest in Coyote Station and none, individually, has the power to direct the activities that most significantly impact CCMC. Therefore, none of the owners individually, including OTP, is considered a primary beneficiary of the VIE and CCMC is not required to be consolidated in the Company’s consolidated financial statements.
Under the LSA, all development period costs of the Coyote Creek coal mine incurred during the development period will be recovered from the Coyote Station owners over the full term of the production period, which commences with the first delivery of coal to Coyote Station, scheduled for May 2016, by being included in the cost of production. The development fee and the capital charge incurred during the development period will be recovered from the Coyote Station owners over the first 52 months of the production period by being included in the cost of production during those months. OTP’s 35% share of development period costs, development fees and capital charges incurred by CCMC through September 30, 2014 is $16.2 million. In the event the contract is terminated because regulations or legislation render the burning of coal cost prohibitive and the assets worthless, OTP’s maximum exposure to loss as a result of its involvement with CCMC as of September 30, 2014 could be as high as $16.2 million.
Revisions to Presentation
Beginning with the Company’s 2013 Annual Report on Form 10-K, the Company is reporting revenues and costs related to the sale of products by its manufacturing and plastic pipe companies separately from the revenues and costs of its construction companies on the face of its consolidated statements of income. Its nonelectric revenues and cost of goods sold for the three and nine month periods ended September 30, 2013 have been revised in a similar manner to be consistent with, and comparable to, the presentation of revenues and costs for the three and nine month periods ended September 30, 2014. The change in presentation of 2013 nonelectric revenues and cost of goods sold had no effect on the Company’s reported consolidated revenues, costs, operating income or net income for the three and nine month periods ended September 30, 2013.
New Accounting Standards
Accounting Standards Update (ASU) 2013-11
In July 2013, the FASB issued ASU 2013-11, Income Taxes (Topic 740) (ASC 740), Presentation of an Unrecognized Tax Benefit When a Net Operating Loss Carryforward, a Similar Tax Loss, or a Tax Credit Carryforward Exists, which requires an entity with unrecognized tax benefits to present the unrecognized tax benefits as a reduction to a deferred tax asset related to a net operating loss carryforward, a similar tax loss, or a tax credit carryforward when such net operating loss carryforward, similar tax loss, or tax credit carryforward is available at the reporting date under the tax law of the applicable jurisdiction to settle any additional income taxes that would result from the disallowance of a tax position. The ASU 2013-11 amendments to ASC 740 are effective for fiscal years beginning after December 15, 2013. The Company adopted the reporting requirements in ASU 2013-11 in the first quarter of 2014 on a prospective basis and transferred $4.3 million of unrecognized tax benefits from other long-term liabilities to long-term deferred income taxes.
ASU 2014-09
In May 2014, the FASB issued ASU 2014-09, Revenue from Contracts with Customers (Topic 606) (ASC 606). ASC 606 is a comprehensive, principles-based accounting standard which amends current revenue recognition guidance with the objective of improving revenue recognition requirements by providing a single comprehensive model to determine the measurement of revenue and the timing of revenue recognition. ASC 606 also requires expanded disclosures to enable users of financial statements to understand the nature, amount, timing and uncertainty of revenue and cash flows arising from contracts with customers.
| 12 |
ASU 2014-09 amendments to the ASC are effective for fiscal years beginning after December 15, 2016. Application methods permitted are: (1) full retrospective, (2) retrospective using one or more practical expedients and (3) retrospective with the cumulative effect of initial application recognized at the date of initial application. Early application of the ASU amendments is not permitted. The Company is currently reviewing ASU 2014-09, identifying key impacts to its businesses, reviewing revenue streams and contracts to determine areas where the amendments in ASU 2014-09 will be applicable and evaluating transition options.
2. Segment Information
The Company’s businesses have been classified into four segments to be consistent with its business strategy and the reporting and review process used by the Company’s chief operating decision makers. These businesses sell products and provide services to customers primarily in the United States. The four segments are: Electric, Manufacturing, Plastics and Construction.
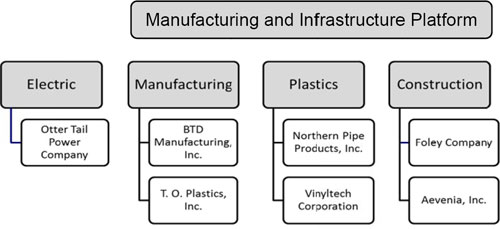
Electric includes the production, transmission, distribution and sale of electric energy in Minnesota, North Dakota and South Dakota by OTP. In addition, OTP is an active wholesale participant in the Midcontinent Independent System Operator, Inc. (MISO) markets. OTP’s operations have been the Company’s primary business since 1907.
Manufacturing consists of businesses in the following manufacturing activities: contract machining, metal parts stamping and fabrication, and production of material and handling trays, horticultural containers and produce packaging. These businesses have manufacturing facilities in Illinois and Minnesota and sell products primarily in the United States.
Plastics consists of businesses producing polyvinyl chloride (PVC) pipe at plants in North Dakota and Arizona. The PVC pipe is sold primarily in the upper Midwest and Southwest regions of the United States.
Construction consists of businesses involved in commercial and industrial electric contracting and construction of fiber optic, electric distribution, water, wastewater and HVAC systems primarily in the central United States.
OTP is a wholly owned subsidiary of the Company. All of the Company’s other businesses are owned by its wholly owned subsidiary, Varistar Corporation (Varistar). The Company’s corporate operating costs include items such as corporate staff and overhead costs, the results of the Company’s captive insurance company and other items excluded from the measurement of operating segment performance. Corporate assets consist primarily of cash, prepaid expenses, investments and fixed assets. Corporate is not an operating segment. Rather, it is added to operating segment totals to reconcile to totals on the Company’s consolidated financial statements.
No single customer accounted for over 10% of the Company’s consolidated revenues in 2013. All of the Company’s long-lived assets are within the United States.
| 13 |
The following table presents the percent of consolidated sales revenue by country:
|
Three Months Ended September 30,
|
Nine Months Ended September 30,
|
|||||||||||||||
|
2014
|
2013
|
2014
|
2013
|
|||||||||||||
|
United States of America
|
95.9 | % | 97.7 | % | 96.5 | % | 97.7 | % | ||||||||
|
Mexico
|
3.0 | % | 1.5 | % | 2.5 | % | 1.3 | % | ||||||||
|
Canada
|
1.0 | % | 0.7 | % | 0.9 | % | 0.9 | % | ||||||||
|
All Other Countries (none greater than 0.05%)
|
0.1 | % | 0.1 | % | 0.1 | % | 0.1 | % | ||||||||
The Company evaluates the performance of its business segments and allocates resources to them based on earnings contribution and return on total invested capital. Information for the business segments for the three and nine months ended September 30, 2014 and 2013 and total assets by business segment as of September 30, 2014 and December 31, 2013 are presented in the following tables:
Operating Revenue
|
Three Months Ended
|
Nine Months Ended
|
|||||||||||||||
|
September 30,
|
September 30,
|
|||||||||||||||
|
(in thousands)
|
2014
|
2013
|
2014
|
2013
|
||||||||||||
|
Electric
|
$ | 89,410 | $ | 86,283 | $ | 301,409 | $ | 270,155 | ||||||||
|
Manufacturing
|
55,536 | 49,323 | 164,341 | 152,282 | ||||||||||||
|
Plastics
|
51,613 | 46,659 | 140,186 | 128,820 | ||||||||||||
|
Construction
|
45,846 | 47,509 | 111,599 | 108,928 | ||||||||||||
|
Intersegment Eliminations
|
(34 | ) | (6 | ) | (81 | ) | (74 | ) | ||||||||
|
Total
|
$ | 242,371 | $ | 229,768 | $ | 717,454 | $ | 660,111 | ||||||||
Interest Charges
|
Three Months Ended
|
Nine Months Ended
|
|||||||||||||||
|
September 30,
|
September 30,
|
|||||||||||||||
|
(in thousands)
|
2014
|
2013
|
2014
|
2013
|
||||||||||||
|
Electric
|
$ | 6,071 | $ | 3,960 | $ | 17,209 | $ | 13,032 | ||||||||
|
Manufacturing
|
812 | 816 | 2,433 | 2,447 | ||||||||||||
|
Plastics
|
276 | 249 | 797 | 753 | ||||||||||||
|
Construction
|
220 | 128 | 489 | 345 | ||||||||||||
|
Corporate and Intersegment Eliminations
|
308 | 1,421 | 981 | 3,854 | ||||||||||||
|
Total
|
$ | 7,687 | $ | 6,574 | $ | 21,909 | $ | 20,431 | ||||||||
Income Taxes
|
Three Months Ended
|
Nine Months Ended
|
|||||||||||||||
|
September 30,
|
September 30,
|
|||||||||||||||
|
(in thousands)
|
2014
|
2013
|
2014
|
2013
|
||||||||||||
|
Electric
|
$ | 1,714 | $ | 2,565 | $ | 6,472 | $ | 5,830 | ||||||||
|
Manufacturing
|
1,164 | 1,124 | 4,171 | 4,715 | ||||||||||||
|
Plastics
|
1,888 | 2,278 | 6,135 | 7,508 | ||||||||||||
|
Construction
|
1,137 | 1,193 | 1,966 | 490 | ||||||||||||
|
Corporate
|
(427 | ) | (2,027 | ) | (3,494 | ) | (5,430 | ) | ||||||||
|
Total
|
$ | 5,476 | $ | 5,133 | $ | 15,250 | $ | 13,113 | ||||||||
| 14 |
Earnings (Loss) Available for Common Shares
|
Three Months Ended
|
Nine Months Ended
|
|||||||||||||||
|
September 30,
|
September 30,
|
|||||||||||||||
|
(in thousands)
|
2014
|
2013
|
2014
|
2013
|
||||||||||||
|
Electric
|
$ | 8,612 | $ | 8,787 | $ | 30,507 | $ | 24,301 | ||||||||
|
Manufacturing
|
2,899 | 2,970 | 8,095 | 8,333 | ||||||||||||
|
Plastics
|
3,092 | 3,403 | 9,985 | 11,215 | ||||||||||||
|
Construction
|
2,205 | 1,784 | 3,438 | 716 | ||||||||||||
|
Corporate
|
(1,155 | ) | (2,118 | ) | (5,026 | ) | (7,514 | ) | ||||||||
|
Discontinued Operations
|
172 | 312 | 249 | 638 | ||||||||||||
|
Total
|
$ | 15,825 | $ | 15,138 | $ | 47,248 | $ | 37,689 | ||||||||
Identifiable Assets
|
September 30,
|
December 31,
|
|||||||
|
(in thousands)
|
2014
|
2013
|
||||||
|
Electric
|
$ | 1,380,563 | $ | 1,290,416 | ||||
|
Manufacturing
|
127,534 | 119,302 | ||||||
|
Plastics
|
90,217 | 76,853 | ||||||
|
Construction
|
60,704 | 49,440 | ||||||
|
Corporate
|
55,257 | 59,970 | ||||||
|
Discontinued Operations
|
10 | 38 | ||||||
|
Total
|
$ | 1,714,285 | $ | 1,596,019 | ||||
3. Rate and Regulatory Matters
Below are descriptions of OTP’s major capital expenditure projects that have had, or will have, a significant impact on OTP’s revenue requirements, rates and alternative revenue recovery mechanisms, followed by summaries of specific electric rate or rider proceedings with the Minnesota Public Utilities Commission (MPUC), the North Dakota Public Service Commission (NDPSC), the South Dakota Public Utilities Commission (SDPUC) and the Federal Energy Regulatory Commission (FERC), impacting OTP’s revenues in 2014 and 2013.
Major Capital Expenditure Projects
Multi-Value Transmission Projects—On December 16, 2010, FERC approved the cost allocation for a new classification of projects in the MISO region called Multi-Value Projects (MVP). MVPs are designed to enable the region to comply with energy policy mandates and to address reliability and economic issues affecting multiple areas within the MISO region. The cost allocation is designed to ensure that the costs of transmission projects with regional benefits are properly assigned to those who benefit. Effective January 1, 2012, the FERC authorized OTP to recover 100% of prudently incurred Construction Work in Progress (CWIP) and Abandoned Plant recovery on two projects approved by MISO as MVPs in MISO’s 2011 Transmission Expansion Plan: the Big Stone South – Brookings MVP and the Big Stone South – Ellendale MVP. Abandoned Plant recovery provides a basis for OTP to request recovery of prudently incurred costs in the event a project is cancelled for reasons beyond OTP’s control. The following projects have been approved by MISO as MVPs under the MISO Open Access Transmission, Energy and Operating Reserve Markets Tariff (Tariff).
The Big Stone South – Brookings Project—This is a planned 345 kiloVolt (kV) transmission line that will extend approximately 70 miles between a proposed substation near Big Stone City, South Dakota and the Brookings County Substation near Brookings, South Dakota. OTP and Xcel Energy jointly developed this project. MISO approved this project as an MVP under the MISO Tariff in December 2011. A Notice of Intent to Construct Facilities (NICF) was filed with the SDPUC on February 29, 2012. The SDPUC approved the certification for the northern portion of the route on April 9, 2013. The SDPUC granted OTP and Xcel Energy approval of a route permit for the southern portion of the Big Stone South - Brookings line on February 18, 2014. On August 1, 2014 OTP and Xcel Energy entered into agreements to construct the project. This line is expected to be in service in 2017.
| 15 |
The Big Stone South – Ellendale Project—This is a proposed 345 kV transmission line that will extend 160 to 170 miles between a proposed substation near Big Stone City, South Dakota and a proposed substation near Ellendale, North Dakota. OTP is jointly developing this project with Montana-Dakota Utilities Co., a Division of MDU Resources Group, Inc. (MDU). MISO approved this project as an MVP under the MISO Tariff in December 2011. OTP and MDU jointly filed an NICF with the SDPUC in March of 2012. On August 25, 2013 the NDPSC granted Certificates of Public Convenience and Necessity to OTP and MDU for ten miles of the proposed line to be built in North Dakota. On July 10, 2014 the NDPSC approved a Certificate of Corridor Compatibility and a route permit for the North Dakota section of the proposed line. On August 22, 2014 the SDPUC issued an order approving the route permit for the South Dakota section of the proposed line.
Capacity Expansion 2020 (CapX2020) Transmission Line Projects—CapX2020 is a joint initiative of eleven investor-owned, cooperative, and municipal utilities in Minnesota and the surrounding region to upgrade and expand the electric transmission grid to ensure continued reliable and affordable service. The CapX2020 companies identified four major transmission projects for the region: (1) the Fargo–Monticello 345 kV Project (the Fargo Project), (2) the Brookings–Southeast Twin Cities 345 kV Project (the Brookings Project), (3) the Bemidji–Grand Rapids 230 kV Project (the Bemidji Project), and (4) the Twin Cities–LaCrosse 345 kV Project. OTP is an investor in the Fargo Project, the Brookings Project and the Bemidji Project. Recovery of OTP’s CapX2020 transmission investments is through the MISO Tariff (the Brookings Project as an MVP) and, currently, Minnesota, North Dakota and South Dakota Transmission Cost Recovery (TCR) Riders.
The Fargo Project—The Monticello to St. Cloud portion of the Fargo Project was placed into service on December 21, 2011. The St. Cloud to Alexandria portion of the Fargo Project was placed into service on April 23, 2014. Construction is underway for the remaining portion of the project, which is expected to be in service in 2015.
The Brookings Project—The MISO granted unconditional approval of the Brookings Project as an MVP under the MISO Tariff in December 2011. The first phase of the 250 mile Brookings Project was energized in March 2014. Additional segments of the line were energized in April 2014. The entire project is expected to be in service in 2015.
The Bemidji Project—The Bemidji-Grand Rapids transmission line was fully energized and put into service on September 17, 2012.
Big Stone Plant Air Quality Control System (AQCS)—The South Dakota Department of Environment and Natural Resources (DENR) determined that the Big Stone Plant is subject to Best-Available Retrofit Technology (BART) requirements of the Clean Air Act (CAA), based on air dispersion modeling indicating that Big Stone Plant’s emissions reasonably contribute to visibility impairment in national parks and wilderness areas in Minnesota, North Dakota, South Dakota and Michigan.
OTP is currently in the process of constructing the BART-compliant AQCS at Big Stone Plant for a current projected cost of approximately $384 million (OTP’s 53.9% share would be $207 million) with an expected commercial operation date of October 2015. OTP’s share of AQCS construction expenditures incurred through September 30, 2014 is $143 million.
Big Stone II Project—On June 30, 2005 OTP and a coalition of six other electric providers entered into several agreements for the development of a second electric generating unit, named Big Stone II, at the site of the existing Big Stone Plant near Milbank, South Dakota. On September 11, 2009 OTP announced its withdrawal—both as a participating utility and as the project’s lead developer—from Big Stone II. On November 2, 2009, the remaining Big Stone II participants announced the cancellation of the Big Stone II project. OTP requested jurisdictional recovery in Minnesota, North Dakota and South Dakota of amounts it had invested in the Big Stone II Project at the time of its withdrawal, discussed below under the respective jurisdictional sections of this note.
Minnesota
2010 General Rate Case—OTP’s most recent general rate increase in Minnesota of approximately $5.0 million, or 1.6%, was granted by the MPUC in an order issued on April 25, 2011 and effective October 1, 2011. The MPUC’s written order included: (1) recovery of Big Stone II costs over five years, (2) moving recovery of wind farm assets from rider recovery to base rate recovery, (3) transfer of a portion of Minnesota Conservation Improvement Program (MNCIP) costs from rider recovery to base rate recovery, (4) transfer of the investment in two transmission lines from rider recovery to base rate recovery, and (5) changing the mechanism for providing customers with a credit for margins earned on asset-based wholesale sales of electricity from a credit to base rates to a credit to the Minnesota Fuel Clause Adjustment.
| 16 |
Renewable Energy Standards, Conservation, Renewable Resource Riders—Minnesota has a renewable energy standard which requires OTP to generate or procure sufficient renewable generation such that the following percentages of total retail electric sales to Minnesota customers come from qualifying renewable sources: 17% by 2016; 20% by 2020 and 25% by 2025. In addition, a standard established by the 2013 legislature requires 1.5% of total electric sales to be supplied by solar energy by the year 2020. OTP is currently evaluating potential options for meeting that standard. Under certain circumstances and after consideration of costs and reliability issues, the MPUC may modify or delay implementation of the standards. OTP has acquired renewable resources and expects to acquire additional renewable resources in order to maintain compliance with Minnesota renewable energy standards. OTP’s compliance with the Minnesota renewable energy standard will be measured through the Midwest Renewable Energy Tracking System.
Under the Next Generation Energy Act of 2007, an automatic adjustment mechanism was established to allow Minnesota electric utilities to recover investments and costs incurred to satisfy the requirements of the renewable energy standard. The MPUC is authorized to approve a rate schedule rider to enable utilities to recover the costs of qualifying renewable energy projects that supply renewable energy to Minnesota customers. Cost recovery for qualifying renewable energy projects can be authorized outside of a rate case proceeding, provided that such renewable projects have received previous MPUC approval. Renewable resource costs eligible for recovery may include return on investment, depreciation, operation and maintenance costs, taxes, renewable energy delivery costs and other related expenses.
The costs for three major wind farms previously approved by the MPUC for recovery through OTP’s Minnesota Renewable Resource Adjustment (MNRRA) were moved to base rates as of October 1, 2011 under the MPUC’s April 25, 2011 general rate case order with the exception of the remaining balance of the MNRRA regulatory asset. The MNRRA rate continued to collect the remaining regulatory asset balance through April 30, 2013, when the balance was near zero. On April 4, 2013 the MPUC authorized that any remaining unrecovered balance be retained as a regulatory asset to be recovered in OTP’s next general rate case. Effective May 1, 2013 the resource adjustment on OTP’s Minnesota customers’ bills no longer includes MNRRA costs.
Minnesota Conservation Improvement Programs (MNCIP)—Under Minnesota law, every regulated public utility that furnishes electric service must make annual investments and expenditures in energy conservation improvements, or make a contribution to the state’s energy and conservation account, in an amount equal to at least 1.5% of its gross operating revenues from service provided in Minnesota. The Next Generation Energy Act of 2007 transitioned from a conservation spending goal to a conservation energy savings goal in 2010.
The Minnesota Department of Commerce (MNDOC) may require a utility to make investments and expenditures in energy conservation improvements whenever it finds that the improvement will result in energy savings at a total cost to the utility less than the cost to the utility to produce or purchase an equivalent amount of a new supply of energy. Such MNDOC orders can be appealed to the MPUC. Investments made pursuant to such orders generally are recoverable costs in rate cases, even though ownership of the improvement may belong to the property owner rather than the utility. OTP recovers conservation related costs not included in base rates under the MNCIP through the use of an annual recovery mechanism approved by the MPUC.
In December 2012, the MPUC ordered a change in the MNCIP cost recovery methodology used by OTP from a percentage of a customer’s bill to an amount per kilowatt-hour (kwh) consumed. On January 1, 2013 OTP’s MNCIP surcharge decreased from 3.8% of the customer’s bill to $0.00142 per kwh, which equates to approximately 1.9% of a customer’s bill. On October 10, 2013 the MPUC approved OTP’s 2012 financial incentive request for $2.7 million as well as its request for an updated surcharge rate to be implemented on November 1, 2013. OTP recognized $3.9 million in MNCIP financial incentives in 2013 related to the results of its conservation improvement programs in Minnesota in 2013. On April 1, 2014 OTP submitted its annual 2013 financial incentive filing request for $4.0 million along with a request for an updated surcharge rate. On September 26, 2014 the MPUC approved OTP’s 2013 financial incentive request for $4.0 million, an updated surcharge rate to be effective October 1, 2014, as well as a change to the carrying charge to be equal to the short term cost of debt set in OTP’s most recent general rate case.
OTP had a regulatory asset of $7.2 million for allowable costs and financial incentives eligible for recovery through the MNCIP rider that had not been billed to Minnesota customers as of September 30, 2014. OTP recognized revenue for Minnesota conservation costs and incentives earned totaling $1.3 million in the three month period ended September 30, 2014, compared with $1.5 million in the three month period ended September 30, 2013, and $4.3 million in the nine month period ended September 30, 2014, compared with $4.8 million in the nine month period ended September 30, 2013.
| 17 |
Transmission Cost Recovery (TCR) Rider—In addition to the MNRRA rider, the Minnesota Public Utilities Act (the Act) provides a similar mechanism for automatic adjustment outside of a general rate proceeding to recover the costs of new transmission facilities that have been previously approved by the MPUC in a Certificate of Need (CON) proceeding, certified by the MPUC as a Minnesota priority transmission project, made to transmit the electricity generated from renewable generation sources ultimately used to provide service to the utility’s retail customers, or exempt from the requirement to obtain a Minnesota CON. The MPUC may also authorize cost recovery via such TCR riders for charges incurred by a utility under a federally approved tariff that accrue from other transmission owners’ regionally planned transmission projects that have been determined by the MISO to benefit the utility or integrated transmission system. The Act also authorizes TCR riders to recover the costs of new transmission facilities approved by the regulatory commission of the state in which the new transmission facilities are to be constructed, to the extent approval is required by the laws of that state, and determined by the MISO to benefit the utility or integrated transmission system. Such TCR riders allow a return on investment at the level approved in a utility’s last general rate case. Additionally, following approval of the rate schedule, the MPUC may approve annual rate adjustments filed pursuant to the rate schedule. OTP’s initial request for approval of a TCR rider was granted by the MPUC on January 7, 2010, and became effective February 1, 2010.
MISO regional cost allocation allows OTP to recover some of the costs of its transmission investment from other MISO customers. On March 26, 2012 the MPUC approved an update to OTP’s Minnesota TCR rider along with an all-in method for MISO regional cost allocations in which OTP’s retail customers would be responsible for the entire investment OTP made in transmission facilities that qualify for regional cost allocation under the MISO Tariff, with an offsetting credit for revenues received from other MISO utilities under the MISO Tariff for projects included in the TCR. OTP’s updated Minnesota TCR rider went into effect April 1, 2012.
On May 24, 2012 OTP filed a petition with the MPUC to seek a determination of eligibility for the inclusion of twelve additional transmission related projects in subsequent Minnesota TCR rider filings. On February 20, 2013 the MPUC approved three of the additional projects as eligible for recovery through the TCR rider. OTP filed its annual update to the TCR rider on February 7, 2013 to include the three new projects as well as updated costs associated with existing projects. In a written order issued on March 10, 2014, the MPUC approved OTP’s 2013 TCR rider update but disallowed recovery of capitalized internal costs, costs in excess of CON estimates and a carrying charge in the TCR rider. These items were removed from OTP’s Minnesota TCR rider effective March 1, 2014. OTP will be allowed to seek recovery of these costs in a future rate case. In response to the MPUC approval of OTP’s annual TCR update, OTP submitted a compliance filing in April 2014 reflecting the TCR rider revenue requirements changes relating to the MPUC’s ruling and requesting no rate change be implemented at the time. The MPUC approved OTP’s compliance filing on June 19, 2014. OTP filed its 2014 annual update on May 1, 2014. The MNDOC issued comments on the 2014 update on August 22, 2014.
OTP had a regulatory asset of $2.7 million for amounts eligible for recovery through the Minnesota TCR rider that had not been billed to Minnesota customers as of September 30, 2014. OTP recognized revenue for amounts eligible for recovery through the Minnesota TCR rider of $1.1 million in the three month period ended September 30, 2014, compared with $0.5 million in the three month period ended September 30, 2013, and $5.2 million in the nine month period ended September 30, 2014, compared with $2.7 million in the nine month period ended September 30, 2013.
Environmental Cost Recovery (ECR) Rider—In a written order issued on January 23, 2012 the MPUC granted OTP’s petition for Advance Determination of Prudence (ADP) for costs associated with the design, construction and operation of the BART-compliant AQCS at Big Stone Plant attributable to serving OTP’s Minnesota customers. On May 24, 2013 legislation was enacted in Minnesota which allowed OTP to file an emission-reduction rider for recovery of the revenue requirements of the AQCS. The legislation authorizes the rider to allow a current return on investment (including CWIP) at the level approved in OTP’s most recent general rate case, unless a different return is determined by the MPUC to be in the public interest. On December 18, 2013 the MPUC granted approval of OTP’s Minnesota ECR rider for recovery of OTP’s Minnesota jurisdictional share of the revenue requirements of its investment in the Big Stone Plant AQCS effective January 1, 2014. The ECR rider recoverable revenue requirements include a current return on the project’s CWIP balance at the level approved in OTP’s most recent general rate case. The rate charged to customers will be updated in an annual filing with the MPUC until the costs are rolled into base rates at an undetermined future date. OTP filed its 2014 annual update on July 31, 2014. The MNDOC filed its comments recommending approval on October 17, 2014. The 2014 annual update is pending approval from the MPUC.
OTP had a regulatory asset of $0.5 million for amounts eligible for recovery through the Minnesota ECR rider that had not been billed to Minnesota customers as of September 30, 2014. OTP recognized revenue for amounts eligible for recovery through the Minnesota ECR rider in the three and nine month periods ended September 30, 2014 of $1.7 million and $5.2 million, respectively.
| 18 |
Big Stone II Cost Recovery—OTP requested recovery of the Minnesota portion of its Big Stone II development costs over a five-year period as part of its general rate case filed in Minnesota on April 2, 2010. In a written order issued on April 25, 2011, the MPUC authorized recovery of the Minnesota portion of Big Stone II generation development costs from Minnesota ratepayers over a 60-month recovery period which began on October 1, 2011. The amount of Big Stone II generation costs incurred by OTP that were deemed recoverable from Minnesota ratepayers as part of the rates established in that proceeding was $3.2 million. Because OTP will not earn a return on these deferred costs over the 60-month recovery period, the recoverable amount of $3.2 million was discounted to its present value of $2.8 million using OTP’s incremental borrowing rate, in accordance with ASC Topic 980, Regulated Operations (ASC 980), accounting requirements. Transmission-related project costs of $3.2 million remained in CWIP as active project costs.
Approximately $0.4 million of the total Minnesota jurisdictional share of Big Stone II transmission costs were transferred to the Big Stone South - Brookings MVP in the first quarter of 2013. The remaining transmission costs, along with accumulated Allowance for Funds Used During Construction (AFUDC), were transferred from CWIP to the Big Stone II Unrecovered Project Costs – Minnesota regulatory asset account in May 2013, based on recovery granted in the April 25, 2011 order. Because OTP will not earn a return on these deferred costs over their anticipated recovery period, the recoverable amount of approximately $3.5 million was discounted to its present value using OTP’s incremental borrowing rate. In May 2013, OTP recorded a charge of $0.7 million related to the discount in accordance with ASC 980 accounting requirements. In June 2014, OTP recorded an additional discount of $0.3 million to reflect changes in the end date of the anticipated recovery period from September 2020 to December 2022.
North Dakota
General Rates—OTP’s most recent general rate increase in North Dakota of $3.6 million, or approximately 3.0%, was granted by the NDPSC in an order issued on November 25, 2009 and effective December 2009.
Renewable Resource Adjustment—OTP has a North Dakota Renewable Resource Adjustment (NDRRA) which enables OTP to recover the North Dakota share of its investments in renewable energy facilities it owns in North Dakota. This rider allows OTP to recover costs associated with new renewable energy projects as they are completed. On March 21, 2012 the NDPSC approved an update to OTP’s NDRRA effective April 1, 2012. The updated NDRRA recovered $9.9 million over the period April 1, 2012 through March 31, 2013. On December 28, 2012 OTP submitted its annual update to the NDRRA with a proposed effective date of April 1, 2013. The update resulted in a rate reduction, so the NDPSC did not issue an order suspending the rate change. Consequently, pursuant to statute, OTP was allowed to implement updated rates effective April 1, 2013. On July 10, 2013, the NDPSC approved the updated rates implemented on April 1, 2013. The NDPSC approved OTP’s most recent annual update to the NDRRA on March 12, 2014 with an effective date of April 1, 2014. The update approved on March 12, 2014 resulted in a 13.5% reduction in the NDRRA rate.
OTP had a net regulatory liability of $0.7 million as of September 30, 2014 for amounts billed to North Dakota customers that were subject to refund through the NDRRA rider. OTP recognized revenue for amounts eligible for recovery through the NDRRA rider of $2.2 million in the three month period ended September 30, 2014, compared with $2.4 million in the three month period ended September 30, 2013, and $5.7 million in the nine month period ended September 30, 2014, compared with $6.9 million in the nine month period ended September 30, 2013.
Transmission Cost Recovery Rider—North Dakota law provides a mechanism for automatic adjustment outside of a general rate proceeding to recover jurisdictional capital and operating costs incurred by a public utility for new or modified electric transmission facilities. On August 30, 2013 OTP filed its annual update to its North Dakota TCR rider rate, which was approved on December 30, 2013 and became effective January 1, 2014. On August 29, 2014 OTP filed its annual update to the North Dakota TCR rider rate with a proposed implementation date of January 1, 2015. Within this TCR filing, as required by the order for the North Dakota Big Stone II rider, OTP included the over-collection of North Dakota Big Stone II abandoned plant costs of $0.1 million.
OTP had a regulatory asset of $0.7 million for amounts eligible for recovery through the North Dakota TCR rider that had not been billed to North Dakota customers as of September 30, 2014. OTP recognized revenue for amounts eligible for recovery through the North Dakota TCR rider of $1.3 million in the three month period ended September 30, 2014, compared with $0.7 million in the three month period ended September 30, 2013, and $4.5 million in the nine month period ended September 30, 2014, compared with $2.4 million in the nine month period ended September 30, 2013.
| 19 |
Environmental Cost Recovery Rider—On May 9, 2012 the NDPSC approved OTP’s application for an ADP related to the Big Stone Plant AQCS. On February 8, 2013 OTP filed a request with the NDPSC for an ECR rider to recover OTP’s North Dakota jurisdictional share of the revenue requirements associated with its investment in the Big Stone Plant AQCS. On December 18, 2013 the NDPSC approved OTP’s North Dakota ECR rider based on revenue requirements through the 2013 calendar year and thereafter, with rates effective for bills rendered on or after January 1, 2014. On March 31, 2014 OTP filed its annual update to its North Dakota ECR rider rate. The update included a request to increase the ECR rider rate from 4.319% of base rates to 7.531% of base rates. On July 10, 2014 the NDPSC approved OTP’s 2014 ECR rider annual update request with an August 1, 2014 implementation date.
OTP had a regulatory asset of $1.7 million as of September 30, 2014 for amounts eligible for recovery through the North Dakota ECR rider that had not been billed to North Dakota customers as of September 30, 2014. OTP recognized revenue for amounts eligible for recovery through the North Dakota ECR rider of $1.5 million in the three month period ended September 30, 2014, compared with ($0.4) million in the three month period ended September 30, 2013, and $4.4 million in the nine month period ended September 30, 2014, compared with $0.0 million in the nine month period ended September 30, 2013.
Big Stone II Cost Recovery—In an order issued June 25, 2010, the NDPSC authorized recovery of Big Stone II development costs from North Dakota ratepayers, pursuant to a final settlement agreement filed June 23, 2010, between the NDPSC advocacy staff, OTP and the North Dakota Large Industrial Energy Group, Interveners. The terms of the settlement agreement indicate that OTP’s discontinuation of participation in the project was prudent and OTP should be authorized to recover the portion of costs it incurred related to the Big Stone II generation project. The total amount of Big Stone II generation costs incurred by OTP (which excluded $2.6 million of project transmission-related costs) was determined to be $10.1 million, of which $4.1 million represents North Dakota’s jurisdictional share.
OTP included in its total recovery amount a carrying charge of approximately $0.3 million on the North Dakota share of Big Stone II generation costs for the period from September 1, 2009 through the date the recovery of costs began based on OTP’s average 2009 AFUDC rate of 7.65%. Because OTP would not earn a return on these deferred costs over the 36-month recovery period, the recoverable amount of $4.3 million was discounted to its then present value of $3.9 million using OTP’s incremental borrowing rate, in accordance with ASC 980 accounting requirements. The North Dakota portion of Big Stone II generation costs was recovered over a 36-month period which began on August 1, 2010.
The North Dakota jurisdictional share of Big Stone II costs incurred by OTP related to transmission was $1.1 million. Approximately $0.3 million of the total North Dakota jurisdictional share of Big Stone II transmission costs were transferred to the Big Stone South - Brookings MVP during the first quarter of 2013. On July 30, 2013 the NDPSC approved OTP’s request to continue the Big Stone II cost recovery rates for an additional eight months through March 31, 2014 to recover the remaining North Dakota share of Big Stone II transmission-related costs plus accrued AFUDC totaling $1.0 million. As of April 1, 2014 North Dakota customer’s bills no longer include a charge for North Dakota share of Big Stone II costs. OTP had a regulatory liability of $0.1 million as of September 30, 2014 for amounts billed to North Dakota customers that will be subject to refund through the North Dakota TCR rider. The North Dakota TCR rider annual update, requesting an increase in the North Dakota TCR rider rate, was filed on August 29, 2014.
South Dakota
2010 General Rate Case—On April 21, 2011 the SDPUC issued a written order approving an overall final revenue increase of approximately $643,000 (2.32%) and an overall rate of return on rate base of 8.50% for the interim rates and final rates for OTP in South Dakota. Final rates were effective with bills rendered on and after June 1, 2011.
Transmission Cost Recovery Rider—South Dakota law provides a mechanism for automatic adjustment outside of a general rate proceeding to recover jurisdictional capital and operating costs incurred by a public utility for new or modified electric transmission facilities. OTP submitted a request for an initial South Dakota TCR rider to the SDPUC on November 5, 2010. The South Dakota TCR was approved by the SDPUC and implemented on December 1, 2011. The SDPUC approved an annual update to OTP’s South Dakota TCR on April 23, 2013 with an effective date of May 1, 2013. The SDPUC approved OTP’s most recent annual update to its South Dakota TCR on February 18, 2014 with an effective date of March 1, 2014.
OTP had a regulatory asset of $0.1 million for amounts eligible for recovery through the South Dakota TCR rider that had not been billed to South Dakota customers as of September 30, 2014. OTP recognized revenue for amounts eligible for recovery through the South Dakota TCR rider of $0.3 million in the three month period ended September 30, 2014, compared with $0.2 million in the three month period ended September 30, 2013, and $1.0 million in the nine month period ended September 30, 2014, compared with $0.6 million in the nine month period ended September 30, 2013.
| 20 |
Environmental Cost Recovery Rider—On March 30, 2012 OTP requested approval from the SDPUC for an ECR rider to recover costs associated with the Big Stone Plant AQCS. On April 17, 2013 OTP filed a request to either suspend or withdraw this filing. The SDPUC approved withdrawing this filing on April 23, 2013. Instead of receiving rider recovery on the portion of AQCS construction costs assignable to OTP’s South Dakota customers, OTP will accrue AFUDC on these costs until, under a future rate filing, recovery of and a return on the accumulated costs, including AFUDC, may be granted in South Dakota. On August 29, 2014 OTP filed a new request with the SDPUC for an ECR rider to recover costs associated with new environmental measures including costs to comply with mercury and air toxics standards.
Big Stone II Cost Recovery—OTP requested recovery of the South Dakota portion of its Big Stone II development costs over a five-year period as part of its general rate case filed in South Dakota on August 20, 2010. In the first quarter of 2011, the SDPUC approved recovery of the South Dakota portion of Big Stone II generation development costs totaling approximately $1.0 million from South Dakota ratepayers over a ten-year period beginning in February 2011 with the implementation of interim rates. OTP is allowed to earn a return on the amount subject to recovery over the ten-year recovery period. Therefore, the South Dakota settlement amount is not discounted. OTP transferred the South Dakota portion of the remaining Big Stone II transmission costs to CWIP, with such costs subject to AFUDC and recovery in future FERC-approved MISO rates or retail rates. On July 31, 2012 the SDPUC approved the transfer of the Big Stone II transmission route permits to OTP.
A portion of the Big Stone II transmission costs were transferred out of CWIP in February 2013 to be included within the Big Stone South - Brookings MVP. On March 28, 2013, OTP filed a petition with the SDPUC requesting deferred accounting for the remaining unrecovered Big Stone II Transmission costs until OTP’s next South Dakota general rate case. The petition was approved by the SDPUC on April 23, 2013 and in May 2013 OTP transferred the remaining South Dakota jurisdictional portion of unrecovered Big Stone II transmission costs plus accumulated AFUDC totaling $0.2 million from CWIP to the Big Stone II Unrecovered Project Costs – South Dakota regulatory asset accounts, which had a combined balance of $0.9 million on September 30, 2014.
Federal
Wholesale power sales and transmission rates are subject to the jurisdiction of the FERC under the Federal Power Act of 1935, as amended. The FERC is an independent agency with jurisdiction over rates for wholesale electricity sales, transmission and sale of electric energy in interstate commerce, interconnection of facilities, and accounting policies and practices. Filed rates are effective after a one day suspension period, subject to ultimate approval by the FERC.
Effective January 1, 2010 the FERC authorized OTP’s implementation of a forward looking formula transmission rate under the MISO Tariff. OTP was also authorized by the FERC to recover in its formula rate: (1) 100% of prudently incurred CWIP in rate base and (2) 100% of prudently incurred costs of transmission facilities that are cancelled or abandoned for reasons beyond OTP’s control (Abandoned Plant Recovery), as determined by the FERC subsequent to abandonment, specifically for three regional transmission CapX2020 projects in which OTP is invested.
On November 12, 2013 a group of industrial customers and other stakeholders filed a complaint at the FERC seeking to reduce the return on equity component of the transmission rates that MISO transmission owners, including OTP, may collect under the MISO Tariff. The complainants are seeking to reduce the current 12.38% return on equity used in MISO’s transmission rates to a proposed 9.15%. A group of MISO transmission owners have filed responses to the complaint, defending the current return on equity and seeking dismissal of the complaint. On October 16, 2014 the FERC issued an order finding that the current MISO return on equity may be unjust and unreasonable and setting the issue for hearing, subject to the outcome of settlement discussion. The parties’ first settlement conference is currently scheduled for November 13, 2014.
| 21 |
United States Environmental Protection Agency (EPA) Cross-State Air Pollution Rule (CSAPR)
On April 29, 2014 the U.S. Supreme Court issued its opinion in litigation concerning the EPA’s CSAPR, reversing the August 21, 2012 decision of the U.S. Court of Appeals for the D.C. Circuit that had vacated CSAPR. CSAPR was remanded to the D.C. Circuit for further proceedings where, on July 26, 2014, the United States moved to lift the previously–entered stay. The EPA’s motion asked the D.C. Circuit to implement CSAPR’s Phase 1 emission budgets beginning January 1, 2015, for the annual sulfur dioxide (SO2) and nitrogen oxide programs. The D.C. Circuit granted the EPA’s motion on October 23, 2014, but did not make clear in its order whether that grant included the extension of the deadline requested by the EPA. The EPA has not yet opined on how it interprets the order lifting the stay or whether it believes additional EPA action is necessary to extend the compliance deadline.
The CSAPR rule is expected to apply to OTP’s Solway gas peaking plant and the Hoot Lake coal-fired plant in Minnesota. The primary anticipated impact of the rule for Hoot Lake Plant is to acquire SO2 allowances to continue operating at historical levels. Based on Hoot Lake’s historical generation and EPA’s predicted allowance costs at the time of the 2012 rule, CSAPR would have resulted in annual SO2 allowance purchase costs of approximately $1.0 million. At this time, the specific cost impact of purchasing allowances is unknown, the market has not yet been well established and, since the time CSAPR was vacated in 2012, there has been a substantial reduction in SO2 emissions in OTP’s CSAPR region. Minnesota is considered a Group 2 state for SO2 compliance along with Alabama, Georgia, Kansas, Nebraska, South Carolina and Texas. Any SO2 allowances that need to be obtained for Hoot Lake Plant will need to be from an entity in a Group 2 state.
EPA Proposed Carbon Dioxide (CO2) Emissions Standards and Guidelines
On January 8, 2014, the EPA published proposed standards of performance for CO2 emissions from new fossil fuel-fired power plants, based on implementation of partial carbon capture and storage for coal-fired units and natural gas combined cycle technology for gas-fired units. On June 18, 2014 the EPA published proposed CO2 emission guidelines for existing fossil fuel-fired power plants, based on a combination of heat-rate improvements, re-dispatch of electricity to lower-emitting natural gas units or non-emitting renewable energy and nuclear units, and demand-side energy efficiency measures. At the same time, the EPA published separate CO2 emission standards for reconstructed and modified fossil fuel-fired power plants essentially requiring that such plants install modern technology, when modifying or reconstructing, to reduce their emissions. The EPA plans to issue final rules for each of these proposals by July 2015. For existing sources, states would then be required to develop and submit plans, either individually or with other states, spelling out how they will achieve the individualized, reduced CO2 emission rates that the EPA has identified. Those state plans are due by July 2016. The EPA is proposing to allow, upon reasonable request, one-year extensions for states proposing individual plans and two-year extensions for states proposing to submit multi-state plans.
OTP is participating with other stakeholders in efforts to shape the final performance standards for new, modified and reconstructed, and existing power plants both at the federal level and, where applicable, at the state level. On September 16, 2014 the EPA announced a 45-day extension for comments to be submitted regarding its proposed 111(d) rule, which seeks to regulate CO2 emissions for existing coal-based power plants. The extension moved the deadline for comments from October 16, 2014 to December 1, 2014. OTP intends to submit comments on the proposed 111(d) rule by that deadline. It is not possible to determine, at this time, the potential impact to OTP of these future regulations on new, modified or reconstructed, or existing sources.
| 22 |
4. Regulatory Assets and Liabilities
As a regulated entity, OTP accounts for the financial effects of regulation in accordance with ASC 980. This accounting standard allows for the recording of a regulatory asset or liability for costs that will be collected or refunded in the future as required under regulation. Additionally, ASC 980-605-25 provides for the recognition of revenues authorized for recovery outside of a general rate case under alternative revenue programs which provide for recovery of costs and incentives or returns on investment in such items as transmission infrastructure, renewable energy resources or conservation initiatives. The following tables indicate the amount of regulatory assets and liabilities recorded on the Company’s consolidated balance sheets:
|
September 30, 2014
|
Remaining
Recovery/
Refund Period
|
||||||||||||
|
(in thousands)
|
Current
|
Long-Term
|
Total
|
||||||||||
|
Regulatory Assets:
|
|||||||||||||
|
Prior Service Costs and Actuarial Losses on Pensions and Other Postretirement Benefits1
|
$ | 3,941 | $ | 52,089 | $ | 56,030 |
see note
|
||||||
|
Conservation Improvement Program Costs and Incentives2
|
5,867 | 1,448 | 7,315 |
21 months
|
|||||||||
|
Deferred Marked-to-Market Losses1
|
3,193 | 3,290 | 6,483 |
51 months
|
|||||||||
|
Accumulated ARO Accretion/Depreciation Adjustment1
|
-- | 5,053 | 5,053 |
asset lives
|
|||||||||
|
Big Stone II Unrecovered Project Costs – Minnesota1
|
584 | 3,326 | 3,910 |
99 months
|
|||||||||
|
MISO Schedule 26/26A Transmission Cost Recovery Rider True-up1
|
2,336 | 1,133 | 3,469 |
24 months
|
|||||||||
|
Minnesota Transmission Rider Accrued Revenues2
|
588 | 2,142 | 2,730 |
24 months
|
|||||||||
|
Deferred Income Taxes1
|
-- | 2,430 | 2,430 |
asset lives
|
|||||||||
|
Debt Reacquisition Premiums1
|
354 | 1,978 | 2,332 |
216 months
|
|||||||||
|
North Dakota Environmental Cost Recovery Rider Accrued Revenues2
|
1,701 | -- | 1,701 |
12 months
|
|||||||||
|
Big Stone II Unrecovered Project Costs – South Dakota2
|
100 | 768 | 868 |
104 months
|
|||||||||
|
North Dakota Transmission Rider Accrued Revenues2
|
748 | -- | 748 |
12 months
|
|||||||||
|
Minnesota Environmental Cost Recovery Rider Accrued Revenues2
|
468 | -- | 468 |
12 months
|
|||||||||
|
Minnesota Renewable Resource Rider Accrued Revenues2
|
-- | 68 | 68 |
see note
|
|||||||||
|
South Dakota Transmission Rider Accrued Revenues2
|
67 | -- | 67 |
12 months
|
|||||||||
|
Total Regulatory Assets
|
$ | 19,947 | $ | 73,725 | $ | 93,672 | |||||||
|
Regulatory Liabilities:
|
|||||||||||||
|
Accumulated Reserve for Estimated Removal Costs – Net of Salvage
|
$ | -- | $ | 73,173 | $ | 73,173 |
asset lives
|
||||||
|
Deferred Marked-to-Market Gains
|
1,114 | 902 | 2,016 |
47 months
|
|||||||||
|
Deferred Income Taxes
|
-- | 1,686 | 1,686 |
asset lives
|
|||||||||
|
North Dakota Renewable Resource Rider Accrued Refund
|
314 | 419 | 733 |
18 months
|
|||||||||
|
Revenue for Rate Case Expenses Subject to Refund – Minnesota
|
-- | 660 | 660 |
see note
|
|||||||||
|
Refundable Fuel Clause Adjustment Revenues
|
412 | -- | 412 |
12 months
|
|||||||||
|
Big Stone II Over Recovered Project Costs – North Dakota
|
144 | -- | 144 |
12 months
|
|||||||||
|
Deferred Gain on Sale of Utility Property – Minnesota Portion
|
6 | 102 | 108 |
231 months
|
|||||||||
|
South Dakota – Nonasset-Based Margin Sharing Excess
|
16 | -- | 16 |
12 months
|
|||||||||
|
Total Regulatory Liabilities
|
$ | 2,006 | $ | 76,942 | $ | 78,948 | |||||||
|
Net Regulatory Asset (Liability) Position
|
$ | 17,941 | $ | (3,217 | ) | $ | 14,724 | ||||||
|
1Costs subject to recovery without a rate of return.
2Amount eligible for recovery under an alternative revenue program which includes an incentive or rate of return.
|
|||||||||||||
| 23 |
|
December 31, 2013
|
Remaining
Recovery/
Refund Period
|
||||||||||||
|
(in thousands)
|
Current
|
Long-Term
|
Total
|
||||||||||
|
Regulatory Assets:
|
|||||||||||||
|
Prior Service Costs and Actuarial Losses on Pensions and Other Postretirement Benefits1
|
$ | 4,095 | $ | 55,012 | $ | 59,107 |
see note
|
||||||
|
Deferred Marked-to-Market Losses1
|
3,008 | 8,674 | 11,682 |
60 months
|
|||||||||
|
Conservation Improvement Program Costs and Incentives2
|
4,945 | 3,959 | 8,904 |
18 months
|
|||||||||
|
Accumulated ARO Accretion/Depreciation Adjustment1
|
-- | 4,646 | 4,646 |
asset lives
|
|||||||||
|
Big Stone II Unrecovered Project Costs – Minnesota1
|
558 | 3,967 | 4,525 |
81 months
|
|||||||||
|
MISO Schedule 26/26A Transmission Cost Recovery Rider True-up1
|
1,351 | 1,753 | 3,104 |
24 months
|
|||||||||
|
Debt Reacquisition Premiums1
|
351 | 2,241 | 2,592 |
225 months
|
|||||||||
|
North Dakota Environmental Cost Recovery Rider Accrued Revenues2
|
2,331 | -- | 2,331 |
12 months
|
|||||||||
|
Deferred Income Taxes1
|
-- | 1,805 | 1,805 |
asset lives
|
|||||||||
|
Big Stone II Unrecovered Project Costs – South Dakota2
|
101 | 843 | 944 |
113 months
|
|||||||||
|
North Dakota Renewable Resource Rider Accrued Revenues2
|
-- | 762 | 762 |
15 months
|
|||||||||
|
Recoverable Fuel and Purchased Power Costs1
|
760 | -- | 760 |
12 months
|
|||||||||
|
Big Stone II Unrecovered Project Costs – North Dakota1
|
375 | -- | 375 |
3 months
|
|||||||||
|
Minnesota Renewable Resource Rider Accrued Revenues2
|
-- | 68 | 68 |
see note
|
|||||||||
|
South Dakota Transmission Rider Accrued Revenues2
|
32 | -- | 32 |
12 months
|
|||||||||
|
Deferred Holding Company Formation Costs1
|
27 | -- | 27 |
6 months
|
|||||||||
|
General Rate Case Recoverable Expenses – South Dakota1
|
6 | -- | 6 |
1 month
|
|||||||||
|
Total Regulatory Assets
|
$ | 17,940 | $ | 83,730 | $ | 101,670 | |||||||
|
Regulatory Liabilities:
|
|||||||||||||
|
Accumulated Reserve for Estimated Removal Costs – Net of Salvage
|
$ | -- | $ | 71,454 | $ | 71,454 |
asset lives
|
||||||
|
Deferred Income Taxes
|
-- | 1,960 | 1,960 |
asset lives
|
|||||||||
|
Minnesota Transmission Rider Accrued Refund
|
670 | -- | 670 |
12 months
|
|||||||||
|
Revenue for Rate Case Expenses Subject to Refund – Minnesota
|
-- | 289 | 289 |
see note
|
|||||||||
|
North Dakota Renewable Resource Rider Accrued Refund
|
261 | -- | 261 |
12 months
|
|||||||||
|
North Dakota Transmission Rider Accrued Refund
|
215 | -- | 215 |
12 months
|
|||||||||
|
Deferred Marked-to-Market Gains
|
6 | 117 | 123 |
56 months
|
|||||||||
|
Deferred Gain on Sale of Utility Property – Minnesota Portion
|
5 | 106 | 111 |
240 months
|
|||||||||
|
South Dakota – Nonasset-Based Margin Sharing Excess
|
38 | -- | 38 |
12 months
|
|||||||||
|
Total Regulatory Liabilities
|
$ | 1,195 | $ | 73,926 | $ | 75,121 | |||||||
|
Net Regulatory Asset Position
|
$ | 16,745 | $ | 9,804 | $ | 26,549 | |||||||
|
1Costs subject to recovery without a rate of return.
2Amount eligible for recovery under an alternative revenue program which includes an incentive or rate of return.
|
|||||||||||||
The regulatory asset related to prior service costs and actuarial losses on pensions and other postretirement benefits represents benefit costs and actuarial losses subject to recovery through rates as they are expensed over the remaining service lives of active employees included in the plans. These unrecognized benefit costs and actuarial losses are required to be recognized as components of Accumulated Other Comprehensive Income in equity under ASC Topic 715, Compensation—Retirement Benefits, but are eligible for treatment as regulatory assets based on their probable recovery in future retail electric rates.
Conservation Improvement Program Costs and Incentives represent mandated conservation expenditures and incentives recoverable through retail electric rates.
All Deferred Marked-to-Market Gains and Losses recorded as of September 30, 2014 are related to forward purchases of energy scheduled for delivery through December 2018.
The Accumulated ARO Accretion/Depreciation Adjustment will accrete and be amortized over the lives of property with asset retirement obligations.
Big Stone II Unrecovered Project Costs – Minnesota are the Minnesota share of generation and transmission plant-related costs incurred by OTP related to its participation in the abandoned Big Stone II generation project.
| 24 |
MISO Schedule 26/26A Transmission Cost Recovery Rider True-up relates to the over/under collection of revenue based on comparison of the expected versus actual construction on eligible projects in the period. The true-up also includes the state jurisdictional portion of MISO Schedule 26/26A for regional transmission cost recovery that was included in the calculation of the state transmission riders and subsequently adjusted to reflect actual billing amounts in the schedule.
Minnesota Transmission Rider Accrued Revenues relate to revenues earned on qualifying transmission system facilities that have not been billed to Minnesota customers as of September 30, 2014.
The regulatory assets and liabilities related to Deferred Income Taxes result from changes in statutory tax rates accounted for in accordance with ASC Topic 740.
Debt Reacquisition Premiums are being recovered from OTP customers over the remaining original lives of the reacquired debt issues, the longest of which is 216 months.
North Dakota Environmental Cost Recovery Rider Accrued Revenues relate to a return granted on the North Dakota share of amounts invested in the construction of the Big Stone Plant AQCS project, net of amounts billed under the rider.
Big Stone II Unrecovered Project Costs – South Dakota are the South Dakota share of generation and transmission plant-related costs incurred by OTP related to its participation in the abandoned Big Stone II generation project.
North Dakota Transmission Rider Accrued Revenues relate to revenues earned on qualifying transmission system facilities that have not been billed to North Dakota customers as of September 30, 2014.
Minnesota Environmental Cost Recovery Rider Accrued Revenues relate to a return granted on the Minnesota share of amounts invested in the construction of the Big Stone Plant AQCS project, net of amounts billed under the rider.
Minnesota Renewable Resource Rider Accrued Revenues relate to revenues earned on qualifying renewable resource costs incurred to serve Minnesota customers that have not been billed to Minnesota customers. On April 4, 2013 the MPUC approved OTP’s request to set the MNRRA rate to zero effective May 1, 2013 and authorized that any unrecovered balance be retained as a regulatory asset to be recovered in OTP’s next general rate case.
South Dakota Transmission Rider Accrued Revenues relate to revenues earned for qualifying transmission system facilities and operating costs incurred to serve South Dakota customers that have not been billed to South Dakota customers as of September 30, 2014.
The Accumulated Reserve for Estimated Removal Costs – Net of Salvage is reduced as actual removal costs, net of salvage revenues, are incurred.
The North Dakota Renewable Resource Rider Accrued Refund relates to amounts collected for qualifying renewable resource costs incurred to serve North Dakota customers that are refundable to North Dakota customers as of September 30, 2014.
Revenue for Rate Case Expenses Subject to Refund – Minnesota relate to revenues collected under general rates to recover costs related to prior rate case proceedings in excess of the actual costs incurred, which are subject to refund.
Big Stone II Over Recovered Project Costs – North Dakota represent amounts collected from North Dakota customers in excess of the North Dakota share of generation and transmission plant-related costs incurred by OTP related to its participation in the abandoned Big Stone II generation project. The September 30, 2014 liability will be refunded to North Dakota customers through an adjustment to revenue requirements under the North Dakota TCR rider.
South Dakota – Nonasset-Based Margin Sharing Excess represents 25% of OTP’s South Dakota share of actual profit margins on nonasset-based wholesale sales of electricity. The excess margins accumulated annually will be subject to refund through future retail rate adjustments in South Dakota in the following year.
If for any reason, OTP ceases to meet the criteria for application of guidance under ASC 980 for all or part of its operations, the regulatory assets and liabilities that no longer meet such criteria would be removed from the consolidated balance sheet and included in the consolidated statement of income as an extraordinary expense or income item in the period in which the application of guidance under ASC 980 ceases.
| 25 |
5. Forward Contracts Classified as Derivatives
Electricity Contracts
All of OTP’s wholesale purchases and sales of energy under forward contracts that do not meet the definition of capacity contracts are considered derivatives subject to mark-to-market accounting. OTP’s objective in entering into forward contracts for the purchase and sale of energy is to meet the energy requirements of its retail customers is to optimize the use of its generating and transmission facilities and leverage its knowledge of wholesale energy markets in the region to maximize financial returns for the benefit of both its customers and shareholders. OTP’s intent in entering into certain of these contracts is to settle them through the physical delivery of energy when physically possible and economically feasible. Prior to September 2014, OTP also entered into certain contracts for trading purposes with the intent to profit from fluctuations in market prices through the timing of purchases and sales. In September 2014, OTP decided to discontinue its trading activities that are not directly associated with serving retail customers.
Market prices used to value OTP’s forward contracts for the purchases and sales of electricity are determined by survey of counterparties or brokers used by OTP’s power services’ personnel responsible for contract pricing, as well as prices gathered from daily settlement prices published by the Intercontinental Exchange and CME Globex. For certain contracts, prices at illiquid trading points are based on a basis spread between that trading point and more liquid trading hub prices. These basis spreads are determined based on available market price information and the use of forward price curve models. The fair value measurements of these forward energy contracts fall into Level 3 of the fair value hierarchy set forth in ASC 820.
The following tables show the effect of marking to market forward contracts for the purchase and sale of electricity and the location and fair value amounts of the related derivatives reported on the Company’s consolidated balance sheets as of September 30, 2014 and December 31, 2013, and the change in the Company’s consolidated balance sheet position from December 31, 2013 to September 30, 2014 and December 31, 2012 to September 30, 2013:
|
(in thousands)
|
September 30, 2014
|
December 31, 2013
|
||||||
|
Current Asset – Marked-to-Market Gain
|
$ | 2,016 | $ | 338 | ||||
|
Regulatory Asset – Current Deferred Marked-to-Market Loss
|
3,193 | 3,008 | ||||||
|
Regulatory Asset – Long-Term Deferred Marked-to-Market Loss
|
3,290 | 8,674 | ||||||
|
Total Assets
|
8,499 | 12,020 | ||||||
|
Current Liability – Marked-to-Market Loss
|
(6,483 | ) | (11,782 | ) | ||||
|
Regulatory Liability – Current Deferred Marked-to-Market Gain
|
(1,114 | ) | (6 | ) | ||||
|
Regulatory Liability – Long-Term Deferred Marked-to-Market Gain
|
(902 | ) | (117 | ) | ||||
|
Total Liabilities
|
(8,499 | ) | (11,905 | ) | ||||
|
Net Fair Value of Marked-to-Market Energy Contracts
|
$ | -- | $ | 115 | ||||
|
(in thousands)
|
Year-to-Date
September 30, 2014
|
Year-to-Date
September 30, 2013
|
||||||
|
Cumulative Fair Value Adjustments Included in Earnings - Beginning of Year
|
$ | 115 | $ | 49 | ||||
|
Less: Amounts Realized on Settlement of Contracts Entered into in Prior Periods
|
(72 | ) | (49 | ) | ||||
|
Changes in Fair Value of Contracts Entered into in Prior Periods
|
(43 | ) | -- | |||||
|
Cumulative Fair Value Adjustments in Earnings of Contracts Entered into in Prior Years at End of Period
|
-- | -- | ||||||
|
Changes in Fair Value of Contracts Entered into in Current Period
|
-- | -- | ||||||
|
Cumulative Fair Value Adjustments Included in Earnings - End of Period
|
$ | -- | $ | -- | ||||
The following realized and unrealized net gains and losses on forward energy contracts are included in electric operating revenues on the Company’s consolidated statements of income:
|
Three Months Ended
|
Nine Months Ended
|
|||||||||||||||
|
September 30,
|
September 30,
|
|||||||||||||||
|
(in thousands)
|
2014
|
2013
|
2014
|
2013
|
||||||||||||
|
Net Gains (Losses) on Forward Electric Energy Contracts
|
$ | -- | $ | 1 | $ | (13 | ) | $ | 255 | |||||||
| 26 |
OTP has credit risk associated with the nonperformance or nonpayment by counterparties to its forward energy and capacity purchases and sales agreements. The Company has established guidelines and limits to manage credit risk associated with wholesale power and capacity purchases and sales. Specific limits are determined by a counterparty’s financial strength.
The following table provides information on OTP’s credit risk exposure on delivered and marked-to-market forward contracts as of September 30, 2014 and December 31, 2013:
|
September 30, 2014
|
December 31, 2013
|
|||||||||||||||
|
(in thousands)
|
Exposure
|
Counterparties
|
Exposure
|
Counterparties
|
||||||||||||
|
Net Credit Risk on Forward Energy Contracts
|
$ | 36 | 1 | $ | 856 | 3 | ||||||||||
|
Net Credit Risk to Single Largest Counterparty
|
$ | 36 | $ | 530 | ||||||||||||
OTP had a net credit risk exposure to one counterparty with investment grade credit ratings. OTP had no exposure at September 30, 2014 or December 31, 2013 to counterparties with credit ratings below investment grade. Counterparties with investment grade credit ratings have minimum credit ratings of BBB- (Standard & Poor’s), Baa3 (Moody’s) or BBB- (Fitch). The credit risk exposures include net amounts due to OTP on receivables/payables from completed transactions billed and unbilled plus marked-to-market gains on forward contracts for the purchase of gasoline scheduled for settlement subsequent to September 30, 2014. Individual counterparty exposures are offset according to legally enforceable netting arrangements. However, the Company does not net offsetting payables and receivables or derivative assets and liabilities under legally enforceable netting arrangements on the face of its consolidated balance sheets. The amounts of derivative asset and derivative liability balances that were subject to legally enforceable netting arrangements as of September 30, 2014 and December 31, 2013 are indicated in the following table:
|
(in thousands)
|
September 30, 2014
|
December 31, 2013
|
||||||
|
Derivative assets subject to legally enforceable netting arrangements
|
$ | 2,016 | $ | 400 | ||||
|
Derivative liabilities subject to legally enforceable netting arrangements
|
(6,520 | ) | (11,782 | ) | ||||
|
Net balance subject to legally enforceable netting arrangements
|
$ | (4,504 | ) | $ | (11,382 | ) | ||
The following table provides a breakdown of OTP’s credit risk standing on forward energy contracts in marked-to-market loss positions as of September 30, 2014 and December 31, 2013:
|
Current Liability – Marked-to-Market Loss (in thousands)
|
September 30,
2014
|
December 31,
2013
|
||||||
|
Loss Contracts Covered by Deposited Funds or Letters of Credit
|
$ | 37 | $ | -- | ||||
|
Contracts Requiring Cash Deposits if OTP’s Credit Falls Below Investment Grade1
|
6,483 | 11,679 | ||||||
|
Loss Contracts with No Ratings Triggers or Deposit Requirements
|
-- | 103 | ||||||
|
Total Current Liability – Marked-to-Market Loss
|
$ | 6,520 | $ | 11,782 | ||||
|
1Certain OTP derivative energy contracts contain provisions that require an investment grade credit rating from each of the major credit rating agencies on OTP’s debt. If OTP’s debt ratings were to fall below investment grade, the counterparties to these forward energy contracts could request the immediate deposit of cash to cover contracts in net liability positions.
|
||||||||
|
Contracts Requiring Cash Deposits if OTP’s Credit Falls Below Investment Grade
|
$ | 6,483 | $ | 11,679 | ||||
|
Offsetting Gains with Counterparties under Master Netting Agreements
|
(2,016 | ) | (117 | ) | ||||
|
Reporting Date Deposit Requirement if Credit Risk Feature Triggered
|
$ | 4,467 | $ | 11,562 | ||||
| 27 |
6. Reconciliation of Common Shareholders’ Equity, Common Shares and Earnings Per Share
Reconciliation of Common Shareholders’ Equity
|
(in thousands)
|
Par Value,
Common
Shares
|
Premium on Common
Shares
|
Retained
Earnings
|
Accumulated
Other
Comprehensive
Income/(Loss)
|
Total
Common
Equity
|
|||||||||||||||
|
Balance, December 31, 2013
|
$ | 181,358 | $ | 255,759 | $ | 99,441 | $ | (1,728 | ) | $ | 534,830 | |||||||||
|
Common Stock Issuances, Net of Expenses
|
2,731 | 10,785 | 13,516 | |||||||||||||||||
|
Common Stock Retirements
|
(102 | ) | (357 | ) | (459 | ) | ||||||||||||||
|
Net Income
|
47,248 | 47,248 | ||||||||||||||||||
|
Other Comprehensive Income
|
68 | 68 | ||||||||||||||||||
|
Tax Benefit – Stock Compensation
|
33 | 33 | ||||||||||||||||||
|
Employee Stock Incentive Plans Expense
|
1,126 | 1,126 | ||||||||||||||||||
|
Common Dividends ($0.9075 per share)
|
(33,120 | ) | (33,120 | ) | ||||||||||||||||
|
Balance, September 30, 2014
|
$ | 183,987 | $ | 267,346 | $ | 113,569 | $ | (1,660 | ) | $ | 563,242 | |||||||||
Common Shares
In 2014, the Company began issuing shares to meet the requirements of its Automatic Dividend Reinvestment and Share Purchase Plan, Employee Stock Purchase Plan and Employee Stock Ownership Plan, rather than purchasing shares in the open market. Also in 2014, the Company began selling common shares under its Distribution Agreement (At-the-Market Offering) with J.P. Morgan Securities (JPMS) under which the Company may offer and sell its common shares from time to time through JPMS, as the Company’s distribution agent for the offer and sale of the shares, up to an aggregate sales price of $75 million. Following is a reconciliation of the Company’s common shares outstanding from December 31, 2013 through September 30, 2014:
|
Common Shares Outstanding, December 31, 2013
|
36,271,696 | |||
|
Issuances:
|
||||
|
Automatic Dividend Reinvestment and Share Purchase Plan:
|
||||
|
Dividends Reinvested
|
135,834 | |||
|
Cash Invested
|
60,582 | |||
|
At-the-Market Offering
|
168,044 | |||
|
Employee Stock Purchase Plan:
|
||||
|
Cash Invested
|
39,222 | |||
|
Dividends Reinvested
|
19,329 | |||
|
Restricted Stock Issued to Employees
|
26,700 | |||
|
Employee Stock Ownership Plan
|
22,650 | |||
|
Executive Stock Performance Awards (2011-2013 shares earned)
|
22,630 | |||
|
Stock Options Exercised
|
19,650 | |||
|
Restricted Stock Issued to Directors
|
16,800 | |||
|
Vesting of Restricted Stock Units
|
14,305 | |||
|
Directors Deferred Compensation
|
498 | |||
|
Retirements:
|
||||
|
Shares Withheld for Individual Income Tax Requirements
|
(16,127 | ) | ||
|
Forfeiture of Unvested Restricted Stock
|
(4,375 | ) | ||
|
Common Shares Outstanding, September 30, 2014
|
36,797,438 |
Earnings Per Share
The numerator used in the calculation of both basic and diluted earnings per common share is earnings available for common shares with no adjustments for the three and nine month periods ended September 30, 2014 and 2013. The denominator used in the calculation of basic earnings per common share is the weighted average number of common shares outstanding during the period excluding nonvested restricted shares granted to the Company’s directors and employees, which are forfeitable and not considered outstanding for the purpose of calculating basic earnings per share. The denominator used in the calculation of diluted earnings per common share is derived by adjusting outstanding shares for the following: (1) all potentially dilutive stock options, (2) underlying shares related to nonvested restricted stock units granted to employees, (3) nonvested restricted shares, (4) shares expected to be awarded for stock performance awards granted to executive officers, and (5) shares expected to be issued under the deferred compensation program for directors. Adjustments to the denominator used to calculate diluted earnings per share of 242,594 shares and 202,393 shares for the three month periods ended September 30, 2014 and 2013, respectively, and 242,757 shares and 202,399 shares for the nine month periods ended September 30, 2014 and 2013, respectively, resulted in no differences greater than $0.01 between basic and diluted earnings per share in total or from continuing or discontinued operations in any of the periods.
| 28 |
7. Share-Based Payments
The Company has five share-based payment programs.
2014 Stock Incentive Plan
On April 14, 2014 the Company’s shareholders approved the Company’s 2014 Stock Incentive Plan. The 2014 Stock Incentive Plan allows the Company to provide compensation through various stock-based arrangements.
Stock Incentive Awards
On April 14, 2014 the Company’s Board of Directors granted the following stock incentive awards to the Company’s non-employee directors, executive officers and key employees under the 2014 Stock Incentive Plan:
|
Award
|
Shares/Units Granted
|
Weighted
Average
Grant-Date
Fair Value
per Award
|
Vesting
|
||||||
|
Restricted Stock Granted to Nonemployee Directors
|
16,800 | $ | 29.41 |
25% per year through April 8, 2018
|
|||||
|
Restricted Stock Granted to Executive Officers
|
26,700 | $ | 29.41 |
25% per year through April 8, 2018
|
|||||
|
Stock Performance Awards Granted to Executive Officers
|
115,200 | $ | 22.94 |
December 31, 2016
|
|||||
|
Restricted Stock Units Granted to Employees
|
11,800 | $ | 24.95 |
100% on April 8, 2018
|
|||||
The restricted shares granted to the Company’s nonemployee directors and executive officers are eligible for full dividend and voting rights. Restricted shares not vested and dividends on those restricted shares are subject to forfeiture under the terms of the restricted stock award agreement. The grant date fair value of each share of restricted stock was the average of the high and low market price per share on the date of grant.
Under the performance share awards, the Company’s executive officers could earn up to an aggregate of 150,400 common shares based on the Company’s total shareholder return relative to the total shareholder return of the companies that comprise the Edison Electric Institute Index over the performance measurement period of January 1, 2014 through December 31, 2016. The aggregate target share award is 115,200 shares. Actual payment may range from zero to 150% of the target amount. The executive officers have no voting or dividend rights related to these shares until the shares, if any, are issued at the end of the performance period. The terms of these awards are such that the entire award will be classified and accounted for as a liability, as required under ASC Topic 718, Stock Compensation (ASC 718), and will be measured over the performance period based on the fair value of the award at the end of each reporting period subsequent to the grant date.
The grant date fair value of each restricted stock unit was based on the market value of one share of the Company’s common stock on the grant date, discounted for the value of the dividend exclusion over the four-year vesting period.
Under the terms of the award agreements, all outstanding (unvested) shares or units held by a retiring grantee vest immediately on normal retirement. When the Company is made aware of a retirement or pending retirement, the Company accelerates recognition of compensation expense related to the unvested awards to correspond with the remaining service period of the grantee in accordance with the requirements of ASC 718.
In connection with the resignation of an executive officer in May 2014, the following awards were forfeited: unvested shares of restricted stock: 1,000 granted in 2012, 1,275 granted in 2013 and 2,100 granted in 2014; unvested stock performance awards: 6,600 granted in 2012, 4,900 granted in 2013 and 8,900 granted in 2014; and 5,500 unvested restricted stock units granted in 2011.
As of September 30, 2014 the remaining unrecognized compensation expense related to stock-based compensation was approximately $4.1 million (before income taxes) which will be amortized over a weighted-average period of 2.0 years.
| 29 |
Compensation expense recognized under the Company’s stock-based payment programs are presented in the table below:
|
Three Months Ended September 30,
|
Nine Months Ended September 30,
|
|||||||||||||||
|
(in thousands)
|
2014
|
2013
|
2014
|
2013
|
||||||||||||
|
Employee Stock Purchase Plan (15% discount)
|
$ | 43 | $ | 39 | $ | 130 | $ | 98 | ||||||||
|
Restricted Stock Granted to Directors
|
98 | 119 | 319 | 488 | ||||||||||||
|
Restricted Stock Granted to Employees
|
194 | 111 | 536 | 315 | ||||||||||||
|
Restricted Stock Units Granted to Employees
|
55 | 61 | 141 | 215 | ||||||||||||
|
Stock Performance Awards Granted to Executive Officers
|
(443 | ) | 347 | 601 | 2,148 | |||||||||||
|
Totals
|
$ | (53 | ) | $ | 677 | $ | 1,727 | $ | 3,264 | |||||||
8. Retained Earnings Restriction
The Company is a holding company with no significant operations of its own. The primary source of funds for payments of dividends to the Company’s shareholders is from dividends paid or distributions made by the Company’s subsidiaries. As a result of certain statutory limitations or regulatory or financing agreements, restrictions could occur on the amount of distributions allowed to be made by the Company’s subsidiaries.
Both the Company and OTP’s credit agreements contain restrictions on the payment of cash dividends upon a default or event of default. An event of default would be considered to have occurred if the Company or OTP, respectively, did not meet certain financial covenants. As of September 30, 2014 the Company and OTP were in compliance with the debt covenants. See note 10 to the Company’s financial statements on Form 10-K for the year ended December 31, 2013 for further information on the covenants.
Under the Federal Power Act, a public utility may not pay dividends from any funds properly included in a capital account. What constitutes “funds properly included in a capital account” is undefined in the Federal Power Act or the related regulations; however, FERC has consistently interpreted the provision to allow dividends to be paid as long as (1) the source of the dividends is clearly disclosed, (2) the dividend is not excessive and (3) there is no self-dealing on the part of corporate officials.
The MPUC indirectly limits the amount of dividends OTP can pay to the Company by requiring an equity-to-total-capitalization ratio between 45.0% and 55.0%. OTP’s equity to total capitalization ratio including short-term debt was 49.3% as of September 30, 2014. Total capitalization for OTP cannot currently exceed $987 million.
9. Commitments and Contingencies
Construction and Other Purchase Commitments
At December 31, 2013 OTP had commitments under contracts in connection with construction programs aggregating approximately $108.2 million. At September 30, 2014 OTP had commitments under contracts in connection with construction programs aggregating approximately $65.0 million. The decrease in construction commitments from December 31, 2013 to September 30, 2014 is mainly for OTP’s share of commitments related to the construction of the Big Stone Plant AQCS pertaining to materials and services ordered or under contract as of December 31, 2013 that were received in the first nine months of 2014. In October 2014 BTD Manufacturing, Inc., the Company’s metal parts stamping and fabrication company, entered into contracts in connection with construction projects aggregating approximately $16.0 million.
Electric Utility Capacity and Energy Requirements and Coal and Delivery Contracts
OTP has commitments for the purchase of capacity and energy requirements under agreements extending through 2038. On October 7, 2014 OTP entered into an agreement to purchase on-peak energy for 2019 and 2020 for approximately $20.5 million. OTP has contracts providing for the purchase and delivery of a significant portion of its current coal requirements. OTP’s current coal purchase agreements, under which OTP is committed to the minimum purchase amounts or to make payments in lieu thereof, expire in 2014, 2015, 2016 and 2040. In the first nine months of 2014, OTP entered into no additional agreements for the purchase of coal to meet its future coal requirements or for the purchase of capacity or energy to meet its future energy requirements.
| 30 |
Operating Leases
In
October 2014 BTD entered into a lease agreement in connection with the expansion of its Lakeville, Minnesota facilities.
In conjunction with BTD’s expansion plans, future operating lease obligations will increase over amounts reported in
the Company’s 2013 annual report on Form 10-K by $0.9 million in 2015, $1.7 million in 2016, $1.7 million in 2017, $1.8
million in 2018 and $12.7 million in the years beyond 2018.
Contingencies
Contingencies, by their nature, relate to uncertainties that require the Company’s management to exercise judgment both in assessing the likelihood a liability has been incurred as well as in estimating the amount of potential loss. The most significant contingencies impacting the Company’s consolidated financial statements are those related to environmental remediation, litigation matters and the resolution of matters related to open tax years. Should all of these known items result in liabilities being incurred, the loss could be as high as $2.0 million. Additionally, the Company may become subject to significant claims of which its management is unaware, or the claims of which its management is aware, such as possible warranty claims on products that are beyond their warranty period but where a customer may claim to have provided notice of a defect while the product was under warranty. If these claims were to occur, it could result in the Company incurring a significantly greater liability than it anticipates.
Other
The Company is a party to litigation arising in the normal course of business. The Company regularly analyzes current information and, as necessary, provides accruals for liabilities that are probable of occurring and that can be reasonably estimated. The Company believes the effect on its consolidated results of operations, financial position and cash flows, if any, for the disposition of all matters pending as of September 30, 2014 will not be material.
10. Short-Term and Long-Term Borrowings
The following table presents the status of our lines of credit as of September 30, 2014 and December 31, 2013:
|
(in thousands)
|
Line Limit
|
In Use on
September 30, 2014
|
Restricted due to
Outstanding
Letters of Credit
|
Available on
September 30, 2014
|
Available on
December 31, 2013
|
|||||||||||||||
|
Otter Tail Corporation Credit Agreement
|
$ | 150,000 | $ | 39,000 | $ | 309 | $ | 110,691 | $ | 149,341 | ||||||||||
|
OTP Credit Agreement
|
170,000 | -- | 730 | 169,270 | 116,975 | |||||||||||||||
|
Total
|
$ | 320,000 | $ | 39,000 | $ | 1,039 | $ | 279,961 | $ | 266,316 | ||||||||||
On November 3, 2014 both the Otter Tail Corporation Credit Agreement and the OTP Credit Agreement were amended to extend the expiration dates by one year from October 29, 2018 to October 29, 2019.
On August 14, 2013 OTP entered into a Note Purchase Agreement (the 2013 Note Purchase Agreement) with the purchasers named therein, pursuant to which OTP agreed to issue to the purchasers, in a private placement transaction, $60 million aggregate principal amount of OTP’s 4.68% Series A Senior Unsecured Notes due February 27, 2029 (the Series A Notes) and $90 million aggregate principal amount of OTP’s 5.47% Series B Senior Unsecured Notes due February 27, 2044 (the Series B Notes and, together with the Series A Notes, the Notes). On February 27, 2014 OTP issued all $150 million aggregate principal amount of the Notes.
The 2013 Note Purchase Agreement states that OTP may prepay all or any part of the Notes (in an amount not less than 10% of the aggregate principal amount of the Notes then outstanding in the case of a partial prepayment) at 100% of the principal amount prepaid, together with accrued interest and a make-whole amount, provided that if no default or event of default under the 2013 Note Purchase Agreement exists, any optional prepayment made by OTP of (i) all of the Series A Notes then outstanding on or after November 27, 2028 or (ii) all of the Series B Notes then outstanding on or after November 27, 2043, will be made at 100% of the principal prepaid but without any make-whole amount. In addition, the 2013 Note Purchase Agreement states OTP must offer to prepay all of the outstanding Notes at 100% of the principal amount together with unpaid accrued interest in the event of a change of control of OTP.
The 2013 Note Purchase Agreement contains a number of restrictions on the business of OTP that became effective upon issuance of the Notes. These include restrictions on OTP’s ability to merge, sell assets, create or incur liens on assets, guarantee the obligations of any other party, and engage in transactions with related parties. The 2013 Note Purchase Agreement also contains affirmative covenants and events of default, as well as certain financial covenants. Specifically, OTP may not permit its Interest-bearing Debt (as defined in the 2013 Note Purchase Agreement) to exceed 60% of Total Capitalization (as defined in the 2013 Note Purchase Agreement), determined as of the end of each fiscal quarter. OTP is also restricted from allowing its Priority Indebtedness (as defined
| 31 |
in the 2013 Note Purchase Agreement) to exceed 20% of Total Capitalization, also determined as of the end of each fiscal quarter. The 2013 Note Purchase Agreement does not include provisions for the termination of the agreement or the acceleration of repayment of amounts outstanding due to changes in OTP’s credit ratings.
On February 27, 2014 OTP used a portion of the proceeds of the Notes to retire OTP’s $40.9 million unsecured term loan under a Credit Agreement with JPMorgan Chase Bank, N.A., and to repay $82.5 million of short-term debt then outstanding under OTP’s Second Amended and Restated Credit Agreement (the OTP Credit Agreement). Remaining proceeds of the Notes have been used to fund OTP construction program expenditures.
The following tables provide a breakdown of the Company’s consolidated short-term and long-term debt outstanding as of September 30, 2014 and December 31, 2013:
|
September 30, 2014 (in thousands)
|
OTP
|
Otter Tail Corporation
|
Otter Tail Corporation Consolidated
|
|||||||||
|
Short-Term Debt
|
$ | -- | $ | 39,000 | $ | 39,000 | ||||||
|
Long-Term Debt:
|
||||||||||||
|
9.000% Notes, due December 15, 2016
|
$ | 52,330 | 52,330 | |||||||||
|
Senior Unsecured Notes 5.95%, Series A, due August 20, 2017
|
33,000 | 33,000 | ||||||||||
|
Senior Unsecured Notes 4.63%, due December 1, 2021
|
140,000 | 140,000 | ||||||||||
|
Senior Unsecured Notes 6.15%, Series B, due August 20, 2022
|
30,000 | 30,000 | ||||||||||
|
Senior Unsecured Notes 6.37%, Series C, due August 20, 2027
|
42,000 | 42,000 | ||||||||||
|
Senior Unsecured Notes 4.68%, Series A, due February 27, 2029
|
60,000 | 60,000 | ||||||||||
|
Senior Unsecured Notes 6.47%, Series D, due August 20, 2037
|
50,000 | 50,000 | ||||||||||
|
Senior Unsecured Notes 5.47%, Series B, due February 27, 2044
|
90,000 | 90,000 | ||||||||||
|
North Dakota Development Note, 3.95%, due April 1, 2018
|
-- | 273 | 273 | |||||||||
|
Partnership in Assisting Community Expansion (PACE) Note,
2.54%, due March 18, 2021
|
-- | 1,136 | 1,136 | |||||||||
|
Total
|
$ | 445,000 | $ | 53,739 | $ | 498,739 | ||||||
|
Less: Current Maturities
|
-- | 198 | 198 | |||||||||
|
Unamortized Debt Discount
|
-- | 1 | 1 | |||||||||
|
Total Long-Term Debt
|
$ | 445,000 | $ | 53,540 | $ | 498,540 | ||||||
|
Total Short-Term and Long-Term Debt (with current maturities)
|
$ | 445,000 | $ | 92,738 | $ | 537,738 | ||||||
|
December 31, 2013 (in thousands)
|
OTP
|
Otter Tail Corporation
|
Otter Tail Corporation Consolidated
|
|||||||||
|
Short-Term Debt
|
$ | 51,195 | $ | -- | $ | 51,195 | ||||||
|
Long-Term Debt:
|
||||||||||||
|
Unsecured Term Loan - LIBOR plus 0.875%, due January 15, 2015
|
$ | 40,900 | $ | 40,900 | ||||||||
|
9.000% Notes, due December 15, 2016
|
$ | 52,330 | 52,330 | |||||||||
|
Senior Unsecured Notes 5.95%, Series A, due August 20, 2017
|
33,000 | 33,000 | ||||||||||
|
Senior Unsecured Notes 4.63%, due December 1, 2021
|
140,000 | 140,000 | ||||||||||
|
Senior Unsecured Notes 6.15%, Series B, due August 20, 2022
|
30,000 | 30,000 | ||||||||||
|
Senior Unsecured Notes 6.37%, Series C, due August 20, 2027
|
42,000 | 42,000 | ||||||||||
|
Senior Unsecured Notes 6.47%, Series D, due August 20, 2037
|
50,000 | 50,000 | ||||||||||
|
North Dakota Development Note, 3.95%, due April 1, 2018
|
-- | 325 | 325 | |||||||||
|
PACE Note, 2.54%, due March 18, 2021
|
-- | 1,223 | 1,223 | |||||||||
|
Total
|
$ | 335,900 | $ | 53,878 | $ | 389,778 | ||||||
|
Less: Current Maturities
|
-- | 188 | 188 | |||||||||
|
Unamortized Debt Discount
|
-- | 1 | 1 | |||||||||
|
Total Long-Term Debt
|
$ | 335,900 | $ | 53,689 | $ | 389,589 | ||||||
|
Total Short-Term and Long-Term Debt (with current maturities)
|
$ | 387,095 | $ | 53,877 | $ | 440,972 | ||||||
| 32 |
12. Pension Plan and Other Postretirement Benefits
Pension Plan—Components of net periodic pension benefit cost of the Company’s noncontributory funded pension plan are as follows:
|
Three Months Ended September 30,
|
Nine Months Ended September 30,
|
|||||||||||||||
|
(in thousands)
|
2014
|
2013
|
2014
|
2013
|
||||||||||||
|
Service Cost—Benefit Earned During the Period
|
$ | 1,150 | $ | 1,359 | $ | 3,499 | $ | 4,195 | ||||||||
|
Interest Cost on Projected Benefit Obligation
|
3,263 | 3,021 | 9,833 | 9,093 | ||||||||||||
|
Expected Return on Assets
|
(4,184 | ) | (3,627 | ) | (12,557 | ) | (10,891 | ) | ||||||||
|
Amortization of Prior-Service Cost:
|
||||||||||||||||
|
From Regulatory Asset
|
64 | 84 | 193 | 250 | ||||||||||||
|
From Other Comprehensive Income1
|
2 | 3 | 5 | 7 | ||||||||||||
|
Amortization of Net Actuarial Loss:
|
||||||||||||||||
|
From Regulatory Asset
|
809 | 1,624 | 2,545 | 4,950 | ||||||||||||
|
From Other Comprehensive Income1
|
22 | 42 | 68 | 132 | ||||||||||||
|
Net Periodic Pension Cost
|
$ | 1,126 | $ | 2,506 | $ | 3,586 | $ | 7,736 | ||||||||
|
1Corporate cost included in Other Nonelectric Expenses.
|
||||||||||||||||
Cash flows—The Company made discretionary plan contributions totaling $20,000,000 in January 2014. The Company currently is not required and does not expect to make an additional contribution to the plan in 2014. The Company also made a discretionary plan contribution of $10,000,000 in January 2013.
Executive Survivor and Supplemental Retirement Plan—Components of net periodic pension benefit cost of the Company’s unfunded, nonqualified benefit plan for executive officers and certain key management employees are as follows:
|
Three Months Ended September 30,
|
Nine Months Ended September 30,
|
|||||||||||||||
|
(in thousands)
|
2014
|
2013
|
2014
|
2013
|
||||||||||||
|
Service Cost—Benefit Earned During the Period
|
$ | 13 | $ | 12 | $ | 38 | $ | 38 | ||||||||
|
Interest Cost on Projected Benefit Obligation
|
380 | 352 | 1,140 | 1,056 | ||||||||||||
|
Amortization of Prior-Service Cost:
|
||||||||||||||||
|
From Regulatory Asset
|
5 | 6 | 16 | 16 | ||||||||||||
|
From Other Comprehensive Income1
|
13 | 13 | 39 | 39 | ||||||||||||
|
Amortization of Net Actuarial Loss:
|
||||||||||||||||
|
From Regulatory Asset
|
35 | 52 | 106 | 156 | ||||||||||||
|
From Other Comprehensive Income2
|
12 | 79 | 35 | 235 | ||||||||||||
|
Net Periodic Pension Cost
|
$ | 458 | $ | 514 | $ | 1,374 | $ | 1,540 | ||||||||
|
1Amortization of Prior Service Costs from Other Comprehensive Income Charged to:
|
||||||||||||||||
|
Electric Operation and Maintenance Expenses
|
$ | 6 | $ | 5 | $ | 16 | $ | 15 | ||||||||
|
Other Nonelectric Expenses
|
7 | 8 | 23 | 24 | ||||||||||||
|
2Amortization of Net Actuarial Loss from Other Comprehensive Income Charged to:
|
||||||||||||||||
|
Electric Operation and Maintenance Expenses
|
$ | 33 | $ | 49 | $ | 99 | $ | 145 | ||||||||
|
Other Nonelectric Expenses
|
(21 | ) | 30 | (64 | ) | 90 | ||||||||||
| 33 |
Postretirement Benefits—Components of net periodic postretirement benefit cost for health insurance and life insurance benefits for retired OTP and corporate employees, net of the effect of the Medicare Part D Subsidy:
|
Three Months Ended September 30,
|
Nine Months Ended September 30,
|
|||||||||||||||
|
(in thousands)
|
2014
|
2013
|
2014
|
2013
|
||||||||||||
|
Service Cost—Benefit Earned During the Period
|
$ | 263 | $ | 184 | $ | 791 | $ | 1,066 | ||||||||
|
Interest Cost on Projected Benefit Obligation
|
550 | 318 | 1,650 | 1,538 | ||||||||||||
|
Amortization of Prior-Service Cost:
|
||||||||||||||||
|
From Regulatory Asset
|
52 | 52 | 154 | 154 | ||||||||||||
|
From Other Comprehensive Income1
|
1 | 2 | 4 | 4 | ||||||||||||
|
Amortization of Net Actuarial Loss:
|
||||||||||||||||
|
From Regulatory Asset
|
-- | (478 | ) | -- | 18 | |||||||||||
|
From Other Comprehensive Income1
|
-- | (12 | ) | -- | -- | |||||||||||
|
Net Periodic Postretirement Benefit Cost
|
$ | 866 | $ | 66 | $ | 2,599 | $ | 2,780 | ||||||||
|
Effect of Medicare Part D Subsidy
|
$ | (237 | ) | $ | (227 | ) | $ | (711 | ) | $ | (1,355 | ) | ||||
|
1Corporate cost included in Other Nonelectric Expenses.
|
||||||||||||||||
13. Fair Value of Financial Instruments
The following methods and assumptions were used to estimate the fair value of each class of financial instruments for which it is practicable to estimate that value:
Cash and Short-Term Investments—The carrying amount approximates fair value because of the short-term maturity of those instruments.
Short-Term Debt—The carrying amount approximates fair value because the debt obligations are short-term and the balances outstanding as of September 30, 2014 and December 31, 2013 related to the Otter Tail Corporation Credit Agreement and the OTP Credit Agreement were subject to variable interest rates of LIBOR plus 1.75% and LIBOR plus 1.25%, respectively, which approximate market rates.
Long-Term Debt including Current Maturities—The fair value of the Company’s and OTP’s long-term debt is estimated based on the current market indications of rates available to the Company for the issuance of debt. The Company’s long-term debt subject to variable interest rates approximates fair value. The fair value measurements of the Company’s long-term debt issues fall into level 2 of the fair value hierarchy set forth in ASC 820.
|
September 30, 2014
|
December 31, 2013
|
|||||||||||||||
|
(in thousands)
|
Carrying
Amount
|
Fair Value
|
Carrying
Amount
|
Fair Value
|
||||||||||||
|
Cash and Cash Equivalents
|
$ | -- | $ | -- | $ | 1,150 | $ | 1,150 | ||||||||
|
Short-Term Debt
|
(39,000 | ) | (39,000 | ) | (51,195 | ) | (51,195 | ) | ||||||||
|
Long-Term Debt including Current Maturities
|
(498,738 | ) | (615,677 | ) | (389,777 | ) | (427,796 | ) | ||||||||
| 34 |
15. Income Tax Expense – Continuing Operations
The following table provides a reconciliation of income tax expense calculated at the net composite federal and state statutory rate on income from continuing operations before income taxes and income tax expense for continuing operations reported on the Company’s consolidated statements of income for the three and nine month periods ended September 30, 2014 and 2013:
|
Three Months Ended
September 30,
|
Nine Months Ended
September 30,
|
|||||||||||||||
|
(in thousands)
|
2014
|
2013
|
2014
|
2013
|
||||||||||||
|
Income Before Income Taxes – Continuing Operations
|
$ | 21,129 | $ | 19,959 | $ | 62,249 | $ | 50,677 | ||||||||
|
Tax Computed at Company’s Net Composite Federal and State Statutory Rate (39%)
|
8,240 | 7,784 | 24,277 | 19,764 | ||||||||||||
|
Increases (Decreases) in Tax from:
|
||||||||||||||||
|
Federal Production Tax Credits (PTCs)
|
(1,362 | ) | (1,162 | ) | (5,478 | ) | (4,592 | ) | ||||||||
|
Section 199 Domestic Production Activities Deduction
|
(416 | ) | -- | (1,123 | ) | -- | ||||||||||
|
North Dakota Wind Tax Credit Amortization – Net of Federal Taxes
|
(212 | ) | (212 | ) | (637 | ) | (651 | ) | ||||||||
|
Employee Stock Ownership Plan Dividend Deduction
|
(186 | ) | (190 | ) | (568 | ) | (568 | ) | ||||||||
|
AFUDC Equity
|
(164 | ) | (168 | ) | (461 | ) | (390 | ) | ||||||||
|
Investment Tax Credits
|
(127 | ) | (140 | ) | (380 | ) | (420 | ) | ||||||||
|
Corporate Owned Life Insurance
|
(17 | ) | (227 | ) | (328 | ) | (621 | ) | ||||||||
|
Research and Development Tax Credits
|
(219 | ) | (520 | ) | (219 | ) | (520 | ) | ||||||||
|
Property Related Adjustments
|
(152 | ) | (94 | ) | (77 | ) | 338 | |||||||||
|
Deferred Tax Asset Reduction - North Dakota due to Tax Rate Decrease
|
-- | -- | -- | 365 | ||||||||||||
|
Other Items - Net
|
91 | 62 | 244 | 408 | ||||||||||||
|
Income Tax Expense – Continuing Operations
|
$ | 5,476 | $ | 5,133 | $ | 15,250 | $ | 13,113 | ||||||||
|
Effective Income Tax Rate – Continuing Operations
|
25.9 | % | 25.7 | % | 24.5 | % | 25.9 | % | ||||||||
The following table summarizes the activity related to our unrecognized tax benefits:
|
(in thousands)
|
2014
|
2013
|
||||||
|
Balance on January 1
|
$ | 4,239 | $ | 4,436 | ||||
|
Increases Related to Tax Positions for Prior Years
|
256 | 97 | ||||||
|
Uncertain Positions Adjusted During Year
|
-- | (288 | ) | |||||
|
Balance on September 30
|
$ | 4,495 | $ | 4,245 | ||||
The balance of unrecognized tax benefits as of September 30, 2014 would not reduce our effective tax rate if recognized. The total amount of unrecognized tax benefits as of September 30, 2014 is not expected to change significantly within the next twelve months. The Company classifies interest and penalties on tax uncertainties as components of the provision for income taxes in its consolidated statement of income. No interest is accrued on tax uncertainties as of September 30, 2014.
The Company and its subsidiaries file a consolidated U.S. federal income tax return and various state and foreign income tax returns. As of September 30, 2014, with limited exceptions, the Company is no longer subject to examinations by taxing authorities for tax years prior to 2012. On September 13, 2013 the IRS and U.S. Treasury issued final regulations on the deductibility and capitalization of expenditures related to tangible property, generally effective for tax years beginning on or after January 1, 2014. Taxpayers were allowed to elect early adoption of the regulations for the 2012 or 2013 tax year. Deferred tax liabilities at September 30, 2014 are not materially affected by the regulations. The final regulations do not impact the effect of Revenue Procedure 2013-24 issued on April 30, 2013, which provided guidance for repairs related to generation property. Among other things, the Revenue Procedure listed units of property and material components of units of property for purposes of analyzing repair versus capitalization issues. The Company will adopt Revenue Procedure 2013-24 and the final tangible property regulations for income tax filings for tax year 2014.
| 35 |
17. Discontinued Operations
On February 8, 2013 the Company completed the sale of substantially all the assets of its waterfront equipment manufacturing company formerly included in the Company’s Manufacturing segment, for approximately $13.0 million in cash and received a working capital true up of approximately $2.4 million in June 2013. On November 30, 2012 the Company completed the sale of the assets of its former wind tower manufacturing company, and on February 29, 2012 the Company completed the sale of DMS Health Technologies, Inc. (DMS) and recorded an additional $0.2 million gain on the sale of DMS in the first quarter of 2013 related to a working capital true up. Following are summary presentations of the results of discontinued operations for the three and nine month periods ended September 30, 2014 and 2013, which mainly include residual revenues and expenses from the Company’s former wind tower and waterfront equipment manufacturers and the additional $0.2 million gain on the sale of DMS in the first quarter of 2013:
|
For the Three Months Ended
September 30,
|
For the Nine Months Ended
September 30,
|
|||||||||||||||
|
(in thousands)
|
2014
|
2013
|
2014
|
2013
|
||||||||||||
|
Operating Revenues
|
$ | -- | $ | -- | $ | -- | $ | 2,016 | ||||||||
|
Operating Expenses
|
(11 | ) | (452 | ) | (138 | ) | 2,094 | |||||||||
|
Operating Income (Loss)
|
11 | 452 | 138 | (78 | ) | |||||||||||
|
Other Income (Deductions)
|
277 | (101 | ) | 277 | 471 | |||||||||||
|
Income Tax Expense (Benefit)
|
116 | 39 | 166 | (35 | ) | |||||||||||
|
Net Income from Operations
|
172 | 312 | 249 | 428 | ||||||||||||
|
Gain on Disposition Before Taxes
|
-- | -- | -- | 216 | ||||||||||||
|
Income Tax Expense on Disposition
|
-- | -- | -- | 6 | ||||||||||||
|
Net Gain on Disposition
|
-- | -- | -- | 210 | ||||||||||||
|
Net Income
|
$ | 172 | $ | 312 | $ | 249 | $ | 638 | ||||||||
Following are summary presentations of the major components of assets and liabilities of discontinued operations as of September 30, 2014 and December 31, 2013:
|
(in thousands)
|
September 30, 2014
|
December 31, 2013
|
||||||
|
Current Assets
|
$ | 10 | $ | 38 | ||||
|
Assets of Discontinued Operations
|
$ | 10 | $ | 38 | ||||
|
Current Liabilities
|
$ | 3,300 | $ | 3,637 | ||||
|
Liabilities of Discontinued Operations
|
$ | 3,300 | $ | 3,637 | ||||
Included in current liabilities of discontinued operations are warranty reserves. Details regarding the warranty reserves follow:
|
(in thousands)
|
2014
|
2013
|
||||||
|
Warranty Reserve Balance, January 1
|
$ | 3,087 | $ | 5,027 | ||||
|
Provision for Warranties Used During the Year
|
-- | 120 | ||||||
|
Less Settlements Made During the Year
|
(13 | ) | (675 | ) | ||||
|
Decrease in Warranty Estimates for Prior Years
|
(175 | ) | (1,112 | ) | ||||
|
Warranty Reserve Balance, September 30
|
$ | 2,899 | $ | 3,360 | ||||
The warranty reserve balances as of September 30, 2014 and December 31, 2013 relate entirely to products produced by the Company’s former wind tower and waterfront equipment manufacturing companies. Expenses associated with remediation activities of these companies could be substantial. Although the assets of these companies have been sold and their operating results are reported under discontinued operations in the Company’s consolidated statements of income, the Company retains responsibility for warranty claims related to the products they produced prior to the sales of these companies. For wind towers, the potential exists for multiple claims based on one defect repeated throughout the production process or for claims where the cost to repair or replace the defective part is highly disproportionate to the original cost of the part. For example, if the Company is required to cover remediation expenses in addition to regular warranty coverage, the Company could be required to accrue additional expenses and experience additional unplanned cash expenditures which could adversely affect the Company’s consolidated results of operations and financial condition.
| 36 |
RESULTS OF OPERATIONS
Following is an analysis of the operating results of Otter Tail Corporation (the Company, we, us and our) by business segment for the three and nine month periods ended September 30, 2014 and 2013, followed by a discussion of changes in our consolidated financial position during the nine months ended September 30, 2014 and our business outlook for the remainder of 2014.
Comparison of the Three Months Ended September 30, 2014 and 2013
Consolidated operating revenues were $242.4 million for the three months ended September 30, 2014 compared with
$229.8 million for the three months ended September 30, 2013. Operating income was $28.3 million for the three months ended September 30, 2014 compared with $25.1 million for the three months ended September 30, 2013. The Company recorded diluted earnings per share from continuing operations of $0.43 for the three months ended September 30, 2014 compared to $0.41 for the three months ended September 30, 2013.
Amounts presented in the segment tables that follow for operating revenues, cost of goods sold and other nonelectric operating expenses for the three month periods ended September 30, 2014 and 2013 will not agree with amounts presented in the consolidated statements of income due to the elimination of intersegment transactions. The amounts of intersegment eliminations by income statement line item are listed below:
|
Intersegment Eliminations (in thousands)
|
September 30, 2014
|
September 30, 2013
|
||||||
|
Operating Revenues:
|
||||||||
|
Electric
|
$ | 34 | $ | 8 | ||||
|
Nonelectric
|
-- | (2 | ) | |||||
|
Cost of Products Sold
|
28 | 1 | ||||||
|
Cost of Construction Revenues Earned
|
2 | -- | ||||||
|
Other Nonelectric Expenses
|
4 | 5 | ||||||
Electric
|
Three Months Ended
|
||||||||||||||||
|
September 30,
|
%
|
|||||||||||||||
|
(in thousands)
|
2014
|
2013
|
Change
|
Change
|
||||||||||||
|
Retail Sales Revenues
|
$ | 78,944 | $ | 72,758 | $ | 6,186 | 8.5 | |||||||||
|
Wholesale Revenues – Company Generation
|
1,770 | 5,182 | (3,412 | ) | (65.8 | ) | ||||||||||
|
Net Revenue – Energy Trading Activity
|
129 | 353 | (224 | ) | (63.5 | ) | ||||||||||
|
Other Revenues
|
8,567 | 7,990 | 577 | 7.2 | ||||||||||||
|
Total Operating Revenues
|
$ | 89,410 | $ | 86,283 | $ | 3,127 | 3.6 | |||||||||
|
Production Fuel
|
15,121 | 18,785 | (3,664 | ) | (19.5 | ) | ||||||||||
|
Purchased Power – System Use
|
10,710 | 8,691 | 2,019 | 23.2 | ||||||||||||
|
Other Operation and Maintenance Expenses
|
33,346 | 30,626 | 2,720 | 8.9 | ||||||||||||
|
Depreciation and Amortization
|
11,033 | 10,787 | 246 | 2.3 | ||||||||||||
|
Property Taxes
|
3,178 | 3,163 | 15 | 0.5 | ||||||||||||
|
Operating Income
|
$ | 16,022 | $ | 14,231 | $ | 1,791 | 12.6 | |||||||||
|
Electric kilowatt-hour (kwh) Sales (in thousands)
|
||||||||||||||||
|
Retail kwh Sales
|
1,003,365 | 982,887 | 20,478 | 2.1 | ||||||||||||
|
Wholesale kwh Sales – Company Generation
|
58,992 | 158,486 | (99,494 | ) | (62.8 | ) | ||||||||||
|
Wholesale kwh Sales – Purchased Power Resold
|
43 | 81,609 | (81,566 | ) | (99.9 | ) | ||||||||||
|
Heating Degree Days
|
58 | 16 | 42 | 262.5 | ||||||||||||
|
Cooling Degree Days
|
262 | 400 | (138 | ) | (34.5 | ) | ||||||||||
| 37 |
Retail electric revenues increased $6.2 million as a result of:
|
|
●
|
a $3.6 million increase in Environmental Cost Recovery rider revenues related to earning a return in Minnesota and North Dakota on increasing amounts invested in the air quality control system (AQCS) under construction at Big Stone Plant,
|
|
|
●
|
a $1.9 million increase in fuel clause adjustment revenues and fuel and purchased power costs recovered in base rates driven by increased power purchases to meet higher retail kwh sales demand,
|
|
|
●
|
a $1.6 million increase in revenue due to a 2.1% increase in retail kwh sales mainly related to increased sales to pipeline customers, and
|
|
|
●
|
a $1.3 million increase in Transmission Cost Recovery rider revenues related to recovering costs and returns earned on increasing investments in transmission plant,
|
offset by:
|
|
●
|
an estimated $1.6 million decrease in revenues related to milder weather and fewer cooling degree days in the third quarter of 2014 compared with the third quarter of 2013,
|
|
|
●
|
a $0.4 million reduction in Big Stone II cost recovery rider revenues as the North Dakota share of abandoned plant costs were fully recovered by the end of March 2014, and
|
|
|
●
|
a $0.2 million decrease in renewable resource cost recovery rider revenues.
|
Wholesale electric revenues from company-owned generation decreased $3.4 million as a result of a 62.8% reduction in wholesale kwh sales combined with an 8.2% decrease in revenue per kwh sold. The decrease in wholesale kwh sales was related to a 17.6% decrease in kwhs generated by Otter Tail Power Company (OTP) generating units, mainly as a result of an extended spring maintenance shutdown of Hoot Lake Plant, which was offline for most of July and August of 2014, and curtailments in generation at Big Stone Plant to conserve fuel in response to delayed coal shipments. The decrease in revenue per kwh sold was related to a reduction in wholesale kwh prices due to cooler summer weather in 2014 compared with 2013.
Net revenue from energy trading activities, including net marked-to-market losses and gains on forward energy contracts, decreased $0.2 million as a result of decreased trading activity. In the third quarter of 2014, OTP decided to discontinue its trading activities that are not directly associated with serving retail customers by the end of 2014 due to a lack of market activity and profitable trading opportunities.
Other electric operating revenues increased $0.6 million mainly due to an increase in Midcontinent Independent System Operator, Inc. (MISO) tariff revenues resulting from increased investment in regional transmission lines and returns on and recovery of Capacity Expansion 2020 (CapX2020) and MISO-designated Multi-Value Project (MVP) investment costs and operating expenses.
Production fuel costs decreased $3.7 million as a result of a 20.7% decrease in kwhs generated from OTP’s steam-powered and combustion turbine generators. The decreases in kwh generation were mainly due to the extended maintenance shutdown of Hoot Lake Plant and curtailments in generation at Big Stone Plant to conserve fuel in response to delayed coal shipments.
The cost of purchased power to serve retail customers increased $2.0 million due to a 64.3% increase in kwhs purchased, partially offset by a 25.0% decrease in the cost per kwh purchased. The increase in kwhs purchased was driven by the need to make up for the reduction in generation from OTP’s coal-fired generating plants due to the extended maintenance shutdown of Hoot Lake Plant and curtailments in generation at Big Stone Plant. Lower wholesale prices were driven by reduced demand related to cooler summer weather in 2014 compared with 2013.
Electric operating and maintenance expenses increased $2.7 million as a result of:
|
|
●
|
a $1.9 million increase in contracted maintenance costs at Hoot Lake Plant related to a scheduled spring maintenance shutdown which extended into August of 2014 due to unanticipated maintenance issues encountered during the shutdown,
|
|
|
●
|
a $0.6 million increase in MISO transmission tariff charges related to increasing investments in regional CapX2020 and MISO-designated MVP transmission projects, and
|
|
|
●
|
a $0.5 million increase in expenditures for vegetation control and utility pole maintenance,
|
offset by:
|
|
●
|
a $0.3 million decrease in amortization of the North Dakota share of Big Stone II abandoned plant costs in conjunction with final recovery of those costs by the end of March 2014.
|
| 38 |
Manufacturing
|
Three Months Ended
|
||||||||||||||||
|
September 30,
|
%
|
|||||||||||||||
|
(in thousands)
|
2014
|
2013
|
Change
|
Change
|
||||||||||||
|
Operating Revenues
|
$ | 55,536 | $ | 49,323 | $ | 6,213 | 12.6 | |||||||||
|
Cost of Products Sold
|
42,314 | 37,197 | 5,117 | 13.8 | ||||||||||||
|
Operating Expenses
|
5,704 | 4,463 | 1,241 | 27.8 | ||||||||||||
|
Depreciation and Amortization
|
2,671 | 2,755 | (84 | ) | (3.0 | ) | ||||||||||
|
Operating Income
|
$ | 4,847 | $ | 4,908 | $ | (61 | ) | (1.2 | ) | |||||||
The increase in revenues in our Manufacturing segment relates to the following:
|
|
●
|
Revenues at BTD Manufacturing, Inc. (BTD), our metal parts stamping and fabrication company, increased $7.6 million mainly as a result of increased sales to customers in recreational, lawn and garden and energy-related end markets.
|
|
|
●
|
Revenues at T.O. Plastics, Inc. (T.O. Plastics), our manufacturer of thermoformed custom and horticultural products, decreased $1.3 million mainly due to discontinuing a cost-intensive, low-margin product packing process performed for a customer prior to 2014. While revenues have declined related to this, T.O. Plastics product mix improved resulting in a higher gross margin percentage and no change in gross profit compared with last year’s third quarter.
|
The increase in cost of products sold in our Manufacturing segment relates to the following:
|
|
●
|
Cost of products sold at BTD increased $6.5 million as a result of the increased sales volumes and material handling costs.
|
|
|
●
|
Cost of products sold at T.O. Plastics decreased $1.3 million mainly due to discontinuing a cost-intensive, low-margin product packing process performed for a customer prior to 2014.
|
The increase in operating expenses in our Manufacturing segment is mainly due to the following:
|
|
●
|
Operating expenses at BTD increased $1.1 million, mainly as a result of increases in labor, benefits and training costs related to staffing additions, employee development and increased sales.
|
|
|
●
|
Operating expenses at T.O. Plastics increased $0.2 million primarily as a result increases in selling expenses.
|
Plastics
|
Three Months Ended
|
||||||||||||||||
|
September 30,
|
%
|
|||||||||||||||
|
(in thousands)
|
2014
|
2013
|
Change
|
Change
|
||||||||||||
|
Operating Revenues
|
$ | 51,613 | $ | 46,659 | $ | 4,954 | 10.6 | |||||||||
|
Cost of Products Sold
|
43,098 | 37,281 | 5,817 | 15.6 | ||||||||||||
|
Operating Expenses
|
2,452 | 2,585 | (133 | ) | (5.1 | ) | ||||||||||
|
Depreciation and Amortization
|
825 | 887 | (62 | ) | (7.0 | ) | ||||||||||
|
Operating Income
|
$ | 5,238 | $ | 5,906 | $ | (668 | ) | (11.3 | ) | |||||||
The increase in Plastics segment revenues is the result of a 6.6% increase in pounds of polyvinyl chloride (PVC) pipe sold combined with a 3.7% increase in the price per pound of pipe sold. Significant increases in sales were seen in California, Minnesota, Washington, New Mexico, Oklahoma and Canada. The increase in cost of products sold is due to the increase in sales volume and an 8.4% increase in the cost per pound of pipe sold related to higher PVC resin costs. The decrease in operating expenses is due to a reduction in incentive compensation related to lower profit margins.
| 39 |
Construction
|
Three Months Ended
|
||||||||||||||||
|
September 30,
|
%
|
|||||||||||||||
|
(in thousands)
|
2014
|
2013
|
Change
|
Change
|
||||||||||||
|
Operating Revenues
|
$ | 45,846 | $ | 47,509 | $ | (1,663 | ) | (3.5 | ) | |||||||
|
Cost of Construction Revenues Earned
|
37,769 | 40,998 | (3,229 | ) | (7.9 | ) | ||||||||||
|
Operating Expenses
|
3,952 | 2,847 | 1,105 | 38.8 | ||||||||||||
|
Depreciation and Amortization
|
565 | 560 | 5 | 0.9 | ||||||||||||
|
Operating Income
|
$ | 3,560 | $ | 3,104 | $ | 456 | 14.7 | |||||||||
The decrease in revenues in our Construction segment reflects the following:
|
|
●
|
Revenues at Foley Company (Foley), a mechanical and prime contractor on industrial projects, decreased $4.0 million due to lower work volume in the third quarter of 2014 compared with the third quarter of 2013.
|
|
|
●
|
Revenues at Aevenia, Inc. (Aevenia), our electrical design and construction services company, increased $2.3 million due to a significant increase in electric transmission and distribution work in western North Dakota.
|
The decrease in cost of construction revenues earned in our Construction segment reflects the following:
|
|
●
|
Cost of construction revenues earned at Foley decreased $4.3 million as a result of lower work volume between the quarters.
|
|
|
●
|
Cost of construction revenues earned at Aevenia increased $1.1 million as a result of the increase in construction activity at Aevenia.
|
The increase in operating expenses in our Construction segment is mainly due to the following:
|
|
●
|
Foley’s operating expenses increased $0.3 million mainly as a result of an increase in incentive compensation related to Foley’s improved profitability between the quarters.
|
|
|
●
|
Aevenia’s operating expenses increased $0.8 million mainly as a result of an increase in incentive compensation driven by improved operating results.
|
In November 2014 we announced the review of strategic alternatives for our construction businesses.
Corporate
Corporate includes items such as corporate staff and overhead costs, the results of our captive insurance company and other items excluded from the measurement of operating segment performance. Corporate is not an operating segment. Rather it is added to operating segment totals to reconcile to totals on our consolidated statements of income.
|
Three Months Ended
|
||||||||||||||||
|
September 30,
|
%
|
|||||||||||||||
|
(in thousands)
|
2014
|
2013
|
Change
|
Change
|
||||||||||||
|
Operating Expenses
|
$ | 1,317 | $ | 2,967 | $ | (1,650 | ) | (55.6 | ) | |||||||
|
Depreciation and Amortization
|
28 | 50 | (22 | ) | (44.0 | ) | ||||||||||
The decrease in Corporate operating expenses between the quarters includes:
|
|
●
|
a $0.9 million decrease in general and administrative costs related to an increase in Corporate costs allocated to our operating companies, and
|
|
|
●
|
a $0.8 million reduction in accrued stock performance incentive expenses related to a decline in the corporation’s total shareholder return (TSR) ranking relative to the TSR rankings of its peers in the Edison Electric Institute in the third quarter of 2014.
|
| 40 |
Interest Charges
The $1.1 million increase in interest charges in the third quarter of 2014 compared with the third quarter of 2013 reflects:
|
|
●
|
a $1.9 million increase in interest expense related to the February 27, 2014 issuance of $60 million aggregate principal amount of OTP’s 4.68% Series A Senior Unsecured Notes due February 27, 2029 and $90 million aggregate principal amount of OTP’s 5.47% Series B Senior Unsecured Notes due February 27, 2044, and
|
|
|
●
|
a $0.3 million reduction in capitalized interest due to OTP being granted a return on funds invested in the Big Stone Plant AQCS through environmental cost recovery riders approved in Minnesota and North Dakota in December 2013, which resulted in the discontinuance of capitalized interest on the North Dakota and Minnesota share of the project and an increase in interest expense between the quarters,
|
offset by:
|
|
●
|
a $1.1 million reduction in interest expense related to the early retirement, in November 2013, of $47.7 million of our 9.0% unsecured notes due December 15, 2016.
|
Other Income
The $0.9 million decrease in other income in the three months ended September 30, 2014 compared with the three months ended September 30, 2013 includes a $0.5 million decrease in allowance for equity funds used in construction (AFUDC) revenue related to the Minnesota and North Dakota share of costs incurred in the construction of a new AQCS at OTP’s Big Stone Plant, which were subject to AFUDC through September of 2013 but not subject to AFUDC in 2014 as returns on amounts invested in this project are now being recovered under environmental cost recovery riders implemented in Minnesota and North Dakota in 2014, and a $0.2 million reduction in the cash value increase of corporate-owned life insurance.
Income Tax Expense – Continuing Operations
Income tax expense - continuing operations increased $0.3 million in the third quarter of 2014 compared with the third quarter of 2013, mainly as a result of an increase in income before income taxes. The following table provides a reconciliation of income tax expense calculated at our net composite federal and state statutory rate on income from continuing operations before income taxes and income tax expense for continuing operations reported on our consolidated statements of income for the three month periods ended September 30, 2014 and 2013:
|
Three Months Ended
September 30,
|
||||||||
|
(in thousands)
|
2014
|
2013
|
||||||
|
Income Before Income Taxes – Continuing Operations
|
$ | 21,129 | $ | 19,959 | ||||
|
Tax Computed at Company’s Net Composite Federal and State Statutory Rate (39%)
|
8,240 | 7,784 | ||||||
|
Increases (Decreases) in Tax from:
|
||||||||
|
Federal Production Tax Credits (PTCs)
|
(1,362 | ) | (1,162 | ) | ||||
|
Section 199 Domestic Production Activities Deduction
|
(416 | ) | -- | |||||
|
Research and Development Tax Credits
|
(219 | ) | (520 | ) | ||||
|
North Dakota Wind Tax Credit Amortization – Net of Federal Taxes
|
(212 | ) | (212 | ) | ||||
|
Employee Stock Ownership Plan Dividend Deduction
|
(186 | ) | (190 | ) | ||||
|
Allowance for Funds Used During Construction (AFUDC) Equity
|
(164 | ) | (168 | ) | ||||
|
Property Related Adjustments
|
(152 | ) | (94 | ) | ||||
|
Investment Tax Credits
|
(127 | ) | (140 | ) | ||||
|
Corporate Owned Life Insurance
|
(17 | ) | (227 | ) | ||||
|
Other Items - Net
|
91 | 62 | ||||||
|
Income Tax Expense – Continuing Operations
|
$ | 5,476 | $ | 5,133 | ||||
|
Effective Income Tax Rate – Continuing Operations
|
25.9 | % | 25.7 | % | ||||
Federal PTCs are recognized as wind energy is generated based on a per kwh rate prescribed in applicable federal statutes. OTP’s kwh generation from its wind turbines eligible for PTCs increased 18.3% in the three months ended September 30, 2014 compared with the three months ended September 30, 2013. North Dakota wind energy credits are based on dollars invested in qualifying facilities and are being recognized on a straight-line basis over 25 years.
| 41 |
Discontinued Operations
On February 8, 2013 we completed the sale of substantially all the assets of our former waterfront equipment manufacturing company, formerly included in our Manufacturing segment, for approximately $13.0 million in cash and received a working capital true up of approximately $2.4 million in June 2013. On November 30, 2012 we completed the sale of the assets of our former wind tower manufacturing company and on February 29, 2012 we completed the sale of DMS Health Technologies, Inc. (DMS) and recorded an additional $0.2 million gain on the sale of DMS in the first quarter of 2013 related to a working capital true up. Following are summary presentations of the results of discontinued operations for the three month periods ended September 30, 2014 and 2013, which mainly includes residual revenues and expenses from our former wind tower and waterfront equipment manufacturers:
|
For the Three Months Ended September 30,
|
||||||||
|
(in thousands)
|
2014
|
2013
|
||||||
|
Operating Revenues
|
$ | -- | $ | -- | ||||
|
Operating Expenses
|
(11 | ) | (452 | ) | ||||
|
Operating Income
|
11 | 452 | ||||||
|
Other Income (Deductions)
|
277 | (101 | ) | |||||
|
Income Tax Expense
|
116 | 39 | ||||||
|
Net Income
|
$ | 172 | $ | 312 | ||||
Comparison of the Nine Months Ended September 30, 2014 and 2013
Consolidated operating revenues were $717.5 million for the nine months ended September 30, 2014 compared with
$660.1 million for the nine months ended September 30, 2013. Operating income was $81.0 million for the nine months ended September 30, 2014 compared with $68.2 million for the nine months ended September 30, 2013. The Company recorded diluted earnings per share from continuing operations of $1.28 for the nine months ended September 30, 2014 compared to $1.02 for the nine months ended September 30, 2013 and total diluted earnings per share of $1.29 for the nine months ended September 30, 2014 compared to $1.04 for the nine months ended September 30, 2013.
Amounts presented in the segment tables that follow for operating revenues, cost of goods sold and other nonelectric operating expenses for the nine month periods ended September 30, 2014 and 2013 will not agree with amounts presented in the consolidated statements of income due to the elimination of intersegment transactions. The amounts of intersegment eliminations by income statement line item are listed below:
|
Intersegment Eliminations (in thousands)
|
September 30, 2014
|
September 30, 2013
|
||||||
|
Operating Revenues:
|
||||||||
|
Electric
|
$ | 81 | $ | 66 | ||||
|
Nonelectric
|
-- | 8 | ||||||
|
Cost of Products Sold
|
35 | 13 | ||||||
|
Cost of Construction Revenues Earned
|
2 | 2 | ||||||
|
Other Nonelectric Expenses
|
44 | 59 | ||||||
| 42 |
Electric
|
Nine Months Ended
|
||||||||||||||||
|
September 30,
|
%
|
|||||||||||||||
|
(in thousands)
|
2014
|
2013
|
Change
|
Change
|
||||||||||||
|
Retail Sales Revenues
|
$ | 267,808 | $ | 237,344 | $ | 30,464 | 12.8 | |||||||||
|
Wholesale Revenues – Company Generation
|
8,432 | 10,247 | (1,815 | ) | (17.7 | ) | ||||||||||
|
Net Revenue – Energy Trading Activity
|
268 | 1,294 | (1,026 | ) | (79.3 | ) | ||||||||||
|
Other Revenues
|
24,901 | 21,270 | 3,631 | 17.1 | ||||||||||||
|
Total Operating Revenues
|
$ | 301,409 | $ | 270,155 | $ | 31,254 | 11.6 | |||||||||
|
Production Fuel
|
49,754 | 52,341 | (2,587 | ) | (4.9 | ) | ||||||||||
|
Purchased Power – System Use
|
48,971 | 36,575 | 12,396 | 33.9 | ||||||||||||
|
Other Operation and Maintenance Expenses
|
107,742 | 98,878 | 8,864 | 9.0 | ||||||||||||
|
Depreciation and Amortization
|
32,722 | 32,090 | 632 | 2.0 | ||||||||||||
|
Property Taxes
|
9,536 | 9,088 | 448 | 4.9 | ||||||||||||
|
Operating Income
|
$ | 52,684 | $ | 41,183 | $ | 11,501 | 27.9 | |||||||||
|
Electric kwh Sales (in thousands)
|
||||||||||||||||
|
Retail kwh Sales
|
3,465,371 | 3,255,205 | 210,166 | 6.5 | ||||||||||||
|
Wholesale kwh Sales – Company Generation
|
189,322 | 333,743 | (144,421 | ) | (43.3 | ) | ||||||||||
|
Wholesale kwh Sales – Purchased Power Resold
|
17,266 | 131,463 | (114,197 | ) | (86.9 | ) | ||||||||||
|
Heating Degree Days
|
4,820 | 4,526 | 294 | 6.5 | ||||||||||||
|
Cooling Degree Days
|
375 | 516 | (141 | ) | (27.3 | ) | ||||||||||
Retail sales revenue increased $30.5 million as a result of:
|
|
●
|
an $11.3 million increase in fuel clause adjustment revenues and fuel and purchased power costs recovered in base rates driven by increased kwh purchases to meet higher retail kwh sales demand along with higher prices for purchased power,
|
|
|
●
|
a $9.6 million increase in Environmental Cost Recovery rider revenues related to earning a return in Minnesota and North Dakota on increasing amounts invested in the AQCS under construction at Big Stone Plant,
|
|
|
●
|
a $7.0 million increase in revenue related to a 6.5% increase in retail kwh sales mainly driven by increased sales to pipeline and commercial customers, but also due to a 3.0% increase in kwh sales to residential customers, and
|
|
|
●
|
a $5.1 million increase in Transmission Cost Recovery rider revenues related to recovering costs and earning returns on increased investments in transmission plant,
|
offset by:
|
|
●
|
a $1.1 million decrease in Renewable Resource Adjustment (RRA) rider revenues in North Dakota as a result of declining book values of renewable assets due to depreciation and reduced RRA requirements related to earning more PTCs as a result of a 19.4% increase in kwhs generated by OTP’s wind turbines eligible for PTCs,
|
|
|
●
|
a $0.7 million reduction in Big Stone II cost recovery rider revenues as the North Dakota share of abandoned plant costs were fully recovered in March 2014,
|
|
|
●
|
a $0.5 million decrease in revenues related to reductions in conservation program costs and incentives recoverable under conservation improvement program rates, and
|
|
|
●
|
a $0.2 million decrease in revenue related to the over recovery of rate case related expenses in Minnesota.
|
A portion of the increase in residential and commercial kwh sales was related to colder weather in the first quarter of 2014 compared with the first quarter of 2013. Retail kwh sales also increased as a result of an increase in the volume of oil transported by pipeline customers.
Wholesale electric revenues from company-owned generation decreased $1.8 million as a result of a 43.3% reduction in wholesale kwh sales, partially offset by a 45.1% increase in revenue per wholesale kwh sold. The decrease in wholesale kwh sales was the result of having less generation available for sale in the second and third quarters of 2014 as a result of the extended maintenance shutdown of Hoot Lake Plant, which was offline for most of the second and third quarters of 2014, and curtailments in generation at Big Stone Plant to conserve fuel in response to delayed coal shipments. The increase in wholesale prices was driven by increased wholesale market demand in the first quarter of 2014 resulting from cold weather.
| 43 |
Net revenue from energy trading activities, including net marked-to-market gains and losses on forward energy contracts, decreased $1.0 million mainly as a result of decreased trading activity and the incurrence of losses on contracts entered into and settled in the first half of 2014. In the third quarter of 2014, OTP decided to discontinue its trading activities that are not directly associated with serving retail customers by the end of 2014 due to a lack of market activity and profitable trading opportunities.
The $3.6 million increase in other electric operating revenues includes:
|
|
●
|
a $3.1 million increase in MISO Schedules 26 and 26A transmission tariff revenues related to increased investment in regional transmission lines and driven in part by returns on and recovery of CapX2020 and MISO designated MVP investment costs and operating expenses, and
|
|
|
●
|
a $0.4 million increase in revenue from steam sales to an ethanol producer adjacent to OTP’s Big Stone Plant site.
|
Production fuel costs decreased $2.6 million as a result of a 7.6% decrease in kwhs generated from OTP’s steam-powered and combustion turbine generators. The decrease in kwh generation was mainly due to the extended maintenance shutdown of Hoot Lake Plant in the second and third quarters of 2014 and curtailments in generation at Big Stone Plant to conserve fuel in response to delayed coal shipments in the third quarter of 2014.
The cost of purchased power to serve retail customers increased $12.4 million due to a 21.7% increase in kwhs purchased in combination with a 10.0% increase in costs per kwh purchased. The increase in kwhs purchased was driven by increased demand from retail customers. The increase in costs per kwh purchased was driven by increased wholesale market demand resulting from colder weather in the first quarter of 2014.
Electric operating and maintenance expenses increased $8.9 million as a result of:
|
|
●
|
a $5.3 million increase in contracted maintenance and material and supplies costs at Hoot Lake Plant related to a scheduled maintenance shutdown which was extended several weeks due to unanticipated maintenance issues encountered during the shutdown,
|
|
|
●
|
a $2.8 million increase in MISO transmission tariff charges related to increasing investments in regional CapX2020 and MISO-designated MVP transmission projects,
|
|
|
●
|
a $0.9 million increase in material and supply and contractor costs related to required generation plant maintenance at Big Stone Plant, Coyote Station and two of OTP’s wind farms,
|
|
|
●
|
a $0.7 million increase in expenditures for vegetation maintenance and control,
|
|
|
●
|
a $0.6 million increase in software licensing, upgrade and maintenance fees,
|
|
|
●
|
a $0.4 million increase in other contracted service costs, and
|
|
|
●
|
a $0.2 million increase in insurance costs,
|
offset by:
|
|
●
|
a $1.4 million reduction in labor and benefit expenses mainly due to decreases in pension and retirement health benefit costs resulting from higher discount rates on projected benefit obligations, and
|
|
|
●
|
a $0.7 million reduction in Big Stone II costs which were fully amortized and recovered in March 2014.
|
The $0.6 million increase in depreciation expense was primarily driven by higher software related costs currently being amortized and increased capital replacement costs on OTP’s wind farms. There was also an adjustment made to the wind farm lives which has increased depreciation. Offsetting these increases is a lengthening of the life of transmission and distribution lines.
The $0.4 million increase in property tax expense is due to higher property valuations for transmission and distribution property in Minnesota and South Dakota.
| 44 |
Manufacturing
|
Nine Months Ended
|
||||||||||||||||
|
September 30,
|
%
|
|||||||||||||||
|
(in thousands)
|
2014
|
2013
|
Change
|
Change
|
||||||||||||
|
Operating Revenues
|
$ | 164,341 | $ | 152,282 | $ | 12,059 | 7.9 | |||||||||
|
Cost of Products Sold
|
125,698 | 113,970 | 11,728 | 10.3 | ||||||||||||
|
Operating Expenses
|
16,029 | 14,282 | 1,747 | 12.2 | ||||||||||||
|
Depreciation and Amortization
|
7,941 | 8,541 | (600 | ) | (7.0 | ) | ||||||||||
|
Operating Income
|
$ | 14,673 | $ | 15,489 | $ | (816 | ) | (5.3 | ) | |||||||
The increase in revenues in our Manufacturing segment reflects the following:
|
|
●
|
Revenues at BTD increased $18.4 million mainly as a result of increased sales to customers in recreational, lawn and garden and energy-related end markets.
|
|
|
●
|
Revenues at T.O. Plastics decreased $6.4 million, mainly due to discontinuing a cost-intensive, low-margin product packing process performed for a customer prior to 2014.
|
The increase in cost of products sold in our Manufacturing segment reflects the following:
|
|
●
|
Cost of products sold at BTD increased $17.1 million as a result of increased material and labor costs related to an increase in sales volume, increased product handling costs and the incurrence of additional tooling costs to repair and refurbish several dies in 2014.
|
|
|
●
|
Cost of products sold at T.O. Plastics decreased $5.3 million mainly as a result of decreased material costs related to the product packaging process that was discontinued in 2014.
|
The increase in operating expenses in our Manufacturing segment is mainly due to the following:
|
|
●
|
Operating expenses at BTD increased $1.5 million due to increased labor, benefits and training costs related to staffing additions, employee development, increased sales and an increase in allocated corporate costs.
|
|
|
●
|
Operating expenses at T.O. Plastics increased $0.3 million mainly due to an increase in allocated corporate costs.
|
Depreciation expense decreased $0.4 million at BTD and $0.2 million at T.O. Plastics as a result of certain assets reaching the end of their depreciable lives.
Plastics
|
Nine Months Ended
|
||||||||||||||||
|
September 30,
|
%
|
|||||||||||||||
|
(in thousands)
|
2014
|
2013
|
Change
|
Change
|
||||||||||||
|
Operating Revenues
|
$ | 140,186 | $ | 128,820 | $ | 11,366 | 8.8 | |||||||||
|
Cost of Products Sold
|
113,838 | 100,644 | 13,194 | 13.1 | ||||||||||||
|
Operating Expenses
|
6,994 | 6,262 | 732 | 11.7 | ||||||||||||
|
Depreciation and Amortization
|
2,544 | 2,483 | 61 | 2.5 | ||||||||||||
|
Operating Income
|
$ | 16,810 | $ | 19,431 | $ | (2,621 | ) | (13.5 | ) | |||||||
The increase in Plastics segment revenue is the result of a 7.8% increase in pounds of PVC pipe sold, combined with a 1.0% increase in the price per pound of pipe sold. States with significant increases in sales were Minnesota, California, North Dakota, Colorado, Nevada and New Mexico. Cost of products sold increased by $13.2 million due to the increase in sales volume and a 5.0% increase in the cost per pound of pipe sold related to higher PVC resin and labor costs. The $1.8 million reduction in margins combined with a $0.7 million increase in operating expenses related to an increase in allocated corporate costs and a $0.1 million increase in depreciation expense resulted in the $2.6 million decline in Plastics segment operating income between the periods.
| 45 |
Construction
|
Nine Months Ended
|
||||||||||||||||
|
September 30,
|
%
|
|||||||||||||||
|
(in thousands)
|
2014
|
2013
|
Change
|
Change
|
||||||||||||
|
Operating Revenues
|
$ | 111,599 | $ | 108,928 | $ | 2,671 | 2.5 | |||||||||
|
Cost of Construction Revenues Earned
|
94,012 | 96,875 | (2,863 | ) | (3.0 | ) | ||||||||||
|
Operating Expenses
|
10,424 | 8,981 | 1,443 | 16.1 | ||||||||||||
|
Depreciation and Amortization
|
1,575 | 1,518 | 57 | 3.8 | ||||||||||||
|
Operating Income
|
$ | 5,588 | $ | 1,554 | $ | 4,034 | 259.6 | |||||||||
The increase in revenues in our Construction segment reflects the following:
|
|
●
|
Revenues at Foley decreased $3.2 million mainly due to lower work volume in 2014 compared with 2013.
|
|
|
●
|
Revenues at Aevenia increased $5.9 million mainly due to increased electric transmission and distribution work in western North Dakota.
|
The decrease in cost of construction revenues earned in our Construction segment reflects the following:
|
|
●
|
Cost of construction revenues earned at Foley decreased $5.5 million mainly as a result of a $10.1 million decrease in material costs related to a reduction in material intensive jobs, partially offset by a $4.6 million increase in subcontractor, labor and equipment rental costs.
|
|
|
●
|
Cost of construction revenues earned at Aevenia increased $2.7 million mainly as a result of the increase in electric transmission and distribution work in western North Dakota.
|
The increase in operating expenses in our Construction segment reflects the following:
|
|
●
|
Foley’s operating expenses increased $0.8 million between the periods, mainly due to incentive compensation and in part to severance costs related to workforce reductions, partially offset by lower legal fees.
|
|
|
●
|
Aevenia’s operating expenses increased $0.6 million due to an increase in incentive compensation driven by increased sales and profits.
|
Corporate
Corporate includes items such as corporate staff and overhead costs, the results of our captive insurance company and other items excluded from the measurement of operating segment performance. Corporate is not an operating segment. Rather it is added to operating segment totals to reconcile to totals on our consolidated statements of income.
|
Nine Months Ended
|
||||||||||||||||
|
September 30,
|
%
|
|||||||||||||||
|
(in thousands)
|
2014
|
2013
|
Change
|
Change
|
||||||||||||
|
Operating Expenses
|
$ | 8,683 | $ | 9,345 | $ | (662 | ) | (7.1 | ) | |||||||
|
Depreciation and Amortization
|
89 | 162 | (73 | ) | (45.1 | ) | ||||||||||
Corporate operating expenses decreased $0.7 million reflecting:
|
|
●
|
a $2.2 million increase in corporate operating expenses allocated to the corporation’s operating segments,
|
|
|
●
|
a $0.6 million net reduction in labor and benefit costs driven in part by a decrease in accrued stock performance incentive expenses related to a decline in the corporation’s TSR ranking relative to the TSR rankings of its peers in the Edison Electric Institute in the third quarter of 2014, and
|
|
|
●
|
a $0.2 million decrease in directors’ compensation expense related to the accelerated recognition of share-based compensation in 2013 for directors who did not serve full three-year terms,
|
offset by:
|
|
●
|
a $2.4 million charge related to the early termination of an airplane lease in the second quarter of 2014, as recent divestitures reduced the need for the airplane.
|
| 46 |
Interest Charges
The $1.5 million increase in interest charges in the first nine months of 2014 compared with the first nine months of 2013, primarily reflects:
|
|
●
|
a $4.5 million increase in interest expense related to the February 27, 2014 issuance of $60 million aggregate principal amount of OTP’s 4.68% Series A Senior Unsecured Notes due February 27, 2029 and $90 million aggregate principal amount of OTP’s 5.47% Series B Senior Unsecured Notes due February 27, 2044, and
|
|
|
●
|
a $0.3 million reduction in capitalized interest due to OTP being granted a return on funds invested in the Big Stone Plant AQCS through environmental cost recovery riders approved in Minnesota and North Dakota in December 2013, which resulted in the discontinuance of capitalized interest on the North Dakota and Minnesota share of the project and an increase in interest expense between the periods.
|
offset by:
|
|
●
|
a $3.2 million reduction in interest expense related to the early retirement of $47.7 million of our 9.0% unsecured notes due December 15, 2016, in November 2013.
|
Income Tax Expense – Continuing Operations
Income tax expense - continuing operations increased $2.1 million in the first nine months of 2014 compared with the first nine months of 2013. The following table provides a reconciliation of income tax expense calculated at our net composite federal and state statutory rate on income from continuing operations before income taxes and income tax expense for continuing operations reported on our consolidated statements of income for the nine month periods ended September 30, 2014 and 2013:
|
Nine Months Ended September 30,
|
||||||||
|
(in thousands)
|
2014
|
2013
|
||||||
|
Income Before Income Taxes – Continuing Operations
|
$ | 62,249 | $ | 50,677 | ||||
|
Tax Computed at Company’s Net Composite Federal and State Statutory Rate (39%)
|
24,277 | 19,764 | ||||||
|
Increases (Decreases) in Tax from:
|
||||||||
|
Federal PTCs
|
(5,478 | ) | (4,592 | ) | ||||
|
Section 199 Domestic Production Activities Deduction
|
(1,123 | ) | -- | |||||
|
North Dakota Wind Tax Credit Amortization – Net of Federal Taxes
|
(637 | ) | (651 | ) | ||||
|
Employee Stock Ownership Plan Dividend Deduction
|
(568 | ) | (568 | ) | ||||
|
AFUDC Equity
|
(461 | ) | (390 | ) | ||||
|
Investment Tax Credits
|
(380 | ) | (420 | ) | ||||
|
Corporate Owned Life Insurance
|
(328 | ) | (621 | ) | ||||
|
Research and Development Tax Credits
|
(219 | ) | (520 | ) | ||||
|
Deferred Tax Asset Reduction - North Dakota due to Tax Rate Decrease
|
-- | 365 | ||||||
|
Property Related Adjustments
|
(77 | ) | 338 | |||||
|
Other Items – Net
|
244 | 408 | ||||||
|
Income Tax Expense – Continuing Operations
|
$ | 15,250 | $ | 13,113 | ||||
|
Effective Income Tax Rate – Continuing Operations
|
24.5 | % | 25.9 | % | ||||
Federal PTCs are recognized as wind energy is generated based on a per kwh rate prescribed in applicable federal statutes. OTP’s kwh generation from its wind turbines eligible for PTCs increased 19.4% in the nine months ended September 30, 2014 compared with the nine months ended September 30, 2013. North Dakota wind energy credits are based on dollars invested in qualifying facilities and are being recognized on a straight-line basis over 25 years.
| 47 |
Discontinued Operations
On February 8, 2013 we completed the sale of substantially all the assets of our former waterfront equipment manufacturing company, formerly included in our Manufacturing segment, for approximately $13.0 million in cash and received a working capital true up of approximately $2.4 million in June 2013. On November 30, 2012 we completed the sale of the assets of our former wind tower manufacturing company and on February 29, 2012 we completed the sale of DMS and recorded an additional $0.2 million gain on the sale of DMS in the first quarter of 2013 related to a working capital true up. Following are summary presentations of the results of discontinued operations for the nine month periods ended September 30, 2014 and 2013, which mainly includes residual revenues and expenses from our former wind tower and waterfront equipment manufacturers and the additional $0.2 million gain on the sale of DMS in the first quarter of 2013:
|
For the Nine Months Ended
September 30,
|
||||||||
|
(in thousands)
|
2014
|
2013
|
||||||
|
Operating Revenues
|
$ | -- | $ | 2,016 | ||||
|
Operating Expenses
|
(138 | ) | 2,094 | |||||
|
Operating Income (Loss)
|
138 | (78 | ) | |||||
|
Other Income
|
277 | 471 | ||||||
|
Income Tax Expense (Benefit)
|
166 | (35 | ) | |||||
|
Net Income from Operations
|
249 | 428 | ||||||
|
Gain on Disposition Before Taxes
|
-- | 216 | ||||||
|
Income Tax Expense on Disposition
|
-- | 6 | ||||||
|
Net Gain on Disposition
|
-- | 210 | ||||||
|
Net Income
|
$ | 249 | $ | 638 | ||||
FINANCIAL POSITION
The following table presents the status of our lines of credit as of September 30, 2014 and December 31, 2013:
|
(in thousands)
|
Line Limit
|
In Use on
September 30, 2014
|
Restricted due to
Outstanding Letters of Credit
|
Available on
September 30, 2014
|
Available on
December 31, 2013
|
|||||||||||||||
|
Otter Tail Corporation Credit Agreement
|
$ | 150,000 | $ | 39,000 | $ | 309 | $ | 110,691 | $ | 149,341 | ||||||||||
|
OTP Credit Agreement
|
170,000 | -- | 730 | 169,270 | 116,975 | |||||||||||||||
|
Total
|
$ | 320,000 | $ | 39,000 | $ | 1,039 | $ | 279,961 | $ | 266,316 | ||||||||||
We believe we have the necessary liquidity to effectively conduct business operations for an extended period if needed. Our balance sheet is strong and we are in compliance with our debt covenants. Financial flexibility is provided by operating cash flows, unused lines of credit, strong financial coverages, investment grade credit ratings and alternative financing arrangements such as leasing.
We believe our financial condition is strong and our cash, other liquid assets, operating cash flows, existing lines of credit, access to capital markets and borrowing ability because of investment-grade credit ratings, when taken together, provide adequate resources to fund ongoing operating requirements and future capital expenditures related to expansion of existing businesses and development of new projects. On May 11, 2012 we filed a shelf registration statement with the Securities and Exchange Commission under which we may offer for sale, from time to time, either separately or together in any combination, equity, debt or other securities described in the shelf registration statement, which expires on May 10, 2015. On May 14, 2012, we entered into a Distribution Agreement with J.P. Morgan Securities (JPMS) under which we may offer and sell our common shares from time to time through JPMS, as our distribution agent, up to an aggregate sales price of $75 million. In the third quarter of 2014 we received proceeds of $2,313,000 net of $46,000 paid to JPMS from the issuance of 81,135 shares under this program.
| 48 |
Equity or debt financing will be required in the period 2014 through 2018 given the expansion plans related to our Electric segment to fund construction of new rate base investments, in the event we decide to reduce borrowings under our lines of credit or refund or retire early any of our presently outstanding debt, to complete acquisitions or for other corporate purposes. Also, our operating cash flow and access to capital markets can be impacted by macroeconomic factors outside our control. In addition, our borrowing costs can be impacted by changing interest rates on short-term and long-term debt and ratings assigned to us by independent rating agencies, which in part are based on certain credit measures such as interest coverage and leverage ratios.
The determination of the amount of future cash dividends to be declared and paid will depend on, among other things, our financial condition, earnings per share, cash flows from operations, the level of our capital expenditures and our future business prospects. As a result of certain statutory limitations or regulatory or financing agreements, restrictions could occur on the amount of distributions that are allowed to be made by our subsidiaries. See note 8 to consolidated financial statements for more information. The decision to declare a dividend is reviewed quarterly by the Board of Directors. In 2014 our Board of Directors increased the quarterly dividend from $0.2975 to $0.3025 per common share.
Cash provided by operating activities of continuing operations was $47.4 million for the nine months ended September 30, 2014 compared with $95.8 million for the nine months ended September 30, 2013. The major contributing factors to the $48.4 million decrease in cash provided by operating activities between the periods was a $37.8 million increase in cash used for working capital items associated with year over year revenue growth and a $10.0 million increase in discretionary contributions to our pension plan. The following major items contributed $36.3 million to the increase in cash used for working capital between the periods:
|
|
●
|
Foley’s accounts payable and billings in excess of costs decreased $15.1 million in the first nine months of 2014 compared with a $5.8 million increase in accounts payable and billings in excess of costs in the first nine months of 2013, as accelerated cash payments received on certain jobs at Foley at the end of 2013 enabled them to pay for increased costs incurred on a higher level of construction activity in the first half of 2014 compared with the first half of 2013.
|
|
|
●
|
In the Plastics segment, accounts receivable and inventories increased $13.6 million in the first nine months of 2014 compared with an increase of $2.9 million in the first nine months of 2013. The greater increase in receivables and inventories in the Plastic segment in 2014 corresponds with a 7.8% increase in sales volume, an 8.8% increase in revenues and higher material, freight, labor and utility costs compared with the first nine months of 2013.
|
|
|
●
|
In the Electric segment, accounts payable related to operating activities decreased $4.5 million in the first nine months of 2014 compared to an increase of $0.2 million in the first nine months of 2013.
|
Net cash used in investing activities of continuing operations was $124.1 million for the nine months ended September 30, 2014 compared with $107.8 million for the nine months ended September 30, 2013 due to a $19.1 million increase in cash used for capital expenditures in the Electric segment, as construction of the Big Stone Plant AQCS remains on pace and OTP continues to invest in major transmission grid upgrades and improvements, offset by a $2.6 million reduction in capital expenditures at our construction companies. Net proceeds from the sale of discontinued operations of $12.8 million in the first nine months of 2013 reflect $14.5 million in net proceeds from the sale of the assets of our former waterfront equipment manufacturer net of a $1.7 million working capital settlement paid to the buyer of DMS, which was sold in the first quarter of 2012.
Net cash provided by financing activities in the nine months ended September 30, 2014 of $75.6 million compares with net cash provided by financing activities in the nine months ended September 30, 2013 of $8.6 million. Net cash provided by financing activities in the first nine months of 2014 mainly reflects the issuance by OTP of $150 million in privately placed unsecured notes in two series on February 27, 2014, and the use of a portion of the proceeds of the notes to retire OTP’s $40.9 million unsecured term loan and to repay short-term debt outstanding under the OTP Credit Agreement which was being used to finance OTP’s construction activities. Financing activities in the first nine months of 2014 also reflect: (1) the payment of $33.0 million in common stock dividends, (2) OTP’s repayment of $51.2 million in short-term debt under the OTP Credit Agreement outstanding on December 31, 2013, and (3) the borrowing of $39.0 million under the Otter Tail Corporation Credit Agreement to fund the working capital needs of our manufacturing and infrastructure companies. Financing cash flows for the first nine months of 2014 also include $12.9 million in net cash proceeds from the issuance of common stock. In 2014, we began issuing common shares to meet the requirements of our dividend reinvestment and share purchase plan, employee stock ownership plan and employee stock purchase plan, rather than purchasing shares in the open market. In the second quarter of 2014 we began issuing common shares using our At-the-Market offering program under our Distribution Agreement with JPMS.
| 49 |
Net cash provided by financing activities of continuing operations of $8.6 million in the nine months ended September 30, 2013 reflects $40.3 million in proceeds from short term borrowings at OTP to fund its capital expenditures and $1.5 million from the issuance of shares of common stock, offset by $33.0 million in common and preferred stock dividend payments. On March 1, 2013 OTP used proceeds from a $40.9 million unsecured term loan to fund the redemption of all $25.1 million of the then outstanding 4.65% Grant County, South Dakota Pollution Control Refunding Revenue Bonds and 4.85% Mercer County, North Dakota Pollution Control Refunding Revenue Bonds, and to pay off an intercompany note to us that mirrored our $15.5 million in outstanding cumulative preferred shares, which were also redeemed on March 1, 2013.
CAPITAL REQUIREMENTS
2014-2018 Capital Expenditures
The following table shows our 2013 capital expenditures, 2014-2018 projected electric utility average rate base and updated 2014-2018 anticipated capital expenditures reflecting additional expenditures in 2018 for a generation facility to replace Hoot Lake Plant, expected reductions in costs for the Big Stone Plant AQCS, an acceleration of expenditures for transmission line construction and recently approved capital expenditures at BTD to facilitate expansion of services to customers:
|
(in millions)
|
2013
Actual
|
2014
|
2015
|
2016
|
2017
|
2018
|
||||||||||||||||||
|
Capital Expenditures:
|
||||||||||||||||||||||||
|
Electric Segment:
|
||||||||||||||||||||||||
|
Transmission
|
$ | 55 | $ | 55 | $ | 98 | $ | 63 | $ | 63 | ||||||||||||||
|
Environmental
|
73 | 50 | -- | -- | -- | |||||||||||||||||||
|
Other
|
34 | 43 | 45 | 41 | 80 | |||||||||||||||||||
|
Total Electric Segment
|
$ | 149 | $ | 162 | $ | 148 | $ | 143 | $ | 104 | $ | 143 | ||||||||||||
|
Manufacturing and Infrastructure Segments
|
15 | 21 | 35 | 24 | 24 | 28 | ||||||||||||||||||
|
Total Capital Expenditures
|
$ | 164 | $ | 183 | $ | 183 | $ | 167 | $ | 128 | $ | 171 | ||||||||||||
|
Total Electric Utility Average Rate Base
|
$ | 885 | $ | 991 | $ | 1,062 | $ | 1,120 | $ | 1,152 | ||||||||||||||
Execution on the currently anticipated electric utility capital expenditure plan is expected to grow rate base and be a key driver in increasing utility earnings over the 2014 through 2018 timeframe.
Ashtabula III Wind Farm
OTP has a purchased wind power agreement with the owner of the Ashtabula III wind farm. In connection with this agreement, OTP has the option to purchase the wind farm for approximately $50 million in the 2023 timeframe.
Contractual Obligations
Our contractual obligations reported in the table on page 53 of our Annual Report on Form 10-K for the year ended December 31, 2013 increased $395 million in the first ten months of 2014. Our debt obligations increased $150 million for the years beyond 2018 and our interest obligations on long-term debt increased by $3.9 million for 2014, $15.5 million for 2015 and 2016, $15.5 million for 2017 and 2018 and $155 million for the years beyond 2018 as a result of OTP’s February 27, 2014 borrowings under OTP’s 2013 Note Purchase Agreement. Our obligations related to capacity and energy requirements increased $20.5 million for the years beyond 2018 when OTP entered into an agreement to purchase on-peak energy for 2019 and 2020 on October 7, 2014. Our purchase obligations increased $16.0 million for 2015 and our operating lease obligations increased $2.6 million for 2015 and 2016, $3.5 million for 2017 and 2018 and $12.7 million for the years beyond 2018 in connection with contracts for construction projects at BTD.
| 50 |
CAPITAL RESOURCES
Short-Term Debt
On October 29, 2012 we entered into a Third Amended and Restated Credit Agreement (the Otter Tail Corporation Credit Agreement), which is an unsecured $150 million revolving credit facility that may be increased to $250 million on the terms and subject to the conditions described in the Otter Tail Corporation Credit Agreement. On November 3, 2014 the Otter Tail Corporation Credit Agreement was amended to extend its expiration date by one year from October 29, 2018 to October 29, 2019. We can draw on this credit facility to refinance certain indebtedness and support our operations and the operations of our subsidiaries. Borrowings under the Otter Tail Corporation Credit Agreement bear interest at LIBOR plus 1.75%, subject to adjustment based on our senior unsecured credit ratings. We are required to pay commitment fees based on the average daily unused amount available to be drawn under the revolving credit facility. The Otter Tail Corporation Credit Agreement contains a number of restrictions on us and the businesses of the Company’s wholly-owned subsidiary, Varistar Corporation, and its subsidiaries, including restrictions on our and their ability to merge, sell assets, make investments, create or incur liens on assets, guarantee the obligations of certain other parties and engage in transactions with related parties. The Otter Tail Corporation Credit Agreement also contains affirmative covenants and events of default, and financial covenants as described below under the heading “Financial Covenants.” The Otter Tail Corporation Credit Agreement does not include provisions for the termination of the agreement or the acceleration of repayment of amounts outstanding due to changes in our credit ratings. Our obligations under the Otter Tail Corporation Credit Agreement are guaranteed by certain of our subsidiaries. Outstanding letters of credit issued by us under the Otter Tail Corporation Credit Agreement can reduce the amount available for borrowing under the line by up to $40 million.
On October 29, 2012 OTP entered into a Second Amended and Restated Credit Agreement (the OTP Credit Agreement), providing for an unsecured $170 million revolving credit facility that may be increased to $250 million on the terms and subject to the conditions described in the OTP Credit Agreement. On November 3, 2014 the OTP Credit Agreement was amended to extend its expiration date by one year from October 29, 2018 to October 29, 2019. OTP can draw on this credit facility to support the working capital needs and other capital requirements of its operations, including letters of credit in an aggregate amount not to exceed $50 million outstanding at any time. Borrowings under this line of credit bear interest at LIBOR plus 1.25%, subject to adjustment based on the ratings of OTP’s senior unsecured debt. OTP is required to pay commitment fees based on the average daily unused amount available to be drawn under the revolving credit facility. The OTP Credit Agreement contains a number of restrictions on the business of OTP, including restrictions on its ability to merge, sell assets, make investments, create or incur liens on assets, guarantee the obligations of any other party, and engage in transactions with related parties. The OTP Credit Agreement also contains affirmative covenants and events of default, and financial covenants as described below under the heading “Financial Covenants.” The OTP Credit Agreement does not include provisions for the termination of the agreement or the acceleration of repayment of amounts outstanding due to changes in OTP’s credit ratings. OTP’s obligations under the OTP Credit Agreement are not guaranteed by any other party.
Long-Term Debt
2016 Notes
On December 4, 2009 we issued $100 million of our 9.000% notes due 2016 (the 2016 Notes) under the indenture (for unsecured debt securities) dated as of November 1, 1997, as amended by the First Supplemental Indenture dated as of July 1, 2009, between us and U.S. Bank National Association (formerly First Trust National Association), as trustee. The 2016 Notes are senior unsecured indebtedness and bear interest at 9.000% per year, payable semi-annually in arrears on June 15 and December 15 of each year. In November 2013 we purchased and retired, in two separate transactions, $12,933,000 and $34,737,000, respectively, of our outstanding 2016 Notes. The remaining $52,330,000 principal amount of the 2016 Notes outstanding, unless previously redeemed or otherwise repaid, will mature and become due and payable on December 15, 2016.
2013 Note Purchase Agreement
On August 14, 2013 OTP entered into a Note Purchase Agreement (the 2013 Note Purchase Agreement) with the Purchasers named therein, pursuant to which OTP agreed to issue to the Purchasers, in a private placement transaction, $60 million aggregate principal amount of OTP’s 4.68% Series A Senior Unsecured Notes due February 27, 2029 (the Series A Notes) and $90 million aggregate principal amount of OTP’s 5.47% Series B Senior Unsecured Notes due February 27, 2044 (the Series B Notes and, together with the Series A Notes, the Notes). On February 27, 2014 OTP issued all $150 million aggregate principal amount of the Notes. OTP used a portion of the proceeds of the Notes to retire its $40.9 million unsecured term loan under a Credit Agreement with JPMorgan Chase Bank, N.A., and to repay $82.5 million of short-term debt then outstanding under the OTP Credit Agreement. Remaining proceeds of the Notes have been used to fund OTP construction program expenditures.
| 51 |
The 2013 Note Purchase Agreement states that OTP may prepay all or any part of the Notes (in an amount not less than 10% of the aggregate principal amount of the Notes then outstanding in the case of a partial prepayment) at 100% of the principal amount prepaid, together with accrued interest and a make-whole amount, provided that if no default or event of default under the 2013 Note Purchase Agreement exists, any optional prepayment made by OTP of (i) all of the Series A Notes then outstanding on or after November 27, 2028 or (ii) all of the Series B Notes then outstanding on or after November 27, 2043, will be made at 100% of the principal prepaid but without any make-whole amount. In addition, the 2013 Note Purchase Agreement states OTP must offer to prepay all of the outstanding Notes at 100% of the principal amount together with unpaid accrued interest in the event of a change of control of OTP.
The 2013 Note Purchase Agreement contains a number of restrictions on the business of OTP, including restrictions on OTP’s ability to merge, sell assets, create or incur liens on assets, guarantee the obligations of any other party, and engage in transactions with related parties. The 2013 Note Purchase Agreement also contains affirmative covenants and events of default, as well as certain financial covenants as described below under the heading “Financial Covenants.” The 2013 Note Purchase Agreement does not include provisions for the termination of the agreement or the acceleration of repayment of amounts outstanding due to changes in OTP’s credit ratings. The 2013 Note Purchase Agreement includes a “most favored lender” provision generally requiring that in the event OTP’s existing credit agreement or any renewal, extension or replacement thereof, at any time contains any financial covenant or other provision providing for limitations on interest expense and such a covenant is not contained in the 2013 Note Purchase Agreement under substantially similar terms or would be more beneficial to the holders of the Notes than any analogous provision contained in the 2013 Note Purchase Agreement (an “Additional Covenant”), then unless waived by the Required Holders (as defined in the 2013 Note Purchase Agreement), the Additional Covenant will be deemed to be incorporated into the 2013 Note Purchase Agreement. The 2013 Note Purchase Agreement also provides for the amendment, modification or deletion of an Additional Covenant if such Additional Covenant is amended or modified under or deleted from the OTP credit agreement, provided that no default or event of default has occurred and is continuing.
2007 and 2011 Note Purchase Agreements
On December 1, 2011, OTP issued $140 million aggregate principal amount of its 4.63% Senior Unsecured Notes due December 1, 2021 (the 2021 Notes) pursuant to a Note Purchase Agreement dated as of July 29, 2011 (2011 Note Purchase Agreement). OTP used a portion of the proceeds of the 2021 Notes to retire $90 million aggregate principal amount of OTP’s 6.63% Senior Notes due December 1, 2011 at maturity and to retire early $10.4 million aggregate principal amount of outstanding pollution control refunding revenue bonds due December 1, 2012. No penalty was paid for the early retirement. The remaining proceeds of the 2021 Notes were used to repay short-term debt of OTP which was issued to fund capital expenditures, to pay fees and expenses related to the debt issuance and to fund a $10 million contribution to the Company’s pension plan in January 2012.
OTP also has outstanding its $155 million senior unsecured notes issued in four series consisting of $33 million aggregate principal amount of 5.95% Senior Unsecured Notes, Series A, due 2017; $30 million aggregate principal amount of 6.15% Senior Unsecured Notes, Series B, due 2022; $42 million aggregate principal amount of 6.37% Senior Unsecured Notes, Series C, due 2027; and $50 million aggregate principal amount of 6.47% Senior Unsecured Notes, Series D, due 2037 (collectively, the 2007 Notes). The 2007 Notes were issued pursuant to a Note Purchase Agreement dated as of August 20, 2007 (the 2007 Note Purchase Agreement).
The 2011 Note Purchase Agreement and the 2007 Note Purchase Agreement each states that OTP may prepay all or any part of the notes issued thereunder (in an amount not less than 10% of the aggregate principal amount of the notes then outstanding in the case of a partial prepayment) at 100% of the principal amount prepaid, together with accrued interest and a make-whole amount. The 2011 Note Purchase Agreement states in the event of a transfer of utility assets put event, the noteholders thereunder have the right to require OTP to repurchase the notes held by them in full, together with accrued interest and a make-whole amount, on the terms and conditions specified in the 2011 Note Purchase Agreement. The 2011 Note Purchase Agreement and the 2007 Note Purchase Agreement each also states that OTP must offer to prepay all of the outstanding notes issued thereunder at 100% of the principal amount together with unpaid accrued interest in the event of a change of control of OTP. The note purchase agreements contain a number of restrictions on OTP, including restrictions on OTP’s ability to merge, sell assets, create or incur liens on assets, guarantee the obligations of any other party, and engage in transactions with related parties. The note purchase agreements also include affirmative covenants and events of default, and certain financial covenants as described below under the heading “Financial Covenants.”
| 52 |
Financial Covenants
We and OTP were in compliance with the financial covenants in our respective debt agreements as of September 30, 2014.
No Credit or Note Purchase Agreement contains any provisions that would trigger an acceleration of the related debt as a result of changes in the credit rating levels assigned to the related obligor by rating agencies.
Our borrowing agreements are subject to certain financial covenants. Specifically:
|
|
●
|
Under the Otter Tail Corporation Credit Agreement, we may not permit the ratio of our Interest-bearing Debt to Total Capitalization to be greater than 0.60 to 1.00 or permit our Interest and Dividend Coverage Ratio to be less than 1.50 to 1.00 (each measured on a consolidated basis), as provided in the Otter Tail Corporation Credit Agreement. As of September 30, 2014 our Interest and Dividend Coverage Ratio calculated under the requirements of the Otter Tail Corporation Credit Agreement was 4.10 to 1.00.
|
|
|
●
|
Under the OTP Credit Agreement, OTP may not permit the ratio of its Interest-bearing Debt to Total Capitalization to be greater than 0.60 to 1.00.
|
|
|
●
|
Under the 2007 Note Purchase Agreement and 2011 Note Purchase Agreement, OTP may not permit the ratio of its Consolidated Debt to Total Capitalization to be greater than 0.60 to 1.00 or permit its Interest and Dividend Coverage Ratio to be less than 1.50 to 1.00, in each case as provided in the related borrowing agreement, and OTP may not permit its Priority Debt to exceed 20% of its Total Capitalization, as provided in the related agreement. As of September 30, 2014 OTP’s Interest and Dividend Coverage Ratio and Interest Charges Coverage Ratio, calculated under the requirements of the 2007 Note Purchase Agreement and 2011 Note Purchase Agreement, was 3.51 to 1.00.
|
|
|
●
|
Under the 2013 Note Purchase Agreement, OTP may not permit its Interest-bearing Debt to exceed 60% of Total Capitalization and may not permit its Priority Indebtedness to exceed 20% of its Total Capitalization, each as provided in the 2013 Note Purchase Agreement.
|
As of September 30, 2014 our interest-bearing debt to total capitalization was 0.49 to 1.00 on a consolidated basis and 0.51 to 1.00 for OTP.
OFF-BALANCE-SHEET ARRANGEMENTS
We and our subsidiary companies have outstanding letters of credit totaling $6.3 million, but our line of credit borrowing limits are only restricted by $1.0 million of the outstanding letters of credit. We do not have any other off-balance-sheet arrangements or any relationships with unconsolidated entities or financial partnerships. These entities are often referred to as structured finance special purpose entities or variable interest entities, which are established for the purpose of facilitating off-balance-sheet arrangements or for other contractually narrow or limited purposes. We are not exposed to any financing, liquidity, market or credit risk that could arise if we had such relationships.
| 53 |
2014 BUSINESS OUTLOOK
We are maintaining our consolidated diluted earnings per share guidance for 2014 to be in the range of $1.65 to $1.80 but revising our 2014 earnings guidance by segment based on 2014 year-to-date segment performance and current projections. This guidance reflects the current mix of businesses owned by us, considers the cyclical nature of some of our businesses and reflects challenges, as well as our plans and strategies for improving future operating results. We review our portfolio of companies at least annually for additional opportunities to improve our risk profile, improve credit metrics and generate additional sources of cash to support the future capital expenditure plans of our respective platforms. Should we be successful in executing our strategic alternatives for our Construction segment in the fourth quarter of 2014, we still expect to be within our original, February earnings guidance for 2014.
Segment components of our 2013 earnings per share and 2014 earnings per share guidance ranges are as follows:
|
2013
EPS by
Segment
|
February 2014 EPS
Guidance
|
August 2014 EPS
Guidance
|
Current 2014 EPS
Guidance
|
||||
|
Low
|
High
|
Low
|
High
|
Low
|
High
|
||
|
Electric
|
$1.05
|
$1.19
|
$1.23
|
$1.23
|
$1.26
|
$1.19
|
$1.22
|
|
Manufacturing
|
$0.32
|
$0.29
|
$0.33
|
$0.30
|
$0.33
|
$0.26
|
$0.29
|
|
Plastics
|
$0.38
|
$0.25
|
$0.29
|
$0.26
|
$0.29
|
$0.31
|
$0.34
|
|
Construction
|
$0.04
|
$0.07
|
$0.11
|
$0.10
|
$0.13
|
$0.11
|
$0.14
|
|
Corporate
|
($0.25)
|
($0.25)
|
($0.21)
|
($0.24)
|
($0.21)
|
($0.22)
|
($0.19)
|
|
Subtotal – Continuing Operations
|
$1.54
|
$1.55
|
$1.75
|
$1.65
|
$1.80
|
$1.65
|
$1.80
|
|
Corporate – Loss on Debt Extinguishment
|
($0.17)
|
||||||
|
Total – Continuing Operations
|
$1.37
|
$1.55
|
$1.75
|
$1.65
|
$1.80
|
$1.65
|
$1.80
|
Contributing to our updated earnings guidance for 2014 are the following items:
|
|
●
|
We are reducing our 2014 net income expectations for our Electric segment back to within our original guidance range for the year due to the extended outage of Hoot Lake Plant and milder than normal third quarter weather, which have offset higher than expected earnings in the first quarter that were driven, in part, by colder than normal weather. Items affecting our 2014 Electric segment earnings guidance compared with 2013 segment earnings include:
|
|
|
○
|
Rider recovery increases, including environmental riders in Minnesota and North Dakota related to the Big Stone Plant AQCS environmental upgrades while under construction, and
|
|
|
○
|
A decrease in pension costs of approximately $2.0 million as a result of an increase in the discount rate from 4.5% to 5.3%, offset by
|
|
|
○
|
An increase in interest costs as a result of $150 million of fixed rate long term debt put in place in the first quarter of 2014 to finance the Big Stone Plant AQCS and transmission projects.
|
|
|
●
|
We are reducing our 2014 earnings expectations for our Manufacturing segment due to the following factors:
|
|
|
○
|
As part of the recently announced facility expansion, BTD is planning on exiting the lease of its Otsego, Minnesota warehouse facilities during the fourth quarter of 2014. The cost associated with exiting the lease is expected to be $0.04 per share.
|
|
|
○
|
T.O. Plastics earnings are expected to be in line with previous earnings expectations.
|
|
|
○
|
Backlog for the manufacturing companies of approximately $50 million for 2014 compared with $47 million one year ago.
|
|
|
●
|
We are raising our previous 2014 net income guidance for our Plastics segment due to stronger actual and anticipated sales volume levels in the last half of 2014 despite an expected continued increase in PVC resin costs which, based on current competitive market conditions, are not expected to be fully recovered through higher sales prices for PVC pipe.
|
|
|
●
|
We are raising our previous 2014 net income guidance for our Construction segment. Segment net income for 2014 is expected to be higher than previous guidance and 2013 net income as a result of improved cost control processes in construction management and more selective bidding on projects with the potential for higher margins and increased electric transmission and distribution work in western North Dakota. Backlog in place for the construction businesses is $31 million for 2014 compared with $34 million one year ago.
|
|
|
●
|
We are lowering our previous range for corporate costs for 2014 due to lower employee benefit costs and better-than-expected performance of our captive insurance program.
|
| 54 |
Critical Accounting Policies Involving Significant Estimates
The discussion and analysis of the financial statements and results of operations are based on our consolidated financial statements, which have been prepared in accordance with accounting principles generally accepted in the United States of America. The preparation of these consolidated financial statements requires management to make estimates and judgments that affect the reported amounts of assets, liabilities, revenues and expenses, and related disclosure of contingent assets and liabilities.
We use estimates based on the best information available in recording transactions and balances resulting from business operations. Estimates are used for such items as depreciable lives, asset impairment evaluations, tax provisions, collectability of trade accounts receivable, self-insurance programs, unbilled electric revenues, accrued renewable resource and transmission rider revenues, valuations of forward energy contracts, percentage-of-completion, warranty and actuarially determined benefits costs and liabilities. As better information becomes available or actual amounts are known, estimates are revised. Operating results can be affected by revised estimates. Actual results may differ from these estimates under different assumptions or conditions. Management has discussed the application of these critical accounting policies and the development of these estimates with the Audit Committee of the Board of Directors. A discussion of critical accounting policies is included under the caption “Critical Accounting Policies Involving Significant Estimates” on pages 60 through 64 of our Annual Report on Form 10-K for the year ended December 31, 2013. There were no material changes in critical accounting policies or estimates during the quarter ended September 30, 2014.
Forward Looking Information - Safe Harbor Statement Under the Private Securities Litigation Reform Act of 1995
In connection with the “safe harbor” provisions of the Private Securities Litigation Reform Act of 1995 (the Act), we have filed cautionary statements identifying important factors that could cause our actual results to differ materially from those discussed in forward-looking statements made by or on behalf of the Company. When used in this Form 10-Q and in future filings by the Company with the Securities and Exchange Commission, in our press releases and in oral statements, words such as “may”, “will”, “expect”, “anticipate”, “continue”, “estimate”, “project”, “believes” or similar expressions are intended to identify forward-looking statements within the meaning of the Act and are included, along with this statement, for purposes of complying with the safe harbor provision of the Act. These forward-looking statements involve risks and uncertainties. Actual results may differ materially from those contemplated by the forward-looking statements due to, among other factors, the risks and uncertainties described in the section entitled “Risk Factors” in Part I, Item 1A of our Annual Report on Form 10-K for the fiscal year ended December 31, 2013, as well as the various factors described below:
|
●
|
Federal and state environmental regulation could require us to incur substantial capital expenditures and increased operating costs.
|
|
●
|
Volatile financial markets and changes in our debt ratings could restrict our ability to access capital and could increase borrowing costs and pension plan and postretirement health care expenses.
|
|
●
|
We rely on access to both short- and long-term capital markets as a source of liquidity for capital requirements not satisfied by cash flows from operations. If we are not able to access capital at competitive rates, our ability to implement our business plans may be adversely affected.
|
|
●
|
Disruptions, uncertainty or volatility in the financial markets can also adversely impact our results of operations, the ability of our customers to finance purchases of goods and services, and our financial condition, as well as exert downward pressure on stock prices and/or limit our ability to sustain our current common stock dividend level.
|
|
●
|
We made $20.0 million in discretionary contributions to our defined benefit pension plan in January 2014. We could be required to contribute additional capital to the pension plan in the future if the market value of pension plan assets significantly declines, plan assets do not earn in line with our long-term rate of return assumptions or relief under the Pension Protection Act is no longer granted.
|
|
●
|
Any significant impairment of our goodwill would cause a decrease in our asset values and a reduction in our net operating income.
|
|
●
|
Declines in projected operating cash flows at any of our reporting units may result in goodwill impairments that could adversely affect our results of operations and financial position, as well as financing agreement covenants.
|
| 55 |
|
●
|
We currently have $7.3 million of goodwill and a $1.1 million indefinite-lived trade name recorded on our consolidated balance sheet related to the acquisition of Foley Company in 2003. Foley net earnings improved $10.4 million between 2012 and 2013. If future expected operating profits do not meet the corporation’s projections, the reductions in anticipated cash flows from Foley may indicate its fair value is less than its book value, resulting in an impairment of some or all of the goodwill and indefinite-lived intangible assets associated with Foley along with a corresponding charge against earnings.
|
|
●
|
The inability of our subsidiaries to provide sufficient earnings and cash flows to allow us to meet our financial obligations and debt covenants and pay dividends to our shareholders could have an adverse effect on us.
|
|
●
|
Economic conditions could negatively impact our businesses.
|
|
●
|
If we are unable to achieve the organic growth we expect, our financial performance may be adversely affected.
|
|
●
|
Our plans to grow and realign our business mix through capital projects, acquisitions and dispositions may not be successful, which could result in poor financial performance.
|
|
●
|
We may, from time to time, sell assets to provide capital to fund investments in our electric utility business or for other corporate purposes, which could result in the recognition of a loss on the sale of any assets sold and other potential liabilities. The sale of any of our businesses could expose us to additional risks associated with indemnification obligations under the applicable sales agreements and any related disputes.
|
|
●
|
Our plans to grow and operate our manufacturing and infrastructure businesses could be limited by state law.
|
|
●
|
Significant warranty claims and remediation costs in excess of amounts normally reserved for such items could adversely affect our results of operations and financial condition.
|
|
●
|
We are subject to risks associated with energy markets.
|
|
●
|
We are subject to risks and uncertainties related to the timing and recovery of deferred tax assets which could have a negative impact on our net income in future periods.
|
|
●
|
We rely on our information systems to conduct our business, and failure to protect these systems against security breaches or cyber-attacks could adversely affect our business and results of operations. Additionally, if these systems fail or become unavailable for any significant period of time, our business could be harmed.
|
|
●
|
We may experience fluctuations in revenues and expenses related to our electric operations, which may cause our financial results to fluctuate and could impair our ability to make distributions to our shareholders or scheduled payments on our debt obligations, or to meet covenants under our borrowing agreements.
|
|
●
|
Actions by the regulators of our electric operations could result in rate reductions, lower revenues and earnings or delays in recovering capital expenditures.
|
|
●
|
OTP’s electric generating facilities are subject to operational risks that could result in unscheduled plant outages, unanticipated operation and maintenance expenses and increased power purchase costs.
|
|
●
|
Changes to regulation of generating plant emissions, including but not limited to carbon dioxide emissions, could affect OTP’s operating costs and the costs of supplying electricity to its customers.
|
|
●
|
Competition from foreign and domestic manufacturers, the price and availability of raw materials and general economic conditions could affect the revenues and earnings of our manufacturing businesses.
|
|
Our Plastics segment is highly dependent on a limited number of vendors for PVC resin, many of which are located in the Gulf Coast regions, and a limited supply of resin. The loss of a key vendor, or an interruption or delay in the supply of PVC resin, could result in reduced sales or increased costs for this segment.
|
|
●
|
Our plastic pipe companies compete against a large number of other manufacturers of PVC pipe and manufacturers of alternative products. Customers may not distinguish the pipe companies’ products from those of its competitors.
|
|
●
|
Changes in PVC resin prices can negatively impact PVC pipe prices, profit margins on PVC pipe sales and the value of PVC pipe held in inventory.
|
|
●
|
A significant failure or an inability to properly bid or perform on projects or contracts by our construction businesses could lead to adverse financial results and could lead to the possibility of delay or liquidated damages.
|
|
●
|
Our construction subsidiaries enter into contracts which could expose them to unforeseen costs and costs not within their control, which may not be recoverable and could adversely affect our results of operations and financial condition.
|
| 56 |
At September 30, 2014 we had exposure to market risk associated with interest rates because we had $39.0 million in short-term debt outstanding subject to variable interest rates that are indexed to LIBOR plus 1.75% under our $150 million revolving credit facility.
All of our consolidated long-term debt outstanding on September 30, 2014 has fixed interest rates. We manage our interest rate risk through the issuance of fixed-rate debt with varying maturities, through economic refunding of debt through optional refundings, limiting the amount of variable interest rate debt, and the utilization of short-term borrowings to allow flexibility in the timing and placement of long-term debt.
We have not used interest rate swaps to manage net exposure to interest rate changes related to our portfolio of borrowings. We maintain a ratio of fixed-rate debt to total debt within a certain range. It is our policy to enter into interest rate transactions and other financial instruments only to the extent considered necessary to meet our stated objectives. We do not enter into interest rate transactions for speculative or trading purposes.
The companies in our Manufacturing segment are exposed to market risk related to changes in commodity prices for steel, aluminum and polystyrene (PS) and other plastics resins. The price and availability of these raw materials could affect the revenues and earnings of our Manufacturing segment.
The plastics companies are exposed to market risk related to changes in commodity prices for PVC resins, the raw material used to manufacture PVC pipe. The PVC pipe industry is highly sensitive to commodity raw material pricing volatility. Historically, when resin prices are rising or stable, sales volume has been higher and when resin prices are falling, sales volume has been lower. Operating income may decline when the supply of PVC pipe increases faster than demand. Due to the commodity nature of PVC resin and the dynamic supply and demand factors worldwide, it is very difficult to predict gross margin percentages or to assume that historical trends will continue.
We have in place an energy risk management policy with a goal to manage, through the use of defined risk management practices, price risk and credit risk associated with wholesale power purchases and sales.
OTP has credit risk associated with the nonperformance or nonpayment by counterparties to its forward energy and capacity purchases and sales agreements. We have established guidelines and limits to manage credit risk associated with wholesale power and capacity purchases and sales. Specific limits are determined by a counterparty’s financial strength. OTP’s credit risk with its largest and only counterparty on delivered and marked-to-market forward contracts as of September 30, 2014 was $36,000. As of September 30, 2014 OTP had a net credit risk exposure of $36,000 from one counterparty with investment grade credit ratings. OTP had no exposure at September 30, 2014 to counterparties with credit ratings below investment grade. Counterparties with investment grade credit ratings have minimum credit ratings of BBB- (Standard & Poor’s), Baa3 (Moody’s) or BBB- (Fitch). The $36,000 credit risk exposure included net amounts due to OTP on receivables/payables from completed transactions billed and unbilled plus marked-to-market gains on forward contracts for the purchase of gasoline scheduled for settlement after September 2014. Individual counterparty exposures are offset according to legally enforceable netting arrangements.
Under the supervision and with the participation of the Company’s management, including the Chief Executive Officer and the Chief Financial Officer, the Company evaluated the effectiveness of the design and operation of its disclosure controls and procedures (as defined in Rule 13a-15(e) under the Securities Exchange Act of 1934 (the Exchange Act)) as of September 30, 2014, the end of the period covered by this report. Based on that evaluation, the Chief Executive Officer and Chief Financial Officer concluded that the Company’s disclosure controls and procedures were effective as of September 30, 2014.
During the fiscal quarter ended September 30, 2014, there were no changes in the Company’s internal control over financial reporting (as defined in Rule 13a-15(f) under the Exchange Act) that have materially affected, or are reasonably likely to materially affect, the Company’s internal control over financial reporting.
| 57 |
The Company is the subject of various pending or threatened legal actions and proceedings in the ordinary course of its business. Such matters are subject to many uncertainties and to outcomes that are not predictable with assurance. The Company records a liability in its consolidated financial statements for costs related to claims, including future legal costs, settlements and judgments, where it has assessed that a loss is probable and an amount can be reasonably estimated. The Company believes the final resolution of currently pending or threatened legal actions and proceedings, either individually or in the aggregate, will not have a material adverse effect on the Company’s consolidated financial position, results of operations or cash flows.
There has been no material change in the risk factors set forth under Part I, Item 1A, “Risk Factors” on pages 28 through 35 of the Company’s Annual Report on Form 10-K for the year ended December 31, 2013.
|
|
4.1
|
Second Amendment to Third Amended and Restated Credit Agreement, dated as of November 3, 2014, among Otter Tail Corporation, U.S. Bank National Association, as Administrative Agent and as a Bank, Bank of America, N.A. and JPMorgan Chase Bank, N.A., each as a Co-Syndication Agent and as a Bank, KeyBank National Association, as Documentation Agent and as a Bank, and Bank of the West as a Bank (incorporated by reference to Exhibit 4.1 to the Form 8-K filed by Otter Tail Corporation on November 4, 2014).
|
|
|
4.2
|
Second Amendment to Second Amended and Restated Credit Agreement, dated as of November 3, 2014, among Otter Tail Power Company, U.S. Bank National Association, as Administrative Agent and as a Bank, Bank of America, N.A. and JPMorgan Chase Bank, N.A., each as a Co-Syndication Agent and as a Bank, KeyBank National Association, as Documentation Agent and as a Bank, CoBank, ACB, as a Co-Documentation Agent and as a Bank, and Wells Fargo Bank, National Association as a Bank (incorporated by reference to Exhibit 4.2 to the Form 8-K filed by Otter Tail Corporation on November 4, 2014).
|
|
|
10.1
|
Amendment to 2014 Performance Award Agreement with Edward J. McIntyre, effective September 23, 2014 (2014 Stock Incentive Plan) (incorporated by reference to Exhibit 10.1 to the Form 8-K filed by Otter Tail Corporation on September 26, 2014).
|
|
|
10.2
|
Amendment to 2013 Performance Award Agreement with Edward J. McIntyre, effective September 23, 2014 (1999 Stock Incentive Plan) (incorporated by reference to Exhibit 10.2 to the Form 8-K filed by Otter Tail Corporation on September 26, 2014).
|
|
|
10.3
|
Change in Control Severance Agreement with Timothy Rogelstad.
|
|
|
10.4
|
Severance Agreement with Timothy Rogelstad.
|
|
|
10.5
|
Executive Employment Agreement with Paul Knutson.
|
|
|
10.6
|
Change in Control Severance Agreement with Paul Knutson.
|
|
|
31.1
|
Certification of Chief Executive Officer Pursuant to Section 302 of the Sarbanes-Oxley Act of 2002.
|
|
|
31.2
|
Certification of Chief Financial Officer Pursuant to Section 302 of the Sarbanes-Oxley Act of 2002.
|
|
|
32.1
|
Certification of Chief Executive Officer Pursuant to Section 906 of the Sarbanes-Oxley Act of 2002.
|
|
|
32.2
|
Certification of Chief Financial Officer Pursuant to Section 906 of the Sarbanes-Oxley Act of 2002.
|
| 58 |
|
|
101
|
Financial statements from the Quarterly Report on Form 10-Q of Otter Tail Corporation for the quarter ended September 30, 2014, formatted in Extensible Business Reporting Language: (i) the Consolidated Balance Sheets, (ii) the Consolidated Statements of Income, (iii) the Consolidated Statements of Comprehensive Income, (iv) the Consolidated Statements of Cash Flows and (v) the Condensed Notes to Consolidated Financial Statements.
|
Pursuant to the requirements of the Securities Exchange Act of 1934, the Registrant has duly caused this report to be signed on its behalf by the undersigned thereunto duly authorized.
OTTER TAIL CORPORATION
| By: | /s/ Kevin G. Moug | ||
|
Kevin G. Moug
|
|||
| Chief Financial Officer | |||
| (Chief Financial Officer/Authorized Officer) | |||
Dated: November 10, 2014
| 59 |
EXHIBIT INDEX
|
Exhibit Number
|
Description
|
|||
|
4.1
|
Second Amendment to Third Amended and Restated Credit Agreement, dated as of November 3, 2014, among Otter Tail Corporation, U.S. Bank National Association, as Administrative Agent and as a Bank, Bank of America, N.A. and JPMorgan Chase Bank, N.A., each as a Co-Syndication Agent and as a Bank, KeyBank National Association, as Documentation Agent and as a Bank, and Bank of the West as a Bank (incorporated by reference to Exhibit 4.1 to the Form 8-K filed by Otter Tail Corporation on November 4, 2014).
|
|||
|
4.2
|
Second Amendment to Second Amended and Restated Credit Agreement, dated as of November 3, 2014, among Otter Tail Power Company, U.S. Bank National Association, as Administrative Agent and as a Bank, Bank of America, N.A. and JPMorgan Chase Bank, N.A., each as a Co-Syndication Agent and as a Bank, KeyBank National Association, as Documentation Agent and as a Bank, CoBank, ACB, as a Co-Documentation Agent and as a Bank, and Wells Fargo Bank, National Association as a Bank (incorporated by reference to Exhibit 4.2 to the Form 8-K filed by Otter Tail Corporation on November 4, 2014).
|
|||
|
10.1
|
Amendment to 2014 Performance Award Agreement with Edward J. McIntyre, effective September 23, 2014 (2014 Stock Incentive Plan) (incorporated by reference to Exhibit 10.1 to the Form 8-K filed by Otter Tail Corporation on September 26, 2014).
|
|||
|
10.2
|
Amendment to 2013 Performance Award Agreement with Edward J. McIntyre, effective September 23, 2014 (1999 Stock Incentive Plan) (incorporated by reference to Exhibit 10.2 to the Form 8-K filed by Otter Tail Corporation on September 26, 2014).
|
|||
|
10.3
|
Change in Control Severance Agreement with Timothy Rogelstad.
|
|||
|
10.4
|
Severance Agreement with Timothy Rogelstad.
|
|||
|
10.5
|
Executive Employment Agreement with Paul Knutson.
|
|||
|
10.6
|
Change in Control Severance Agreement with Paul Knutson.
|
|||
|
31.1
|
Certification of Chief Executive Officer Pursuant to Section 302 of the Sarbanes-Oxley Act of 2002.
|
|||
|
31.2
|
Certification of Chief Financial Officer Pursuant to Section 302 of the Sarbanes-Oxley Act of 2002.
|
|||
|
32.1
|
Certification of Chief Executive Officer Pursuant to Section 906 of the Sarbanes-Oxley Act of 2002.
|
|||
|
32.2
|
Certification of Chief Financial Officer Pursuant to Section 906 of the Sarbanes-Oxley Act of 2002.
|
|||
|
101
|
Financial statements from the Quarterly Report on Form 10-Q of Otter Tail Corporation for the quarter ended September 30, 2014, formatted in Extensible Business Reporting Language: (i) the Consolidated Balance Sheets, (ii) the Consolidated Statements of Income, (iii) the Consolidated Statements of Comprehensive Income, (iv) the Consolidated Statements of Cash Flows and (v) the Condensed Notes to Consolidated Financial Statements.
|
|||
| 60 |