Attached files
| file | filename |
|---|---|
| EX-32.2 - EXHIBIT 32.2 - Otter Tail Corp | ex32-2.htm |
| EX-32.1 - EXHIBIT 32.1 - Otter Tail Corp | ex32-1.htm |
| EX-31.2 - EXHIBIT 31.2 - Otter Tail Corp | ex31-2.htm |
| EX-31.1 - EXHIBIT 31.1 - Otter Tail Corp | ex31-1.htm |
UNITED STATES SECURITIES AND EXCHANGE COMMISSION
Washington, D.C. 20549
FORM 10-Q
(Mark One)
[ X] QUARTERLY REPORT PURSUANT TO SECTION 13 OR 15(d) OF THE SECURITIES EXCHANGE ACT OF 1934
|
For the quarterly period ended |
June 30, 2017 |
OR
[ ] TRANSITION REPORT PURSUANT TO SECTION 13 OR 15(d) OF THE SECURITIES EXCHANGE ACT OF 1934
|
For the transition period from |
to |
|
Commission file number |
0-53713 |
|
OTTER TAIL CORPORATION |
|
(Exact name of registrant as specified in its charter) |
|
Minnesota |
27-0383995 |
|
(State or other jurisdiction of |
(I.R.S. Employer |
|
incorporation or organization) |
Identification No.) |
|
215 South Cascade Street, Box 496, Fergus Falls, Minnesota |
56538-0496 |
|
(Address of principal executive offices) |
(Zip Code) |
|
866-410-8780 |
|
(Registrant's telephone number, including area code) |
|
(Former name, former address and former fiscal year, if changed since last report) |
Indicate by check mark whether the registrant (1) has filed all reports required to be filed by Section 13 or 15(d) of the Securities Exchange Act of 1934 during the preceding 12 months (or for such shorter period that the registrant was required to file such reports), and (2) has been subject to such filing requirements for the past 90 days.
Yes ☑ No ☐
Indicate by check mark whether the registrant has submitted electronically and posted on its corporate Web site, if any, every Interactive Data File required to be submitted and posted pursuant to Rule 405 of Regulation S-T (§ 232.405 of this chapter) during the preceding 12 months (or for such shorter period that the registrant was required to submit and post such files). Yes ☑ No ☐
Indicate by check mark whether the registrant is a large accelerated filer, an accelerated filer, a non-accelerated filer, a smaller reporting company, or an emerging growth company. See the definitions of “large accelerated filer,” “accelerated filer,” “smaller reporting company” and “emerging growth company” in Rule 12b-2 of the Exchange Act.:
| Large accelerated filer ☑ | Accelerated filer ☐ | |
| Non-accelerated filer ☐ | Smaller reporting company ☐ | Emerging growth company ☐ |
| (Do not check if a smaller reporting company) |
If an emerging growth company, indicate by checkmark if the registrant has elected not to use the extended transition period for complying with any new or revised financial accounting standards provided pursuant to Section 13(a) of the Exchange Act ☐
Indicate by check mark whether the registrant is a shell company (as defined by Rule 12b-2 of the Exchange Act).
Yes ☐ No ☑
Indicate the number of shares outstanding of each of the issuer's classes of Common Stock, as of the latest practicable date:
July 31, 2017 – 39,557,391 Common Shares ($5 par value)
OTTER TAIL CORPORATION
INDEX
|
Part I. Financial Information |
Page No. |
|
|
Item 1. |
Financial Statements |
|
|
Consolidated Balance Sheets – June 30, 2017 and December 31, 2016 (not audited) |
2 & 3 |
|
|
Consolidated Statements of Income - Three and Six Months Ended June 30, 2017 and 2016 (not audited) |
4 |
|
|
Consolidated Statements of Comprehensive Income - Three and Six Months Ended June 30, 2017 and 2016 (not audited) |
5 |
|
|
Consolidated Statements of Cash Flows - Six Months Ended June 30, 2017 and 2016 (not audited) |
6 |
|
|
Condensed Notes to Consolidated Financial Statements (not audited) |
7-30 |
|
|
Item 2. |
Management's Discussion and Analysis of Financial Condition and Results of Operations |
31-47 |
|
Item 3. |
Quantitative and Qualitative Disclosures About Market Risk |
47-48 |
|
Item 4. |
Controls and Procedures |
48 |
|
Part II. Other Information |
||
|
Item 1. |
Legal Proceedings |
48 |
|
Item 1A. |
Risk Factors |
48 |
|
Item 2. |
Unregistered Sales of Equity Securities and Use of Proceeds |
48 |
|
Item 6. |
Exhibits |
49 |
|
Signatures |
49 |
|
|
PART I. FINANCIAL INFORMATION |
||
|
Item 1. financial statements |
||
|
Otter Tail Corporation |
||
|
Consolidated Balance Sheets |
||
|
(not audited) |
|
(in thousands) |
June 30, 2017 |
December 31, 2016 |
||||||
|
Assets |
||||||||
|
Current Assets |
||||||||
|
Cash and Cash Equivalents |
$ | -- | $ | -- | ||||
|
Accounts Receivable: |
||||||||
|
Trade—Net |
79,029 | 68,242 | ||||||
|
Other |
7,895 | 5,850 | ||||||
|
Inventories |
87,267 | 83,740 | ||||||
|
Unbilled Revenues |
15,560 | 20,080 | ||||||
|
Income Taxes Receivable |
-- | 662 | ||||||
|
Regulatory Assets |
16,540 | 21,297 | ||||||
|
Other |
14,352 | 8,144 | ||||||
|
Total Current Assets |
220,643 | 208,015 | ||||||
|
Investments |
8,156 | 8,417 | ||||||
|
Other Assets |
35,253 | 34,104 | ||||||
|
Goodwill |
37,572 | 37,572 | ||||||
|
Other Intangibles—Net |
14,391 | 14,958 | ||||||
|
Regulatory Assets |
127,479 | 132,094 | ||||||
|
Plant |
||||||||
|
Electric Plant in Service |
1,870,928 | 1,860,357 | ||||||
|
Nonelectric Operations |
214,925 | 211,826 | ||||||
|
Construction Work in Progress |
188,450 | 153,261 | ||||||
|
Total Gross Plant |
2,274,303 | 2,225,444 | ||||||
|
Less Accumulated Depreciation and Amortization |
773,741 | 748,219 | ||||||
|
Net Plant |
1,500,562 | 1,477,225 | ||||||
|
Total Assets |
$ | 1,944,056 | $ | 1,912,385 | ||||
|
See accompanying condensed notes to consolidated financial statements. |
|
Otter Tail Corporation |
||
|
Consolidated Balance Sheets |
||
|
(not audited) |
|
(in thousands, except share data) |
June 30, 2017 |
December 31, 2016 |
||||||
|
Liabilities and Equity |
||||||||
|
Current Liabilities |
||||||||
|
Short-Term Debt |
$ | 58,117 | $ | 42,883 | ||||
|
Current Maturities of Long-Term Debt |
42,200 | 33,201 | ||||||
|
Accounts Payable |
94,353 | 89,350 | ||||||
|
Accrued Salaries and Wages |
15,115 | 17,497 | ||||||
|
Accrued Taxes |
10,954 | 16,000 | ||||||
|
Other Accrued Liabilities |
15,142 | 15,377 | ||||||
|
Liabilities of Discontinued Operations |
1,113 | 1,363 | ||||||
|
Total Current Liabilities |
236,994 | 215,671 | ||||||
|
Pensions Benefit Liability |
98,297 | 97,627 | ||||||
|
Other Postretirement Benefits Liability |
62,980 | 62,571 | ||||||
|
Other Noncurrent Liabilities |
22,441 | 21,706 | ||||||
|
Commitments and Contingencies (note 9) |
||||||||
|
Deferred Credits |
||||||||
|
Deferred Income Taxes |
235,554 | 226,591 | ||||||
|
Deferred Tax Credits |
22,115 | 22,849 | ||||||
|
Regulatory Liabilities |
83,561 | 82,433 | ||||||
|
Other |
5,324 | 7,492 | ||||||
|
Total Deferred Credits |
346,554 | 339,365 | ||||||
|
Capitalization |
||||||||
|
Long-Term Debt—Net |
490,386 | 505,341 | ||||||
|
Cumulative Preferred Shares– Authorized 1,500,000 Shares Without Par Value; Outstanding – None |
-- | -- | ||||||
|
Cumulative Preference Shares – Authorized 1,000,000 Shares Without Par Value; Outstanding – None |
-- | -- | ||||||
|
Common Shares, Par Value $5 Per Share—Authorized, 50,000,000 Shares; Outstanding, 2017—39,555,076 Shares; 2016—39,348,136 Shares |
197,775 | 196,741 | ||||||
|
Premium on Common Shares |
341,657 | 337,684 | ||||||
|
Retained Earnings |
150,558 | 139,479 | ||||||
|
Accumulated Other Comprehensive Loss |
(3,586 | ) | (3,800 | ) | ||||
|
Total Common Equity |
686,404 | 670,104 | ||||||
|
Total Capitalization |
1,176,790 | 1,175,445 | ||||||
|
Total Liabilities and Equity |
$ | 1,944,056 | $ | 1,912,385 | ||||
|
See accompanying condensed notes to consolidated financial statements. |
|
Otter Tail Corporation |
||||
|
Consolidated Statements of Income |
||||
|
(not audited) |
|
Three Months Ended June 30, |
Six Months Ended June 30, |
|||||||||||||||
|
(in thousands, except share and per-share amounts) |
2017 |
2016 |
2017 |
2016 |
||||||||||||
|
Operating Revenues |
||||||||||||||||
|
Electric |
$ | 102,231 | $ | 97,918 | $ | 220,774 | $ | 210,903 | ||||||||
|
Product Sales |
109,855 | 105,564 | 205,429 | 198,821 | ||||||||||||
|
Total Operating Revenues |
212,086 | 203,482 | 426,203 | 409,724 | ||||||||||||
|
Operating Expenses |
||||||||||||||||
|
Production Fuel – Electric |
12,477 | 9,990 | 28,859 | 25,690 | ||||||||||||
|
Purchased Power – Electric System Use |
16,376 | 15,127 | 35,564 | 32,013 | ||||||||||||
|
Electric Operation and Maintenance Expenses |
37,850 | 38,981 | 76,229 | 78,999 | ||||||||||||
|
Cost of Products Sold (depreciation included below) |
84,013 | 80,949 | 159,290 | 153,588 | ||||||||||||
|
Other Nonelectric Expenses |
10,164 | 9,238 | 20,602 | 20,693 | ||||||||||||
|
Depreciation and Amortization |
17,908 | 18,525 | 35,762 | 36,814 | ||||||||||||
|
Property Taxes – Electric |
3,709 | 3,589 | 7,507 | 7,268 | ||||||||||||
|
Total Operating Expenses |
182,497 | 176,399 | 363,813 | 355,065 | ||||||||||||
|
Operating Income |
29,589 | 27,083 | 62,390 | 54,659 | ||||||||||||
|
Interest Charges |
7,527 | 7,976 | 14,989 | 15,970 | ||||||||||||
|
Other Income |
552 | 1,532 | 1,105 | 1,932 | ||||||||||||
|
Income Before Income Taxes—Continuing Operations |
22,614 | 20,639 | 48,506 | 40,621 | ||||||||||||
|
Income Tax Expense—Continuing Operations |
5,897 | 5,083 | 12,260 | 10,575 | ||||||||||||
|
Net Income from Continuing Operations |
16,717 | 15,556 | 36,246 | 30,046 | ||||||||||||
|
Discontinued Operations |
||||||||||||||||
|
Income – net of Income Tax Expense of $40, $80, $78 and $100 for the respective periods |
61 | 119 | 117 | 149 | ||||||||||||
|
Net Income |
16,778 | 15,675 | 36,363 | 30,195 | ||||||||||||
|
Average Number of Common Shares Outstanding—Basic |
39,462,865 | 38,179,371 | 39,406,834 | 38,058,157 | ||||||||||||
|
Average Number of Common Shares Outstanding—Diluted |
39,702,499 | 38,321,289 | 39,671,612 | 38,183,249 | ||||||||||||
|
Basic Earnings Per Common Share: |
||||||||||||||||
|
Continuing Operations |
$ | 0.43 | $ | 0.41 | $ | 0.92 | $ | 0.79 | ||||||||
|
Discontinued Operations |
-- | -- | -- | -- | ||||||||||||
| $ | 0.43 | $ | 0.41 | $ | 0.92 | $ | 0.79 | |||||||||
|
Diluted Earnings Per Common Share: |
||||||||||||||||
|
Continuing Operations |
$ | 0.42 | $ | 0.41 | $ | 0.92 | $ | 0.79 | ||||||||
|
Discontinued Operations |
-- | -- | -- | -- | ||||||||||||
| $ | 0.42 | $ | 0.41 | $ | 0.92 | $ | 0.79 | |||||||||
|
Dividends Declared Per Common Share |
$ | 0.3200 | $ | 0.3125 | $ | 0.6400 | $ | 0.6250 | ||||||||
|
See accompanying condensed notes to consolidated financial statements. |
|
Otter Tail Corporation |
||||
|
Consolidated Statements of Comprehensive Income |
||||
|
(not audited) |
|
Three Months Ended June 30, |
Six Months Ended June 30, |
|||||||||||||||
|
(in thousands) |
2017 |
2016 |
2017 |
2016 |
||||||||||||
|
Net Income |
$ | 16,778 | $ | 15,675 | $ | 36,363 | $ | 30,195 | ||||||||
|
Other Comprehensive Income: |
||||||||||||||||
|
Unrealized Gain on Available-for-Sale Securities: |
||||||||||||||||
|
Reversal of Previously Recognized Gains Realized on Sale of Investments and Included in Other Income During Period |
(1 | ) | -- | (1 | ) | -- | ||||||||||
|
Gains Arising During Period |
21 | 27 | 38 | 100 | ||||||||||||
|
Income Tax Expense |
(7 | ) | (9 | ) | (13 | ) | (35 | ) | ||||||||
|
Change in Unrealized Gains on Available-for-Sale Securities – net-of-tax |
13 | 18 | 24 | 65 | ||||||||||||
|
Pension and Postretirement Benefit Plans: |
||||||||||||||||
|
Amortization of Unrecognized Postretirement Benefit Losses and Costs (note 11) |
159 | 155 | 316 | 309 | ||||||||||||
|
Income Tax Expense |
(63 | ) | (63 | ) | (126 | ) | (124 | ) | ||||||||
|
Pension and Postretirement Benefit Plans – net-of-tax |
96 | 92 | 190 | 185 | ||||||||||||
|
Total Other Comprehensive Income |
109 | 110 | 214 | 250 | ||||||||||||
|
Total Comprehensive Income |
$ | 16,887 | $ | 15,785 | $ | 36,577 | $ | 30,445 | ||||||||
|
See accompanying condensed notes to consolidated financial statements. |
|
Otter Tail Corporation |
||
|
Consolidated Statements of Cash Flows |
||
|
(not audited) |
|
Six Months Ended June 30, |
||||||||
|
(in thousands) |
2017 |
2016 |
||||||
|
Cash Flows from Operating Activities |
||||||||
|
Net Income |
$ | 36,363 | $ | 30,195 | ||||
|
Adjustments to Reconcile Net Income to Net Cash Provided by Operating Activities: |
||||||||
|
Net Income from Discontinued Operations |
(117 | ) | (149 | ) | ||||
|
Depreciation and Amortization |
35,762 | 36,814 | ||||||
|
Deferred Tax Credits |
(734 | ) | (828 | ) | ||||
|
Deferred Income Taxes |
8,666 | 9,679 | ||||||
|
Change in Deferred Debits and Other Assets |
8,075 | 2,680 | ||||||
|
Discretionary Contribution to Pension Plan |
-- | (10,000 | ) | |||||
|
Change in Noncurrent Liabilities and Deferred Credits |
(695 | ) | 6,404 | |||||
|
Allowance for Equity/Other Funds Used During Construction |
(401 | ) | (475 | ) | ||||
|
Stock Compensation Expense—Equity Awards |
1,920 | 828 | ||||||
|
Other—Net |
39 | (76 | ) | |||||
|
Cash (Used for) Provided by Current Assets and Current Liabilities: |
||||||||
|
Change in Receivables |
(12,832 | ) | (12,673 | ) | ||||
|
Change in Inventories |
(3,527 | ) | 4,218 | |||||
|
Change in Other Current Assets |
2,095 | (1,043 | ) | |||||
|
Change in Payables and Other Current Liabilities |
(5,878 | ) | (5,441 | ) | ||||
|
Change in Interest and Income Taxes Receivable/Payable |
590 | 4,018 | ||||||
|
Net Cash Provided by Continuing Operations |
69,326 | 64,151 | ||||||
|
Net Cash (Used in) Provided by Discontinued Operations |
(54 | ) | 11 | |||||
|
Net Cash Provided by Operating Activities |
69,272 | 64,162 | ||||||
|
Cash Flows from Investing Activities |
||||||||
|
Capital Expenditures |
(56,354 | ) | (79,158 | ) | ||||
|
Net Proceeds from Disposal of Noncurrent Assets |
2,167 | 1,080 | ||||||
|
Final Purchase Price Adjustment – BTD-Georgia Acquisition |
-- | 1,500 | ||||||
|
Cash Used for Investments and Other Assets |
(2,431 | ) | (1,719 | ) | ||||
|
Net Cash Used in Investing Activities |
(56,618 | ) | (78,297 | ) | ||||
|
Cash Flows from Financing Activities |
||||||||
|
Change in Checks Written in Excess of Cash |
1,043 | (2,024 | ) | |||||
|
Net Short-Term Borrowings (Repayments) |
15,234 | (31,398 | ) | |||||
|
Proceeds from Issuance of Common Stock – net of Issuance Expenses |
4,266 | 21,645 | ||||||
|
Payments for Retirement of Capital Stock |
(1,799 | ) | (104 | ) | ||||
|
Proceeds from Issuance of Long-Term Debt |
-- | 50,000 | ||||||
|
Short-Term and Long-Term Debt Issuance Expenses |
-- | (59 | ) | |||||
|
Payments for Retirement of Long-Term Debt |
(6,114 | ) | (106 | ) | ||||
|
Dividends Paid |
(25,284 | ) | (23,819 | ) | ||||
|
Net Cash (Used in) Provided by Financing Activities |
(12,654 | ) | 14,135 | |||||
|
Net Change in Cash and Cash Equivalents |
-- | -- | ||||||
|
Cash and Cash Equivalents at Beginning of Period |
-- | -- | ||||||
|
Cash and Cash Equivalents at End of Period |
$ | -- | $ | -- | ||||
|
See accompanying condensed notes to consolidated financial statements. |
OTTER TAIL CORPORATION
CONDENSED NOTES TO CONSOLIDATED FINANCIAL STATEMENTS
(not audited)
In the opinion of management, Otter Tail Corporation (the Company) has included all adjustments (including normal recurring accruals) necessary for a fair presentation of the consolidated financial statements for the periods presented. The consolidated financial statements and condensed notes thereto should be read in conjunction with the consolidated financial statements and notes included in the Company's Annual Report on Form 10-K for the fiscal year ended December 31, 2016. Because of seasonal and other factors, the earnings for the three- and six-month periods ended June 30, 2017 should not be taken as an indication of earnings for all or any part of the balance of the year.
The following condensed notes are numbered to correspond to numbers of the notes included in the Company's Annual Report on Form 10-K for the fiscal year ended December 31, 2016.
1. Summary of Significant Accounting Policies
Revenue Recognition
Due to the diverse business operations of the Company, revenue recognition depends on the product produced and sold or service performed. The Company recognizes revenue when the earnings process is complete, evidenced by an agreement with the customer, there has been delivery and acceptance, the price is fixed or determinable and collectability is reasonably assured. In cases where significant obligations remain after delivery, revenue recognition is deferred until such obligations are fulfilled. Provisions for sales returns and warranty costs are recorded at the time of the sale based on historical information and current trends. Gains and losses on forward energy contracts subject to regulatory treatment, if any, are deferred and recognized on a net basis in revenue in the period realized.
For the Company’s operating companies recognizing revenue on certain products when shipped, those operating companies have no further obligation to provide services related to such products. The shipping terms used in these instances are FOB shipping point.
Agreements Subject to Legally Enforceable Netting Arrangements
The Company does not offset assets and liabilities under legally enforceable netting arrangements on the face of its consolidated balance sheet.
Fair Value Measurements
The Company follows Accounting Standards Codification (ASC) Topic 820, Fair Value Measurements and Disclosures (ASC 820), for recurring fair value measurements. ASC 820 provides a single definition of fair value, requires enhanced disclosures about assets and liabilities measured at fair value and establishes a hierarchal framework for disclosing the observability of the inputs utilized in measuring assets and liabilities at fair value. The three levels defined by the hierarchy and examples of each level are as follows:
Level 1 – Quoted prices are available in active markets for identical assets or liabilities as of the reported date. The types of assets and liabilities included in Level 1 are highly liquid and actively traded instruments with quoted prices, such as equities listed by the New York Stock Exchange and commodity derivative contracts listed on the New York Mercantile Exchange (NYMEX).
Level 2 – Pricing inputs are other than quoted prices in active markets, but are either directly or indirectly observable as of the reported date. The types of assets and liabilities included in Level 2 are typically either comparable to actively traded securities or contracts, such as treasury securities with pricing interpolated from recent trades of similar securities, or priced with models using highly observable inputs, such as commodity options priced using observable forward prices and volatilities.
Level 3 – Significant inputs to pricing have little or no observability as of the reporting date. The types of assets and liabilities included in Level 3 are those with inputs requiring significant management judgment or estimation and may include complex and subjective models and forecasts.
The following tables present, for each of the hierarchy levels, the Company’s assets and liabilities that are measured at fair value on a recurring basis as of June 30, 2017 and December 31, 2016:
|
June 30, 2017 (in thousands) |
Level 1 |
Level 2 |
Level 3 |
|||||||||
|
Assets: |
||||||||||||
|
Investments: |
||||||||||||
|
Equity Funds – Held by Captive Insurance Company |
$ | 879 | ||||||||||
|
Corporate Debt Securities – Held by Captive Insurance Company |
$ | 4,991 | ||||||||||
|
Government-Backed and Government-Sponsored Enterprises’ Debt Securities – Held by Captive Insurance Company |
2,099 | |||||||||||
|
Other Assets: |
||||||||||||
|
Money Market and Mutual Funds – Nonqualified Retirement Savings Plan |
781 | |||||||||||
|
Total Assets |
$ | 1,660 | $ | 7,090 | ||||||||
|
December 31, 2016 (in thousands) |
Level 1 |
Level 2 |
Level 3 |
|||||||||
|
Assets: |
||||||||||||
|
Investments: |
||||||||||||
|
Corporate Debt Securities – Held by Captive Insurance Company |
$ | 5,280 | ||||||||||
|
Government-Backed and Government-Sponsored Enterprises’ Debt Securities – Held by Captive Insurance Company |
2,945 | |||||||||||
|
Other Assets: |
||||||||||||
|
Money Market and Mutual Funds – Nonqualified Retirement Savings Plan |
$ | 849 | ||||||||||
|
Total Assets |
$ | 849 | $ | 8,225 | ||||||||
The valuation techniques and inputs used for the Level 2 fair value measurements in the table above are as follows:
Government-Backed and Government-Sponsored Enterprises’ and Corporate Debt Securities Held by the Company’s Captive Insurance Company – Fair values are determined on the basis of valuations provided by a third-party pricing service which utilizes industry accepted valuation models and observable market inputs to determine valuation. Some valuations or model inputs used by the pricing service may be based on broker quotes.
Coyote Station Lignite Supply Agreement – Variable Interest Entity—In October 2012 the Coyote Station owners, including Otter Tail Power Company (OTP), entered into a lignite sales agreement (LSA) with Coyote Creek Mining Company, L.L.C. (CCMC), a subsidiary of The North American Coal Corporation, for the purchase of lignite coal to meet the coal supply requirements of Coyote Station for the period beginning in May 2016 and ending in December 2040. The price per ton paid by the Coyote Station owners under the LSA reflects the cost of production, along with an agreed profit and capital charge. CCMC was formed for the purpose of mining coal to meet the coal fuel supply requirements of Coyote Station from May 2016 through December 2040 and, based on the terms of the LSA, is considered a variable interest entity (VIE) due to the transfer of all operating and economic risk to the Coyote Station owners, as the agreement is structured so that the price of the coal would cover all costs of operations as well as future reclamation costs. The Coyote Station owners are also providing a guarantee of the value of the assets of CCMC as they would be required to buy certain assets at book value should they terminate the contract prior to the end of the contract term and are providing a guarantee of the value of the equity of CCMC in that they are required to buy the entity at the end of the contract term at equity value. Under current accounting standards, the primary beneficiary of a VIE is required to include the assets, liabilities, results of operations and cash flows of the VIE in its consolidated financial statements. No single owner of Coyote Station owns a majority interest in Coyote Station and none, individually, has the power to direct the activities that most significantly impact CCMC. Therefore, none of the owners individually, including OTP, is considered a primary beneficiary of the VIE and the Company is not required to include CCMC in its consolidated financial statements.
If the LSA terminates prior to the expiration of its term or the production period terminates prior to December 31, 2040 and the Coyote Station owners purchase all of the outstanding membership interests of CCMC as required by the LSA, the owners will satisfy, or (if permitted by CCMC’s applicable lender) assume, all of CCMC’s obligations owed to CCMC’s lenders under its loans and leases. The Coyote Station owners have limited rights to assign their rights and obligations under the LSA without the consent of CCMC’s lenders during any period in which CCMC’s obligations to its lenders remain outstanding. In the event the contract is terminated because regulations or legislation render the burning of coal cost prohibitive and the assets worthless, OTP’s maximum exposure to loss as a result of its involvement with CCMC as of June 30, 2017 could be as high as $58.9 million, OTP’s 35% share of unrecovered costs.
Inventories
Inventories, valued at the lower of cost or net realizable value, consist of the following:
|
June 30, |
December 31, |
|||||||
|
(in thousands) |
2017 |
2016 |
||||||
|
Finished Goods |
$ | 24,646 | $ | 27,755 | ||||
|
Work in Process |
13,977 | 11,754 | ||||||
|
Raw Material, Fuel and Supplies |
48,644 | 44,231 | ||||||
|
Total Inventories |
$ | 87,267 | $ | 83,740 | ||||
Goodwill and Other Intangible Assets
An assessment of the carrying amounts of goodwill of the Company’s operating units as of December 31, 2016 indicated the fair values are substantially in excess of their respective book values and not impaired.
The following table indicates there were no changes to goodwill by business segment during the first six months of 2017:
|
(in thousands) |
Gross Balance December 31, 2016 |
Accumulated Impairments |
Balance (net of impairments) December 31, 2016 |
Adjustments to Goodwill in 2017 |
Balance (net of impairments) June 30, 2017 |
|||||||||||||||
|
Manufacturing |
$ | 18,270 | $ | -- | $ | 18,270 | $ | -- | $ | 18,270 | ||||||||||
|
Plastics |
19,302 | -- | 19,302 | -- | 19,302 | |||||||||||||||
|
Total |
$ | 37,572 | $ | -- | $ | 37,572 | $ | -- | $ | 37,572 | ||||||||||
Intangible assets with finite lives are amortized over their estimated useful lives and reviewed for impairment in accordance with requirements under ASC Topic 360-10-35, Property, Plant, and Equipment—Overall—Subsequent Measurement.
The following table summarizes the components of the Company’s intangible assets at June 30, 2017 and December 31, 2016:
|
June 30, 2017 (in thousands) |
Gross Carrying Amount |
Accumulated Amortization |
Net Carrying Amount |
Remaining Amortization Periods (months) |
|||||||||||
|
Amortizable Intangible Assets: |
|||||||||||||||
|
Customer Relationships |
$ | 22,491 | $ | 8,427 | $ | 14,064 | 30 |
- |
218 | ||||||
|
Covenant not to Compete |
590 | 361 | 229 |
14 |
|||||||||||
|
Other |
98 | -- | 98 |
36 |
|||||||||||
|
Total |
$ | 23,179 | $ | 8,788 | $ | 14,391 | |||||||||
|
December 31, 2016 (in thousands) |
|||||||||||||||
|
Amortizable Intangible Assets: |
|||||||||||||||
|
Customer Relationships |
$ | 22,491 | $ | 7,861 | $ | 14,630 | 36 |
- |
224 | ||||||
|
Covenant not to Compete |
590 | 262 | 328 |
20 |
|||||||||||
|
Total |
$ | 23,081 | $ | 8,123 | $ | 14,958 | |||||||||
The amortization expense for these intangible assets was:
|
Three Months Ended |
Six Months Ended |
|||||||||||||||
|
June 30, |
June 30, |
|||||||||||||||
|
(in thousands) |
2017 |
2016 |
2017 |
2016 |
||||||||||||
|
Amortization Expense – Intangible Assets |
$ | 333 | $ | 398 | $ | 665 | $ | 755 | ||||||||
The estimated annual amortization expense for these intangible assets for the next five years is:
|
(in thousands) |
2017 |
2018 |
2019 |
2020 |
2021 |
|||||||||||||||
|
Estimated Amortization Expense – Intangible Assets |
$ | 1,330 | $ | 1,264 | $ | 1,133 | $ | 1,099 | $ | 1,099 | ||||||||||
Supplemental Disclosures of Cash Flow Information
|
As of June 30, |
||||||||
|
(in thousands) |
2017 |
2016 |
||||||
|
Noncash Investing Activities: |
||||||||
|
Transactions Related to Capital Additions not Settled in Cash |
$ | 16,312 | $ | 17,837 | ||||
New Accounting Standards Adopted
Accounting Standards Update (ASU) 2015-11—In July 2015 the Financial Accounting Standards Board (FASB) issued ASU No. 2015-11, Inventory (Topic 330): Simplifying the Measurement of Inventory, which requires that inventories be measured at the lower of cost or net realizable value instead of the lower of cost or market value. Net realizable value is defined as the estimated selling price in the ordinary course of business, less reasonably predictable costs of completion, disposal, and transportation. The standards update was effective prospectively for fiscal years and interim periods beginning after December 15, 2016. The Company adopted the updates in ASU 2015-11 in the first quarter of 2017. The adoption of the updated standard did not have a material impact on the Company’s consolidated financial statements as market and net realizable value were substantially the same for the inventories of its manufacturing companies.
New Accounting Standards Pending Adoption
ASU 2014-09—In May 2014 the FASB issued ASU No. 2014-09, Revenue from Contracts with Customers (Topic 606) (ASC 606). ASC 606 is a comprehensive, principles-based accounting standard which amends current revenue recognition guidance with the objective of improving revenue recognition requirements by providing a single comprehensive model to determine the measurement of revenue and the timing of revenue recognition. ASC 606 also requires expanded disclosures to enable users of financial statements to understand the nature, amount, timing and uncertainty of revenue and cash flows arising from contracts with customers.
Amendments to the ASC in ASU 2014-09, as amended, are effective for fiscal years beginning after December 15, 2017. Early adoption is permitted, but not any earlier than January 1, 2017. Application methods permitted are: (1) full retrospective, (2) retrospective using one or more practical expedients and (3) retrospective with the cumulative effect of initial application recognized at the date of initial application. The Company does not plan to adopt the updated guidance prior to January 1, 2018. As of June 30, 2017 the Company has reviewed its revenue streams and contracts to determine areas where the amendments in ASU 2014-09 will be applicable and has evaluated transition options. Based on review of the Company’s revenue streams, the Company does not anticipate a significant change in the levels or timing of revenue recognition over an annual or interim period as a result of the adoption of ASU 2014-09. Based on these observations, the Company expects to adopt the updates in ASU 2014-09 retrospectively with the cumulative effect of initial application on retained earnings and other balance sheet accounts recognized on January 1, 2018, the date of initial application. Adoption of ASU 2014-09 will result in additional disclosures related to the nature, timing and certainty of revenues and any contract assets or liabilities that may be required to be reported under the updated standard.
ASU 2016-02—In February 2016 the FASB issued ASU No. 2016-02, Leases (Topic 842) (ASU 2016-02). ASU 2016-02 is a comprehensive amendment of the ASC, creating Topic 842, which will supersede the current requirements under ASC Topic 840 on leases and require the recognition of lease assets and lease liabilities on the balance sheet and the disclosure of key information about leasing arrangements. Topic 842 affects any entity that enters into a lease, with some specified scope exemptions. The main difference between previous Generally Accepted Accounting Principles in the United States (GAAP) and Topic 842 is the recognition of lease assets and lease liabilities by lessees for those leases classified as operating leases under previous GAAP. Topic 842 retains a distinction between finance leases and operating leases. The classification criteria for distinguishing between finance leases and operating leases are substantially similar to the classification criteria for distinguishing between capital leases and operating leases in the previous guidance. Topic 842 also requires qualitative and specific quantitative disclosures by lessees and lessors to meet the objective of enabling users of financial statements to assess the amount, timing, and uncertainty of cash flows arising from leases. The amendments in ASU 2016-02 are effective for fiscal years beginning after December 15, 2018, including interim periods within those fiscal years. Early application of the amendments in ASU 2016-02 is permitted. The Company is currently reviewing ASU 2016-02, developing a list of all current leases outstanding and identifying key impacts to its businesses to determine areas where the amendments in ASU 2016-02 will be applicable and evaluating transition options. The Company does not currently plan to apply the amendments in ASU 2016-02 to its consolidated financial statements prior to 2019.
ASU 2017-04—In January 2017 the FASB issued ASU No. 2017-04, Intangibles—Goodwill and Other (Topic 350): Simplifying the Test for Goodwill Impairment (ASU 2017-04), which simplifies how an entity is required to test goodwill for impairment by eliminating Step 2 from the goodwill impairment test. Step 2 measured a goodwill impairment loss by comparing the implied fair value of a reporting unit’s goodwill with the carrying amount of that goodwill. In computing the implied fair value of goodwill under Step 2, an entity had to perform procedures to determine the fair value at the impairment testing date of its assets and liabilities (including unrecognized assets and liabilities) following the procedure that would be required in determining the fair value of assets acquired and liabilities assumed in a business combination. Under the amendments in ASU 2017-04, an entity will perform its annual, or interim, goodwill impairment test by comparing the fair value of a reporting unit with its carrying amount. An entity will recognize an impairment charge for the amount by which the carrying amount exceeds the reporting unit’s fair value; however, the loss recognized will not exceed the total amount of goodwill allocated to that reporting unit. Additionally, an entity will consider income tax effects from any tax deductible goodwill on the carrying amount of the reporting unit when measuring the goodwill impairment loss, if applicable.
The amendments in ASU 2017-04 modify the concept of impairment from the condition that exists when the carrying amount of goodwill exceeds its implied fair value to the condition that exists when the carrying amount of a reporting unit exceeds its fair value. An entity no longer will determine goodwill impairment by calculating the implied fair value of goodwill by assigning the fair value of a reporting unit to all of its assets and liabilities as if that reporting unit had been acquired in a business combination. Because these amendments eliminate Step 2 from the goodwill impairment test, they should reduce the cost and complexity of evaluating goodwill for impairment. The amendments in ASU 2017-04 are effective for annual or any interim goodwill impairment tests in fiscal years beginning after December 15, 2019. Early adoption is permitted for interim or annual goodwill impairment tests performed on testing dates after January 1, 2017.
ASU 2017-07—In March 2017 the FASB issued ASU No. 2017-07, Compensation—Retirement Benefits (Topic 715): Improving the Presentation of Net Periodic Pension Cost and Net Periodic Postretirement Benefit Cost (ASU 2017-07), which is intended to improve the presentation of net periodic pension cost and net periodic postretirement benefit cost. ASC Topic 715, Compensation—Retirement Benefits (ASC 715), does not prescribe where the amount of net benefit cost should be presented in an employer’s income statement and does not require entities to disclose by line item the amount of net benefit cost that is included in the income statement or capitalized in assets. The amendments in ASU 2017-07 require that an employer report the service cost component of periodic benefit costs in the same line item or items as other compensation costs arising from services rendered by the pertinent employees during the period. The other components of net benefit cost as defined in ASC 715 are required to be presented in the income statement separately from the service cost component and outside a subtotal of income from operations. The amendments in ASU 2017-07 also allow only the service cost component to be eligible for capitalization when applicable (for example, as a cost of internally manufactured inventory or a self-constructed asset). The amendments in ASU 2017-07 are effective for annual periods beginning after December 15, 2017, including interim periods within those annual periods. The amendments will be applied retrospectively for the presentation of the service cost component and the other components of net periodic pension cost and net periodic postretirement benefit cost in the income statement and prospectively, on and after the effective date, for the capitalization of the service cost component of net periodic pension cost and net periodic postretirement benefit in assets.
The majority of the Company’s benefit costs to which the amendments in ASU 2017-07 apply are related to benefit plans in place at OTP, the Company’s regulated provider of electric utility services. The amendments in ASU 2017-07 deviate significantly from current prescribed ratemaking and regulatory accounting treatment of postretirement benefit costs, which require the capitalization of a portion of all the components of net periodic benefit costs be included in rate base additions and provide for rate recovery of the non-capitalized portion of all of the components of net periodic pension costs as recoverable operating expenses. The Company currently is assessing the impact adoption of the amendments in ASU 2017-07 may have on its consolidated financial statements, financial position and results of operations and is determining what adjustments and regulatory assets, if any, may need to be established in order to reflect the effect of the required regulatory accounting treatment of the affected net periodic benefit costs. At a minimum, the Company anticipates the non-service cost components of the affected net periodic benefit costs will be reported below the operating income line on its consolidated income statements upon adoption of the amendments in ASU 2017-07. The Company does not plan to adopt the updates in ASU 2017-07 prior to the first quarter of 2018, the required effective period for application of the updates by the Company.
2. Segment Information
Segment Information
The accounting policies of the segments are described under note 1 – Summary of Significant Accounting Policies. The Company's businesses have been classified into three segments to be consistent with its business strategy and the reporting and review process used by the Company’s chief operating decision makers. These businesses sell products and provide services to customers primarily in the United States. The Company’s business structure currently includes the following three segments: Electric, Manufacturing and Plastics. The chart below indicates the companies included in each segment.
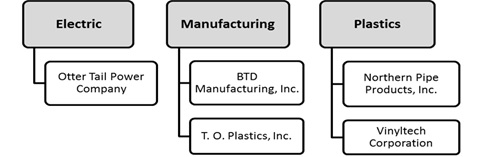
Electric includes the production, transmission, distribution and sale of electric energy in Minnesota, North Dakota and South Dakota by OTP. In addition, OTP is a participant in the Midcontinent Independent System Operator, Inc. (MISO) markets. OTP’s operations have been the Company’s primary business since 1907.
Manufacturing consists of businesses in the following manufacturing activities: contract machining, metal parts stamping, fabrication and painting, and production of plastic thermoformed horticultural containers, life science and industrial packaging, and material handling components. These businesses have manufacturing facilities in Georgia, Illinois and Minnesota and sell products primarily in the United States.
Plastics consists of businesses producing polyvinyl chloride (PVC) pipe at plants in North Dakota and Arizona. The PVC pipe is sold primarily in the upper Midwest and Southwest regions of the United States.
OTP is a wholly owned subsidiary of the Company. All of the Company’s other businesses are owned by its wholly owned subsidiary, Varistar Corporation (Varistar). The Company’s Corporate operating costs include items such as corporate staff and overhead costs, the results of the Company’s captive insurance company and other items excluded from the measurement of operating segment performance. Corporate assets consist primarily of cash, prepaid expenses, investments and fixed assets. Corporate is not an operating segment. Rather, it is added to operating segment totals to reconcile to totals on the Company’s consolidated financial statements.
No single customer accounted for over 10% of the Company’s consolidated revenues in 2016. All of the Company’s long-lived assets are within the United States and sales within the United States accounted for 98.3% and 98.5% of its operating revenues for the respective three-month periods ended June 30, 2017 and 2016, and 98.3% and 98.7% of its operating revenues for the respective six-month periods ended June 30, 2017 and 2016.
The Company evaluates the performance of its business segments and allocates resources to them based on earnings contribution and return on total invested capital. Information for the business segments for the three- and six-month periods ended June 30, 2017 and 2016 and total assets by business segment as of June 30, 2017 and December 31, 2016 are presented in the following tables:
Operating Revenue
|
Three Months Ended |
Six Months Ended |
|||||||||||||||
|
June 30, |
June 30, |
|||||||||||||||
|
(in thousands) |
2017 |
2016 |
2017 |
2016 |
||||||||||||
|
Electric |
$ | 102,236 | $ | 97,925 | $ | 220,787 | $ | 210,919 | ||||||||
|
Manufacturing |
59,304 | 58,452 | 117,721 | 118,272 | ||||||||||||
|
Plastics |
50,551 | 47,112 | 87,708 | 80,549 | ||||||||||||
|
Intersegment Eliminations |
(5 | ) | (7 | ) | (13 | ) | (16 | ) | ||||||||
|
Total |
$ | 212,086 | $ | 203,482 | $ | 426,203 | $ | 409,724 | ||||||||
Interest Charges
|
Three Months Ended |
Six Months Ended |
|||||||||||||||
|
June 30, |
June 30, |
|||||||||||||||
|
(in thousands) |
2017 |
2016 |
2017 |
2016 |
||||||||||||
|
Electric |
$ | 6,439 | $ | 6,156 | $ | 12,825 | $ | 12,440 | ||||||||
|
Manufacturing |
553 | 1,006 | 1,107 | 1,998 | ||||||||||||
|
Plastics |
173 | 279 | 326 | 523 | ||||||||||||
|
Corporate and Intersegment Eliminations |
362 | 535 | 731 | 1,009 | ||||||||||||
|
Total |
$ | 7,527 | $ | 7,976 | $ | 14,989 | $ | 15,970 | ||||||||
Income Taxes
|
Three Months Ended |
Six Months Ended |
|||||||||||||||
|
June 30, |
June 30, |
|||||||||||||||
|
(in thousands) |
2017 |
2016 |
2017 |
2016 |
||||||||||||
|
Electric |
$ | 2,442 | $ | 1,920 | $ | 8,504 | $ | 6,532 | ||||||||
|
Manufacturing |
1,573 | 1,791 | 2,628 | 2,810 | ||||||||||||
|
Plastics |
2,858 | 2,262 | 4,248 | 3,629 | ||||||||||||
|
Corporate |
(976 | ) | (890 | ) | (3,120 | ) | (2,396 | ) | ||||||||
|
Total |
$ | 5,897 | $ | 5,083 | $ | 12,260 | $ | 10,575 | ||||||||
Net Income (Loss)
|
Three Months Ended |
Six Months Ended |
|||||||||||||||
|
June 30, |
June 30, |
|||||||||||||||
|
(in thousands) |
2017 |
2016 |
2017 |
2016 |
||||||||||||
|
Electric |
$ | 10,134 | $ | 9,148 | $ | 25,694 | $ | 21,686 | ||||||||
|
Manufacturing |
2,955 | 3,009 | 5,127 | 4,862 | ||||||||||||
|
Plastics |
4,637 | 3,485 | 7,074 | 5,637 | ||||||||||||
|
Corporate |
(1,009 | ) | (86 | ) | (1,649 | ) | (2,139 | ) | ||||||||
|
Discontinued Operations |
61 | 119 | 117 | 149 | ||||||||||||
|
Total |
$ | 16,778 | $ | 15,675 | $ | 36,363 | $ | 30,195 | ||||||||
Identifiable Assets
|
June 30, |
December 31, |
|||||||
|
(in thousands) |
2017 |
2016 |
||||||
|
Electric |
$ | 1,639,699 | $ | 1,622,231 | ||||
|
Manufacturing |
170,429 | 166,525 | ||||||
|
Plastics |
94,900 | 84,592 | ||||||
|
Corporate |
39,028 | 39,037 | ||||||
|
Total |
$ | 1,944,056 | $ | 1,912,385 | ||||
3. Rate and Regulatory Matters
Below are descriptions of OTP’s major capital expenditure projects that have had, or will have, a significant impact on OTP’s revenue requirements, rates and alternative revenue recovery mechanisms, followed by summaries of specific electric rate or rider proceedings with the Minnesota Public Utilities Commission (MPUC), the North Dakota Public Service Commission (NDPSC), the South Dakota Public Utilities Commission (SDPUC) and the Federal Energy Regulatory Commission (FERC) impacting OTP’s revenues in 2017 and 2016.
Major Capital Expenditure Projects
The Big Stone South – Brookings Multi-Value Transmission Project (MVP) and Capacity Expansion 2020 (CapX2020) Project—This 345 kiloVolt (kV) transmission line, currently under construction, will extend approximately 70 miles between a substation near Big Stone City, South Dakota and the Brookings County Substation near Brookings, South Dakota. OTP and Northern States Power – MN (NSP MN), a subsidiary of Xcel Energy Inc., jointly developed this project and the parties will have equal ownership interest in the transmission line portion of the project. MISO approved this project as an MVP under the MISO Open Access Transmission, Energy and Operating Reserve Markets Tariff (MISO Tariff) in December 2011. MVPs are designed to enable the region to comply with energy policy mandates and to address reliability and economic issues affecting multiple areas within the MISO region. The cost allocation is designed to ensure the costs of transmission projects with regional benefits are properly assigned to those who benefit. Construction began on this line in the third quarter of 2015 and the line is expected to be in service in fall 2017. OTP’s capitalized costs on this project as of June 30, 2017 were approximately $66.3 million, which includes assets that are 100% owned by OTP.
The Big Stone South – Ellendale MVP—This is a 345 kV transmission line that will extend 163 miles between a substation near Big Stone City, South Dakota and a substation near Ellendale, North Dakota. OTP jointly developed this project with Montana-Dakota Utilities Co., a division of MDU Resources Group, Inc. (MDU), and the parties will have equal ownership interest in the transmission line portion of the project. MISO approved this project as an MVP under the MISO Tariff in December 2011. Construction began on this line in the second quarter of 2016 and is expected to be completed in 2019. OTP’s capitalized costs on this project as of June 30, 2017 were approximately $65.5 million, which includes assets that are 100% owned by OTP.
Recovery of OTP’s major transmission investments is through the MISO Tariff (several as MVPs) and, currently, Minnesota, North Dakota and South Dakota Transmission Cost Recovery (TCR) Riders.
Minnesota
2016 General Rate Case—The MPUC rendered its final decision in OTP’s 2016 general rate case in March 2017 and issued its written order on May 1, 2017. Pursuant to the order, OTP’s allowed rate of return on rate base will decrease from 8.61% to 7.5056% and its allowed rate of return on equity will decrease from 10.74% to 9.41%. On July 6, 2017 the MPUC denied OTP’s request for reconsideration of certain of the MPUC’s rulings in the rate case and confirmed details of its May 1, 2017 order approving OTP’s request for a revenue increase in Minnesota. Information on the initial request for a revenue increase, interim and projected final rate increases and interim revenue refund accrued is detailed in the tables below:
|
($ in thousands) |
Initial Request February 16, 2016 |
Interim Rates Authorized April 14, 2016 |
Projected Final Rates |
|||||||||
|
Revenue Increase – Annualized based on Test Year Data |
$ | 19,296 | $ | 16,816 | $ | 12,100 | ||||||
|
Revenue Percent Increase |
9.80 | % | 9.56 | % | 6.23 | % | ||||||
|
Return on Rate Base |
8.07 | % | 8.07 | % | 7.5056 | % | ||||||
|
Jurisdictional Rate Base based on Test Year Data |
$ | 483,000 | $ | 483,000 | $ | 471,000 | ||||||
|
Return on Equity |
10.40 | % | 10.1 | % | 9.41 | % | ||||||
|
Based on Equity to Total Capital of |
52.50 | % | 52.50 | % | 52.50 | % | ||||||
|
Debt to Total Capital |
47.50 | % | 47.50 | % | 47.50 | % | ||||||
|
Interim Revenue (in thousands) |
April 16, 2016 through June 30, 2017 |
|||
|
Billed and Accrued |
$ | 18,956 | ||
|
Accrued Refund |
$ | 7,449 | ||
|
Net Interim Revenue Earned and Reported |
$ | 11,507 | ||
|
Interest on Refundable Amount |
$ | 163 | ||
|
Refund Liability as of June 30, 2017 |
$ | 7,612 | ||
OTP will continue to accrue the interim rate refund until final rates become effective, expected for bills rendered on and after November 1, 2017. The interim rate refund, including interest, will be applied as a credit to Minnesota customers’ electric bills in the fourth quarter of 2017.
The MPUC’s order also included: (1) the determination that all costs (including FERC allocated costs and revenues) of the Big Stone South to Brookings and Big Stone South to Ellendale MVP projects will be included in the Minnesota TCR rider and jurisdictionally allocated to OTP’s Minnesota customers, and (2) approval of OTP’s proposal to transition rate base, expenses and revenues from Environmental Cost Recovery (ECR) and TCR riders to base rate recovery, with the transition occurring when final rates are implemented. The rate base balances, expense levels and revenue levels existing in the riders at the time of implementation of final rates will be used to establish the amounts transitioned to base rates. Certain MISO expenses and revenues will remain in the TCR rider to allow for the ongoing refund or recovery of these variable revenues and costs.
Minnesota Conservation Improvement Programs (MNCIP)—OTP recovers conservation related costs not included in base rates under the MNCIP through the use of an annual recovery mechanism approved by the MPUC. On May 25, 2016 the MPUC adopted the Minnesota Department of Commerce’s (MNDOC’s) proposed changes to the MNCIP financial incentive. The new model provides utilities an incentive of 13.5% of 2017 net benefits, 12% of 2018 net benefits and 10% of 2019 net benefits, assuming the utility achieves 1.7% savings compared to retail sales. OTP estimates the impact of the new model will reduce the MNCIP financial incentive by approximately 50% compared to the previous incentive mechanism. MNCIP incentives include $5.0 million requested for 2016, $4.3 million approved for 2015 and $3.0 million approved for 2014. The MNDOC recently granted two large customers’ requests for exemption from OTP’s MNCIP pursuant to Minnesota Law. With the exemption of these two customers, recovery of the portion of OTP’s MNCIP costs previously recovered from these two customers has shifted to OTP’s other Minnesota customers.
Transmission Cost Recovery Rider—The Minnesota Public Utilities Act provides a mechanism for automatic adjustment outside of a general rate proceeding to recover the costs of new transmission facilities that meet certain criteria, plus a return on investment at the level approved in a utility’s last general rate case. Additionally, following approval of the rate schedule, the MPUC may approve annual rate adjustments filed pursuant to the rate schedule.
In OTP’s 2016 general rate case, the MPUC ordered OTP to include, in the TCR rider retail rate base, Minnesota’s jurisdictional share of OTP’s investment in the Big Stone South – Brookings and Big Stone South – Ellendale MVP Projects and all revenues received from other utilities under MISO’s tariffed rates as a credit in its TCR revenue requirement calculations. The MPUC-ordered treatment will result in the projects being treated as retail investments for Minnesota retail ratemaking purposes.
Environmental Cost Recovery Rider—OTP has an ECR rider for recovery of OTP’s Minnesota jurisdictional share of the revenue requirements of its investment in the Big Stone Plant Air Quality Control System (AQCS). The ECR rider provides for a return on the project’s construction work in progress (CWIP) balance at the level approved in OTP’s 2010 general rate case. In OTP’s 2016 general rate case, the MPUC approved OTP’s proposal to transition eligible rate base and expense recovery from the ECR rider to base rate recovery, with the transition occurring when final rates are implemented.
North Dakota
General Rates—OTP’s most recent general rate increase in North Dakota of $3.6 million, or approximately 3.0%, was granted by the NDPSC in an order issued on November 25, 2009 and effective December 2009. Pursuant to the order, OTP’s allowed rate of return on rate base was set at 8.62%, and its allowed rate of return on equity was set at 10.75%.
Renewable Resource Adjustment—OTP has a North Dakota Renewable Resource Adjustment which enables OTP to recover its North Dakota jurisdictional share of investments in renewable energy facilities. This rider allows OTP to recover costs associated with new renewable energy projects as they are completed, along with a return on investment.
Transmission Cost Recovery Rider—North Dakota law provides a mechanism for automatic adjustment outside of a general rate proceeding to recover jurisdictional capital and operating costs incurred by a public utility for new or modified electric transmission facilities. For qualifying projects, the law authorizes a current return on CWIP and a return on investment at the level approved in the utility's most recent general rate case.
Environmental Cost Recovery Rider—OTP has an ECR rider in North Dakota to recover its North Dakota jurisdictional share of the revenue requirements associated with its investment in the Big Stone Plant AQCS and Hoot Lake Plant Mercury and Air Toxics Standards (MATS) projects. The ECR rider provides for a current return on CWIP and a return on investment at the level approved in OTP’s most recent general rate case.
South Dakota
2010 General Rate Case—OTP’s most recent general rate increase in South Dakota of approximately $643,000 or approximately 2.32% was granted by the SDPUC in an order issued on April 21, 2011 and effective with bills rendered on and after June 1, 2011. Pursuant to the order, OTP’s allowed rate of return on rate base was set at 8.50%.
Transmission Cost Recovery Rider—South Dakota law provides a mechanism for automatic adjustment outside of a general rate proceeding to recover jurisdictional capital and operating costs incurred by a public utility for new or modified electric transmission facilities.
Environmental Cost Recovery Rider—OTP has an ECR rider in South Dakota to recover its South Dakota jurisdictional share of revenue requirements associated with its investment in the Big Stone Plant AQCS and Hoot Lake Plant MATS projects.
Rate Rider Updates
The following table provides summary information on the status of updates since January 1, 2015 for the rate riders described above:
|
Rate Rider |
R - Request Date A - Approval Date |
Effective Date Requested or Approved |
Annual Revenue ($000s) |
Rate |
|||||
|
Minnesota |
|||||||||
|
Conservation Improvement Program |
|||||||||
|
2016 Incentive and Cost Recovery |
R – March 31, 2017 |
October 1, 2017 |
$ | 9,868 |
$0.00754/kwh |
||||
|
2015 Incentive and Cost Recovery |
A – July 19, 2016 |
October 1, 2016 |
$ | 8,590 |
$0.00275/kwh |
||||
|
2014 Incentive and Cost Recovery |
A – July 10, 2015 |
October 1, 2015 |
$ | 8,689 |
$0.00287/kwh |
||||
|
Transmission Cost Recovery |
|||||||||
|
2016 Annual Update1 |
A – July 5, 2016 |
September 1, 2016 |
$ | 4,736 |
Various |
||||
|
2015 Annual Update |
A – March 9, 2016 |
April 1, 2016 |
$ | 7,203 |
Various |
||||
|
2014 Annual Update |
A – February 18, 2015 |
March 1, 2015 |
$ | 8,388 |
Various |
||||
|
Environmental Cost Recovery |
|||||||||
|
2016 Annual Update1 |
A – July 5, 2016 |
September 1, 2016 |
$ | 11,884 |
6.927% of Rev |
||||
|
2015 Annual Update |
A – March 9, 2016 |
October 1, 2015 |
$ | 12,104 |
7.006% of Rev |
||||
|
North Dakota |
|||||||||
|
Renewable Resource Adjustment |
|||||||||
|
2016 Annual Update |
A – March 15, 2017 |
April 1, 2017 |
$ | 9,156 |
7.005% of Rev |
||||
|
2015 Annual Update |
A – June 22, 2016 |
July 1, 2016 |
$ | 9,262 |
7.573% of Rev |
||||
|
2014 Annual Update |
A – March 25, 2015 |
April 1, 2015 |
$ | 5,441 |
4.069% of Rev |
||||
|
Transmission Cost Recovery |
|||||||||
|
2016 Annual Update |
A – December 14, 2016 |
January 1, 2017 |
$ | 6,916 |
Various |
||||
|
2015 Annual Update |
A – December 16, 2015 |
January 1, 2016 |
$ | 9,985 |
Various |
||||
|
Environmental Cost Recovery |
|||||||||
|
2017 Annual Update |
A – July 12, 2017 |
August 1, 2017 |
$ | 9,917 |
7.633% of base |
||||
|
2016 Annual Update |
A – June 22, 2016 |
July 1, 2016 |
$ | 10,359 |
7.904% of base |
||||
|
2015 Annual Update |
A – June 17, 2015 |
July 1, 2015 |
$ | 12,249 |
9.193% of base |
||||
|
South Dakota |
|||||||||
|
Transmission Cost Recovery |
|||||||||
|
2016 Annual Update |
A – February 17, 2017 |
March 1, 2017 |
$ | 2,053 |
Various |
||||
|
2015 Annual Update |
A – February 12, 2016 |
March 1, 2016 |
$ | 1,895 |
Various |
||||
|
2014 Annual Update |
A – February 13, 2015 |
March 1, 2015 |
$ | 1,538 |
Various |
||||
|
Environmental Cost Recovery |
|||||||||
|
2016 Annual Update |
A – October 26, 2016 |
November 1, 2016 |
$ | 2,238 |
$0.00536/kwh |
||||
|
2015 Annual Update |
A – October 15, 2015 |
November 1, 2015 |
$ | 2,728 |
$0.00643/kwh |
||||
1Approved on a provisional basis and subject to change based on comments from the MNDOC.
The following table presents revenue recorded by OTP under rate riders in place in Minnesota, North Dakota and South Dakota:
Revenues Recorded under Rider Rates
|
Three Months Ended June 30, |
Six Months Ended June 30, |
|||||||||||||||
|
Rate Rider (in thousands) |
2017 |
2016 |
2017 |
2016 |
||||||||||||
|
Minnesota |
||||||||||||||||
|
Conservation Improvement Program Costs and Incentives1 |
$ | 2,102 | $ | 2,209 | $ | 4,068 | $ | 4,715 | ||||||||
|
Transmission Cost Recovery |
1,273 | 1,133 | 3,443 | 3,409 | ||||||||||||
|
Environmental Cost Recovery |
2,812 | 3,153 | 5,636 | 6,235 | ||||||||||||
|
North Dakota |
||||||||||||||||
|
Renewable Resource Adjustment |
1,839 | 1,922 | 3,609 | 3,981 | ||||||||||||
|
Transmission Cost Recovery |
1,384 | 1,969 | 3,895 | 4,205 | ||||||||||||
|
Environmental Cost Recovery |
2,388 | 2,771 | 4,876 | 5,582 | ||||||||||||
|
South Dakota |
||||||||||||||||
|
Transmission Cost Recovery |
287 | 411 | 728 | 1,062 | ||||||||||||
|
Environmental Cost Recovery |
545 | 627 | 1,142 | 1,260 | ||||||||||||
|
Conservation Improvement Program Costs and Incentives |
176 | 124 | 416 | 283 | ||||||||||||
|
1Includes MNCIP costs recovered in base rates. |
FERC
Wholesale power sales and transmission rates are subject to the jurisdiction of the FERC under the Federal Power Act of 1935, as amended. The FERC is an independent agency with jurisdiction over rates for wholesale electricity sales, transmission and sale of electric energy in interstate commerce, interconnection of facilities, and accounting policies and practices. Filed rates are effective after a one day suspension period, subject to ultimate approval by the FERC.
Multi-Value Transmission Projects—On December 16, 2010 the FERC approved the cost allocation for a new classification of projects in the MISO region called MVPs. MVPs are designed to enable the region to comply with energy policy mandates and to address reliability and economic issues affecting multiple transmission zones within the MISO region. The cost allocation is designed to ensure that the costs of transmission projects with regional benefits are properly assigned to those who benefit.
On November 12, 2013 a group of industrial customers and other stakeholders filed a complaint with the FERC seeking to reduce the ROE component of the transmission rates that MISO transmission owners, including OTP, may collect under the MISO Tariff. The complainants sought to reduce the 12.38% ROE used in MISO’s transmission rates to a proposed 9.15%. The complaint established a 15-month refund period from November 12, 2013 to February 11, 2015. A non-binding decision by the presiding Administrative Law Judge (ALJ) was issued on December 22, 2015 finding that the MISO transmission owners’ ROE should be 10.32%, and the FERC issued an order on September 28, 2016 setting the base ROE at 10.32%.
On November 6, 2014 a group of MISO transmission owners, including OTP, filed for a FERC incentive of an additional 50-basis points for Regional Transmission Organization participation (RTO Adder). On January 5, 2015 the FERC granted the request, deferring collection of the RTO Adder until the FERC issued its order in the ROE complaint proceeding. Based on the FERC adjustment to the MISO Tariff ROE resulting from the November 12, 2013 complaint and OTP’s incentive rate filing, OTP’s ROE will be 10.82% (a 10.32% base ROE plus the 0.5% RTO Adder) effective September 28, 2016.
On February 12, 2015 another group of stakeholders filed a complaint with the FERC seeking to reduce the ROE component of the transmission rates that MISO transmission owners, including OTP, may collect under the MISO Tariff from 12.38% to a proposed 8.67%. This second complaint established a second 15-month refund period from February 12, 2015 to May 11, 2016. The FERC issued an order on June 18, 2015 setting the complaint for hearings before an ALJ, which were held the week of February 16, 2016. A non-binding decision by the presiding ALJ was issued on June 30, 2016 finding that the MISO transmission owners’ ROE should be 9.7%. A lack of a quorum at FERC will delay the issuance of an order in the second complaint for an uncertain period of time.
Based on the probable reduction by the FERC in the ROE component of the MISO Tariff, OTP had a $2.7 million liability on its balance sheet as of December 31, 2016, representing OTP’s best estimate of the refund obligations that would arise, net of amounts that would be subject to recovery under state jurisdictional TCR riders, based on a reduced ROE. MISO processed the refund for the FERC ordered reduction in the MISO tariff allowed ROE for the first 15-month refund period in its February and June 2017 billings. The refund, in combination with a decision in the 2016 Minnesota general rate case that affected the Minnesota TCR rider, resulted in a reduction in OTP’s accrued MISO tariff ROE refund liability from $2.7 million on December 31, 2016 to $1.6 million as of June 30, 2017.
4. Regulatory Assets and Liabilities
As a regulated entity, OTP accounts for the financial effects of regulation in accordance with ASC Topic 980, Regulated Operations (ASC 980). This accounting standard allows for the recording of a regulatory asset or liability for costs that will be collected or refunded in the future as required under regulation. Additionally, ASC 980-605-25 provides for the recognition of revenues authorized for recovery outside of a general rate case under alternative revenue programs which provide for recovery of costs and incentives or returns on investment in such items as transmission infrastructure, renewable energy resources or conservation initiatives. The following tables indicate the amount of regulatory assets and liabilities recorded on the Company’s consolidated balance sheets:
|
June 30, 2017 |
Remaining Recovery/ Refund Period |
||||||||||||
|
(in thousands) |
Current |
Long-Term |
Total |
(months) |
|||||||||
|
Regulatory Assets: |
|||||||||||||
|
Prior Service Costs and Actuarial Losses on Pensions and Other Postretirement Benefits1 |
$ | 6,444 | $ | 105,045 | $ | 111,489 |
see below |
||||||
|
Conservation Improvement Program Costs and Incentives2 |
3,185 | 6,705 | 9,890 |
27 |
|||||||||
|
Deferred Marked-to-Market Losses1 |
4,063 | 4,436 | 8,499 |
42 |
|||||||||
|
Accumulated ARO Accretion/Depreciation Adjustment1 |
-- | 6,400 | 6,400 |
asset lives |
|||||||||
|
Big Stone II Unrecovered Project Costs – Minnesota1 |
699 | 1,762 | 2,461 |
46 |
|||||||||
|
Debt Reacquisition Premiums1 |
277 | 1,087 | 1,364 |
183 |
|||||||||
|
Deferred Income Taxes1 |
-- | 1,026 | 1,026 |
asset lives |
|||||||||
|
Minnesota Deferred Rate Case Expenses Subject to Recovery1 |
725 | -- | 725 |
10 |
|||||||||
|
North Dakota Renewable Resource Rider Accrued Revenues2 |
331 | 294 | 625 |
21 |
|||||||||
|
Big Stone II Unrecovered Project Costs – South Dakota2 |
100 | 492 | 592 |
71 |
|||||||||
|
MISO Schedule 26/26A Transmission Cost Recovery Rider True-up2 |
170 | 232 | 402 |
30 |
|||||||||
|
North Dakota Transmission Cost Recovery Rider Accrued Revenues2 |
284 | -- | 284 |
6 |
|||||||||
|
Minnesota Transmission Cost Recovery Rider Accrued Revenues2 |
180 | -- | 180 |
12 |
|||||||||
|
South Dakota Transmission Cost Recovery Rider Accrued Revenues2 |
71 | -- | 71 |
6 |
|||||||||
|
Minnesota Renewable Resource Rider Accrued Revenues2 |
11 | -- | 11 |
3 |
|||||||||
|
Total Regulatory Assets |
$ | 16,540 | $ | 127,479 | $ | 144,019 | |||||||
|
Regulatory Liabilities: |
|||||||||||||
|
Accumulated Reserve for Estimated Removal Costs – Net of Salvage |
$ | -- | $ | 82,158 | $ | 82,158 |
asset lives |
||||||
|
North Dakota Transmission Cost Recovery Rider Accrued Refund |
929 | 498 | 1,427 |
18 |
|||||||||
|
Deferred Income Taxes |
-- | 753 | 753 |
asset lives |
|||||||||
|
Minnesota Environmental Cost Recovery Rider Accrued Refund |
645 | -- | 645 |
12 |
|||||||||
|
Revenue for Rate Case Expenses Subject to Refund – Minnesota |
563 | -- | 563 |
10 |
|||||||||
|
Refundable Fuel Clause Adjustment Revenues |
509 | -- | 509 |
12 |
|||||||||
|
South Dakota Environmental Cost Recovery Rider Accrued Refund |
332 | -- | 332 |
12 |
|||||||||
|
North Dakota Environmental Cost Recovery Rider Accrued Refund |
167 | -- | 167 |
12 |
|||||||||
|
South Dakota Transmission Cost Recovery Rider Accrued Refund |
151 | -- | 151 |
12 |
|||||||||
|
MISO Schedule 26/26A Transmission Cost Recovery Rider True-up |
66 | 66 | 132 |
18 |
|||||||||
|
Other |
6 | 86 | 92 |
198 |
|||||||||
|
Total Regulatory Liabilities |
$ | 3,368 | $ | 83,561 | $ | 86,929 | |||||||
|
Net Regulatory Asset Position |
$ | 13,172 | $ | 43,918 | $ | 57,090 | |||||||
|
1Costs subject to recovery without a rate of return. 2Amount eligible for recovery under an alternative revenue program which includes an incentive or rate of return. |
|
December 31, 2016 |
Remaining Recovery/ Refund Period |
||||||||||||
|
(in thousands) |
Current |
Long-Term |
Total |
(months) |
|||||||||
|
Regulatory Assets: |
|||||||||||||
|
Prior Service Costs and Actuarial Losses on Pensions and Other Postretirement Benefits1 |
$ | 6,443 | $ | 108,267 | $ | 114,710 |
see below |
||||||
|
Conservation Improvement Program Costs and Incentives2 |
4,836 | 5,158 | 9,994 |
21 |
|||||||||
|
Deferred Marked-to-Market Losses1 |
4,063 | 6,467 | 10,530 |
48 |
|||||||||
|
Accumulated ARO Accretion/Depreciation Adjustment1 |
-- | 6,153 | 6,153 |
asset lives |
|||||||||
|
Big Stone II Unrecovered Project Costs – Minnesota1 |
778 | 2,087 | 2,865 |
52 |
|||||||||
|
Recoverable Fuel and Purchased Power Costs1 |
1,798 | -- | 1,798 |
12 |
|||||||||
|
Debt Reacquisition Premiums1 |
325 | 1,214 | 1,539 |
189 |
|||||||||
|
Deferred Income Taxes1 |
-- | 1,014 | 1,014 |
asset lives |
|||||||||
|
Minnesota Deferred Rate Case Expenses Subject to Recovery1 |
1,082 | -- | 1,082 |
12 |
|||||||||
|
North Dakota Renewable Resource Rider Accrued Revenues2 |
1,319 | 482 | 1,801 |
15 |
|||||||||
|
Big Stone II Unrecovered Project Costs – South Dakota2 |
100 | 543 | 643 |
77 |
|||||||||
|
MISO Schedule 26/26A Transmission Cost Recovery Rider True-up2 |
333 | -- | 333 |
12 |
|||||||||
|
North Dakota Transmission Cost Recovery Rider Accrued Revenues2 |
-- | 568 | 568 |
24 |
|||||||||
|
South Dakota Transmission Cost Recovery Rider Accrued Revenues2 |
73 | 141 | 214 |
14 |
|||||||||
|
North Dakota Environmental Cost Recovery Rider Accrued Revenues2 |
113 | -- | 113 |
12 |
|||||||||
|
Minnesota Renewable Resource Rider Accrued Revenues2 |
34 | -- | 34 |
9 |
|||||||||
|
Total Regulatory Assets |
$ | 21,297 | $ | 132,094 | $ | 153,391 | |||||||
|
Regulatory Liabilities: |
|||||||||||||
|
Accumulated Reserve for Estimated Removal Costs – Net of Salvage |
$ | -- | $ | 80,404 | $ | 80,404 |
asset lives |
||||||
|
North Dakota Transmission Cost Recovery Rider Accrued Refund |
1,381 | 782 | 2,163 |
24 |
|||||||||
|
Deferred Income Taxes |
-- | 818 | 818 |
asset lives |
|||||||||
|
Minnesota Environmental Cost Recovery Rider Accrued Refund |
139 | -- | 139 |
12 |
|||||||||
|
Revenue for Rate Case Expenses Subject to Refund – Minnesota |
711 | 208 | 919 |
16 |
|||||||||
|
Minnesota Transmission Cost Recovery Rider Accrued Refund |
757 | -- | 757 |
12 |
|||||||||
|
South Dakota Environmental Cost Recovery Rider Accrued Refund |
285 | -- | 285 |
12 |
|||||||||
|
MISO Schedule 26/26A Transmission Cost Recovery Rider True-up |
-- | 132 | 132 |
24 |
|||||||||
|
Other |
21 | 89 | 110 |
204 |
|||||||||
|
Total Regulatory Liabilities |
$ | 3,294 | $ | 82,433 | $ | 85,727 | |||||||
|
Net Regulatory Asset Position |
$ | 18,003 | $ | 49,661 | $ | 67,664 | |||||||
|
1Costs subject to recovery without a rate of return. 2Amount eligible for recovery under an alternative revenue program which includes an incentive or rate of return. |
The regulatory asset related to prior service costs and actuarial losses on pensions and other postretirement benefits represents benefit costs and actuarial losses subject to recovery through rates as they are expensed over the remaining service lives of active employees included in the plans. These unrecognized benefit costs and actuarial losses are required to be recognized as components of Accumulated Other Comprehensive Income in equity under ASC Topic 715, Compensation—Retirement Benefits, but are eligible for treatment as regulatory assets based on their probable recovery in future retail electric rates.
Conservation Improvement Program Costs and Incentives represent mandated conservation expenditures and incentives recoverable through retail electric rates.
All Deferred Marked-to-Market Losses recorded as of June 30, 2017 relate to forward purchases of energy scheduled for delivery through December 2020.
The Accumulated Asset Retirement Obligation (ARO) Accretion/Depreciation Adjustment will accrete and be amortized over the lives of property with asset retirement obligations.
Big Stone II Unrecovered Project Costs – Minnesota are the Minnesota share of generation and transmission plant-related costs incurred by OTP related to its participation in the abandoned Big Stone II project.
Debt Reacquisition Premiums are being recovered from OTP customers over the remaining original lives of the reacquired debt issues, the longest of which is 183 months.
The regulatory assets and liabilities related to Deferred Income Taxes result from changes in statutory tax rates accounted for in accordance with ASC Topic 740, Income Taxes.
Minnesota Deferred Rate Case Expenses Subject to Recovery relate to costs incurred in conjunction with OTP’s 2016 rate case in Minnesota currently being recovered over a 24-month period beginning with the establishment of interim rates in April 2016.
North Dakota Renewable Resource Rider Accrued Revenues relate to qualifying renewable resource costs incurred to serve North Dakota customers that have not been billed to North Dakota customers as of June 30, 2017.
Big Stone II Unrecovered Project Costs – South Dakota are the South Dakota share of generation and transmission plant-related costs incurred by OTP related to its participation in the abandoned Big Stone II project.
MISO Schedule 26/26A Transmission Cost Recovery Rider True-ups relate to the over/under collection of revenue based on comparison of the expected versus actual construction on eligible projects in the period. The true-ups also include the state jurisdictional portion of MISO Schedule 26/26A for regional transmission cost recovery that was included in the calculation of the state transmission riders and subsequently adjusted to reflect actual billing amounts in the schedule.
The North Dakota Transmission Cost Recovery Rider Accrued Revenues relate to revenues earned on qualifying transmission system facilities that have not been billed to North Dakota customers as of June 30, 2017.
The Minnesota Transmission Cost Recovery Rider Accrued Revenues relate to revenues earned on qualifying transmission system facilities that have not been billed to Minnesota customers as of June 30, 2017.
The South Dakota Transmission Cost Recovery Rider Accrued Revenues relate to revenues earned on qualifying transmission system facilities that have not been billed to South Dakota customers as of June 30, 2017.
Minnesota Renewable Resource Rider Accrued Revenues relate to revenues earned on qualifying renewable resource costs incurred to serve Minnesota customers that have not been billed to Minnesota customers. On April 4, 2013 the MPUC approved OTP’s request to set the rider rate to zero effective May 1, 2013 and authorized that any unrecovered balance be retained as a regulatory asset to be recovered over an 18-month period beginning with the establishment of interim rates in April 2016.
The Accumulated Reserve for Estimated Removal Costs – Net of Salvage is reduced as actual removal costs, net of salvage revenues, are incurred.
The North Dakota Transmission Cost Recovery Rider Accrued Refund relates to amounts collected for qualifying transmission system facilities and operating costs incurred to serve North Dakota customers that are refundable to North Dakota customers as of June 30, 2017.
The Minnesota Environmental Cost Recovery Rider Accrued Refund relates to amounts collected on the Minnesota share of OTP’s investment in the Big Stone Plant AQCS project that are refundable to Minnesota customers as of June 30, 2017.
Revenue for Rate Case Expenses Subject to Refund – Minnesota relates to revenues collected under general rates to recover costs related to prior rate case proceedings in excess of the actual costs incurred, which are subject to refund over a 24-month period beginning with the establishment of interim rates in April 2016.
The South Dakota Environmental Cost Recovery Rider Accrued Refund relates to amounts collected on the South Dakota share of OTP’s investments in the Big Stone Plant AQCS and Hoot Lake Plant MATS projects that are refundable to South Dakota customers as of June 30, 2017.
The North Dakota Environmental Cost Recovery Rider Accrued Refund relates to amounts collected on the North Dakota share of OTP’s investments in the Big Stone Plant AQCS and Hoot Lake Plant MATS projects that are refundable to North Dakota customers as of June 30, 2017.
The South Dakota Transmission Cost Recovery Rider Accrued Refund relates to amounts collected for qualifying transmission system facilities and operating costs incurred to serve South Dakota customers that are refundable to South Dakota customers as of June 30, 2017.
If for any reason OTP ceases to meet the criteria for application of guidance under ASC 980 for all or part of its operations, the regulatory assets and liabilities that no longer meet such criteria would be removed from the consolidated balance sheet and included in the consolidated statement of income as an expense or income item in the period in which the application of guidance under ASC 980 ceases.
5. Open Contract Positions Subject to Legally Enforceable Netting Arrangements
OTP has certain derivative contracts that are designated as normal purchases. Individual counterparty exposures for these contracts can be offset according to legally enforceable netting arrangements. The following table shows the current fair value of these forward contract positions subject to legally enforceable netting arrangements as of June 30, 2017 and December 31, 2016:
|
(in thousands) |
June 30, 2017 |
December 31, 2016 |
||||||
|
Open Contract Gain Positions Subject to Legally Enforceable Netting Arrangements |
$ | -- | $ | -- | ||||
|
Open Contract Loss Positions Subject to Legally Enforceable Netting Arrangements |
(13,856 | ) | (17,382 | ) | ||||
|
Net Balance Subject to Legally Enforceable Netting Arrangements |
$ | (13,856 | ) | $ | (17,382 | ) | ||
The following table provides a breakdown of OTP’s credit risk standing on forward energy contracts in marked-to-market loss positions as of June 30, 2017 and December 31, 2016:
|
(in thousands) |
June 30, 2017 |
December 31, 2016 |
||||||
|
Loss Contracts Covered by Deposited Funds or Letters of Credit |
$ | -- | $ | -- | ||||
|
Contracts Requiring Cash Deposits if OTP’s Credit Falls Below Investment Grade1 |
13,856 | 17,382 | ||||||
|
Total Loss Contracts based on Current Market Values |
$ | 13,856 | $ | 17,382 | ||||
|
1Certain OTP derivative energy contracts contain provisions that require an investment grade credit rating from each of the major credit rating agencies on OTP’s debt. If OTP’s debt ratings were to fall below investment grade, the counterparties to these forward energy contracts could request the immediate deposit of cash to cover contracts in net liability positions. |
||||||||
|
Contracts Requiring Cash Deposits if OTP’s Credit Falls Below Investment Grade |
$ | 13,856 | $ | 17,382 | ||||
|
Offsetting Gains with Counterparties under Master Netting Agreements |
-- | -- | ||||||
|
Reporting Date Deposit Requirement if Credit Risk Feature Triggered |
$ | 13,856 | $ | 17,382 | ||||
6. Reconciliation of Common Shareholders’ Equity, Common Shares and Earnings Per Share
Reconciliation of Common Shareholders’ Equity
|
(in thousands) |
Par Value, Common Shares |
Premium on Common Shares |
Retained Earnings |
Accumulated Other Comprehensive Income/(Loss) |
Total Common Equity |
|||||||||||||||
|
Balance, December 31, 2016 |
$ | 196,741 | $ | 337,684 | $ | 139,479 | $ | (3,800 | ) | $ | 670,104 | |||||||||
|
Common Stock Issuances, Net of Expenses |
1,273 | 3,613 | 4,886 | |||||||||||||||||
|
Common Stock Retirements |
(239 | ) | (1,560 | ) | (1,799 | ) | ||||||||||||||
|
Net Income |
36,363 | 36,363 | ||||||||||||||||||
|
Other Comprehensive Income |
214 | 214 | ||||||||||||||||||
|
Employee Stock Incentive Plans Expense |
1,920 | 1,920 | ||||||||||||||||||
|
Common Dividends ($0.64 per share) |
(25,284 | ) | (25,284 | ) | ||||||||||||||||
|
Balance, June 30, 2017 |
$ | 197,775 | $ | 341,657 | $ | 150,558 | $ | (3,586 | ) | $ | 686,404 | |||||||||
Shelf Registration and Common Share Distribution Agreement
The Company’s shelf registration statement filed with the Securities and Exchange Commission on May 11, 2015, under which the Company may offer for sale, from time to time, either separately or together in any combination, equity, debt or other securities described in the shelf registration statement, including common shares of the Company, expires on May 11, 2018. On May 11, 2015, the Company entered into a Distribution Agreement with J.P. Morgan Securities (JPMS) under which it may offer and sell its common shares from time to time in an At-the-Market offering program through JPMS, as its distribution agent, up to an aggregate sales price of $75 million.
Common Shares
Following is a reconciliation of the Company’s common shares outstanding from December 31, 2016 through June 30, 2017:
|
Common Shares Outstanding December 31, 2016 |
39,348,136 | |||
|
Issuances: |
||||
|
Executive Stock Performance Awards (2014 shares earned) |
89,291 | |||
|
Automatic Dividend Reinvestment and Share Purchase Plan: |
||||
|
Dividends Reinvested |
68,235 | |||
|
Cash Invested |
27,348 | |||
|
Vesting of Restricted Stock Units |
21,925 | |||
|
Restricted Stock Issued to Directors |
17,600 | |||
|
Employee Stock Purchase Plan: |
||||
|
Dividends Reinvested |
9,566 | |||
|
Cash Invested |
5,284 | |||
|
Employee Stock Ownership Plan |
14,835 | |||
|
Directors Deferred Compensation |
560 | |||
|
Retirements: |
||||
|
Shares Withheld for Individual Income Tax Requirements |
(47,704 | ) | ||
|
Common Shares Outstanding June 30, 2017 |
39,555,076 |
Earnings Per Share
The numerator used in the calculation of both basic and diluted earnings per common share is net income for the three- and six-month periods ended June 30, 2017 and 2016. The denominator used in the calculation of basic earnings per common share is the weighted average number of common shares outstanding during the period excluding nonvested restricted shares granted to the Company’s directors and employees, which are considered contingently returnable and not outstanding for the purpose of calculating basic earnings per share. The denominator used in the calculation of diluted earnings per common share is derived by adjusting basic shares outstanding for the items listed in the following reconciliation:
|
Three Months ended June 30 |
Six Months ended June 30 |
|||||||||||||||
|
2017 |
2016 |
2017 |
2016 |
|||||||||||||
|
Weighted Average Common Shares Outstanding – Basic |
39,462,865 | 38,179,371 | 39,406,834 | 38,058,157 | ||||||||||||
|
Plus Outstanding Share Awards net of Share Reductions for Unrecognized Stock-Based Compensation Expense and Excess Tax Benefits: |
||||||||||||||||
|
Shares Expected to be Awarded for Stock Performance Awards Granted to Executive Officers based on Measurement Period-to-Date Performance |
173,974 | 91,381 | 187,806 | 69,133 | ||||||||||||
|
Underlying Shares Related to Nonvested Restricted Stock Units Granted to Employees |
50,087 | 39,374 | 53,980 | 39,608 | ||||||||||||
|
Nonvested Restricted Shares |
12,719 | 7,862 | 19,894 | 12,819 | ||||||||||||
|
Shares Expected to be Issued Under the Deferred Compensation Program for Directors |
2,854 | 3,301 | 3,098 | 3,532 | ||||||||||||
|
Total Dilutive Shares |
239,634 | 141,918 | 264,778 | 125,092 | ||||||||||||
|
Weighted Average Common Shares Outstanding – Diluted |
39,702,499 | 38,321,289 | 39,671,612 | 38,183,249 | ||||||||||||
The effect of dilutive shares on earnings per share for the three- and six-month periods ended June 30, 2017 and 2016, resulted in no differences greater than $0.01 between basic and diluted earnings per share in total or from continuing or discontinued operations in either period.
7. Share-Based Payments
Stock Incentive Awards
The following stock incentive awards were granted under the 2014 Stock Incentive Plan during the six-month period ended June 30, 2017:
|
Award |
Grant-Date |
Shares/Units Granted |
Weighted Average Grant-Date Fair Value per Award |
Vesting |
||||||
|
Stock Performance Awards Granted to Executive Officers |
February 2, 2017 |
59,500 | $ | 31.00 |
December 31, 2019 |
|||||
|
Restricted Stock Units Granted to Executive Officers |
February 2, 2017 |
15,900 | $ | 37.65 |
25% per year through February 6, 2021 |
|||||
|
Restricted Stock Units Granted to Key Employees |
April 10, 2017 |
9,995 | $ | 32.78 |
100% on April 8, 2021 |
|||||
|
Restricted Stock Granted to Nonemployee Directors |
April 10, 2017 |
17,600 | $ | 37.75 |
25% per year through April 8, 2021 |
|||||
Under the performance share awards, the aggregate award for performance at target is 59,500 shares. For target performance the participants would earn an aggregate of 39,667 common shares based on the Company’s total shareholder return relative to the total shareholder return of the companies that comprise the Edison Electric Institute Index over the performance measurement period of January 1, 2017 through December 31, 2019, with the beginning and ending share values based on the average closing price of a share of the Company’s common stock for the 20 trading days immediately following January 1, 2017 and the average closing price for the 20 trading days immediately preceding January 1, 2020. The participants would also earn an aggregate of 19,833 common shares for achieving the target set for the Company’s 3-year average adjusted return on equity. Actual payment may range from zero to 150% of the target amount, or up to 89,250 common shares. There are no voting or dividend rights related to the performance shares until common shares, if any, are issued at the end of the performance measurement period. The amount of payment in the event of retirement, resignation for good reason or involuntary termination without cause is to be made at the end of the performance period based on actual performance, subject to proration in certain cases, except that the payment of performance awards granted to certain officers who are parties to Executive Employment Agreements with the Company is to be made at target at the date of any such event. The vesting of these performance awards is accelerated and paid at target in the event of a change in control, disability or death and on retirement at or after age 62 for certain officers who are parties to executive employment agreements with the Company. The terms of these awards are such that the entire award will be classified and accounted for as equity, as required under ASC 718, and recognized over the grantee’s requisite service period based on the grant-date fair value of the award.
The vesting of restricted stock units is accelerated in the event of a change in control, disability, death or retirement, subject to proration in certain cases. All restricted stock units granted to executive officers are eligible to receive dividend equivalent payments on all unvested awards over the awards respective vesting periods, subject to forfeiture under the terms of the restricted stock unit award agreements. The grant-date fair value of each restricted stock unit granted to an executive officer was the average of the high and low market price of one share of the Company’s common stock on the date of grant. The grant-date fair value of each restricted stock unit granted to a key employee that is not an executive officer was based on the average of the high and low market price of one share of the Company’s common stock on the date of grant, discounted for the value of the dividend exclusion on those restricted stock units over the four-year vesting period.
The restricted shares granted to the Company’s nonemployee directors are eligible for full dividend and voting rights. Restricted shares not vested and dividends on those restricted shares are subject to forfeiture under the terms of the restricted stock award agreements. The grant-date fair value of each restricted share was the average of the high and low market price of one share of the Company’s common stock on the date of grant.
The end of the period over which compensation expense is recognized for the above share-based awards for the individual grantees is the shorter of the indicated vesting period for the respective awards or the date the grantee becomes eligible for retirement as defined in their award agreement.
As of June 30, 2017 the remaining unrecognized compensation expense related to outstanding, unvested stock-based compensation was approximately $5.5 million (before income taxes) which will be amortized over a weighted-average period of 2.4 years.
Amounts of compensation expense recognized under the Company’s six stock-based payment programs for the three- and six-month periods ended June 30, 2017 and 2016 are presented in the table below:
|
Three Months Ended June 30, |
Six Months Ended June 30, |
|||||||||||||||
|
(in thousands) |
2017 |
2016 |
2017 |
2016 |
||||||||||||
|
Stock Performance Awards Granted to Executive Officers |
$ | 425 | $ | 304 | $ | 1,074 | $ | 841 | ||||||||
|
Restricted Stock Units Granted to Executive Officers |
104 | 64 | 368 | 309 | ||||||||||||
|
Restricted Stock Granted to Executive Officers |
16 | 22 | 38 | 51 | ||||||||||||
|
Restricted Stock Granted to Nonemployee Directors |
144 | 128 | 272 | 235 | ||||||||||||
|
Restricted Stock Units Granted to Key Employees |
81 | 81 | 168 | 145 | ||||||||||||
|
Employee Stock Purchase Plan (15% discount) |
-- | 44 | -- | 88 | ||||||||||||
|
Totals |
$ | 770 | $ | 643 | $ | 1,920 | $ | 1,669 | ||||||||
8. Retained Earnings Restriction
The Company is a holding company with no significant operations of its own. The primary source of funds for payments of dividends to the Company’s shareholders is from dividends paid or distributions made by the Company’s subsidiaries. As a result of certain statutory limitations or regulatory or financing agreements, restrictions could occur on the amount of distributions allowed to be made by the Company’s subsidiaries.
Both the Company and OTP debt agreements contain restrictions on the payment of cash dividends upon a default or event of default. An event of default would be considered to have occurred if the Company did not meet certain financial covenants. As of June 30, 2017 the Company was in compliance with these financial covenants. See note 10 to the Company’s consolidated financial statements on Form 10-K for the year ended December 31, 2016 for further information on the covenants.
Under the Federal Power Act, a public utility may not pay dividends from any funds properly included in a capital account. What constitutes “funds properly included in a capital account” is undefined in the Federal Power Act or the related regulations; however, the FERC has consistently interpreted the provision to allow dividends to be paid as long as (1) the source of the dividends is clearly disclosed, (2) the dividend is not excessive and (3) there is no self-dealing on the part of corporate officials.
The MPUC indirectly limits the amount of dividends OTP can pay to the Company by requiring an equity-to-total-capitalization ratio between 47.5% and 58.1% based on OTP’s 2016 capital structure petition approved by order of the MPUC on August 2, 2016. As of June 30, 2017 OTP’s equity-to-total-capitalization ratio including short-term debt was 52.4% and its net assets restricted from distribution totaled approximately $452,000,000. Total capitalization for OTP cannot currently exceed $1,123,168,000. On May 1, 2017 OTP requested an equity-to-total capitalization ratio between 47.4% and 58.0% in its 2017 capital structure filing currently pending before MPUC. If approved, total capitalization for OTP will not be allowed to exceed $1,178,024,000.
9. Commitments and Contingencies
Construction and Other Purchase Commitments
At December 31, 2016 OTP had commitments under contracts extending into 2019, including its share of construction program commitments, totaling approximately $84.8 million. At June 30, 2017 OTP had commitments under contracts extending into 2019, including its share of construction program commitments, totaling approximately $71.7 million.
Electric Utility Capacity and Energy Requirements and Coal and Delivery Contracts
OTP has commitments for the purchase of capacity and energy requirements under agreements extending into 2040. OTP has contracts providing for the purchase and delivery of a significant portion of its current coal requirements. OTP’s current coal purchase agreements for Big Stone Plant and Coyote Station expire at the end of 2019 and 2040, respectively. In the first quarter of 2017 a portion of the coal supply for Big Stone Plant contracted for delivery in 2016 was rolled into 2018 when Big Stone Plant entered into an agreement to purchase additional tons for 2019. These arrangements result in an additional commitment for the purchase of coal in 2018 and 2019 totaling approximately $3.0 million. OTP has an agreement with Cloud Peak Energy Resources LLC for the purchase of subbituminous coal for Hoot Lake Plant for the period of January 1, 2016 through December 31, 2023. OTP has no fixed minimum purchase requirements under the agreement, but all of Hoot Lake Plant’s coal requirements for the period covered must be purchased under this agreement.
Operating Leases
OTP has obligations to make future operating lease payments primarily related to land leases and coal rail-car leases. The Company’s nonelectric companies have obligations to make future operating lease payments primarily related to leases of buildings and manufacturing equipment.
Contingencies
OTP had a $2.7 million refund liability on its balance sheet as of December 31, 2016 representing its best estimate of the refund obligations that would arise, net of amounts that would be subject to recovery under state jurisdictional TCR riders, based on the likelihood of FERC reducing the ROE component of the MISO Tariff and ordering MISO to refund amounts charged in excess of the lower rate. In the February and June 2017 MISO billings, MISO processed the refund of the FERC-ordered reduction in the MISO tariff allowed ROE for the first 15-month refund period. The refund, in combination with a decision in the 2016 Minnesota general rate case that affected the Minnesota TCR rider, resulted in a reduction in OTP’s accrued MISO tariff ROE refund liability from $2.7 million as of December 31, 2016 to $1.6 million as of June 30, 2017.
Together with as many as 200 utilities, generators and power marketers, OTP participated in proceedings before the FERC regarding the calculation, assessment and implementation of MISO Revenue Sufficiency Guarantee (RSG) charges for entities participating in the MISO wholesale energy market since that market’s start on April 1, 2005 until the conclusion of the proceedings on May 2, 2015. The proceedings fundamentally concerned MISO’s application of its MISO RSG rate on file with the FERC to market participants, revisions to the RSG rate based on several FERC orders, and the FERC’s decision to resettle the markets based on MISO application of the RSG rate to market participants. Several of the FERC’s orders are on review in a set of consolidated cases before the Court of Appeals for the District of Columbia (the “ D.C. Circuit”). The consolidated petitions at the D.C. Circuit involve multiple petitioners and intervenors. OTP is an intervenor in these cases. The D.C. Circuit has set a briefing schedule with final briefs due in January 2018. The scope of the issues that will be subject to review at the D.C. Circuit has not yet been finalized. MISO has not made available past billing or resettlement data necessary for determining amounts that might be payable if the FERC’s decisions are reversed. Therefore, the Company cannot estimate OTP’s exposure at this time from a final order reversing the relevant FERC orders, which could have a material adverse effect on the Company’s results of operations.
Contingencies, by their nature, relate to uncertainties that require the Company’s management to exercise judgment both in assessing the likelihood a liability has been incurred as well as in estimating the amount of potential loss. The most significant contingencies impacting the Company’s consolidated financial statements are those related to environmental remediation, risks associated with indemnification obligations under divestitures of discontinued operations and litigation matters. Should all of these known items result in liabilities being incurred, the loss could be as high as $1.0 million, excluding any liability for RSG charges for which an estimate cannot be made at this time.
In 2014 the Environmental Protection Agency (EPA) published both proposed standards of performance for carbon dioxide (CO2) emissions from new, reconstructed and modified fossil fuel-fired power plants (New Source Performance Standards), and proposed CO2 emission guidelines for existing fossil fuel-fired power plants (the Clean Power Plan) under section 111 of the Clean Air Act. The EPA published final rules for each of these proposals on October 23, 2015. Both rules were challenged on legal grounds. On February 9, 2016 the U.S. Supreme Court granted a stay of the Clean Power Plan, pending disposition of petitions for review in the D.C. Circuit. The D.C. Circuit heard oral argument on challenges to the Clean Power Plan on September 27, 2016 before the full court, and a decision was expected in the first half of 2017. However, pursuant to Executive Order 13783, Promoting Energy Independence and Economic Growth, the EPA was directed to consider suspending, revising or rescinding the CO2 rules discussed above. Thereafter, the EPA issued notices in the Federal Register of its intent to review these rules pursuant to the Executive Order, and it filed motions to stay the pending litigation. The D.C. Circuit subsequently issued orders holding in abeyance the appeals of both the New Source Performance Standards and the Clean Power Plan, pending EPA review. Therefore, there is uncertainty regarding the future of both rules.
Other
The Company is a party to litigation and regulatory enforcement matters arising in the normal course of business. The Company regularly analyzes current information and, as necessary, provides accruals for liabilities that are probable of occurring and that can be reasonably estimated. The Company believes the effect on its consolidated results of operations, financial position and cash flows, if any, for the disposition of all matters pending as of June 30, 2017 will not be material.
10. Short-Term and Long-Term Borrowings
The following table presents the status of our lines of credit as of June 30, 2017 and December 31, 2016:
|
(in thousands) |
Line Limit |
In Use on June 30, 2017 |
Restricted due to Outstanding Letters of Credit |
Available on June 30, 2017 |
Available on December 31, 2016 |
|||||||||||||||
|
Otter Tail Corporation Credit Agreement |
$ | 130,000 | $ | 117 | $ | -- | $ | 129,883 | $ | 130,000 | ||||||||||
|
OTP Credit Agreement |
170,000 | 58,000 | 300 | 111,700 | 127,067 | |||||||||||||||
|
Total |
$ | 300,000 | $ | 58,117 | $ | 300 | $ | 241,583 | $ | 257,067 | ||||||||||
Debt Retirements
On February 5, 2016 the Company borrowed $50 million under a Term Loan Agreement at an interest rate based on the 30 day LIBOR plus 90 basis points. The Company repaid $35.0 million of the $50 million in the fourth quarter of 2016 and made additional repayments of $3.0 million in January 2017, $3.0 million in June 2017 and $9.0 million on August 7, 2017. As of August 9, 2017 the Company had no borrowings under the Term Loan Agreement.
The following tables provide a breakdown of the assignment of the Company’s consolidated short-term and long-term debt outstanding as of June 30, 2017 and December 31, 2016:
|
June 30, 2017 (in thousands) |
OTP |
Otter Tail Corporation |
Otter Tail Corporation Consolidated |
|||||||||
|
Short-Term Debt |
$ | 58,000 | $ | 117 | $ | 58,117 | ||||||
|
Long-Term Debt: |
||||||||||||
|
Term Loan, LIBOR plus 0.90%, due February 5, 2018 |
$ | 9,000 | $ | 9,000 | ||||||||
|
3.55% Guaranteed Senior Notes, due December 15, 2026 |
80,000 | 80,000 | ||||||||||
|
Senior Unsecured Notes 5.95%, Series A, due August 20, 2017 |
$ | 33,000 | 33,000 | |||||||||
|
Senior Unsecured Notes 4.63%, due December 1, 2021 |
140,000 | 140,000 | ||||||||||
|
Senior Unsecured Notes 6.15%, Series B, due August 20, 2022 |
30,000 | 30,000 | ||||||||||
|
Senior Unsecured Notes 6.37%, Series C, due August 20, 2027 |
42,000 | 42,000 | ||||||||||
|
Senior Unsecured Notes 4.68%, Series A, due February 27, 2029 |
60,000 | 60,000 | ||||||||||
|
Senior Unsecured Notes 6.47%, Series D, due August 20, 2037 |
50,000 | 50,000 | ||||||||||
|
Senior Unsecured Notes 5.47%, Series B, due February 27, 2044 |
90,000 | 90,000 | ||||||||||
|
North Dakota Development Note, 3.95%, due April 1, 2018 |
67 | 67 | ||||||||||
|
Partnership in Assisting Community Expansion (PACE) Note, 2.54%, due March 18, 2021 |
761 | 761 | ||||||||||
|
Total |
$ | 445,000 | $ | 89,828 | $ | 534,828 | ||||||
|
Less: Current Maturities net of Unamortized Debt Issuance Costs |
32,993 | 9,207 | 42,200 | |||||||||
|
Unamortized Long-Term Debt Issuance Costs |
1,742 | 500 | 2,242 | |||||||||
|
Total Long-Term Debt net of Unamortized Debt Issuance Costs |
$ | 410,265 | $ | 80,121 | $ | 490,386 | ||||||
|
Total Short-Term and Long-Term Debt (with current maturities) |
$ | 501,258 | $ | 89,445 | $ | 590,703 | ||||||
|
December 31, 2016 (in thousands) |
OTP |
Otter Tail Corporation |
Otter Tail Corporation Consolidated |
|||||||||
|
Short-Term Debt |
$ | 42,883 | $ | -- | $ | 42,883 | ||||||
|
Long-Term Debt: |
||||||||||||
|
Term Loan, LIBOR plus 0.90%, due February 5, 2018 |
$ | 15,000 | $ | 15,000 | ||||||||
|
3.55% Guaranteed Senior Notes, due December 15, 2026 |
80,000 | 80,000 | ||||||||||
|
Senior Unsecured Notes 5.95%, Series A, due August 20, 2017 |
$ | 33,000 | 33,000 | |||||||||
|
Senior Unsecured Notes 4.63%, due December 1, 2021 |
140,000 | 140,000 | ||||||||||
|
Senior Unsecured Notes 6.15%, Series B, due August 20, 2022 |
30,000 | 30,000 | ||||||||||
|
Senior Unsecured Notes 6.37%, Series C, due August 20, 2027 |
42,000 | 42,000 | ||||||||||
|
Senior Unsecured Notes 4.68%, Series A, due February 27, 2029 |
60,000 | 60,000 | ||||||||||
|
Senior Unsecured Notes 6.47%, Series D, due August 20, 2037 |
50,000 | 50,000 | ||||||||||
|
Senior Unsecured Notes 5.47%, Series B, due February 27, 2044 |
90,000 | 90,000 | ||||||||||
|
North Dakota Development Note, 3.95%, due April 1, 2018 |
106 | 106 | ||||||||||
|
PACE Note, 2.54%, due March 18, 2021 |
836 | 836 | ||||||||||
|
Total |
$ | 445,000 | $ | 95,942 | $ | 540,942 | ||||||
|
Less: Current Maturities net of Unamortized Debt Issuance Costs |
32,970 | 231 | 33,201 | |||||||||
|
Unamortized Long-Term Debt Issuance Costs |
1,861 | 539 | 2,400 | |||||||||
|
Total Long-Term Debt net of Unamortized Debt Issuance Costs |
$ | 410,169 | $ | 95,172 | $ | 505,341 | ||||||
|
Total Short-Term and Long-Term Debt (with current maturities) |
$ | 486,022 | $ | 95,403 | $ | 581,425 | ||||||
11. Pension Plan and Other Postretirement Benefits
Pension Plan—Components of net periodic pension benefit cost of the Company's noncontributory funded pension plan are as follows:
|
Three Months Ended June 30, |
Six Months Ended June 30, |
|||||||||||||||
|
(in thousands) |
2017 |
2016 |
2017 |
2016 |
||||||||||||
|
Service Cost—Benefit Earned During the Period |
$ | 1,407 | $ | 1,381 | $ | 2,814 | $ | 2,763 | ||||||||
|
Interest Cost on Projected Benefit Obligation |
3,536 | 3,521 | 7,070 | 7,043 | ||||||||||||
|
Expected Return on Assets |
(4,807 | ) | (4,866 | ) | (9,614 | ) | (9,733 | ) | ||||||||
|
Amortization of Prior-Service Cost: |
||||||||||||||||
|
From Regulatory Asset |
29 | 47 | 59 | 94 | ||||||||||||
|
From Other Comprehensive Income1 |
1 | 1 | 2 | 2 | ||||||||||||
|
Amortization of Net Actuarial Loss: |
||||||||||||||||
|
From Regulatory Asset |
1,272 | 1,227 | 2,545 | 2,454 | ||||||||||||
|
From Other Comprehensive Income1 |
32 | 32 | 63 | 63 | ||||||||||||
|
Net Periodic Pension Cost |
$ | 1,470 | $ | 1,343 | $ | 2,939 | $ | 2,686 | ||||||||
|
1Corporate cost included in Other Nonelectric Expenses. |
Cash flows—The Company currently is not required and does not anticipate making a contribution to its pension plan in 2017. The Company made a discretionary plan contribution totaling $10.0 million in January 2016.
Executive Survivor and Supplemental Retirement Plan—Components of net periodic pension benefit cost of the Company’s unfunded, nonqualified benefit plan for executive officers and certain key management employees are as follows:
|
Three Months Ended June 30, |
Six Months Ended June 30, |
|||||||||||||||
|
(in thousands) |
2017 |
2016 |
2017 |
2016 |
||||||||||||
|
Service Cost—Benefit Earned During the Period |
$ | 72 | $ | 63 | $ | 145 | $ | 126 | ||||||||
|
Interest Cost on Projected Benefit Obligation |
421 | 417 | 843 | 834 | ||||||||||||
|
Amortization of Prior-Service Cost: |
||||||||||||||||
|
From Regulatory Asset |
4 | 4 | 8 | 8 | ||||||||||||
|
From Other Comprehensive Income1 |
10 | 10 | 19 | 19 | ||||||||||||
|
Amortization of Net Actuarial Loss: |
||||||||||||||||
|
From Regulatory Asset |
72 | 73 | 143 | 146 | ||||||||||||
|
From Other Comprehensive Income2 |
110 | 111 | 220 | 223 | ||||||||||||
|
Net Periodic Pension Cost |
$ | 689 | $ | 678 | $ | 1,378 | $ | 1,356 | ||||||||
|
1Amortization of Prior Service Costs from Other Comprehensive Income Charged to: |
||||||||||||||||
|
Electric Operation and Maintenance Expenses |
$ | 4 | $ | 4 | $ | 8 | $ | 8 | ||||||||
|
Other Nonelectric Expenses |
6 | 6 | 11 | 11 | ||||||||||||
|
2Amortization of Net Actuarial Loss from Other Comprehensive Income Charged to: |
||||||||||||||||
|
Electric Operation and Maintenance Expenses |
$ | 66 | $ | 68 | $ | 132 | $ | 136 | ||||||||
|
Other Nonelectric Expenses |
44 | 43 | 88 | 87 | ||||||||||||
Postretirement Benefits—Components of net periodic postretirement benefit cost for health insurance and life insurance benefits for retired OTP and corporate employees, net of the effect of Medicare Part D Subsidy:
|
Three Months Ended June 30, |
Six Months Ended June 30, |
|||||||||||||||
|
(in thousands) |
2017 |
2016 |
2017 |
2016 |
||||||||||||
|
Service Cost—Benefit Earned During the Period |
$ | 356 | $ | 305 | $ | 712 | $ | 611 | ||||||||
|
Interest Cost on Projected Benefit Obligation |
678 | 542 | 1,356 | 1,083 | ||||||||||||
|
Amortization of Prior-Service Cost: |
||||||||||||||||
|
From Regulatory Asset |
-- | 33 | -- | 66 | ||||||||||||
|
From Other Comprehensive Income1 |
-- | 1 | -- | 2 | ||||||||||||
|
Amortization of Net Actuarial Loss: |
||||||||||||||||
|
From Regulatory Asset |
233 | -- | 466 | -- | ||||||||||||
|
From Other Comprehensive Income1 |
6 | -- | 12 | -- | ||||||||||||
|
Net Periodic Postretirement Benefit Cost |
$ | 1,273 | $ | 881 | $ | 2,546 | $ | 1,762 | ||||||||
|
Effect of Medicare Part D Subsidy |
$ | (140 | ) | $ | (258 | ) | $ | (280 | ) | $ | (515 | ) | ||||
|
1Corporate cost included in Other Nonelectric Expenses. |
||||||||||||||||
12. Fair Value of Financial Instruments
The following methods and assumptions were used to estimate the fair value of each class of financial instruments for which it is practicable to estimate that value:
Short-Term Debt—The carrying amount approximates fair value because the debt obligations are short-term and the balances outstanding as of June 30, 2017 and December 31, 2016 related to the Otter Tail Corporation Credit Agreement and the OTP Credit Agreement were subject to variable interest rates of LIBOR plus 1.75% and LIBOR plus 1.25%, respectively, which approximate market rates.
Long-Term Debt including Current Maturities—The fair value of the Company's and OTP’s long-term debt is estimated based on the current market indications of rates available to the Company for the issuance of debt. The Company’s long-term debt subject to variable interest rates approximates fair value. The fair value measurements of the Company’s long-term debt issues fall into level 2 of the fair value hierarchy set forth in ASC 820.
|
June 30, 2017 |
December 31, 2016 |
|||||||||||||||
|
(in thousands) |
Carrying Amount |
Fair Value |
Carrying Amount |
Fair Value |
||||||||||||
|
Short-Term Debt |
(58,117 | ) | (58,117 | ) | (42,883 | ) | (42,883 | ) | ||||||||
|
Long-Term Debt including Current Maturities |
(532,586 | ) | (588,251 | ) | (538,542 | ) | (583,835 | ) | ||||||||
14. Income Tax Expense – Continuing Operations
The following table provides a reconciliation of income tax expense calculated at the net composite federal and state statutory rate on income from continuing operations before income taxes and income tax expense for continuing operations reported on the Company’s consolidated statements of income:
|
Three Months Ended June 30, |
Six Months Ended June 30, |
|||||||||||||||
|
(in thousands) |
2017 |
2016 |
2017 |
2016 |
||||||||||||
|
Income Before Income Taxes – Continuing Operations |
$ | 22,614 | $ | 20,639 | $ | 48,506 | $ | 40,621 | ||||||||
|
Tax Computed at Company’s Net Composite Federal and State Statutory Rate (39%) |
8,819 | 8,049 | 18,917 | 15,842 | ||||||||||||
|
Increases (Decreases) in Tax from: |
||||||||||||||||
|
Federal Production Tax Credits |
(2,010 | ) | (1,885 | ) | (4,062 | ) | (3,571 | ) | ||||||||
|
Excess Tax Deduction – 2014 Performance Share Awards |
-- | -- | (697 | ) | -- | |||||||||||
|
Section 199 Domestic Production Activities Deduction |
(330 | ) | (94 | ) | (660 | ) | (198 | ) | ||||||||
|
Corporate-Owned Life Insurance |
(207 | ) | (480 | ) | (501 | ) | (572 | ) | ||||||||
|
North Dakota Wind Tax Credit Amortization – Net of Federal Taxes |
(213 | ) | (213 | ) | (425 | ) | (425 | ) | ||||||||
|
Employee Stock Ownership Plan Dividend Deduction |
(173 | ) | (157 | ) | (345 | ) | (315 | ) | ||||||||
|
Other Items – Net |
11 | (137 | ) | 33 | (186 | ) | ||||||||||
|
Income Tax Expense – Continuing Operations |
$ | 5,897 | $ | 5,083 | $ | 12,260 | $ | 10,575 | ||||||||
|
Effective Income Tax Rate – Continuing Operations |
26.1 | % | 24.6 | % | 25.3 | % | 26.0 | % | ||||||||
The following table summarizes the activity related to our unrecognized tax benefits:
|
(in thousands) |
2017 |
2016 |
||||||
|
Balance on January 1 |
$ | 891 | $ | 468 | ||||
|
Increases Related to Tax Positions for Prior Years |
-- | -- | ||||||
|
Increases Related to Tax Positions for Current Year |
147 | 26 | ||||||
|
Uncertain Positions Resolved During Year |
-- | -- | ||||||
|
Balance on June 30 |
$ | 1,038 | $ | 494 | ||||
The balance of unrecognized tax benefits as of June 30, 2017 would reduce the Company’s effective tax rate if recognized. The total amount of unrecognized tax benefits as of June 30, 2017 is not expected to change significantly within the next
12 months. The Company classifies interest and penalties on tax uncertainties as components of the provision for income taxes in its consolidated statement of income. There was no amount accrued for interest on tax uncertainties as of June 30, 2017.
The Company and its subsidiaries file a consolidated U.S. federal income tax return and various state income tax returns. As of June 30, 2017, with limited exceptions, the Company is no longer subject to examinations by taxing authorities for tax years prior to 2013 for federal and Minnesota and North Dakota state income taxes.
16. Discontinued Operations
Included in discontinued operations are activities related to the Company’s former wind tower manufacturing business and dock and boatlift company. Included in liabilities of discontinued operations are warranty reserves. Details regarding the warranty reserves follow:
|
(in thousands) |
2017 |
2016 |
||||||
|
Warranty Reserve Balance, January 1 |
$ | 1,369 | $ | 2,103 | ||||
|
Additional Provision for Warranties Made During the Year |
-- | -- | ||||||
|
Settlements Made During the Year |
(51 | ) | -- | |||||
|
Decrease in Warranty Estimates for Prior Years |
(200 | ) | (230 | ) | ||||
|
Warranty Reserve Balance, June 30 |
$ | 1,118 | $ | 1,873 | ||||
The warranty reserve balances as of June 30, 2017 relate to products produced by the Company’s former wind tower and dock and boatlift manufacturing companies. Certain products sold by the companies carried one to fifteen year warranties. Although the assets of these companies have been sold and their operating results are reported under discontinued operations in the Company’s consolidated statements of income, the Company retains responsibility for warranty claims related to the products they produced prior to the sales of these companies.
Expenses associated with remediation activities of these companies could be substantial. For wind towers, the potential exists for multiple claims based on one defect repeated throughout the production process or for claims where the cost to repair or replace the defective part is highly disproportionate to the original cost of the part. For example, if the Company is required to cover remediation expenses in addition to regular warranty coverage, the Company could be required to accrue additional expenses and experience additional unplanned cash expenditures which could adversely affect the Company’s consolidated net income and financial condition.
Item 2. Management's Discussion and Analysis of Financial Condition and Results of Operations
Results of Operations
Following is an analysis of the operating results of Otter Tail Corporation (the Company, we, us and our) by business segment for the three and six months ended June 30, 2017 and 2016, followed by a discussion of changes in our consolidated financial position during the six months ended June 30, 2017 and our business outlook for the remainder of 2017.
Comparison of the Three Months Ended June 30, 2017 and 2016
Consolidated operating revenues were $212.1 million for the three months ended June 30, 2017 compared with $203.5 million for the three months ended June 30, 2016. Operating income was $29.6 million for the three months ended June 30, 2017 compared with $27.1 million for the three months ended June 30, 2016. The Company recorded diluted earnings per share from continuing operations of $0.42 for the three months ended June 30, 2017 compared with $0.41 for the three months ended June 30, 2016, and total diluted earnings per share of $0.42 for the three months ended June 30, 2017 compared with $0.41 for the three months ended June 30, 2016.
Amounts presented in the segment tables that follow for operating revenues, cost of products sold and other nonelectric operating expenses for the three month periods ended June 30, 2017 and 2016 will not agree with amounts presented in the consolidated statements of income due to the elimination of intersegment transactions. The amounts of intersegment eliminations by income statement line item are listed below:
|
Intersegment Eliminations (in thousands) |
June 30, 2017 |
June 30, 2016 |
||||||
|
Operating Revenues: |
||||||||
|
Electric |
$ | 5 | $ | 7 | ||||
|
Nonelectric |
-- | -- | ||||||
|
Costs of Products Sold |
2 | -- | ||||||
|
Other Nonelectric Expenses |
3 | 7 | ||||||
Electric
|
Three Months Ended |
||||||||||||||||
|
June 30, |
% |
|||||||||||||||
|
(in thousands) |
2017 |
2016 |
Change |
Change |
||||||||||||
|
Retail Sales Revenues |
$ | 86,255 | $ | 85,985 | $ | 270 | 0.3 | |||||||||
|
Wholesale Revenues – Company Generation |
1,184 | 859 | 325 | 37.8 | ||||||||||||
|
Other Revenues |
14,797 | 11,081 | 3,716 | 33.5 | ||||||||||||
|
Total Operating Revenues |
$ | 102,236 | $ | 97,925 | $ | 4,311 | 4.4 | |||||||||
|
Production Fuel |
12,477 | 9,990 | 2,487 | 24.9 | ||||||||||||
|
Purchased Power – System Use |
16,376 | 15,127 | 1,249 | 8.3 | ||||||||||||
|
Other Operation and Maintenance Expenses |
37,850 | 38,981 | (1,131 | ) | (2.9 | ) | ||||||||||
|
Depreciation and Amortization |
13,094 | 13,432 | (338 | ) | (2.5 | ) | ||||||||||
|
Property Taxes |
3,709 | 3,589 | 120 | 3.3 | ||||||||||||
|
Operating Income |
$ | 18,730 | $ | 16,806 | $ | 1,924 | 11.4 | |||||||||
|
Electric kilowatt-hour (kwh) Sales (in thousands) |
||||||||||||||||
|
Retail kwh Sales |
1,073,689 | 1,048,718 | 24,971 | 2.4 | ||||||||||||
|
Wholesale kwh Sales – Company Generation |
45,308 | 37,163 | 8,145 | 21.9 | ||||||||||||
|
Heating Degree Days |
420 | 455 | (35 | ) | (7.7 | ) | ||||||||||
|
Cooling Degree Days |
96 | 133 | (37 | ) | (27.8 | ) | ||||||||||
The following table shows heating and cooling degree days as a percent of normal:
|
Three Months ended June 30, |
||||||||
|
2017 |
2016 |
|||||||
|
Heating Degree Days |
80.9 | % | 87.7 | % | ||||
|
Cooling Degree Days |
90.6 | % | 125.5 | % | ||||
The following table summarizes the estimated effect on diluted earnings per share of the difference in retail kwh sales under actual weather conditions and expected retail kwh sales under normal weather conditions in the second quarters of 2017 and 2016 and between the quarters:
|
Three Months ended June 30, |
||||||||||||
|
2017 vs Normal |
2016 vs Normal |
2017 vs 2016 |
||||||||||
|
Effect on Diluted Earnings Per Share |
$ | ( 0.01 | ) | $ | 0.00 | $ | ( 0.01 | ) | ||||
The $0.3 million increase in retail electric revenue includes:
|
● |
A $3.4 million increase in retail revenue related to the recovery of increased fuel and purchased power costs due to an increase in the price per kwh purchased and an increase in fuel costs per kwh generated to serve retail customers. |
|
● |
A $0.9 million increase in revenue due to increased kwh sales to commercial and industrial customers. |
offset by:
|
● |
A $1.5 million net decrease in retail revenue, primarily due to an increase in the interim rate refund accrual in the second quarter of 2017 related to the final order in Otter Tail Power Company’s (OTP’s) 2016 Minnesota general rate case. |
|
● |
A $0.8 million decrease in Environmental Costs Recovery (ECR) rider revenue mainly due to a reduction in the unrecovered balance of environmental upgrades due to depreciation. |
|
● |
A $0.6 million negative price variance related to increased sales of electricity to customers with lower rate tariffs. |
|
● |
A $0.6 million decrease in Transmission Cost Recovery (TCR) rider revenue due to a reduction in transmission services and costs from another regional transmission provider. |
|
● |
A $0.4 million decrease in revenue related to decreased consumption due to milder weather in the second quarter of 2017, evidenced by a 7.7% decrease in heating degree days and a 27.8% decrease in cooling degree days between the quarters. |
|
● |
A $0.1 million decrease in North Dakota Renewable Resource Adjustment (NDRRA) rider revenue mainly due to an increase in Production Tax Credits (PTCs) that reduces rider revenue requirements. |
Other electric revenues increased $3.7 million, primarily due to a $3.3 million increase in Midcontinent Independent System Operator, Inc. (MISO) transmission tariff revenues related to increased investment in regional transmission lines.
Production fuel costs increased $2.5 million as a result of a 23.5% increase in kwhs generated combined with a 1.1% increase in the cost of fuel per kwh generated from our steam-powered and combustion turbine generators. The increase in generation was mainly at Coyote Station, which was down for maintenance for eight weeks of the second quarter of 2016 but fully operational during the second quarter of 2017.
The cost of purchased power to serve retail customers increased $1.2 million, despite an 11.2% decrease in kwh purchases, as a result of a 21.9% increase in the cost per kwh purchased due higher market prices and increased prices for energy purchases under a long-term contract.
The $1.1 million decrease in other electric operation and maintenance expenses includes:
|
● |
A $1.2 million reduction in external service costs mostly due to a decrease in costs related to a maintenance shutdown at Coyote Station in April and May of 2016 in conjunction with the Coyote Creek Coal Mine tie-in project. |
|
● |
A $0.6 million decrease in Southwest Power Pool and MISO transmission service charges, with the MISO decrease mainly related to a decrease in the return on equity component of the MISO tariff from 12.38% to 10.82%. |
offset by:
|
● |
A $0.3 million increase in labor costs mainly related to work required to respond to storm outages. |
|
● |
A $0.3 million increase in filing expenses related to the 2016 Minnesota general rate case. |
Depreciation and amortization expense decreased $0.3 million as a result of extending the depreciable lives of certain assets and other assets reaching the end of their depreciable lives in 2016.
Manufacturing
|
Three Months Ended |
||||||||||||||||
|
June 30, |
% |
|||||||||||||||
|
(in thousands) |
2017 |
2016 |
Change |
Change |
||||||||||||
|
Operating Revenues |
$ | 59,304 | $ | 58,452 | $ | 852 | 1.5 | |||||||||
|
Cost of Products Sold |
44,735 | 43,258 | 1,477 | 3.4 | ||||||||||||
|
Operating Expenses |
5,646 | 5,261 | 385 | 7.3 | ||||||||||||
|
Depreciation and Amortization |
3,874 | 4,128 | (254 | ) | (6.2 | ) | ||||||||||
|
Operating Income |
$ | 5,049 | $ | 5,805 | $ | (756 | ) | (13.0 | ) | |||||||
The $0.9 million increase in revenues in our Manufacturing segment includes the following:
|
● |
Revenues at BTD Manufacturing, Inc. (BTD), our custom metal fabricator, increased $0.2 million as a result of a $0.5 million increase in scrap revenue mainly due to higher scrap metal prices and a $0.2 million increase in revenue from parts sales, offset by a $0.5 million reduction in tooling revenue. |
|
● |
Revenues at T.O. Plastics, Inc. (T.O. Plastics), our manufacturer of thermoformed plastic and horticultural products, increased $0.6 million with increases in all end markets served. |
The $1.5 million increase in cost of products sold in our Manufacturing segment includes the following:
|
● |
Cost of products sold at BTD increased $1.5 million due to increased costs for scrapped parts and obsolete inventory, unfavorable product mix in our Minnesota and Illinois plants compared to the second quarter of 2016 and higher sales volume. The increase in cost of products sold resulted in lower operating margins in the second quarter of 2017 compared with the second quarter of 2016. |
|
● |
Costs of products sold at T.O. Plastics remained flat quarter over quarter as a result of lower material costs in the second quarter of 2017. |
At BTD, operating expenses increased $0.2 million as a result of increases in contracted services expenses. T.O. Plastics operating expenses increased $0.2 million, mainly as a result of increases in accrued incentive and other compensation expenses.
Depreciation and amortization expense decreased $0.2 million at BTD and $0.1 million at T.O. Plastics as a result of certain assets becoming fully amortized and other assets reaching the ends of their depreciable lives.
Plastics
|
Three Months Ended |
||||||||||||||||
|
June 30, |
% |
|||||||||||||||
|
(in thousands) |
2017 |
2016 |
Change |
Change |
||||||||||||
|
Operating Revenues |
$ | 50,551 | $ | 47,112 | $ | 3,439 | 7.3 | |||||||||
|
Cost of Products Sold |
39,280 | 37,691 | 1,589 | 4.2 | ||||||||||||
|
Operating Expenses |
2,705 | 2,464 | 241 | 9.8 | ||||||||||||
|
Depreciation and Amortization |
931 | 952 | (21 | ) | (2.2 | ) | ||||||||||
|
Operating Income |
$ | 7,635 | $ | 6,005 | $ | 1,630 | 27.1 | |||||||||
Plastics segment revenues increased $3.4 million despite a 1.9% decrease in pounds of polyvinyl chloride (PVC) pipe sold as a result of a 9.4% increase in PVC pipe prices between the quarters. The increase in revenue more than offset a $1.6 million increase in cost of products sold, which was primarily due to a 6.3% increase in the cost per pound of PVC pipe sold.
Corporate
Corporate includes items such as corporate staff and overhead costs, the results of our captive insurance company and other items excluded from the measurement of operating segment performance. Corporate is not an operating segment. Rather it is added to operating segment totals to reconcile to totals on our consolidated statements of income.
|
Three Months Ended |
||||||||||||||||
|
June 30, |
% |
|||||||||||||||
|
(in thousands) |
2017 |
2016 |
Change |
Change |
||||||||||||
|
Operating Expenses |
$ | 1,816 | $ | 1,520 | $ | 296 | 19.5 | |||||||||
|
Depreciation and Amortization |
9 | 13 | (4 | ) | (30.8 | ) | ||||||||||
Corporate operating expenses increased $0.3 million, mainly as a result of increases in employee benefit costs.
Interest Charges
The $0.4 million decrease in interest charges in the three months ended June 30, 2017 compared with the three months ended June 30, 2016 is related to lower cost debt resulting from the issuance of $80.0 million of our 3.55% Guaranteed Senior Notes and the retirement of our remaining $52.3 million outstanding 9.000% Notes in December 2016. The average level of debt outstanding between the quarters was essentially unchanged.
Other Income
Other income decreased $1.0 million in the three months ended June 30, 2017 compared with the three months ended June 30, 2016 as a result of the receipt of $0.7 million in nontaxable corporate-owned life insurance benefit proceeds in the second quarter of 2016 while no similar benefit proceeds were received in the second quarter of 2017, a $0.2 million decrease in investment income and $0.1 million decrease in allowance for equity/other funds used during construction (AFUDC) as a result of OTP making greater use of short-term debt to finance construction expenditures in 2017.
Income Taxes – Continuing Operations
Income tax expense - continuing operations increased $0.8 million in the three months ended June 30, 2017 compared with the three months ended June 30, 2016 mainly as a result of a $2.0 million increase in income from continuing operations before income taxes. The following table provides a reconciliation of income tax expense calculated at our net composite federal and state statutory rate on income from continuing operations before income taxes and income tax expense for continuing operations reported on our consolidated statements of income for the three month periods ended June 30, 2017 and 2016:
|
(in thousands) |
2017 |
2016 |
||||||
|
Income Before Income Taxes – Continuing Operations |
$ | 22,614 | $ | 20,639 | ||||
|
Tax Computed at Company’s Net Composite Federal and State Statutory Rate (39%) |
8,819 | 8,049 | ||||||
|
Increases (Decreases) in Tax from: |
||||||||
|
Federal PTCs |
(2,010 | ) | (1,885 | ) | ||||
|
Section 199 Domestic Production Activities Deduction |
(330 | ) | (94 | ) | ||||
|
North Dakota Wind Tax Credit Amortization – Net of Federal Taxes |
(213 | ) | (213 | ) | ||||
|
Corporate-Owned Life Insurance |
(207 | ) | (480 | ) | ||||
|
Employee Stock Ownership Plan Dividend Deduction |
(173 | ) | (157 | ) | ||||
|
Other Items – Net |
11 | (137 | ) | |||||
|
Income Tax Expense – Continuing Operations |
$ | 5,897 | $ | 5,083 | ||||
|
Effective Income Tax Rate – Continuing Operations |
26.1 | % | 24.6 | % | ||||
Federal PTCs are recognized as wind energy is generated based on a per kwh rate prescribed in applicable federal statutes. North Dakota wind energy credits are based on dollars invested in qualifying facilities and are being recognized on a straight-line basis over 25 years.
Comparison of the Six Months Ended June 30, 2017 and 2016
Consolidated operating revenues were $426.2 million for the six months ended June 30, 2017 compared with $409.7 million for the six months ended June 30, 2016. Operating income was $62.4 million for the six months ended June 30, 2017 compared with $54.7 million for the six months ended June 30, 2016. The Company recorded diluted earnings per share from continuing operations of $0.92 for the six months ended June 30, 2017 compared with $0.79 for the six months ended June 30, 2016, and total diluted earnings per share of $0.92 for the six months ended June 30, 2017 compared with $0.79 for the six months ended June 30, 2016.
Amounts presented in the segment tables that follow for operating revenues, cost of products sold and other nonelectric operating expenses for the six month periods ended June 30, 2017 and 2016 will not agree with amounts presented in the consolidated statements of income due to the elimination of intersegment transactions. The amounts of intersegment eliminations by income statement line item are listed below:
|
Intersegment Eliminations (in thousands) |
June 30, 2017 |
June 30, 2016 |
||||||
|
Operating Revenues: |
||||||||
|
Electric |
$ | 13 | $ | 16 | ||||
|
Nonelectric |
-- | -- | ||||||
|
Costs of Products Sold |
3 | -- | ||||||
|
Other Nonelectric Expenses |
10 | 16 | ||||||
Electric
|
Six Months Ended |
||||||||||||||||
|
June 30, |
% |
|||||||||||||||
|
(in thousands) |
2017 |
2016 |
Change |
Change |
||||||||||||
|
Retail Sales Revenues |
$ | 191,470 | $ | 186,640 | $ | 4,830 | 2.6 | |||||||||
|
Wholesale Revenues – Company Generation |
2,051 | 1,770 | 281 | 15.9 | ||||||||||||
|
Other Revenues |
27,266 | 22,509 | 4,757 | 21.1 | ||||||||||||
|
Total Operating Revenues |
$ | 220,787 | $ | 210,919 | $ | 9,868 | 4.7 | |||||||||
|
Production Fuel |
28,859 | 25,690 | 3,169 | 12.3 | ||||||||||||
|
Purchased Power – System Use |
35,564 | 32,013 | 3,551 | 11.1 | ||||||||||||
|
Other Operation and Maintenance Expenses |
76,229 | 78,999 | (2,770 | ) | (3.5 | ) | ||||||||||
|
Depreciation and Amortization |
26,160 | 26,915 | (755 | ) | (2.8 | ) | ||||||||||
|
Property Taxes |
7,507 | 7,268 | 239 | 3.3 | ||||||||||||
|
Operating Income |
$ | 46,468 | $ | 40,034 | $ | 6,434 | 16.1 | |||||||||
|
Electric kwh Sales (in thousands) |
||||||||||||||||
|
Retail kwh Sales |
2,463,610 | 2,421,917 | 41,693 | 1.7 | ||||||||||||
|
Wholesale kwh Sales – Company Generation |
84,242 | 80,573 | 3,669 | 4.6 | ||||||||||||
|
Heating Degree Days |
3,502 | 3,254 | 248 | 7.6 | ||||||||||||
|
Cooling Degree Days |
96 | 133 | (37 | ) | (27.8 | ) | ||||||||||
The following table shows heating and cooling degree days as a percent of normal:
|
Six Months ended June 30, |
||||||||
|
2017 |
2016 |
|||||||
|
Heating Degree Days |
88.9 | % | 82.6 | % | ||||
|
Cooling Degree Days |
90.6 | % | 125.5 | % | ||||
The following table summarizes the estimated effect on diluted earnings per share of the difference in retail kwh sales under actual weather conditions and expected retail kwh sales under normal weather conditions in the first six months of 2017 and 2016 and between the periods:
|
Six Months ended June 30, |
||||||||||||
|
2017 vs Normal |
2016 vs Normal |
2017 vs 2016 |
||||||||||
|
Impact on Diluted Earnings Per Share |
$ | ( 0.03 | ) | $ | (0.04 | ) | $ | 0.01 | ||||
The $4.8 million increase in retail electric revenue includes:
|
● |
A $6.4 million increase in retail revenue related to the recovery of increased fuel and purchased power costs due to a 15.5% increase in the price per kwh purchased and a 5.1% increase in fuel costs per kwh generated to serve retail customers. |
|
● |
A $1.3 million net increase in retail revenue related to an interim rate increase implemented in April 2016 in conjunction with OTP's 2016 general rate increase request in Minnesota. |
|
● |
A $0.8 million increase in revenue related to increased consumption due to colder weather in the first half of 2017, evidenced by a 7.6% increase in heating degree days between the periods. |
|
● |
A $0.4 million increase in revenue due to increased kwh sales to commercial and industrial customers not related to weather. |
offset by:
|
● |
A $1.4 million decrease in ECR rider revenue mainly due to a reduction in the unrecovered balance of environmental upgrades due to depreciation. |
|
● |
A $1.2 million negative price variance related to increased sales of electricity to customers with lower rate tariffs. |
|
● |
A $0.6 million decrease in TCR rider revenue due to a reduction in transmission services and costs from another regional transmission provider. |
|
● |
A $0.5 million decrease in Conservation Improvement Program (CIP) cost recovery and incentive revenues. |
|
● |
A $0.4 million decrease in NDRRA rider revenue mainly due to increasing PTCs applied against the rider revenue requirement. |
Other electric revenues increased $4.8 million, primarily due to a $4.0 million increase in MISO transmission tariff revenues related to increased investment in regional transmission lines and a $0.5 million increase in interconnection revenues related to another generator's new wind project that began generating electricity in November 2016.
Production fuel costs increased $3.2 million as a result of a 7.1% increase in kwhs generated combined with a 4.9% increase in the cost of fuel per kwh generated from our steam-powered and combustion turbine generators. The increase in generation was mainly at Coyote Station, which was down for maintenance for 10 weeks during the first six months of 2016 but fully operational during the first six months of 2017. The increase in fuel costs per kwh of generation was mainly at Coyote Station, which began taking coal under a new supply agreement in May 2016.
The cost of purchased power to serve retail customers increased $3.6 million, despite a 3.8% decrease in kwh purchases, as a result of a 15.5% increase in the cost per kwh purchased due to higher market prices and increased prices for energy purchases under a long-term contract.
Other electric operation and maintenance expenses decreased $2.8 million as a result of:
|
● |
A $1.6 million reduction in external service costs mostly due to a decrease in costs related to a 10-week maintenance shutdown at Coyote Station in the first half of 2016 in conjunction with the Coyote Creek Coal Mine tie-in project. |
|
● |
A $1.6 million decrease in transmission service charges, mainly due to a refund received in February 2017 related to a reduction in the return on equity component of the MISO tariff imposed from November 2013 through January 2015. The benefits of this refund are passed back to retail ratepayers through state transmission cost recovery rider adjustments. |
|
● |
A $0.5 million reduction in transmission and distribution line maintenance expenses. |
|
● |
A $0.4 million reduction in expenses related to settling a customer rate dispute in the first half of 2016. |
offset by:
|
● |
A $0.8 million increase in labor costs mainly related to work required to respond to storm outages, to permit a new power plant and to conduct load research and applications development to improve system operations. |
|
● |
A $0.5 million increase in stock-based performance incentive costs allocated from Corporate to OTP. |
Depreciation and amortization expense decreased $0.4 million as a result of extending the depreciable lives of certain assets and $0.4 million as a result of other assets reaching the end of their depreciable lives in 2016.
Manufacturing
|
Six Months Ended |
||||||||||||||||
|
June 30, |
% |
|||||||||||||||
|
(in thousands) |
2017 |
2016 |
Change |
Change |
||||||||||||
|
Operating Revenues |
$ | 117,721 | $ | 118,272 | $ | (551 | ) | (0.5 | ) | |||||||
|
Cost of Products Sold |
89,763 | 89,313 | 450 | 0.5 | ||||||||||||
|
Operating Expenses |
11,422 | 11,335 | 87 | 0.8 | ||||||||||||
|
Depreciation and Amortization |
7,731 | 7,964 | (233 | ) | (2.9 | ) | ||||||||||
|
Operating Income |
$ | 8,805 | $ | 9,660 | $ | (855 | ) | (8.9 | ) | |||||||
The $0.6 million decrease in revenues in our Manufacturing segment includes the following:
|
● |
Revenues at BTD decreased $1.9 million as a result of: |
|
o |
A $4.1 million reduction in sales of transportation fixtures for wind turbine blades. |
|
o |
A $1.5 million reduction in tooling revenue. |
|
o |
A $1.4 million decrease in sales to industrial equipment end markets. |
offset by:
|
o |
A $2.2 million increase in revenue from sales of equipment used in the mineral extraction industry. |
|
o |
A $1.3 million increase in revenue from scrap sales mainly due to higher scrap metal prices. |
|
o |
A $1.2 million increase in sales to manufacturers of lawn and garden equipment. |
|
o |
A $0.4 million increase in revenue from other parts sales. |
|
● |
Revenues at T.O. Plastics increased $1.4 million, including a $0.6 million increase in revenue from sales of life sciences products, a $0.5 million increase in revenue from sales of horticultural containers and a $0.3 million increase in revenue from sales to industrial customers. |
The $0.4 million increase in cost of products sold in our Manufacturing segment includes the following:
|
● |
Cost of products sold at BTD decreased $0.2 million as decreased costs related to the decrease in BTD’s sales and a change in the mix of products sold between the periods was mostly offset by increased costs for scrapped parts and obsolete inventory. |
|
● |
Cost of products sold at T.O. Plastics increased $0.6 million as a result of the increase in product sales, partially mitigated by lower material costs in the second quarter of 2017. |
Plastics
|
Six Months Ended |
||||||||||||||||
|
June 30, |
% |
|||||||||||||||
|
(in thousands) |
2017 |
2016 |
Change |
Change |
||||||||||||
|
Operating Revenues |
$ | 87,708 | $ | 80,549 | $ | 7,159 | 8.9 | |||||||||
|
Cost of Products Sold |
69,530 | 64,275 | 5,255 | 8.2 | ||||||||||||
|
Operating Expenses |
4,733 | 4,612 | 121 | 2.6 | ||||||||||||
|
Depreciation and Amortization |
1,854 | 1,910 | (56 | ) | (2.9 | ) | ||||||||||
|
Operating Income |
$ | 11,591 | $ | 9,752 | $ | 1,839 | 18.9 | |||||||||
Plastics segment revenues increased $7.2 million as a result of a 5.2% increase in PVC pipe prices in combination with a 3.5% increase in pounds of PVC pipe sold. The increase in revenue more than offset a $5.3 million increase in cost of products sold, which was primarily due to a 4.5% increase in the cost per pound of PVC pipe sold.
Corporate
Corporate includes items such as corporate staff and overhead costs, the results of our captive insurance company and other items excluded from the measurement of operating segment performance. Corporate is not an operating segment. Rather it is added to operating segment totals to reconcile to totals on our consolidated statements of income.
|
Six Months Ended |
||||||||||||||||
|
June 30, |
% |
|||||||||||||||
|
(in thousands) |
2017 |
2016 |
Change |
Change |
||||||||||||
|
Operating Expenses |
$ | 4,457 | $ | 4,762 | $ | (305 | ) | (6.4 | ) | |||||||
|
Depreciation and Amortization |
17 | 25 | (8 | ) | (32.0 | ) | ||||||||||
Corporate operating expenses decreased $0.3 million, mainly as a result of a decrease in contracted service expenses and an increase in the level of corporate costs allocated to the Electric segment as a result of an increase in the segment’s proportional share of consolidated revenues and net income.
Interest Charges
The $1.0 million decrease in interest charges in the six months ended June 30, 2017 compared with the six months ended June 30, 2016 is related to lower cost debt resulting from the issuance of $80.0 million of our 3.55% Guaranteed Senior Notes and the retirement of our remaining $52.3 million outstanding 9.000% Notes in December 2016. The average level of debt outstanding between the quarters was essentially unchanged.
Other Income
Other income decreased $0.8 million in the six months ended June 30, 2017 compared with the six months ended June 30, 2016, mainly as a result of the receipt of $0.7 million in nontaxable corporate-owned life insurance benefit proceeds in the second quarter of 2016 while no similar benefit proceeds were received in the first six months of 2017.
Income Taxes – Continuing Operations
Income tax expense - continuing operations increased $1.7 million in the six months ended June 30, 2017 compared with the six months ended June 30, 2016 mainly as a result of a $7.9 million increase in income from continuing operations before income taxes, offset by (1) $0.7 million in excess tax benefits related to the accounting treatment of stock performance awards, and (2) a $0.5 million increase in federal PTCs earned between the periods. The following table provides a reconciliation of income tax expense calculated at our net composite federal and state statutory rate on income from continuing operations before income taxes and income tax expense for continuing operations reported on our consolidated statements of income for the six month periods ended June 30, 2017 and 2016:
|
(in thousands) |
2017 |
2016 |
||||||
|
Income Before Income Taxes – Continuing Operations |
$ | 48,506 | $ | 40,621 | ||||
|
Tax Computed at Company’s Net Composite Federal and State Statutory Rate (39%) |
18,917 | 15,842 | ||||||
|
Increases (Decreases) in Tax from: |
||||||||
|
Federal PTCs |
(4,062 | ) | (3,571 | ) | ||||
|
Excess Tax Deduction – 2014 Performance Share Awards |
(697 | ) | -- | |||||
|
Section 199 Domestic Production Activities Deduction |
(660 | ) | (198 | ) | ||||
|
Corporate-Owned Life Insurance |
(501 | ) | (572 | ) | ||||
|
North Dakota Wind Tax Credit Amortization – Net of Federal Taxes |
(425 | ) | (425 | ) | ||||
|
Employee Stock Ownership Plan Dividend Deduction |
(345 | ) | (315 | ) | ||||
|
Other Items - Net |
33 | (186 | ) | |||||
|
Income Tax Expense – Continuing Operations |
$ | 12,260 | $ | 10,575 | ||||
|
Effective Income Tax Rate – Continuing Operations |
25.3 | % | 26.0 | % | ||||
Federal PTCs are recognized as wind energy is generated based on a per kwh rate prescribed in applicable federal statutes. OTP’s kwh generation from its wind turbines eligible for PTCs increased 7.5% in the six months ended June 30, 2017 compared with the six months ended June 30, 2016 due to improved availability of the turbines and more favorable wind and operating conditions in the first six months of 2017. North Dakota wind energy credits are based on dollars invested in qualifying facilities and are being recognized on a straight-line basis over 25 years.
Financial Position
The following table presents the status of our lines of credit as of June 30, 2017 and December 31, 2016:
|
(in thousands) |
Line Limit |
In Use on June 30, 2017 |
Restricted due to Outstanding Letters of Credit |
Available on June 30, 2017 |
Available on December 31, 2016 |
|||||||||||||||
|
Otter Tail Corporation Credit Agreement |
$ | 130,000 | $ | 117 | $ | -- | $ | 129,883 | $ | 130,000 | ||||||||||
|
OTP Credit Agreement |
170,000 | 58,000 | 300 | 111,700 | 127,067 | |||||||||||||||
|
Total |
$ | 300,000 | $ | 58,117 | $ | 300 | $ | 241,583 | $ | 257,067 | ||||||||||
We believe we have the necessary liquidity to effectively conduct business operations for an extended period if needed. Our balance sheet is strong and we are in compliance with our debt covenants. Financial flexibility is provided by operating cash flows, unused lines of credit, strong financial coverages, investment grade credit ratings and alternative financing arrangements such as leasing.
We believe our financial condition is strong and our cash, other liquid assets, operating cash flows, existing lines of credit, access to capital markets and borrowing ability because of investment-grade credit ratings, when taken together, provide adequate resources to fund ongoing operating requirements and future capital expenditures related to expansion of existing businesses and development of new projects. On May 11, 2015 we filed a shelf registration statement with the Securities and Exchange Commission (SEC) under which we may offer for sale, from time to time, either separately or together in any combination, equity, debt or other securities described in the shelf registration statement, which expires on May 11, 2018. On May 11, 2015, we entered into a Distribution Agreement with J.P. Morgan Securities LLC (JPMS) under which we may offer and sell our common shares from time to time through JPMS, as our distribution agent, up to an aggregate sales price of $75 million through an At-the-Market offering program. No shares were issued under this program in the first six months of 2017.
Equity or debt financing will be required in the period 2017 through 2021 given the expansion plans related to our Electric segment to fund construction of new rate base investments. Also, such financing will be required should we decide to reduce borrowings under our lines of credit or refund or retire early any of our presently outstanding debt, to complete acquisitions or for other corporate purposes. Our operating cash flows and access to capital markets can be impacted by macroeconomic factors outside our control. In addition, our borrowing costs can be impacted by changing interest rates on short-term and long-term debt and ratings assigned to us by independent rating agencies, which in part are based on certain credit measures such as interest coverage and leverage ratios.
The determination of the amount of future cash dividends to be declared and paid will depend on, among other things, our financial condition, improvement in earnings per share, cash flows from operations, the level of our capital expenditures and our future business prospects. As a result of certain statutory limitations or regulatory or financing agreements, restrictions could occur on the amount of distributions allowed to be made by our subsidiaries. See note 8 to consolidated financial statements for more information. The decision to declare a dividend is reviewed quarterly by the board of directors. On February 2, 2017 our board of directors increased the quarterly dividend from $0.3125 to $0.32 per common share.
Cash provided by operating activities of continuing operations was $69.3 million for the six months ended June 30, 2017 compared with cash provided by operating activities of $64.2 million for the six months ended June 30, 2016. Contributing to the $5.1 million increase in cash provided by continuing operations between the periods was a $10.0 million reduction in discretionary contributions to the Company’s funded pension plan and a $6.2 million increase in net income from continuing operations. These increases were partially offset by an $8.6 million increase in cash used for working capital items, a $1.1 million decrease in depreciation expense and $1.0 million less in deferred income taxes between periods. The increase in cash used for working capital items between the periods is primarily due to a $7.7 million increase in cash used to build inventories between the periods. All operating segments experienced increases in inventories in the first six months of 2017 compared with decreases in the first six months of 2016.
Net cash used in investing activities was $56.6 million for the six months ended June 30, 2017 compared with $78.3 million for the six months ended June 30, 2016. The $21.7 million decrease in cash used for investing activities includes a $22.8 million decrease in capital expenditures, mainly due to a $20.5 million reduction in cash used for capital expenditures at OTP as work is winding down on the Big Stone South-Brookings 345 kV transmission line project. Cash used for capital expenditures also decreased $3.2 million at BTD in the six months ended June 30, 2017 compared with the six months ended June 30, 2016.
Financing activities in the first six months of 2017 included a net increase in short-term and long-term borrowings of $15.2 million, $4.3 million in net proceeds from the issuance of common stock under its automatic dividend reinvestment and share purchase plan, and an increase in checks issued in excess of cash of $1.0 million, which were more than offset by $25.3 million in common dividend payments and $6.1 million in long-term debt repayments. See note 6 to the Company’s consolidated financial statements for further information on stock issuances and retirements in the first six months of 2017.
Financing activities in the first six months of 2016 included $50 million in borrowings under a Term Loan Agreement and $21.6 million in net proceeds from the issuance of stock under the Company’s At-the-Market offering program and its automatic dividend reinvestment and share purchase plan, offset by $33.4 million in cash used to pay down short-term borrowings and checks written in excess of cash and $23.8 million in common stock dividend payments. The outstanding short-term borrowings that were paid down were, in part, used to fund the expansion of BTD’s Minnesota facilities in 2015 and the September 1, 2015 acquisition of BTD-Georgia.
CAPITAL REQUIREMENTS
2017-2021 Capital Expenditures
The following table shows our 2016 capital expenditures and 2017 through 2021 anticipated capital expenditures and electric utility average rate base:
|
(in millions) |
2016 |
2017 |
2018 |
2019 |
2020 |
2021 |
||||||||||||||||||
|
Capital Expenditures: |
||||||||||||||||||||||||
|
Electric Segment: |
||||||||||||||||||||||||
|
Transmission |
$ | 88 | $ | 49 | $ | 11 | $ | 11 | $ | 7 | ||||||||||||||
|
Renewables and Natural Gas Generation |
3 | 80 | 288 | 71 | 20 | |||||||||||||||||||
|
Other |
44 | 44 | 47 | 48 | 51 | |||||||||||||||||||
|
Total Electric Segment |
$ | 150 | $ | 135 | $ | 173 | $ | 346 | $ | 130 | $ | 78 | ||||||||||||
|
Manufacturing and Plastics Segments |
11 | 14 | 17 | 15 | 14 | 14 | ||||||||||||||||||
|
Total Capital Expenditures |
$ | 161 | $ | 149 | $ | 190 | $ | 361 | $ | 144 | $ | 92 | ||||||||||||
|
Total Electric Utility Average Rate Base |
$ | 1,063 | $ | 1,118 | $ | 1,267 | $ | 1,396 | $ | 1,419 | ||||||||||||||
The capital expenditure plan for the 2017-2021 time period calls for $936 million based on the need for additional wind and solar in rate base and capital spending on a natural gas-fired plant that is expected to replace Hoot Lake Plant when it is retired in 2021. Execution on the currently anticipated electric utility capital expenditure plan is expected to grow rate base and be a key driver in increasing utility earnings over the 2017 through 2021 timeframe.
On November 16, 2016 OTP entered into an Asset Purchase Agreement (the Purchase Agreement) with EDF Renewable Development, Inc. and certain of its affiliated companies (EDF) to purchase and assume the development assets associated with a 150-megawatt wind farm in southeastern North Dakota (the Merricourt Project) for a purchase price of $34.7 million, subject to adjustments for interconnection costs. The Purchase Agreement is currently expected to close no earlier than mid-2018, pending regulatory reviews and other customary conditions. On the same day, OTP entered into a Turnkey Engineering, Procurement and Construction Services Agreement (the TEPC Agreement) with EDF that will be effective upon the closing of the Purchase Agreement pursuant to which EDF will construct the wind farm with a targeted completion date in 2019 for consideration of $200.5 million, subject to certain adjustments, payable following the closing of the Purchase Agreement in installments in connection with certain project milestones. The agreements contain representations, warranties, covenants and indemnities customary to transactions of this type and include provisions for liquidated damages to be paid by EDF in the event of certain occurrences described in the agreements. As of June 30, 2017 OTP had capitalized approximately $4.2 million in development costs associated with the Merricourt Project. On April 10, 2017 OTP submitted an application for Advance Determination of Prudence (ADP) and Certificate of Public Convenience and Necessity to the North Dakota Public Service Commission (NDPSC) for the Merricourt Project. A hearing on the application is scheduled for October 6, 2017. Receipt of a satisfactory ADP by OTP is a condition to closing on the Purchase Agreement.
In addition to initiation of the Merricourt Project, OTP is moving forward with plans for the development, construction and ownership of a 250-megawatt simple-cycle natural gas-fired combustion turbine generation facility near Astoria, South Dakota (Astoria Station) as part of its plan to reliably meet customers’ electric needs, replace expiring capacity purchase agreements and prepare for the planned retirement of its Hoot Lake Plant in 2021. OTP expects the project will cost approximately $165 million. As of June 30, 2017 OTP had capitalized approximately $3.1 million in development costs associated with Astoria Station. On April 10, 2017 OTP also submitted an application for ADP to the NDPSC for Astoria Station. The application for ADP was consolidated for hearing with the Merricourt Project ADP application hearing on October 6, 2017.
If a resource addition is determined to be prudent by the NDPSC, a public utility may recover in its rates for North Dakota customers, and in a timely manner consistent with the public utility's financial obligations, the jurisdictional share of amounts the public utility reasonably incurred or obligated on a prudent resource addition, including accrued AFUDC, even though the resource addition may never be fully operational or used by the public utility to serve its North Dakota customers. The cost amortization period for a discontinued resource addition may not exceed five years from the date commencement of the recovery is approved by the NDPSC. No return on amounts incurred or obligated by the public utility may be authorized for the period after the resource addition is discontinued.
Contractual Obligations
Our contractual obligations for years 2018 and 2019 reported in the table on page 49 of our Annual Report on Form 10-K for the year ended December 31, 2016 increased $38.7 million in the first six months of 2017 as a result of an increase in purchase obligations associated with the construction of the Big Stone South-Ellendale 345 kV Multi-Value Transmission Project (MVP) of $35.7 million and an increase in coal purchase commitments for Big Stone Plant of $3.0 million.
OTP’s outstanding $33 million of 5.95% Senior Unsecured Notes mature on August 20, 2017. OTP plans on redeeming the notes with funds available for borrowing under the OTP Credit Agreement.
CAPITAL RESOURCES
On May 11, 2015 we filed a shelf registration statement with the SEC under which we may offer for sale, from time to time, either separately or together in any combination, equity, debt or other securities described in the shelf registration statement, which expires on May 11, 2018. On May 11, 2015, we entered into a Distribution Agreement with JPMS under which we may offer and sell our common shares from time to time through JPMS, as our distribution agent, up to an aggregate sales price of $75 million through an At-the-Market offering program. No shares have been sold under this program in the first six months of 2017.
Short-Term Debt
The following table presents the status of our lines of credit as of June 30, 2017 and December 31, 2016:
|
(in thousands) |
Line Limit |
In Use on June 30, 2017 |
Restricted due to Outstanding Letters of Credit |
Available on June 30, 2017 |
Available on December 31, 2016 |
|||||||||||||||
|
Otter Tail Corporation Credit Agreement |
$ | 130,000 | $ | 117 | $ | -- | $ | 129,883 | $ | 130,000 | ||||||||||
|
OTP Credit Agreement |
170,000 | 58,000 | 300 | 111,700 | 127,067 | |||||||||||||||
|
Total |
$ | 300,000 | $ | 58,117 | $ | 300 | $ | 241,583 | $ | 257,067 | ||||||||||
On October 29, 2012 we entered into a Third Amended and Restated Credit Agreement (the Otter Tail Corporation Credit Agreement), which is an unsecured $130 million revolving credit facility that may be increased to $250 million on the terms and subject to the conditions described in the Otter Tail Corporation Credit Agreement. On October 31, 2016 the Otter Tail Corporation Credit Agreement was amended to extend its expiration date by one year from October 29, 2020 to October 29, 2021 and the unsecured revolving credit facility was reduced from $150 million to $130 million. We can draw on this credit facility to refinance certain indebtedness and support our operations and the operations of certain of our subsidiaries. Borrowings under the Otter Tail Corporation Credit Agreement bear interest at LIBOR plus 1.75%, subject to adjustment based on our senior unsecured credit ratings. We are required to pay commitment fees based on the average daily unused amount available to be drawn under the revolving credit facility. The Otter Tail Corporation Credit Agreement contains a number of restrictions on us and the businesses of our wholly owned subsidiary, Varistar Corporation (Varistar) and its subsidiaries, including restrictions on our and their ability to merge, sell assets, make investments, create or incur liens on assets, guarantee the obligations of certain other parties and engage in transactions with related parties. The Otter Tail Corporation Credit Agreement also contains affirmative covenants and events of default, and financial covenants as described below under the heading “Financial Covenants.” The Otter Tail Corporation Credit Agreement does not include provisions for the termination of the agreement or the acceleration of repayment of amounts outstanding due to changes in our credit ratings. Our obligations under the Otter Tail Corporation Credit Agreement are guaranteed by certain of our subsidiaries. Outstanding letters of credit issued by us under the Otter Tail Corporation Credit Agreement can reduce the amount available for borrowing under the line by up to $40 million.
On October 29, 2012 OTP entered into a Second Amended and Restated Credit Agreement (the OTP Credit Agreement), providing for an unsecured $170 million revolving credit facility that may be increased to $250 million on the terms and subject to the conditions described in the OTP Credit Agreement. On October 31, 2016 the OTP Credit Agreement was amended to extend its expiration date by one year from October 29, 2020 to October 29, 2021. OTP can draw on this credit facility to support the working capital needs and other capital requirements of its operations, including letters of credit in an aggregate amount not to exceed $50 million outstanding at any time. Borrowings under this line of credit bear interest at LIBOR plus 1.25%, subject to adjustment based on the ratings of OTP’s senior unsecured debt. OTP is required to pay commitment fees based on the average daily unused amount available to be drawn under the revolving credit facility. The OTP Credit Agreement contains a number of restrictions on the business of OTP, including restrictions on its ability to merge, sell assets, make investments, create or incur liens on assets, guarantee the obligations of any other party, and engage in transactions with related parties. The OTP Credit Agreement also contains affirmative covenants and events of default, and financial covenants as described below under the heading “Financial Covenants.” The OTP Credit Agreement does not include provisions for the termination of the agreement or the acceleration of repayment of amounts outstanding due to changes in OTP’s credit ratings. OTP’s obligations under the OTP Credit Agreement are not guaranteed by any other party.
Long-Term Debt
2016 Note Purchase Agreement
On September 23, 2016 we entered into a Note Purchase Agreement (the 2016 Note Purchase Agreement) with the purchasers named therein, pursuant to which we agreed to issue to the purchasers, in a private placement transaction, $80 million aggregate principal amount of our 3.55% Guaranteed Senior Notes due December 15, 2026 (the 2026 Notes). The 2026 Notes were issued on December 13, 2016. Our obligations under the 2016 Note Purchase Agreement and the 2026 Notes are guaranteed by our Material Subsidiaries (as defined in the 2016 Note Purchase Agreement, but specifically excluding OTP). The proceeds from the issuance of the 2026 Notes were used to repay the remaining $52,330,000 of our 9.000% Senior Notes due December 15, 2016, and to pay down a portion of the $50 million in funds borrowed in February 2016 under our Term Loan Agreement described below.
We may prepay all or any part of the 2026 Notes (in an amount not less than 10% of the aggregate principal amount of the 2026 Notes then outstanding in the case of a partial prepayment) at 100% of the principal amount prepaid, together with unpaid accrued interest and a make-whole amount; provided that if no default or event of default exists under the 2016 Note Purchase Agreement, any optional prepayment made by us of all of the 2026 Notes on or after September 15, 2026 will be made without any make-whole amount. We are required to offer to prepay all of the outstanding 2026 Notes at 100% of the principal amount together with unpaid accrued interest in the event of a Change of Control (as defined in the 2016 Note Purchase Agreement) of the Company. In addition, if we and our Material Subsidiaries sell a “substantial part” of our or their assets and use the proceeds to prepay or retire senior Interest-bearing Debt (as defined in the 2016 Note Purchase Agreement) of the Company and/or a Material Subsidiary in accordance with the terms of the 2016 Note Purchase Agreement, we are required to offer to prepay a Ratable Portion (as defined in the 2016 Note Purchase Agreement) of the 2026 Notes held by each holder of the 2026 Notes.
The 2016 Note Purchase Agreement contains a number of restrictions on the business of the Company and our Material Subsidiaries. These include restrictions on our and our Material Subsidiaries’ abilities to merge, sell assets, create or incur liens on assets, guarantee the obligations of any other party, engage in transactions with related parties, redeem or pay dividends on our and our Material Subsidiaries’ shares of capital stock, and make investments. The 2016 Note Purchase Agreement also contains other negative covenants and events of default, as well as certain financial covenants as described below under the heading “Financial Covenants.” The 2016 Note Purchase Agreement does not include provisions for the termination of the agreement or the acceleration of repayment of amounts outstanding due to changes in our or our Material Subsidiaries’ credit ratings.
Term Loan Agreement
On February 5, 2016 we entered into a Term Loan Agreement (the Term Loan Agreement) with the Banks named therein, JPMorgan Chase Bank, N.A. (JPMorgan), as administrative agent, and JPMS, as Lead Arranger and Book Runner. The Term Loan Agreement provides for an unsecured term loan with an aggregate commitment of $50 million that we may use for purposes of funding working capital, capital expenditures and other corporate purposes of the Company and certain of our subsidiaries. Under the Term Loan Agreement, we may, on up to two occasions, enter into additional tranches of term loans in minimum increments of $10 million, subject to the consent of the lenders and so long as the aggregate amount of outstanding term loans does not exceed $100 million at any time. Borrowings under the Term Loan Agreement will bear interest at either (1) LIBOR plus 0.90% or (2) the greater of (a) the Prime Rate, (b) the Federal Reserve Bank of New York Rate plus 0.50% and (c) LIBOR multiplied by the Statutory Reserve Rate plus 1%. The applicable interest rate will depend on our election of whether to make the advance a LIBOR advance. The Term Loan Agreement terminates on February 5, 2018.
On February 5, 2016 we borrowed $50 million under the Term Loan Agreement at an interest rate based on the 30 day LIBOR plus 90 basis points and used the proceeds to pay down borrowings under the Otter Tail Corporation Credit Agreement that were used to fund the expansion of BTD’s Minnesota facilities in 2015 and to fund the September 1, 2015 acquisition of BTD-Georgia. We repaid $35.0 million under the Term Loan Agreement in the fourth quarter of 2016 and made additional repayments of $3.0 million in January 2017, $3.0 million in June 2017 and $9.0 million on August 7, 2017. As of August 9, 2017 we had no borrowings under the Term Loan Agreement.
The Term Loan Agreement contains a number of restrictions on us, Varistar and certain subsidiaries of Varistar, including restrictions on our and their ability to merge, sell assets, make investments, create or incur liens on assets, guarantee the obligations of any other party and engage in transactions with related parties. The Term Loan Agreement also contains affirmative covenants and events of default, as well as certain financial covenants as described below under the heading “Financial Covenants.” The Term Loan Agreement does not include provisions for the termination of the agreement or the acceleration of repayment of amounts outstanding due to changes in our credit ratings. Our obligations under the Term Loan Agreement are guaranteed by Varistar and certain of its subsidiaries.
2013 Note Purchase Agreement
On August 14, 2013 OTP entered into a Note Purchase Agreement (the 2013 Note Purchase Agreement) with the Purchasers named therein, pursuant to which OTP agreed to issue to the Purchasers, in a private placement transaction, $60 million aggregate principal amount of OTP’s 4.68% Series A Senior Unsecured Notes due February 27, 2029 (the Series A Notes) and $90 million aggregate principal amount of OTP’s 5.47% Series B Senior Unsecured Notes due February 27, 2044 (the Series B Notes and, together with the Series A Notes, the Notes). On February 27, 2014 OTP issued all $150 million aggregate principal amount of the Notes.
The 2013 Note Purchase Agreement states that OTP may prepay all or any part of the Notes (in an amount not less than 10% of the aggregate principal amount of the Notes then outstanding in the case of a partial prepayment) at 100% of the principal amount prepaid, together with accrued interest and a make-whole amount, provided that if no default or event of default under the 2013 Note Purchase Agreement exists, any optional prepayment made by OTP of (i) all of the Series A Notes then outstanding on or after November 27, 2028 or (ii) all of the Series B Notes then outstanding on or after November 27, 2043, will be made at 100% of the principal prepaid but without any make-whole amount. In addition, the 2013 Note Purchase Agreement states OTP must offer to prepay all of the outstanding Notes at 100% of the principal amount together with unpaid accrued interest in the event of a change of control of OTP.
The 2013 Note Purchase Agreement contains a number of restrictions on the business of OTP, including restrictions on OTP’s ability to merge, sell assets, create or incur liens on assets, guarantee the obligations of any other party, and engage in transactions with related parties. The 2013 Note Purchase Agreement also contains affirmative covenants and events of default, as well as certain financial covenants as described below under the heading “Financial Covenants.” The 2013 Note Purchase Agreement does not include provisions for the termination of the agreement or the acceleration of repayment of amounts outstanding due to changes in OTP’s credit ratings. The 2013 Note Purchase Agreement includes a “most favored lender” provision generally requiring that in the event OTP’s existing credit agreement or any renewal, extension or replacement thereof, at any time contains any financial covenant or other provision providing for limitations on interest expense and such a covenant is not contained in the 2013 Note Purchase Agreement under substantially similar terms or would be more beneficial to the holders of the Notes than any analogous provision contained in the 2013 Note Purchase Agreement (an “Additional Covenant”), then unless waived by the Required Holders (as defined in the 2013 Note Purchase Agreement), the Additional Covenant will be deemed to be incorporated into the 2013 Note Purchase Agreement. The 2013 Note Purchase Agreement also provides for the amendment, modification or deletion of an Additional Covenant if such Additional Covenant is amended or modified under or deleted from the OTP credit agreement, provided that no default or event of default has occurred and is continuing.
2007 and 2011 Note Purchase Agreements
On December 1, 2011, OTP issued $140 million aggregate principal amount of its 4.63% Senior Unsecured Notes due December 1, 2021 pursuant to a Note Purchase Agreement dated as of July 29, 2011 (2011 Note Purchase Agreement). OTP also has outstanding its $155 million senior unsecured notes issued in four series consisting of $33 million aggregate principal amount of 5.95% Senior Unsecured Notes, Series A, due 2017; $30 million aggregate principal amount of 6.15% Senior Unsecured Notes, Series B, due 2022; $42 million aggregate principal amount of 6.37% Senior Unsecured Notes, Series C, due 2027; and $50 million aggregate principal amount of 6.47% Senior Unsecured Notes, Series D, due 2037 (collectively, the 2007 Notes). The 2007 Notes were issued pursuant to a Note Purchase Agreement dated as of August 20, 2007 (the 2007 Note Purchase Agreement).
The 2011 Note Purchase Agreement and the 2007 Note Purchase Agreement each states that OTP may prepay all or any part of the notes issued thereunder (in an amount not less than 10% of the aggregate principal amount of the notes then outstanding in the case of a partial prepayment) at 100% of the principal amount prepaid, together with accrued interest and a make-whole
amount. The 2011 Note Purchase Agreement states in the event of a transfer of utility assets put event, the noteholders thereunder have the right to require OTP to repurchase the notes held by them in full, together with accrued interest and a make-whole amount, on the terms and conditions specified in the 2011 Note Purchase Agreement. The 2011 Note Purchase Agreement and the 2007 Note Purchase Agreement each also states that OTP must offer to prepay all of the outstanding notes issued thereunder at 100% of the principal amount together with unpaid accrued interest in the event of a change of control of OTP. The note purchase agreements contain a number of restrictions on OTP, including restrictions on OTP’s ability to merge, sell assets, create or incur liens on assets, guarantee the obligations of any other party, and engage in transactions with related parties. The note purchase agreements also include affirmative covenants and events of default, and certain financial covenants as described below under the heading “Financial Covenants.”
Financial Covenants
We were in compliance with the financial covenants in our debt agreements as of June 30, 2017.
No Credit or Note Purchase Agreement contains any provisions that would trigger an acceleration of the related debt as a result of changes in the credit rating levels assigned to the related obligor by rating agencies.
Our borrowing agreements are subject to certain financial covenants. Specifically:
|
● |
Under the Otter Tail Corporation Credit Agreement, the Term Loan Agreement and the 2016 Note Purchase Agreement, we may not permit the ratio of our Interest-bearing Debt to Total Capitalization to be greater than 0.60 to 1.00 or permit our Interest and Dividend Coverage Ratio to be less than 1.50 to 1.00 (each measured on a consolidated basis). As of June 30, 2017 our Interest and Dividend Coverage Ratio calculated under the requirements of the Otter Tail Corporation Credit Agreement, the Term Loan Agreement and the 2016 Note Purchase Agreement was 4.02 to 1.00. |
|
● |
Under the 2016 Note Purchase Agreement, we may not permit our Priority Indebtedness to exceed 10% of our Total Capitalization. |
|
● |
Under the OTP Credit Agreement, OTP may not permit the ratio of its Interest-bearing Debt to Total Capitalization to be greater than 0.60 to 1.00. |
|
● |
Under the 2007 Note Purchase Agreement and 2011 Note Purchase Agreement, OTP may not permit the ratio of its Consolidated Debt to Total Capitalization to be greater than 0.60 to 1.00 or permit its Interest and Dividend Coverage Ratio to be less than 1.50 to 1.00, in each case as provided in the related borrowing agreement, and OTP may not permit its Priority Debt to exceed 20% of its Total Capitalization, as provided in the related agreement. As of June 30, 2017 OTP’s Interest and Dividend Coverage Ratio and Interest Charges Coverage Ratio, calculated under the requirements of the 2007 Note Purchase Agreement and 2011 Note Purchase Agreement, was 3.84 to 1.00. |
|
● |
Under the 2013 Note Purchase Agreement, OTP may not permit its Interest-bearing Debt to exceed 60% of Total Capitalization and may not permit its Priority Indebtedness to exceed 20% of its Total Capitalization, each as provided in the 2013 Note Purchase Agreement. |
As of June 30, 2017 our ratio of Interest-bearing Debt to Total Capitalization was 0.46 to 1.00 on a consolidated basis and 0.48 to 1.00 for OTP. Neither Otter Tail Corporation or OTP had any Priority Indebtedness outstanding as of June 30, 2017.
OFF-BALANCE-SHEET ARRANGEMENTS
We and our subsidiary companies have outstanding letters of credit totaling $3.9 million, but our line of credit borrowing limits are only restricted by $0.3 million in outstanding letters of credit. We do not have any other off-balance-sheet arrangements or any relationships with unconsolidated entities or financial partnerships. These entities are often referred to as structured finance special purpose entities or variable interest entities, which are established for the purpose of facilitating off-balance-sheet arrangements or for other contractually narrow or limited purposes. We are not exposed to any financing, liquidity, market or credit risk that could arise if we had such relationships.
2017 BUSINESS OUTLOOK
We are raising our 2017 consolidated earnings guidance range to $1.65 - $1.80 per diluted share from $1.60 - $1.75 per diluted share. This guidance reflects the current mix of businesses we own, considers the cyclical nature of some of our businesses, and reflects current regulatory factors and economic challenges facing our Electric, Manufacturing and Plastics segments and strategies for improving future operating results. We expect capital expenditures for 2017 to be $149 million compared with actual cash used for capital expenditures of $161 million in 2016. Major projects in our planned expenditures for 2017 include investments in two large transmission line projects for the Electric segment, which positively impact earnings by providing an immediate return on invested funds through rider recovery mechanisms.
Segment components of our 2017 earnings per share guidance range compared with 2016 actual earnings are as follows:
|
2016 EPS by |
2017 Guidance February 6, 2017 |
2017 Guidance May 1, 2017 |
2017 Guidance August 7, 2017 |
|||||||||||||||||||||||||
| Diluted Earnings Per Share | Segment |
Low |
High |
Low |
High |
Low |
High |
|||||||||||||||||||||
|
Electric |
$ | 1.29 | $ | 1.31 | $ | 1.34 | $ | 1.31 | $ | 1.34 | $ | 1.31 | $ | 1.34 | ||||||||||||||
|
Manufacturing |
$ | 0.15 | $ | 0.17 | $ | 0.21 | $ | 0.17 | $ | 0.21 | $ | 0.17 | $ | 0.21 | ||||||||||||||
|
Plastics |
$ | 0.27 | $ | 0.26 | $ | 0.30 | $ | 0.26 | $ | 0.30 | $ | 0.31 | $ | 0.35 | ||||||||||||||
|
Corporate |
$ | (0.11 | ) | $ | (0.14 | ) | $ | (0.10 | ) | $ | (0.14 | ) | $ | (0.10 | ) | $ | (0.14 | ) | $ | (0.10 | ) | |||||||
|
Total – Continuing Operations |
$ | 1.60 | $ | 1.60 | $ | 1.75 | $ | 1.60 | $ | 1.75 | $ | 1.65 | $ | 1.80 | ||||||||||||||
|
Return on Equity |
9.8 | % | 9.3 | % | 10.2 | % | 9.3 | % | 10.2 | % | 9.7 | % | 10.5 | % | ||||||||||||||
Contributing to our earnings guidance for 2017 are the following items:
|
● |
We expect 2017 Electric segment net income to be higher than 2016 segment net income based on: |
|
o |
Normal weather for the remainder of 2017. Milder than normal weather in 2016 negatively impacted diluted earnings per share by $0.07. Milder than normal weather has negatively impacted diluted earnings per share by $0.03 through the six months ended June 30, 2017. |
|
o |
A full year of increased rates compared with 8.5 months in 2016. In March 2017, the Minnesota Public Utilities Commission granted OTP a revenue increase of approximately 6.2% with a 9.41% return on equity. |
|
o |
Rider recovery increases primarily from transmission riders related to the Electric segment’s continuing investments in its share of the MVPs in South Dakota. |
|
o |
Expected increases in sales to industrial and commercial customers. |
offset by:
|
o |
Increased operating and maintenance expenses of $0.04 per share due to inflationary increases and increasing benefit costs. Included is an increase in pension costs as a result of a decrease in the discount rate from 4.76% to 4.60% and a decrease in the assumed long-term rate of return on plan assets from 7.75% to 7.50%. |
|
o |
Higher property tax expense due to large capital projects being put into service. |
|
o |
Lower CIP incentives of $0.03 per share in Minnesota as a result of program changes made by the Minnesota Department of Commerce that reduced the CIP incentive cap by 32.5% compared to 2016. |
|
o |
Increased costs related to contractual price increases in certain capacity agreements. |
|
● |
We expect 2017 net income from our Manufacturing segment to increase over 2016 due to: |
|
o |
A slight increase in sales at BTD due to higher lawn and garden end market sales offset by lower end market recreational vehicle sales, capturing new business with existing customers and higher scrap sales. |
|
o |
Improved margins on parts and tooling sales at BTD combined with lower interest costs as a result of the refinancing of long-term debt at a lower interest rate in the fourth quarter of 2016. |
|
o |
An increase in earnings from T.O. Plastics mainly driven by year-over-year sales growth in our horticulture, life science and industrial markets and lower interest costs as a result of the refinancing of long-term debt at a lower interest rate in the fourth quarter of 2016. |
|
o |
Backlog for the manufacturing companies of approximately $84 million for 2017 compared with $81 million one year ago. |
|
● |
We are raising our 2017 net income expectations from the Plastics segment to be higher than our original plan, primarily due to our strong second quarter results. The Plastics segment also benefits from lower interest costs as a result of the refinancing of long-term debt completed in the fourth quarter of 2016. |
|
● |
Corporate costs in 2017 are expected to be in line with 2016 costs. |
Critical Accounting Policies Involving Significant Estimates
The discussion and analysis of the financial statements and results of operations are based on our consolidated financial statements, which have been prepared in accordance with accounting principles generally accepted in the United States of America. The preparation of these consolidated financial statements requires management to make estimates and judgments that affect the reported amounts of assets, liabilities, revenues and expenses, and related disclosure of contingent assets and liabilities.
We use estimates based on the best information available in recording transactions and balances resulting from business operations. Estimates are used for such items as depreciable lives, asset impairment evaluations, tax provisions, collectability of trade accounts receivable, self-insurance programs, unbilled electric revenues, warranty reserves and actuarially determined benefits costs and liabilities. As better information becomes available or actual amounts are known, estimates are revised. Operating results can be affected by revised estimates. Actual results may differ from these estimates under different assumptions or conditions. Management has discussed the application of these critical accounting policies and the development of these estimates with the Audit Committee of the board of directors. A discussion of critical accounting policies is included under the caption “Critical Accounting Policies Involving Significant Estimates” on pages 55 through 58 of our Annual Report on Form 10-K for the year ended December 31, 2016. There were no material changes in critical accounting policies or estimates during the quarter ended June 30, 2017.
Forward Looking Information - Safe Harbor Statement Under the Private Securities Litigation Reform Act of 1995
In connection with the "safe harbor" provisions of the Private Securities Litigation Reform Act of 1995 (the Act), we have filed cautionary statements identifying important factors that could cause our actual results to differ materially from those discussed in forward-looking statements made by or on behalf of the Company. When used in this Form 10-Q and in future filings by the Company with the Securities and Exchange Commission, in our press releases and in oral statements, words such as "may", "will", "expect", "anticipate", "continue", "estimate", "project", "believes" or similar expressions are intended to identify forward-looking statements within the meaning of the Act and are included, along with this statement, for purposes of complying with the safe harbor provision of the Act. These forward-looking statements involve risks and uncertainties. Actual results may differ materially from those contemplated by the forward-looking statements due to, among other factors, the risks and uncertainties described in the section entitled “Risk Factors” in Part I, Item 1A of our Annual Report on Form 10-K for the fiscal year ended December 31, 2016, as well as the various factors described below:
|
● |
Federal and state environmental regulation could require us to incur substantial capital expenditures and increased operating costs. |
|
● |
Volatile financial markets and changes in our debt ratings could restrict our ability to access capital and increase borrowing costs and pension plan and postretirement health care expenses. |
|
● |
We rely on access to both short- and long-term capital markets as a source of liquidity for capital requirements not satisfied by cash flows from operations. If we are unable to access capital at competitive rates, our ability to implement our business plans may be adversely affected. |
|
● |
Disruptions, uncertainty or volatility in the financial markets can also adversely impact our results of operations, the ability of customers to finance purchases of goods and services, and our financial condition, as well as exert downward pressure on stock prices and/or limit our ability to sustain our current common stock dividend level. |
|
● |
We could be required to contribute additional capital to the pension plan in the future if the market value of pension plan assets significantly declines, plan assets do not earn in line with our long-term rate of return assumptions or relief under the Pension Protection Act is no longer granted. |
|
● |
Any significant impairment of our goodwill would cause a decrease in our asset values and a reduction in our net operating income. |
|
● |
Declines in projected operating cash flows at BTD or the Plastics segment may result in goodwill impairments that could adversely affect our results of operations and financial position, as well as financing agreement covenants. |
|
● |
The inability of our subsidiaries to provide sufficient earnings and cash flows to allow us to meet our financial obligations and debt covenants and pay dividends to our shareholders could have an adverse effect on us. |
|
● |
We rely on our information systems to conduct our business and failure to protect these systems against security breaches or cyber-attacks could adversely affect our business and results of operations. Additionally, if these systems fail or become unavailable for any significant period of time, our business could be harmed. |
|
● |
Economic conditions could negatively impact our businesses. |
|
● |
If we are unable to achieve the organic growth we expect, our financial performance may be adversely affected. |
|
● |
Our plans to grow and realign our business mix through capital projects, acquisitions and dispositions may not be successful, which could result in poor financial performance. |
|
● |
We may, from time to time, sell assets to provide capital to fund investments in our electric utility business or for other corporate purposes, which could result in the recognition of a loss on the sale of any assets sold and other potential liabilities. The sale of any of our businesses could expose us to additional risks associated with indemnification obligations under the applicable sales agreements and any related disputes. |
|
● |
Significant warranty claims and remediation costs in excess of amounts normally reserved for such items could adversely affect our results of operations and financial condition. |
|
● |
We are subject to risks associated with energy markets. |
|
● |
Changes in tax laws, as well as judgments and estimates used in the determination of tax-related asset and liability amounts, could materially adversely affect our business, financial condition, results of operations and prospects. |
|
● |
We may experience fluctuations in revenues and expenses related to our electric operations, which may cause our financial results to fluctuate and could impair our ability to make distributions to our shareholders or scheduled payments on our debt obligations, or to meet covenants under our borrowing agreements. |
|
● |
Actions by the regulators of our electric operations could result in rate reductions, lower revenues and earnings or delays in recovering capital expenditures. |
|
● |
OTP’s operations are subject to an extensive legal and regulatory framework under federal and state laws as well as regulations imposed by other organizations that may have a negative impact on our business and results of operations. |
|
● |
OTP’s electric transmission and generation facilities could be vulnerable to cyber and physical attack that could impair its ability to provide electrical service to its customers or disrupt the U.S. bulk power system. |
|
● |
OTP’s electric generating facilities are subject to operational risks that could result in unscheduled plant outages, unanticipated operation and maintenance expenses and increased power purchase costs. |
|
● |
Changes to regulation of generating plant emissions, including but not limited to carbon dioxide emissions, could affect our operating costs and the costs of supplying electricity to our customers. |
|
● |
Competition from foreign and domestic manufacturers, the price and availability of raw materials, prices and supply of scrap or recyclable material and general economic conditions could affect the revenues and earnings of our manufacturing businesses. |
|
● |
Our plastics operations are highly dependent on a limited number of vendors for PVC resin and a limited supply of resin. The loss of a key vendor, or any interruption or delay in the supply of PVC resin, could result in reduced sales or increased costs for this segment. |
|
● |
We compete against a large number of other manufacturers of PVC pipe and manufacturers of alternative products. Customers may not distinguish the pipe companies’ products from those of our competitors. |
|
● |
Changes in PVC resin prices can negatively affect our plastics business. |
Item 3. Quantitative and Qualitative Disclosures about Market Risk
At June 30, 2017 we had exposure to market risk associated with interest rates because we had $9.0 million outstanding subject to a variable interest rate that is indexed to 30 day LIBOR plus 90 basis points under the Term Loan Agreement that terminates on February 5, 2018. OTP had $58.0 million in short-term debt outstanding on June 30, 2017 subject to variable interest rates indexed to LIBOR plus 1.25% under the OTP Credit Agreement.
All of our remaining consolidated long-term debt outstanding on June 30, 2017 has fixed interest rates. We manage our interest rate risk through the issuance of fixed-rate debt with varying maturities, through economic refunding of debt through optional refundings, limiting the amount of variable interest rate debt, and the utilization of short-term borrowings to allow flexibility in the timing and placement of long-term debt.
We have not used interest rate swaps to manage net exposure to interest rate changes related to our portfolio of borrowings. We maintain a ratio of fixed-rate debt to total debt within a certain range. It is our policy to enter into interest rate transactions and other financial instruments only to the extent considered necessary to meet our stated objectives. We do not enter into interest rate transactions for speculative or trading purposes.
The companies in our Manufacturing segment are exposed to market risk related to changes in commodity prices for steel, aluminum and polystyrene (PS) and other plastics resins. The price and availability of these raw materials could affect the revenues and earnings of our Manufacturing segment.
The plastics companies are exposed to market risk related to changes in commodity prices for PVC resins, the raw material used to manufacture PVC pipe. The PVC pipe industry is highly sensitive to commodity raw material pricing volatility. Historically, when resin prices are rising or stable, sales volume has been higher and when resin prices are falling, sales volume has been lower. Operating income may decline when the supply of PVC pipe increases faster than demand. Due to the commodity nature of PVC resin and the dynamic supply and demand factors worldwide, it is very difficult to predict gross margin percentages or to assume that historical trends will continue.
Item 4. Controls and Procedures
Under the supervision and with the participation of company management, including our Chief Executive Officer and Chief Financial Officer, we evaluated the effectiveness of the design and operation of our disclosure controls and procedures (as defined in Rule 13a-15(e) under the Securities Exchange Act of 1934, as amended (the Exchange Act)) as of June 30, 2017, the end of the period covered by this report. Based on that evaluation, our Chief Executive Officer and Chief Financial Officer concluded that our disclosure controls and procedures were effective as of June 30, 2017.
During the fiscal quarter ended June 30, 2017, there were no changes in our internal control over financial reporting (as defined in Rule 13a-15(f) under the Exchange Act) that have materially affected, or are reasonably likely to materially affect, our internal control over financial reporting.
PART II. OTHER INFORMATION
Item 1. Legal Proceedings
We are subject of various pending or threatened legal actions and proceedings in the ordinary course of our business. Such matters are subject to many uncertainties and to outcomes that are not predictable with assurance. We record a liability in our consolidated financial statements for costs related to claims, including future legal costs, settlements and judgments, where we have assessed that a loss is probable and an amount can be reasonably estimated. We believe the final resolution of currently pending or threatened legal actions and proceedings, either individually or in the aggregate, will not have a material adverse effect on our consolidated financial position, results of operations or cash flows, excluding any liability for RSG charges described in Note 9 to our consolidated financial statements for which an estimate cannot be made at this time.
Item 1A. Risk Factors
There has been no material change in the risk factors set forth under Part I, Item 1A, “Risk Factors” on pages 26 through 33 of our Annual Report on Form 10-K for the year ended December 31, 2016.
Item 2. Unregistered Sales of Equity Securities and Use of Proceeds
We do not have a publicly announced stock repurchase program. The following table shows common shares of the Company that were surrendered to us by employees to pay taxes in connection with shares issued for incentive awards in April 2017 under our 1999 and 2014 Stock Incentive Plans:
|
Calendar Month |
Total Number of Shares Purchased |
Average Price Paid per Share |
||||||
|
April 2017 |
1,070 | 38.075 | ||||||
|
May 2017 |
-- | -- | ||||||
|
June 2017 |
-- | -- | ||||||
|
Total |
1,070 | |||||||
Item 6. Exhibits
|
31.1 |
Certification of Chief Executive Officer Pursuant to Section 302 of the Sarbanes-Oxley Act of 2002. |
|
31.2 |
Certification of Chief Financial Officer Pursuant to Section 302 of the Sarbanes-Oxley Act of 2002. |
|
32.1 |
Certification of Chief Executive Officer Pursuant to Section 906 of the Sarbanes-Oxley Act of 2002. |
|
32.2 |
Certification of Chief Financial Officer Pursuant to Section 906 of the Sarbanes-Oxley Act of 2002. |
|
101 |
Financial statements from the Quarterly Report on Form 10-Q of Otter Tail Corporation for the quarter ended June 30, 2017, formatted in Extensible Business Reporting Language: (i) the Consolidated Balance Sheets, (ii) the Consolidated Statements of Income, (iii) the Consolidated Statements of Comprehensive Income, (iv) the Consolidated Statements of Cash Flows and (v) the Condensed Notes to Consolidated Financial Statements. |
SIGNATURES
Pursuant to the requirements of the Securities Exchange Act of 1934, the Registrant has duly caused this report to be signed on its behalf by the undersigned thereunto duly authorized.
OTTER TAIL CORPORATION
By: /s/ Kevin G. Moug
Kevin G. Moug
Chief Financial Officer and Senior Vice President
(Chief Financial Officer/Authorized Officer)
Dated: August 9, 2017
EXHIBIT INDEX
Exhibit Number Description
|
31.1 |
Certification of Chief Executive Officer Pursuant to Section 302 of the Sarbanes-Oxley Act of 2002. |
|
31.2 |
Certification of Chief Financial Officer Pursuant to Section 302 of the Sarbanes-Oxley Act of 2002. |
|
32.1 |
Certification of Chief Executive Officer Pursuant to Section 906 of the Sarbanes-Oxley Act of 2002. |
|
32.2 |
Certification of Chief Financial Officer Pursuant to Section 906 of the Sarbanes-Oxley Act of 2002. |
|
101 |
Financial statements from the Quarterly Report on Form 10-Q of Otter Tail Corporation for the quarter ended June 30, 2017, formatted in Extensible Business Reporting Language: (i) the Consolidated Balance Sheets, (ii) the Consolidated Statements of Income, (iii) the Consolidated Statements of Comprehensive Income, (iv) the Consolidated Statements of Cash Flows and (v) the Condensed Notes to Consolidated Financial Statements. |