Attached files
| file | filename |
|---|---|
| 8-K - 8-K - FRANKLIN ELECTRIC CO INC | a20141111baird8-k.htm |

Baird Industrial Conference November 11, 2014

Safe Harbor Statement "Safe Harbor” Statement under the Private Securities Litigation Reform Act of 1995. Any forward-looking statements contained herein, including those relating to market conditions or the Company’s financial results, costs, expenses or expense reductions, profit margins, inventory levels, foreign currency translation rates, liquidity expectations, business goals and sales growth, involve risks and uncertainties, including but not limited to, risks and uncertainties with respect to general economic and currency conditions, various conditions specific to the Company’s business and industry, weather conditions, new housing starts, market demand, competitive factors, changes in distribution channels, supply constraints, effect of price increases, raw material costs, technology factors, integration of acquisitions, litigation, government and regulatory actions, the Company’s accounting policies, future trends, and other risks which are detailed in the Company’s Securities and Exchange Commission filings, included in Item 1A of Part I of the Company’s Annual Report on Form 10-K/A for the fiscal year ending December 28, 2013, Exhibit 99.1 attached thereto and in Item 1A of Part II of the Company’s Quarterly Reports on Form 10-Q. These risks and uncertainties may cause actual results to differ materially from those indicated by the forward-looking statements. All forward-looking statements made herein are based on information currently available, and the Company assumes no obligation to update any forward-looking statements. 2

Topics Financial Overview --- Strategy Overview Water Systems Fueling Systems Acquisitions 3

2010-2014 Sales History $0 $200 $300 $400 $500 $600 $700 $100 $1,000 $891 M 2012 $900 $800 2010 $714 M 2011 $821 M 4 $965 M 2013 $1,024 M 2014 LTM

2010-2014 Operating Income(1) History 1 After non-GAAP adjustments – See 10Q For reconciliation $0 $50 $75 $100 $25 $125 $114.9 M 2012 2010 $72.4 M 2011 $95.7 M 5 $127.4 M 2013 $128.9 M 2014 LTM
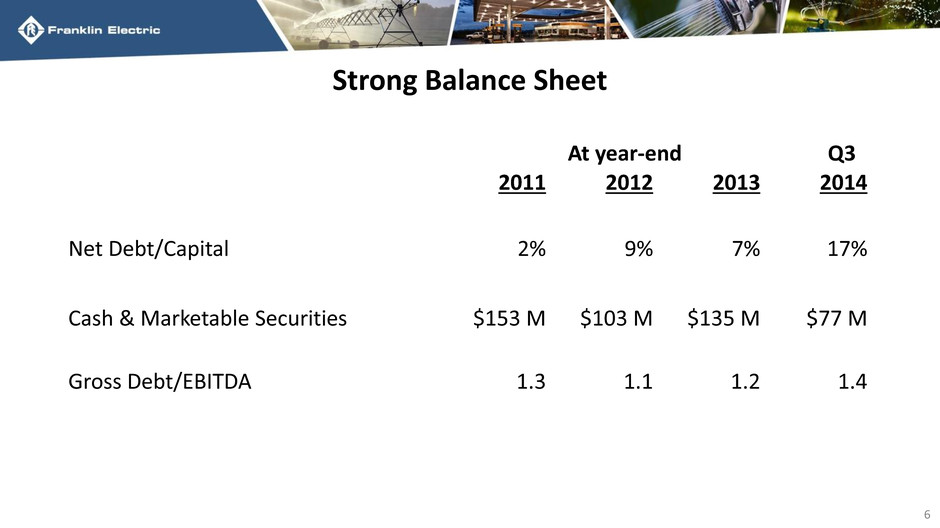
Strong Balance Sheet 6 At year-end Q3 2011 2012 2013 2014 Net Debt/Capital 2% 9% 7% 17% Cash & Marketable Securities $153 M $103 M $135 M $77 M Gross Debt/EBITDA 1.3 1.1 1.2 1.4

$0 1993 $0.10 $0.15 $0.20 $0.25 $0.30 $0.05 1994 1995 1996 1997 1998 1999 2000 2002 2009 2003 2004 2005 2006 2007 2008 2010 2001 2011 2012 2013 $0.35 2014 7 22 Consecutive Annual Dividend Payment Increases

9 mos. YTD 2014 % +(-) Prior Year Sales $794 + 8% EPS(1) $1.45 + 1% ROIC(2) 17.3% - 2.2% (1) After non-GAAP adjustments – see 10-K for reconciliation to GAAP EPS (2) ROIC LTM operating income after non-GAAP adjustments ÷ (net debt + equity) 8 2014 Sales & Earnings Growth
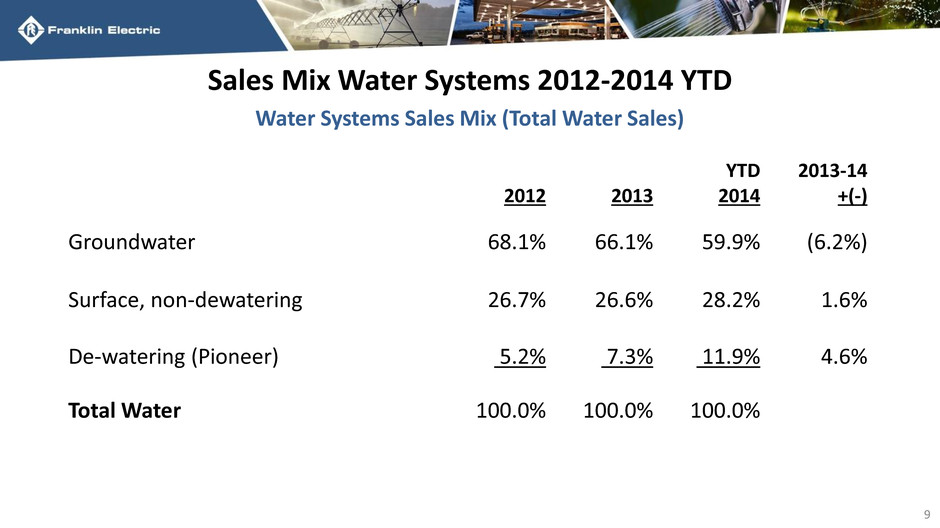
Sales Mix Water Systems 2012-2014 YTD Water Systems Sales Mix (Total Water Sales) 2012 2013 YTD 2014 2013-14 +(-) Groundwater 68.1% 66.1% 59.9% (6.2%) Surface, non-dewatering 26.7% 26.6% 28.2% 1.6% De-watering (Pioneer) 5.2% 7.3% 11.9% 4.6% Total Water 100.0% 100.0% 100.0% 9

10 Pioneer Margins

Drought Map – 2013-14 Comparison 11

Distributor Reset 12

Distributor Reset 13

Strategy 14

Water Systems 79% Fueling Systems 21% 15 2014 Q3 YTD Net Sales Business Segments
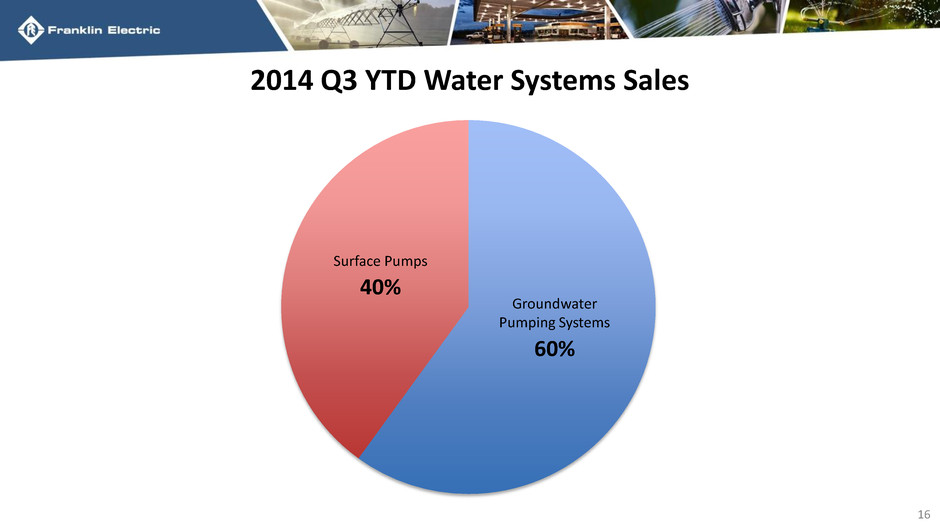
Groundwater Pumping Systems 60% Surface Pumps 40% 16 2014 Q3 YTD Water Systems Sales
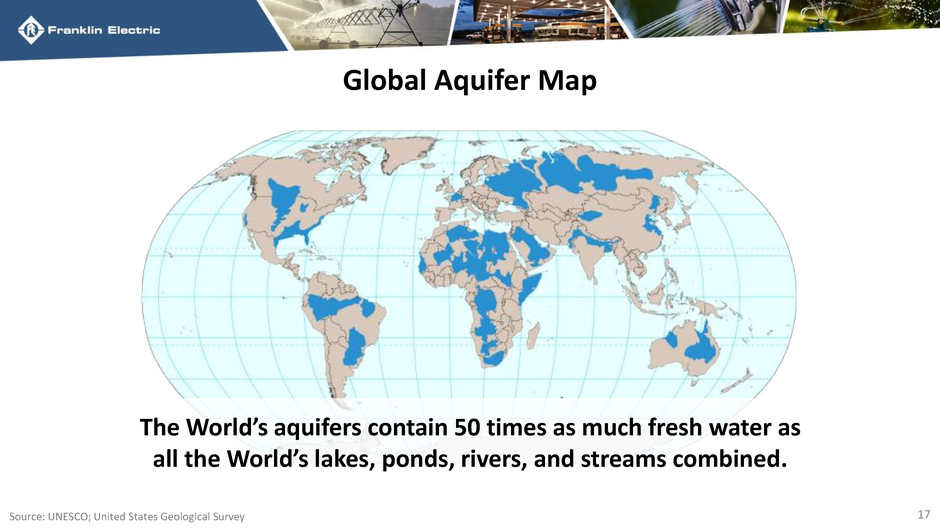
The World’s aquifers contain 50 times as much fresh water as all the World’s lakes, ponds, rivers, and streams combined. 17 Global Aquifer Map Source: UNESCO; United States Geological Survey

United States 47% Developed Non-US 14% Developing Regions 39% 2010-13 Developed World CAGR 9.3% 2010-13 Developing World CAGR 13.6% 18 2014 Q3 YTD Water Systems Sales

$21.3 $35.9 $17.7 Year Prior to Acquisition (at 2014 FX) $38.1 $76.7 $44.7 2014 19 Global Expansion – Platform Acquisitions FOCUS ON INDIA

20 Global Expansion – Distribution Bombas Leão Pluga

Irrigation & Industrial Groundwater Pumping Systems 27% Residential Groundwater Pumping Systems 33% Residential Surface Pumps 15% Irrigation & Industrial Surface Pumps 25% 21 2014 Q3 YTD Water Systems Sales

Irrigation & Industrial Groundwater Pumping Systems 27% Residential Groundwater Pumping Systems 33% Residential Surface Pumps 15% Irrigation & Industrial Surface Pumps 25% #2 Global Supplier to residential water pumping systems distribution channel #1 Global supplier to agricultural irrigation pumping systems distribution channel Non Discretionary Replacement Purchases Represent +80% of Sales 22 *Management estimates 2014 Q3 YTD Water Systems Sales

CONCEPT MODELING SIMULATION 200 250 300 350 0 500 1000 H ea d (Ft ) Flow (GPM RESULTS TESTING PROTOTYPE OPTIMIZE GEOMETRY 23 Product Development Process
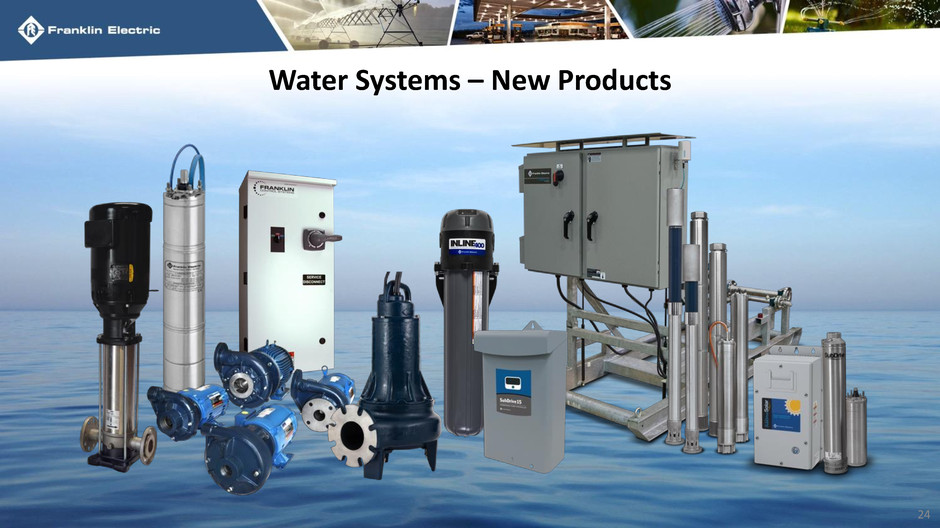
24 Water Systems – New Products

• Leading supplier of drives and controls for low horsepower groundwater pumping applications • Cerus acquisition (FCS) – technology leader in higher horsepower fluid transfer applications • Sell FCS drives and controls with Franklin high horsepower pumps and motors • Doubles revenue per installation SUBMERSIBLE PUMPS WASTEWATER SURFACE PUMPS VERTICAL MULTISTAGE 25 Water Systems – Drives & Controls

Present Motor Eff. New 6” Motor – Unique High Efficiency Design 26 Water Systems – High Efficiency

27 Water Systems – Solar

Oil and Gas Deliquification 28

29

Fuel Management Systems #2 Global Supplier Vapor Recovery Systems #1 Global Supplier Piping & Containment Systems #1 Global Supplier Pumping Systems #1 Global Supplier Fueling Systems 30

Fueling Systems – Growth Through Acquisitions 2010 Acquisitions 55% Organic 45% GROWTH 2002 2000 2004 2006 2012 31
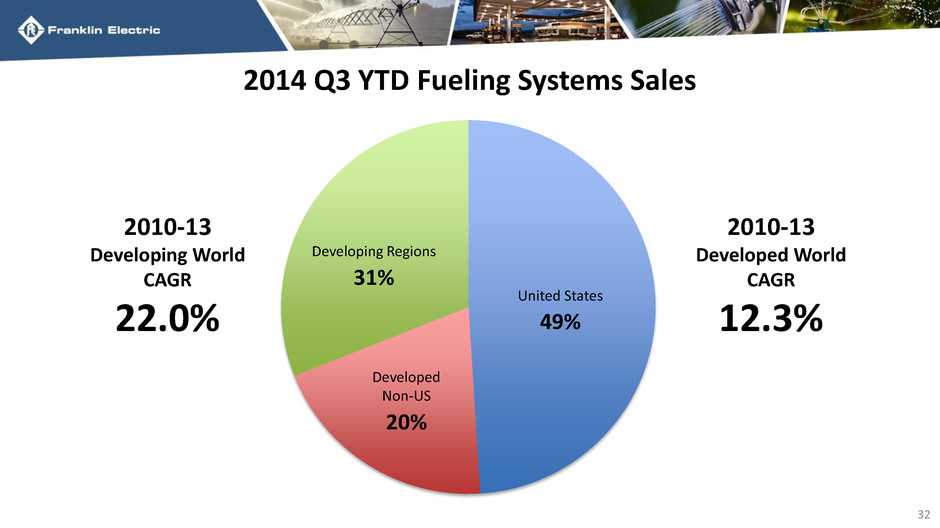
United States 49% Developed Non-US 20% Developing Regions 31% 2010-13 Developed World CAGR 12.3% 2010-13 Developing World CAGR 22.0% 32 2014 Q3 YTD Fueling Systems Sales
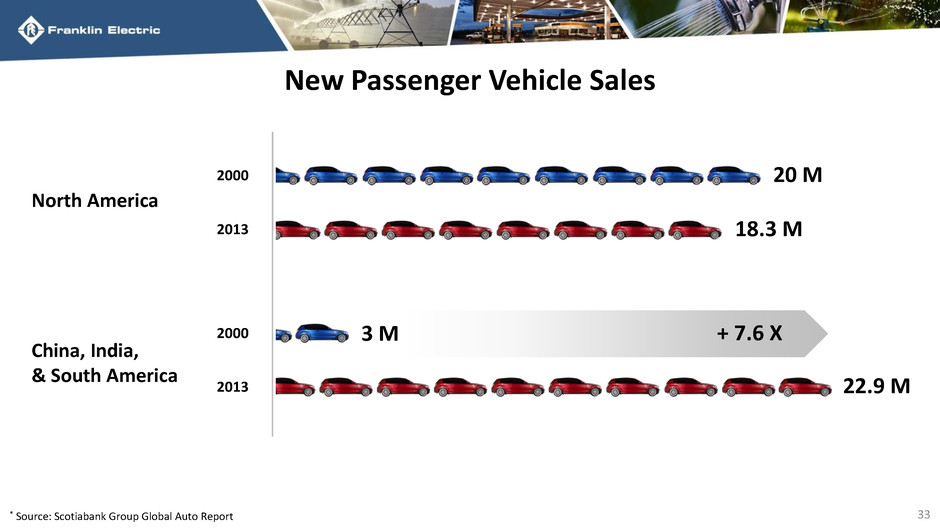
New Passenger Vehicle Sales 33 * Source: Scotiabank Group Global Auto Report 2000 2013 2000 2013 North America China, India, & South America + 7.6 X 20 M 18.3 M 3 M 22.9 M
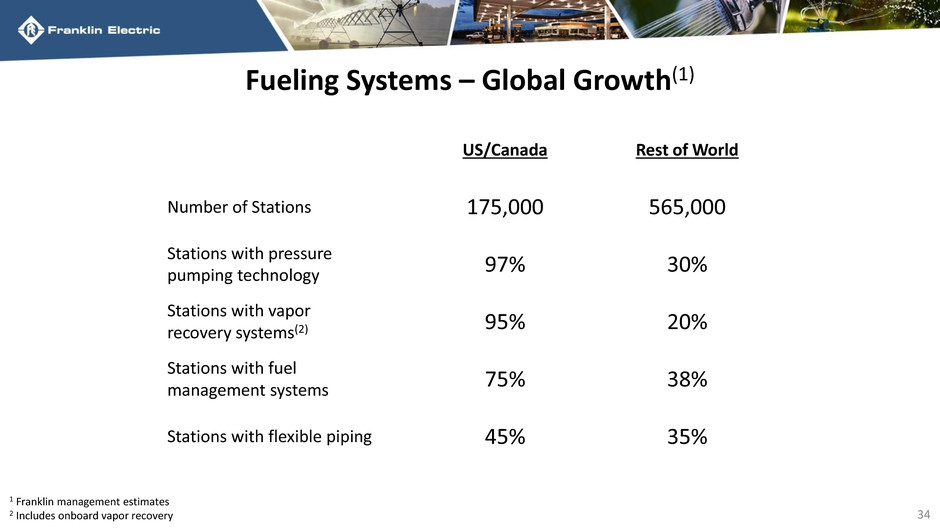
Fueling Systems – Global Growth(1) US/Canada Rest of World Number of Stations 175,000 565,000 Stations with pressure pumping technology 97% 30% Stations with vapor recovery systems(2) 95% 20% Stations with fuel management systems 75% 38% Stations with flexible piping 45% 35% 1 Franklin management estimates 2 Includes onboard vapor recovery 34

Fueling Systems – New Products 35

Fueling Systems – New Product Development Addressing the Needs of both Developed and Developing Markets 36

Acquisitions • Fragmented Global Markets – Bolt-on Acquisition Opportunities • Franklin Acquisition Profile (Past 10 Years) – Acquisitions per Year ~ 2 – Purchase Price – $1-125 M (Avg. $30 M) – Average EBITDA Multiple ~ 7.5 X 37

Baird Industrial Conference November 11, 2014
