Attached files
| file | filename |
|---|---|
| EX-99.1 - EARNINGS RELEASE - SOUTHERN Co GAS | exhibit_99-1.htm |
| 8-K - FORM 8-K - SOUTHERN Co GAS | form_8-k.htm |
Third Quarter 2014 Earnings Presentation November 10, 2014
Cautionary Statements & Supplemental Information Forward-Looking Statements This presentation contains forward-looking statements. Senior officers and other employees also may make statements to analysts, investors, regulators, the media and others that are forward-looking. Forward-looking statements include matters that are not historical facts, such as statements regarding our future operations, prospects, strategies, financial condition, economic performance (including growth and earnings), industry conditions and demand for our products and services. Because these statements involve anticipated events or conditions, forward-looking statements often include words such as "anticipate," "assume," "believe," "can," "could," "estimate," "expect," "forecast," "future," "goal," "indicate," "intend," "may," "outlook," "plan," "potential," "predict," "project," "seek," "should," "target," "would," or similar expressions. Forward-looking statements contained in this presentation include, without limitation, statements regarding regulatory filings and approvals, amounts and timing of collections under our infrastructure programs and impact on future periods, access to capital, debt repayment, performance expectations for the full year and growth potential in future periods, priorities for 2014 and 2014 earnings guidance and related expectations and assumptions. Our expectations are not guarantees and are based on currently available competitive, financial and economic data along with our operating plans. While we believe our expectations are reasonable in view of the currently available information, our expectations are subject to future events, risks and uncertainties, and there are several factors - many beyond our control - that could cause results to differ materially from our expectations. Actual results may differ materially from those suggested by the forward-looking statements for a number of reasons including, but not limited to, changes in price, supply and demand for natural gas and related products; the impact of changes in state and federal legislation and regulation, including changes related to climate change; actions taken by government agencies on rates and other matters, including regulatory approval of new partnerships and infrastructure programs; impact of any material weakness on our internal control over financial reporting; concentration of credit risk; utility and energy industry consolidation; the impact on cost and timeliness of construction projects by government and other approvals; development project delays; adequacy of supply of diversified vendors; unexpected change in project costs, including the cost of funds to finance these projects; the impact of acquisitions and divestitures; limits on natural gas pipeline capacity; direct or indirect effects on our business, financial condition or liquidity resulting from a change in our credit ratings or the credit ratings of our counterparties or competitors; interest rate fluctuations; financial market conditions, including disruptions in the capital markets and lending environment and the current economic uncertainty; general economic conditions; uncertainties about environmental issues and the related impact of such issues, including our environmental remediation plans; the impact of changes in weather, including climate change, on the temperature-sensitive portions of our business; the impact of natural disasters such as hurricanes on the supply and price of natural gas; the outcome of litigation; acts of war or terrorism; and other factors which are provided in detail in our filings with the Securities and Exchange Commission. Forward-looking statements are only as of the date they are made, and we disclaim any obligation to update these statements to reflect subsequent changes, except as required by law. Supplemental Information Company management evaluates segment financial performance based on operating margin and earnings before interest and taxes (EBIT), which include the effects of corporate expense allocations. The company believes EBIT is a useful measurement of its performance because it provides information that can be used to evaluate the effectiveness of its businesses from an operational perspective, exclusive of the costs to finance those activities and exclusive of income taxes, neither of which is directly relevant to the efficiency of those operations. Further, management calculates “economic earnings” in relation to EBIT reported on a GAAP basis for the wholesale services segment in order to assess and evaluate earnings generated during the year. The company believes economic earnings is a useful measurement of the wholesale services’ segment as it provides information excluding the volatility effects resulting from mark-to-market, LOCOM accounting adjustments and gains or losses from dispositions recorded during the prior period, as well as the offset of mark-to-market gains or losses reported in prior periods. Operating margin is a non-GAAP measure calculated as operating revenues minus cost of goods sold and revenue taxes, excluding operation and maintenance expense, depreciation and amortization, certain taxes other than income taxes, and gains or losses on the sale of assets, if any. These items are included in the company's calculation of operating income. The company believes operating margin is a better indicator than operating revenues of the contribution resulting from customer growth, since cost of gas and revenue taxes are generally passed directly through to customers. In addition, we use a non-GAAP measure of adjusted earnings per share (EPS) that excludes the impacts of our wholesale services segment and our discontinued operations. The company believes presenting EPS excluding wholesale services provides investors with an additional measure of operating performance excluding the volatility effects resulting from mark-to-market and LOCOM accounting adjustments in the wholesale services segment. In addition, income (loss) related to the sale of Tropical Shipping are reflected as discontinued operations, and the company believes excluding the impacts of discontinued operations provides a more accurate view of earnings from continuing operations. Operating margin and adjusted EPS should not be considered as alternatives to, or more meaningful indicators of, the company's operating performance than net income attributable to AGL Resources Inc., operating income or EPS as determined in accordance with GAAP. In addition, the company's operating margin and adjusted EPS may not be comparable to similarly titled measures of another company. Reconciliations of non-GAAP financial measures referenced in this presentation are attached as an exhibit to this presentation and also are available on the company’s website at www.aglresources.com under the Investor Relations section. *
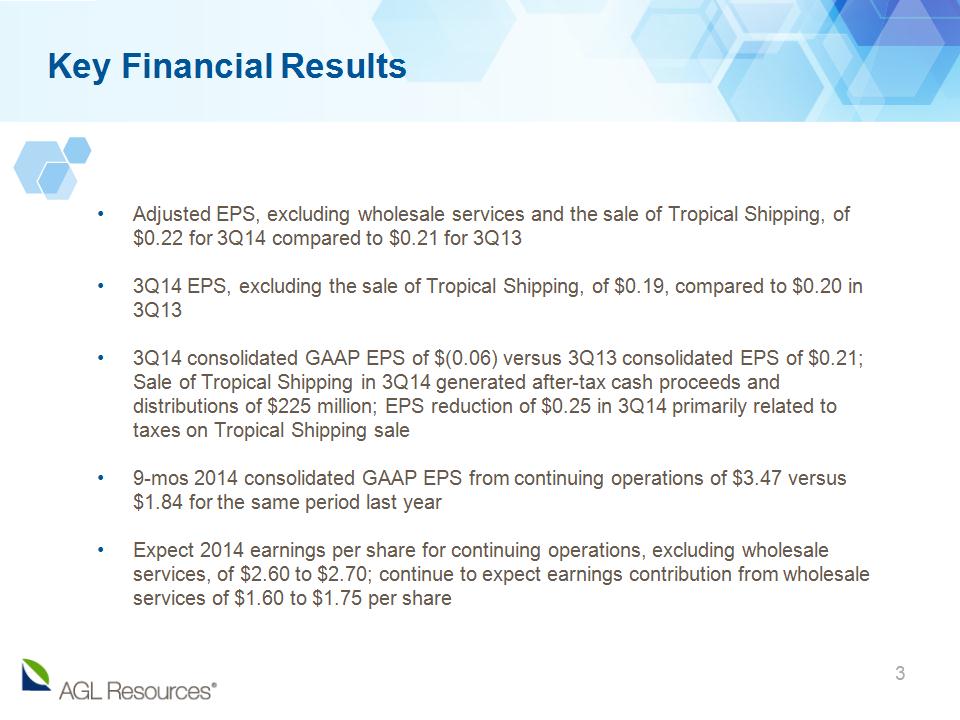
Adjusted EPS, excluding wholesale services and the sale of Tropical Shipping, of $0.22 for 3Q14 compared to $0.21 for 3Q13 3Q14 EPS, excluding the sale of Tropical Shipping, of $0.19, compared to $0.20 in 3Q13 3Q14 consolidated GAAP EPS of $(0.06) versus 3Q13 consolidated EPS of $0.21; Sale of Tropical Shipping in 3Q14 generated after-tax cash proceeds and distributions of $225 million; EPS reduction of $0.25 in 3Q14 primarily related to taxes on Tropical Shipping sale 9-mos 2014 consolidated GAAP EPS from continuing operations of $3.47 versus $1.84 for the same period last year Expect 2014 earnings per share for continuing operations, excluding wholesale services, of $2.60 to $2.70; continue to expect earnings contribution from wholesale services of $1.60 to $1.75 per share Key Financial Results *
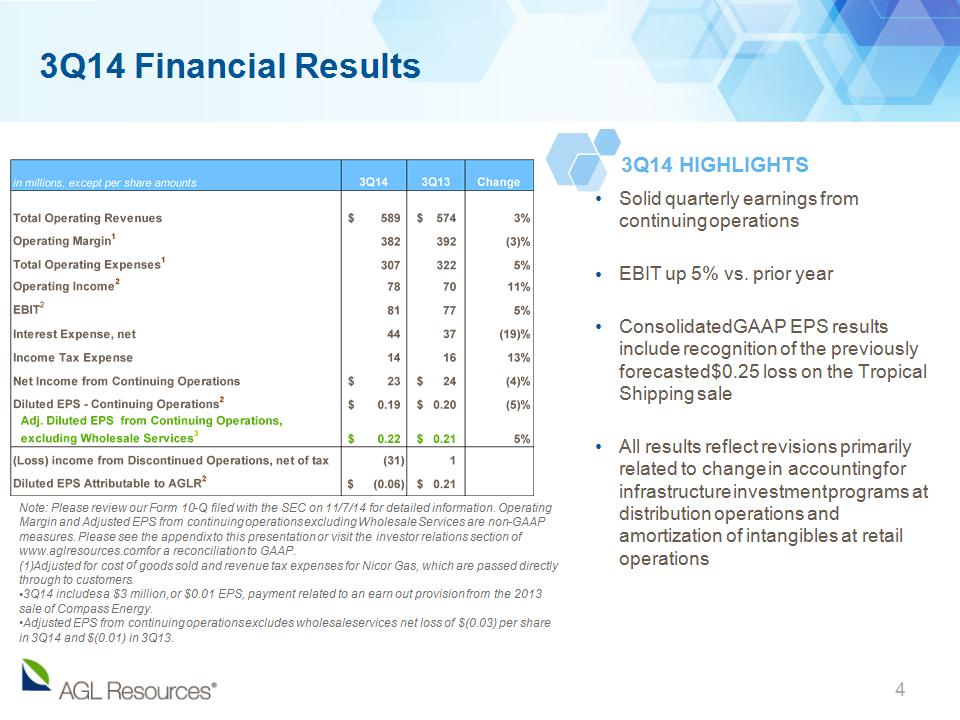
3Q14 Financial Results * Note: Please review our Form 10-Q filed with the SEC on 11/7/14 for detailed information. Operating Margin and Adjusted EPS from continuing operations excluding Wholesale Services are non-GAAP measures. Please see the appendix to this presentation or visit the investor relations section of www.aglresources.com for a reconciliation to GAAP. Adjusted for cost of goods sold and revenue tax expenses for Nicor Gas, which are passed directly through to customers. 3Q14 includes a $3 million, or $0.01 EPS, payment related to an earn out provision from the 2013 sale of Compass Energy. Adjusted EPS from continuing operations excludes wholesale services net loss of $(0.03) per share in 3Q14 and $(0.01) in 3Q13. Solid quarterly earnings from continuing operations EBIT up 5% vs. prior year Consolidated GAAP EPS results include recognition of the previously forecasted $0.25 loss on the Tropical Shipping sale All results reflect revisions primarily related to change in accounting for infrastructure investment programs at distribution operations and amortization of intangibles at retail operations 3Q14 HIGHLIGHTS
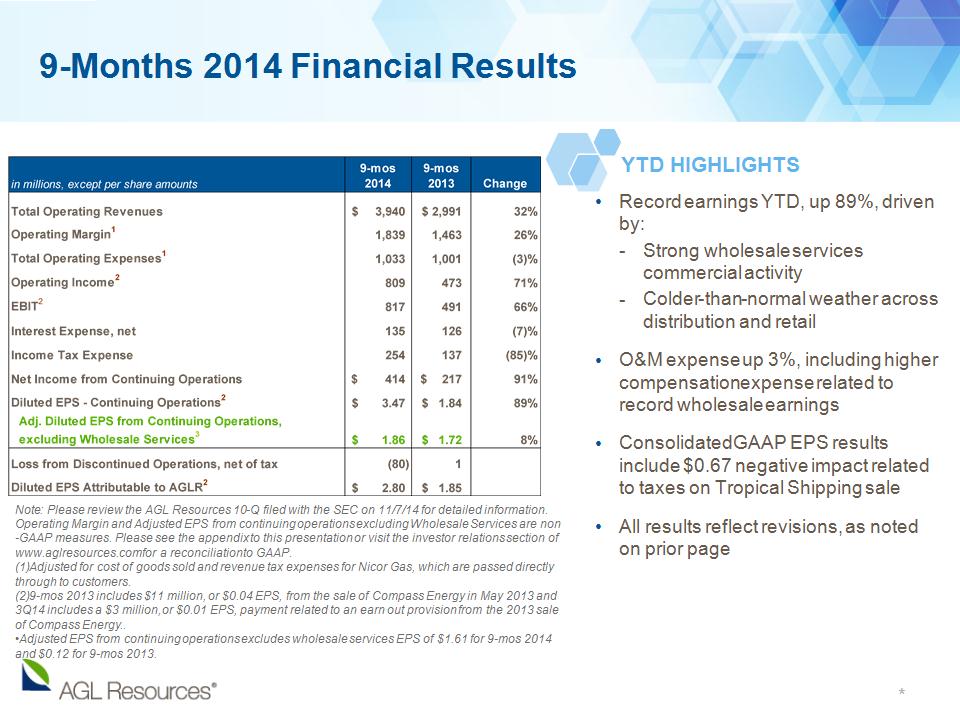
9-Months 2014 Financial Results * Note: Please review the AGL Resources 10-Q filed with the SEC on 11/7/14 for detailed information. Operating Margin and Adjusted EPS from continuing operations excluding Wholesale Services are non-GAAP measures. Please see the appendix to this presentation or visit the investor relations section of www.aglresources.com for a reconciliation to GAAP. Adjusted for cost of goods sold and revenue tax expenses for Nicor Gas, which are passed directly through to customers. 9-mos 2013 includes $11 million, or $0.04 EPS, from the sale of Compass Energy in May 2013 and 3Q14 includes a $3 million, or $0.01 EPS, payment related to an earn out provision from the 2013 sale of Compass Energy.. Adjusted EPS from continuing operations excludes wholesale services EPS of $1.61 for 9-mos 2014 and $0.12 for 9-mos 2013. Record earnings YTD, up 89%, driven by: Strong wholesale services commercial activity Colder-than-normal weather across distribution and retail O&M expense up 3%, including higher compensation expense related to record wholesale earnings Consolidated GAAP EPS results include $0.67 negative impact related to taxes on Tropical Shipping sale All results reflect revisions, as noted on prior page YTD HIGHLIGHTS
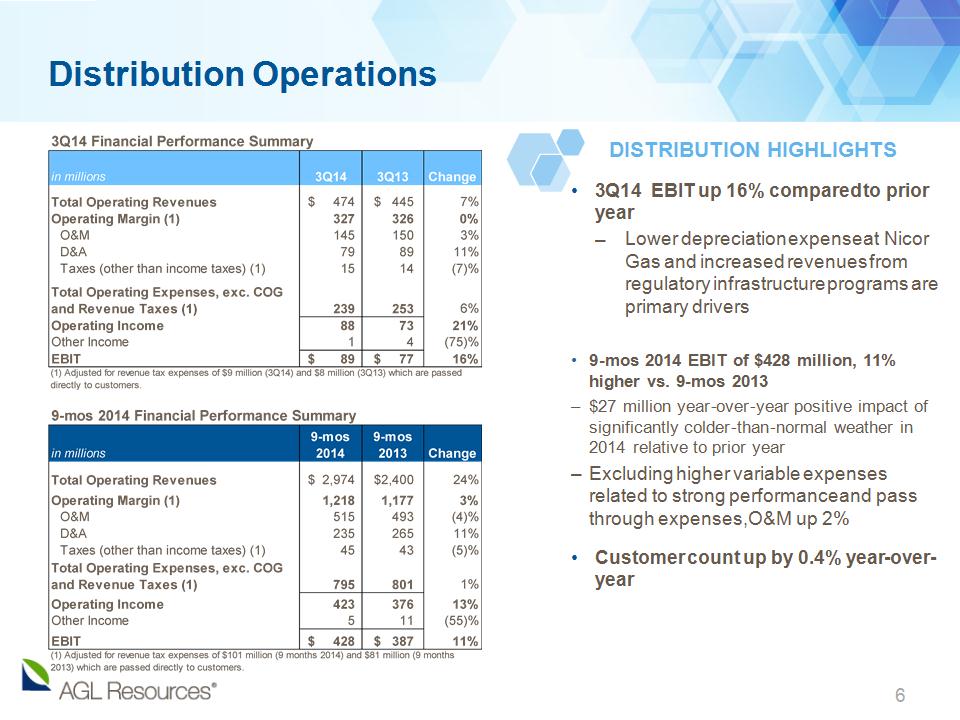
3Q14 EBIT up 16% compared to prior year Lower depreciation expense at Nicor Gas and increased revenues from regulatory infrastructure programs are primary drivers 9-mos 2014 EBIT of $428 million, 11% higher vs. 9-mos 2013 $27 million year-over-year positive impact of significantly colder-than-normal weather in 2014 relative to prior year Excluding higher variable expenses related to strong performance and pass through expenses, O&M up 2% Customer count up by 0.4% year-over-year Distribution Operations * DISTRIBUTION HIGHLIGHTS
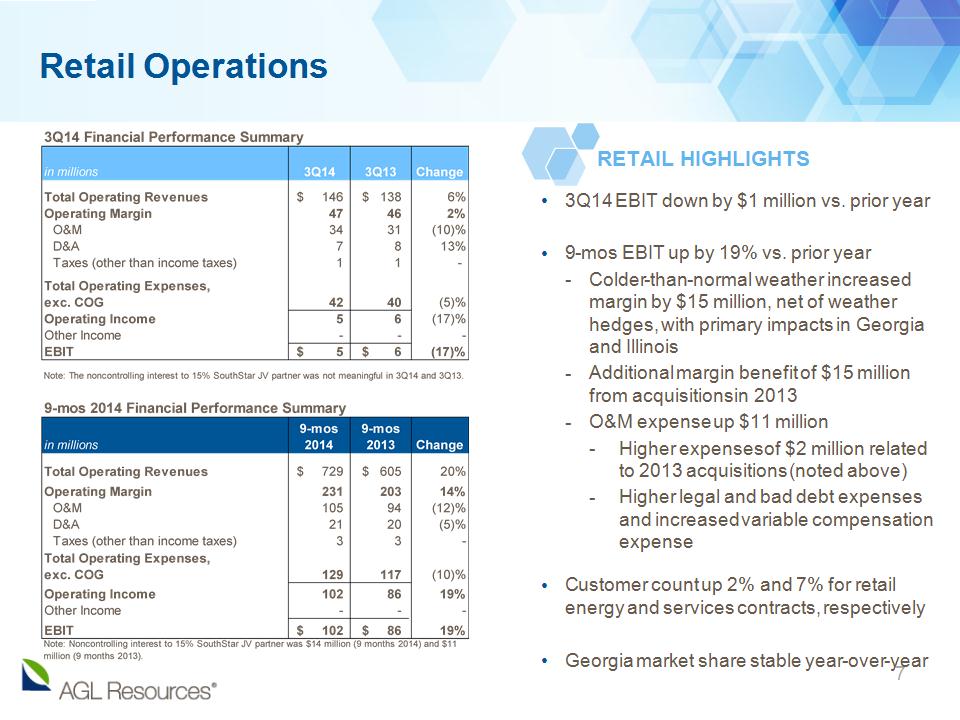
Retail Operations * 3Q14 EBIT down by $1 million vs. prior year 9-mos EBIT up by 19% vs. prior year Colder-than-normal weather increased margin by $15 million, net of weather hedges, with primary impacts in Georgia and Illinois Additional margin benefit of $15 million from acquisitions in 2013 O&M expense up $11 million Higher expenses of $2 million related to 2013 acquisitions (noted above) Higher legal and bad debt expenses and increased variable compensation expense Customer count up 2% and 7% for retail energy and services contracts, respectively Georgia market share stable year-over-year RETAIL HIGHLIGHTS
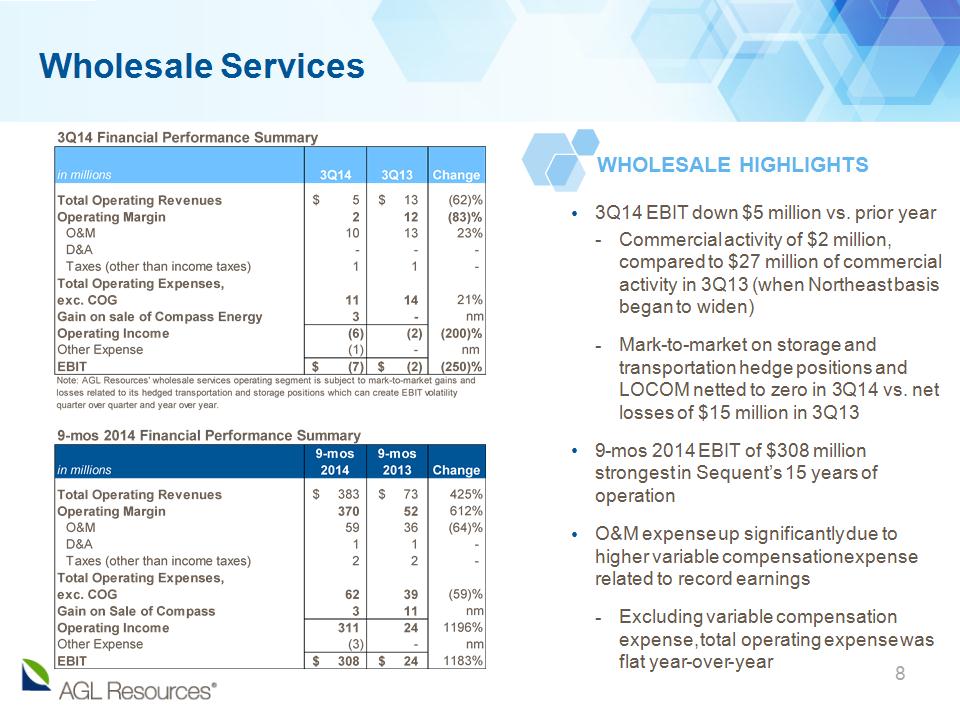
Wholesale Services * 3Q14 EBIT down $5 million vs. prior year Commercial activity of $2 million, compared to $27 million of commercial activity in 3Q13 (when Northeast basis began to widen) Mark-to-market on storage and transportation hedge positions and LOCOM netted to zero in 3Q14 vs. net losses of $15 million in 3Q13 9-mos 2014 EBIT of $308 million strongest in Sequent’s 15 years of operation O&M expense up significantly due to higher variable compensation expense related to record earnings Excluding variable compensation expense, total operating expense was flat year-over-year WHOLESALE HIGHLIGHTS
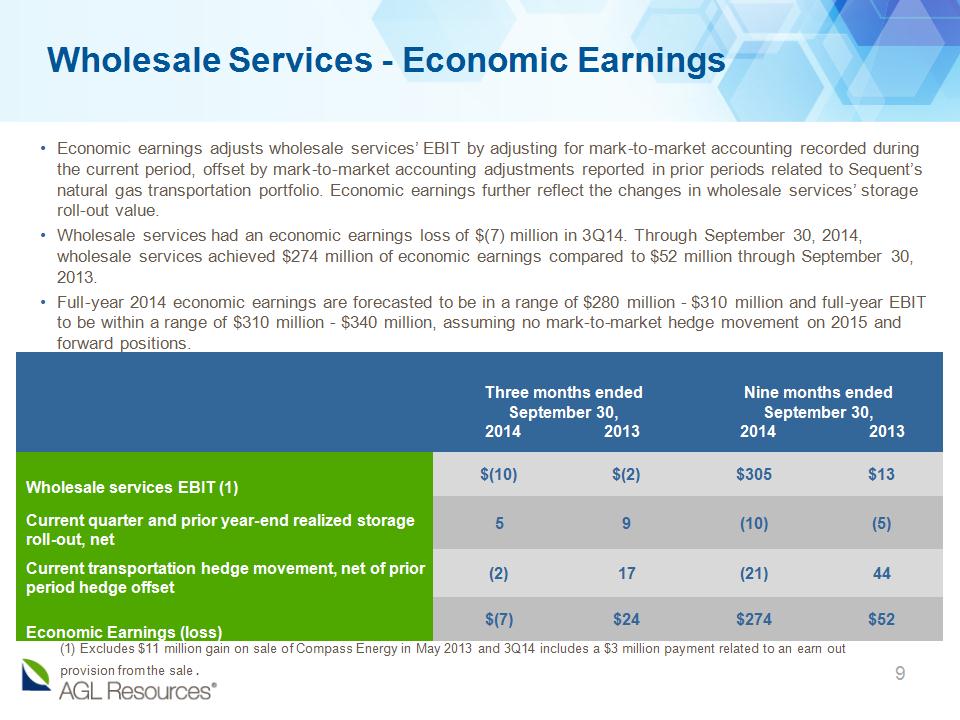
Three months ended September 30, Three months ended September 30, Wholesale services EBIT (1) $(10) $(2) Current quarter and prior year-end realized storage roll-out, net 5 9 Current transportation hedge movement, net of prior period hedge offset (2) 17 Economic Earnings (loss) $(7) $24 Economic earnings adjusts wholesale services’ EBIT by adjusting for mark-to-market accounting recorded during the current period, offset by mark-to-market accounting adjustments reported in prior periods related to Sequent’s natural gas transportation portfolio. Economic earnings further reflect the changes in wholesale services’ storage roll-out value. Wholesale services had an economic earnings loss of $(7) million in 3Q14. Through September 30, 2014, wholesale services achieved $274 million of economic earnings compared to $52 million through September 30, 2013. Full-year 2014 economic earnings are forecasted to be in a range of $280 million - $310 million and full-year EBIT to be within a range of $310 million - $340 million, assuming no mark-to-market hedge movement on 2015 and forward positions. Wholesale Services – Economic Earnings 2014 2013 * Nine months ended September 30, Nine months ended September 30, $305 $13 (10) (5) (21) 44 $274 $52 2014 2014 2013 2013 (1) Excludes $11 million gain on sale of Compass Energy in May 2013 and 3Q14 includes a $3 million payment related to an earn out provision from the sale.
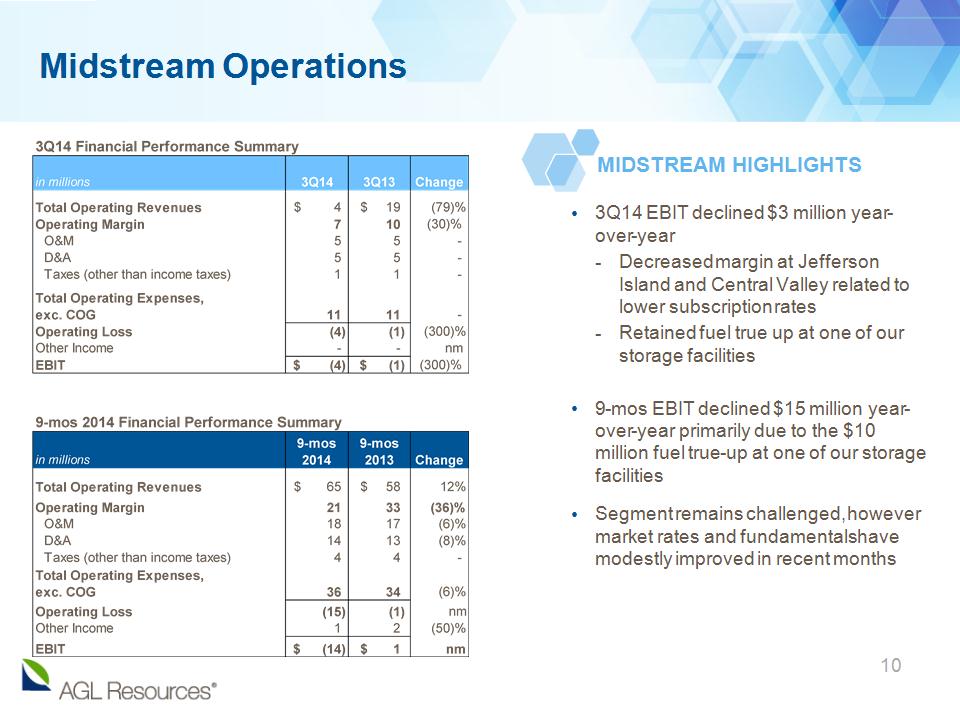
Midstream Operations * 3Q14 EBIT declined $3 million year-over-year Decreased margin at Jefferson Island and Central Valley related to lower subscription rates Retained fuel true up at one of our storage facilities 9-mos EBIT declined $15 million year-over-year primarily due to the $10 million fuel true-up at one of our storage facilities Segment remains challenged, however market rates and fundamentals have modestly improved in recent months MIDSTREAM HIGHLIGHTS
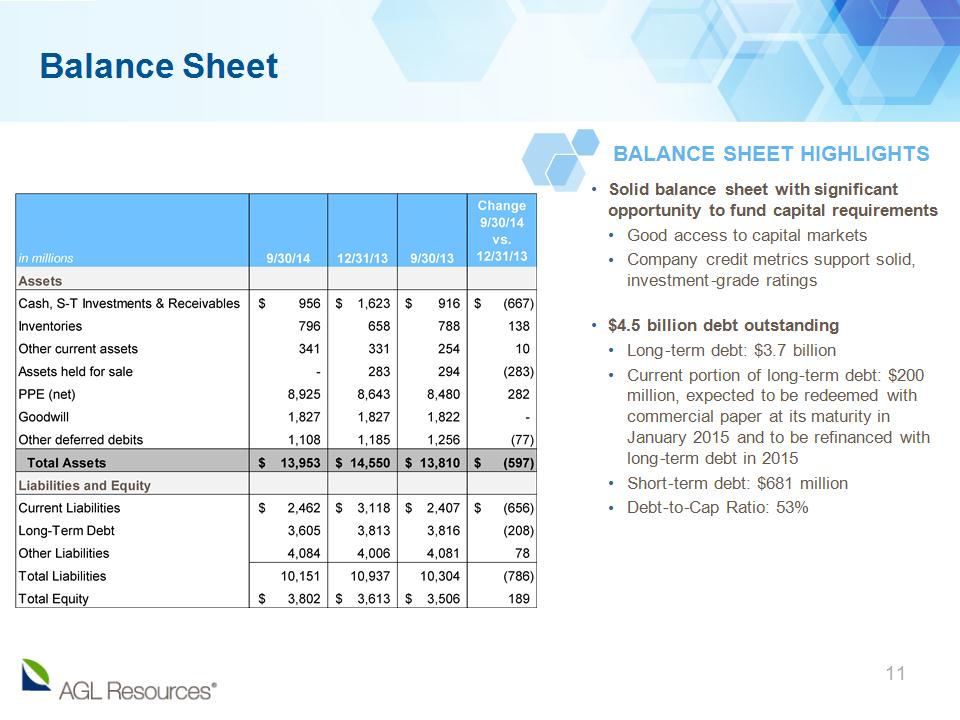
Balance Sheet * Solid balance sheet with significant opportunity to fund capital requirements Good access to capital markets Company credit metrics support solid, investment-grade ratings $4.5 billion debt outstanding Long-term debt: $3.7 billion Current portion of long-term debt: $200 million, expected to be redeemed with commercial paper at its maturity in January 2015 and to be refinanced with long-term debt in 2015 Short-term debt: $681 million Debt-to-Cap Ratio: 53% BALANCE SHEET HIGHLIGHTS
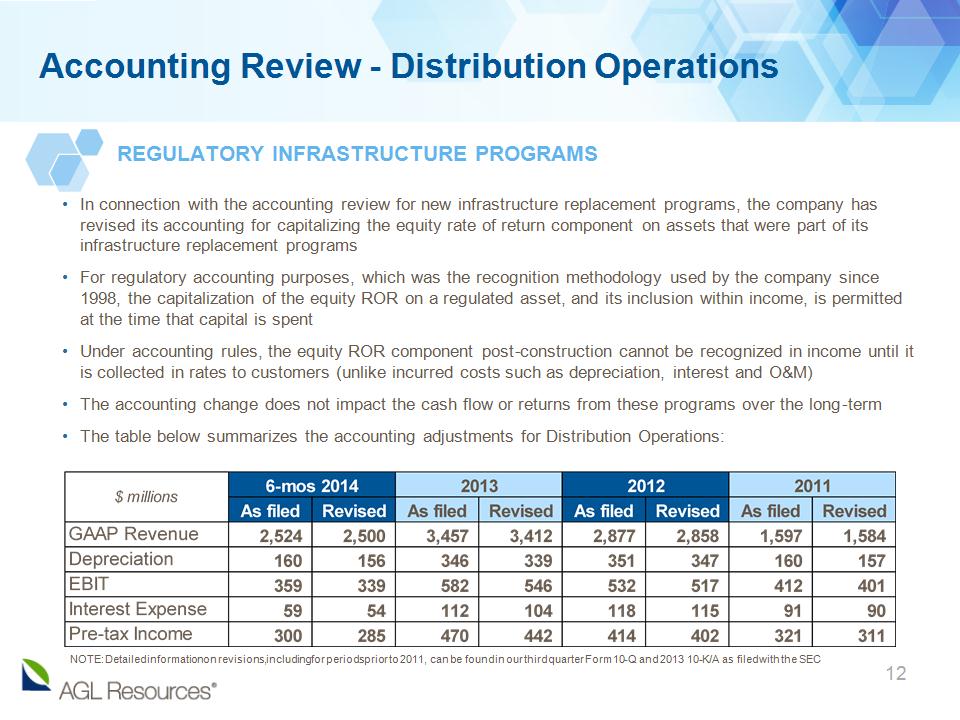
Accounting Review – Distribution Operations * In connection with the accounting review for new infrastructure replacement programs, the company has revised its accounting for capitalizing the equity rate of return component on assets that were part of its infrastructure replacement programs For regulatory accounting purposes, which was the recognition methodology used by the company since 1998, the capitalization of the equity ROR on a regulated asset, and its inclusion within income, is permitted at the time that capital is spent Under accounting rules, the equity ROR component post-construction cannot be recognized in income until it is collected in rates to customers (unlike incurred costs such as depreciation, interest and O&M) The accounting change does not impact the cash flow or returns from these programs over the long-term The table below summarizes the accounting adjustments for Distribution Operations: REGULATORY INFRASTRUCTURE PROGRAMS NOTE: Detailed information on revisions, including for periods prior to 2011, can be found in our third quarter Form 10-Q and 2013 10-K/A as filed with the SEC
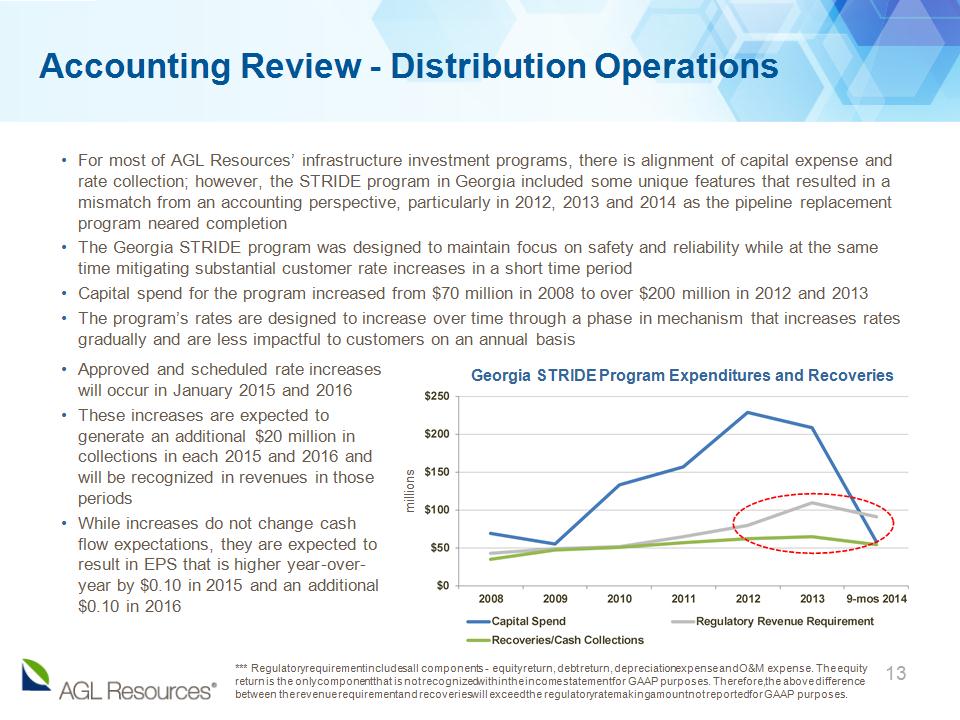
Approved and scheduled rate increases will occur in January 2015 and 2016 These increases are expected to generate an additional $20 million in collections in each 2015 and 2016 and will be recognized in revenues in those periods While increases do not change cash flow expectations, they are expected to result in EPS that is higher year-over-year by $0.10 in 2015 and an additional $0.10 in 2016 Accounting Review – Distribution Operations For most of AGL Resources’ infrastructure investment programs, there is alignment of capital expense and rate collection; however, the STRIDE program in Georgia included some unique features that resulted in a mismatch from an accounting perspective, particularly in 2012, 2013 and 2014 as the pipeline replacement program neared completion The Georgia STRIDE program was designed to maintain focus on safety and reliability while at the same time mitigating substantial customer rate increases in a short time period Capital spend for the program increased from $70 million in 2008 to over $200 million in 2012 and 2013 The program’s rates are designed to increase over time through a phase in mechanism that increases rates gradually and are less impactful to customers on an annual basis Georgia STRIDE Program Expenditures and Recoveries millions * *** Regulatory requirement includes all components - equity return, debt return, depreciation expense and O&M expense. The equity return is the only component that is not recognized within the income statement for GAAP purposes. Therefore, the above difference between the revenue requirement and recoveries will exceed the regulatory ratemaking amount not reported for GAAP purposes.
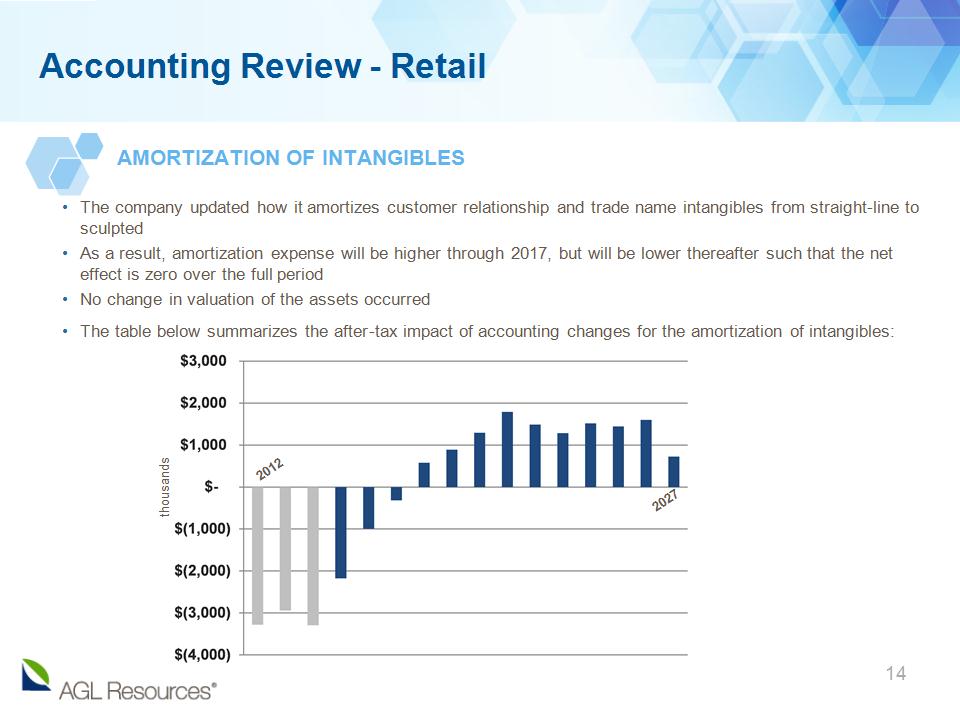
Accounting Review - Retail * The company updated how it amortizes customer relationship and trade name intangibles from straight-line to sculpted As a result, amortization expense will be higher through 2017, but will be lower thereafter such that the net effect is zero over the full period No change in valuation of the assets occurred The table below summarizes the after-tax impact of accounting changes for the amortization of intangibles: AMORTIZATION OF INTANGIBLES thousands 2012 2027
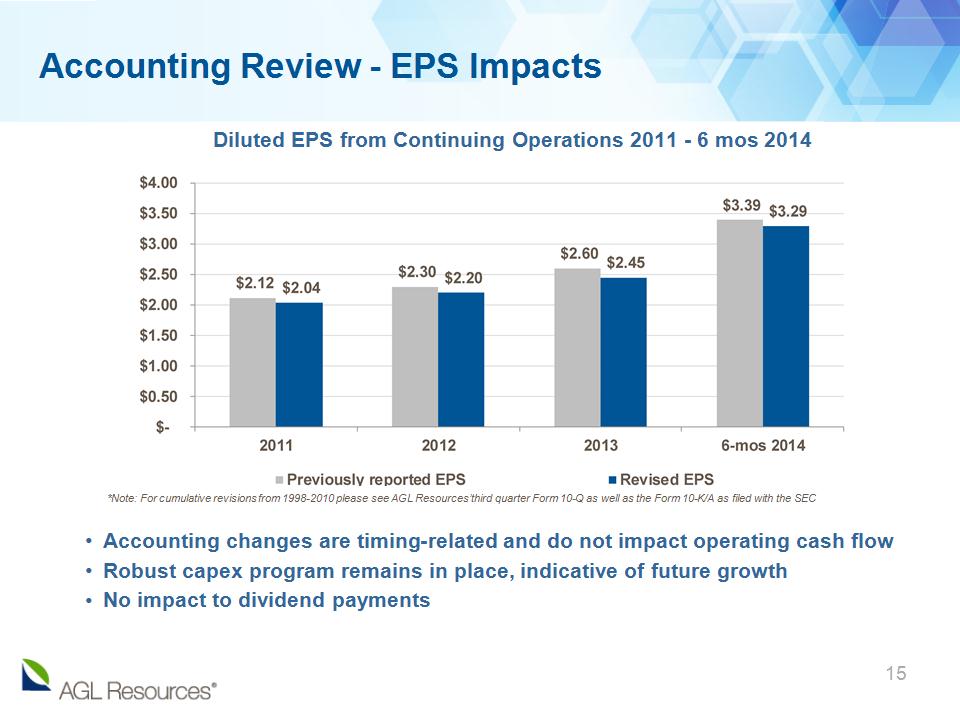
Accounting Review – EPS Impacts * Diluted EPS from Continuing Operations 2011 – 6 mos 2014 Accounting changes are timing-related and do not impact operating cash flow Robust capex program remains in place, indicative of future growth No impact to dividend payments *Note: For cumulative revisions from 1998-2010 please see AGL Resources’ third quarter Form 10-Q as well as the Form 10-K/A as filed with the SEC
Closed the sale of Tropical Shipping in the third quarter, generating $225 million in after-tax cash proceeds and distributions from the transaction Expect 2014 earnings per share for continuing operations, excluding wholesale services, of $2.60 to $2.70; continue to expect earnings contribution from wholesale services of $1.60 to $1.75 per share $210 million investment in Dalton pipeline which brings additional supplies into Georgia; largest portion of spending in 2016, and expected in-service date of 2017 ~$200 million investment in PennEast pipeline; will bring additional supplies into New Jersey; construction expected to begin in 2017, and expected in-service date in late 2017 ~$260 million investment in Atlantic Coast Pipeline which brings additional supplies into Virginia; construction expected to begin in late 2016, and expected in-service date in late 2018 Tallgrass and AGL announced a non-binding open season for firm transportation capacity to move gas from supply connections in central Illinois to the Chicago Market Center and points in between; known as the Prairie State Pipeline, project could have capacity between 1.2 Bcf/d and 1.5 Bcf/d Additional Business Updates * Pipeline Investments Summary Sale of Tropical Shipping 2014 Earnings Guidance Update
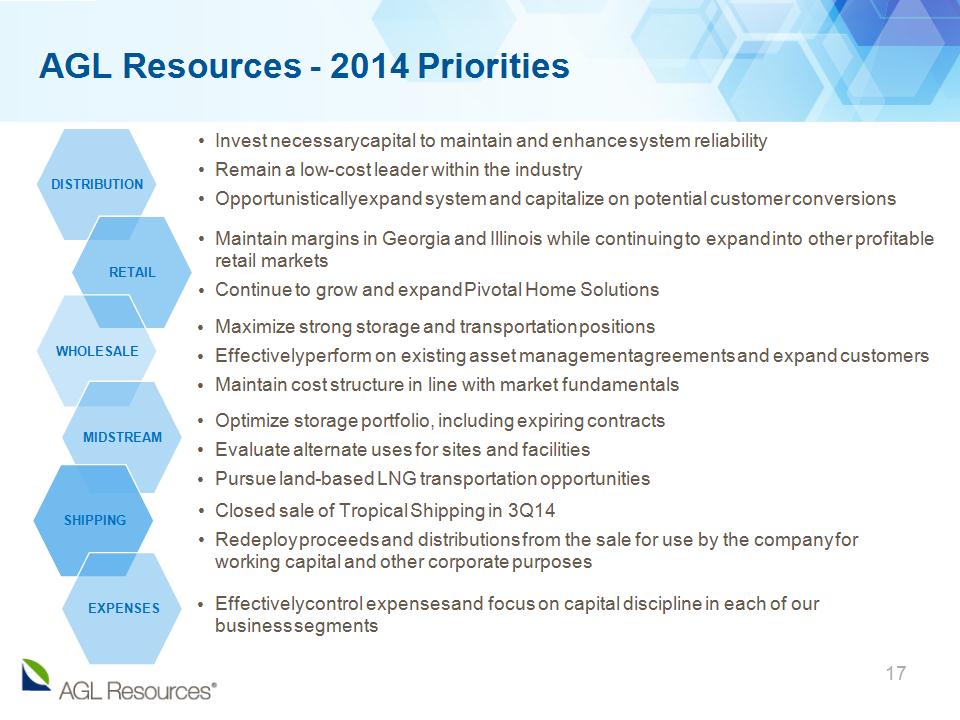
AGL Resources - 2014 Priorities Invest necessary capital to maintain and enhance system reliability Remain a low-cost leader within the industry Opportunistically expand system and capitalize on potential customer conversions Maintain margins in Georgia and Illinois while continuing to expand into other profitable retail markets Continue to grow and expand Pivotal Home Solutions Maximize strong storage and transportation positions Effectively perform on existing asset management agreements and expand customers Maintain cost structure in line with market fundamentals Optimize storage portfolio, including expiring contracts Evaluate alternate uses for sites and facilities Pursue land-based LNG transportation opportunities Effectively control expenses and focus on capital discipline in each of our business segments Closed sale of Tropical Shipping in 3Q14 Redeploy proceeds and distributions from the sale for use by the company for working capital and other corporate purposes * DISTRIBUTION RETAIL WHOLESALE MIDSTREAM SHIPPING EXPENSES

Appendix
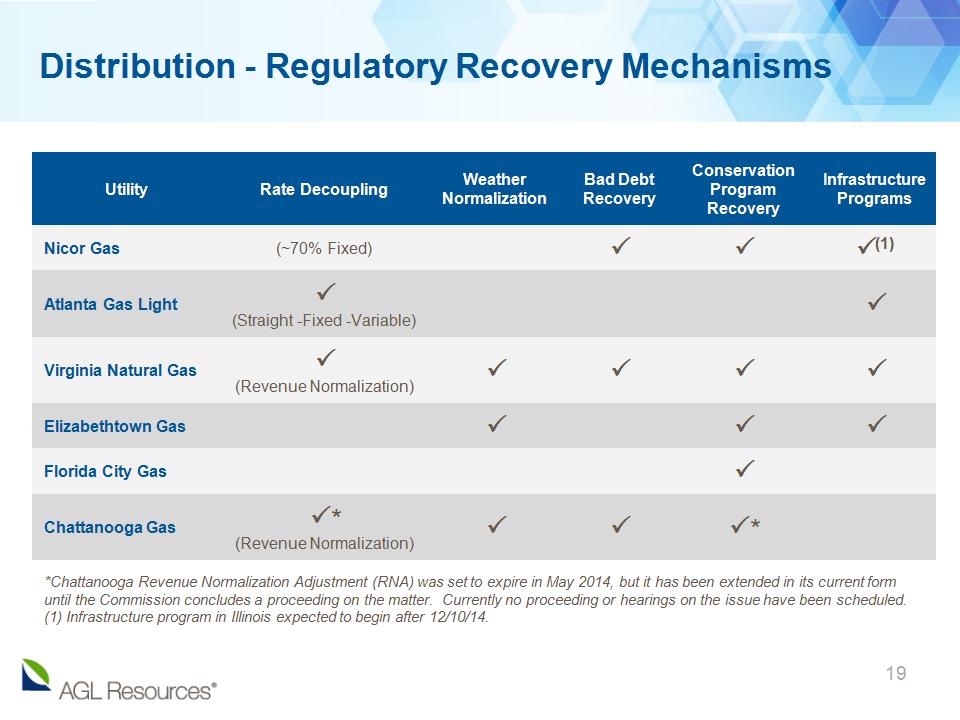
Distribution - Regulatory Recovery Mechanisms Utility Rate Decoupling Weather Normalization Bad Debt Recovery Conservation Program Recovery Infrastructure Programs Nicor Gas (~70% Fixed) P P P(1) Atlanta Gas Light P (Straight –Fixed -Variable) P Virginia Natural Gas P (Revenue Normalization) P P P P Elizabethtown Gas P P P Florida City Gas P Chattanooga Gas P* (Revenue Normalization) P P P* * *Chattanooga Revenue Normalization Adjustment (RNA) was set to expire in May 2014, but it has been extended in its current form until the Commission concludes a proceeding on the matter. Currently no proceeding or hearings on the issue have been scheduled. (1) Infrastructure program in Illinois expected to begin after 12/10/14.
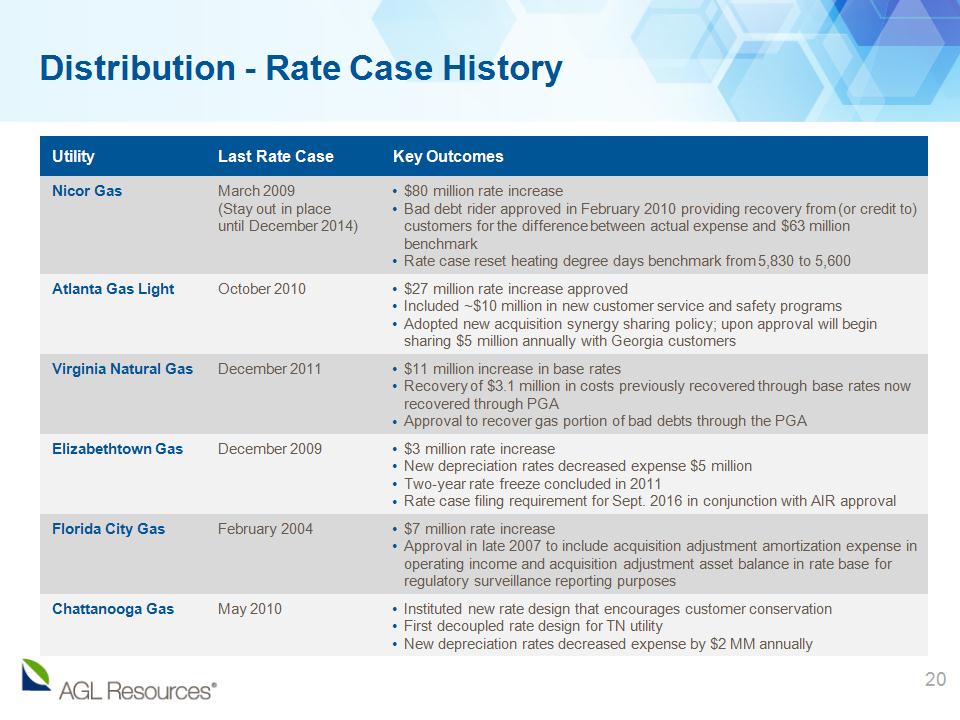
* millions redeemed Utility Last Rate Case Key Outcomes Nicor Gas March 2009 (Stay out in place until December 2014) $80 million rate increase Bad debt rider approved in February 2010 providing recovery from (or credit to) customers for the difference between actual expense and $63 million benchmark Rate case reset heating degree days benchmark from 5,830 to 5,600 Atlanta Gas Light October 2010 $27 million rate increase approved Included ~$10 million in new customer service and safety programs Adopted new acquisition synergy sharing policy; upon approval will begin sharing $5 million annually with Georgia customers Virginia Natural Gas December 2011 $11 million increase in base rates Recovery of $3.1 million in costs previously recovered through base rates now recovered through PGA Approval to recover gas portion of bad debts through the PGA Elizabethtown Gas December 2009 $3 million rate increase New depreciation rates decreased expense $5 million Two-year rate freeze concluded in 2011 Rate case filing requirement for Sept. 2016 in conjunction with AIR approval Florida City Gas February 2004 $7 million rate increase Approval in late 2007 to include acquisition adjustment amortization expense in operating income and acquisition adjustment asset balance in rate base for regulatory surveillance reporting purposes Chattanooga Gas May 2010 Instituted new rate design that encourages customer conservation First decoupled rate design for TN utility New depreciation rates decreased expense by $2 MM annually Distribution - Rate Case History
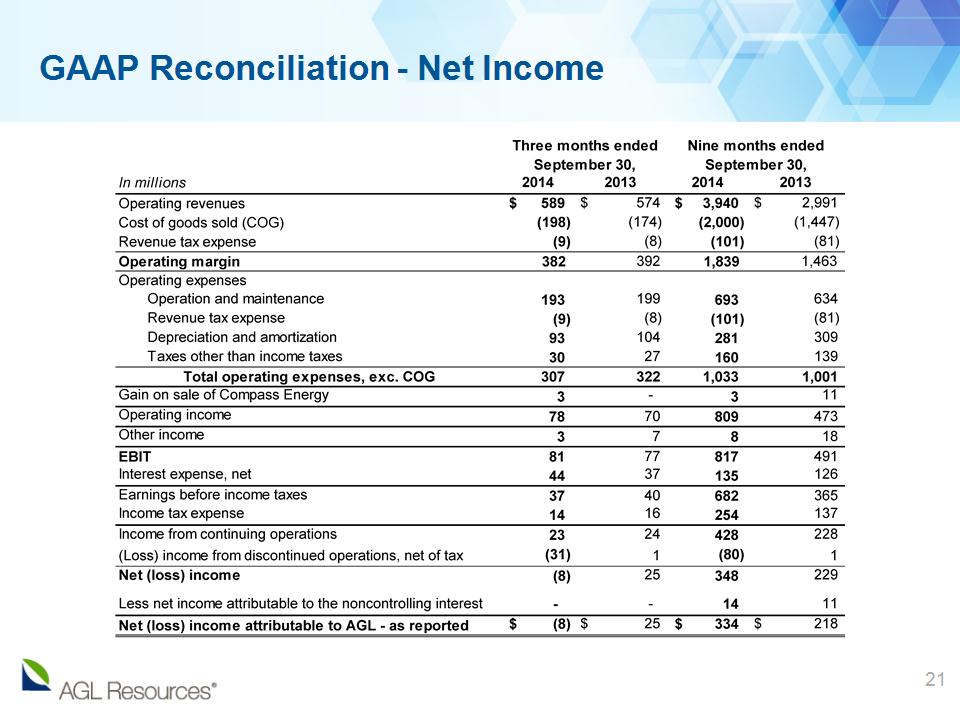
* millions redeemed GAAP Reconciliation – Net Income
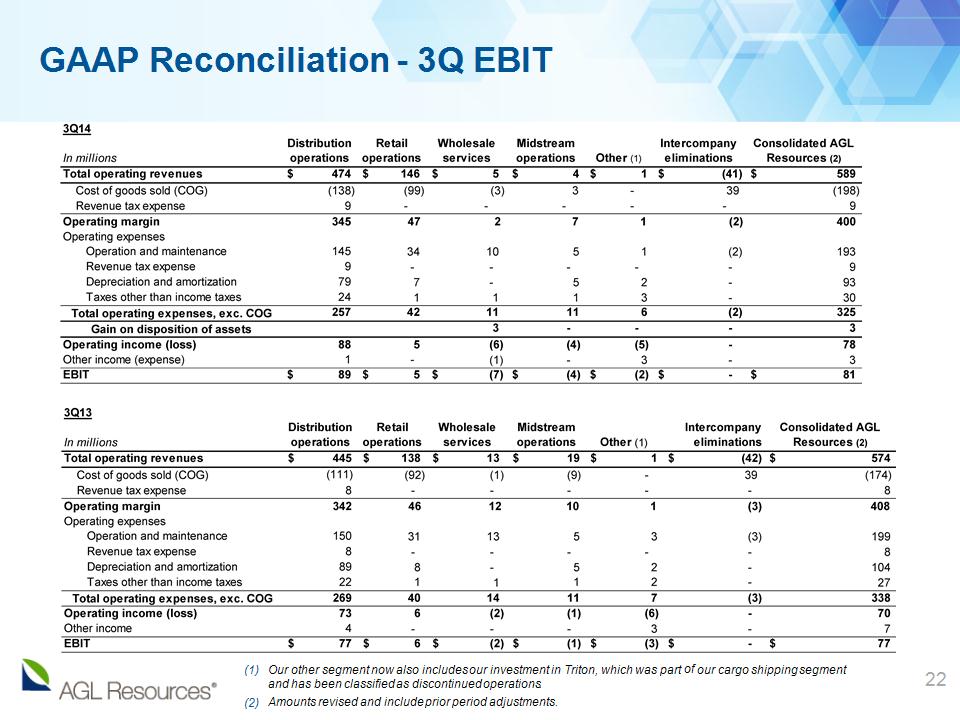
* millions redeemed GAAP Reconciliation – 3Q EBIT Our other segment now also includes our investment in Triton, which was part of our cargo shipping segment and has been classified as discontinued operations. Amounts revised and include prior period adjustments.
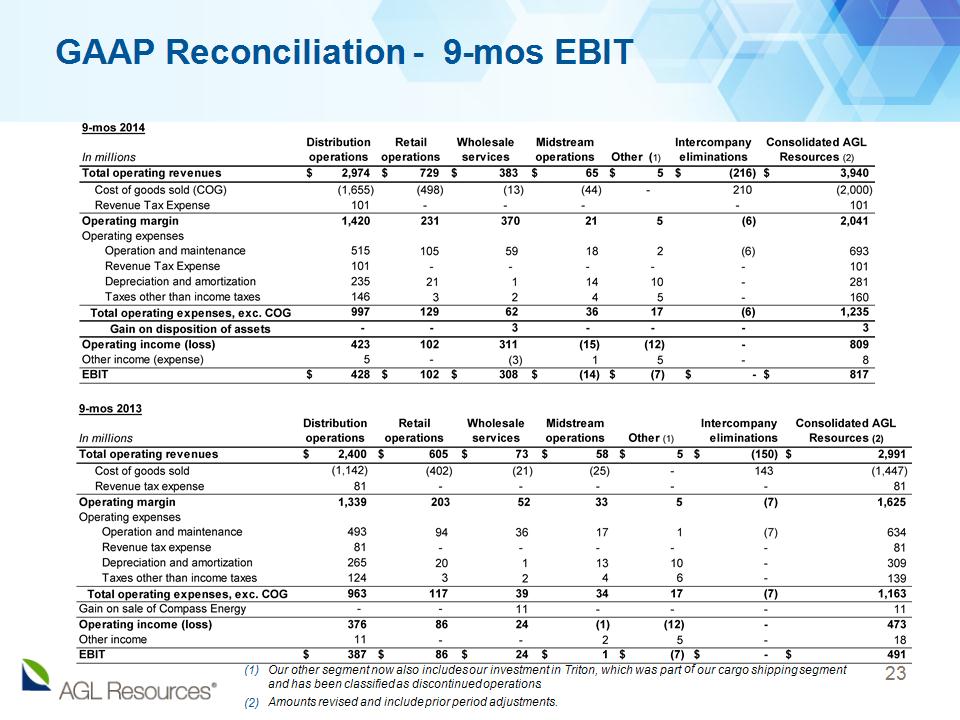
GAAP Reconciliation - 9-mos EBIT * Our other segment now also includes our investment in Triton, which was part of our cargo shipping segment and has been classified as discontinued operations. Amounts revised and include prior period adjustments.
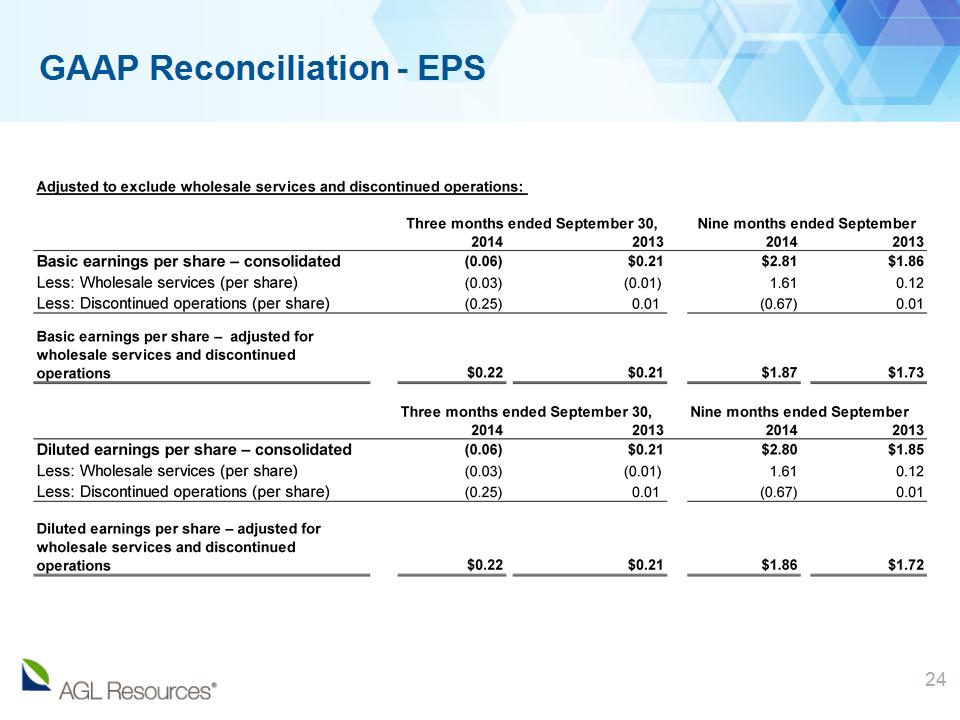
* millions redeemed GAAP Reconciliation – EPS