Attached files
| file | filename |
|---|---|
| 8-K - 8-K - Agiliti Health, Inc. | a14-23888_18k.htm |
| EX-99.1 - EX-99.1 - Agiliti Health, Inc. | a14-23888_1ex99d1.htm |
Exhibit 99.2
|
|
UHOS Q3 2014 Earnings Teleconference November 7, 2014 |
|
|
Forward Looking Statements Safe Harbor Statement under the Private Securities Litigation Reform Act of 1995: Universal Hospital Services, Inc. believes statements in this presentation looking forward in time involve risks and uncertainties based on management’s current views and assumptions. Actual events may differ materially. Please refer to the cautionary statement regarding forward-looking statements and risk factors that appear in the Company’s Annual Report on Form 10-K for the year ended December 31, 2013, and other filings with the SEC, which can be accessed at www.UHS.com under “Financials.” This presentation contains non-GAAP measures as defined by SEC rules. Reconciliations of these measures to the most directly comparable GAAP measures are contained in the appendix. 2 |
|
|
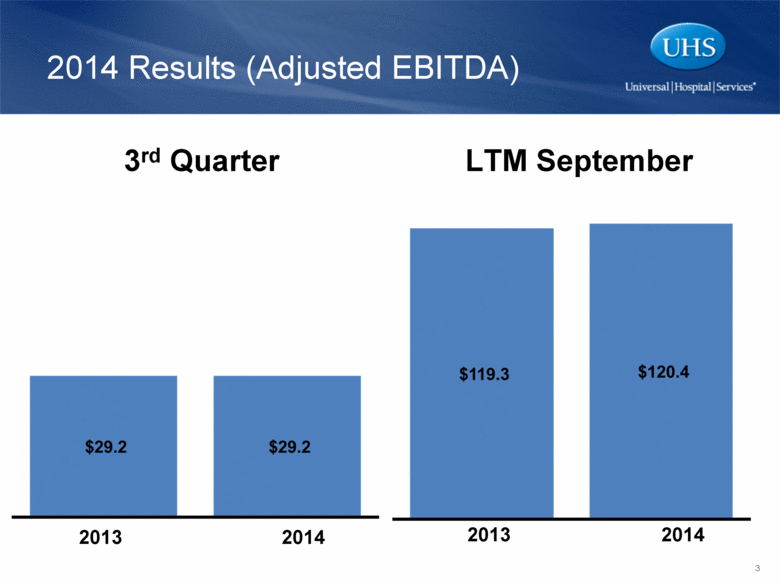
2014 Results (Adjusted EBITDA) 3rd Quarter 2013 2014 2013 2014 LTM September 3 |
|
|
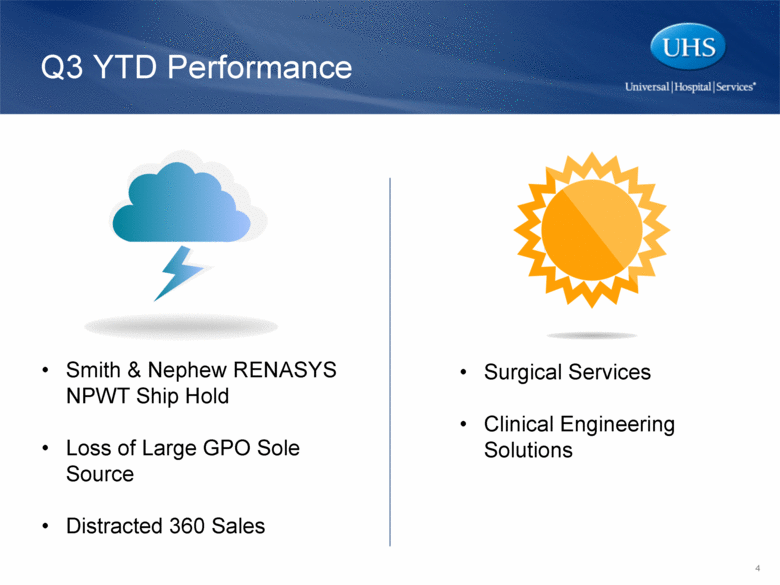
Q3 YTD Performance Surgical Services Clinical Engineering Solutions Smith & Nephew RENASYS NPWT Ship Hold Loss of Large GPO Sole Source Distracted 360 Sales 4 |
|
|
Busy season Re-focus on key growth drivers Drive operational/infrastructure improvements to support growth initiatives Focus for Q4 – Into 2015 5 |
|
|
Financial Review 3rd Quarter 2014 6 |
|
|
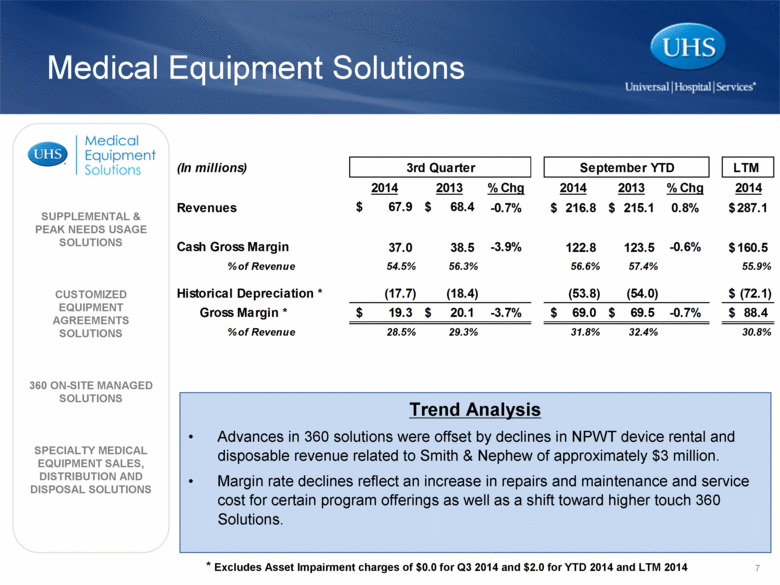
SUPPLEMENTAL & PEAK NEEDS USAGE SOLUTIONS CUSTOMIZED EQUIPMENT AGREEMENTS SOLUTIONS 360 ON-SITE MANAGED SOLUTIONS SPECIALTY MEDICAL EQUIPMENT SALES, DISTRIBUTION AND DISPOSAL SOLUTIONS Trend Analysis Advances in 360 solutions were offset by declines in NPWT device rental and disposable revenue related to Smith & Nephew of approximately $3 million. Margin rate declines reflect an increase in repairs and maintenance and service cost for certain program offerings as well as a shift toward higher touch 360 Solutions. Medical Equipment Solutions * Excludes Asset Impairment charges of $0.0 for Q3 2014 and $2.0 for YTD 2014 and LTM 2014 7 (In millions) LTM 2014 2013 % Chg 2014 2013 % Chg 2014 Revenues 67.9 $ 68.4 $ -0.7% 216.8 $ 215.1 $ 0.8% 287.1 $ Cash Gross Margin 37.0 38.5 -3.9% 122.8 123.5 -0.6% 160.5 $ % of Revenue 54.5% 56.3% 56.6% 57.4% 55.9% Historical Depreciation * (17.7) (18.4) (53.8) (54.0) (72.1) $ Gross Margin * 19.3 $ 20.1 $ -3.7% 69.0 $ 69.5 $ -0.7% 88.4 $ % of Revenue 28.5% 29.3% 31.8% 32.4% 30.8% September YTD 3rd Quarter |
|
|
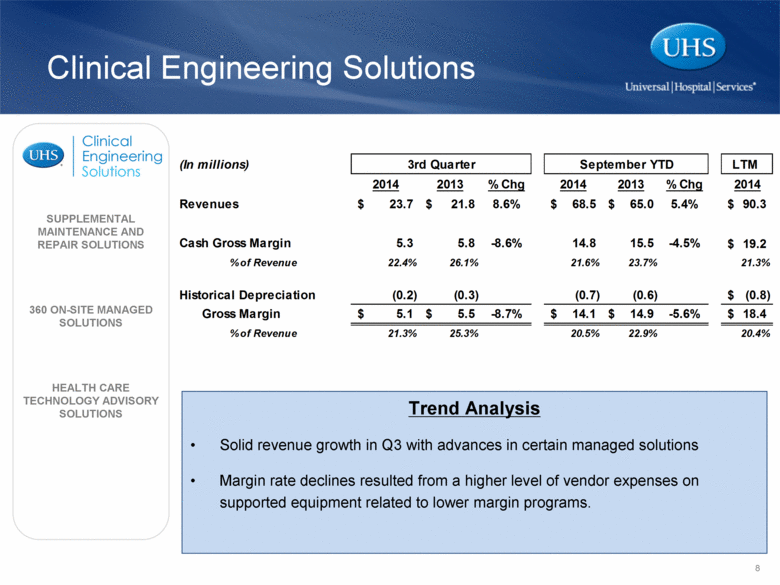
SUPPLEMENTAL MAINTENANCE AND REPAIR SOLUTIONS 360 ON-SITE MANAGED SOLUTIONS HEALTH CARE TECHNOLOGY ADVISORY SOLUTIONS Trend Analysis Solid revenue growth in Q3 with advances in certain managed solutions Margin rate declines resulted from a higher level of vendor expenses on supported equipment related to lower margin programs. Clinical Engineering Solutions 8 (In millions) LTM 2014 2013 % Chg 2014 2013 % Chg 2014 Revenues 23.7 $ 21.8 $ 8.6% 68.5 $ 65.0 $ 5.4% 90.3 $ Cash Gross Margin 5.3 5.8 -8.6% 14.8 15.5 -4.5% 19.2 $ % of Revenue 22.4% 26.1% 21.6% 23.7% 21.3% Historical Depreciation (0.2) (0.3) (0.7) (0.6) (0.8) $ Gross Margin 5.1 $ 5.5 $ -8.7% 14.1 $ 14.9 $ -5.6% 18.4 $ % of Revenue 21.3% 25.3% 20.5% 22.9% 20.4% 3rd Quarter September YTD |
|
|
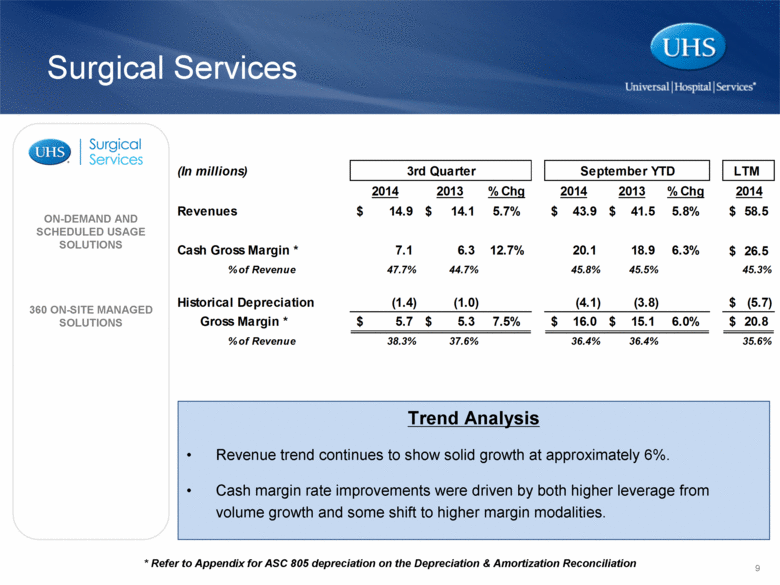
* Refer to Appendix for ASC 805 depreciation on the Depreciation & Amortization Reconciliation Trend Analysis Revenue trend continues to show solid growth at approximately 6%. Cash margin rate improvements were driven by both higher leverage from volume growth and some shift to higher margin modalities. Surgical Services ON-DEMAND AND SCHEDULED USAGE SOLUTIONS 360 ON-SITE MANAGED SOLUTIONS 9 (In millions) LTM 2014 2013 % Chg 2014 2013 % Chg 2014 Revenues 14.9 $ 14.1 $ 5.7% 43.9 $ 41.5 $ 5.8% 58.5 $ Cash Gross Margin * 7.1 6.3 12.7% 20.1 18.9 6.3% 26.5 $ % of Revenue 47.7% 44.7% 45.8% 45.5% 45.3% Historical Depreciation (1.4) (1.0) (4.1) (3.8) (5.7) $ Gross Margin * 5.7 $ 5.3 $ 7.5% 16.0 $ 15.1 $ 6.0% 20.8 $ % of Revenue 38.3% 37.6% 36.4% 36.4% 35.6% 3rd Quarter September YTD |
|
|
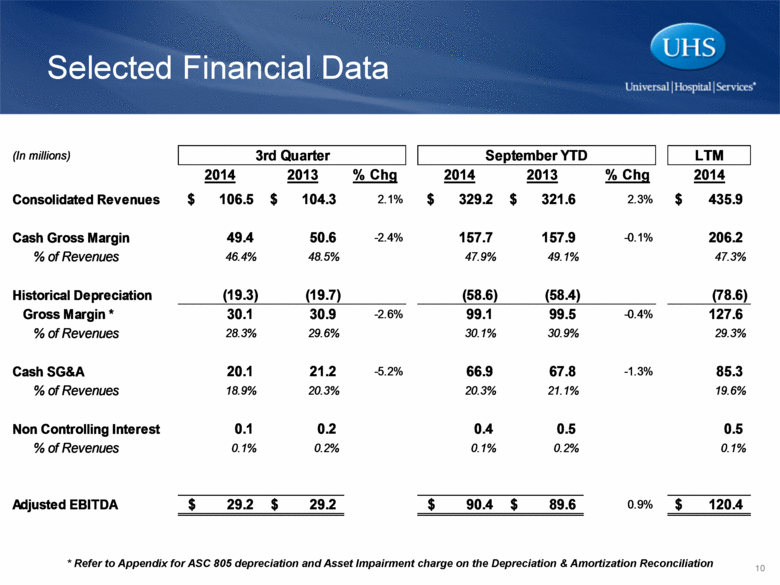
* Refer to Appendix for ASC 805 depreciation and Asset Impairment charge on the Depreciation & Amortization Reconciliation Selected Financial Data 10 (In millions) LTM 2014 2013 % Chg 2014 2013 % Chg 2014 Consolidated Revenues 106.5 $ 104.3 $ 2.1% 329.2 $ 321.6 $ 2.3% 435.9 $ Cash Gross Margin 49.4 50.6 -2.4% 157.7 157.9 -0.1% 206.2 % of Revenues 46.4% 48.5% 47.9% 49.1% 47.3% Historical Depreciation (19.3) (19.7) (58.6) (58.4) (78.6) Gross Margin * 30.1 30.9 -2.6% 99.1 99.5 -0.4% 127.6 % of Revenues 28.3% 29.6% 30.1% 30.9% 29.3% Cash SG&A 20.1 21.2 -5.2% 66.9 67.8 -1.3% 85.3 % of Revenues 18.9% 20.3% 20.3% 21.1% 19.6% Non Controlling Interest 0.1 0.2 0.4 0.5 0.5 % of Revenues 0.1% 0.2% 0.1% 0.2% 0.1% Adjusted EBITDA 29.2 $ 29.2 $ 90.4 $ 89.6 $ 0.9% 120.4 $ 3rd Quarter September YTD |
|
|
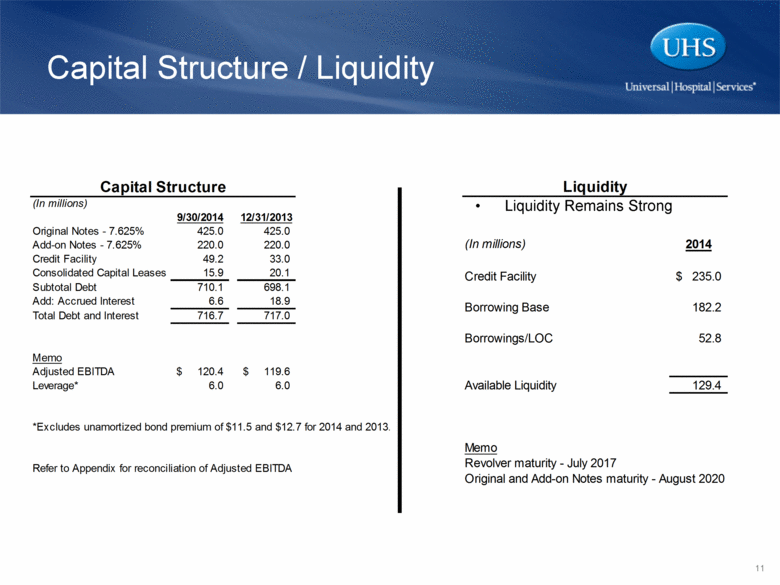
Capital Structure / Liquidity Liquidity Remains Strong 11 (In millions) 9/30/2014 12/31/2013 Original Notes - 7.625% 425.0 425.0 Add-on Notes - 7.625% 220.0 220.0 Credit Facility 49.2 33.0 Consolidated Capital Leases 15.9 20.1 Subtotal Debt 710.1 698.1 Add: Accrued Interest 6.6 18.9 Total Debt and Interest 716.7 717.0 Memo Adjusted EBITDA 120.4 $ 119.6 $ Leverage* 6.0 6.0 *Excludes unamortized bond premium of $11.5 and $12.7 for 2014 and 2013. Refer to Appendix for reconciliation of Adjusted EBITDA Capital Structure (In millions) 2014 Credit Facility 235.0 $ Borrowing Base 182.2 Borrowings/LOC 52.8 Available Liquidity 129.4 Memo Revolver maturity - July 2017 Original and Add-on Notes maturity - August 2020 Liquidity |
|
|
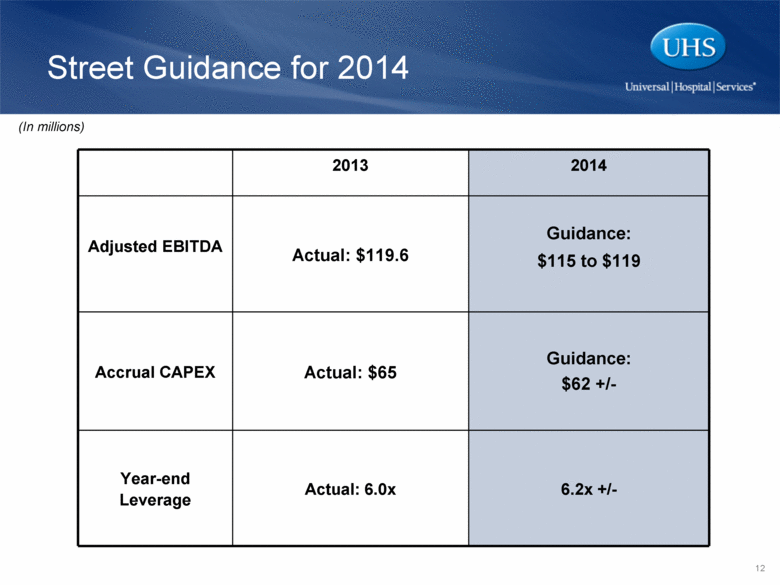
2013 2014 Adjusted EBITDA Actual: $119.6 Guidance: $115 to $119 Accrual CAPEX Actual: $65 Guidance: $62 +/- Year-end Leverage Actual: 6.0x 6.2x +/- (In millions) Street Guidance for 2014 12 |
|
|
EBITDA Reconciliation: 2014 & 2013 EBITDA Reconciliation: 2007 – 2014 Selected Reconciliations Depreciation and Amortization Reconciliation Other Reconciliations Appendix 13 |
|
|
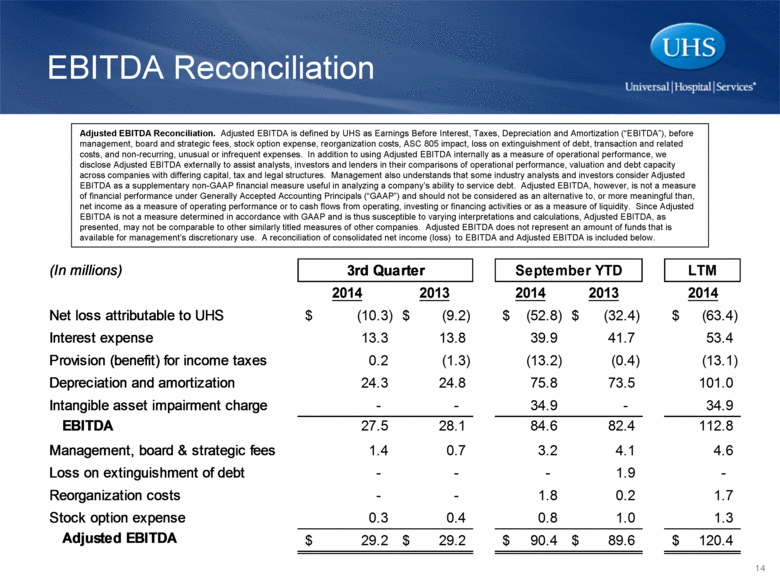
Adjusted EBITDA Reconciliation. Adjusted EBITDA is defined by UHS as Earnings Before Interest, Taxes, Depreciation and Amortization (“EBITDA”), before management, board and strategic fees, stock option expense, reorganization costs, ASC 805 impact, loss on extinguishment of debt, transaction and related costs, and non-recurring, unusual or infrequent expenses. In addition to using Adjusted EBITDA internally as a measure of operational performance, we disclose Adjusted EBITDA externally to assist analysts, investors and lenders in their comparisons of operational performance, valuation and debt capacity across companies with differing capital, tax and legal structures. Management also understands that some industry analysts and investors consider Adjusted EBITDA as a supplementary non-GAAP financial measure useful in analyzing a company’s ability to service debt. Adjusted EBITDA, however, is not a measure of financial performance under Generally Accepted Accounting Principals (“GAAP”) and should not be considered as an alternative to, or more meaningful than, net income as a measure of operating performance or to cash flows from operating, investing or financing activities or as a measure of liquidity. Since Adjusted EBITDA is not a measure determined in accordance with GAAP and is thus susceptible to varying interpretations and calculations, Adjusted EBITDA, as presented, may not be comparable to other similarly titled measures of other companies. Adjusted EBITDA does not represent an amount of funds that is available for management’s discretionary use. A reconciliation of consolidated net income (loss) to EBITDA and Adjusted EBITDA is included below. (Draft) (Draft) EBITDA Reconciliation 14 (In millions) LTM 2014 2013 2014 2013 2014 Net loss attributable to UHS (10.3) $ (9.2) $ (52.8) $ (32.4) $ (63.4) $ Interest expense 13.3 13.8 39.9 41.7 53.4 Provision (benefit) for income taxes 0.2 (1.3) (13.2) (0.4) (13.1) Depreciation and amortization 24.3 24.8 75.8 73.5 101.0 Intangible asset impairment charge - - 34.9 - 34.9 EBITDA 27.5 28.1 84.6 82.4 112.8 Management, board & strategic fees 1.4 0.7 3.2 4.1 4.6 Loss on extinguishment of debt - - - 1.9 - Reorganization costs - - 1.8 0.2 1.7 Stock option expense 0.3 0.4 0.8 1.0 1.3 Adjusted EBITDA 29.2 $ 29.2 $ 90.4 $ 89.6 $ 120.4 $ September YTD 3rd Quarter |
|
|
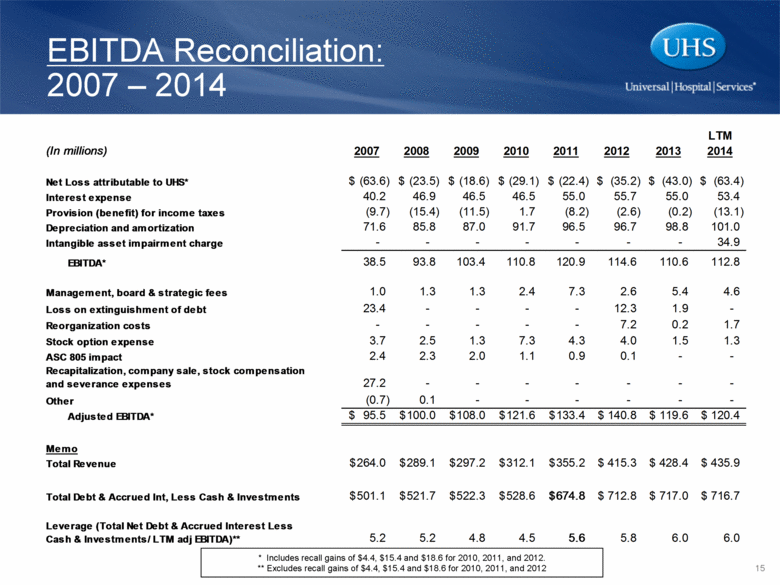
* Includes recall gains of $4.4, $15.4 and $18.6 for 2010, 2011, and 2012. ** Excludes recall gains of $4.4, $15.4 and $18.6 for 2010, 2011, and 2012 EBITDA Reconciliation: 2007 – 2014 15 LTM (In millions) 2007 2008 2009 2010 2011 2012 2013 2014 Net Loss attributable to UHS* (63.6) $ (23.5) $ (18.6) $ (29.1) $ (22.4) $ (35.2) $ (43.0) $ (63.4) $ Interest expense 40.2 46.9 46.5 46.5 55.0 55.7 55.0 53.4 Provision (benefit) for income taxes (9.7) (15.4) (11.5) 1.7 (8.2) (2.6) (0.2) (13.1) Depreciation and amortization 71.6 85.8 87.0 91.7 96.5 96.7 98.8 101.0 Intangible asset impairment charge - - - - - - - 34.9 EBITDA* 38.5 93.8 103.4 110.8 120.9 114.6 110.6 112.8 Management, board & strategic fees 1.0 1.3 1.3 2.4 7.3 2.6 5.4 4.6 Loss on extinguishment of debt 23.4 - - - - 12.3 1.9 - Reorganization costs - - - - - 7.2 0.2 1.7 Stock option expense 3.7 2.5 1.3 7.3 4.3 4.0 1.5 1.3 ASC 805 impact 2.4 2.3 2.0 1.1 0.9 0.1 - - Recapitalization, company sale, stock compensation and severance expenses 27.2 - - - - - - - Other (0.7) 0.1 - - - - - - Adjusted EBITDA* 95.5 $ 100.0 $ 108.0 $ 121.6 $ 133.4 $ 140.8 $ 119.6 $ 120.4 $ Memo Total Revenue 264.0 $ 289.1 $ 297.2 $ 312.1 $ 355.2 $ 415.3 $ 428.4 $ 435.9 $ Total Debt & Accrued Int, Less Cash & Investments 501.1 $ 521.7 $ 522.3 $ 528.6 $ 674.8 $ 712.8 $ 717.0 $ 716.7 $ Leverage (Total Net Debt & Accrued Interest Less Cash & Investments/ LTM adj EBITDA)** 5.2 5.2 4.8 4.5 5.6 5.8 6.0 6.0 |
|
|
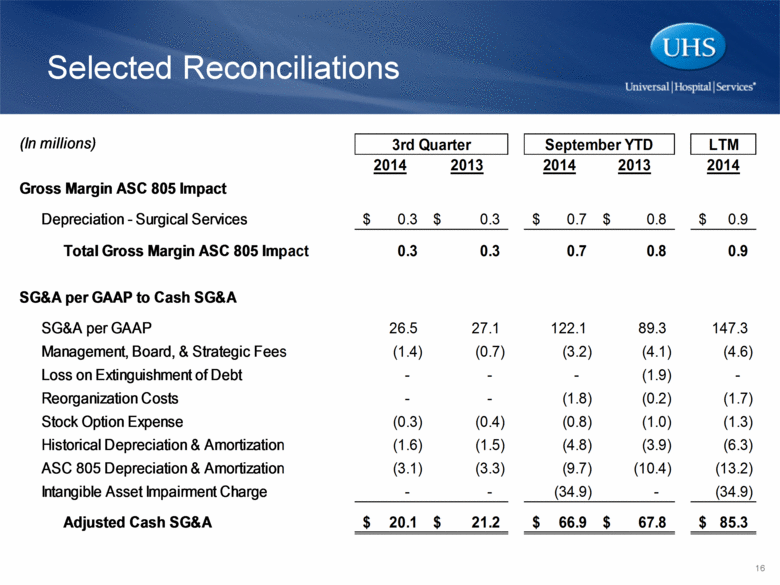
Selected Reconciliations 16 (In millions) LTM 2014 2013 2014 2013 2014 Gross Margin ASC 805 Impact Depreciation - Surgical Services 0.3 $ 0.3 $ 0.7 $ 0.8 $ 0.9 $ Total Gross Margin ASC 805 Impact 0.3 0.3 0.7 0.8 0.9 SG&A per GAAP to Cash SG&A SG&A per GAAP 26.5 27.1 122.1 89.3 147.3 Management, Board, & Strategic Fees (1.4) (0.7) (3.2) (4.1) (4.6) Loss on Extinguishment of Debt - - - (1.9) - Reorganization Costs - - (1.8) (0.2) (1.7) Stock Option Expense (0.3) (0.4) (0.8) (1.0) (1.3) Historical Depreciation & Amortization (1.6) (1.5) (4.8) (3.9) (6.3) ASC 805 Depreciation & Amortization (3.1) (3.3) (9.7) (10.4) (13.2) Intangible Asset Impairment Charge - - (34.9) - (34.9) Adjusted Cash SG&A 20.1 $ 21.2 $ 66.9 $ 67.8 $ 85.3 $ 3rd Quarter September YTD |
|
|
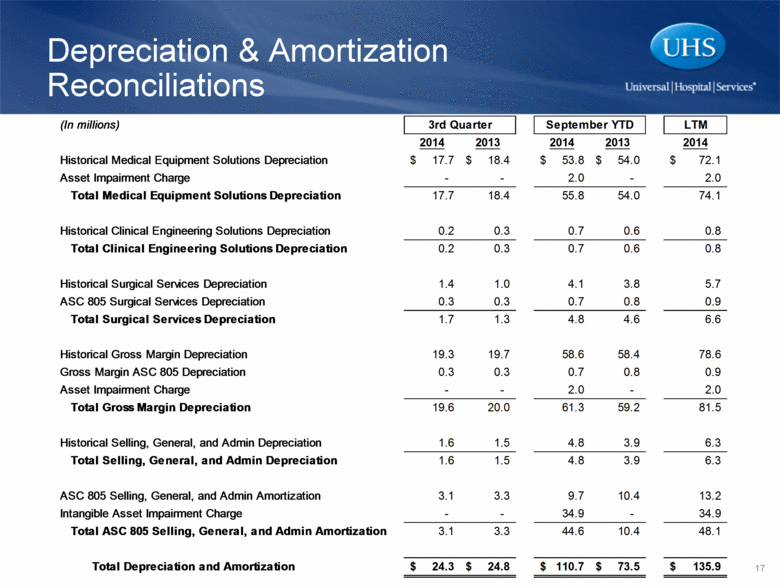
Depreciation & Amortization Reconciliations 17 (In millions) LTM 2014 2013 2014 2013 2014 Historical Medical Equipment Solutions Depreciation 17.7 $ 18.4 $ 53.8 $ 54.0 $ 72.1 $ Asset Impairment Charge - - 2.0 - 2.0 Total Medical Equipment Solutions Depreciation 17.7 18.4 55.8 54.0 74.1 Historical Clinical Engineering Solutions Depreciation 0.2 0.3 0.7 0.6 0.8 Total Clinical Engineering Solutions Depreciation 0.2 0.3 0.7 0.6 0.8 Historical Surgical Services Depreciation 1.4 1.0 4.1 3.8 5.7 ASC 805 Surgical Services Depreciation 0.3 0.3 0.7 0.8 0.9 Total Surgical Services Depreciation 1.7 1.3 4.8 4.6 6.6 Historical Gross Margin Depreciation 19.3 19.7 58.6 58.4 78.6 Gross Margin ASC 805 Depreciation 0.3 0.3 0.7 0.8 0.9 Asset Impairment Charge - - 2.0 - 2.0 Total Gross Margin Depreciation 19.6 20.0 61.3 59.2 81.5 Historical Selling, General, and Admin Depreciation 1.6 1.5 4.8 3.9 6.3 Total Selling, General, and Admin Depreciation 1.6 1.5 4.8 3.9 6.3 ASC 805 Selling, General, and Admin Amortization 3.1 3.3 9.7 10.4 13.2 Intangible Asset Impairment Charge - - 34.9 - 34.9 Total ASC 805 Selling, General, and Admin Amortization 3.1 3.3 44.6 10.4 48.1 Total Depreciation and Amortization 24.3 $ 24.8 $ 110.7 $ 73.5 $ 135.9 $ September YTD 3rd Quarter |
|
|
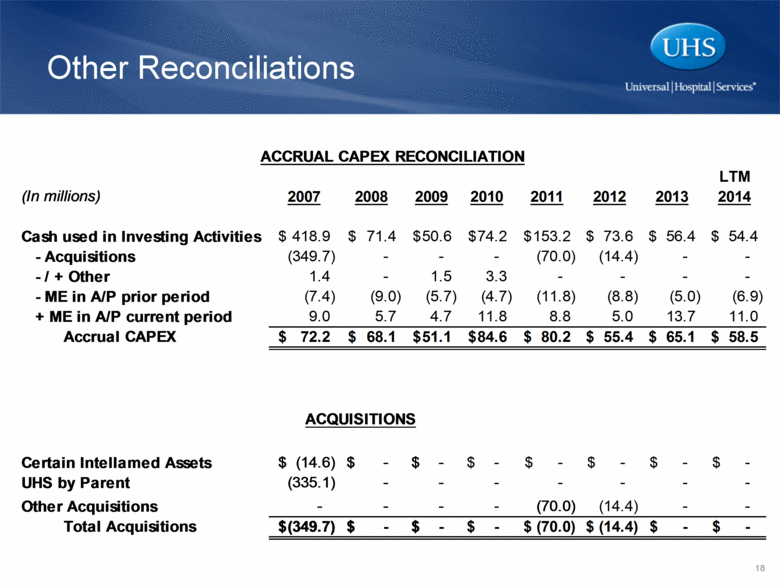
Other Reconciliations 18 LTM (In millions) 2007 2008 2009 2010 2011 2012 2013 2014 Cash used in Investing Activities 418.9 $ 71.4 $ 50.6 $ 74.2 $ 153.2 $ 73.6 $ 56.4 $ 54.4 $ - Acquisitions (349.7) - - - (70.0) (14.4) - - - / + Other 1.4 - 1.5 3.3 - - - - - ME in A/P prior period (7.4) (9.0) (5.7) (4.7) (11.8) (8.8) (5.0) (6.9) + ME in A/P current period 9.0 5.7 4.7 11.8 8.8 5.0 13.7 11.0 Accrual CAPEX 72.2 $ 68.1 $ 51.1 $ 84.6 $ 80.2 $ 55.4 $ 65.1 $ 58.5 $ Certain Intellamed Assets (14.6) $ - $ - $ - $ - $ - $ - $ - $ UHS by Parent (335.1) - - - - - - - Other Acquisitions - - - - (70.0) (14.4) - - Total Acquisitions (349.7) $ - $ - $ - $ (70.0) $ (14.4) $ - $ - $ ACQUISITIONS ACCRUAL CAPEX RECONCILIATION |