Attached files
| file | filename |
|---|---|
| 8-K - FORM 8-K - Genpact LTD | d817127d8k.htm |
| EX-99.1 - EX-99.1 - Genpact LTD | d817127dex991.htm |
 November 5, 2014
Ticker (NYSE: G)
Genpact
Q3 2014 Earnings Presentation
Exhibit 99.2 |
 PROCESS
•
ANALYTICS
•
TECHNOLOGY
2
Forward-Looking Statements
These materials also include measures defined by the SEC as non-GAAP financial
measures. Genpact believes that these non-GAAP measures can provide
useful supplemental information to investors regarding financial and business trends
relating to its financial condition and results of operations when read in
conjunction with the Company’s reported results. Reconciliations of
these non-GAAP measures from GAAP are available in this presentation and in our earnings release
dated November 5, 2014.
Non-GAAP Financial Measures
These
materials
contain
certain
statements
concerning
our
future
growth
prospects
and
forward-looking
statements,
as
defined
in the safe harbor provisions of the U.S. Private Securities Litigation Reform Act
of 1995. These statements are based on Genpact’s current expectations
and beliefs, as well as a number of assumptions concerning future events. These
statements involve a number of risks, uncertainties and other factors that could
cause actual results to differ materially from those in such
forward-looking statements. These risks and uncertainties include but are not limited to a slowdown in the
economies and sectors in which our clients operate, a slowdown in the BPO and IT
Services sectors, the risks and uncertainties
arising
from
our
past
and
future
acquisitions,
our
ability
to
manage
growth,
factors
which
may
impact
our
cost
advantage, wage increases, our ability to attract and retain skilled professionals,
risks and uncertainties regarding fluctuations in our earnings, dependence
on tax legislation, general economic conditions affecting our industry as well as
other risks detailed in our reports filed with the U.S. Securities and Exchange
Commission (the “SEC”), including the Company's
Annual
Report
on
Form
10-K.
These
filings
are
available
at
www.sec.gov
or
on
the
investor
relations
section
of
our website,
www.genpact.com.
Genpact
may
from
time
to
time
make
additional
written
and
oral
forward-looking
statements,
including statements contained in our filings with the SEC. The Company undertakes
no obligation to update any forward- looking statements that may be made
from time to time by or on behalf of the Company. |
 PROCESS •
ANALYTICS •
TECHNOLOGY
3
Q3 2014 –
Solid Growth & Progress on Strategy Execution
Key events and accomplishments:
Continued momentum on large deals pipeline; signed another significant
transformational engagement to transform and outsource a client’s
F&A operations in Japan Continued to add depth to our client-facing
teams; ahead of our plans, we now expect to invest approximately 6.5% of our
revenue in sales & marketing for the full year Integration of our life
sciences regulatory affairs acquisition on track; strategic capabilities in
this growing area of client demand are translating into results Launched
technology system of engagement; combining advanced technologies with our
deep
domain
and
process
expertise
to
drive
business
outcomes
for
clients
Stepped
up
the
integration
of
automation
tools
and
technologies,
with
our
process
excellence heritage; a key differentiator to further drive operational intelligence
for clients Made strong progress on the KYC solution with Markit; will
continue to invest in this venture this year and in 2015
|
 PROCESS •
ANALYTICS •
TECHNOLOGY
4
Q3 2014 –
Key Financial Highlights
Strong revenue growth. Margins reflect accelerated investments.
Q3
‘14
versus
Q3
‘13
performance:
Total Revenue:
+10%
Revenue from Global Clients:
+13%
GE Revenue:
-0.4%
From a service line perspective, Finance & Accounting, Core Vertical Operations
and Consulting led growth
Notes:
1.
Adjusted Income from Operations is a non-GAAP measure. Q3 ‘14 GAAP income
from operations decreased 15.2% and GAAP Operating Margin was 12.4%. Q3
2014 Adjusted Income from Operations margin at 15.0% Global Client
growth led by four of our target verticals, namely Life Sciences, CPG,
Insurance and Infrastructure, Manufacturing and Services
|
 PROCESS •
ANALYTICS •
TECHNOLOGY
5
Investments Driving Increased Pipeline Momentum
Healthy pipeline with good inflows of larger, complex deals
Momentum in our pipeline reflects focus on our chosen verticals,
geographies
and service lines
Bolstered our capabilities with increased investments in advanced
technologies and automation as well as consulting services
Increased investments in client-facing teams, domain experts and advanced
technology are driving increased involvement in more strategic and
transformative engagements
Solid progress on integrating new client-facing teams and improved
productivity Win rates improving |
 PROCESS •
ANALYTICS •
TECHNOLOGY
6
Multiple Large Deals won YTD
Closed a large deal and ramped up our new engagement in the CPG vertical,
which we announced in the first quarter; building unique CPG
core operations capabilities
we can leverage across that industry
Won
a
large
transformational
deal
in
the
second
quarter
to provide complex
F&A services to
one
of
the world’s largest insurance companies
Won another large engagement in the second quarter to help a leading
information services company transition from a portfolio of disparate
businesses into an integrated enterprise, including shedding and
further
streamlining non-core processes
Partnered with Hitachi in the third quarter to transform and outsource their
F&A operations in Japan |
 PROCESS •
ANALYTICS •
TECHNOLOGY
7
Q3 Revenue Growth of 10%
Driven by Global Clients
Q3 2014 Global Clients
BPO revenues increased 16% and ITO revenues increased 4%
Q3 2014 GE
Growth in short-cycle IT and consulting projects partially offsetting expected
declines in other parts of the business Global
Clients
(1)
GE
(1)
BPO
ITO
9.9%
YoY
Growth%
12.9%
(0.4%)
9.9%
6.1%
11.2%
YoY
Growth%
Q3 ‘13
Q3 ‘14
Q3 ‘13
Q3 ‘14
($ in millions)
($ in millions)
$534.9
$588.1
$588.1
$534.9
(2)
(2)
(2)
(2)
401.7
446.8
133.2
141.3
417.1
470.8
117.7
117.3
Notes:
1.
Data adjusted for dispositions by GE of businesses that Genpact continues to serve
as Global Clients 2.
Including Pharmalink; excluding Pharmalink, total revenue growth is 8% and Global Clients growth is
10% |
 PROCESS •
ANALYTICS •
TECHNOLOGY
8
Continue to Expand Client Relationships
Notes:
1.
Relationship size = Clients representing annual revenues based on last four rolling
quarters 77
25
12
88
30
15
0
10
20
30
40
50
60
70
80
90
100
> $5 MM
> $15 MM
>$25 MM
Q3 13
Q3 14
Relationship Size
(1) |
 PROCESS •
ANALYTICS •
TECHNOLOGY
9
Accelerated investments in client–facing teams and capabilities
Q3‘13
Q3‘14
YoY
Revenue
534.9
588.1
9.9%
Cost of Revenue
329.3
354.5
7.6%
Gross Profit
205.6
233.6
13.6%
Gross Profit % of Revenue
38.4%
39.7%
130 bps
SG&A
117.0
153.1
30.9%
SG&A % of Revenue
21.9%
26.0%
410bps
Adjusted Income From Operations
(1)
95.0
88.5
-6.9%
Adjusted Income From Operations Margin
17.8%
15.0%
-280 bps
($ millions)
Notes:
1.
Adjusted Income from Operations is a non-GAAP measure. Income from Operations
was $86.0 million in Q3 ‘13 and $72.9 million in Q3’14 |
 PROCESS •
ANALYTICS •
TECHNOLOGY
10
EPS Year-over-Year Bridge
Q3 ‘13
Q3 ‘14
Adjusted Net Income ($ millions)
77.3
57.1
Diluted Shares Outstanding (millions)
(2)
236
221
30
-5
FX Re-
measurement
Loss
Q3 ‘13
GAAP
EPS
21
(Cents per share)
Net
Adjustments
(1)
33
26
3
Net
Adjustments
(1)
Q3 ‘13
Adjusted
EPS
Q3 ‘14
Adjusted
EPS
Q3 ‘14
GAAP
EPS
-2
Lower Adjusted
Income from
Operations
-5
Increase Decrease
Notes:
1.
Adjustments primarily include amortization of intangibles relating to acquisitions
and share-based compensation expenses. 2.
Weighted average number of diluted shares outstanding
-
The above bridge reflects only significant variance items year over year and is
illustrative and subject to rounding. -
EPS = Diluted earnings per share |
 PROCESS •
ANALYTICS •
TECHNOLOGY
11
Cash From Operations
Q3 2014 cash from operations down $40 MM
Cash from operations down 32% YoY, driven by foreign exchange re-measurement
impacts, strong sequential growth and lower income from operations.
Q3 ‘13
Q3 ‘14
(32)%
Q3 ’13
Q2’14
Q3 ‘14
Days Sales Outstanding
Cash and Liquid Assets ($ millions)
(1)
Notes:
1) Cash and Liquid Assets = Cash and cash equivalents and short-term
deposits (23%)
YTD ‘13
YTD ‘14
YoY
Change%
YoY
Change%
($ in millions)
($ in millions)
126
86
233
179
80
84
82
499
377
424 |
 PROCESS •
ANALYTICS •
TECHNOLOGY
12
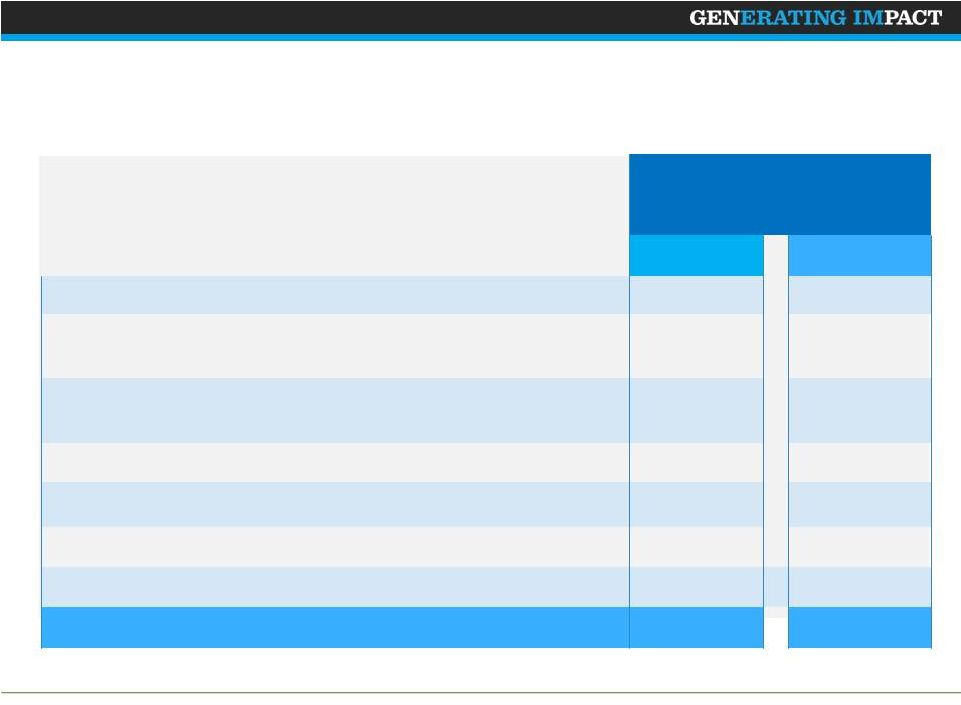
FY 2014
Revenues ($B)
2.24 -
2.28
Adjusted Income from Operations -
Margin
15.0% -
15.5%
Other Metrics
Cash Flow From Operations
Decline ~15 -
20% YoY
Effective Tax Rate
24% -
26%
Capital Expenditure (% of revenue)
2.5% -
3.0%
Full Year 2014 Outlook |
 PROCESS •
ANALYTICS •
TECHNOLOGY
13
Annexure 1: Reconciliation of Adjusted Income from
Operations
(USD, In Thousands)
Three months
ended
September 30,
2013
2014
Income from operations per GAAP
$
85,957
$
72,867
Add: Amortization of acquired intangible assets resulting from
acquisitions and Formation Accounting
4,568
6,386
Add: Stock-based compensation
5,312
8,274
Add: Other income
184
950
Add/Less: Provision (created) reversed for loss on Divestitures
141
-
Add: Gain on Equity-method investment activity, net
32
33
Less: Net income attributable to noncontrolling interest
(1,169)
(13)
Adjusted income from operations
$
95,025
$
88,497 |
 PROCESS •
ANALYTICS •
TECHNOLOGY
14
Annexure 2: Reconciliation of Adjusted Net Income
(USD, In Thousands, except per share data)
Three months
ended
September 30,
2013
2014
Net income per GAAP
$
70,262
$
46,653
Add: Amortization of acquired intangible assets resulting from
acquisitions and Formation Accounting
4,568
6,386
Add: Stock-based compensation
5,312
8,274
Less: Tax impact on amortization of acquired intangibles resulting
from Formation Accounting and acquisitions
(1,433)
(2,050)
Less: Tax Impact on stock-based compensation
(1,458)
(2,150)
Adjusted net income
$
77,251
$
57,113
Adjusted diluted earnings per share
$
0.33
$
0.26 |
 Thank you |