Attached files
| file | filename |
|---|---|
| 8-K - 8-K PPBI INVESTOR PRESENTATION 2014-Q3 - PACIFIC PREMIER BANCORP INC | ppbi_8k-2014q3invpres.htm |
Exhibit 99.1

Investor Presentation
Third Quarter 2014
Steve Gardner
President & Chief Executive Officer
sgardner@ppbi.com
949-864-8000

2
Forward-Looking Statements and
Where to Find Additional Information
Where to Find Additional Information
The statements contained in this presentation that are not historical facts are forward-looking statements based on management’s current
expectations and beliefs concerning future developments and their potential effects on Pacific Premier Bancorp, Inc. (the “Company”). Such
statements involve inherent risks and uncertainties, many of which are difficult to predict and are generally beyond the control of the Company.
There can be no assurance that future developments affecting the Company will be the same as those anticipated by management. The Company
cautions readers that a number of important factors could cause actual results to differ materially from those expressed in, or implied or projected
by, such forward-looking statements. These risks and uncertainties include, but are not limited to, the following: the strength of the United States
economy in general and the strength of the local economies in which the Company conducts operations; the effects of, and changes in, trade,
monetary and fiscal policies and laws, including interest rate policies of the Board of Governors of the Federal Reserve System; inflation, interest rate,
market and monetary fluctuations; the timely development of competitive new products and services and the acceptance of these products and
services by new and existing customers; the willingness of users to substitute competitors’ products and services for the Company’s products and
services; the impact of changes in financial services policies, laws and regulations (including the Dodd-Frank Wall Street Reform and Consumer
Protection Act) and of governmental efforts to restructure the U.S. financial regulatory system; technological changes; the effect of acquisitions that
the Company has made or may make; changes in the level of the Company’s nonperforming assets and charge-offs; oversupply of inventory and
deterioration in values of California real estate, both residential and commercial; the effect of changes in accounting policies and practices, as may be
adopted from time-to-time by bank regulatory agencies, the Securities and Exchange Commission (“SEC”), the Public Company Accounting Oversight
Board, the Financial Accounting Standards Board or other accounting standards setters; possible other-than-temporary impairments of securities
held by the Company; changes in consumer spending, borrowing and savings habits; the effects of the Company’s lack of a diversified loan portfolio,
including the risks of geographic and industry concentrations; ability to attract deposits and other sources of liquidity; changes in the financial
performance and/or condition of the Company’s borrowers; changes in the competitive environment among financial and bank holding companies
and other financial service providers; unanticipated regulatory or judicial proceedings; and the Company’s ability to manage the risks involved in the
foregoing.
Additional factors that could cause actual results to differ materially from those expressed in the forward-looking statements are discussed in the
Company’s 2013 Annual Report on Form 10-K, filed with the SEC and other filings made by the Company with the SEC. The Company specifically
disclaims any obligation to update any factors or to publicly announce the result of revisions to any of the forward-looking statements included
herein to reflect future events or developments.
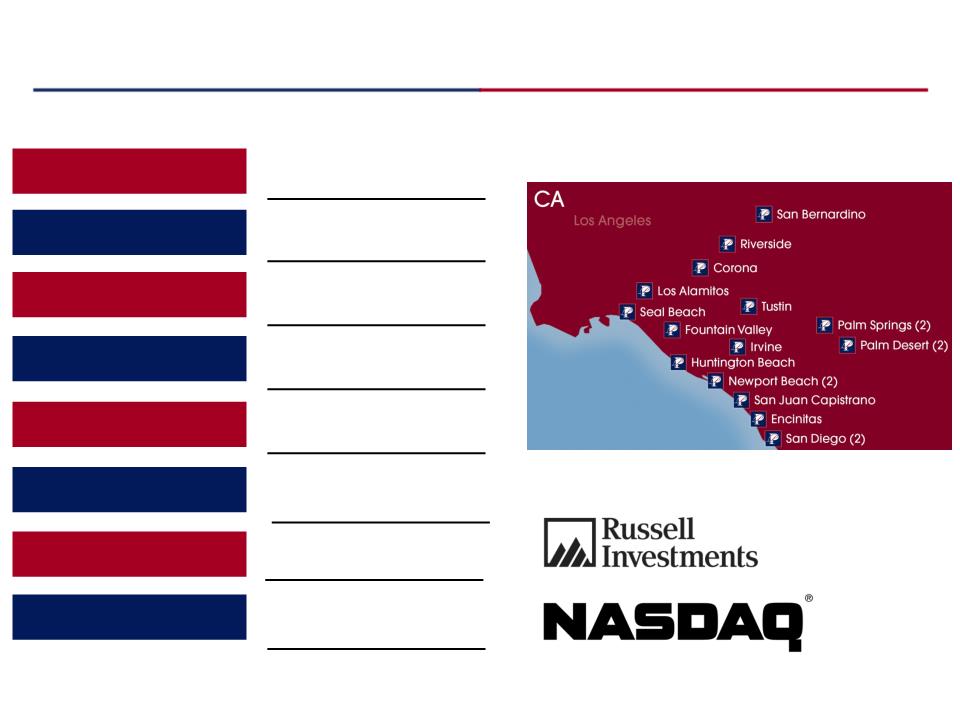
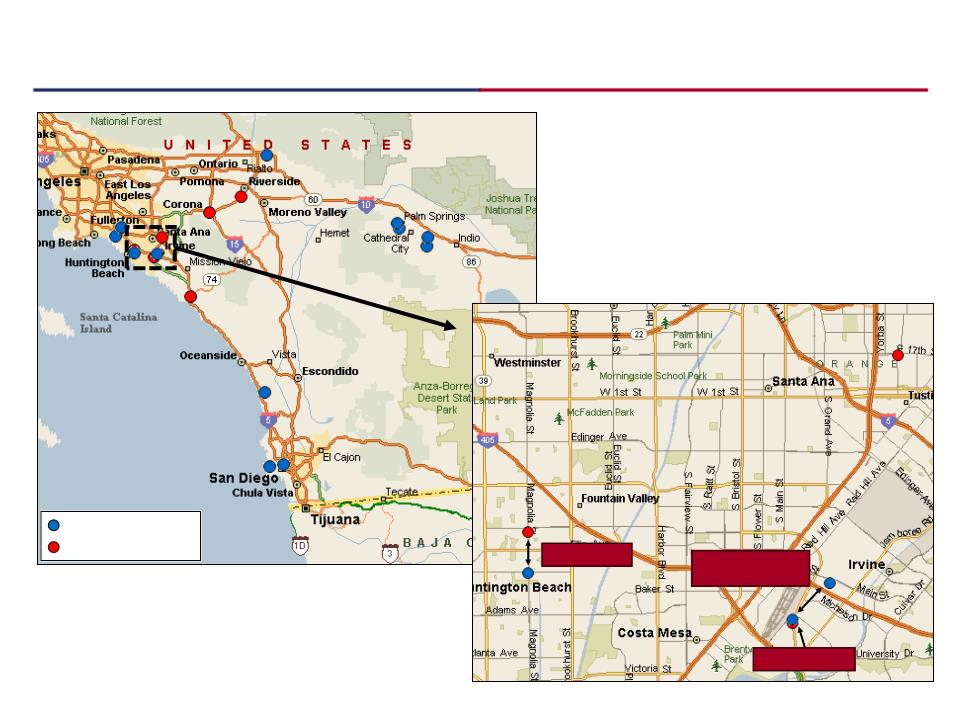
3
13 Full-Service
Branch Locations
Company Profile
Exchange / Listing
NASDAQ: PPBI
Focus
Small & Mid-Market
Businesses
Businesses
Total Assets
$2.0 Billion
Branch Network
Note: Financial information as of the quarter ending 9/30/2014
Note: Market data as of 10/30/2014
Pacific Premier Branch Footprint
Headquarters
Irvine, CA
# of Research Analysts
6 Analysts
Market Cap
$273.1 Million
Avg. Daily Volume
35,177 Shares
Note: Map does not include PPBI offices outside of California

4
Strategic Plan Execution
Pre 2008
§ Conversion from a thrift to a commercial bank
§ Improve deposit base and diversify loan portfolio
§ Regimented approach to credit management
2008 - 2012
§ Organic growth driven by disciplined sales culture
§ Geographic expansion through highly accretive FDIC-assisted acquisitions
§ Canyon National Bank (CNB) - $209 million in assets at closing on 2/11/2011 (FDIC-Assisted)
§ Palm Desert National Bank (PDNB) - $121 million in assets at closing on 4/27/2012 (FDIC-Assisted)
Next Stage
§ Focus on producing EPS growth from scale, efficiency, balance sheet leverage
§ Increase revenue from recurring fee income through growth in SBA lending
§ Increase non-interest bearing deposit accounts to over 35% of deposit base
2013 - 2014
§ Build out our commercial banking platform through acquisitions
§ First Associations Bank (FAB) - $419 million in assets at closing on 3/15/2013 (Whole Bank)
§ San Diego Trust Bank (SDTB) - $208 million in assets at closing on 6/25/2013 (Whole Bank)
§ Infinity Franchise Holdings (IFH) - $80 million in assets at closing on 1/30/2014 (Specialty Finance)
§ Independence Bank (IDPK) - $426 million in assets, announced 10/22/2014 (Whole Bank)
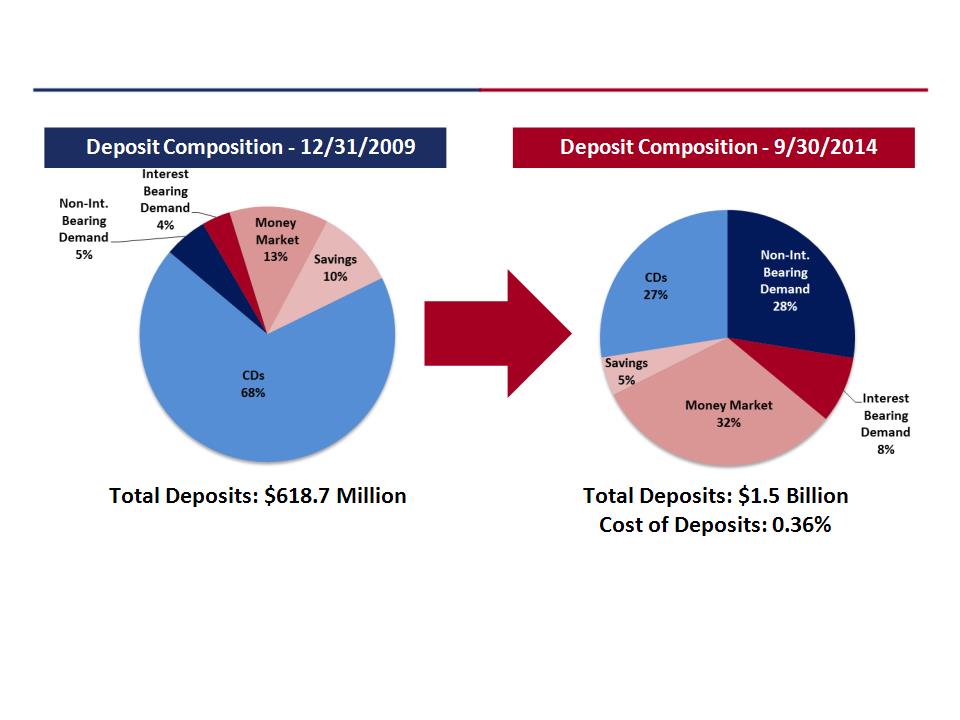
5
Commercial Bank Transformation - Deposit Composition
§ 73% of deposits are non-CD deposits
§ 28% of deposit balances are non-interest bearing deposits
§ 91% of deposit balances are Core deposits *
Cost of Deposits: 1.79%
* Core deposits are all transaction accounts and non-brokered CD accounts below $250,000
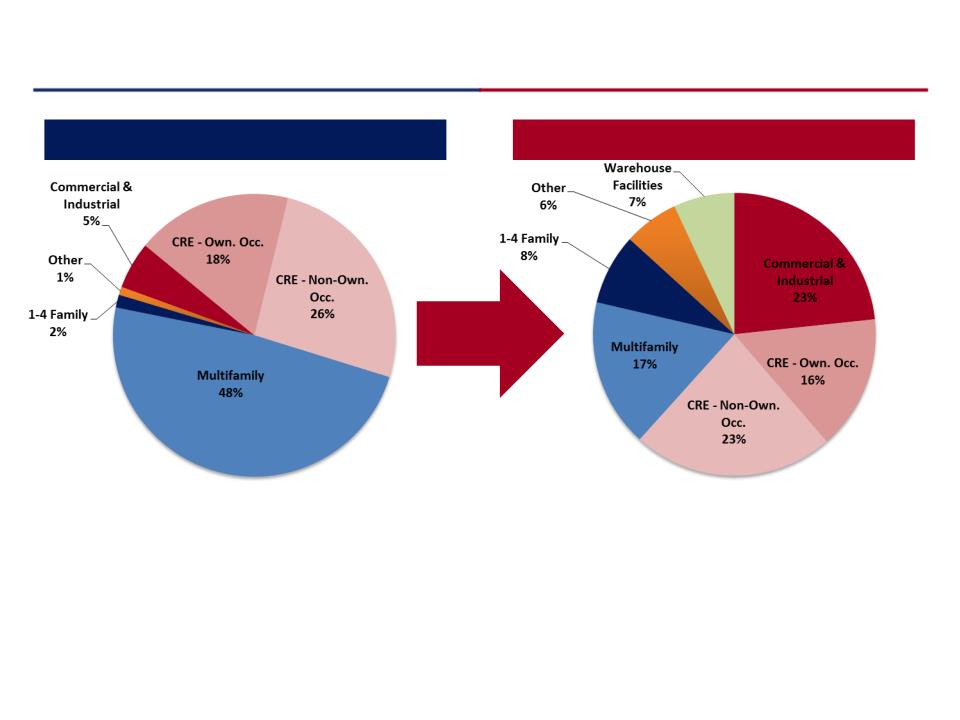
6
Commercial Bank Transformation - Loan Composition
Loan Composition - 12/31/2009
Loan Composition - 9/30/2014
§ Loan portfolio is high quality and well-diversified
§ Business loans represent 47% of total loans at 9/30/14
Total Loans: $576.3 Million
Total Loans: $1.5 Billion
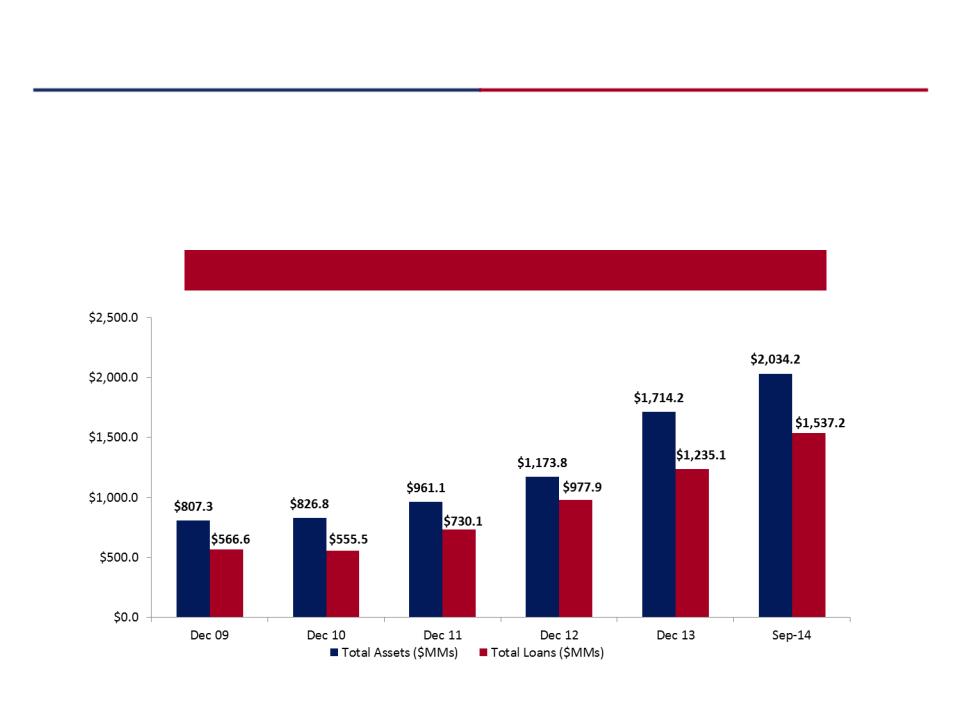
7
Growth Driven Organically and Through M&A
Total Assets & Total Loans
§ Total assets compound annual growth rate of 21% since 2009
§ Total loans compound annual growth rate of 23% since 2009
Note: All dollars in millions
8
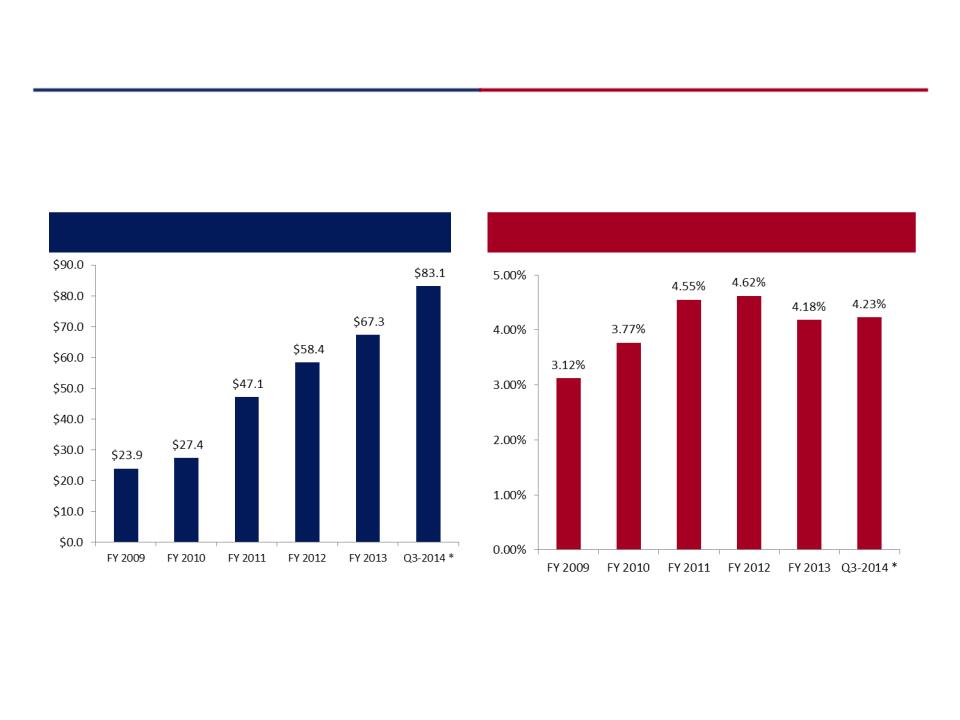
Revenue Growth & Net Interest Margin
Net Interest Margin
Operating Revenue
§ Meaningful operating revenue growth in each of the last several years
§ Strength in net interest margin through loan pricing discipline and growth in core deposits
Note: Operating revenue = net interest income + non-interest income.
* For the nine months ended September 30, 2014, annualized.
Note: All dollars in millions
* For the nine months ended September 30, 2014.
9
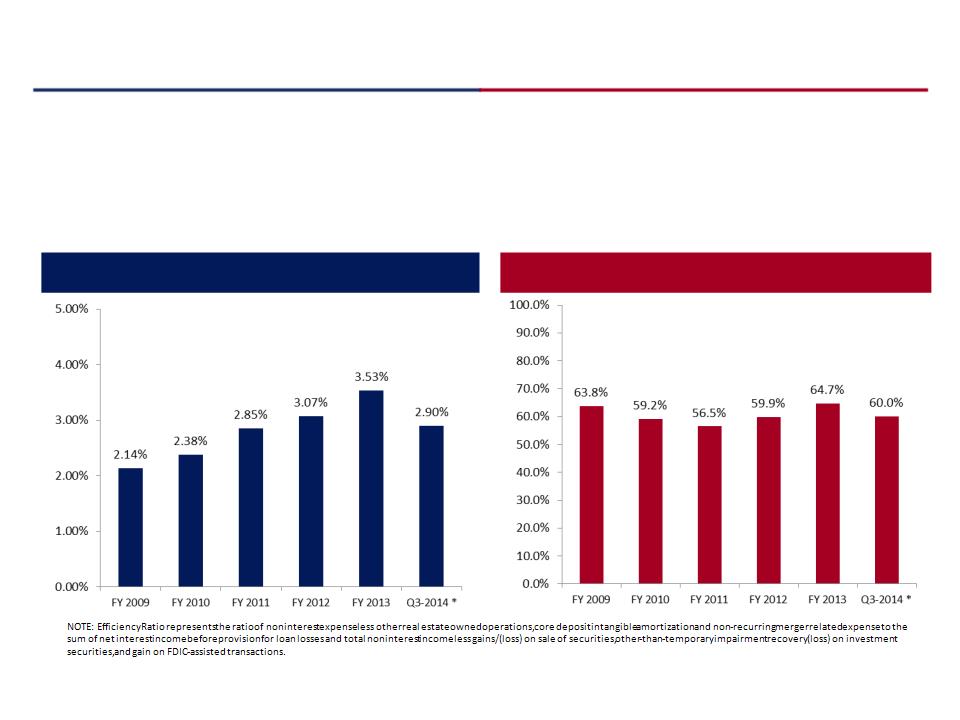
Expenses & Efficiency
Non-Interest Expense / Avg. Assets
Efficiency Ratio
§ The Company continues to support its growth efforts by investing in talented producers
§ The Company will realize benefits from economies of scale as it continues to grow
* For the nine months ended September 30, 2014.
10
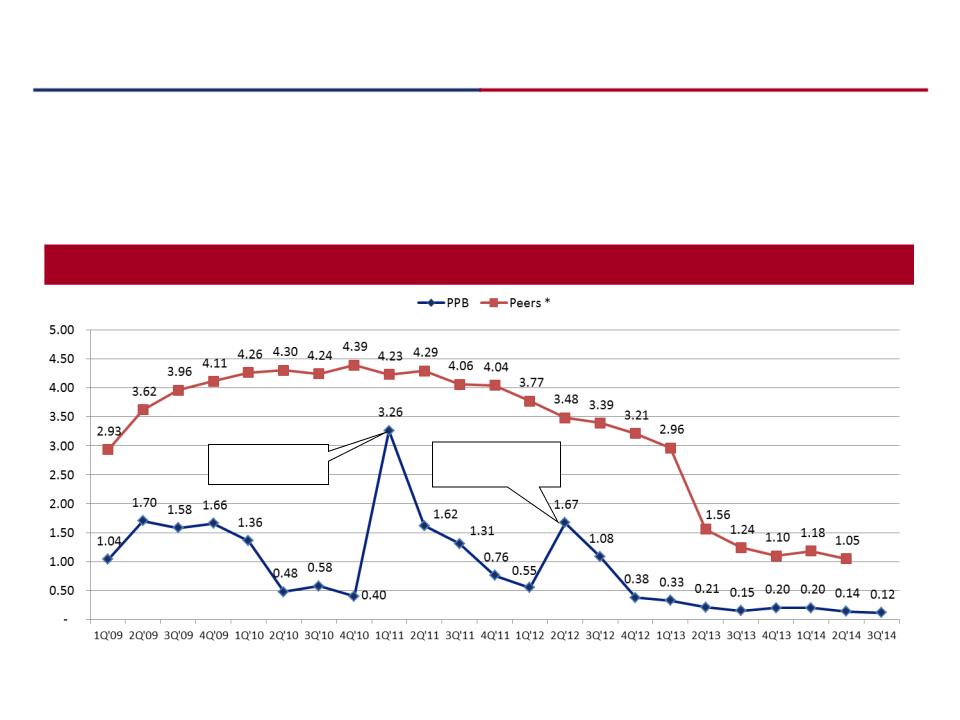
Conservative Credit Culture
Nonperforming Assets to Total Assets (%)
§ The Company has a history of pro-actively addressing credit issues through aggressive problem-asset resolution
§ No troubled debt restructurings (“TDRs”)
§ Loan sales utilized strategically to manage various risks
CNB Acquisition
2/11/11
PDNB Acquisition
4/27/12
* California peer group consists of all insured California institutions, from SNL Financial.

11
Overview of Q3 2014 Highlights
§ Stockholder Highlights
§ Diluted earnings per share of $0.31
§ Return on average tangible common equity of 13.60%*
§ Return on average assets of 1.14%
§ Financial Highlights
§ Total assets of $2.0 billion, an increase of 6% or $112.7 million compared to prior quarter
§ Net loans of $1.5 billion, an increase of 6% or $80.2 million compared to prior quarter
§ Loan originations of $171 million during Q3
§ Efficiency ratio remains attractive at 56.6%
§ Other Highlights
§ Franchise lending contributes $35 million in C&I loan growth
§ Significant business development in commercial banking with 37% of originations being C&I loans
§ Deposit pipeline growing; expect good deposit inflows over the next two quarters
§ Issued $60 million of subordinated notes at 5.75% interest rate, 10 year fixed rate
*Please refer to non-GAAP reconciliation
12
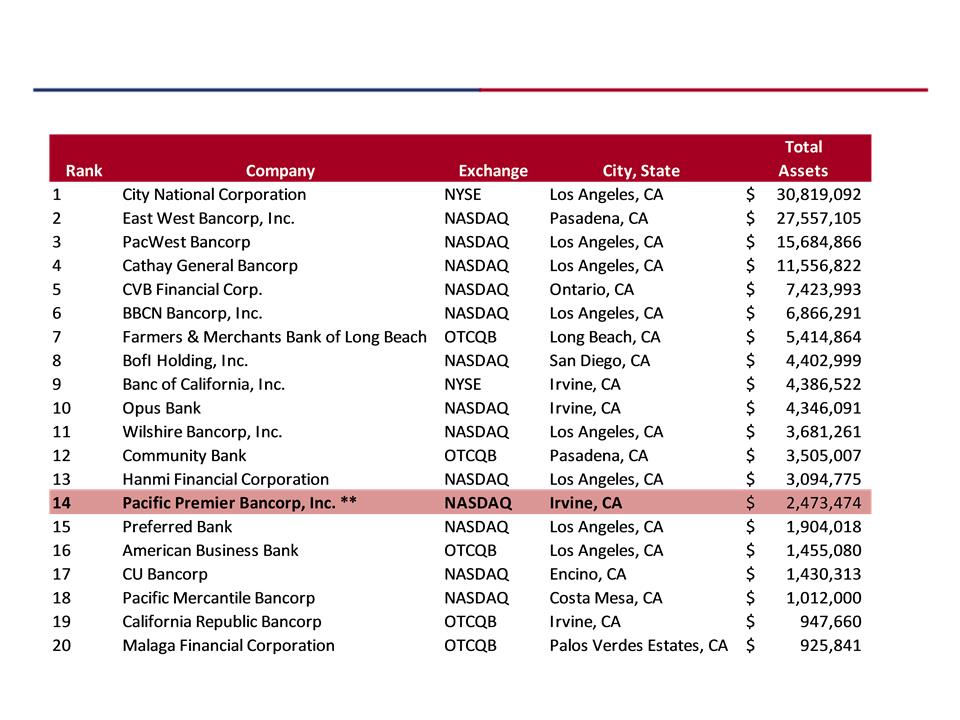
Creating Scarcity Value
*Southern CA includes LA, Orange, Imperial, Riverside, San Bernardino, San
Diego Counties.**PPBI pro forma with Independence Bank as of 9/30/14
Diego Counties.**PPBI pro forma with Independence Bank as of 9/30/14
§ Ranked 14th largest among exchange listed banks by total assets in Southern California*
Source: SNL Financial, as of 6/30/2014, Note: Includes banks listed on NASDAQ/NYSE/OTCB

13
§ Small and middle market business banking focus
§ Full suite of business banking services, including: cash
management, payroll and merchant card services
management, payroll and merchant card services
§ Customized C&I and commercial real estate loans
Commercial Banking Business Units
Business Banking
SBA Lending
HOA Banking
Warehouse Lending
Income Property Lending
§ Small Business Administration (“SBA”) Loans
§ California Capital Access Program (“Cal CAP”) Loans
§ United State Department of Agriculture (“USDA”) Loans
§ Bureau of Indian Affairs (“BIA”) Loans
§ Nationwide leader of customized cash management,
electronic banking services and credit facilities for:
electronic banking services and credit facilities for:
§ Home Owner Association (“HOA”) Companies
§ HOA Management Companies
§ Credit facilities and electronic banking services
exclusively designed for large and small mortgage
banking concerns
exclusively designed for large and small mortgage
banking concerns
§ Credit facilities and banking services for commercial
real estate (“CRE”) investors
real estate (“CRE”) investors
§ Structured CRE and bridge loan flexibility
Construction Lending
§ Construction loans for developers and owner users on
residential and CRE properties
residential and CRE properties
§ New team assembled in first half of 2013
Franchise Lending
§ Financing for established and experienced owner
operators of Quick Serve Restaurants nationwide
operators of Quick Serve Restaurants nationwide
§ C&I and CRE loans secured by equipment and real
estate
estate
Nonprofit & Escrow Banking
§ Customized credit solutions for nonprofits
§ Specialized cash management and electronic banking
products to meet escrow and title company needs
products to meet escrow and title company needs

14
Disciplined Sales Culture Drives Organic Growth
§ Business development team consists of early career sales executives
with real estate or financial services experience
with real estate or financial services experience
§ Consistent calling effort identifies prospects
§ Diligent monitoring and management of quantity and quality of lead
generation
generation
§ Senior commercial bankers utilized to close new relationships
Business
Development /
Sales Infrastructure
Development /
Sales Infrastructure
Consistent
Contact
Contact
Lead
Generation
Management
Generation
Management
Senior Commercial
Bankers Close New
Relationships
Bankers Close New
Relationships

15
Acquisition & Integration Strategy
General Acquisition Criteria
Integration Strategy
§ Look for strategic, financially compelling and
culturally compatible organizations
culturally compatible organizations
§ Favorable markets / demographics
§ Must complement our business banking
strategy
strategy
§ Disciplined approach to analysis, pricing and
structuring of each transaction
structuring of each transaction
§ Realistic cost savings assumptions
§ Core customer retention
§ Keeping franchise value intact
§ Aggressive approach to timely and effective
integration
integration
§ Identify key players that fit into our culture
and who can add value to the organization
and who can add value to the organization
§ Immediately meet with new customer base to
begin cross-selling products and services
begin cross-selling products and services
§ Aggressive approach to disposition of any
problem assets inherited in a transaction
problem assets inherited in a transaction
§ Diligent approach to acquisitive growth and business integration

16
Acquisition of Independence Bank - announced 10/22/14
Strategic
Rationale
Rationale
§ Compelling in-market consolidation opportunity that strengthens PPBI’s competitive position as one of
the premier community banks headquartered in Southern California with $2.5 billion pro forma assets
the premier community banks headquartered in Southern California with $2.5 billion pro forma assets
§ Geographic fit - enhances and connects PPBI’s footprint in Southern California
§ Fills in existing franchise between Orange County and Coachella Valley
§ Deep understanding of respective business model, customer base and employees
§ Addition of attractive loan portfolio with no substantial asset quality issues
§ Valuable low-cost core deposit franchise
§ 25.9% non-interest bearing deposits and 81.5% non-CD deposits
§ Total cost of deposits of 0.40%
Financially
Attractive
Attractive
§ First full year EPS accretion of approximately 9.6% in 2016(1)
§ Internal rate of return in excess of 20%
§ Tangible book value per share(2) payback period of approximately 3.2 years(3)
§ Significant cost savings and operational synergies due to branch overlap
Source: SNL Financial, financial information as of the quarter ended 9/30/2014, based on regulatory data
(1) Based on PPBI mean EPS estimates for 2014 and 2015 per SNL FactSet research. Excludes non-recurring
merger related expenses in 2015
merger related expenses in 2015
(2) Non-GAAP, please see non-GAAP reconciliation in appendix
(3) Payback period based on the number of years its takes to eliminate the tangible book value per share
dilution with the estimated pro forma PPBI EPS accretion
dilution with the estimated pro forma PPBI EPS accretion
17
Pro Forma Footprint
Source: SNL Financial
Note: Map does not include PPBI office s outside of California
1.0 Mile Apart
175 Yards Apart
PPBI Branch
Independence Branch
§ Strong geographic fit that enhances
southern California presence
southern California presence
§ Consolidating Independence branches
in Newport Beach and Fountain Valley
in Newport Beach and Fountain Valley
Headquarters are
1.25 miles apart
1.25 miles apart
18
Financial Impact and Assumptions
Financially
Compelling
Compelling
§ EPS accretion of approximately 5.0% in 2015 and 9.6% in 2016(2)
§ Tangible book value per share(3) dilution of approximately 5.0% at closing, payback period of approximately 3.2 years(4)
§ Internal rate of return in excess of 20%
§ Strong pro forma capital position - leverage ratio above 9.0% and risk based capital ratio above 13.5%
Valuation
Multiples
Multiples
§ Deal value / tangible book value per share of 139.3%(1)
§ Deal value / earnings per share for last twelve months of 20.7x(1)
Source: SNL Financial, financial data as of 9/30/2014
(1) Based on PPBI price of $14.73, market data as of 10/21/2014
(2) Based on PPBI mean EPS estimates for 2014 and 2015 per SNL FactSet research. Excludes non-recurring merger
related expenses in 2015
related expenses in 2015
(3) Non-GAAP, please see non-GAAP reconciliation in appendix
(4) Payback period based on the number of years its takes to eliminate the tangible book value per share dilution
with the estimated pro forma PPBI EPS accretion
with the estimated pro forma PPBI EPS accretion
Cost Savings
§ Estimated cost savings in excess of 45.0%
§ Assumption that cost savings are 75.0% phased-in during 2015 and 100.0% by 2016
Other
Assumptions
Assumptions
§ Fair value mark of -1.65% of gross loans, or $5.6 million, and -10.0% of fixed assets, or $200k
§ Pre-tax one-time transaction costs of approximately $6.3 million
§ Core deposit intangible asset of 1.42% or $4.2 million amortized over 8 years based on sum-of-years digits methodology
§ No revenue synergies assumed in modeling

19
Capital Resources
§ Well capitalized and equipped to execute on the Company’s growth strategy
§ Pure common equity capital structure (no TARP / preferred equity)
*Please refer to non-GAAP reconciliation
|
|
As of September 30, 2014
|
||
|
|
Well-Capitalized
Requirement |
Pacific Premier
Bancorp, Inc. |
Pacific Premier
Bank |
|
Stockholders' Equity
|
|
$ 197,857
|
$ 242,205
|
|
Tangible Common Equity
|
|
$ 169,040
|
$ 213,388
|
|
Tier 1 Capital
|
|
$ 178,727
|
$ 216,185
|
|
|
|
|
|
|
Regulatory Capital Ratios:
|
|
|
|
|
Tier 1 Leverage Capital Ratio
|
5.00%
|
9.50%
|
11.48%
|
|
Tier 1 Risk-Based Capital Ratio
|
6.00%
|
10.53%
|
12.77%
|
|
Total Risk Based Capital Ratio
|
10.00%
|
14.71%
|
13.42%
|
|
|
|
|
|
|
Tangible Common Equity Ratio*
|
|
8.43%
|
10.67%
|
20
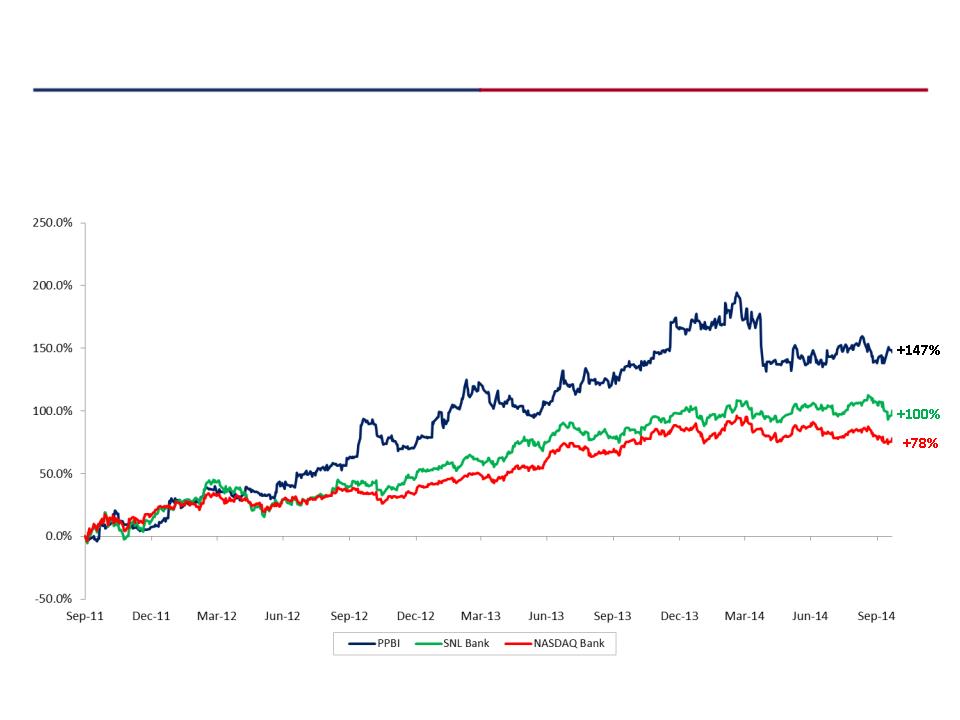
Superior Market Performance (PPBI)
Source: SNL Financial, market information as of 10/21/2014
§ The Company’s stock price has significantly outperformed its publicly traded bank peers (SNL Bank Index / NASDAQ Bank
Index) in the market over the last 3 years
Index) in the market over the last 3 years
§ Since September 2011, PPBI’s stock price is up 147% versus the SNL Bank at 100% and NASDAQ bank indices at 78%

21
§ Achieve economies of scale and operating leverage
§ Business lines that generate higher risk adjusted returns
§ Proven track record of executing on acquisitions and organic growth
§ Attractive acquisition opportunities in California
§ Deposit platform to fund future loan growth
§ Create scarcity value among banks in Southern California
PPBI Outlook
Continued Focus on Building Long-term Franchise Value

22
Appendix material
PPBI Supplemental Information
23
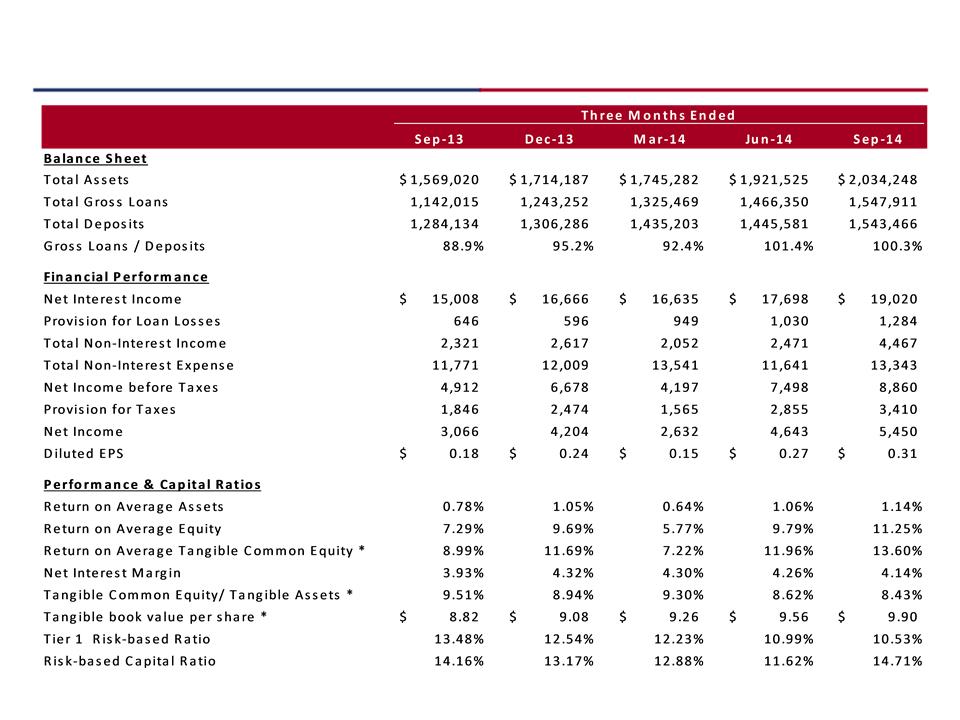
Financial Highlight Trends
Note: All dollars in thousands, except per share. *Please refer to non-GAAP reconciliation

24
Non-GAAP Financial Measures
Tangible common equity to tangible assets (the "tangible common equity ratio") and tangible book value per share are a non-GAAP financial measures derived from GAAP-based
amounts. We calculate the tangible common equity ratio by excluding the balance of intangible assets from common stockholders' equity and dividing by tangible assets. We calculate
tangible book value per share by dividing tangible common equity by common shares outstanding, as compared to book value per common share, which we calculate by dividing
common stockholders’ equity by common shares outstanding. We believe that this information is consistent with the treatment by bank regulatory agencies, which exclude intangible
assets from the calculation of risk-based capital ratios. Accordingly, we believe that these non-GAAP financial measures provide information that is important to investors and that is
useful in understanding our capital position and ratios. However, these non-GAAP financial measures are supplemental and are not a substitute for an analysis based on GAAP
measures. As other companies may use different calculations for these measures, this presentation may not be comparable to other similarly titled measures reported by other
companies. A reconciliation of the non-GAAP measure of tangible common equity ratio to the GAAP measure of common equity ratio and tangible book value per share to the GAAP
measure of book value per share are set forth below.
Note: All dollars in thousands, except per share data.
|
|
|
PPBI
|
|
PPB
|
||||||||
|
|
|
September 30,
|
|
December 31,
|
|
March 31,
|
|
June 30,
|
|
September 30,
|
|
September 30,
|
|
|
|
2013
|
|
2013
|
|
2014
|
|
2014
|
|
2014
|
|
2014
|
|
|
|
|
|
|
|
|
|
|
|
|
|
|
|
Total stockholders' equity
|
|
$ 171,154
|
|
$ 175,226
|
|
$ 188,860
|
|
$ 192,181
|
|
$ 197,857
|
|
$ 242,205
|
|
Less: Intangible assets
|
|
(24,309)
|
|
(24,056)
|
|
(29,324)
|
|
(29,071)
|
|
(28,817)
|
|
(28,817)
|
|
Tangible common equity
|
|
$ 146,845
|
|
$ 151,170
|
|
$ 159,536
|
|
$ 163,110
|
|
$ 169,040
|
|
$ 213,388
|
|
|
|
|
|
|
|
|
|
|
|
|
|
|
|
Total assets
|
|
$ 1,569,020
|
|
$ 1,714,187
|
|
$ 1,745,282
|
|
$ 1,921,525
|
|
$ 2,034,248
|
|
$ 2,029,550
|
|
Less: Intangible assets
|
|
(24,309)
|
|
(24,056)
|
|
(29,324)
|
|
(29,071)
|
|
(28,817)
|
|
(28,817)
|
|
Tangible assets
|
|
$ 1,544,711
|
|
$ 1,690,131
|
|
$ 1,715,958
|
|
$ 1,892,454
|
|
$ 2,005,431
|
|
$ 2,000,733
|
|
|
|
|
|
|
|
|
|
|
|
|
|
|
|
Common Equity ratio
|
|
10.91%
|
|
10.22%
|
|
10.82%
|
|
10.00%
|
|
9.73%
|
|
11.93%
|
|
Less: Intangibility equity ratio
|
|
(1.40%)
|
|
(1.28%)
|
|
(1.52%)
|
|
(1.38%)
|
|
(1.30%)
|
|
(1.26%)
|
|
Tangible common equity ratio
|
|
9.51%
|
|
8.94%
|
|
9.30%
|
|
8.62%
|
|
8.43%
|
|
10.67%
|
|
|
|
|
|
|
|
|
|
|
|
|
|
|
|
Basic shares outstanding
|
|
16,641,991
|
|
16,656,279
|
|
17,224,977
|
|
17,068,641
|
|
17,068,641
|
|
|
|
|
|
|
|
|
|
|
|
|
|
|
|
|
|
Book value per share
|
|
$ 10.28
|
|
$ 10.52
|
|
$ 10.96
|
|
$ 11.26
|
|
$ 11.59
|
|
|
|
Less: Intangible book value per share
|
|
(1.46)
|
|
(1.44)
|
|
(1.70)
|
|
(1.70)
|
|
(1.69)
|
|
|
|
Tangible book value per share
|
|
$ 8.82
|
|
$ 9.08
|
|
$ 9.26
|
|
$ 9.56
|
|
$ 9.90
|
|
|
25
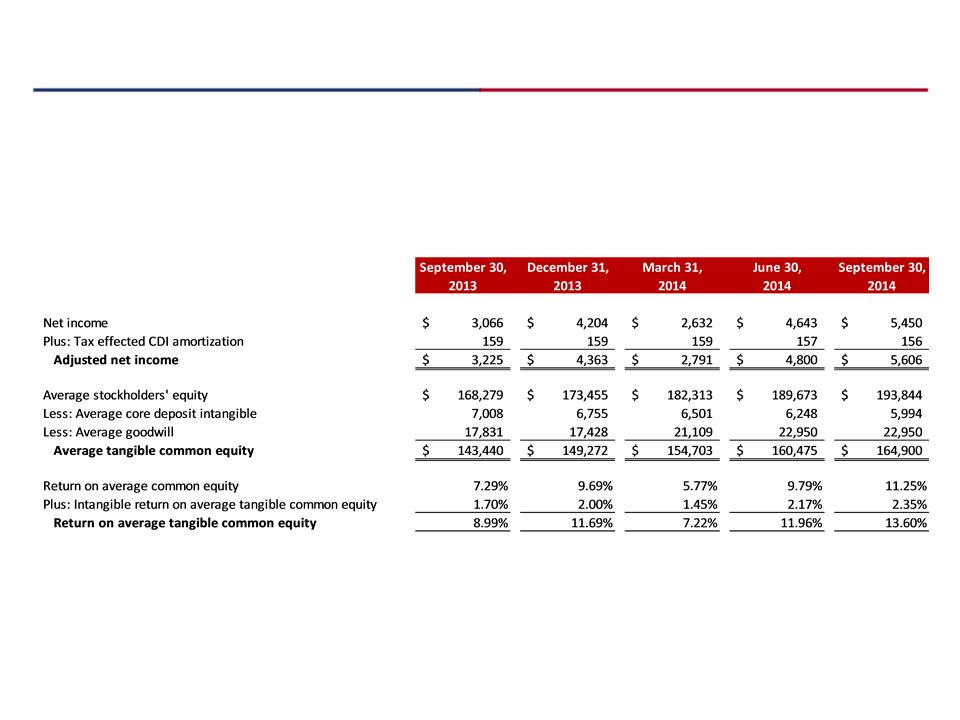
Non-GAAP Financial Measures
For the periods presented below, adjusted net income and average tangible common equity are non-GAAP financial measures derived from GAAP-based amounts. We calculate return
on average tangible common equity by adjusting net income for the effect of CDI amortization and exclude the average CDI and average goodwill from the average stockholders'
equity during the period. We believe that this is consistent with the treatment by bank regulatory agencies, which exclude intangible assets from the calculation of risk-based capital
ratios. Accordingly, we believe that these non-GAAP financial measures provide information that is important to investors and that is useful in understanding our capital position and
ratios. However, these non-GAAP financial measures are supplemental and are not a substitute for an analysis based on GAAP measures. As other companies may use different
calculations for these adjusted measures, this presentation may not be comparable to other similarly titled adjusted measures reported by other companies. A reconciliation of the non-
GAAP measure of return on average tangible common equity to the GAAP measure of return on common stockholders’ equity is set forth below.
Note: All dollars in thousands