Attached files
| file | filename |
|---|---|
| 8-K - CURRENT REPORT - SEACOAST BANKING CORP OF FLORIDA | v392507_8k.htm |
| EX-99.2 - EXHIBIT 99.2 - SEACOAST BANKING CORP OF FLORIDA | v392507_ex99-2.htm |
| EX-99.1 - EXHIBIT 99.1 - SEACOAST BANKING CORP OF FLORIDA | v392507_ex99-1.htm |
Exhibit 99.3

Third Quarter 2014 October 28, 2014
2 Cautionary Notice Regarding Forward - Looking Statements This press release contains “forward - looking statements” within the meaning of Section 27 A of the Securities Act of 1933 and Section 21 E of the Securities Exchange Act of 1934 , including, without limitation, statements about future financial and operating results, ability to realized deferred tax assets, cost savings, enhanced revenues, economic and seasonal conditions in our markets, and improvements to reported earnings that may be realized from cost controls and for integration of banks that we have acquired, as well as statements with respect to Seacoast’s objectives, expectations and intentions and other statements that are not historical facts . Actual results may differ from those set forth in the forward - looking statements . Forward - looking statements include statements with respect to our beliefs, plans, objectives, goals, expectations, anticipations, estimates and intentions, and involve known and unknown risks, uncertainties and other factors, which may be beyond our control, and which may cause the actual results, performance or achievements of Seacoast to be materially different from future results, performance or achievements expressed or implied by such forward - looking statements . You should not expect us to update any forward - looking statements . You can identify these forward - looking statements through our use of words such as “may,” “will,” “anticipate,” “assume,” “should,” “support”, “indicate,” “would,” “believe,” “contemplate,” “expect,” “estimate,” “continue,” “further”, “point to,” “project,” “could,” “intend” or other similar words and expressions of the future . These forward - looking statements may not be realized due to a variety of factors, including, without limitation : the effects of future economic and market conditions, including seasonality ; governmental monetary and fiscal policies, as well as legislative, tax and regulatory changes ; changes in accounting policies, rules and practices ; the risks of changes in interest rates on the level and composition of deposits, loan demand, liquidity and the values of loan collateral, securities, and interest sensitive assets and liabilities ; interest rate risks, sensitivities and the shape of the yield curve ; the effects of competition from other commercial banks, thrifts, mortgage banking firms, consumer finance companies, credit unions, securities brokerage firms, insurance companies, money market and other mutual funds and other financial institutions operating in our market areas and elsewhere, including institutions operating regionally, nationally and internationally, together with such competitors offering banking products and services by mail, telephone, computer and the Internet ; and the failure of assumptions underlying the establishment of reserves for possible loan losses . The risks of mergers and acquisitions, include, without limitation : unexpected transaction costs, including the costs of integrating operations ; the risks that the businesses will not be integrated successfully or that such integration may be more difficult, time - consuming or costly than expected ; the potential failure to fully or timely realize expected revenues and revenue synergies, including as the result of revenues following the merger being lower than expected ; the risk of deposit and customer attrition ; any changes in deposit mix ; unexpected operating and other costs, which may differ or change from expectations ; the risks of customer and employee loss and business disruption, including, without limitation, as the result of difficulties in maintaining relationships with employees ; increased competitive pressures and solicitations of customers by competitors ; as well as the difficulties and risks inherent with entering new markets . All written or oral forward - looking statements attributable to us are expressly qualified in their entirety by this cautionary notice, including, without limitation, those risks and uncertainties described in our annual report on Form 10 - K for the year ended December 31 , 2013 under “Special Cautionary Notice Regarding Forward - Looking Statements” and “Risk Factors”, and otherwise in our SEC reports and filings . Such reports are available upon request from the Company, or from the Securities and Exchange Commission, including through the SEC’s Internet website at http : //www . sec . gov .

3 Q3 2014 Financial and Growth Highlights Financial Highlights • Earnings per share of $0.12 for the third quarter, up from $0.07 in the prior quarter • Adjusted pretax, preprovision earnings* up 14% over the second quarter • Core net interest income** up $723 thousand, or over 4% compared to prior year • Asset quality improvement results in $1.4 million provision for loan loss recapture Growth Highlights • Merger with The BANKshares, Inc. completed October 1, 2014 • Total loans outstanding up $128 million or 10% compared to one year ago • Demand deposits (noninterest bearing) increased to 29% of total deposits from 27% one year ago; proforma mix with BANKshares of 31% • Total deposits excluding certificates of deposit increased $146 million or 10% compared to one year ago * Non - GAAP measure, excludes merger related legal and professional fees and other non core expenses (See Appendix for reconcilia tion to GAAP) ** Excludes non - accrual interest recoveries of $505 thousand in Q3 2013 and $192 thousand in Q3 2014

4 Consistent Loan Growth In All Portfolios • Total loans increased over 10% year over year to $ 1.391 billion • Commercial loans increased $37 million from Q2 and $91 million or over 15% year over year • Residential production of $66 million, an 8% increase over Q2 • Commercial Real Estate loans have increased 14% year over year 598 632 637 653 689 665 672 675 682 702 3Q13 4Q13 1Q14 2Q14 3Q14 Total Loans ............................................................................................................................. ... ............. ($ in millions) Commercial Consumer $1,263 $1,312 $1,335 $1,304 $1,391

5 Consistent Growth in Low Cost Deposits • Average non - interest bearing d emand d eposits up $51 million or 11% compared to prior year • Total average deposits increased $86 million or 5% over prior year • Non - interest bearing and low - cost deposits were 86% of total average deposits compared to 83% one year ago 455 463 481 506 506 970 1,006 1,036 1,041 1,042 289 283 270 259 252 3Q13 4Q13 1Q14 2Q14 3Q14 Average Deposit Balances ............................................................................................................................. .. ($ in millions) Non-Interest Bearing Low Cost Deposits Time Deposits $1,714 $1,787 $1,806 $1,752 $1,800

6 Funding Costs Continue to Decline • Cost of interest - bearing liabilities declined 4 basis points compared to one year ago • Improved deposit mix lowered total cost of deposits by 3 basis points compared to Q3 2013 15 14 14 13 12 36 35 33 33 32 3Q13 4Q13 1Q14 2Q14 3Q14 Funding Costs ................................................................................................... (in bps) Deposit Costs Interest - Bearing Liabilities

7 Net Interest Margin Improves • Net interest margin improves 7 basis points from Q2 • Net interest income increased $503 thousand linked quarter • Core net interest income* up $311 thousand linked quarter and $723 thousand year over year 16,872* 16,336 16,277 16,779 17,282* 3.25% 3.08% 3.07% 3.10% 3.17% Q3-2013 Q4-2013 Q1-2014 Q2-2014 Q3-2014 Net Interest Income and Net Interest Margin ……………………………................................................................................... Net Interest Income Net Interest Margin * Q3 2013 and Q3 2014 includes non - accrual interest recoveries of $505 thousand and $192 thousand respectively

8 Non - Interest Income • Non - interest income increased $253 thousand from Q2, or 4% • Excluding mortgage banking fees, non - interest income increased $312 thousand or 6% year over year • Wealth Management fees up $175 thousand or 17% from Q3 2013 • Service charges on deposits increased $269 thousand or 18% linked quarter 1,741 1,778 1,507 1,484 1,753 1,075 728 661 855 825 1,050 1,154 1,050 1,113 1,225 283 215 254 340 281 1,358 1,394 1,403 1,514 1,452 580 697 683 590 613 3Q13 4Q13 1Q14 2Q14 3Q14 Non - Interest Income ............................................................................................................................. ... ............. ($ in thousands) Service Charges on Deposits Mortgage Banking Fees Wealth Management Income Marine Finance Interchange Income Other $6,149 $5,558 $5,966 $5,896 $6,087
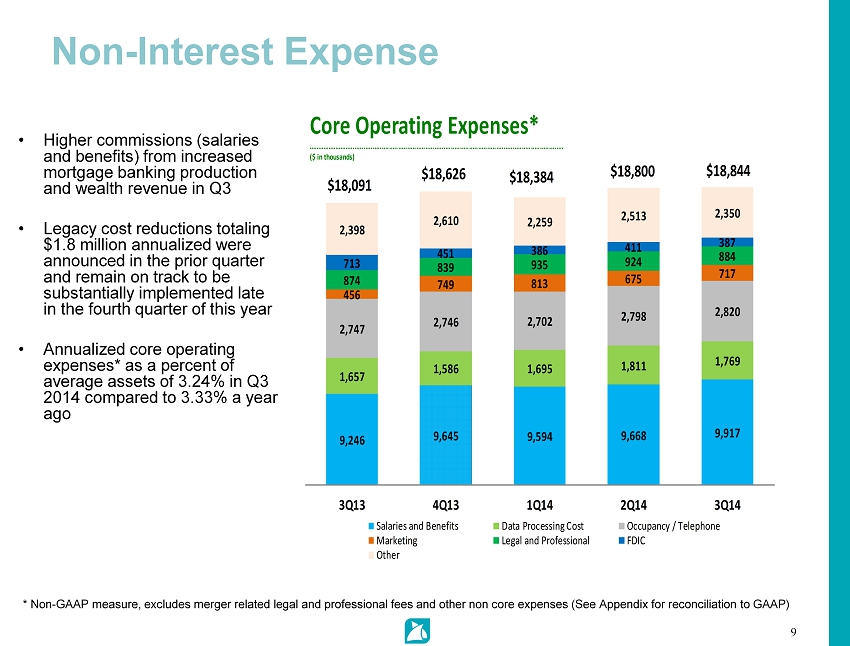
9 Non - Interest Expense • Higher commissions (salaries and benefits) from increased mortgage banking production and wealth revenue in Q3 • Legacy cost reductions totaling $1.8 million annualized were announced in the prior quarter and remain on track to be substantially implemented late in the fourth quarter of this year • Annualized core operating expenses* as a percent of average assets of 3.24% in Q3 2014 compared to 3.33% a year ago 9,246 9,645 9,594 9,668 9,917 1,657 1,586 1,695 1,811 1,769 2,747 2,746 2,702 2,798 2,820 456 749 813 675 717 874 839 935 924 884 713 451 386 411 387 2,398 2,610 2,259 2,513 2,350 3Q13 4Q13 1Q14 2Q14 3Q14 Core Operating Expenses* ............................................................................................................................. ... ............. ($ in thousands) Salaries and Benefits Data Processing Cost Occupancy / Telephone Marketing Legal and Professional FDIC Other $18,091 $18,626 $18,384 $18,800 $18,844 * Non - GAAP measure, excludes merger related legal and professional fees and other non core expenses (See Appendix for reconcilia tion to GAAP)

10 Asset Quality Improvement • Net recoveries of $856 thousand in Q3 • NPLs have declined 34% year over year • Loan loss provision reversal of $1.4 million in Q3 • Nonperforming assets to total assets declined to 1.0%, compared to 1.6% a year ago $28,724 $27,672 $26,220 $21,745 71.08% 72.52% 74.26% 83.42% 92.76% Q3-2013 Q4-2013 Q1-2014 Q2-2014 Q3-2014 NPLs Coverage Ratio NPLs and Coverage Ratio NPLs and Coverage Ratio NPLs and Coverage Ratio NPLs and Coverage Ratio NPLs and Coverage Ratio NPLs and Coverage Ratio NPLs and Coverage Ratio NPLs and Coverage Ratio $ 18,942 $842 $838 ($139) ($112) ($856) 0.26% 0.26% - 0.04% - 0.03% - 0.25% Q3-2013 Q4-2013 Q1-2014 Q2-2014 Q3-2014 NCOs (Recoveries) NCO Ratio Net Charge - offs and Ratio

11 2014 - 2015 Initiatives Building Shareholder Value • Continue revenue and growth momentum with integration of The BANKshares, Inc. • R eduction of legacy costs and operational expense • Focus on customer acquisition and diversified lending Growing Our Franchise • Accelerated growth through additional acquisition opportunities • Enhance customer experience through reinvestment in branch network • Leverage investments in marketing and data analytics

12 Appendix

13 Net Income - GAAP to Non - GAAP Reconciliation: Presented below is net income excluding adjustments for merger related legal and professional fees and other non core expenses. The Company believes that these results of operations are a more meaningful depiction of the underlying fundamentals of its business and overall performance. (1) Non - GAAP Measure (Dollars in thousands) Third Quarter 2014 Second Quarter 2014 First Quarter 2014 Fourth Quarter 2013 Third Quarter 2013 Net Income Available to Common Shareholders $2,996 $1,918 $2,299 $588 $44,204 Tax benefit related to deferred tax asset recovery 0 0 0 0 (42,993) Severance 328 181 212 0 24 Legal and professional fees for acquisition and expense initiatives 467 1,348 6 0 0 Security losses (gains) (344) 0 (17) 0 (280) Miscellaneous losses (45) 144 0 190 0 Recovery of prior legal fees 0 0 0 (350) 0 Recovery of non-accrual loan interest (192) 0 0 0 (505) Net loss on OREO and repossessed assets 156 92 53 0 229 Asset dispositions expense 139 118 128 180 159 Effective tax rate on adjustments (219) (811) (148) (8) 144 Adjusted Net Income (1) $3,286 $2,990 $2,533 $600 $982 Provision (recapture) for loan losses (1,425) (1,444) (735) 490 1,180 Income taxes 2,480 2,275 1,597 1,265 1,207 Preferred stock dividends and accretion of discount 0 0 0 1,262 937 Adjusted Pretax, Preprovision Income (1) $4,341 $3,821 $3,395 $3,617 $4,306 Adjusted Earnings per diluted share (1) $0.13 $0.12 $0.10 $0.03 $0.05 Average shares outstanding 26,026 25,998 25,657 21,558 19,098
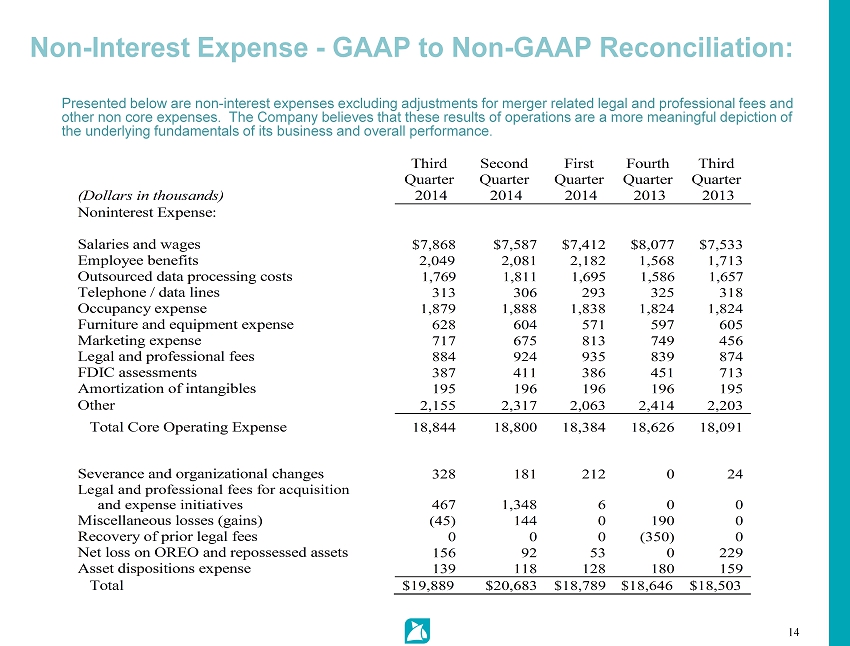
14 Non - Interest Expense - GAAP to Non - GAAP Reconciliation: Presented below are non - interest expenses excluding adjustments for merger related legal and professional fees and other non core expenses. The Company believes that these results of operations are a more meaningful depiction of the underlying fundamentals of its business and overall performance. (Dollars in thousands) Third Quarter 2014 Second Quarter 2014 First Quarter 2014 Fourth Quarter 2013 Third Quarter 2013 Noninterest Expense: Salaries and wages $7,868 $7,587 $7,412 $8,077 $7,533 Employee benefits 2,049 2,081 2,182 1,568 1,713 Outsourced data processing costs 1,769 1,811 1,695 1,586 1,657 Telephone / data lines 313 306 293 325 318 Occupancy expense 1,879 1,888 1,838 1,824 1,824 Furniture and equipment expense 628 604 571 597 605 Marketing expense 717 675 813 749 456 Legal and professional fees 884 924 935 839 874 FDIC assessments 387 411 386 451 713 Amortization of intangibles 195 196 196 196 195 Other 2,155 2,317 2,063 2,414 2,203 Total Core Operating Expense 18,844 18,800 18,384 18,626 18,091 Severance and organizational changes 328 181 212 0 24 Legal and professional fees for acquisition and expense initiatives 467 1,348 6 0 0 Miscellaneous losses (gains) (45) 144 0 190 0 Recovery of prior legal fees 0 0 0 (350) 0 Net loss on OREO and repossessed assets 156 92 53 0 229 Asset dispositions expense 139 118 128 180 159 Total $19,889 $20,683 $18,789 $18,646 $18,503
15