Attached files
| file | filename |
|---|---|
| 8-K - 8-K - KAPSTONE PAPER & PACKAGING CORP | a14-23100_18k.htm |
| EX-99.1 - EX-99.1 - KAPSTONE PAPER & PACKAGING CORP | a14-23100_1ex99d1.htm |
Exhibit 99.2
|
|
2014 Third Quarter Review Roger W. Stone Chairman and Chief Executive Officer October 29, 2014 Andrea K. Tarbox Vice President and Chief Financial Officer 1 |
|
|
Forward Looking Statements Forward-Looking Statements The information in this presentation and statements made during this presentation may contain certain forward-looking statements within the meaning of federal securities laws. These statements reflect management’s expectations regarding future events and operating performance. Risk Factors These forward-looking statements involve a number of risks and uncertainties. A list of the factors that could cause actual results to differ materially from those expressed in, or underlying, any forward-looking statements can be found in the Company’s filings with the Securities and Exchange Commission, such as its annual and quarterly reports. The Company disclaims any obligation to revise or update such statements to reflect the occurrence of events after the date of this presentation. Non-GAAP Financial Measures This presentation refers to non-U.S. GAAP financial information. A reconciliation of non-U.S. GAAP to U.S. GAAP financial measures is available on the company’s website at KapStonepaper.com under Investors. 2 |
|
|
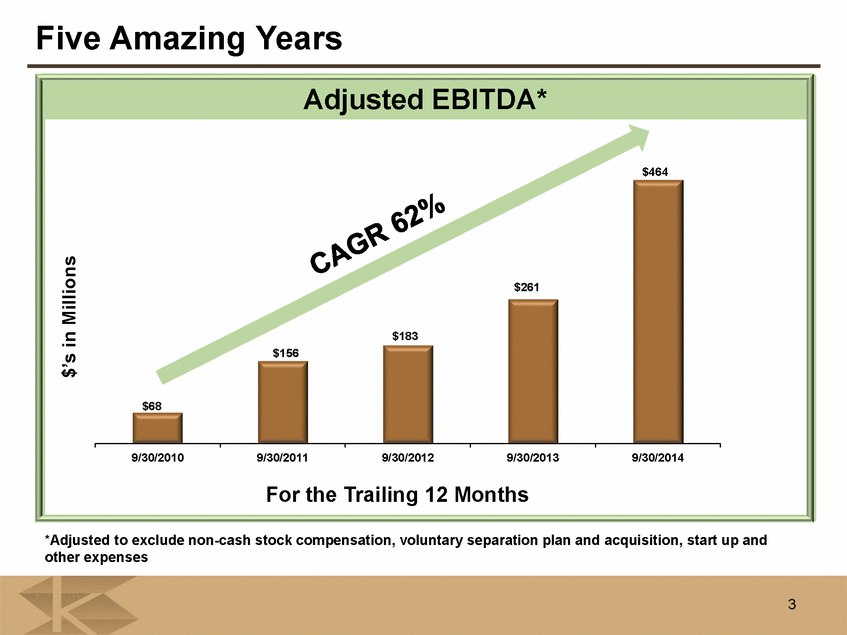
Five Amazing Years Adjusted EBITDA* Millions $464 $261 $183 $’s in $156 $68 9/30/2010 9/30/2011 9/30/2012 9/30/2013 9/30/2014 For the Trailing 12 Months *Adjusted to exclude non-cash stock compensation, voluntary separation plan and acquisition, start up and other expenses 3 |
|
|
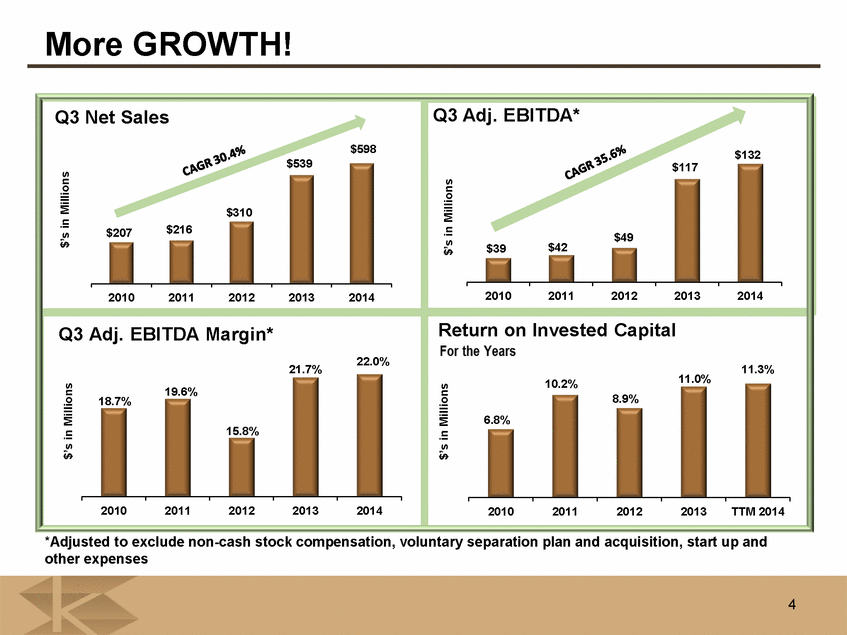
More GROWTH! Q3 Net Sales Q3 Adj. EBITDA* $598 Millions $132 $539 Millions $117 $310 $207 $216 $’s in $49 $’s in $39 $42 2010 2011 2012 2013 2014 2010 2011 2012 2013 2014 Q3 Adj. EBITDA Margin* Return on Invested Capital 22.0% Millions 21.7% Millions 11.3% 10.2% 11.0% 19.6% 18.7% 8.9% 6.8% $’s in 15.8% $’s in 2010 2011 2012 2013 2014 2010 2011 2012 2013 TTM 2014 *Adjusted to exclude non-cash stock compensation, voluntary separation plan and acquisition, start up and other expenses 4 |
|
|
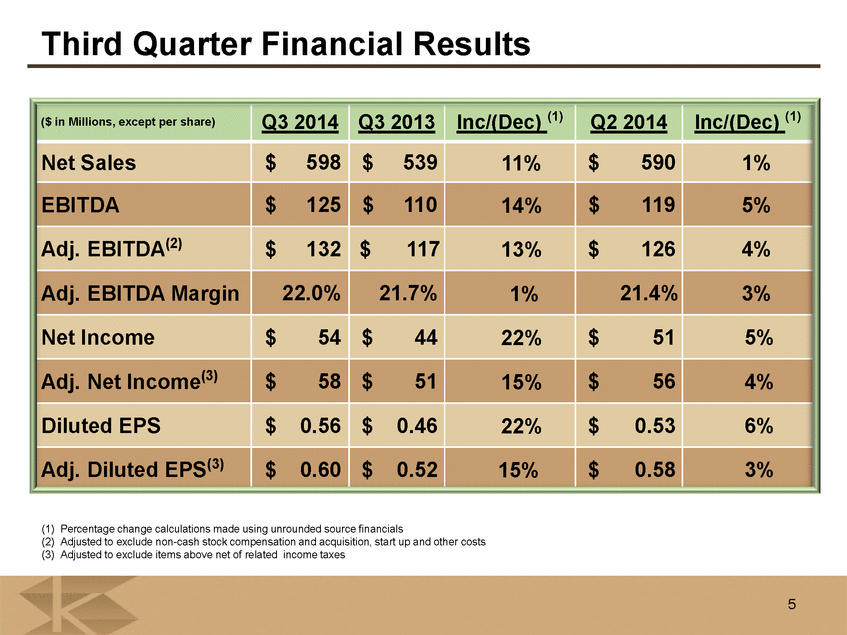
Third Quarter Financial Results ($ in Millions, except per share) Q3 2014 Q3 2013 Inc/(Dec) (1) Q2 2014 Inc/(Dec) (1) Net Sales $ 598 $ 539 11% $ 590 1% EBITDA $ 125 $ 110 14% $ 119 5% Adj. EBITDA(2) $ 132 $ 117 13% $ 126 4% Adj. EBITDA Margin 22.0% 21.7% 1% 21.4% 3% Net Income $ 54 $ 44 22% $ 51 5% Adj. Net Income(3) $ 58 $ 51 15% $ 56 4% Diluted EPS $ 0.56 $ 0.46 22% $ 0.53 6% Adj. Diluted EPS(3) $ 0.60 $ 0.52 15% $ 0.58 3% (1) Percentage change calculations made using unrounded source financials (2) Adjusted to exclude non-cash stock compensation and acquisition, start up and other costs (3) Adjusted to exclude items above net of related income taxes 5 |
|
|
Q3 2014 Compared to Q2 2014 Actual Mill Productivity Drives Improvement Net Sales Adjusted EBITDA $3 $2 $7 $3 $2 $7 $598 $1 $1 $132 $590 $126 $ in Millions $ in Millions Net sales benefited from improved operations that produced 28,000 additional mill tons, one additional mill production day in Q3, and higher corrugated volumes Partially offsetting were 25,000 tons of increased internal mill sales Favorable price reflects partial realization of the 2014 kraft paper price increase not fully realized until September Unfavorable mix due to lower kraft paper volume as customers purchased more in Q2 ahead of price increase and increased export containerboard sales Productivity reflects favorable mill performance resulting from capital improvements projects and cost reduction measures implemented 6 |
|
|
Q3 2014 Compared to Q3 2013 Actual Productivity Gains and Longview Propel Adjusted EBITDA Net Sales Adjusted EBITDA $598 $4 $4 $5 $43 $12 $4 $8 $4 $1 $132 $539 $117 $10 $ in Millions $ in Millions Compared to Q3 2013, the Longview acquisition added $43 million in sales and $8 million of adjusted EBITDA as Q3 2014 included 17 days of additional activity Productivity includes 29,000 additional mill tons, acquisition synergies and cost savings Synergies from the Longview acquisition are now expected to reach $23 million by late 2015 Annualized synergies realized to date total $19 million Sales volume/mix reflects higher corrugated products shipments offset by lower external domestic containerboard volume as tons were used for internal consumption Price improvement reflects realization of the 2014 kraft paper price increase partially offset lower export containerboard prices Inflation reduced adjusted EBITDA by $5 million due to fiber, freight and compensation increases Outage costs increased $4 million in 2014 for legacy KapStone due to timing of Charleston outage 7 |
|
|
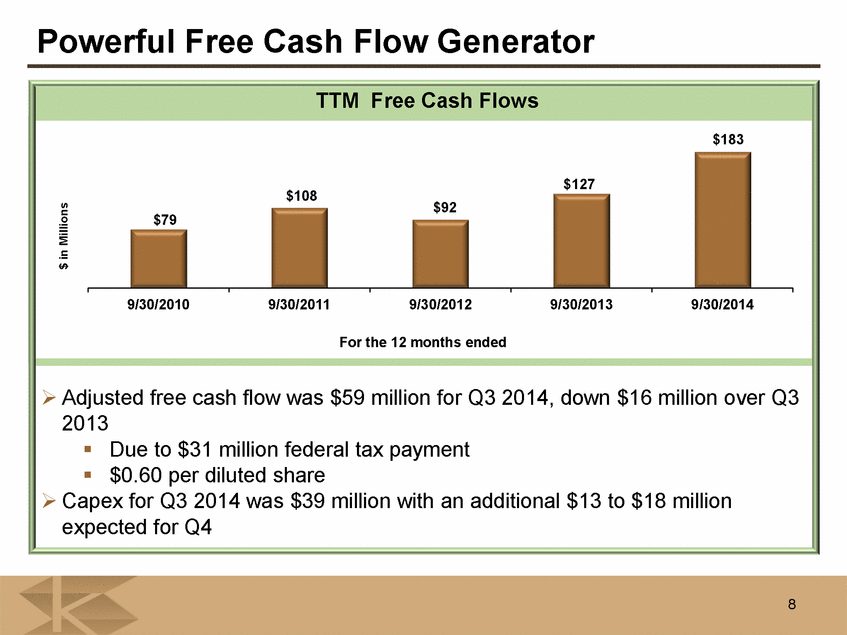
Powerful Free Cash Flow Generator TTM Free Cash Flows $183 $127 $108 $92 $ in Millions $79 9/30/2010 9/30/2011 9/30/2012 9/30/2013 9/30/2014 For the 12 months ended Adjusted free cash flow was $59 million for Q3 2014, down $16 million over Q3 2013 Due to $31 million federal tax payment $0.60 per diluted share Capex for Q3 2014 was $39 million with an additional $13 to $18 million expected for Q4 8 |
|
|
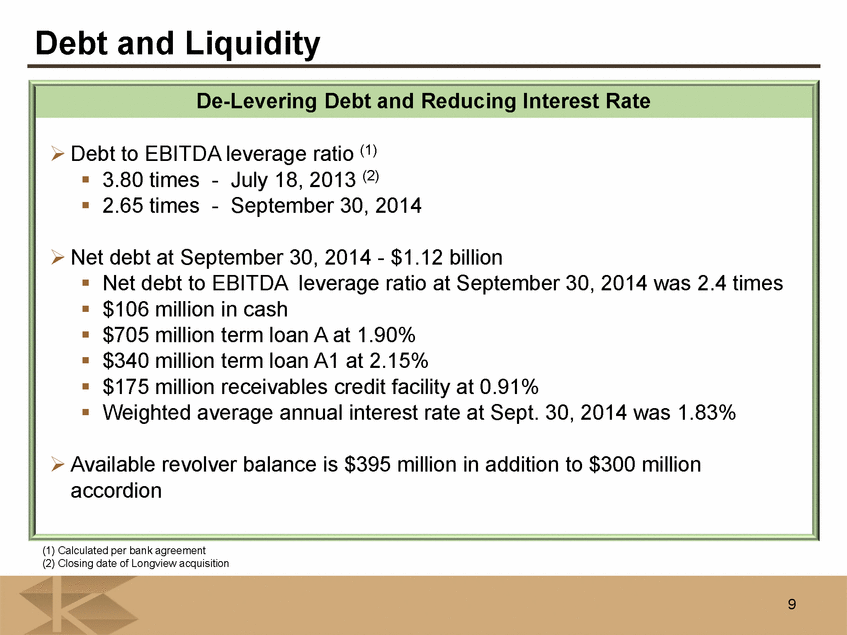
Debt and Liquidity De-Levering Debt and Reducing Interest Rate Debt to EBITDA leverage ratio (1) 3.80 times - July 18, 2013 (2) 2.65 times - September 30, 2014 Net debt at September 30, 2014 - $1.12 billion Net debt to EBITDA leverage ratio at September 30, 2014 was 2.4 times $106 million in cash $705 million term loan A at 1.90% $340 million term loan A1 at 2.15% $175 million receivables credit facility at 0.91% Weighted average annual interest rate at Sept. 30, 2014 was 1.83% Available revolver balance is $395 million in addition to $300 million accordion (1) Calculated per bank agreement (2) Closing date of Longview acquisition 9 |
|
|
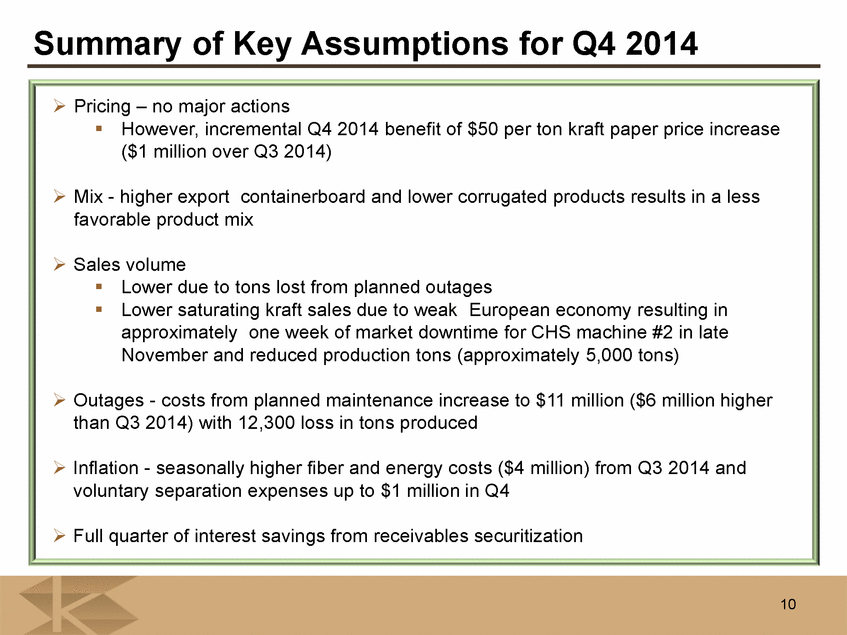
Summary of Key Assumptions for Q4 2014 Pricing – no major actions However, incremental Q4 2014 benefit of $50 per ton kraft paper price increase ($1 million over Q3 2014) Mix - higher export containerboard and lower corrugated products results in a less favorable product mix Sales volume Lower due to tons lost from planned outages Lower saturating kraft sales due to weak European economy resulting in approximately one week of market downtime for CHS machine #2 in late November and reduced production tons (approximately 5,000 tons) Outages - costs from planned maintenance increase to $11 million ($6 million higher than Q3 2014) with 12,300 loss in tons produced Inflation - seasonally higher fiber and energy costs ($4 million) from Q3 2014 and voluntary separation expenses up to $1 million in Q4 Full quarter of interest savings from receivables securitization 10 |
|
|
Appendix |
|
|
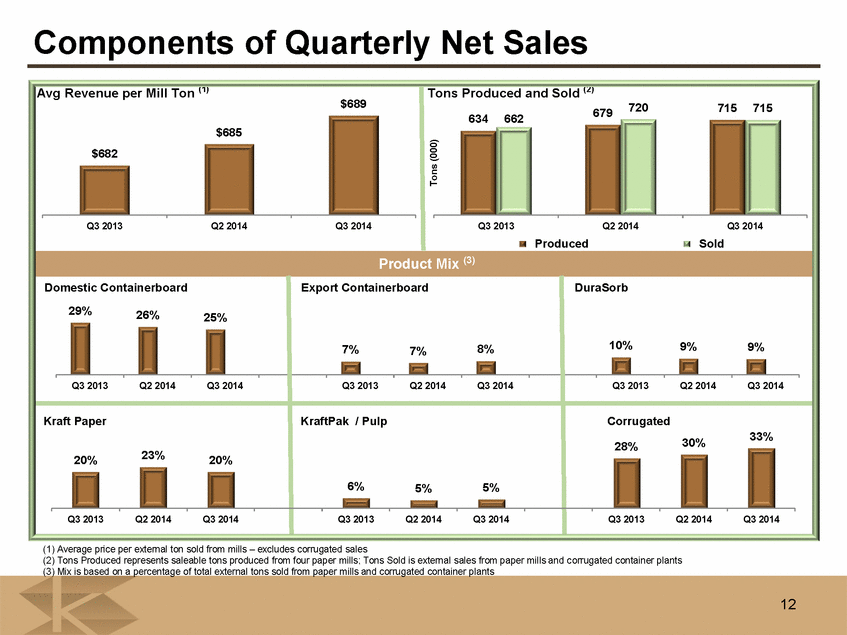
Components of Quarterly Net Sales Avg Revenue per Mill Ton (1) Tons Produced and Sold (2)$689 720 715 715 679 634 662 $685 $682 Tons (000) Q3 2013 Q2 2014 Q3 2014 Q3 2013 Q2 2014 Q3 2014 Produced Sold Product Mix (3) Domestic Containerboard Export Containerboard DuraSorb 29% 26% 25% 7% 8% 10% 9% 9% 7% Q3 2013 Q2 2014 Q3 2014 Q3 2013 Q2 2014 Q3 2014 Q3 2013 Q2 2014 Q3 2014 Kraft Paper KraftPak / Pulp Corrugated 33% 28% 30% 20% 23% 20% 6% 5% 5% Q3 2013 Q2 2014 Q3 2014 Q3 2013 Q2 2014 Q3 2014 Q3 2013 Q2 2014 Q3 2014 (1) Average price per external ton sold from mills – excludes corrugated sales (2) Tons Produced represents saleable tons produced from four paper mills; Tons Sold is external sales from paper mills and corrugated container plants (3) Mix is based on a percentage of total external tons sold from paper mills and corrugated container plants 12 |
|
|
Maintenance Outage Expense & Production 2013 Actual Q1 Q2 Q3 Q4 Financial Impact $ 4.7 $ 8.5 $ 1.1 $ 10.5 Production Impact - 9,432 - 12,500 2014 Actual/Expected Q1A Q2A Q3A Q4E Financial Impact $ 14.8 $ 5.2 $ 5.2 $ 11.2 Production Impact 14,300 5,400 - 12,300 13 |

