Attached files
| file | filename |
|---|---|
| 8-K - 8-K - US FOODS, INC. | d809972d8k.htm |
| Exhibit 99.1
|
A Taste of What’s Cooking at US Foods Q3 2014 Performance Update October 2014
|
|
While the information provided herein is believed to be accurate and reliable, US Foods (“US Foods”) does not make any representations or warranties, express or implied, as to the accuracy or completeness of such information or as to future results. No representation or warranty is made that any of the projections presented herein will be realized. Forward-looking statements notice This presentation and related comments by our management may include “forward-looking statements.” Our use of the words “expect,” “anticipate,” “possible,” “potential,” “target,” “believe,” “commit,” “intend,” “continue,” “may,” “would,” “could,” “should,” “project,” “projected,” “positioned” or similar expressions is intended to identify forward-looking statements that represent our current judgment about possible future events. We believe these judgments are reasonable, but these statements are not guarantees of any events or financial results, and our actual results may differ materially due to a variety of important factors. Among other items, such factors might include: our ability to remain profitable during times of cost inflation, commodity volatility, and other factors; competition in the industry and our ability to compete successfully; our reliance on third-party suppliers, including the impact of any interruption of supplies or increases in product costs; shortages of fuel and increases or volatility in fuel costs; any declines in the consumption of food prepared away from home, including as a result of changes in the economy or other factors affecting consumer confidence; costs and risks associated with labor relations and the availability of qualified labor; any change in our relationships with group purchasing organizations; our ability to increase sales to independent customers; changes in industry pricing practices; changes in cost structure of competitors; costs and risks associated with government laws and regulations, including environmental, health, safety, food safety, transportation, labor and employment, laws and regulations, and changes in existing laws or regulations; technology disruptions and our ability to implement new technologies; liability claims relating to products that we distribute; our ability to maintain a good reputation; costs and risks associated with litigation; our ability to manage future expenses and liabilities with respect to our retirement benefits; our ability to successfully integrate future acquisitions; our ability to achieve the benefits that we expect to achieve from our cost savings programs; risks relating to our indebtedness, including our substantial amount of debt, our ability to incur substantially more debt, increases in interest rates; risks related to and our ability to consummate the proposed acquisition by Sysco, including risks to our relationships with customers, vendors and employees. Additional information regarding these factors is contained in the company’s filings with the Securities and Exchange Commission, including, without limitation, its Annual Report on Form 10-K for the fiscal year ended December 28, 2013. All forward-looking statements speak only as of the date they were made. The company does not undertake any obligation to update or publicly release any revisions to any forward-looking statements to reflect events, circumstances or changes in expectations after the date of this presentation. FOOD. FOOD PEOPLE. EASY. 1
|
|
Non-GAAP financial measures This presentation contains unaudited non-GAAP financial measures, including Reported EBITDA, Adjusted EBITDA, Consolidated EBITDA, Debt Coverage Ratio, Interest Coverage Ratio, Adjusted Operating Expenses and Adjusted Gross Profit. Management believes these non-GAAP financial measures provide meaningful supplemental information regarding our operating performance because they exclude amounts that our management and our board of directors do not consider part of core operating results when assessing the performance of the Company. Our management uses these non-GAAP financial measures to evaluate the Company’s historical financial performance, establish future operating and capital budgets and determine variable compensation for management and employees. Accordingly, the Company believes these non-GAAP financial measures are useful in allowing for a better understanding of the Company’s core operations. While management believes that these non-GAAP financial measures provide useful information, they are not operating measures under U.S. GAAP, and there are limitations associated with their use. The Company’s calculation of these non-GAAP financial measures may not be completely comparable to similarly titled measures of other companies due to potential differences between companies in their method of calculation. As a result the use of these non-GAAP financial measures has limitations and should not be considered in isolation from, or as a substitute for, other measures such as Net income or Net income attributable to stockholders. Due to these limitations, these non-GAAP financial measures are used as a supplement to U.S. GAAP measures and should not be considered as a substitute for net income (loss) from continuing operations, operating profit or any other performance measures derived in accordance with GAAP, nor are they a substitute for cash flow from operating activities as a measure of our liquidity. Management uses Adjusted EBITDA Margin and Consolidated EBITDA Margin to focus on year-over-year changes in the Company’s business and believes this information is also helpful to investors. The Company uses Adjusted EBITDA in these EBITDA-related margin measures because it believes its investors are familiar with Adjusted EBITDA and that consistency in presentation of EBITDA-related measures is helpful to investors. Management also uses Debt Coverage Ratios and Interest Coverage Ratios to focus management on year-over-year changes in the Company’s leverage and believes this information is also helpful to investors. The Company cautions investors that these non-GAAP financial measures presented also are intended to supplement the Company’s GAAP results and are not a substitute for such results. Additionally, the Company cautions investors that the non-GAAP financial measures used by the Company may differ from the non-GAAP measures used by other companies. Please see the Appendix for a reconciliation of the differences between the non-GAAP financial measures to the most directly comparable GAAP financial measures. FOOD. FOOD PEOPLE. EASY. 2
|
|
Agenda Business Highlights Quarterly Financial Update Closing Comments Appendix FOOD. FOOD PEOPLE. EASY. 3
|
|
Agenda Business Highlights Quarterly Financial Update Closing Comments Appendix FOOD. FOOD PEOPLE. EASY. 4
|
|
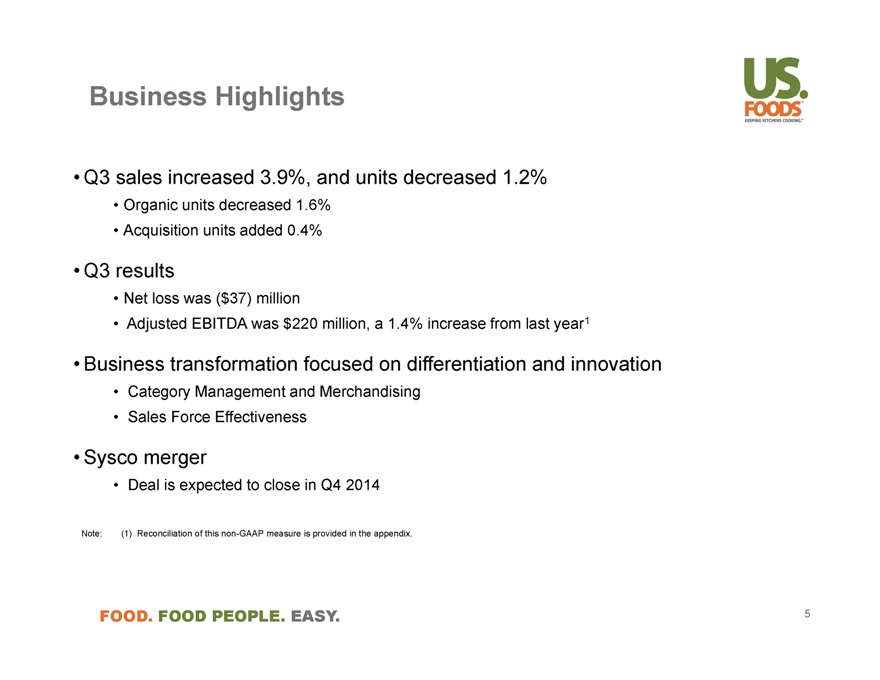
Business Highlights Q3 sales increased 3.9%, and units decreased 1.2% Organic units decreased 1.6% Acquisition units added 0.4% Q3 results Net loss was ($37) million Adjusted EBITDA was $220 million, a 1.4% increase from last year1 Business transformation focused on differentiation and innovation Category Management and Merchandising Sales Force Effectiveness Sysco merger Deal is expected to close in Q4 2014 Note: (1) Reconciliation of this non-GAAP measure is provided in the appendix. FOOD. FOOD PEOPLE. EASY. 5
|
|
Agenda Business Highlights Quarterly Financial Update Closing Comments Appendix FOOD. FOOD PEOPLE. EASY. 6
|
|
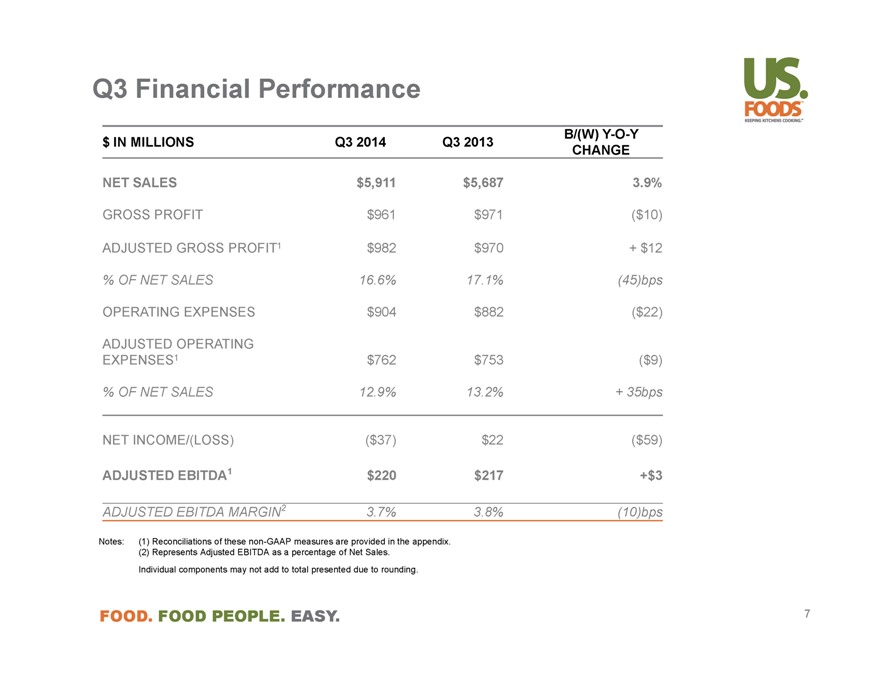
Q3 Financial Performance B/(W) Y-O-Y $ IN MILLIONS Q3 2014 Q3 2013 CHANGE NET SALES $5,911 $5,687 3.9% GROSS PROFIT $961 $971 ($10) ADJUSTED GROSS PROFIT1 $982 $970 + $12 % OF NET SALES 16.6% 17.1% (45)bps OPERATING EXPENSES $904 $882 ($22) ADJUSTED OPERATING EXPENSES1 $762 $753 ($9) % OF NET SALES 12.9% 13.2% + 35bps NET INCOME/(LOSS) ($37) $22 ($59) ADJUSTED EBITDA1 $220 $217 +$3 ADJUSTED EBITDA MARGIN2 3.7% 3.8% (10)bps Notes: (1) Reconciliations of these non-GAAP measures are provided in the appendix. (2) Represents Adjusted EBITDA as a percentage of Net Sales. Individual components may not add to total presented due to rounding. FOOD. FOOD PEOPLE. EASY. 7
|
|
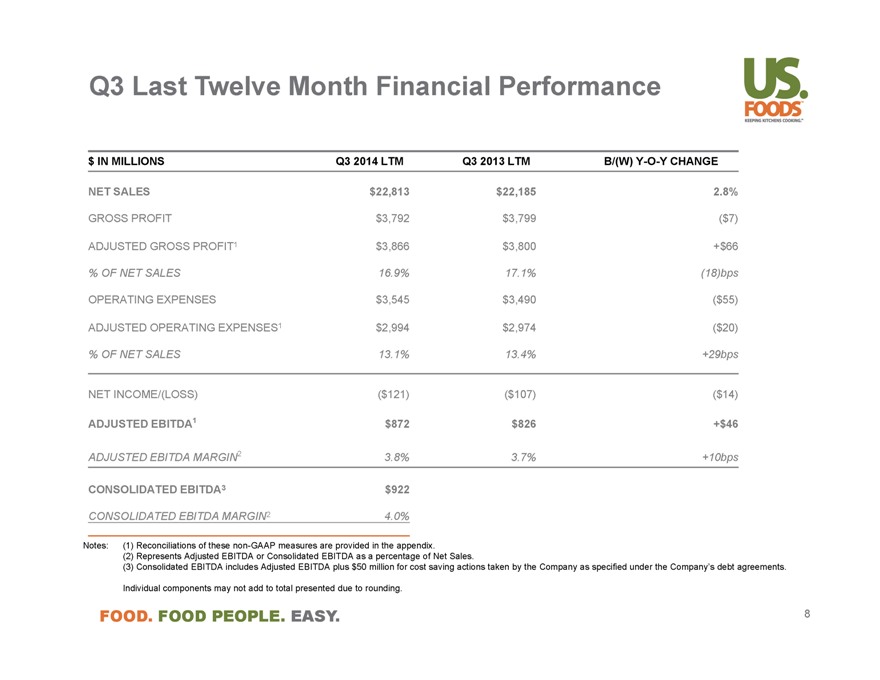
Q3 Last Twelve Month Financial Performance $ IN MILLIONS Q3 2014 LTM Q3 2013 LTM B/(W) Y-O-Y CHANGE NET SALES $22,813 $22,185 2.8% GROSS PROFIT $3,792 $3,799 ($7) ADJUSTED GROSS PROFIT1 $3,866 $3,800 +$66 % OF NET SALES 16.9% 17.1% (18)bps OPERATING EXPENSES $3,545 $3,490 ($55) ADJUSTED OPERATING EXPENSES1 $2,994 $2,974 ($20) % OF NET SALES 13.1% 13.4% +29bps NET INCOME/(LOSS) ($121) ($107) ($14) ADJUSTED EBITDA1 $872 $826 +$46 ADJUSTED EBITDA MARGIN2 3.8% 3.7% +10bps CONSOLIDATED EBITDA3 $922 CONSOLIDATED EBITDA MARGIN2 4.0% Notes: (1) Reconciliations of these non-GAAP measures are provided in the appendix. (2) Represents Adjusted EBITDA or Consolidated EBITDA as a percentage of Net Sales. (3) Consolidated EBITDA includes Adjusted EBITDA plus $50 million for cost saving actions taken by the Company as specified under the Company’s debt agreements. Individual components may not add to total presented due to rounding. FOOD. FOOD PEOPLE. EASY. 8
|
|
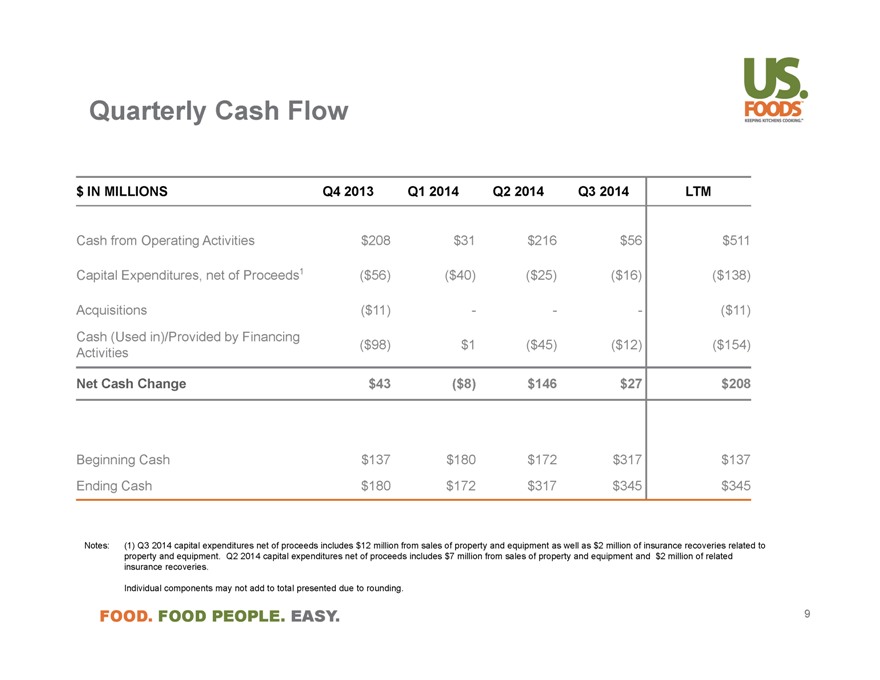
Quarterly Cash Flow $ IN MILLIONS Q4 2013 Q1 2014 Q2 2014 Q3 2014 LTM Cash from Operating Activities $208 $31 $216 $56 $511 Capital Expenditures, net of Proceeds1 ($56) ($40) ($25) ($16) ($138) Acquisitions ($11) - - - ($11) Cash (Used in)/Provided by Financing ($98) $1 ($45) ($12) ($154) Activities Net Cash Change $43 ($8) $146 $27 $208 Beginning Cash $137 $180 $172 $317 $137 Ending Cash $180 $172 $317 $345 $345 Notes: (1) Q3 2014 capital expenditures net of proceeds includes $12 million from sales of property and equipment as well as $2 million of insurance recoveries related to property and equipment. Q2 2014 capital expenditures net of proceeds includes $7 million from sales of property and equipment and $2 million of related insurance recoveries. Individual components may not add to total presented due to rounding. FOOD. FOOD PEOPLE. EASY. 9
|
|
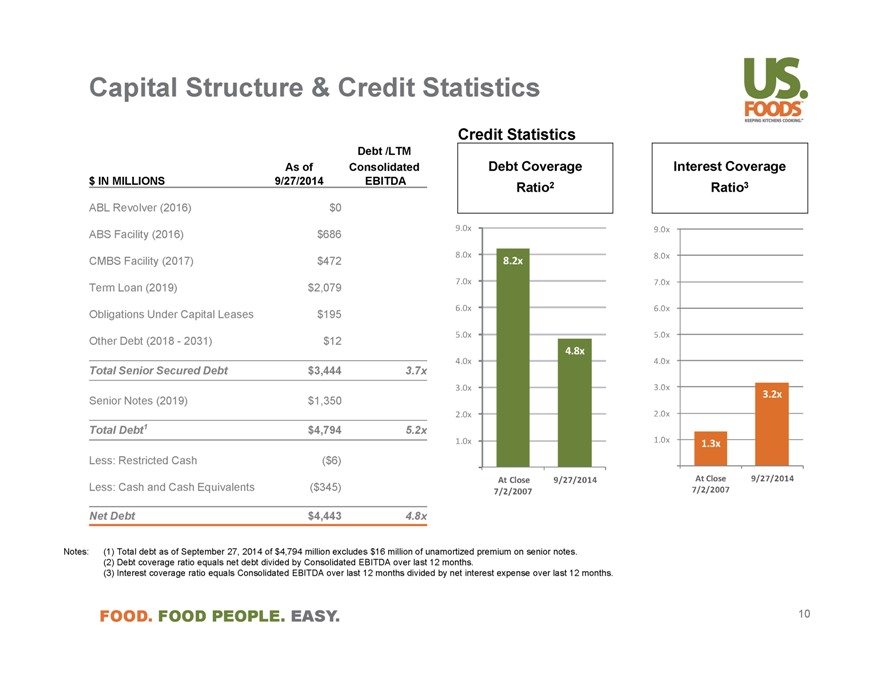
Capital Structure & Credit Statistics Credit Statistics Debt /LTM As of Consolidated Debt Coverage Interest Coverage $ IN MILLIONS 9/27/2014 EBITDA 2 3 Ratio Ratio ABL Revolver (2016) $0 9.0x 9.0x ABS Facility (2016) $686 8.0x 8.0x CMBS Facility (2017) $472 8.2x 7.0x 7.0x Term Loan (2019) $2,079 6.0x 6.0x Obligations Under Capital Leases $195 5.0x 5.0x Other Debt (2018 - 2031) $12 4.8x Total Senior Secured Debt $3,444 3.7x 4.0x 4.0x 3.0x . 3.0x 3.2x Senior Notes (2019) $1,350 2.0x 2.0x Total Debt1 $4,794 5.2x 1.0x 1.0x 1.3x Less: Restricted Cash ($6) . Less: Cash and Cash Equivalents ($345) At Close 9/27/2014 At Close 9/27/2014 7/2/2007 7/2/2007 Net Debt $4,443 4.8x 1.3x 1.3x Notes: (1) Total debt as of September 27, 2014 of $4,794 million excludes $16 million of unamortized premium on senior notes. (2) Debt coverage ratio equals net debt divided by Consolidated EBITDA over last 12 months. (3) Interest coverage ratio equals Consolidated EBITDA over last 12 months divided by net interest expense over last 12 months. FOOD. FOOD PEOPLE. EASY. 10
|
|
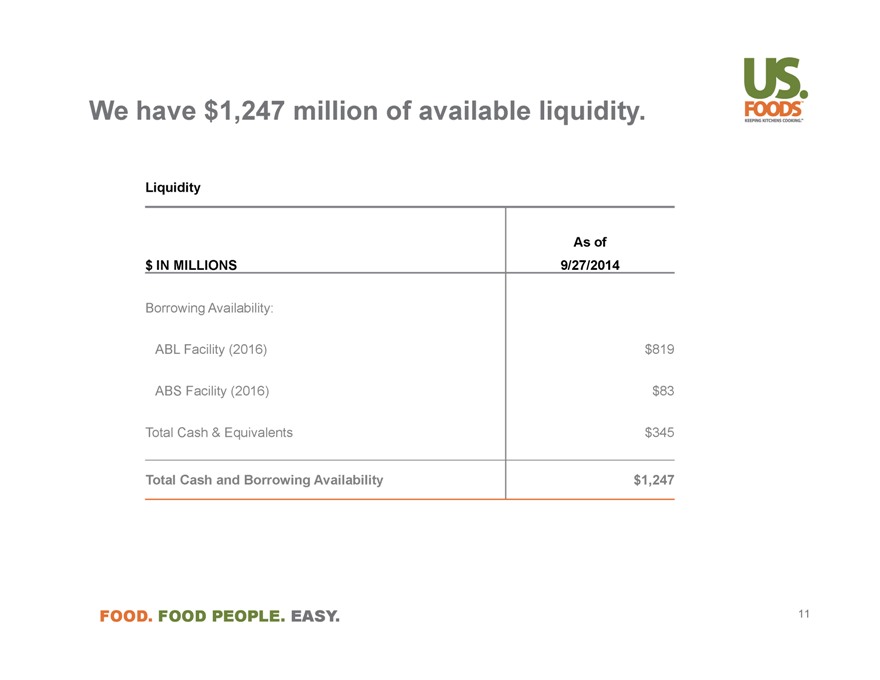
We have $1,247 million of available liquidity. Liquidity As of $ IN MILLIONS 9/27/2014 Borrowing Availability: ABL Facility (2016) $819 ABS Facility (2016) $83 Total Cash & Equivalents $345 Total Cash and Borrowing Availability $1,247 FOOD. FOOD PEOPLE. EASY. 11
|
|
Agenda Business Highlights Quarterly Financial Update Closing Comments Appendix FOOD. FOOD PEOPLE. EASY. 12
|
|
Agenda Business Highlights Quarterly Financial Update Closing Comments Appendix FOOD. FOOD PEOPLE. EASY. 13
|
|
Non-GAAP Reconciliations Management believes these non-GAAP financial measures provide meaningful supplemental information regarding our operating performance because they exclude amounts that our management and our board of directors do not consider part of core operating results when assessing the performance of the Company. Our management uses these non-GAAP financial measures to evaluate the Company’s historical financial performance, establish future operating and capital budgets and determine variable compensation for management and employees. Accordingly, the Company believes these non-GAAP financial measures are useful in allowing for a better understanding of the Company’s core operations. While management believes that these non-GAAP financial measures provide useful information, they are not operating measures under U.S. GAAP, and there are limitations associated with their use. The Company’s calculation of these non-GAAP financial measures may not be completely comparable to similarly titled measures of other companies due to potential differences between companies in their method of calculation. As a result, the use of these non-GAAP financial measures has limitations and should not be considered in isolation from, or as a substitute for, other measures such as Net income or Net income attributable to stockholders. Due to these limitations, these non-GAAP financial measures are used as a supplement to U.S. GAAP measures. FOOD. FOOD PEOPLE. EASY. 14
|
|
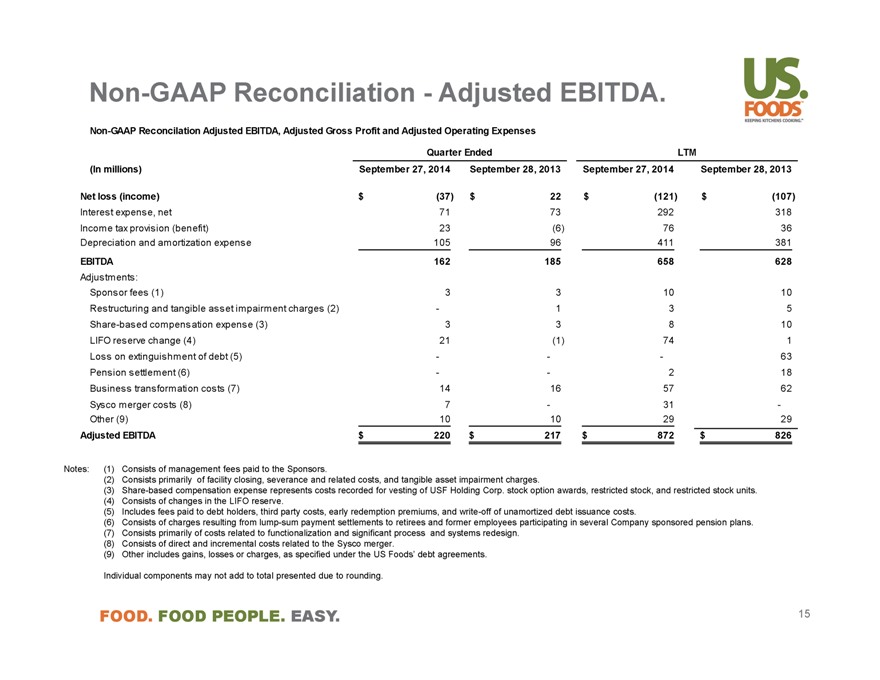
Non-GAAP Reconciliation - Adjusted EBITDA. Non-GAAP Reconcilation Adjusted EBITDA, Adjusted Gross Profit and Adjusted Operating Expenses Quarter Ended LTM (In millions) September 27, 2014 September 28, 2013 September 27, 2014 September 28, 2013 Net loss (income) $ (37) $ 22 $ (121) $ (107) Interest expense, net 71 73 292 318 Income tax provision (benefit) 23 (6) 76 36 Depreciation and amortization expense 105 96 411 381 EBITDA 162 185 658 628 Adjustments: Sponsor fees (1) 3 3 10 10 Restructuring and tangible asset impairment charges (2) - 1 3 5 Share-based compensation expense (3) 3 3 8 10 LIFO reserve change (4) 21 (1) 74 1 Loss on extinguishment of debt (5) - - - 63 Pension settlement (6) - - 2 18 Business transformation costs (7) 14 16 57 62 Sysco merger costs (8) 7 - 31 -Other (9) 10 10 29 29 Adjusted EBITDA $ 220 $ 217 $ 872 $ 826 Notes: (1) Consists of management fees paid to the Sponsors. (2) Consists primarily of facility closing, severance and related costs, and tangible asset impairment charges. (3) Share-based compensation expense represents costs recorded for vesting of USF Holding Corp. stock option awards, restricted stock, and restricted stock units. (4) Consists of changes in the LIFO reserve. (5) Includes fees paid to debt holders, third party costs, early redemption premiums, and write-off of unamortized debt issuance costs. (6) Consists of charges resulting from lump-sum payment settlements to retirees and former employees participating in several Company sponsored pension plans. (7) Consists primarily of costs related to functionalization and significant process and systems redesign. (8) Consists of direct and incremental costs related to the Sysco merger. (9) Other includes gains, losses or charges, as specified under the US Foods’ debt agreements. Individual components may not add to total presented due to rounding. FOOD. FOOD PEOPLE. EASY. 15
|
|
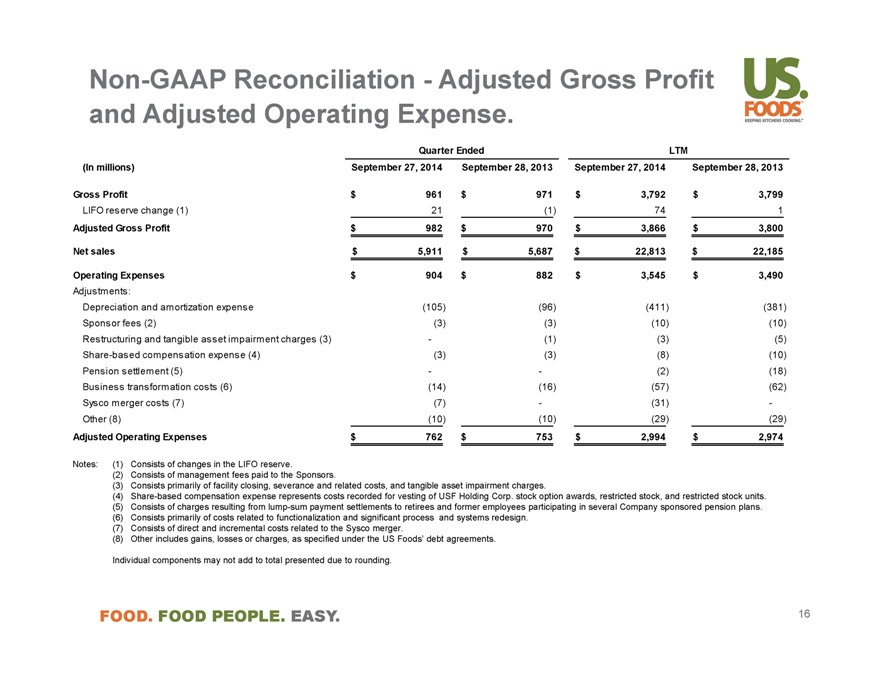
Non-GAAP Reconciliation - Adjusted Gross Profit and Adjusted Operating Expense. Quarter Ended LTM (In millions) September 27, 2014 September 28, 2013 September 27, 2014 September 28, 2013 Gross Profit $ 961 $ 971 $ 3,792 $ 3,799 LIFO reserve change (1) 21 (1) 74 1 Adjusted Gross Profit $ 982 $ 970 $ 3,866 $ 3,800 Net sales $ 5,911 $ 5,687 $ 22,813 $ 22,185 Operating Expenses $ 904 $ 882 $ 3,545 $ 3,490 Adjustments: Depreciation and amortization expense (105) (96) (411) (381) Sponsor fees (2) (3) (3) (10) (10) Restructuring and tangible asset impairment charges (3) - (1) (3) (5) Share-based compensation expense (4) (3) (3) (8) (10) Pension settlement (5) - - (2) (18) Business transformation costs (6) (14) (16) (57) (62) Sysco merger costs (7) (7) - (31) -Other (8) (10) (10) (29) (29) Adjusted Operating Expenses $ 762 $ 753 $ 2,994 $ 2,974 Notes: (1) Consists of changes in the LIFO reserve. (2) Consists of management fees paid to the Sponsors. (3) Consists primarily of facility closing, severance and related costs, and tangible asset impairment charges. (4) Share-based compensation expense represents costs recorded for vesting of USF Holding Corp. stock option awards, restricted stock, and restricted stock units. (5) Consists of charges resulting from lump-sum payment settlements to retirees and former employees participating in several Company sponsored pension plans. (6) Consists primarily of costs related to functionalization and significant process and systems redesign. (7) Consists of direct and incremental costs related to the Sysco merger. (8) Other includes gains, losses or charges, as specified under the US Foods’ debt agreements. Individual components may not add to total presented due to rounding. FOOD. FOOD PEOPLE. EASY. 16
|
|