Attached files
| file | filename |
|---|---|
| 8-K - USG CORPORATION 8-K - USG CORP | a50968032.htm |
| EX-99.1 - EXHIBIT 99.1 - USG CORP | a50968032ex99_1.htm |
Exhibit 99.2
October 23, 2014 USG Corporation Third Quarter 2014 Earnings Conference Call and Webcast
This presentation contains forward-looking statements within the meaning of the Private Securities Litigation Reform Act of 1995 related to management’s expectations about future conditions. Actual business, market or other conditions may differ materially from management’s expectations and, accordingly, may affect our sales and profitability or other results and liquidity. Actual results may differ materially due to various other factors, including: economic conditions, such as the levels of new home and other construction activity, employment levels, the availability of mortgage, construction and other financing, mortgage and other interest rates, housing affordability and supply, the levels of foreclosures and home resales, currency exchange rates and consumer confidence; capital markets conditions and the availability of borrowings under our credit agreement or other financings; our substantial indebtedness and our ability to incur substantial additional indebtedness; competitive conditions, such as price, service and product competition; shortages in raw materials; changes in raw material and energy costs; volatility in the assumptions used to determine the funded status of our pension plans; the loss of one or more major customers and our customers’ ability to meet their financial obligations to us; capacity utilization rates for us and the industry; our ability to expand into new geographic markets and the stability of such markets; our ability to successfully operate the joint venture with Boral Limited, including risks that our joint venture partner, Boral Limited, may not fulfill its obligations as an investor or may take actions that are inconsistent with our objectives; our ability to protect our intellectual property and other proprietary rights; changes in laws or regulations, including environmental and safety regulations; the satisfactory performance of certain business functions by third party service providers; our ability to achieve anticipated savings from cost reduction programs; the outcome in contested litigation matters; the effects of acts of terrorism or war upon domestic and international economies and financial markets; and acts of God. We assume no obligation to update any forward-looking information contained in this presentation. Additional information concerning these and other factors may be found in our filings with the Securities and Exchange Commission, including the “Risk Factors” in our most recent Annual Report on Form 10-K and Quarterly Report on Form 10-Q for the quarter ended June 30, 2014. CAUTIONARY STATEMENTS
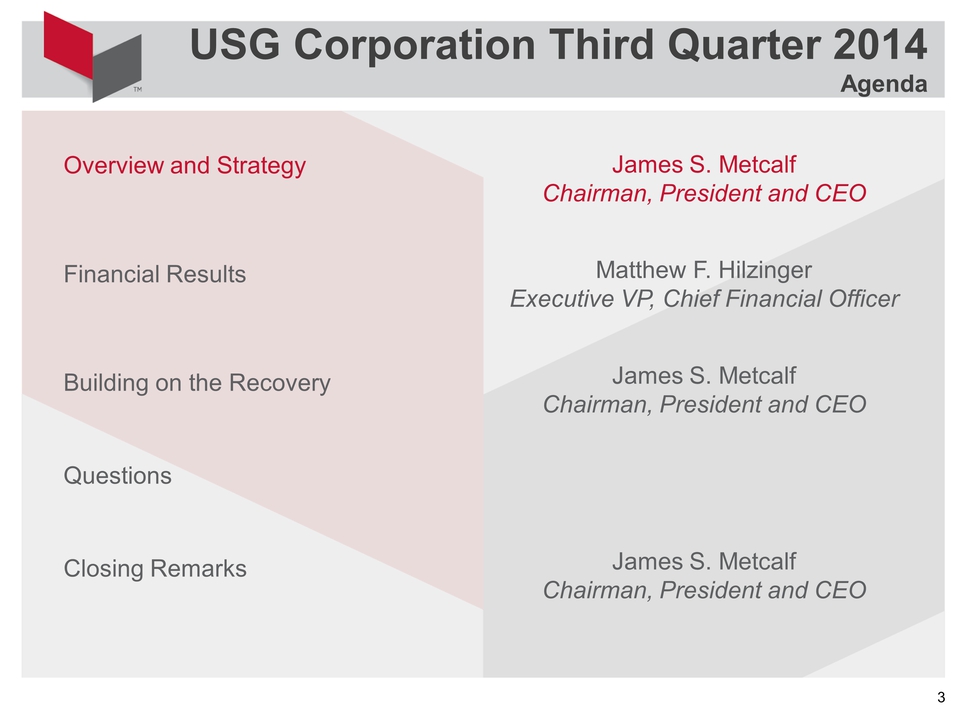
USG Corporation Third Quarter 2014 Agenda Overview and Strategy Financial Results Building on the Recovery Questions Closing Remarks James S. Metcalf Chairman, President and CEO Matthew F. Hilzinger Executive VP, Chief Financial Officer James S. Metcalf Chairman, President and CEO James S. Metcalf Chairman, President and CEO
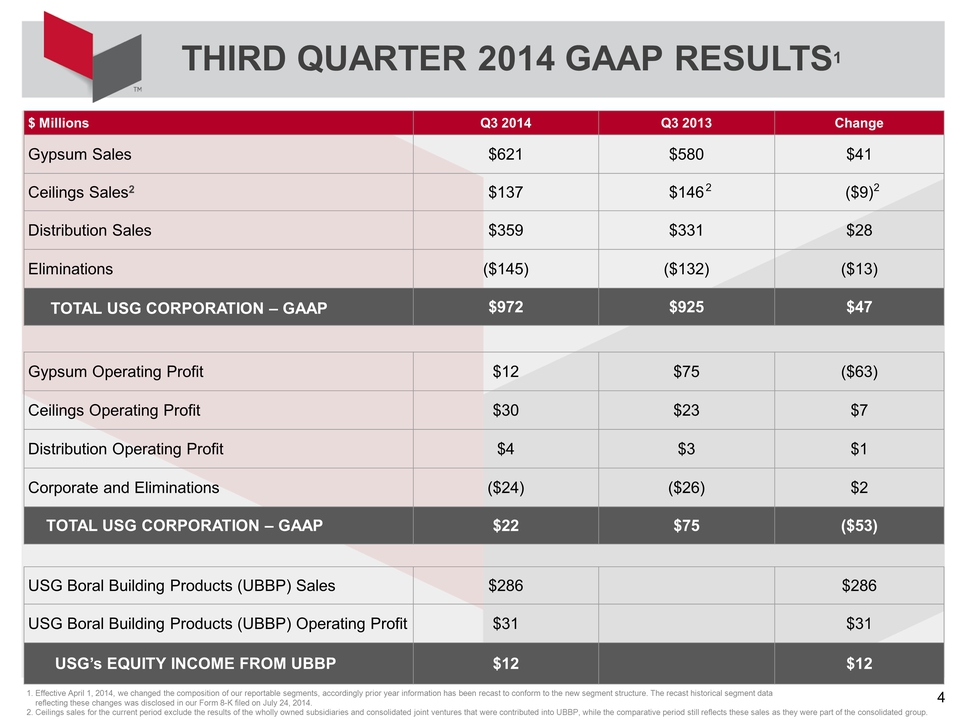
THIRD QUARTER 2014 GAAP RESULTS1 1. Effective April 1, 2014, we changed the composition of our reportable segments, accordingly prior year information has been recast to conform to the new segment structure. The recast historical segment data reflecting these changes was disclosed in our Form 8-K filed on July 24, 2014. 2. Ceilings sales for the current period exclude the results of the wholly owned subsidiaries and consolidated joint ventures that were contributed into UBBP, while the comparative period still reflects these sales as they were part of the consolidated group. $ Millions Q3 2014 Q3 2013 Change Gypsum Sales $621 $580 $41 Ceilings Sales2 $137 $146 ($9) Distribution Sales $359 $331 $28 Eliminations ($145) ($132) ($13) TOTAL USG CORPORATION – GAAP $972 $925 $47 Gypsum Operating Profit $12 $75 ($63) Ceilings Operating Profit $30 $23 $7 Distribution Operating Profit $4 $3 $1 Corporate and Eliminations ($24) ($26) $2 TOTAL USG CORPORATION – GAAP $22 $75 ($53) USG Boral Building Products (UBBP) Sales $286 $286 USG Boral Building Products (UBBP) Operating Profit $31 $31 USG’s EQUITY INCOME FROM UBBP $12 $12 2 2
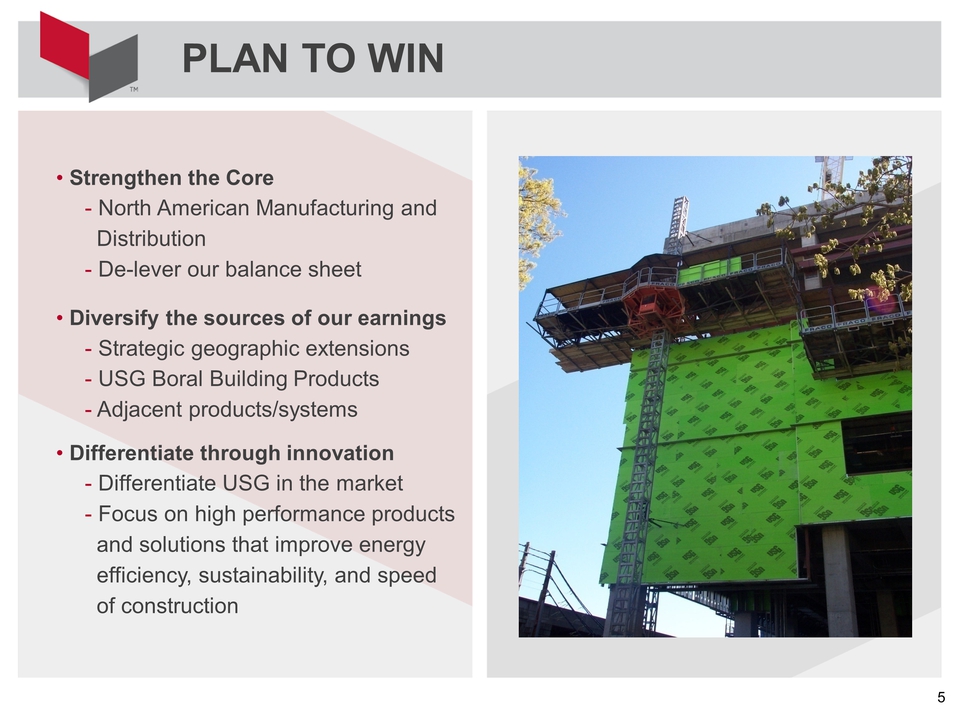
PLAN TO WIN Strengthen the Core North American Manufacturing and Distribution De-lever our balance sheet Diversify the sources of our earnings - Strategic geographic extensions USG Boral Building Products Adjacent products/systems Differentiate through innovation Differentiate USG in the market Focus on high performance products and solutions that improve energy efficiency, sustainability, and speed of construction
USG Corporation Third Quarter 2014 Agenda Overview and Strategy Financial Results Building on the Recovery Questions Closing Remarks James S. Metcalf Chairman, President and CEO Matthew F. Hilzinger Executive VP, Chief Financial Officer James S. Metcalf Chairman, President and CEO James S. Metcalf Chairman, President and CEO
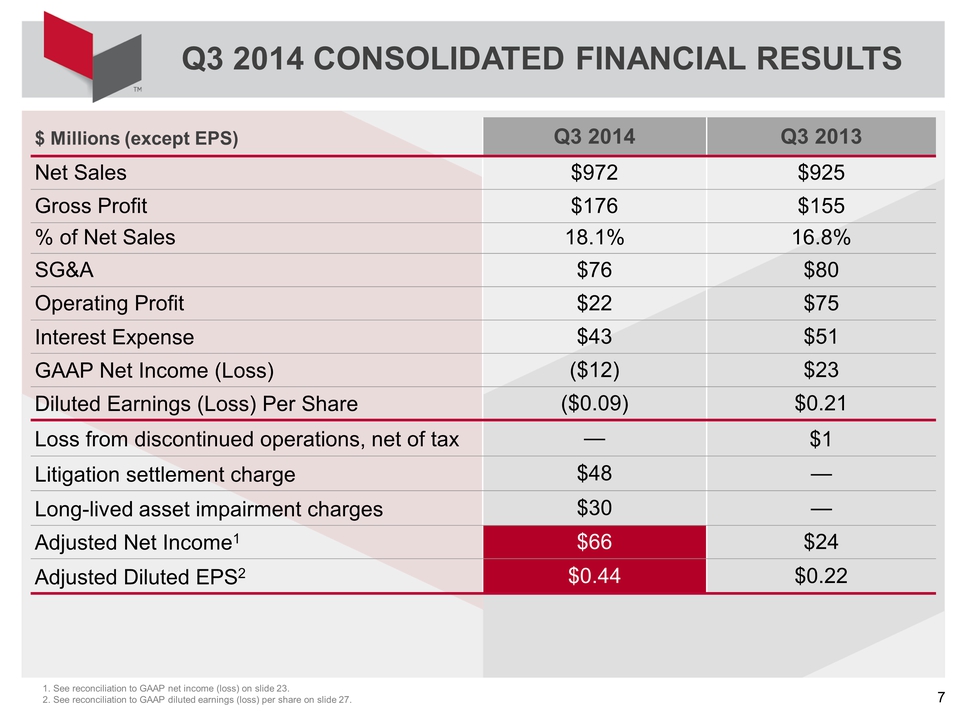
$ Millions (except EPS) Q3 2014 Q3 2013 Net Sales $972 $925 Gross Profit $176 $155 % of Net Sales 18.1% 16.8% SG&A $76 $80 Operating Profit $22 $75 Interest Expense $43 $51 GAAP Net Income (Loss) ($12) $23 Diluted Earnings (Loss) Per Share ($0.09) $0.21 Loss from discontinued operations, net of tax — $1 Litigation settlement charge $48 — Long-lived asset impairment charges $30 — Adjusted Net Income1 $66 $24 Adjusted Diluted EPS2 $0.44 $0.22 1. See reconciliation to GAAP net income (loss) on slide 23. 2. See reconciliation to GAAP diluted earnings (loss) per share on slide 27. Q3 2014 CONSOLIDATED FINANCIAL RESULTS
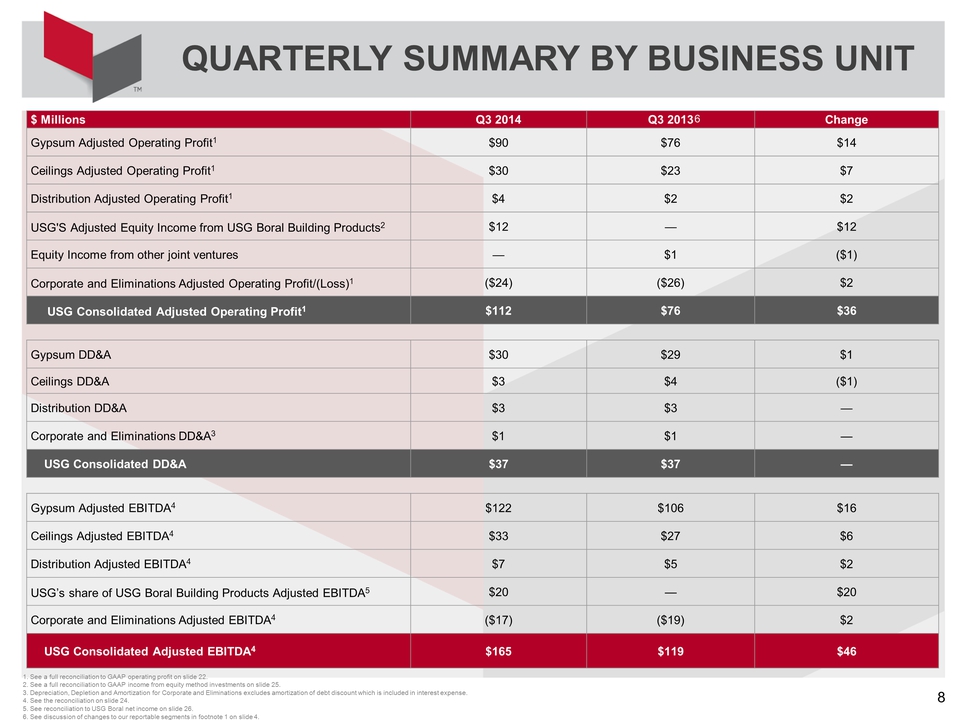
$ Millions Q3 2014 Q3 2013 Change Gypsum Adjusted Operating Profit1 $90 $76 $14 Ceilings Adjusted Operating Profit1 $30 $23 $7 Distribution Adjusted Operating Profit1 $4 $2 $2 USG'S Adjusted Equity Income from USG Boral Building Products2 $12 — $12 Equity Income from other joint ventures — $1 ($1) Corporate and Eliminations Adjusted Operating Profit/(Loss)1 ($24) ($26) $2 USG Consolidated Adjusted Operating Profit1 $112 $76 $36 Gypsum DD&A $30 $29 $1 Ceilings DD&A $3 $4 ($1) Distribution DD&A $3 $3 — Corporate and Eliminations DD&A3 $1 $1 — USG Consolidated DD&A $37 $37 — Gypsum Adjusted EBITDA4 $122 $106 $16 Ceilings Adjusted EBITDA4 $33 $27 $6 Distribution Adjusted EBITDA4 $7 $5 $2 USG’s share of USG Boral Building Products Adjusted EBITDA5 $20 — $20 Corporate and Eliminations Adjusted EBITDA4 ($17) ($19) $2 USG Consolidated Adjusted EBITDA4 $165 $119 $46 1. See a full reconciliation to GAAP operating profit on slide 22. 2. See a full reconciliation to GAAP income from equity method investments on slide 25. 3. Depreciation, Depletion and Amortization for Corporate and Eliminations excludes amortization of debt discount which is included in interest expense. 4. See the reconciliation on slide 24. 5. See reconciliation to USG Boral net income on slide 26. 6. See discussion of changes to our reportable segments in footnote 1 on slide 4. QUARTERLY SUMMARY BY BUSINESS UNIT 6
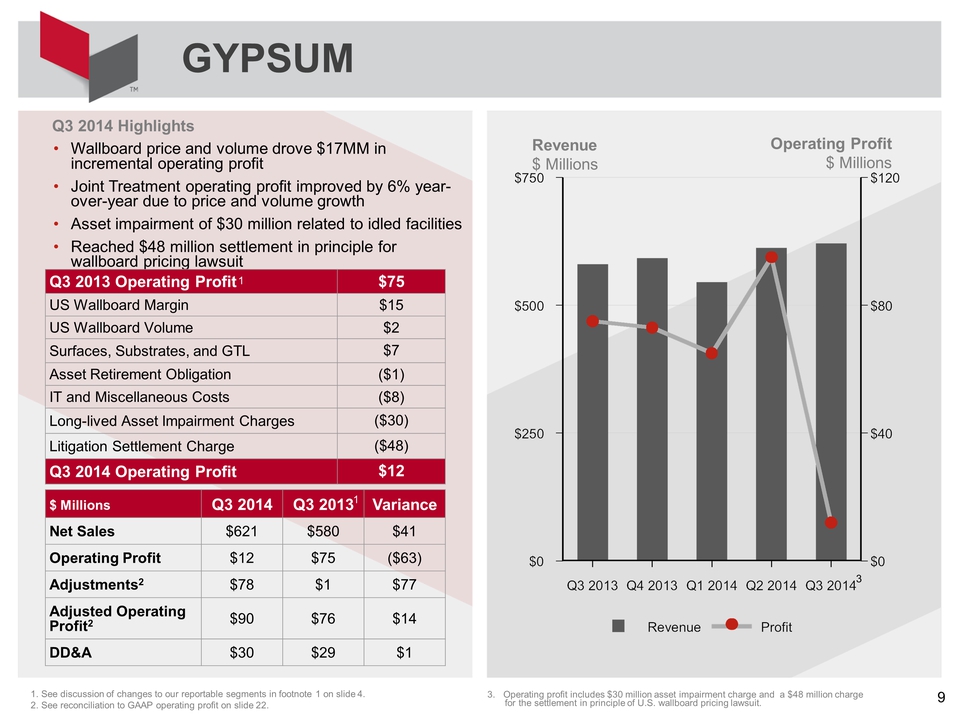
Q3 2014 Highlights Wallboard price and volume drove $17MM in incremental operating profit Joint Treatment operating profit improved by 6% year-over-year due to price and volume growth Asset impairment of $30 million related to idled facilities Reached $48 million settlement in principle for wallboard pricing lawsuit GYPSUM 1. See discussion of changes to our reportable segments in footnote 1 on slide 4. 2. See reconciliation to GAAP operating profit on slide 22. Revenue $ Millions Operating Profit $ Millions Q3 2013 Operating Profit $75 US Wallboard Margin $15 US Wallboard Volume $2 Surfaces, Substrates, and GTL $7 Asset Retirement Obligation ($1) IT and Miscellaneous Costs ($8) Long-lived Asset Impairment Charges ($30) Litigation Settlement Charge ($48) Q3 2014 Operating Profit $12 $ Millions Q3 2014 Q3 2013 Variance Net Sales $621 $580 $41 Operating Profit $12 $75 ($63) Adjustments2 $78 $1 $77 Adjusted Operating Profit2 $90 $76 $14 DD&A $30 $29 $1 1 1 3 3. Operating profit includes $30 million asset impairment charge and a $48 million charge for the settlement in principle of U.S. wallboard pricing lawsuit.
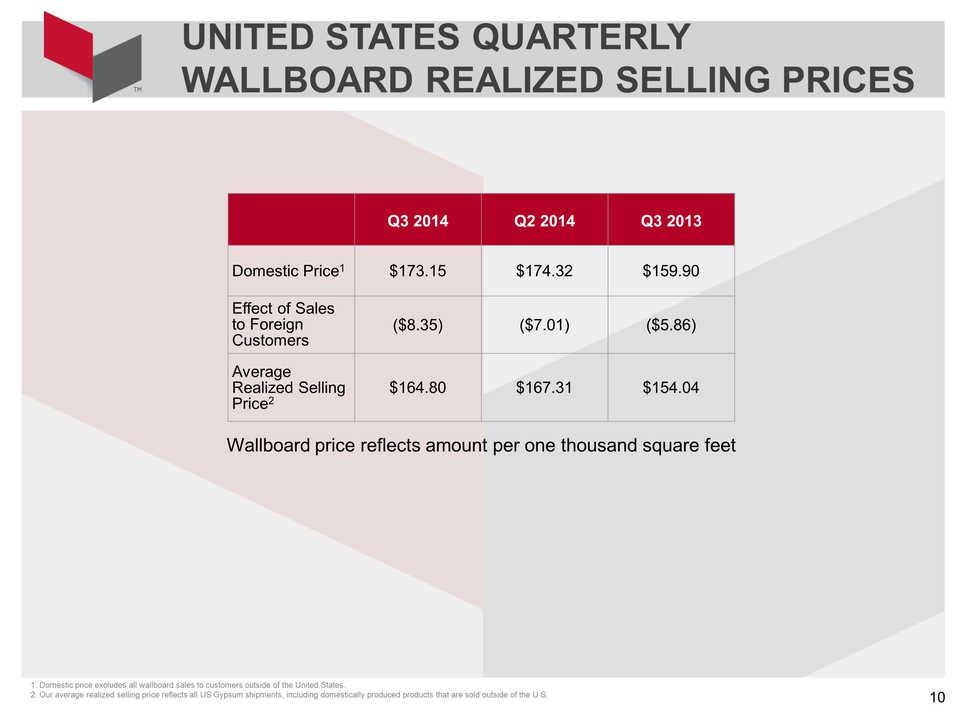
UNITED STATES QUARTERLY WALLBOARD REALIZED SELLING PRICES Q3 2014 Q2 2014 Q3 2013 Domestic Price1 $173.15 $174.32 $159.90 Effect of Sales to Foreign Customers ($8.35) ($7.01) ($5.86) Average Realized Selling Price2 $164.80 $167.31 $154.04 Wallboard price reflects amount per one thousand square feet 1. Domestic price excludes all wallboard sales to customers outside of the United States. 2. Our average realized selling price reflects all US Gypsum shipments, including domestically produced products that are sold outside of the U.S.
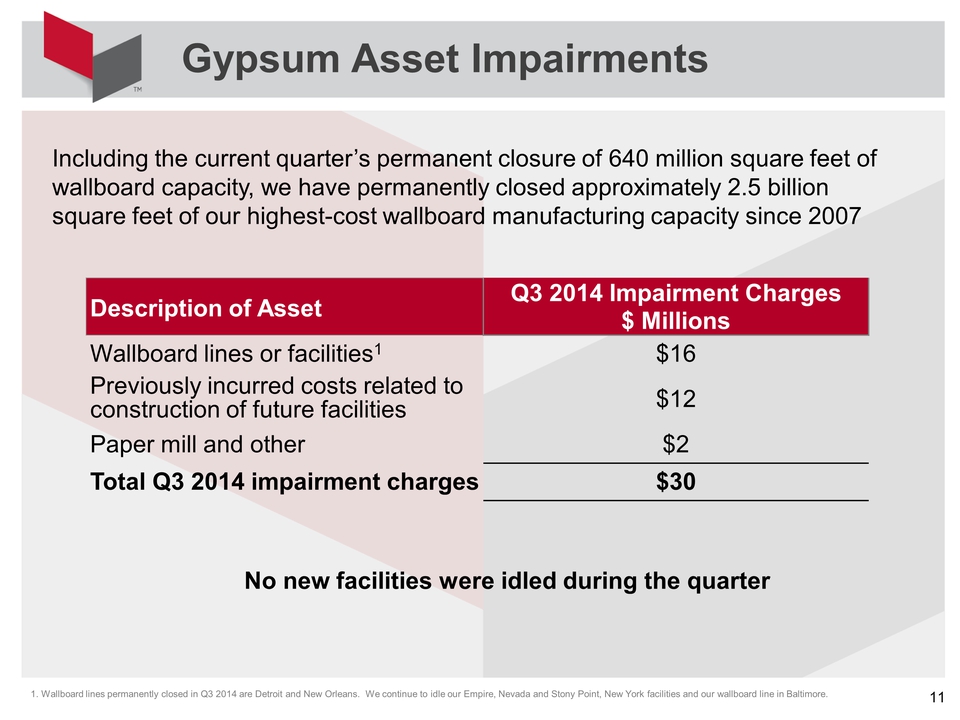
Including the current quarter’s permanent closure of 640 million square feet of wallboard capacity, we have permanently closed approximately 2.5 billion square feet of our highest-cost wallboard manufacturing capacity since 2007 Gypsum Asset Impairments Description of Asset Q3 2014 Impairment Charges $ Millions Wallboard lines or facilities1 $16 Previously incurred costs related to construction of future facilities $12 Paper mill and other $2 Total Q3 2014 impairment charges $30 1. Wallboard lines permanently closed in Q3 2014 are Detroit and New Orleans. We continue to idle our Empire, Nevada and Stony Point, New York facilities and our wallboard line in Baltimore. No new facilities were idled during the quarter
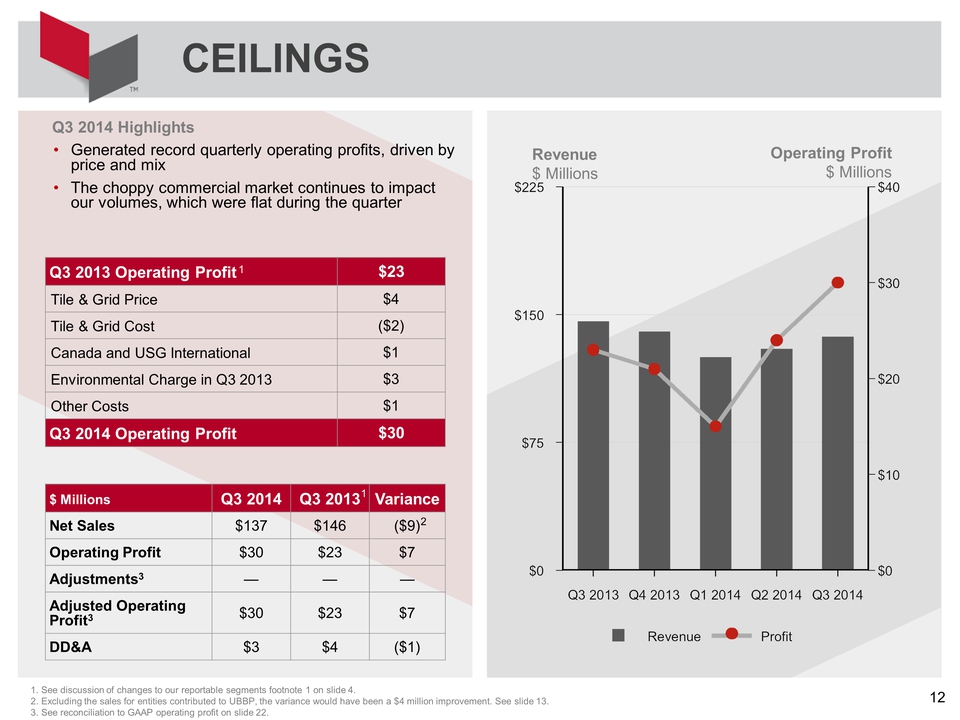
Q3 2014 Highlights Generated record quarterly operating profits, driven by price and mix The choppy commercial market continues to impact our volumes, which were flat during the quarter Q3 2013 Operating Profit $23 Tile & Grid Price $4 Tile & Grid Cost ($2) Canada and USG International $1 Environmental Charge in Q3 2013 $3 Other Costs $1 Q3 2014 Operating Profit $30 $ Millions Q3 2014 Q3 2013 Variance Net Sales $137 $146 ($9) Operating Profit $30 $23 $7 Adjustments3 Adjusted Operating Profit3 $30 $23 $7 DD&A $3 $4 ($1) CEILINGS 1. See discussion of changes to our reportable segments footnote 1 on slide 4. 2. Excluding the sales for entities contributed to UBBP, the variance would have been a $4 million improvement. See slide 13. 3. See reconciliation to GAAP operating profit on slide 22. Revenue $ Millions Operating Profit $ Millions 1 1 2
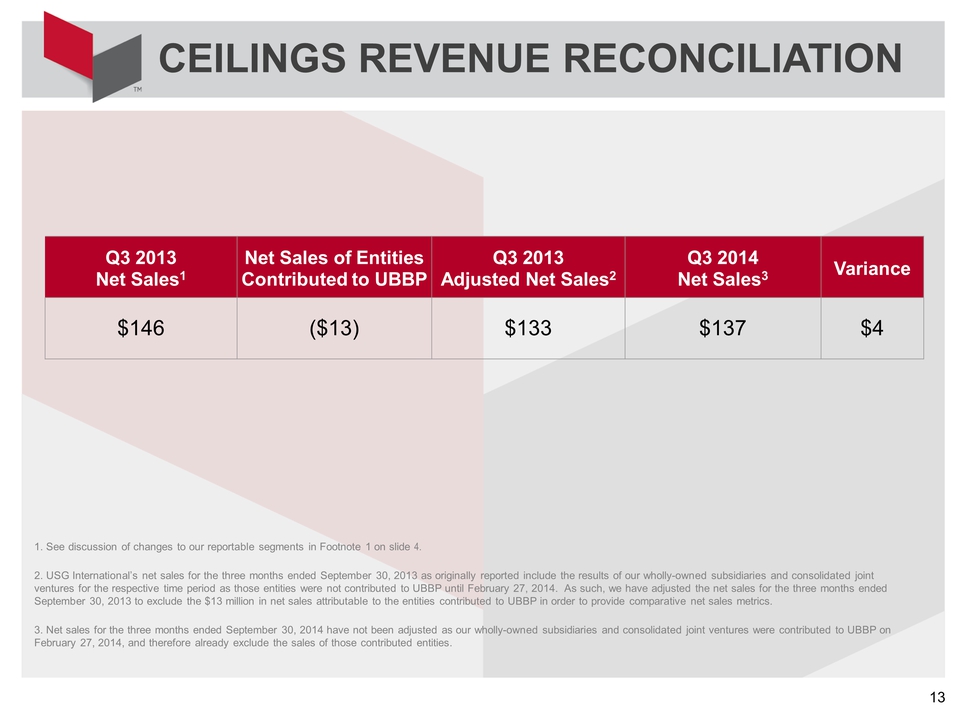
CEILINGS REVENUE RECONCILIATION Q3 2013 Net Sales1 Net Sales of Entities Contributed to UBBP Q3 2013 Adjusted Net Sales2 Q3 2014 Net Sales3 Variance $146 ($13) $133 $137 $4 1. See discussion of changes to our reportable segments in Footnote 1 on slide 4. 2. USG International’s net sales for the three months ended September 30, 2013 as originally reported include the results of our wholly-owned subsidiaries and consolidated joint ventures for the respective time period as those entities were not contributed to UBBP until February 27, 2014. As such, we have adjusted the net sales for the three months ended September 30, 2013 to exclude the $13 million in net sales attributable to the entities contributed to UBBP in order to provide comparative net sales metrics. 3. Net sales for the three months ended September 30, 2014 have not been adjusted as our wholly-owned subsidiaries and consolidated joint ventures were contributed to UBBP on February 27, 2014, and therefore already exclude the sales of those contributed entities.
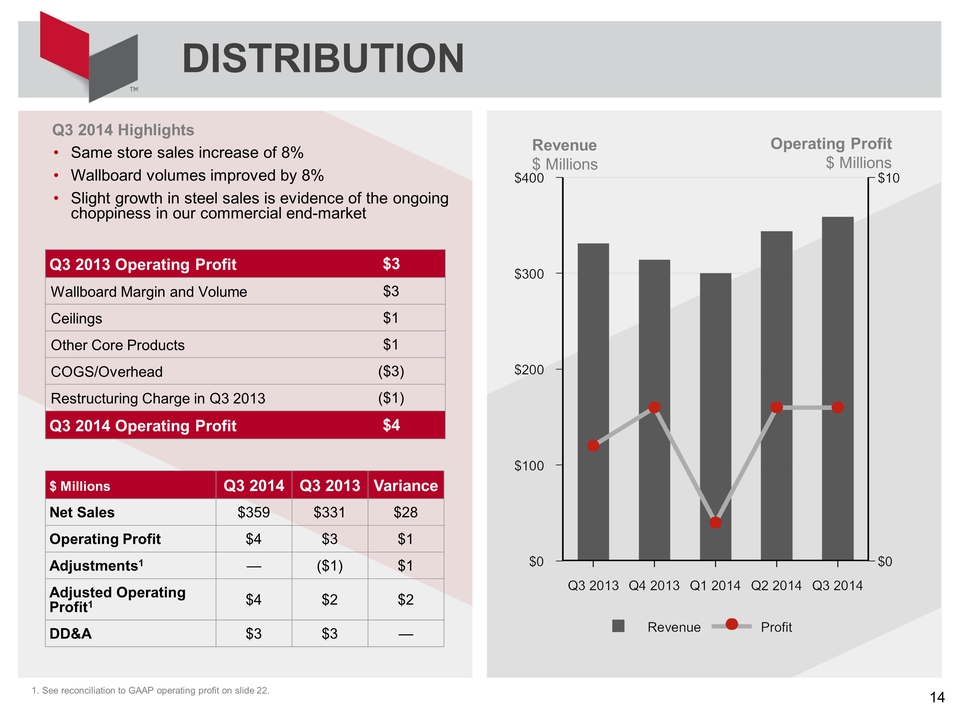
Q3 2014 Highlights Same store sales increase of 8% Wallboard volumes improved by 8% Slight growth in steel sales is evidence of the ongoing choppiness in our commercial end-market Q3 2013 Operating Profit $3 Wallboard Margin and Volume $3 Ceilings $1 Other Core Products $1 COGS/Overhead ($3) Restructuring Charge in Q3 2013 ($1) Q3 2014 Operating Profit $4 $ Millions Q3 2014 Q3 2013 Variance Net Sales $359 $331 $28 Operating Profit $4 $3 $1 Adjustments1 ($1) $1 Adjusted Operating Profit1 $4 $2 $2 DD&A $3 $3 DISTRIBUTION Revenue $ Millions Operating Profit $ Millions 1. See reconciliation to GAAP operating profit on slide 22.
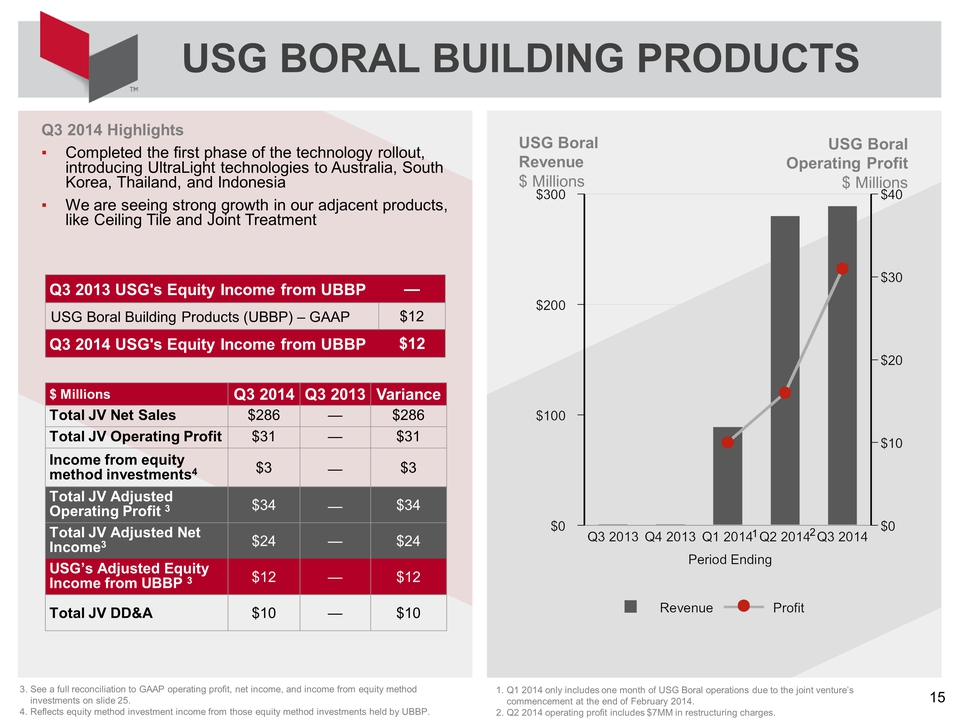
Q3 2014 Highlights Completed the first phase of the technology rollout, introducing UltraLight technologies to Australia, South Korea, Thailand, and Indonesia We are seeing strong growth in our adjacent products, like Ceiling Tile and Joint Treatment USG BORAL BUILDING PRODUCTS USG Boral Revenue $ Millions USG Boral Operating Profit $ Millions 3. See a full reconciliation to GAAP operating profit, net income, and income from equity method investments on slide 25. 4. Reflects equity method investment income from those equity method investments held by UBBP. $ Millions Q3 2014 Q3 2013 Variance Total JV Net Sales $286 $286 Total JV Operating Profit $31 $31 Income from equity method investments4 $3 $3 Total JV Adjusted Operating Profit 3 $34 $34 Total JV Adjusted Net Income3 $24 $24 USG’s Adjusted Equity Income from UBBP 3 $12 $12 Total JV DD&A $10 $10 Q3 2013 USG's Equity Income from UBBP USG Boral Building Products (UBBP) GAAP $12 Q3 2014 USG's Equity Income from UBBP $12 1. Q1 2014 only includes one month of USG Boral operations due to the joint venture’s commencement at the end of February 2014. 2. Q2 2014 operating profit includes $7MM in restructuring charges. 1 2
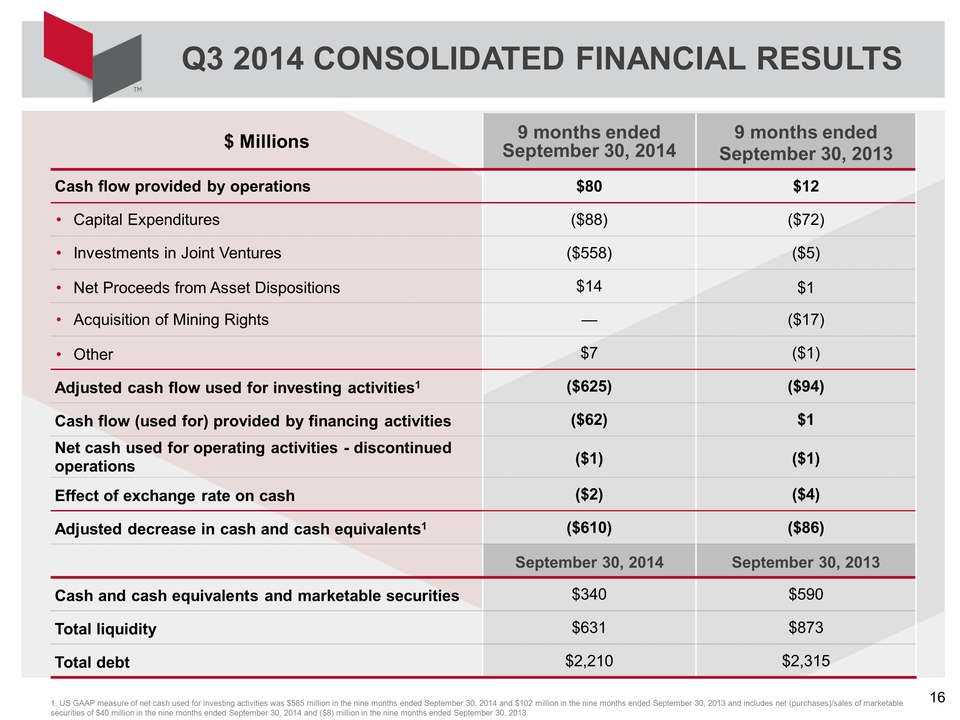
Q3 2014 CONSOLIDATED FINANCIAL RESULTS $ Millions 9 months ended September 30, 2014 9 months ended September 30, 2013 Cash flow provided by operations $80 $12 Capital Expenditures ($88) ($72) Investments in Joint Ventures ($558) ($5) Net Proceeds from Asset Dispositions $14 $1 Acquisition of Mining Rights ($17) Other $7 ($1) Adjusted cash flow used for investing activities1 ($625) ($94) Cash flow (used for) provided by financing activities ($62) $1 Net cash used for operating activities - discontinued operations ($1) ($1) Effect of exchange rate on cash ($2) ($4) Adjusted decrease in cash and cash equivalents1 ($610) ($86) September 30, 2014 September 30, 2013 Cash and cash equivalents and marketable securities $340 $590 Total liquidity $631 $873 Total debt $2,210 $2,315 1. US GAAP measure of net cash used for investing activities was $585 million in the nine months ended September 30, 2014 and $102 million in the nine months ended September 30, 2013 and includes net (purchases)/sales of marketable securities of $40 million in the nine months ended September 30, 2014 and ($8) million in the nine months ended September 30, 2013.
USG Corporation Third Quarter 2014 Agenda Overview and Strategy Financial Results Building on the Recovery Questions Closing Remarks James S. Metcalf Chairman, President and CEO Matthew F. Hilzinger Executive VP, Chief Financial Officer James S. Metcalf Chairman, President and CEO James S. Metcalf Chairman, President and CEO
Despite the slower pace of new housing starts, we believe that the long-term residential recovery remains intact Repair and remodel continues to be our strongest performing market Commercial demand remains choppy, but we expect the second half of 2014 to be stronger than the first half We believe that 2015 will be better than 2014 in each of our end-markets Q3 2014 Economic Outlook
USG Corporation Third Quarter 2014 Agenda Overview and Strategy Financial Results Building on the Recovery Questions Closing Remarks James S. Metcalf Chairman, President and CEO Matthew F. Hilzinger Executive VP, Chief Financial Officer James S. Metcalf Chairman, President and CEO James S. Metcalf Chairman, President and CEO
USG Corporation Third Quarter 2014 Agenda Overview and Strategy Financial Results Building on the Recovery Questions Closing Remarks James S. Metcalf Chairman, President and CEO Matthew F. Hilzinger Executive VP, Chief Financial Officer James S. Metcalf Chairman, President and CEO James S. Metcalf Chairman, President and CEO
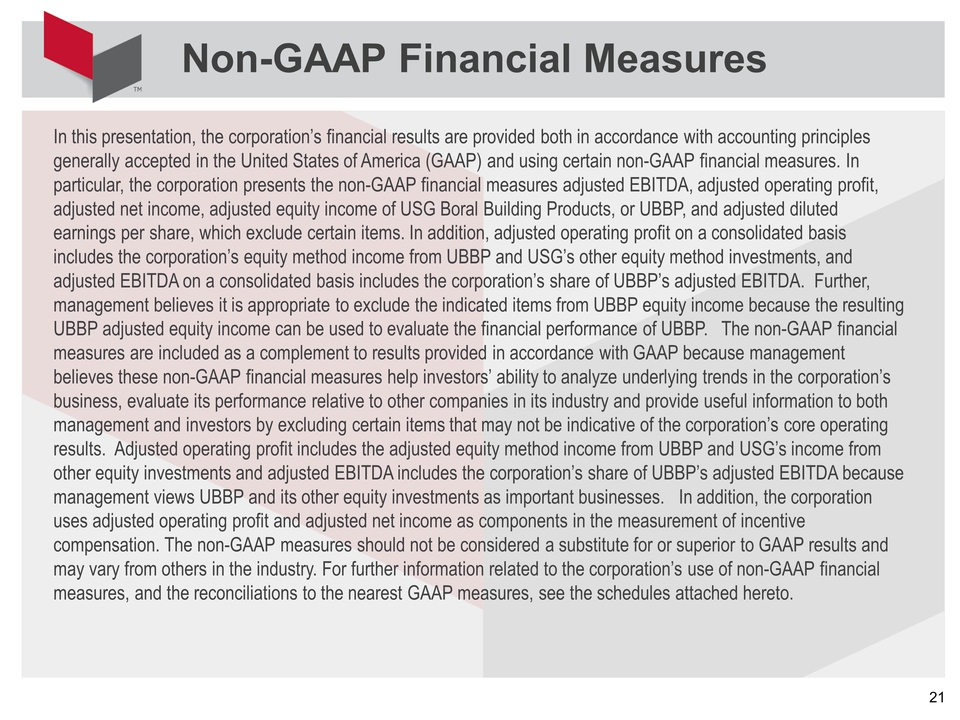
In this presentation, the corporation’s financial results are provided both in accordance with accounting principles generally accepted in the United States of America (GAAP) and using certain non-GAAP financial measures. In particular, the corporation presents the non-GAAP financial measures adjusted EBITDA, adjusted operating profit, adjusted net income, adjusted equity income of USG Boral Building Products, or UBBP, and adjusted diluted earnings per share, which exclude certain items. In addition, adjusted operating profit on a consolidated basis includes the corporation’s equity method income from UBBP and USG’s other equity method investments, and adjusted EBITDA on a consolidated basis includes the corporation’s share of UBBP’s adjusted EBITDA. Further, management believes it is appropriate to exclude the indicated items from UBBP equity income because the resulting UBBP adjusted equity income can be used to evaluate the financial performance of UBBP. The non-GAAP financial measures are included as a complement to results provided in accordance with GAAP because management believes these non-GAAP financial measures help investors’ ability to analyze underlying trends in the corporation’s business, evaluate its performance relative to other companies in its industry and provide useful information to both management and investors by excluding certain items that may not be indicative of the corporation’s core operating results. Adjusted operating profit includes the adjusted equity method income from UBBP and USG’s income from other equity investments and adjusted EBITDA includes the corporation’s share of UBBP’s adjusted EBITDA because management views UBBP and its other equity investments as important businesses. In addition, the corporation uses adjusted operating profit and adjusted net income as components in the measurement of incentive compensation. The non-GAAP measures should not be considered a substitute for or superior to GAAP results and may vary from others in the industry. For further information related to the corporation’s use of non-GAAP financial measures, and the reconciliations to the nearest GAAP measures, see the schedules attached hereto. Non-GAAP Financial Measures
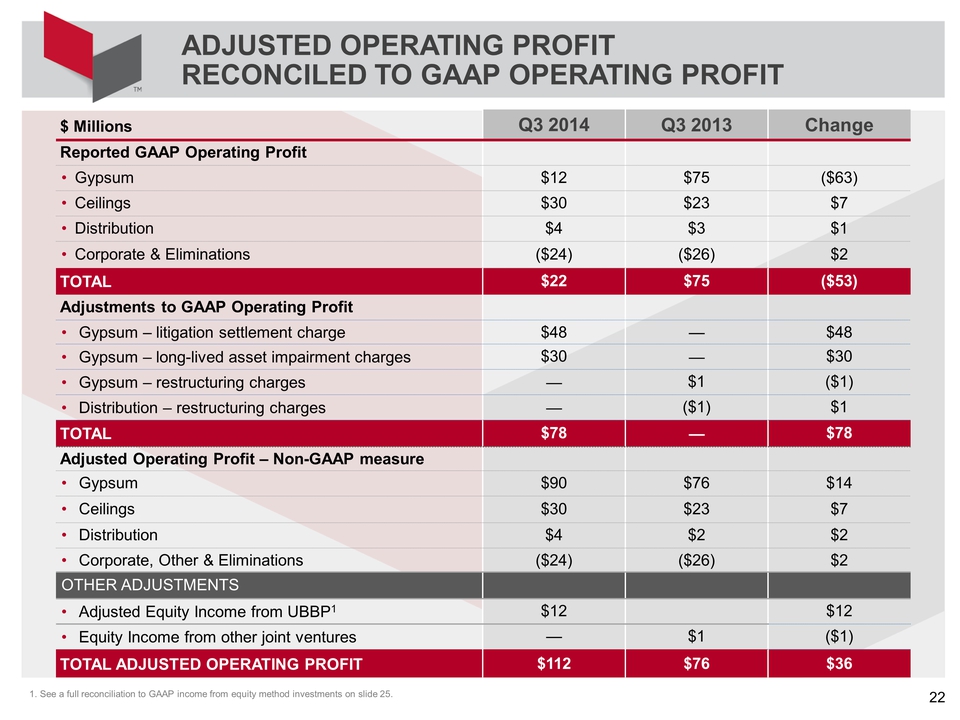
ADJUSTED OPERATING PROFIT RECONCILED TO GAAP OPERATING PROFIT $ Millions Q3 2014 Q3 2013 Change Reported GAAP Operating Profit Gypsum $12 $75 ($63) Ceilings $30 $23 $7 Distribution $4 $3 $1 Corporate & Eliminations ($24) ($26) $2 TOTAL $22 $75 ($53) Adjustments to GAAP Operating Profit Gypsum litigation settlement charge $48 $48 Gypsum long-lived asset impairment charges $30 $30 Gypsum restructuring charges $1 ($1) Distribution restructuring charges ($1) $1 TOTAL $78 $78 Adjusted Operating Profit Non-GAAP measure Gypsum $90 $76 $14 Ceilings $30 $23 $7 Distribution $4 $2 $2 Corporate, Other & Eliminations ($24) ($26) $2 OTHER ADJUSTMENTS Adjusted Equity Income from UBBP1 $12 $12 Equity Income from other joint ventures $1 ($1) TOTAL ADJUSTED OPERATING PROFIT $112 $76 $36 1. See a full reconciliation to GAAP income from equity method investments on slide 25.
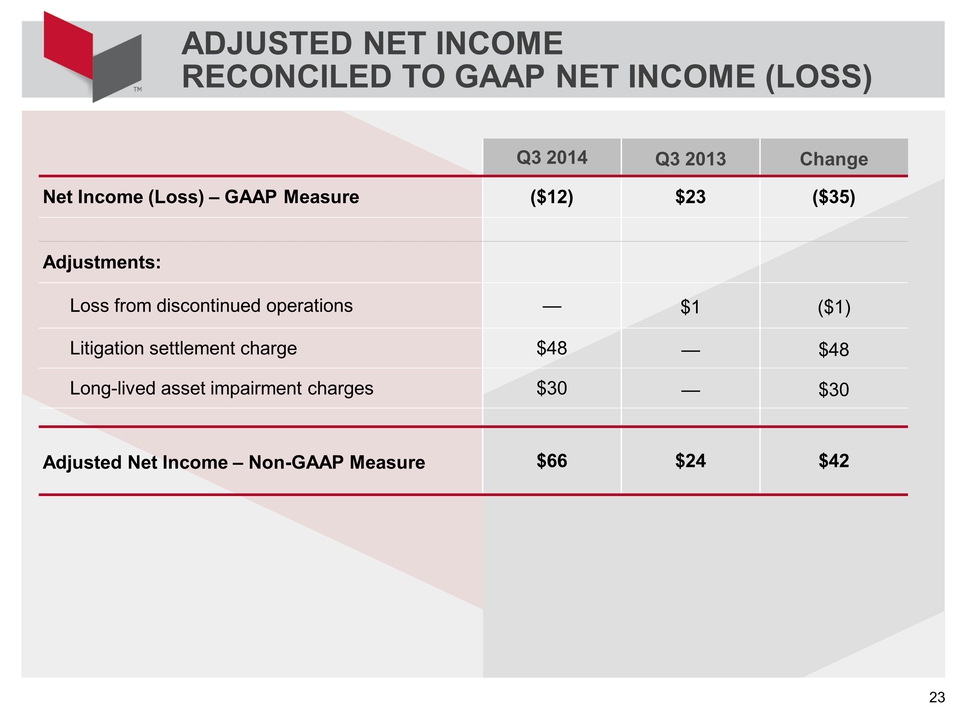
ADJUSTED NET INCOME RECONCILED TO GAAP NET INCOME (LOSS) Q3 2014 Q3 2013 Change Net Income (Loss) GAAP Measure ($12) $23 ($35) Adjustments: Loss from discontinued operations $1 ($1) Litigation settlement charge $48 $48 Long-lived asset impairment charges $30 $30 Adjusted Net Income – Non-GAAP Measure $66 $24 $42
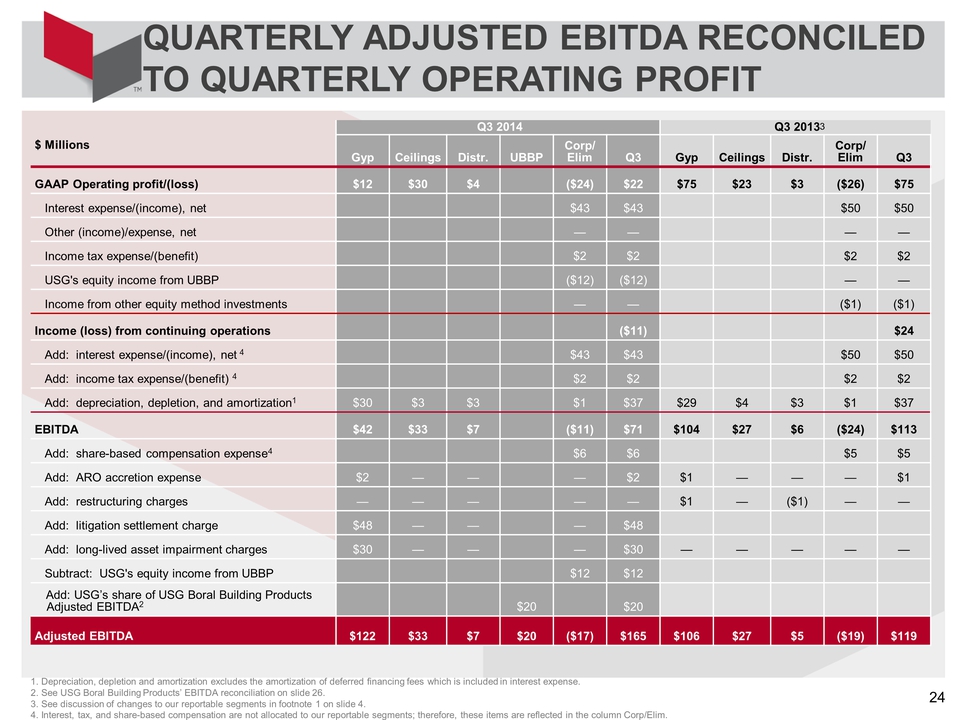
QUARTERLY ADJUSTED EBITDA RECONCILED TO QUARTERLY OPERATING PROFIT Q3 2014 Q3 2013 $ Millions Gyp Ceilings Distr. UBBP Corp/Elim Q3 Gyp Ceilings Distr. Corp/Elim Q3 GAAP Operating profit/(loss) $12 $30 $4 ($24) $22 $75 $23 $3 ($26) $75 Interest expense/(income), net $43 $43 $50 $50 Other (income)/expense, net Income tax expense/(benefit) $2 $2 $2 $2 USG's equity income from UBBP ($12) ($12) Income from other equity method investments ($1) ($1) Income (loss) from continuing operations ($11) $24 Add: interest expense/(income), net 4 $43 $43 $50 $50 Add: income tax expense/(benefit) 4 $2 $2 $2 $2 Add: depreciation, depletion, and amortization1 $30 $3 $3 $1 $37 $29 $4 $3 $1 $37 EBITDA $42 $33 $7 ($11) $71 $104 $27 $6 ($24) $113 Add: share-based compensation expense4 $6 $6 $5 $5 Add: ARO accretion expense $2 $2 $1 $1 Add: restructuring charges $1 ($1) Add: litigation settlement charge $48 $48 Add: long-lived asset impairment charges $30 $30 Subtract: USG's equity income from UBBP $12 $12 Add: USG’s share of USG Boral Building Products Adjusted EBITDA2 $20 $20 Adjusted EBITDA $122 $33 $7 $20 ($17) $165 $106 $27 $5 ($19) $119 1. Depreciation, depletion and amortization excludes the amortization of deferred financing fees which is included in interest expense. 2. See USG Boral Building Products’ EBITDA reconciliation on slide 26. 3. See discussion of changes to our reportable segments in footnote 1 on slide 4. 4. Interest, tax, and share-based compensation are not allocated to our reportable segments; therefore, these items are reflected in the column Corp/Elim. 3
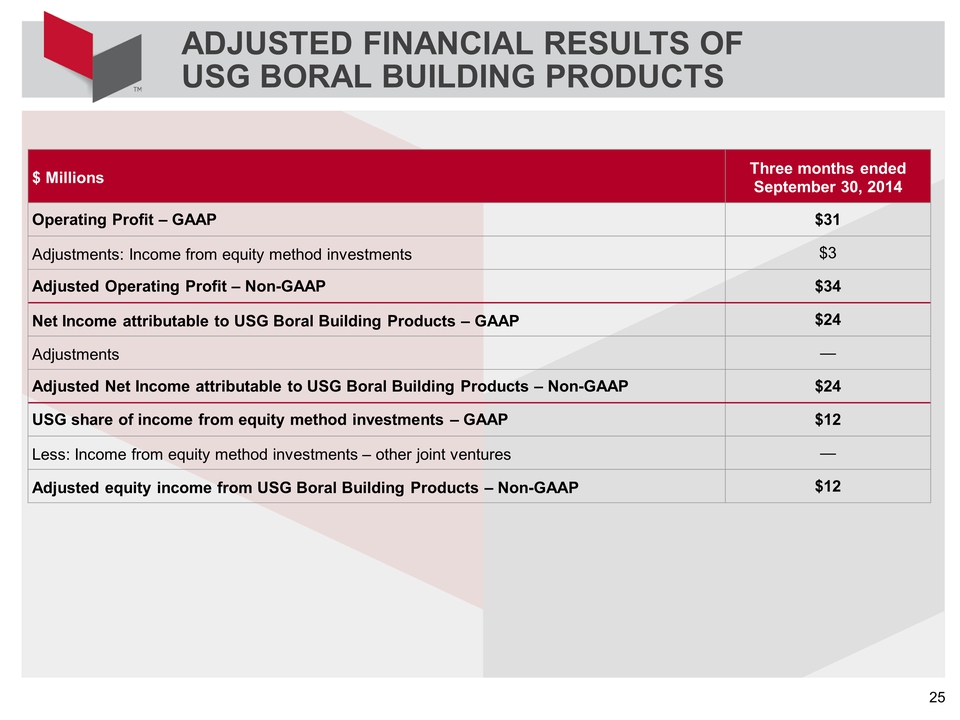
ADJUSTED FINANCIAL RESULTS OF USG BORAL BUILDING PRODUCTS $ Millions Three months ended September 30, 2014 Operating Profit GAAP $31 Adjustments: Income from equity method investments $3 Adjusted Operating Profit Non-GAAP $34 Net Income attributable to USG Boral Building Products GAAP $24 Adjustments Adjusted Net Income attributable to USG Boral Building Products Non-GAAP $24 USG share of income from equity method investments GAAP $12 Less: Income from equity method investments other joint ventures Adjusted equity income from USG Boral Building Products Non-GAAP $12
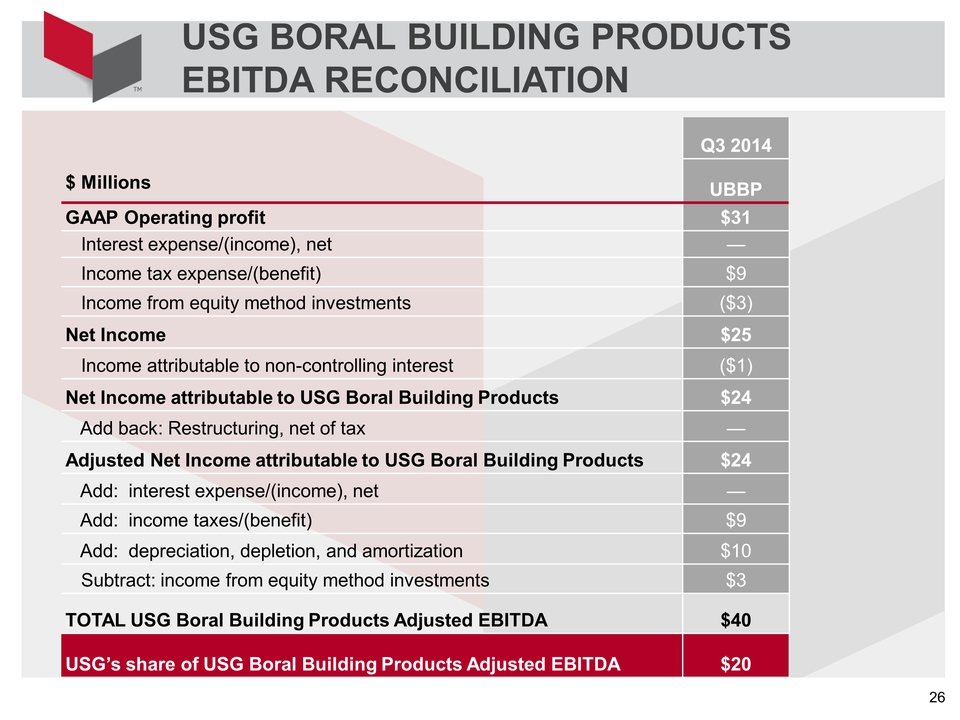
USG BORAL BUILDING PRODUCTS EBITDA RECONCILIATION Q3 2014 $ Millions UBBP GAAP Operating profit $31 Interest expense/(income), net Income tax expense/(benefit) $9 Income from equity method investments ($3) Net Income $25 Income attributable to non-controlling interest ($1) Net Income attributable to USG Boral Building Products $24 Add back: Restructuring, net of tax Adjusted Net Income attributable to USG Boral Building Products $24 Add: interest expense/(income), net Add: income taxes/(benefit) $9 Add: depreciation, depletion, and amortization $10 Subtract: income from equity method investments $3 TOTAL USG Boral Building Products Adjusted EBITDA $40 USG’s share of USG Boral Building Products Adjusted EBITDA $20
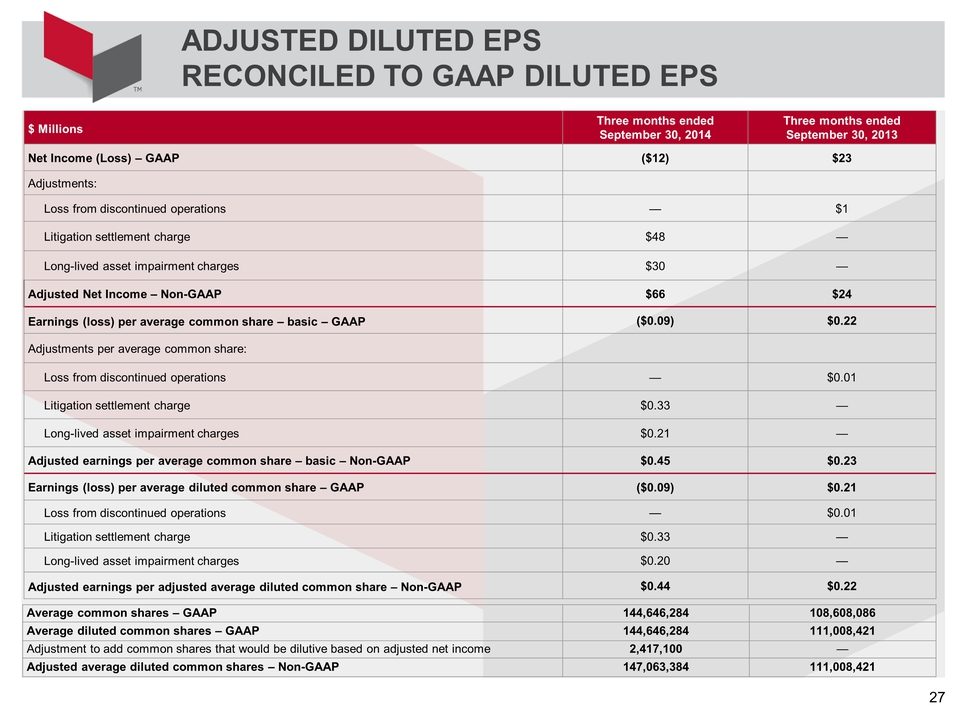
ADJUSTED DILUTED EPS RECONCILED TO GAAP DILUTED EPS $ Millions Three months ended September 30, 2014 Three months ended September 30, 2013 Net Income (Loss) GAAP ($12) $23 Adjustments: Loss from discontinued operations $1 Litigation settlement charge $48 Long-lived asset impairment charges $30 Adjusted Net Income Non-GAAP $66 $24 Earnings (loss) per average common share basic GAAP ($0.09) $0.22 Adjustments per average common share: Loss from discontinued operations $0.01 Litigation settlement charge $0.33 Long-lived asset impairment charges $0.21 Adjusted earnings per average common share basic Non-GAAP $0.45 $0.23 Earnings (loss) per average diluted common share GAAP ($0.09) $0.21 Loss from discontinued operations $0.01 Litigation settlement charge $0.33 Long-lived asset impairment charges $0.20 Adjusted earnings per adjusted average diluted common share Non-GAAP $0.44 $0.22 Average common shares GAAP 144,646,284 108,608,086 Average diluted common shares GAAP 144,646,284 111,008,421 Adjustment to add common shares that would be dilutive based on adjusted net income 2,417,100 Adjusted average diluted common shares Non-GAAP 147,063,384 111,008,421