Attached files
| file | filename |
|---|---|
| 8-K - 8-K - LegacyTexas Financial Group, Inc. | a8k3q2014covererslides.htm |
| EX-99.2 - EXHIBIT 99.2 - LegacyTexas Financial Group, Inc. | ex992q32014dividendannounc.htm |
| EX-99.1 - EXHIBIT 99.1 - LegacyTexas Financial Group, Inc. | ex991q32014earningsrelease.htm |

1 NASDAQ: VPFG Third Quarter 2014 Earnings Kevin Hanigan – President and Chief Executive Officer Kari Anderson – Interim Chief Financial Officer and Chief Accounting Officer EXHIBIT 99.3
2 Safe Harbor Statement When used in this presentation, in filings by ViewPoint Financial Group, Inc. (“ViewPoint”) with the Securities and Exchange Commission (the “SEC”) in ViewPoint’s press releases or other public or shareholder communications, and in oral statements made with the approval of an authorized executive officer, the words or phrases “will likely result,” “are expected to,” “will continue,” “is anticipated,” “estimate,” “project,” “intends” or similar expressions are intended to identify “forward-looking statements” within the meaning of the Private Securities Litigation Reform Act of 1995. Such statements are subject to certain risks and uncertainties that could cause actual results to differ materially from historical earnings and those presently anticipated or projected, including, among other things, the expected cost savings, synergies and other financial benefits from the ViewPoint-LegacyTexas merger (the “Merger”) might not be realized within the expected time frames or at all and costs or difficulties relating to integration matters might be greater than expected, the requisite regulatory approvals might not be obtained or other conditions to completion of the merger set forth in the merger agreement might not be satisfied or waived, changes in economic conditions, legislative changes, changes in policies by regulatory agencies, fluctuations in interest rates, the risks of lending and investing activities, including changes in the level and direction of loan delinquencies and write-offs and changes in estimates of the adequacy of the allowance for loan losses, ViewPoint’s ability to access cost-effective funding, fluctuations in real estate values and both residential and commercial real estate market conditions, demand for loans and deposits in ViewPoint’s market area, the industry-wide decline in mortgage production, competition, changes in management’s business strategies and other factors set forth in ViewPoint’s filings with the SEC. ViewPoint does not undertake – and specifically declines any obligation – to publicly release the result of any revisions which may be made to any forward- looking statements to reflect events or circumstances after the date of such statements or to reflect the occurrence of anticipated or unanticipated events. This communication does not constitute an offer to sell or the solicitation of an offer to buy any securities or a solicitation of any vote or approval. ViewPoint has filed with the SEC a registration statement on Form S-4, which was declared effective by the SEC on April 9, 2014. The registration statement includes a proxy statement/prospectus, which was mailed in definitive form to the shareholders of LegacyTexas on April 15, 2014. INVESTORS ARE URGED TO READ THE PROXY STATEMENT/PROSPECTUS AND ANY OTHER DOCUMENTS FILED WITH THE SEC IN CONNECTION WITH THE MERGER BECAUSE THEY CONTAIN, OR WILL CONTAIN, IMPORTANT INFORMATION ABOUT LEGACYTEXAS, VIEWPOINT AND THE MERGER. Investors may obtain these documents free of charge at the SEC’s website (www.sec.gov). In addition, documents filed with the SEC by ViewPoint are available free of charge by accessing ViewPoint’s website (www.viewpointfinancialgroup.com, under “SEC Filings”) or by contacting Casey Farrell at (972) 801-5871.
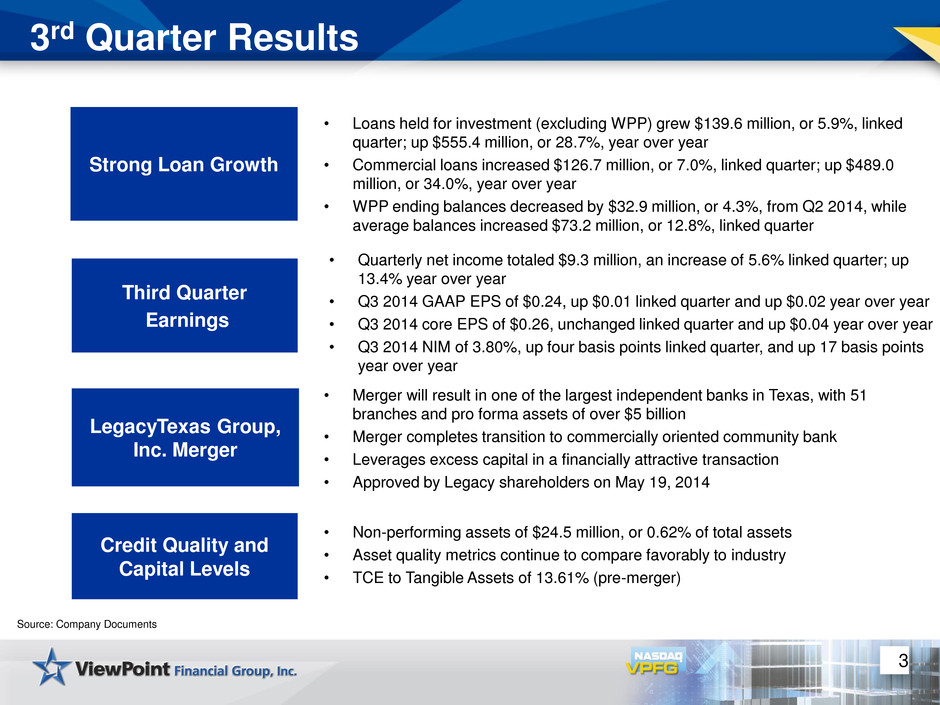
3 3rd Quarter Results • Loans held for investment (excluding WPP) grew $139.6 million, or 5.9%, linked quarter; up $555.4 million, or 28.7%, year over year • Commercial loans increased $126.7 million, or 7.0%, linked quarter; up $489.0 million, or 34.0%, year over year • WPP ending balances decreased by $32.9 million, or 4.3%, from Q2 2014, while average balances increased $73.2 million, or 12.8%, linked quarter Strong Loan Growth Third Quarter Earnings • Quarterly net income totaled $9.3 million, an increase of 5.6% linked quarter; up 13.4% year over year • Q3 2014 GAAP EPS of $0.24, up $0.01 linked quarter and up $0.02 year over year • Q3 2014 core EPS of $0.26, unchanged linked quarter and up $0.04 year over year • Q3 2014 NIM of 3.80%, up four basis points linked quarter, and up 17 basis points year over year • Merger will result in one of the largest independent banks in Texas, with 51 branches and pro forma assets of over $5 billion • Merger completes transition to commercially oriented community bank • Leverages excess capital in a financially attractive transaction • Approved by Legacy shareholders on May 19, 2014 Credit Quality and Capital Levels • Non-performing assets of $24.5 million, or 0.62% of total assets • Asset quality metrics continue to compare favorably to industry • TCE to Tangible Assets of 13.61% (pre-merger) Source: Company Documents LegacyTexas Group, Inc. Merger
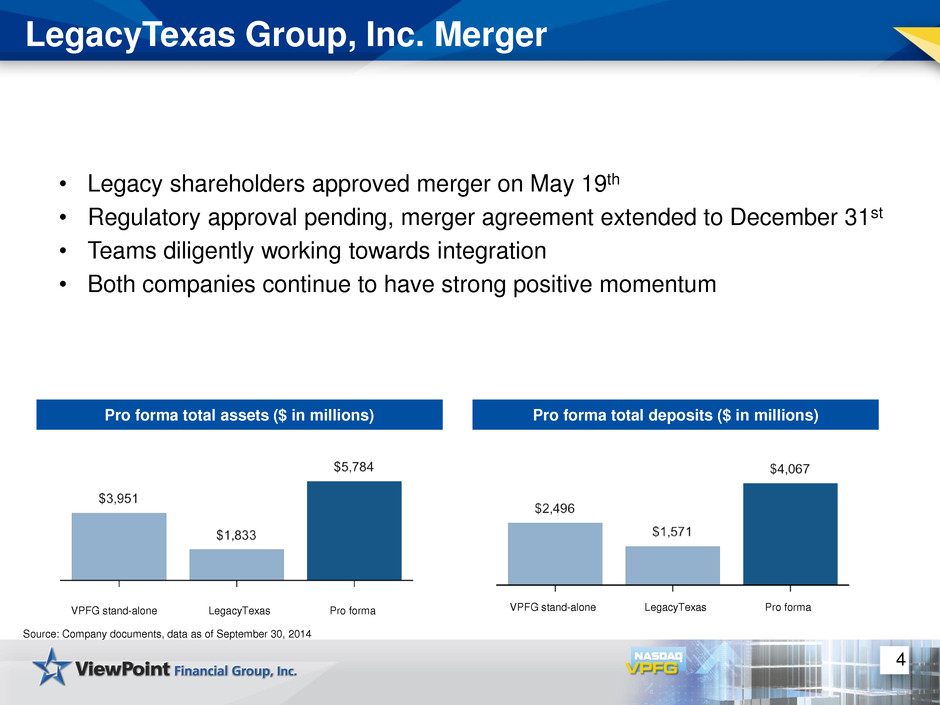
4 LegacyTexas Group, Inc. Merger • Legacy shareholders approved merger on May 19th • Regulatory approval pending, merger agreement extended to December 31st • Teams diligently working towards integration • Both companies continue to have strong positive momentum Pro forma total assets ($ in millions) Pro forma total deposits ($ in millions) VPFG stand-alone LegacyTexas Pro forma VPFG stand-alone LegacyTexas Pro forma Source: Company documents, data as of September 30, 2014
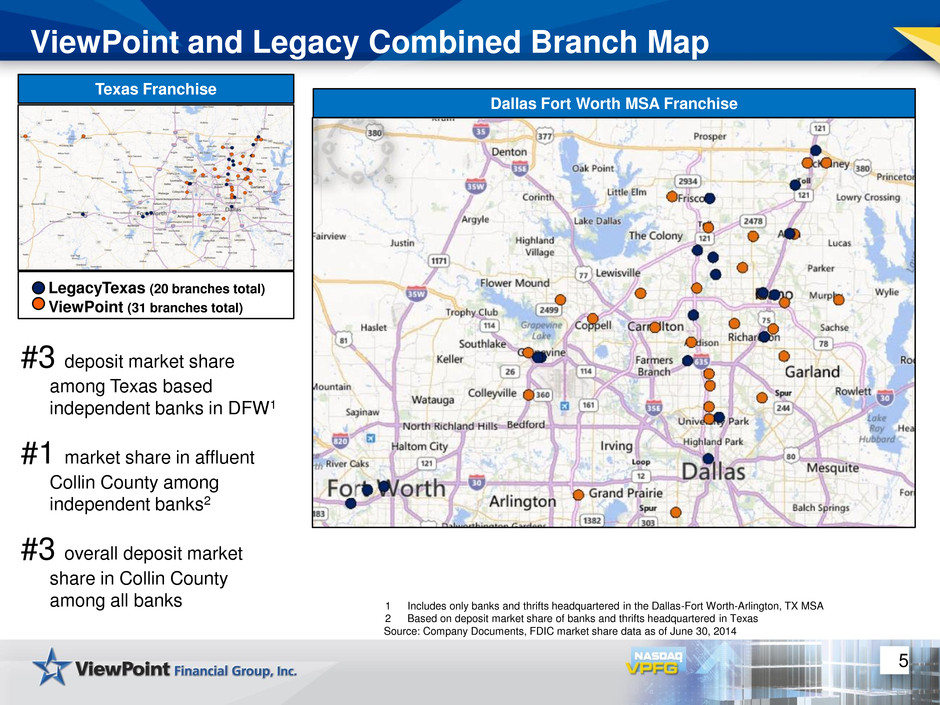
5 ViewPoint and Legacy Combined Branch Map 1 Includes only banks and thrifts headquartered in the Dallas-Fort Worth-Arlington, TX MSA 2 Based on deposit market share of banks and thrifts headquartered in Texas Source: Company Documents, FDIC market share data as of June 30, 2014 Dallas Fort Worth MSA Franchise Texas Franchise LegacyTexas (20 branches total) ViewPoint (31 branches total) #3 deposit market share among Texas based independent banks in DFW1 #1 market share in affluent Collin County among independent banks2 #3 overall deposit market share in Collin County among all banks
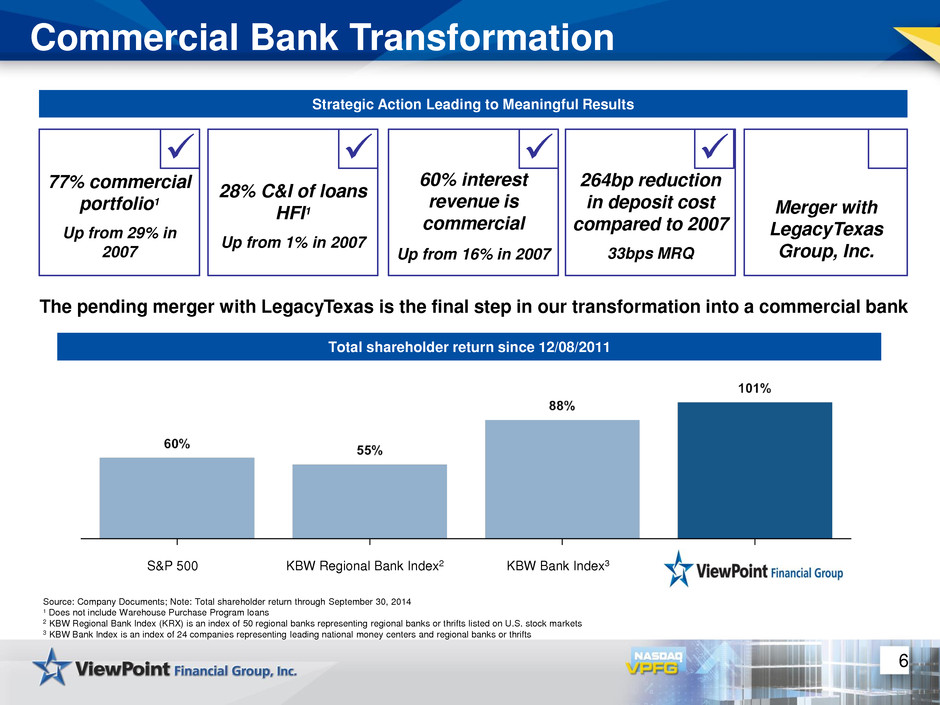
6 Source: Company Documents; Note: Total shareholder return through September 30, 2014 ¹ Does not include Warehouse Purchase Program loans 2 KBW Regional Bank Index (KRX) is an index of 50 regional banks representing regional banks or thrifts listed on U.S. stock markets 3 KBW Bank Index is an index of 24 companies representing leading national money centers and regional banks or thrifts Total shareholder return since 12/08/2011 77% commercial portfolio1 Up from 29% in 2007 Commercial Bank Transformation The pending merger with LegacyTexas is the final step in our transformation into a commercial bank Strategic Action Leading to Meaningful Results Merger with LegacyTexas Group, Inc. 60% interest revenue is commercial Up from 16% in 2007 28% C&I of loans HFI1 Up from 1% in 2007 264bp reduction in deposit cost compared to 2007 33bps MRQ KBW Regional Bank Index2 S&P 500 KBW Bank Index3
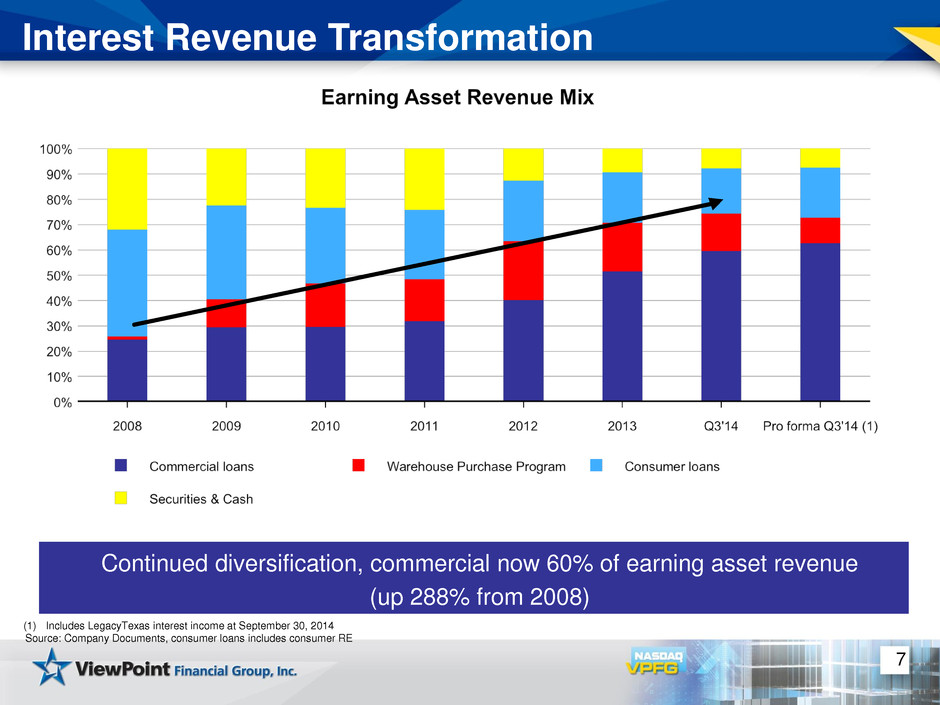
7 Interest Revenue Transformation (1) Includes LegacyTexas interest income at September 30, 2014 Source: Company Documents, consumer loans includes consumer RE Continued diversification, commercial now 60% of earning asset revenue (up 288% from 2008)
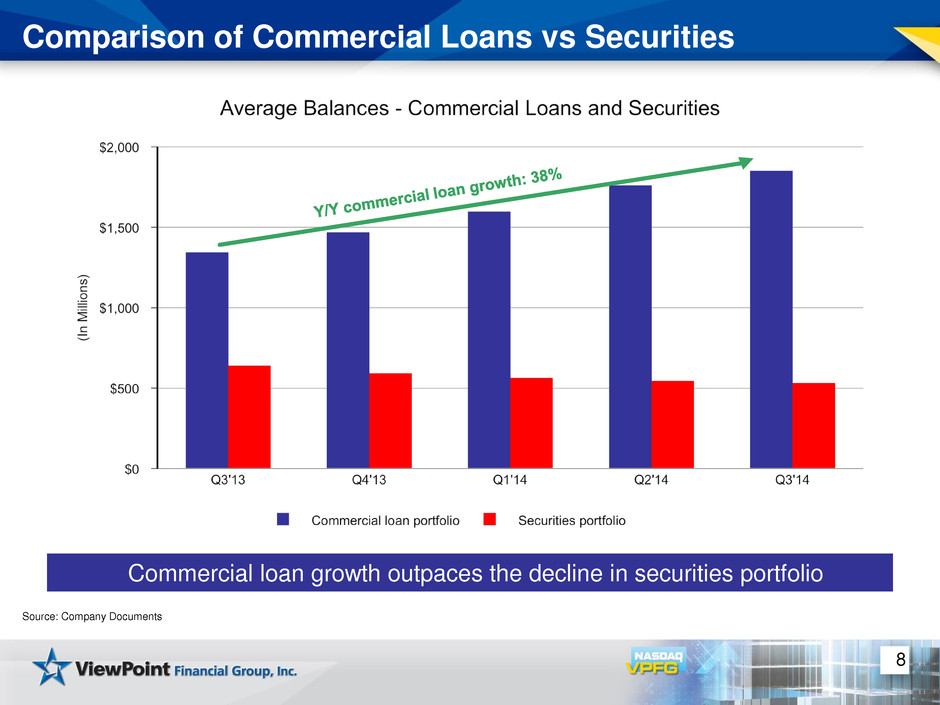
8 Comparison of Commercial Loans vs Securities Source: Company Documents Commercial loan growth outpaces the decline in securities portfolio
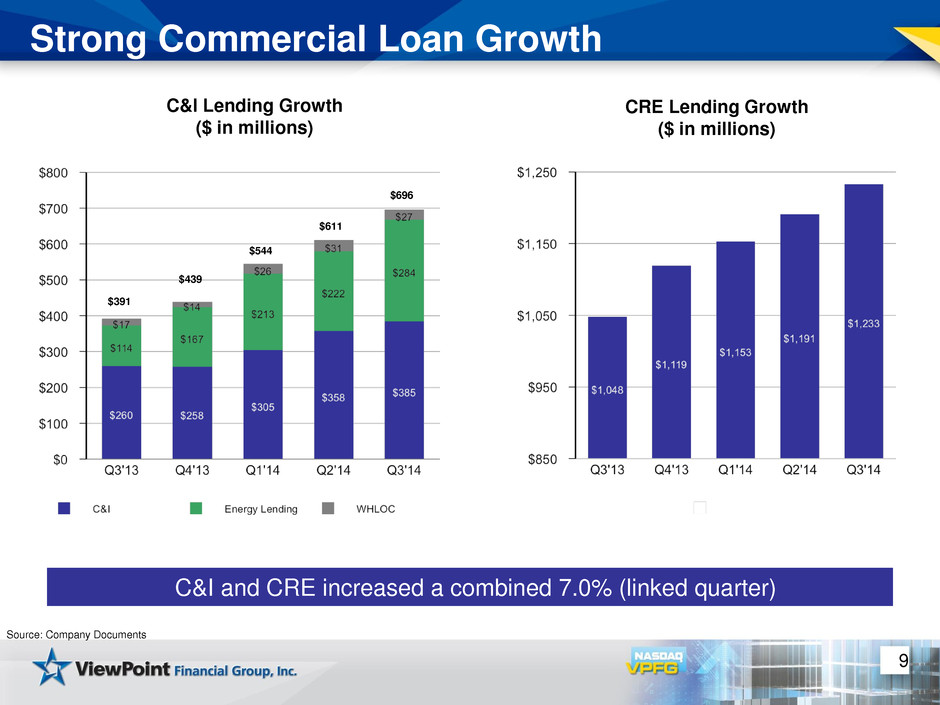
9 Strong Commercial Loan Growth C&I Lending Growth ($ in millions) Source: Company Documents CRE Lending Growth ($ in millions) C&I and CRE increased a combined 7.0% (linked quarter) $439 $544 $611 $696 $391

Low Cost, Diversified Deposit Base 10 Source: Company Documents Total deposits Cost of deposits • Non-interest-bearing demand deposits up $82.6 million from September 30, 2013 • Savings and money market deposits up $161.6 million from September 30, 2013
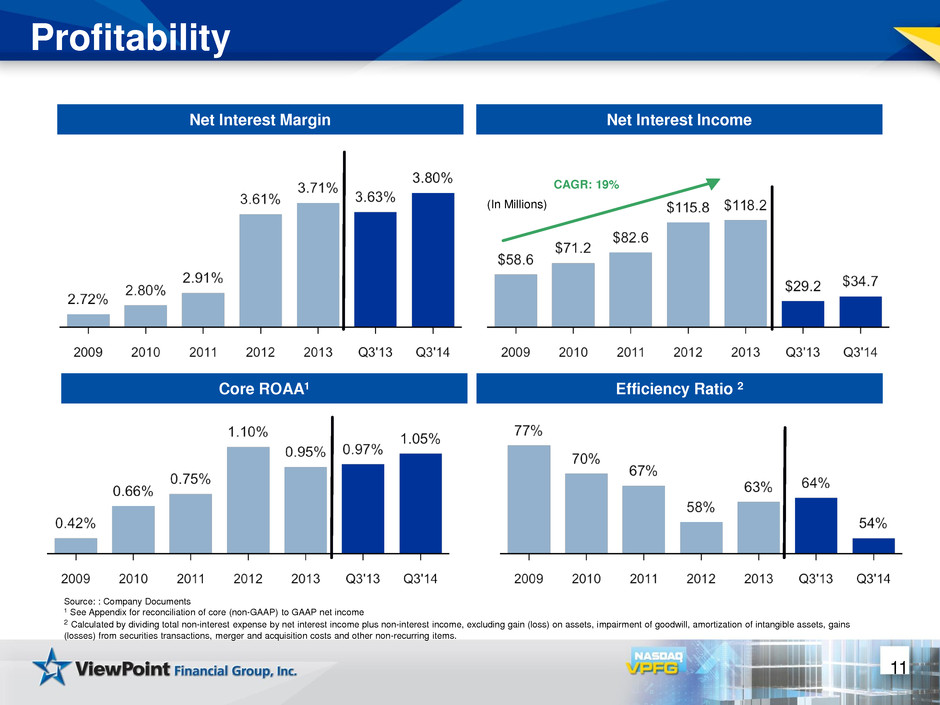
11 Source: : Company Documents 1 See Appendix for reconciliation of core (non-GAAP) to GAAP net income 2 Calculated by dividing total non-interest expense by net interest income plus non-interest income, excluding gain (loss) on assets, impairment of goodwill, amortization of intangible assets, gains (losses) from securities transactions, merger and acquisition costs and other non-recurring items. Efficiency Ratio 2 Net Interest Margin Net Interest Income (In Millions) Core ROAA1 CAGR: 19% Profitability
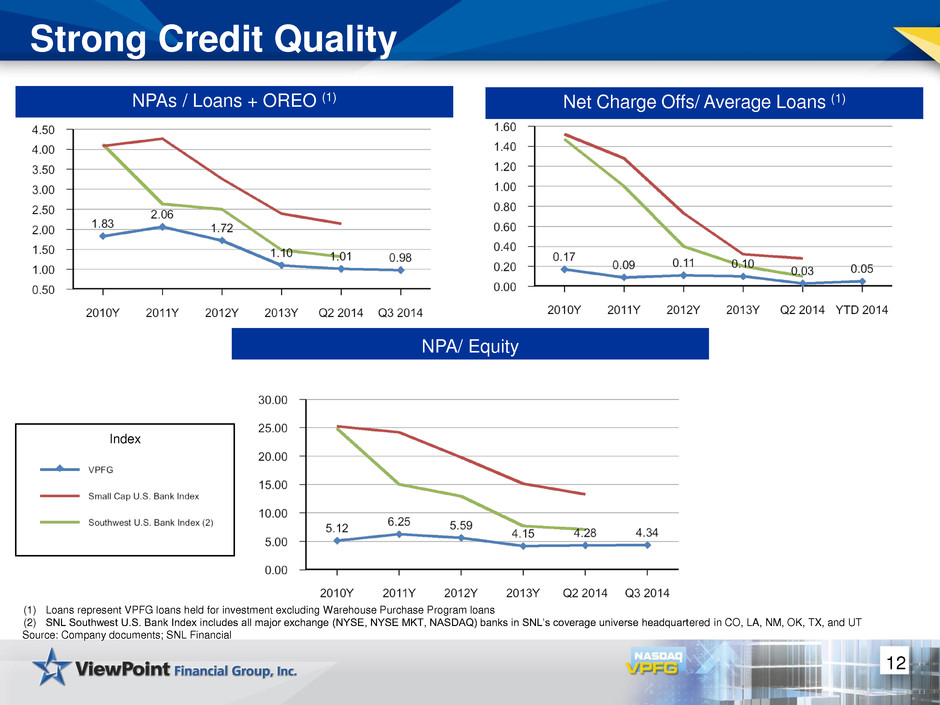
12 Strong Credit Quality Net Charge Offs/ Average Loans (1) NPAs / Loans + OREO (1) (1) Loans represent VPFG loans held for investment excluding Warehouse Purchase Program loans (2) SNL Southwest U.S. Bank Index includes all major exchange (NYSE, NYSE MKT, NASDAQ) banks in SNL’s coverage universe headquartered in CO, LA, NM, OK, TX, and UT Source: Company documents; SNL Financial NPA/ Equity Index
13 Looking Ahead * Successful integration of LegacyTexas and re-branding of the pro- forma franchise * Focus on growth – organically and through selective acquisitions * Diversify income sources * Prudent and focused expense management * Maintain strong asset quality * Strategic capital deployment

14 Questions?
15 Appendix The subsequent tables present non-GAAP reconciliations of the following calculations: Tangible book value per share to tangible assets ratio Tangible book value per share Core (non-GAAP) net income and earnings per share
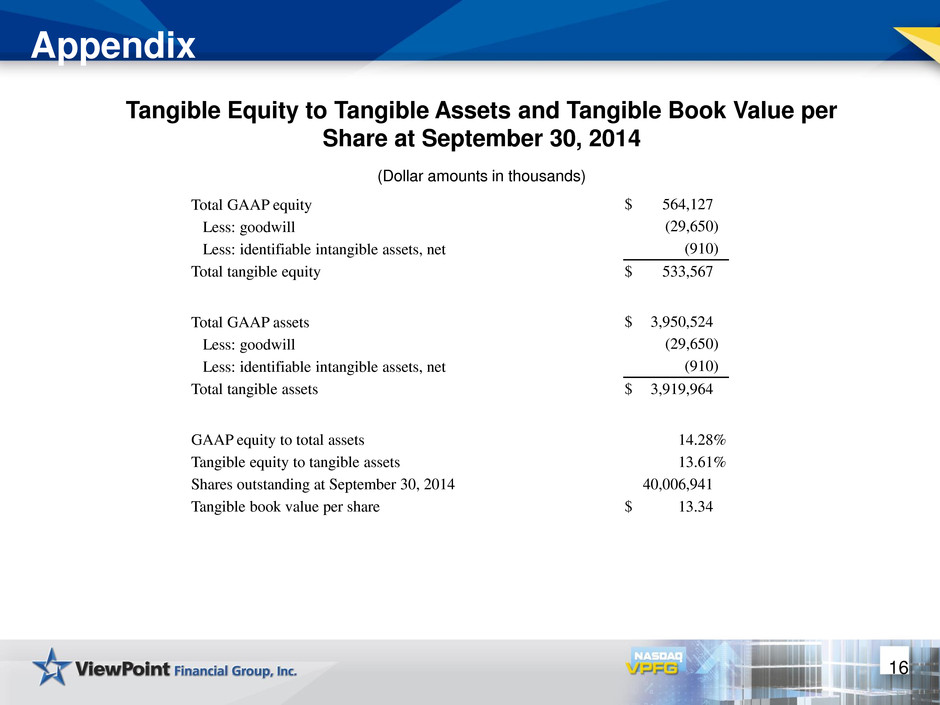
16 Appendix Tangible Equity to Tangible Assets and Tangible Book Value per Share at September 30, 2014 (Dollar amounts in thousands) Total GAAP equity $ 564,127 Less: goodwill (29,650 ) Less: identifiable intangible assets, net (910 ) Total tangible equity $ 533,567 Total GAAP assets $ 3,950,524 Less: goodwill (29,650 ) Less: identifiable intangible assets, net (910 ) Total tangible assets $ 3,919,964 GAAP equity to total assets 14.28 % Tangible equity to tangible assets 13.61 % Shares outstanding at September 30, 2014 40,006,941 Tangible book value per share $ 13.34
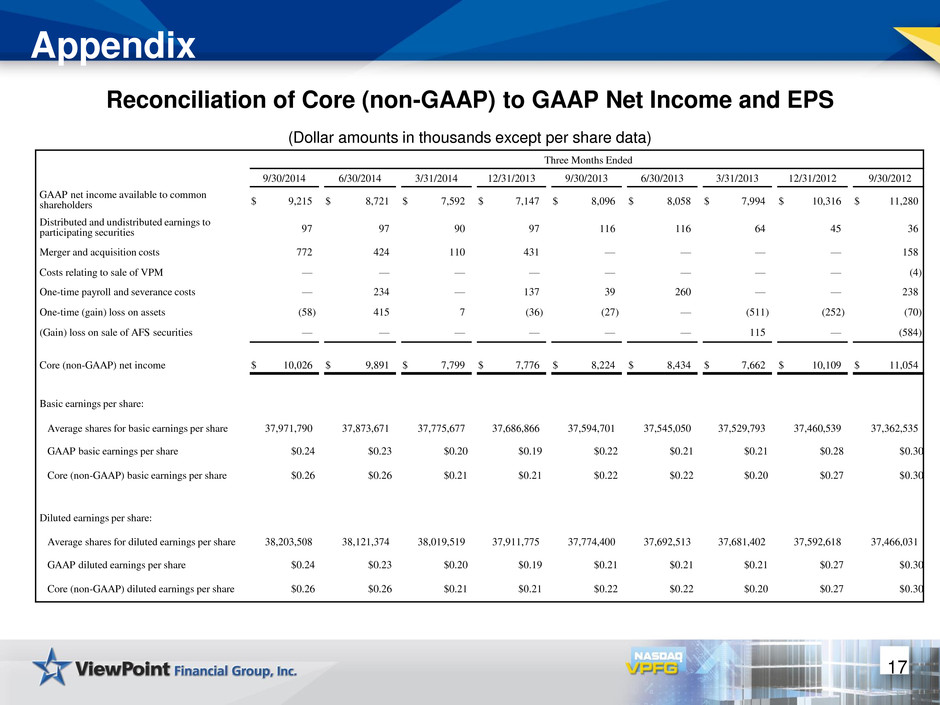
17 Appendix Reconciliation of Core (non-GAAP) to GAAP Net Income and EPS (Dollar amounts in thousands except per share data) Three Months Ended 9/30/2014 6/30/2014 3/31/2014 12/31/2013 9/30/2013 6/30/2013 3/31/2013 12/31/2012 9/30/2012 GAAP net income available to common shareholders $ 9,215 $ 8,721 $ 7,592 $ 7,147 $ 8,096 $ 8,058 $ 7,994 $ 10,316 $ 11,280 Distributed and undistributed earnings to participating securities 97 97 90 97 116 116 64 45 36 Merger and acquisition costs 772 424 110 431 — — — — 158 Costs relating to sale of VPM — — — — — — — — (4 ) One-time payroll and severance costs — 234 — 137 39 260 — — 238 One-time (gain) loss on assets (58 ) 415 7 (36 ) (27 ) — (511 ) (252 ) (70 ) (Gain) loss on sale of AFS securities — — — — — — 115 — (584 ) Core (non-GAAP) net income $ 10,026 $ 9,891 $ 7,799 $ 7,776 $ 8,224 $ 8,434 $ 7,662 $ 10,109 $ 11,054 Basic earnings per share: Average shares for basic earnings per share 37,971,790 37,873,671 37,775,677 37,686,866 37,594,701 37,545,050 37,529,793 37,460,539 37,362,535 GAAP basic earnings per share $0.24 $0.23 $0.20 $0.19 $0.22 $0.21 $0.21 $0.28 $0.30 Core (non-GAAP) basic earnings per share $0.26 $0.26 $0.21 $0.21 $0.22 $0.22 $0.20 $0.27 $0.30 Diluted earnings per share: Average shares for diluted earnings per share 38,203,508 38,121,374 38,019,519 37,911,775 37,774,400 37,692,513 37,681,402 37,592,618 37,466,031 GAAP diluted earnings per share $0.24 $0.23 $0.20 $0.19 $0.21 $0.21 $0.21 $0.27 $0.30 Core (non-GAAP) diluted earnings per share $0.26 $0.26 $0.21 $0.21 $0.22 $0.22 $0.20 $0.27 $0.30
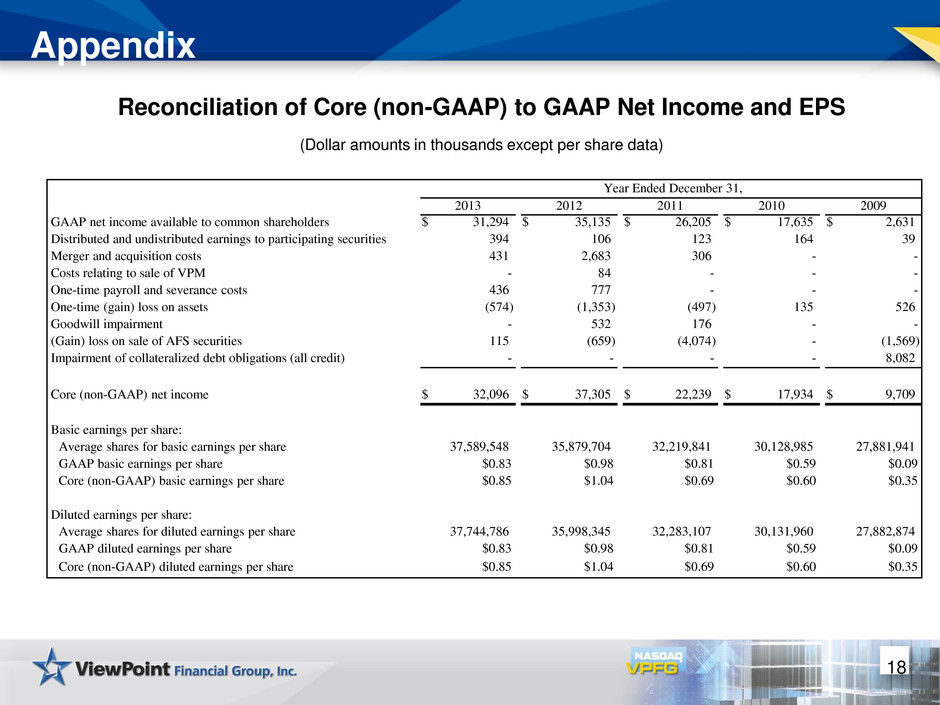
18 Appendix Reconciliation of Core (non-GAAP) to GAAP Net Income and EPS (Dollar amounts in thousands except per share data) Year Ended December 31, 2013 2012 2011 2010 2009 GAAP net income available to common shareholders $ 31,294 $ 35,135 $ 26,205 $ 17,635 $ 2,631 Distributed and undistributed earnings to participating securities 394 106 123 164 39 Merger and acquisition costs 431 2,683 306 - - Costs relating to sale of VPM - 84 - - - One-time payroll and severance costs 436 777 - - - One-time (gain) loss on assets (574 ) (1,353 ) (497 ) 135 526 Goodwill impairment - 532 176 - - (Gain) loss on sale of AFS securities 115 (659 ) (4,074 ) - (1,569 ) Impairment of collateralized debt obligations (all credit) - - - - 8,082 Core (non-GAAP) net income $ 32,096 $ 37,305 $ 22,239 $ 17,934 $ 9,709 Basic earnings per share: Average shares for basic earnings per share 37,589,548 35,879,704 32,219,841 30,128,985 27,881,941 GAAP basic earnings per share $0.83 $0.98 $0.81 $0.59 $0.09 Core (non-GAAP) basic earnings per share $0.85 $1.04 $0.69 $0.60 $0.35 Diluted earnings per share: Average shares for diluted earnings per share 37,744,786 35,998,345 32,283,107 30,131,960 27,882,874 GAAP diluted earnings per share $0.83 $0.98 $0.81 $0.59 $0.09 Core (non-GAAP) diluted earnings per share $0.85 $1.04 $0.69 $0.60 $0.35
