Attached files
| file | filename |
|---|---|
| 8-K - 8-K - XPO Logistics, Inc. | d791699d8k.htm |
| EX-99.2 - EX-99.2 - XPO Logistics, Inc. | d791699dex992.htm |
 Investor Presentation
September 2014
Exhibit 99.1 |
 2
Forward-Looking Statements Disclaimer
This document includes forward-looking statements within the meaning of Section
27A of the Securities Act of 1933, as amended, and Section 21E of the
Securities Exchange Act of 1934, as amended, including the company’s full year 2014 and full year 2017
financial targets. All statements other than statements of historical fact are, or
may be deemed to be, forward-looking statements. In some cases,
forward-looking statements can be identified by the use of forward-looking terms such as "anticipate," "estimate,"
"believe," "continue," "could," "intend,"
"may," "plan," "potential," "predict," "should," "will," "expect," "objective," "projection,"
"forecast,"
"goal,"
"guidance,"
"outlook,"
"effort,"
"target"
or
the
negative
of
these
terms
or
other
comparable
terms.
However,
the
absence
of
these
words
does
not
mean
that
the
statements
are
not
forward-looking.
These
forward-looking
statements
are
based
on certain assumptions and analyses made by us in light of our experience and our
perception of historical trends, current conditions and expected future
developments, as well as other factors we believe are appropriate in the circumstances.
These forward-looking statements are subject to known and unknown risks,
uncertainties and assumptions that may cause actual results, levels of
activity, performance or achievements to be materially different from any future results, levels of activity,
performance or achievements expressed or implied by such forward-looking
statements. Factors that might cause or contribute to a material difference
include those discussed in XPO’s filings with the SEC and the following: economic conditions generally;
competition;
XPO’s
ability
to
find
suitable
acquisition
candidates
and
execute
its
acquisition
strategy;
the
expected
impact
of
acquisitions, including the expected impact on XPO's results of operations; the
ability to realize anticipated synergies and cost savings with respect to
acquired companies; XPO’s ability to raise debt and equity capital; XPO’s ability to attract and retain key
employees
to
execute
its
growth
strategy,
including
acquired
companies’
management
teams;
litigation,
including
litigation
related
to alleged misclassification of independent contractors; the ability to develop and
implement a suitable information technology system; the ability to maintain
positive relationships with XPO’s networks of third-party transportation providers; the ability to retain
XPO’s
and
acquired
companies’
largest
customers;
XPO’s
ability
to
successfully
integrate
acquired
businesses;
rail
and
other
network changes; weather and other service disruptions; and governmental
regulation. All forward-looking statements set forth in this document
are qualified by these cautionary statements and there can be no assurance that the actual results or
developments anticipated will be realized or, even if substantially realized, that
they will have the expected consequences to, or effects on, XPO or its
businesses or operations. Forward-looking statements set forth in this document speak only as of the date
hereof, and XPO undertakes no obligation to update forward-looking statements
to reflect subsequent events or circumstances, changes in expectations or
the occurrence of unanticipated events except to the extent required by law. |
 3
One of the Largest 3PLs in North America
We facilitate over 31,000 deliveries per day
#4 freight brokerage firm and Top 50 logistics company
#3 provider of intermodal services
#1 provider of cross-border Mexico intermodal
#1 manager of expedited shipments
#1 provider of last-mile logistics for heavy goods
Leading provider of technology-enabled contract logistics
Growing presence in freight forwarding, LTL and managed
Sources for rankings: Transport Topics, Journal of Commerce and company data
transportation |
 4
Clearly Defined Strategy for Value Creation
Acquire companies that bring value and are highly scalable
Significantly scale up and optimize existing operations
Open cold-starts where sales recruitment can drive revenue
We are ahead of plan in transforming XPO Logistics into
a leading multi-modal supply chain provider |
 5
$700 Million Strategic Investment in XPO
Three global institutions have invested a total of $700 million of
equity to further XPO’s growth strategy
–
PSP Investments, one of Canada's largest pension investment
managers
–
GIC of Singapore, the fourth largest sovereign fund in the world
–
Ontario Teachers’
Pension Plan, the largest single-profession
plan in Canada
Strong endorsement of XPO’s plan for value creation
Capital primarily will be used to capitalize on acquisition pipeline
Transaction completed September 17, 2014 |
 6
Targets raised in light of the $700 million investment
Updated 2017 Full Year Targets
$9 billion of revenue
$575 million of EBITDA |
 7
Completed 13 strategic acquisitions and established
23 cold-starts in less than three years
Created leading-edge recruiting and training programs
Introduced scalable IT platform
Added national operations centers for shared services, carrier
procurement and last-mile operations
Stratified customers, assigned a single point of contact to each
Created a culture of passionate on-time performance
Disciplined focus on operational excellence
Precise Execution of Growth Plan |
 8
Strong Commitment to Shipper Satisfaction
Integrated network with cross-company visibility
203 locations in the U.S., Canada, Mexico, Asia and Europe
Approximately 10,400 employees
More than 3,600 owner-operator trucks under contract for
Relationships with an additional 27,000 vetted carriers
Access to 60,000 miles of network rail routes
drayage, expedited and last mile subsidiaries |
 9
Significant Growth Embedded in XPO’s Model
Strategic
accounts:
market
to
large
shippers
Cold-starts:
expand
footprint
in
markets
with
best
access
to sales talent
Scale
and
productivity:
recruit
sales
reps
and
provide
state-
of-the-art training and IT
Supply
chain
offering:
build
leadership
positions
in
the
fastest-growing areas of logistics
Performance:
become
the
logistics
partner
of
choice
by
providing the most compelling multi-modal supply chain offering
M&A
program:
focus
on
the
top
100
pipeline
prospects |
 10
Secular Trends Driving Industry Growth
Growth in e-commerce retailing
Outsourcing of logistics services and capacity
Conversion from over-the-road to intermodal rail
Near-shoring of manufacturing in Mexico
Just-in-time lean production
Driver shortage
Automation of the transportation logistics process |
 11
Leading Positions in High-Growth Sectors
Sources: Armstrong & Associates, Norbridge, Inc., EVE Partners LLC, FTR
Associates, SJ Consulting Group, Inc., Bureau of Economic Analysis, US
Department of Commerce Sector
Market
Size
($ billions)
Projected
Growth
(x GDP)
Growth Drivers
Truck brokerage
$50
2-3 times
Outsourcing and technology
Intermodal
$15
3-5 times
Long-haul rail efficiencies and
near-sourcing of
manufacturing in Mexico
Heavy goods,
last-mile
$13
5-6 times
Outsourcing and e-commerce |
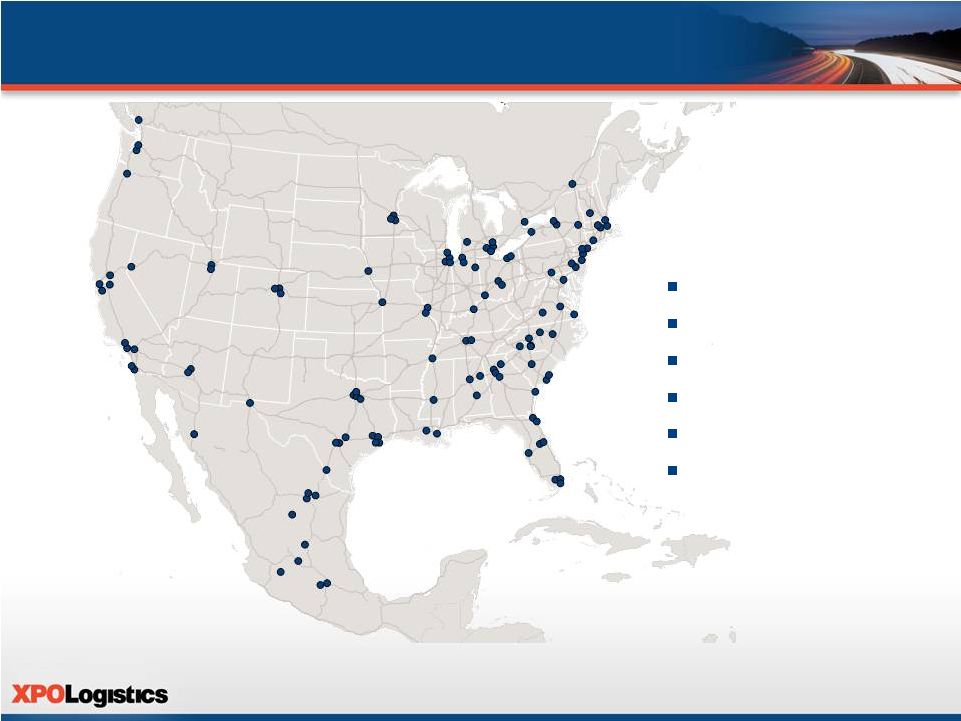 Major
Coverage: U.S., Mexico and Canada Source: Company data
Serving over
Manufacturing
Retail, E-commerce
Commercial
Life Sciences
Food and Beverage
Governmental
12
14,000 customers |
 13
Acquisition of New Breed Logistics
Compelling reasons for the transaction
Transformational for XPO’s scale and value proposition
–
Combined company of over 200 locations
–
Most differentiated supply chain offering for end-to-end solutions
Capitalizes on trend toward outsourcing reverse logistics,
transportation management, lean manufacturing and aftermarket
support, and other contract logistics services
Expected to create significant cross-selling opportunities with XPO
strategic accounts, New Breed customers and their vendors
Source: Company data |
 14
XPO Gains a Preeminent Platform for Growth
Leads the most desirable sector of contract logistics
Technology-enabled solutions for blue chip customers
–
Very stable relationships with low cyclicality
–
Top 10 customers have utilized New Breed for an average of
10 years
Focuses on high-growth industries
–
Technology, telecom, e-commerce, aerospace and defense,
medical equipment and select areas of manufacturing
Operations are led by Louis DeJoy, New Breed’s visionary CEO
Sources: Company data |
 15
New Breed’s Attractive Financial Model
16% revenue CAGR for the past 10 years
38% return on invested capital (FY 2013)
(1)
Approximately 99% contractual revenue renewal rate over the
past three years
Low capex requirements (4.2% of revenue in FY 2013) and
largely devoted to IT development
(1)
Return on invested capital equals ongoing operations EBIT divided by the sum of
net working capital and net PP&E Source: Company data
|
 16
Industry-defining Technology
Integration of proprietary IT will create strong differentiation
–
XPO NLM is the largest web-based manager of expedited
shipments in North America
–
New Breed’s transportation management system uses
sophisticated tools for dynamic freight optimization, routing
guide management and carrier selection
–
New Breed acquisition has doubled XPO’s IT workforce to
more than 600
Sources: Company data
Combination of two robust managed transportation solutions
|
 17
Details of the New Breed Transaction
$615 million cash purchase price
Adds approximately $597 million of revenue (trailing 12 months
ended June 30, 2014)
Multiple of approximately 8.0 times trailing 12 months
adjusted EBITDA
Financed with the proceeds from XPO’s August 2014 private
placement of $500 million of senior notes and available cash
on hand
Transaction completed September 2, 2014 |
 18
$500 Million Senior Notes Issued August 2014
Proceeds used to finance the acquisition of New Breed
7.875% senior notes maturing September 1, 2019
High yield market could present attractive avenue for additional
growth capital
Additive to $415 million accounts receivable facility
Long-term leverage targets: fully-drawn ABL plus 2x EBITDA
–
Callable at XPO’s option, September 2016 |
 19
Acquired ACL in July 2014
Compelling reasons for the transaction
Non-asset, multi-regional, last mile logistics provider
Moves high volumes of e-commerce purchases for
mega-companies
Adds approximately 160 employees, 14 locations and 650
contracted trucks to XPO
Complementary delivery schedules allow XPO Last Mile to
leverage combined capacity
Pipeline still active for last mile acquisitions |
 20
Details of the ACL Transaction
$36.5 million cash purchase price
Adds approximately $63 million of revenue (trailing 12 months
ended June 30, 2014)
Multiple of approximately 5.9 times trailing 12 months
adjusted EBITDA
Transaction completed July 2014 |
 21
Acquired Pacer in March 2014
Gained instant scale in North American intermodal
–
Third largest provider of intermodal services
–
#1 provider of cross-border Mexico intermodal, with
30 years’
experience
–
Access to 60,000 miles of network rail routes
–
Decades-deep relationships with the railroads
Added $980 million of revenue (FY 2013), 31 locations and
approximately 800 employees
Sources: SJ Consulting Group, Inc., Bureau of Economic Analysis, US Department of Commerce and company data |
 22
Major Intermodal Market Opportunity
$15 billion sector in North America
Sources: SJ Consulting Group, Inc., FTR Associates and
company data –
Growing at three to five times GDP
One of the fastest-growing areas of transportation logistics
Enables shippers to lower transportation costs for freight
traveling 600 miles or more
–
Rail is more fuel-efficient than truckload for long haul
–
Intermodal can lower shipper’s cost by up to 20%
|
 23
High-Growth Cross-Border Mexico Sector
Near-shoring
in
Mexico
–
fast
becoming
the
manufacturing
country of choice
–
Competitively priced labor force versus China
–
Faster speed-to-market than overseas locales
–
Can be more cost effective than cross-border truckload
–
Growth driven by billions of dollars invested by major
manufacturers, Mexican government and the rails
Large opportunity to covert to intermodal: an estimated
2.8 million trucks move cross-border each year
Sources: AlixPartners and company data |
 24
Integration of Intermodal Is Driving Results
XPO now manages approximately 10% of all domestic
intermodal loads in North America
Stronger value proposition as a large, single-source supply
chain partner with deep capacity
Energetically cross-selling intermodal to XPO customer base,
and selling full service range to intermodal customers
Q2: intermodal revenue up 11.7% and volume up 7.5% YOY
On track to realize $15 million of targeted cost synergies from
integration
Source: Company data |
 25
Rebranded as XPO Last Mile
Largest provider of last-mile logistics for heavy goods home
delivery in North America
Facilitates approximately 7 million last-mile deliveries per year
Leading, proprietary software for workflow and customer
experience management
Strong customer-centric culture built by experienced leaders
who now run the business for XPO
Acquired 3PD in August 2013
Source: Company data |
 26
XPO Last Mile serves one of the fastest-growing sectors of
non-asset, third party logistics
–
Heavy goods home delivery
growing at five to six times GDP
–
Strong tailwinds from e-commerce and outsourcing
$13 billion market for heavy goods home deliveries
–
Only 30% currently going through 3PLs
Highly fragmented with many small, regional providers
Last Mile’s Exciting Market Potential
Sources: Norbridge, Inc. and EVE Partners LLC |
 27
Capitalizing on major advantages of scale and growing
–
Cost efficiencies, productivity, access to trucks, rigorous
quality control systems, expertise
Acquired Optima Service Solutions in November 2013
–
Highly scalable supplier, leading arranger of last mile
installations of large appliances and electronics
Acquisition of ACL brought deep relationships in retail
e-commerce channels
XPO Has a Strong Platform for Last Mile
Source: Company data |
 28
Rebranded as XPO NLM
#1 web-based expediter, made XPO the #1 manager of
expedited shipments in North America
Manages an annual run rate of more than three quarters of a
billion dollars of gross transportation spend
–
Online auction system proprietary to XPO
–
Carriers bid on loads that are awarded electronically
Benefits from trend toward just-in-time inventories, and
supply chain disruptions
Acquired NLM in December 2013 |
 29
Focused Sales and Marketing Effort
Differentiate XPO by providing a passionate commitment to
customer satisfaction across a range of services
Single point of contact for each customer
–
Strategic accounts team marketing to largest 2,000 shippers
–
National accounts team focused on next largest
5,000 companies
–
Branch network expands our reach to hundreds of
thousands of small and medium-sized shippers
Capture more of the $32 billion less-than-truckload opportunity
Sources: SJ Consulting Group, Inc., company data |
 30
One common IT platform for freight brokerage in all cold-starts
and acquired companies
Proprietary freight optimizer tools for pricing and load-covering
put in place in 2012
Highly scalable load execution and tendering via automated
load-to-carrier matching
Total IT budget of more than $70 million for 2014
(1)
Increasing Productivity through Technology
(1) Includes full year IT budget for Pacer and excludes New Breed IT
budget |
 31
23 cold-starts
–
11 in freight brokerage, including Kansas City opened
in March; 11 in freight forwarding; one in expedited
Freight brokerage cold-starts on an annual revenue run rate
of more than $220 million
Up from $90 million 12 months ago
Low capital investment can deliver outsized returns
Hire strong industry veterans as branch presidents
Position in prime recruitment areas and scale up
Growth through Cold-starts |
 32
Founded and led four highly successful companies,
including world-class public corporations
United Rentals:
Built world’s largest equipment rental company
United Waste:
Created 5th largest solid waste business in North America
Hamilton Resources:
Grew global oil trading company to ~$1 billion
Amerex Oil Associates:
Built one of world’s largest oil brokerage firms
United Rentals stock outperformed S&P 500 by 2.2x from 1997 to 2007
United Waste stock outperformed S&P 500 by 5.6x from 1992 to 1997
CEO Bradley S. Jacobs |
 33
Highly Skilled Management Team
Partial list
The full management team can be found on www.xpologistics.com
Troy Cooper
Chief Operating Officer
Paul Smith
President, Intermodal division
Karl Meyer
Chief Executive Officer, XPO Last Mile
Chris Healy
President, Expedited Transportation
John Hardig
Chief Financial Officer
Tom Connolly
Senior Vice President, Acquisitions
Dave Rowe
Chief Technology Officer
Mario Harik
Chief Information Officer
Julie Luna
Chief Commercial Officer
Scott Malat
Chief Strategy Officer
Gordon Devens
General Counsel
United Rentals, United Waste
Pacer International
Boyd Brothers, Caliber Logistics, Roberts Express
Stifel Nicolaus, Alex. Brown
EVE Partners
Echo Global Logistics
Oakleaf Waste Management
AutoNation, Skadden Arps
Goldman Sachs, UBS, JPMorgan Chase
Pacer International, Union Pacific
3PD, Inc., Home Depot |
 34
Deep Bench of Industry Experience Partial list
Lou Amo
Vice President, Operational Initiatives
Jake Schnell
Sr. Operational Process and Integration Manager
Jenna Sargent
Regional Sales and Operation Manager
Evan Laskaris
Director of Operations, Chicago
Bud Workmon
President, XPO Last Mile
Jim Commiskey
Strategic Accounts Manager
Greg Ritter
Senior Vice President, Strategic Accounts
Doug George
Branch President, Dallas
Will O’Shea
Chief Sales and Marketing Officer, XPO Last Mile
Andrew Armstrong
Sales and Operations Manager
Drew Wilkerson
Branch President, Charlotte
3PD, Inc., Cardinal Logistics
Electrolux, Union Pacific, Odyssey Logistics
C.H. Robinson
OHL, Schneider Logistics
AFN, CEVA Logistics, Menlo
Pacer International, UPS, Menlo
Knight Brokerage, C.H. Robinson
AFN, Ryder Integrated Logistics
Livingston International, Echo Global Logistics
C.H. Robinson
3PD, Inc., Ryder Integrated Logistics, Cardinal Logistics
|
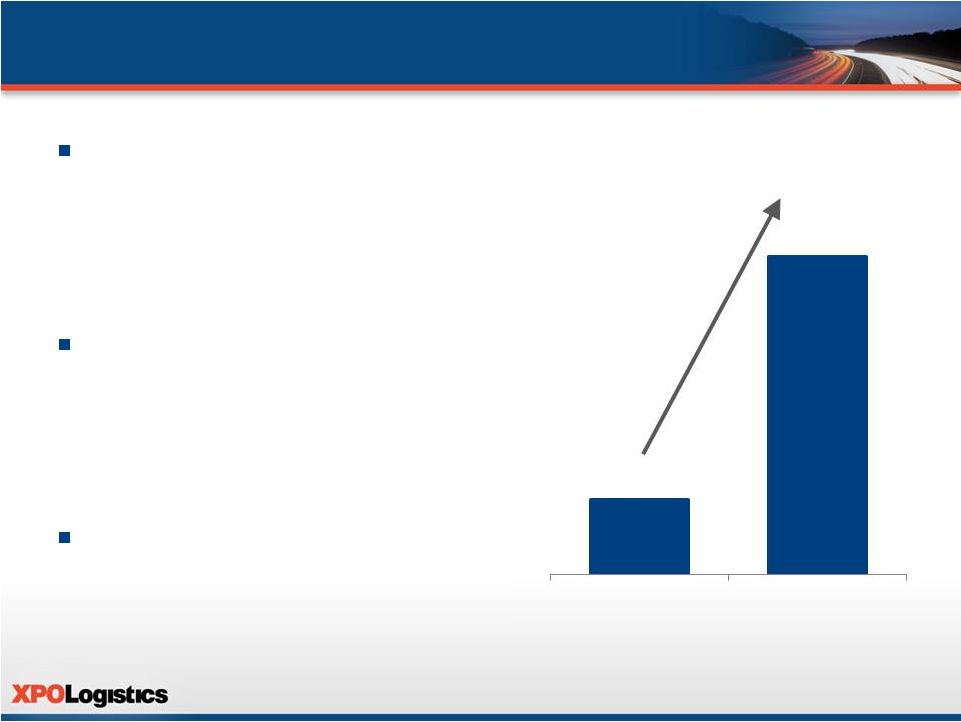 35
Revenue trajectory
–
2011 revenue of $177 million
–
Approximately $2.3 billion annual
revenue run rate as of 6/30/14
(1)
Q2 company-wide, 2014 vs. 2013
–
Organic growth up 49%
–
Gross revenue up 324%
–
Net revenue up 530%
Organic growth in freight
brokerage up 67%
Revenue and Margin Growth
Gross Revenue ($ millions)
+324%
(1) Excludes beneficial impact of ACL and New Breed acquisitions
Q2 ‘13
Q2 ‘14
$137
$581 |
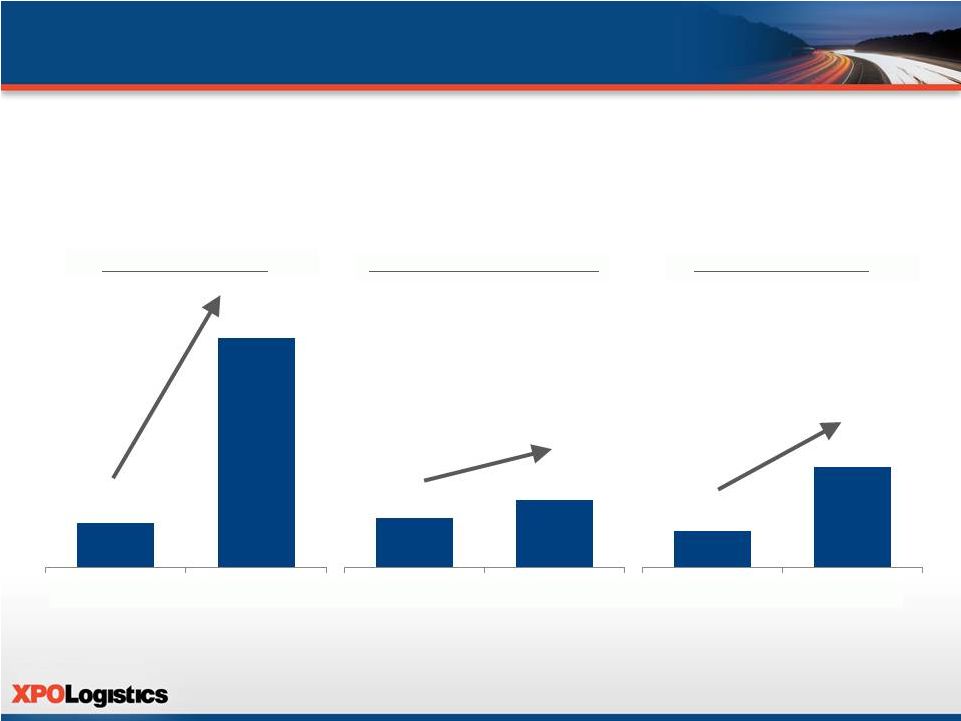 Key
Financial Statistics Expedited Transportation
Freight Brokerage
Freight Forwarding
Q2 Revenue Growth by Business Unit, 2014 vs. 2013
Revenue ($ millions)
+417%
+37%
+180%
36
$26
$36
$19
$54
$493
$95
Q2 ’
13
Q2 ’
14
Q2 ’
13
Q2 ’
14
Q2 ’
13
Q2 ’
14 |
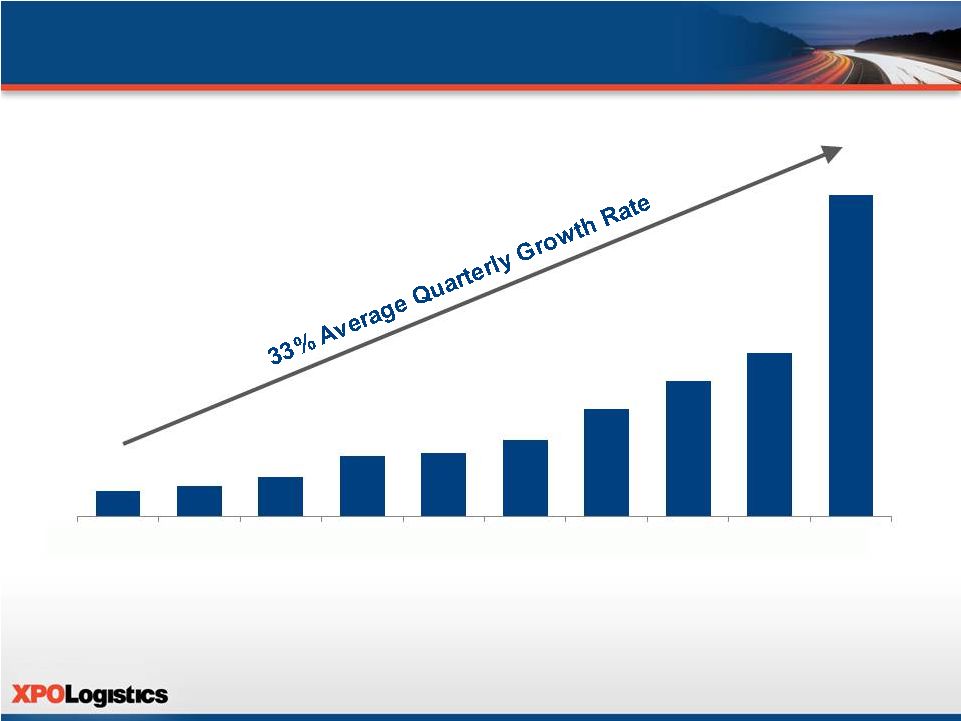 First
30 Months of Growth Strategy 2012
2013
2014
Revenue ($ millions)
37
Q1
Q2
Q3
Q4
Q1
Q2
Q3
Q4
Q1
Q2
$45
$55
$71
$109
$114
$137
$194
$257
$282
$581 |
 38
As of December 31, 2014
Annual revenue run rate of at least $3 billion
Annual EBITDA run rate of at least $150 million
2014 Financial Targets |
 39
Incentivized XPO Management
Equity ownership aligns management team with shareholders
Management and directors own approx. 22% of the company
(1)
Common Stock Equivalent Capitalization as of 9/17/14
Common Shares
76.6 million
(2)
Preferred Shares
10.5 million
Warrants (Strike Price $7 per share)
10.6 million (8.7 million dilutive)
(3)
Convertible Senior Notes
7.3 million shares
(4)
Stock Options and RSUs
2.3 million shares dilutive
(5)
Fully Diluted Shares Outstanding
105.4 million shares
(1)
Based on SEC beneficial ownership calculation as of September 17, 2014; includes (i) 10.7 million
shares issued pursuant to the September 2014 private placement (the “Private
Placement”) and (ii) 12.1 million shares on a pro forma basis that are issuable upon conversion of preferred stock
that was issued pursuant to the Private Placement (2)
Includes the common shares described in clauses (i) and (ii) of note (1) above, assuming, on a pro
forma basis, the conversion of preferred shares into common stock, which is subject to
shareholder approval (3)
Dilutive effect of warrants calculated using treasury method (using XPO closing price of
$39.72 on September 17, 2014); total warrant proceeds of $74.0 million (4)
Assumes conversion in full of $120.7 million in aggregate principal amount of outstanding 4.50%
convertible senior notes due 2017
(5)
Dilutive effect of outstanding RSUs and stock options calculated using treasury method (using XPO
closing price of $39.72 on September 17, 2014) |
 40
Significant growth embedded in XPO’s business model
Leading positions in fastest-growing areas of transportation
Compelling value proposition as a multi-modal, single-source
provider
Passionate culture of on-time performance and productivity
Top management talent with skills that uniquely fit XPO’s
growth strategy
Clear Path for Significant Value Creation |
 41
Additional Information about the Investment
XPO will file a proxy statement and other documents relating to the securities
issued pursuant to the Investment Agreement, dated
as
of
September
11,
2014,
by
and
among
XPO
and
the
Purchasers
named
therein
(the
“Investment”)
with
the
Securities
and Exchange Commission (the “SEC”). INVESTORS AND SECURITY HOLDERS ARE
URGED TO READ THE PROXY STATEMENT AND OTHER DOCUMENTS FILED WITH THE SEC
WHEN THEY BECOME AVAILABLE, AS WELL AS ANY AMENDMENTS OR SUPPLEMENTS TO
THOSE DOCUMENTS, BECAUSE THEY WILL CONTAIN IMPORTANT INFORMATION
ABOUT
THE
INVESTMENT.
Investors
and
security
holders
may
obtain
these
documents
free
of
charge
at
the
SEC’s
website
at
www.sec.gov.
You
may
also
obtain
these
documents
free
of
charge
at
www.xpo.com.
You
may
also
read
and
copy any reports, statements and other information filed by XPO with the SEC at the
SEC public reference room at 100 F Street N.E., Room 1580, Washington, D.C.
20549. Participants in Solicitation
XPO and
its
executive
officers
and
directors
may
be
deemed
to
be
participants
in
the
solicitation
of
proxies
from
XPO
shareholders with respect to the Investment. Information about XPO’s executive
officers and directors is available in XPO’s proxy statement
on
Schedule
14A
for
its
2014
annual
meeting
of
shareholders,
filed
with
the
SEC
on
April
25,
2014.
Investors
and
shareholders may obtain more detailed information regarding the direct and indirect
interests of XPO and its executive officers and directors in the Investment
by reading the proxy statement regarding the Investment when it becomes available. Copies of
these documents may be obtained, free of charge, as described above. This document
shall not constitute an offer to sell or the solicitation
of
an
offer
to
sell
or
the
solicitation
of
an
offer
to
buy
any
securities,
nor
shall
there
be
any
sale
of
securities
in any
jurisdiction in which such offer, solicitation or sale would be unlawful prior to
registration or qualification under the securities laws of any such
jurisdiction. |