Attached files
| file | filename |
|---|---|
| 8-K - HGR 2014 ANNUAL SHAREHOLDER MEETING 8-K - HGR Liquidating Trust | hinesglobalreit2014proxyre.htm |

2014 Shareholder Meeting Hines Global REIT Sherri Schugart President and CEO

Hines Global REIT 2014 Shareholder Meeting Company Overview Commenced capital raising in 2009 and closed our share offerings to new investors in April 2014, raising $2.8 billion in aggregate proceeds Investment Strategy & Objectives • Invest in diversified portfolio of high quality commercial real estate • U.S. & international for geographic diversification • Multiple asset classes for sector diversification • Currencies provide an additional level of diversification • Moderate leverage • Provide regular cash distributions • Achieve attractive total returns upon the ultimate sale of our investments or another ultimate liquidity event 2

Hines Global REIT 2014 Shareholder Meeting Portfolio Overview Current portfolio consists of • 41 projects 1 • Office, Retail, Industrial, Multifamily and Mixed Use • Estimated aggregate value of approximately $4.7 billion 1,3 • 14.0 million square feet 1 • 95% leased 2 Moderate leverage of 47% with weighted average interest rate of 3.3% Current distribution rate maintained through September 20144 • 6.25% annualized rate on $10.40 share price 4,5 • 6.32% annualized rate on $10.28 share price 4,5 • 6.50% annualized rate on $10.00 share price 4,5 3 1. Assumes 100% ownership in each of Hines Global REIT’s real estate assets and includes costs of three development projects, which have not been completed, and real estate related debt. We own less than 100% of the interests in five projects. Assuming our effective ownership in each asset, the net purchase price would be $4.3 billion and square feet would be 13.8 million. Data is as of June 30, 2014. 2. The percentage leased would be 95% assuming the REIT’s effective ownership. The square feet and percentage leased do not include development projects. 3. Based on Hines Global REIT’s pro-rata share of the estimated value of each investment as of December 31, 2013. The estimated values of Hines Global REIT’s real estate property investments were based on their appraised values as of December 31, 2013. Values of Hines Global REIT’s multifamily development projects (one of which has not been completed) were based on their estimated cost to completion and values of Hines Global REIT’s real estate-related debt investments were based on the amounts outstanding under each loan as of June 30, 2014. 4. The board determines the timing and amount of distributions. There is no guarantee that distributions will be paid or that the distribution rate will be maintained. We reduced our annualized distribution rate in January 2012. Distributions have exceeded earnings and have been funded from cash flows from operating activities and cash flows from financing activities, which includes borrowings, offering proceeds and noncontrolling interests contributions. For the 6 months ended June 30, 2014, and for the years ended 12/31/13, 12/31/12 and 12/31/11, respectively, 12%, 48%, 18%, and 13% of distributions were funded from borrowings and 24%, 13%, 32%, and 40% of distributions were funded from offering proceeds. The balance of distributions was funded from cash flows from operating activities. The use of proceeds, borrowed funds and noncontrolling interests contributions to pay distributions may adversely impact our ability to pay distributions at the current rate or at all, and could reduce the amount available for investment, which could reduce a shareholder’s overall return. Share price for the initial offering was determined arbitrarily. 5. Annualized rate assumes rate is maintained for a twelve-month period.

Hines Global REIT 2014 Shareholder Meeting 4 Geographical Diversification GEOGRAPHIC REGIONS Moscow London Birmingham Katowice Paris Stuttgart Forchheim Wroclaw Erfurt Warsaw Brisbane Sydney 1. Data includes all acquisitions through June 30, 2014. We have a real estate loan receivable related to Flagship in Dallas, not a property. 2. Based on Hines Global REIT’s pro-rata share of the estimated value of each investment as of December 31, 2013. The estimated values of Hines Global REIT’s real estate property investments were based on their appraised values as of December 31, 2013. Values of Hines Global REIT’s multifamily development projects (one of which has not been completed) were based on their estimated cost at completion and values of Hines Global REIT’s real estate-related debt investments were based on the amounts outstanding under each loan as of June 30, 2014. The estimated values of completed acquisitions in 2014 were based on the contract purchase prices. 53% Domestic/ 47% International1 East Midwest South West International Austin Orange County Durham Minneapolis Boston area Atlanta Houston Seattle Miami San Francisco Los Angeles Dallas Jacksonville Nashville Washington, DC San Antonio Office - 65% Retail - 14% Multifamily - 3% Industrial - 9% Mixed-Use - 9% PRODUCT TYPE1,2 % OF TOTAL PORTFOLIO—BASED ON ESTIMATED VALUES

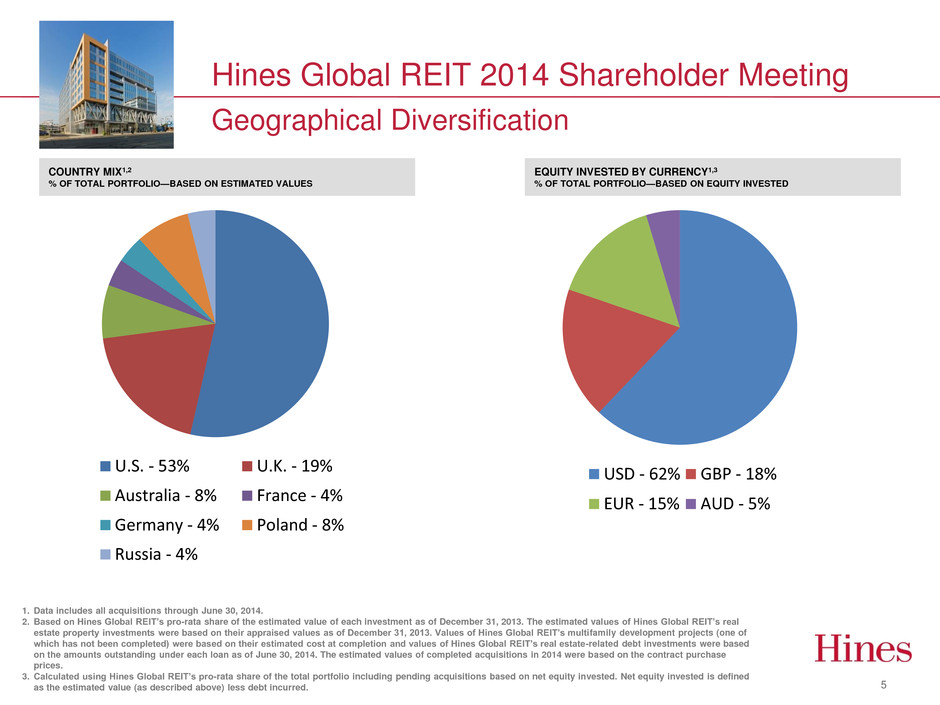
Hines Global REIT 2014 Shareholder Meeting 5 Geographical Diversification 1. Data includes all acquisitions through June 30, 2014. 2. Based on Hines Global REIT’s pro-rata share of the estimated value of each investment as of December 31, 2013. The estimated values of Hines Global REIT’s real estate property investments were based on their appraised values as of December 31, 2013. Values of Hines Global REIT’s multifamily development projects (one of which has not been completed) were based on their estimated cost at completion and values of Hines Global REIT’s real estate-related debt investments were based on the amounts outstanding under each loan as of June 30, 2014. The estimated values of completed acquisitions in 2014 were based on the contract purchase prices. 3. Calculated using Hines Global REIT’s pro-rata share of the total portfolio including pending acquisitions based on net equity invested. Net equity invested is defined as the estimated value (as described above) less debt incurred. EQUITY INVESTED BY CURRENCY1,3 % OF TOTAL PORTFOLIO—BASED ON EQUITY INVESTED COUNTRY MIX1,2 % OF TOTAL PORTFOLIO—BASED ON ESTIMATED VALUES U.S. - 53% U.K. - 19% Australia - 8% France - 4% Germany - 4% Poland - 8% Russia - 4% USD - 62% GBP - 18% EUR - 15% AUD - 5%

Hines Global REIT 2014 Shareholder Meeting 2014 Acquisitions 6 25 Cabot Square London, UK The Rim San Antonio, TX Simon Hegele Logistics Forchheim, Germany Purchase Price: $176.3 million 658,964 Square Feet 100% Leased Purchase Price: $371.7 million 455,687 Square Feet 100% Leased Purchase Price: $49.2 million 371,345 Square Feet 100% Leased

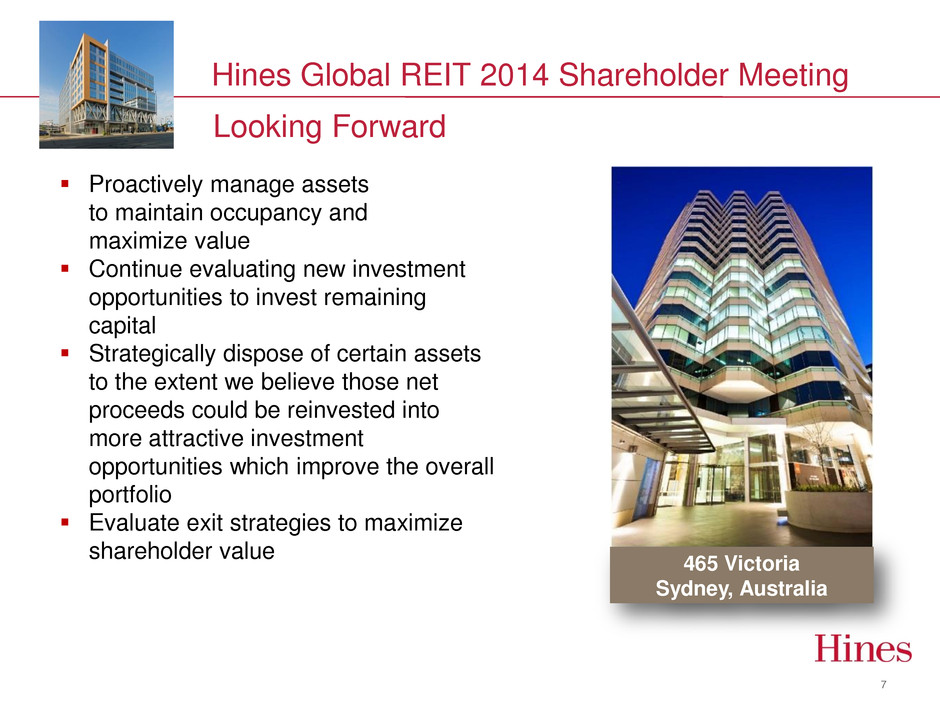
Hines Global REIT 2014 Shareholder Meeting 7 Looking Forward Proactively manage assets to maintain occupancy and maximize value Continue evaluating new investment opportunities to invest remaining capital Strategically dispose of certain assets to the extent we believe those net proceeds could be reinvested into more attractive investment opportunities which improve the overall portfolio Evaluate exit strategies to maximize shareholder value 465 Victoria Sydney, Australia
