Attached files
| file | filename |
|---|---|
| 8-K - 8-K - CVB FINANCIAL CORP | d791312d8k.htm |
| EX-99.2 - EX-99.2 - CVB FINANCIAL CORP | d791312dex992.htm |
Exhibit 99.1
CVB Financial Corp.
September 2014
2Q Results 2014 | cbbank.com
Safe Harbor
Certain
matters set forth herein (including the exhibits hereto) constitute forward-looking statements within the meaning of the Private Securities Litigation Reform Act of 1995, including forward-looking statements relating to the Company’s current
business plans and expectations regarding future operating results. These forward-looking statements are subject to risks and uncertainties that could cause actual results, performance or achievements to differ materially from those projected. These
risks and uncertainties include, but are not limited to, local, regional, national and international economic conditions and events and the impact they may have on us and our customers; ability to attract deposits and other sources of liquidity;
supply and demand for real property inventory and periodic deterioration in values of California real estate, both residential and commercial; a prolonged slowdown or decline in construction activity; changes in the financial performance and/or
condition of our borrowers; changes in the level of non-performing assets and charge-offs; the cost or effect of acquisitions we may make; the effect of changes in laws and regulations (including laws, regulations and judicial decisions concerning
financial reform, taxes, banking capital levels, securities, employment, executive compensation, insurance and information security) with which we and our subsidiaries must comply; changes in estimates of future reserve requirements and minimum
capital requirements based upon the periodic review thereof under relevant regulatory and accounting requirements, including changes in the Basel Committee framework establishing capital standards for credit, operations and market risk; inflation,
interest rate, securities market and monetary fluctuations; changes in government interest rate or monetary policies; changes in the amount and availability of deposit insurance; cyber-security threats including loss of system functionality or theft
or loss of Company or customer data; political instability; acts of war or terrorism, or natural disasters, such as earthquakes, or the effects of pandemic diseases; the timely development and acceptance of new banking products and services and
perceived overall value of these products and services by users; changes in consumer spending, borrowing and savings habits; technological changes and the expanding use of technology in banking (including the adoption of mobile banking
applications); the ability to retain and increase market share, retain and grow customers and control expenses; changes in the competitive environment among financial and bank holding companies and other financial service providers; continued
volatility in the credit and equity markets and its effect on the general economy or local business conditions; fluctuations in the price of the Company’s stock; the effect of changes in accounting policies and practices, as may be adopted from
time-to-time by the regulatory agencies, as well as by the Public Company Accounting Oversight Board, the Financial Accounting Standards Board and other accounting standard-setters; changes in our organization, management, compensation and benefit
plans, and our ability to retain or expand our management team and/or our board of directors; the costs and effects of legal and regulatory developments, including the resolution of legal proceedings or regulatory or other governmental inquiries or
investigations and the results of regulatory examinations or reviews; our success at managing the risks involved in the foregoing items and all other factors set forth in the Company’s public reports including its Annual Report on Form 10-K for
the year ended December 31, 2013, and particularly the discussion of risk factors within that document. The Company does not undertake, and specifically disclaims any obligation, to update any forward-looking statements to reflect occurrences
or unanticipated events or circumstances after the date of such statements except as required by law.
2Q Results 2014 | cbbank.com 2
CVB Financial Corp. (CVBF)
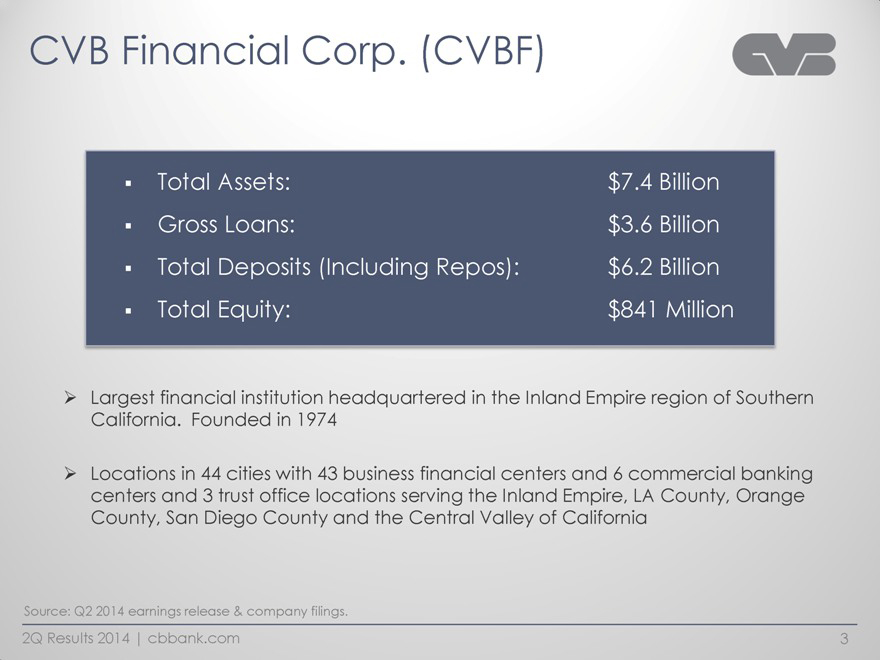
. Total Assets: $7.4 Billion
. Gross Loans: $3.6 Billion
. Total Deposits (Including Repos): $6.2 Billion
. Total Equity: $841 Million
Largest financial institution headquartered in the Inland Empire region of Southern California. Founded in 1974
Locations in 44 cities with 43 business financial centers and 6 commercial banking centers and 3 trust office locations serving the Inland Empire, LA County, Orange County, San
Diego County and the Central Valley of California
Source: Q2 2014 earnings release & company filings.
2Q Results 2014 | cbbank.com 3
Experienced Leadership
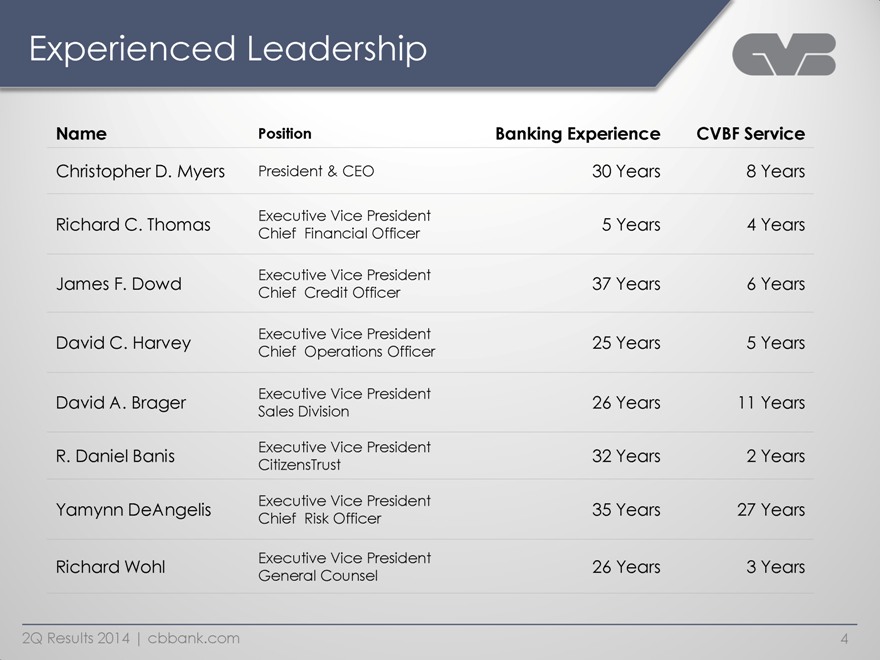
Name Position Banking Experience CVBF Service
Christopher D. Myers President
& CEO 30 Years 8 Years
Richard C. Thomas Executive Vice President Chief Financial Officer 5 Years 4 Years
James F. Dowd Executive Vice President Chief Credit Officer 37 Years 6 Years
David C. Harvey
Executive Vice President Chief Operations Officer 25 Years 5 Years
David A. Brager Executive Vice President Sales Division 26 Years 11 Years
R. Daniel Banis Executive Vice President CitizensTrust 32 Years 2 Years
Yamynn DeAngelis
Executive Vice President Chief Risk Officer 35 Years 27 Years
Richard Wohl Executive Vice President General Counsel 26 Years 3 Years
2Q Results 2014 | cbbank.com 4
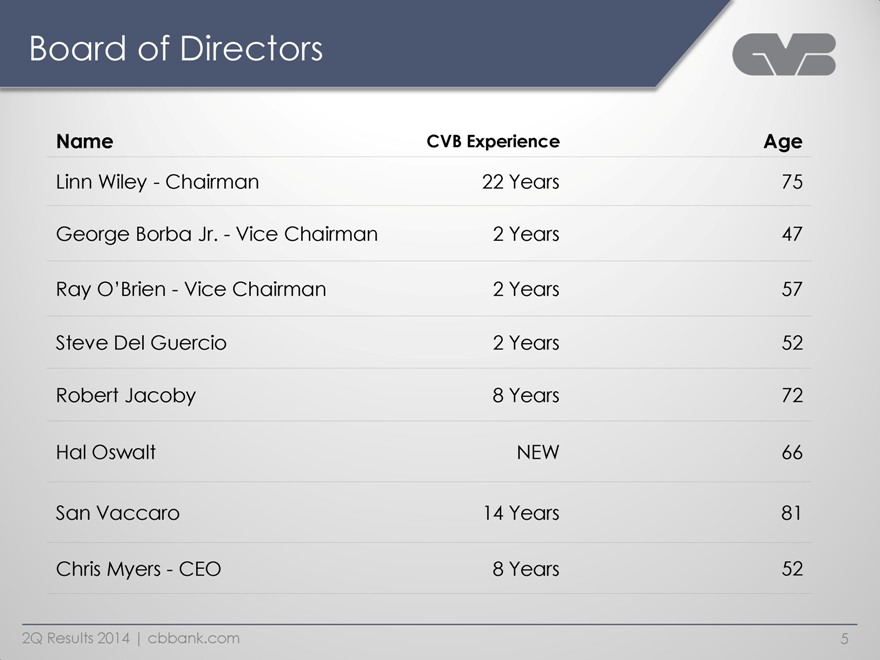
Board of Directors
Name
CVB Experience Age
Linn Wiley - Chairman 22 Years 75
George Borba Jr. - Vice
Chairman 2 Years 47
Ray O’Brien - Vice Chairman 2 Years 57
Steve Del
Guercio 2 Years 52
Robert Jacoby 8 Years 72
Hal Oswalt NEW 66
San Vaccaro 14 Years 81
Chris Myers - CEO 8 Years 52
2Q Results 2014 | cbbank.com 5
CVB Financial Corp.
Who
is CVB Financial Corp.?
2Q Results 2014 | cbbank.com
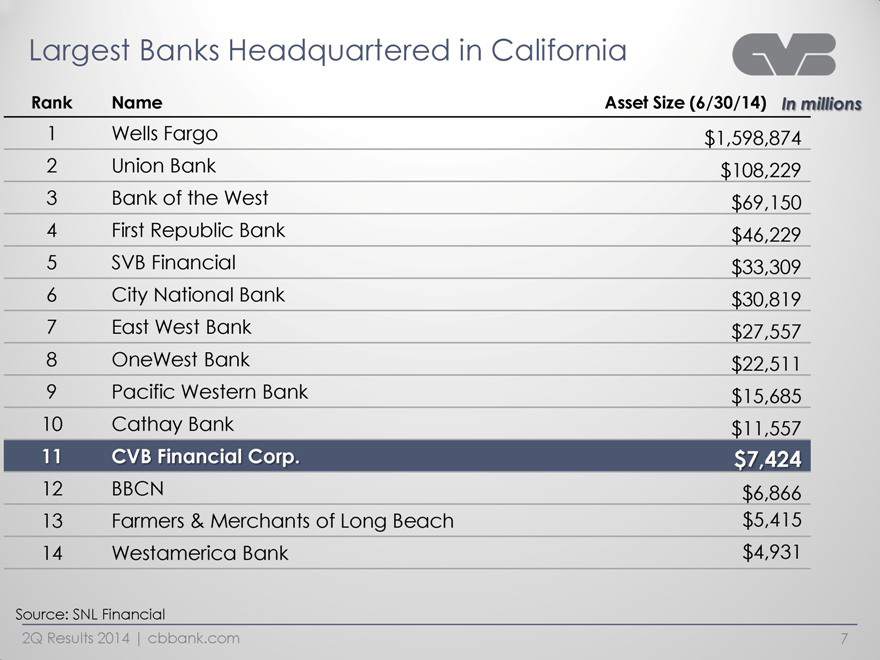
Largest Banks Headquartered in California
Rank Name Asset Size (6/30/14) In millions
1 Wells Fargo $1,598,874
2 Union Bank $108,229
3 Bank of the West $69,150
4 First Republic Bank $46,229
5 SVB Financial $33,309
6 City National Bank $30,819
7 East West Bank $27,557
8 OneWest Bank $22,511
9 Pacific Western Bank $15,685
10 Cathay Bank $11,557
11 CVB Financial Corp. $7,424
12 BBCN $6,866
13 Farmers & Merchants of Long Beach $5,415
14 Westamerica Bank $4,931
Source: SNL Financial
2Q Results 2014 | cbbank.com
7
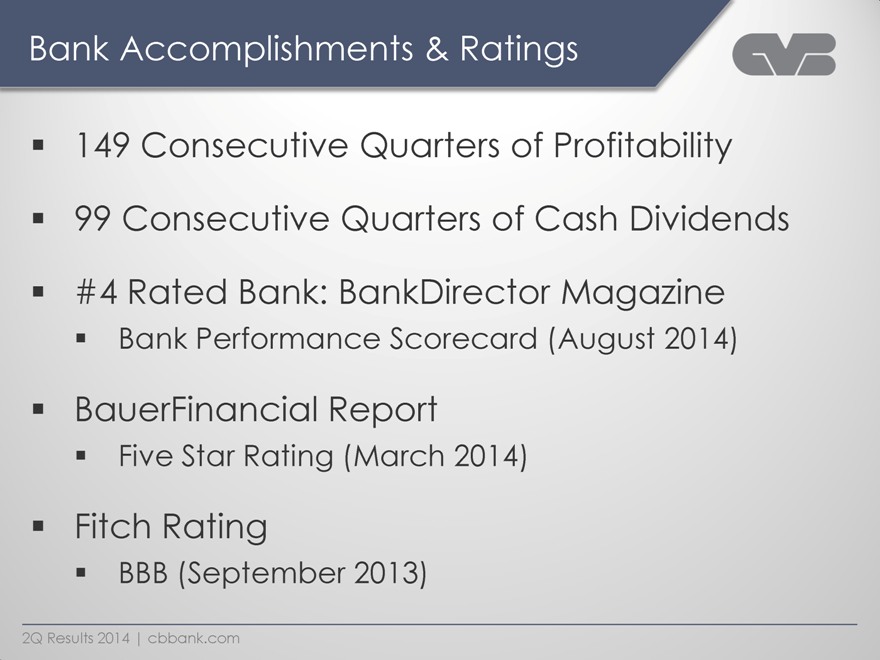
Bank Accomplishments & Ratings
149 Consecutive Quarters of Profitability
99 Consecutive Quarters of Cash Dividends
#4 Rated Bank: BankDirector Magazine
Bank Performance Scorecard (August 2014)
BauerFinancial Report
Five Star Rating (March 2014)
Fitch Rating
BBB (September 2013)
2Q Results 2014 | cbbank.com
CVB Financial Corp.
Our
Markets
2Q Results 2014 | cbbank.com
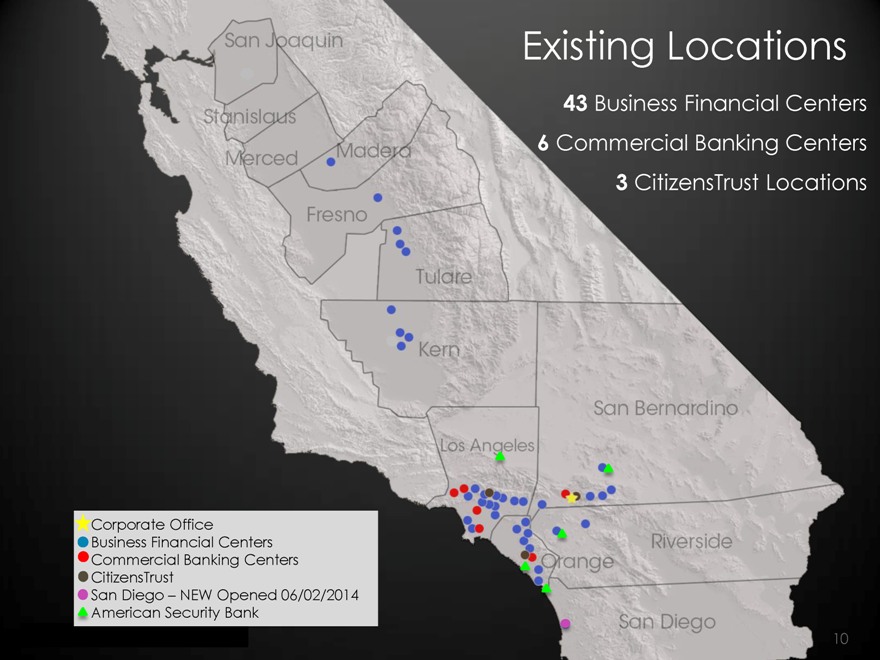
Existing Locations
43
Business Financial Centers
6 Commercial Banking Centers
3 CitizensTrust
Locations
San Joaquin
Stanislaus
Merced
Madera
Fresno
Tulare
Kern
San Bernardino
Los Angeles
Orange
Riverside
San Diego
Corporate Office
Business Financial Centers
Commercial Banking Centers
CitizensTrust
San Diego – NEW Opened 06/02/2014
American Security Bank
10
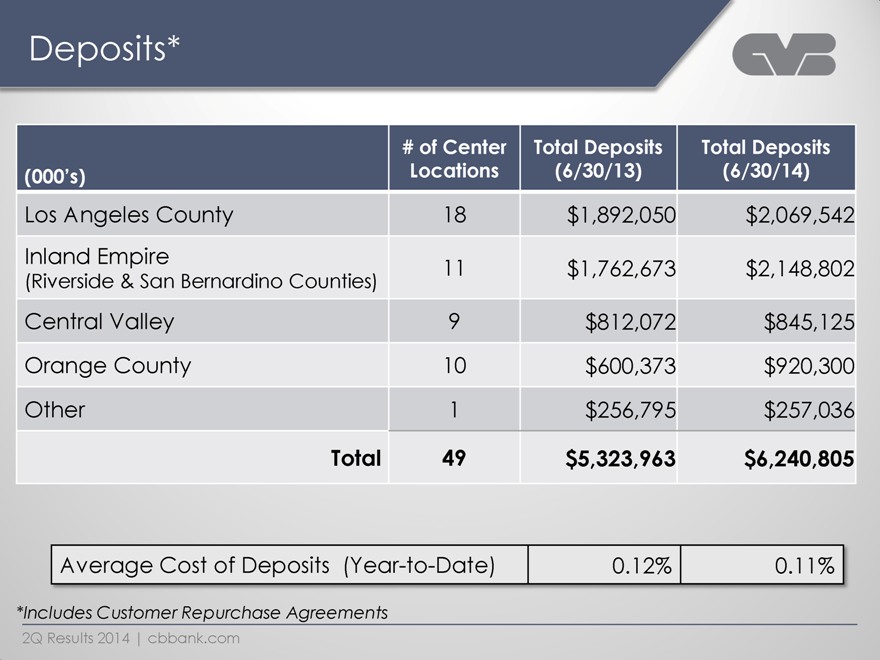
Deposits*
(000’s) #
of Center Locations
Total Deposits (6/30/13)
Total Deposits (6/30/14)
Los Angeles County 18 $1,892,050 $2,069,542
Inland Empire (Riverside &
San Bernardino Counties) 11 $1,762,673 $2,148,802
Central Valley 9 $812,072 $845,125 Orange County 10 $600,373 $920,300
Other 1 $256,795 $257,036
Total 49 $5,323,963 $6,240,805
Average Cost of Deposits (Year-to-Date) 0.12% 0.11%
*Includes Customer Repurchase Agreements
2Q Results 2014 | cbbank.com
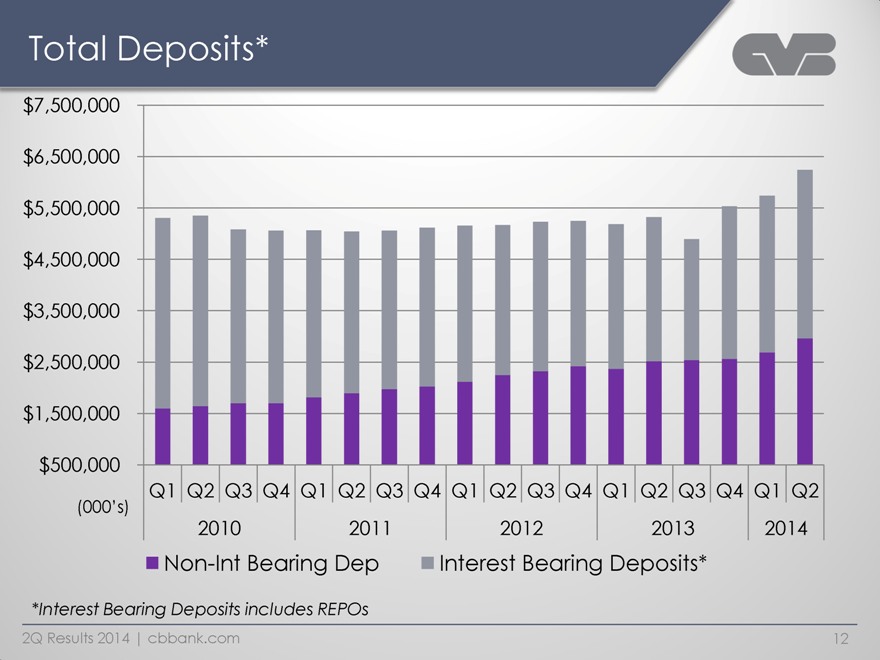
Total Deposits*
$7,500,000
$6,500,000
$5,500,000
$4,500,000
$3,500,000
$2,500,000
$1,500,000
$500,000
(000’s)
Q1 Q2 Q3 Q4 2010
Q1 Q2 Q3 Q4 2011
Q1 Q2 Q3 Q4 2012
Q1 Q2 Q3 Q4 2013
Q1 Q2 2014
Non-Int Bearing Dep Interest Bearing Deposits*
*Interest Bearing Deposits includes REPOs
2Q Results 2014 | cbbank.com
12
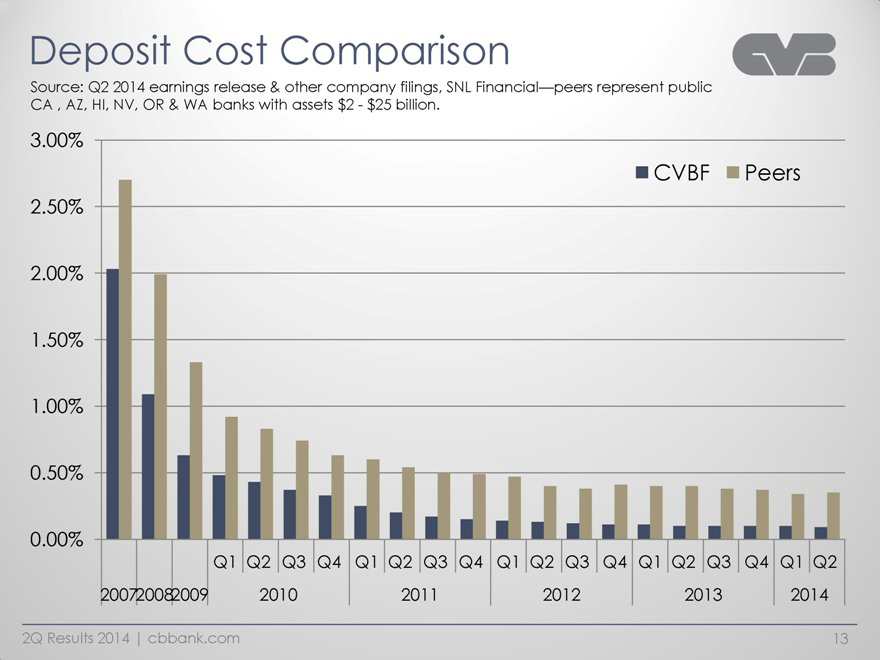
Deposit Cost Comparison
Source: Q2 2014 earnings release & other company filings, SNL Financial—peers represent public CA , AZ, HI, NV, OR & WA banks with assets $2
- $25 billion.
3.00%
2.50%
2.00%
1.50%
1.00%
0.50%
0.00%
CVBF
Peers
Q1 Q2 Q3 Q4
Q1 Q2 Q3 Q4
Q1 Q2 Q3 Q4
Q1 Q2 Q3 Q4
Q1 Q2
2007 2008 2009 2010 2011 2012 2013 2014
2Q Results 2014 | cbbank.com 13
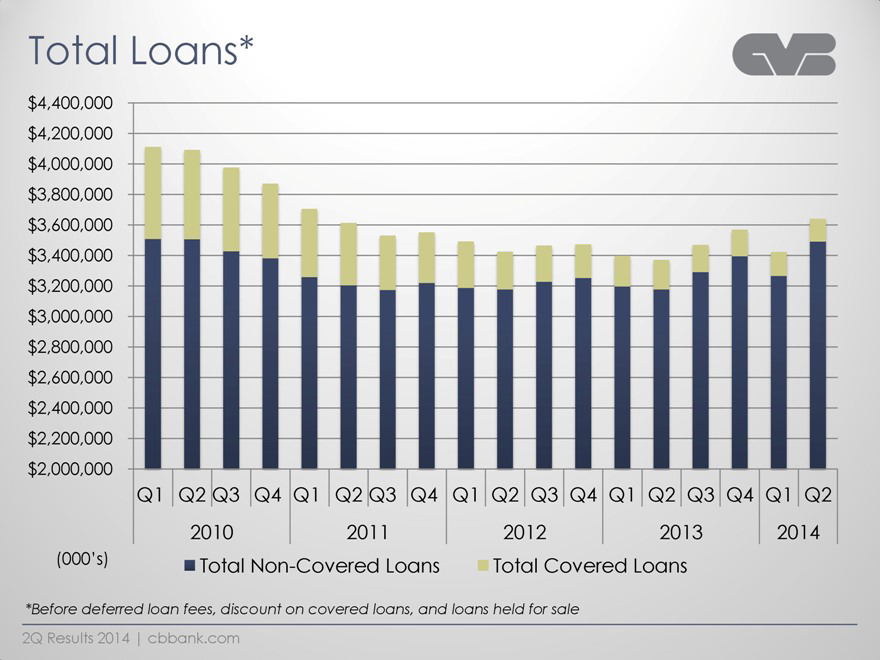
Total Loans*
$4,400,000
$4,200,000
$4,000,000
$3,800,000
$3,600,000
$3,400,000
$3,200,000
$3,000,000
$2,800,000
$2,600,000
$2,400,000
$2,200,000
$2,000,000
Q1 Q2 Q3 Q4
Q1 Q2 Q3 Q4
Q1 Q2 Q3 Q4
Q1 Q2 Q3 Q4
Q1 Q2
2010
2011
2012
2013
2014
(000’s)
Total Non-Covered Loans
Total Covered Loans
*Before deferred loan fees, discount on covered loans, and loans held for
sale
2Q Results 2014 | cbbank.com
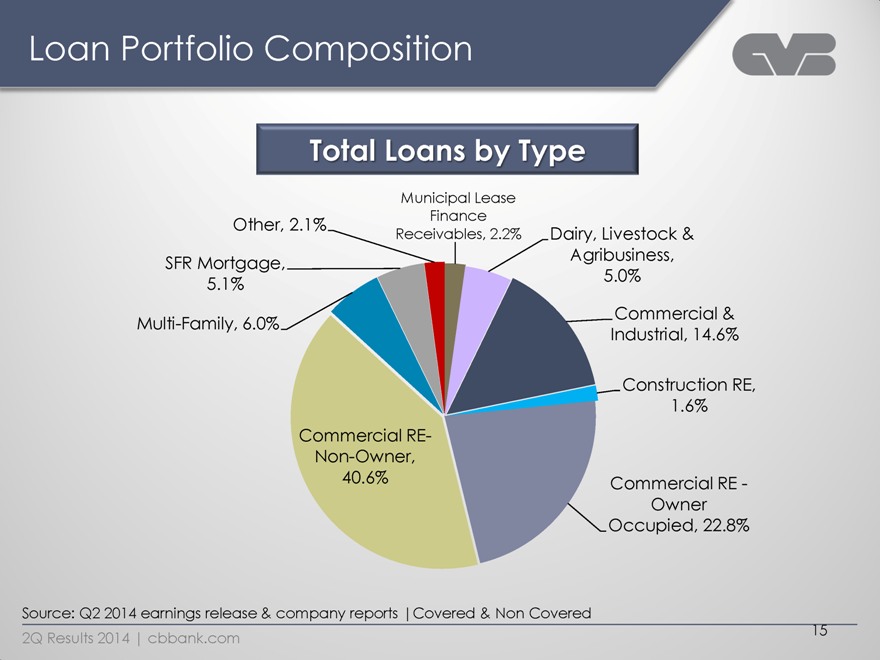
Loan Portfolio Composition
Total Loans by Type
Other, 2.1%
SFR Mortgage,
5.1%
Multi-Family, 6.0%
Commercial RE-
Non-Owner,
40.6%
Municipal Lease
Finance
Receivables, 2.2%
Dairy, Livestock &
Agribusiness,
5.0%
Commercial &
Industrial, 14.6%
Construction RE,
1.6%
Commercial RE -
Owner
Occupied, 22.8%
Source: Q2 2014 earnings release & company reports
| Covered & Non Covered
2Q Results 2014 | cbbank.com 15
New/Enhanced Lending Initiatives
Residential Real Estate
Multi-Family
Asset Based Lending
Residential and Commercial Construction
2Q Results 2014 | cbbank.com 16
CVB Financial Corp.
Credit Quality
2Q Results 2014 | cbbank.com
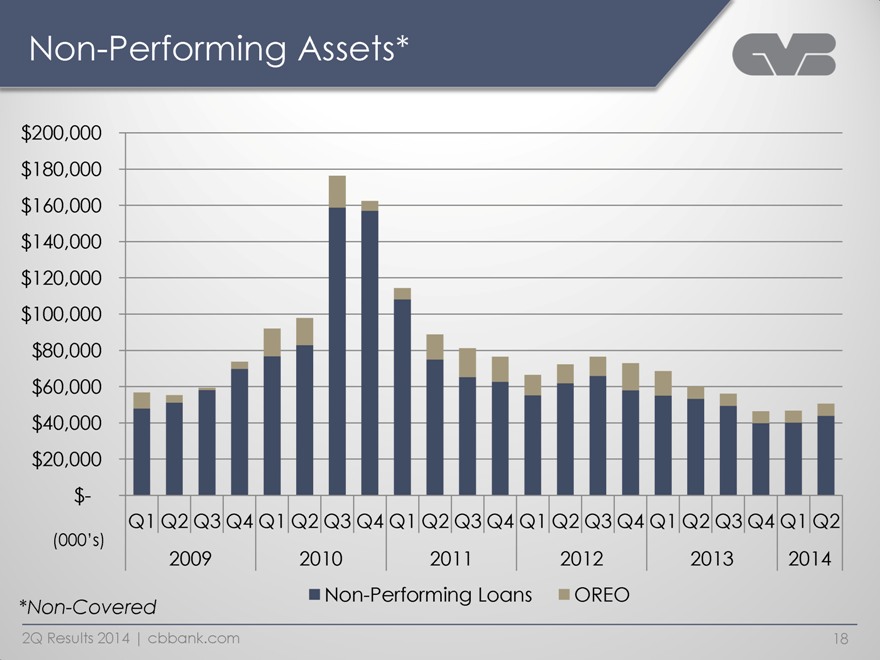
Non-Performing Assets*
$200,000
$180,000
$160,000
$140,000
$120,000
$100,000
$80,000
$60,000
$40,000
$20,000
$-
(000’s)
Q1 Q2 Q3 Q4
Q1 Q2 Q3 Q4
Q1 Q2 Q3 Q4
Q1 Q2 Q3 Q4
Q1 Q2 Q3 Q4
Q1 Q2
2009
2010
2011
2012
2013
2014
*Non-Covered
Non-Performing Loans
OREO
2Q Results 2014 | cbbank.com 18
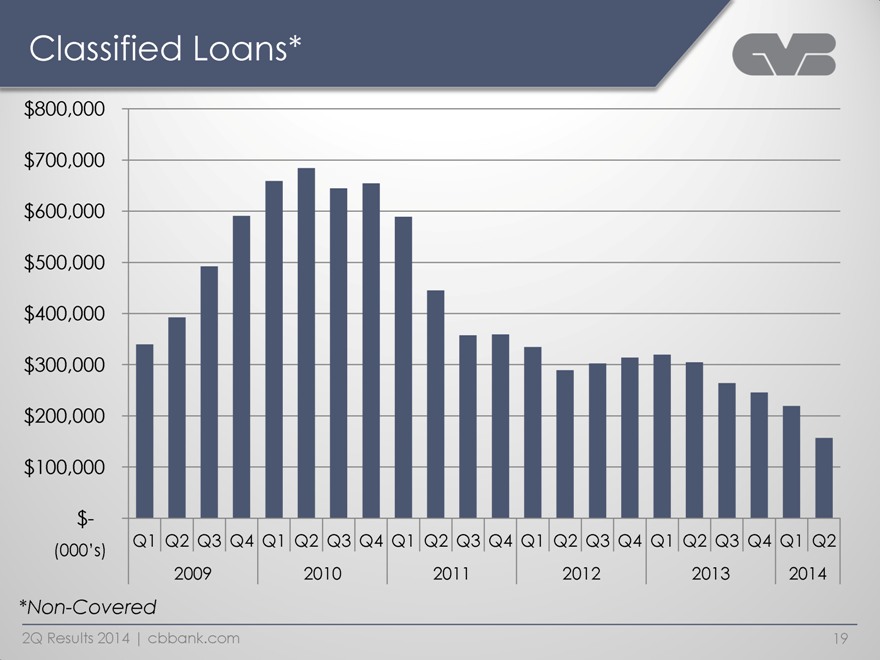
Classified Loans*
$800,000
$700,000
$600,000
$500,000
$400,000
$300,000
$200,000
$100,000
$-
(000’s)
Q1 Q2 Q3 Q4
Q1 Q2 Q3 Q4
Q1 Q2 Q3 Q4
Q1 Q2 Q3 Q4
Q1 Q2 Q3 Q4
Q1 Q2
2009
2010
2011
2012
2013
2014
*Non-Covered
2Q Results 2014 | cbbank.com 19
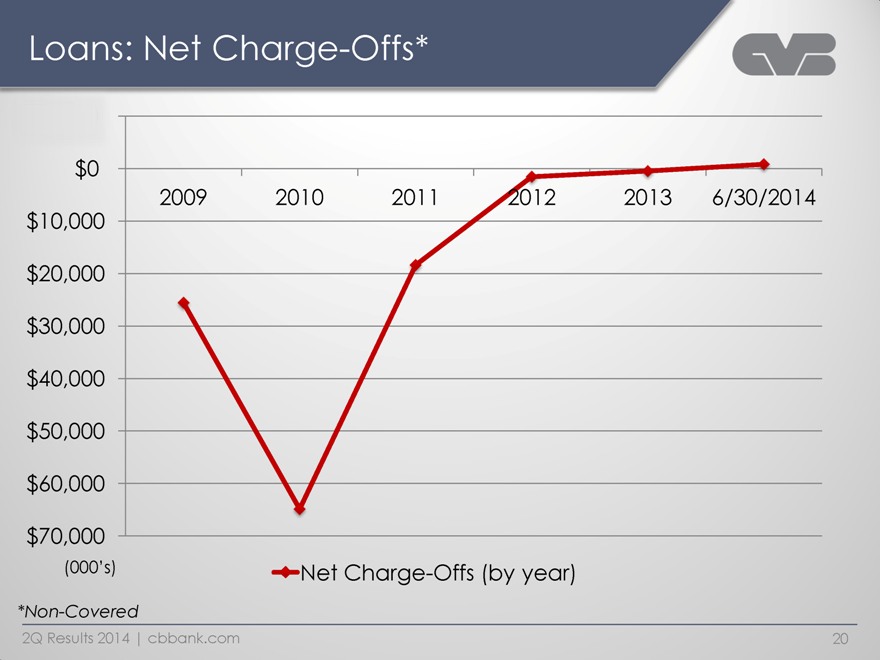
Loans: Net Charge-Offs*
$0
$10,000
$20,000
$30,000
$40,000
$50,000
$60,000
$70,000
(000’s)
2009
2010
2011
2012
2013
6/30/2014
Net Charge-Offs (by year)
*Non-Covered
2Q Results 2014 | cbbank.com 20
CVB Financial Corp.
Profits
2Q Results 2014 | cbbank.com
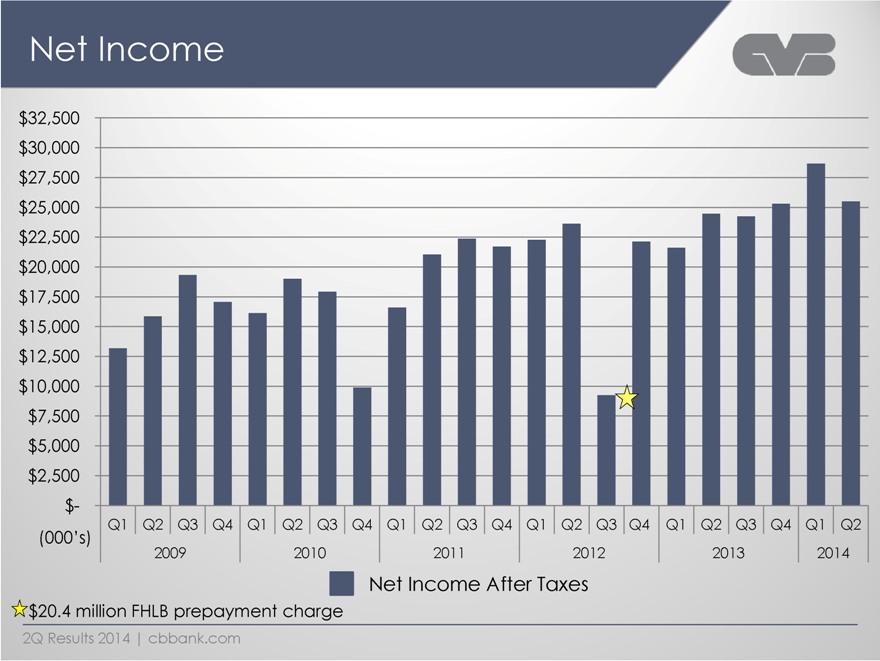
Net Income
$32,500
$30,000
$27,500
$25,000
$22,500
$20,000
$17,500
$15,000
$12,500
$10,000
$7,500
$5,000
$2,500
$-
(000’s)
Q1 Q2 Q3 Q4
Q1 Q2 Q3 Q4
Q1 Q2 Q3 Q4
Q1 Q2 Q3 Q4
Q1 Q2 Q3 Q4
Q1 Q2
2009
2010
2011
2012
2013
2014
Net Income After Taxes
$20.4 million FHLB prepayment charge
2Q Results 2014 | cbbank.com
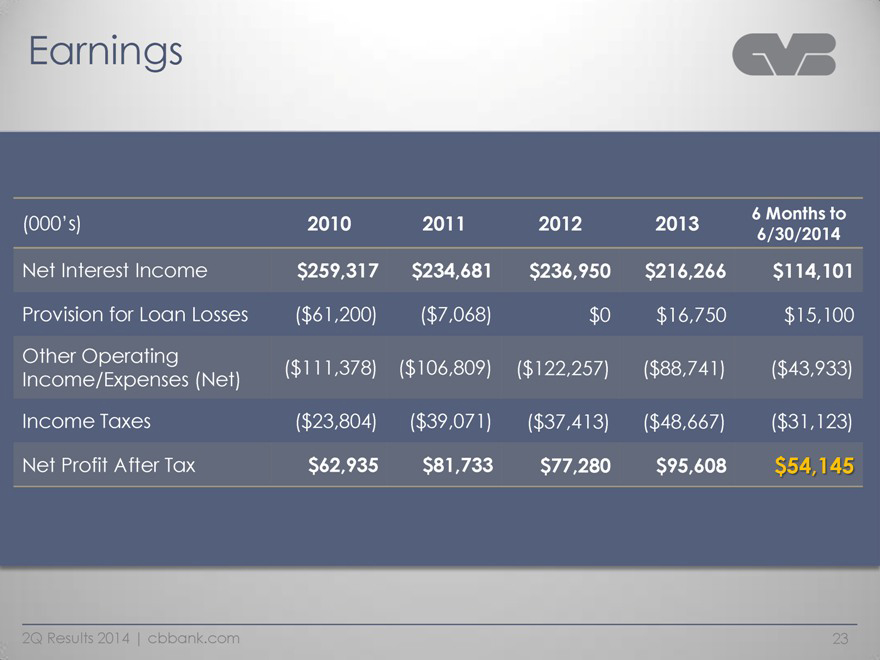
Earnings
(000’s)
Net Interest Income
Provision for Loan Losses
Other Operating
Income/Expenses (Net)
Income Taxes
Net Profit After Tax
2010
2011
2012
2013
6 Months to
6/30/2014
$259,317
$234,681
$236,950
$216,266
$114,101
($61,200)
($7,068)
$0
$16,750
$15,100
($111,378)
($106,809)
($122,257)
($88,741)
($43,933)
($23,804)
($39,071)
($37,413)
($48,667)
($31,123)
$62,935
$81,733
$77,280
$95,608
$54,145
2Q Results 2014 | cbbank.com
23
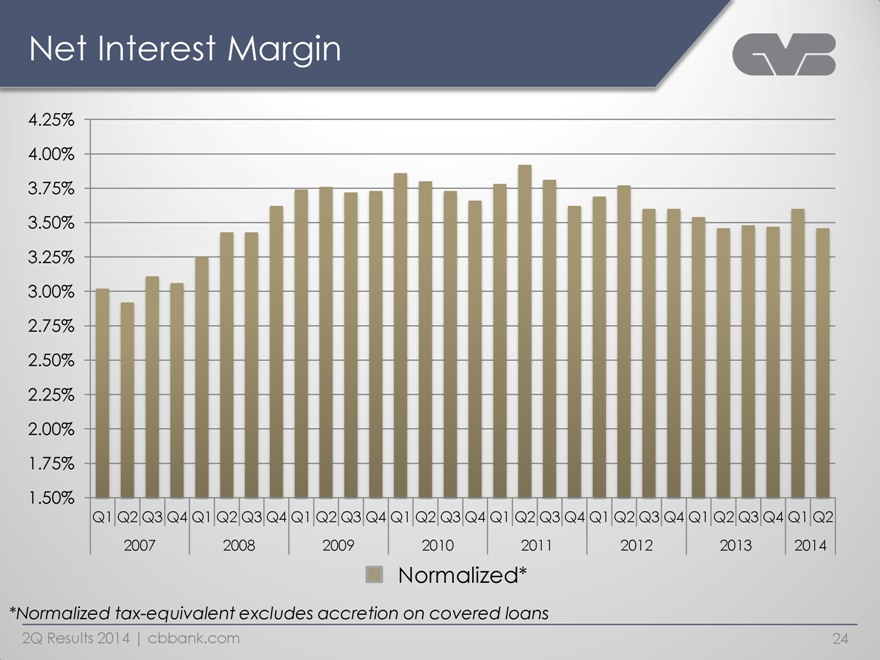
Net Interest Margin
4.25%
4.00%
3.75%
3.50%
3.25%
3.00%
2.75%
2.50%
2.25%
2.00%
1.75%
1.50%
Q1 Q2 Q3 Q4
Q1 Q2 Q3 Q4
Q1 Q2 Q3 Q4
Q1 Q2 Q3 Q4
Q1 Q2 Q3 Q4
Q1 Q2 Q3 Q4
Q1 Q2 Q3 Q4
Q1 Q2
2007
2008
2009
2010
2011
2012
2013
2014
Normalized*
*Normalized tax-equivalent excludes accretion on covered loans
2Q Results 2014 | cbbank.com 24
CVB Financial Corp.
Efficiency & Expenses
2Q Results 2014 | cbbank.com
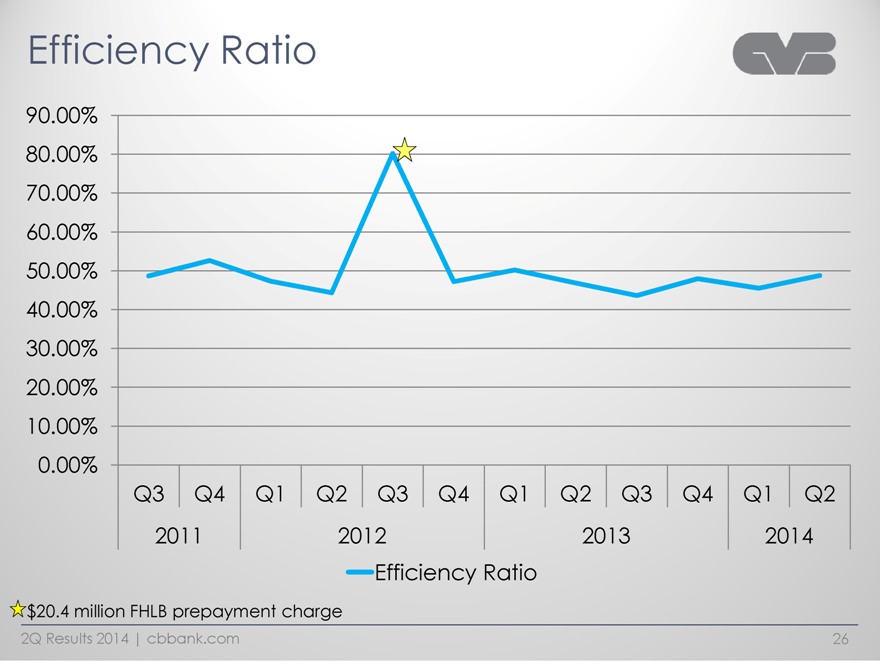
Efficiency Ratio
90.00%
80.00%
70.00%
60.00%
50.00%
40.00%
30.00%
20.00%
10.00%
0.00%
Q3
Q4
Q1
Q2
Q3
Q4
Q1
Q2
Q3
Q4
Q1
Q2
2011
2012
2013
2014
Efficiency Ratio
$20.4 million FHLB prepayment charge
2Q Results 2014 | cbbank.com
26
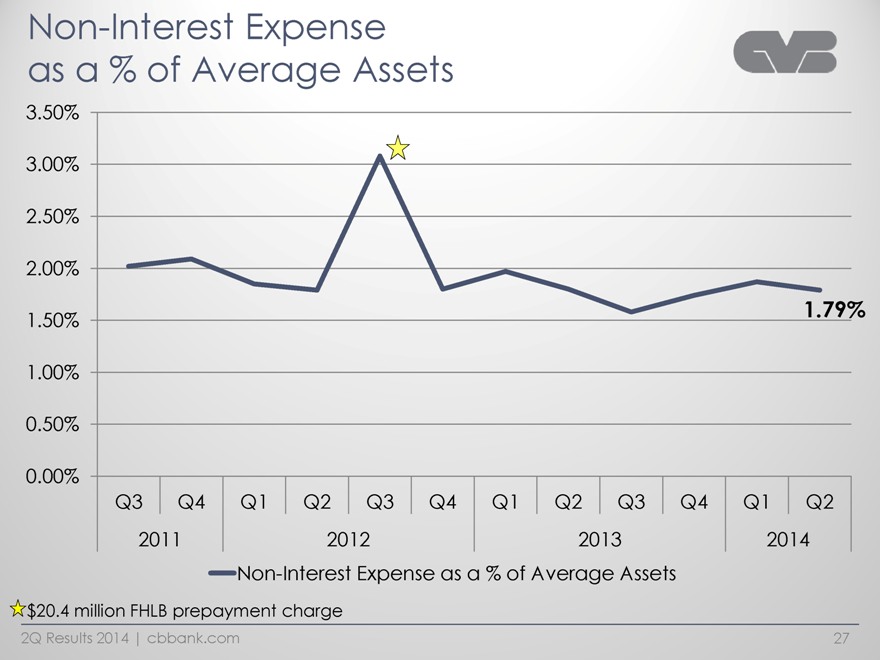
Non-Interest Expense as a % of Average Assets
3.50%
3.00%
2.50%
2.00%
1.50%
1.00%
0.50%
0.00%
1.79%
Q3
Q4
Q1
Q2
Q3
Q4
Q1
Q2
Q3
Q4
Q1
Q2
2011
2012
2013
2014
Non-Interest Expense as a % of Average Assets
$20.4 million FHLB prepayment charge
2Q Results 2014 | cbbank.com
27
CVB Financial Corp.
Capital
2Q Results 2014 | cbbank.com
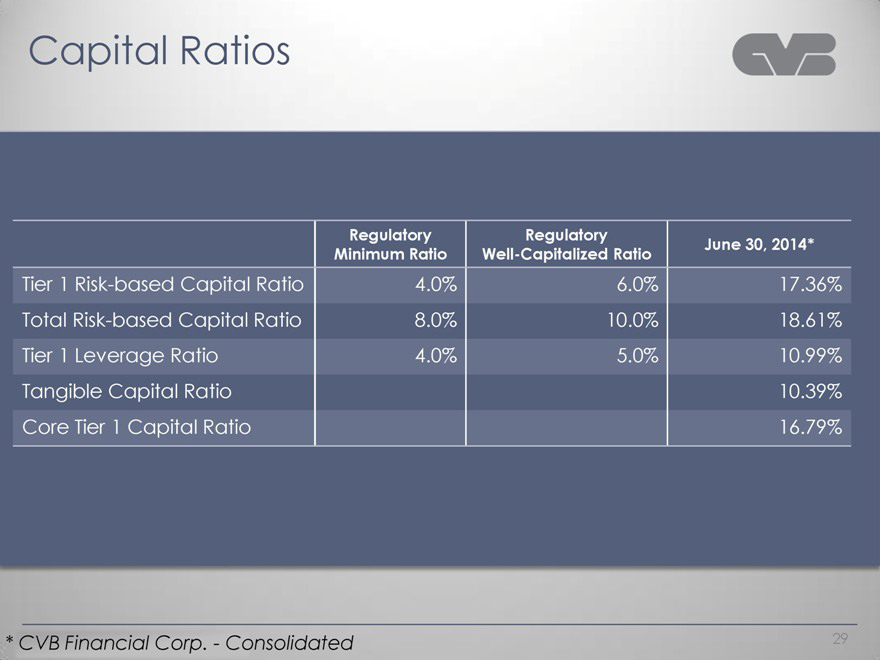
Capital Ratios
Regulatory
Minimum Ratio
Regulatory Well-Capitalized Ratio
June 30, 2014*
Tier 1 Risk-based Capital Ratio
4.0%
6.0%
17.36%
Total Risk-based Capital Ratio
8.0%
10.0%
18.61%
Tier 1 Leverage Ratio
4.0%
5.0%
10.99%
Tangible Capital Ratio
10.39%
Core Tier 1 Capital Ratio
16.79%
* CVB Financial Corp. - Consolidated
29
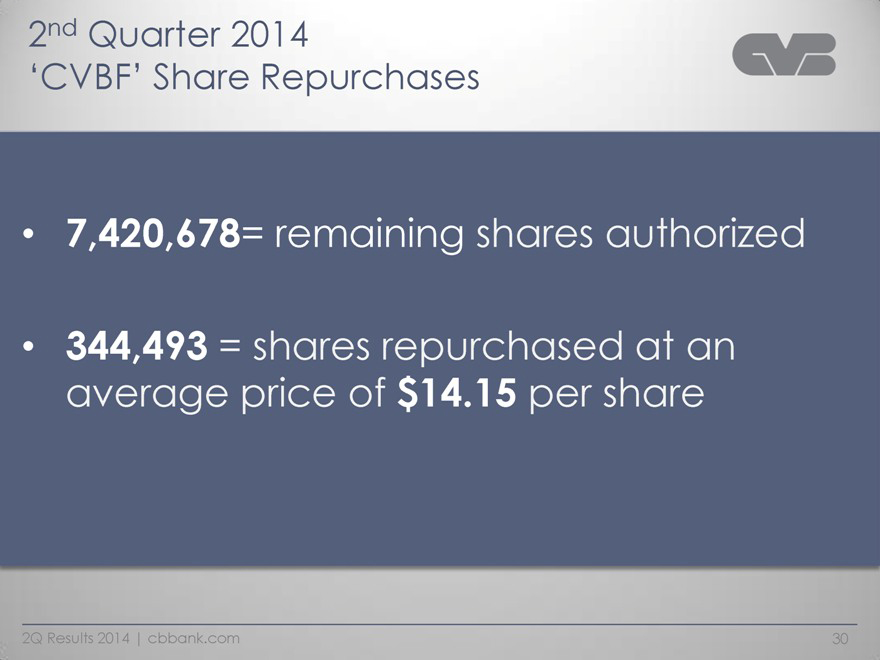
2nd Quarter 2014
‘CVBF’ Share Repurchases
7,420,678= remaining shares authorized
344,493 = shares repurchased at an average price of $14.15 per share
2Q
Results 2014 | cbbank.com
30
CVB Financial Corp.
Securities & Investments
2Q Results 2014 | cbbank.com
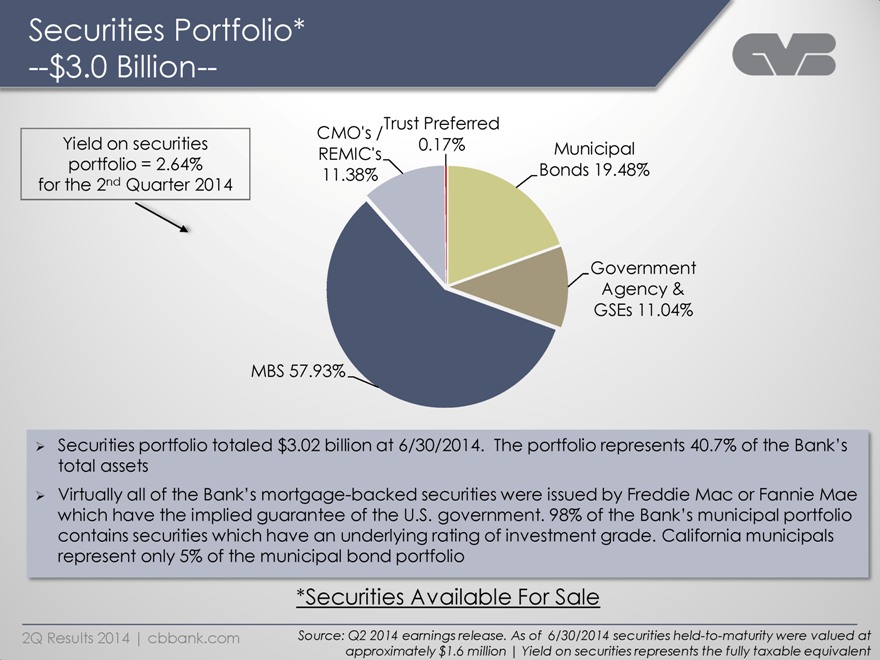
Securities Portfolio*
--$3.0 Billion--
Yield on securities portfolio = 2.64% for the 2nd Quarter
2014
CMO’s / REMIC’s
11.38%
Trust Preferred
0.17%
Municipal Bonds 19.48%
Government Agency & GSEs 11.04%
MBS 57.93%
Securities portfolio totaled $3.02 billion at 6/30/2014. The portfolio represents
40.7% of the Bank’s total assets
Virtually all of the Bank’s mortgage-backed securities were issued by Freddie Mac or Fannie Mae which have the implied
guarantee of the U.S. government. 98% of the Bank’s municipal portfolio contains securities which have an underlying rating of investment grade. California municipals represent only 5% of the municipal bond portfolio
*Securities Available For Sale
2Q Results 2014 | cbbank.com
Source: Q2 2014 earnings release. As of 6/30/2014 securities held-to-maturity were valued at approximately $1.6 million | Yield on securities represents the fully taxable
equivalent
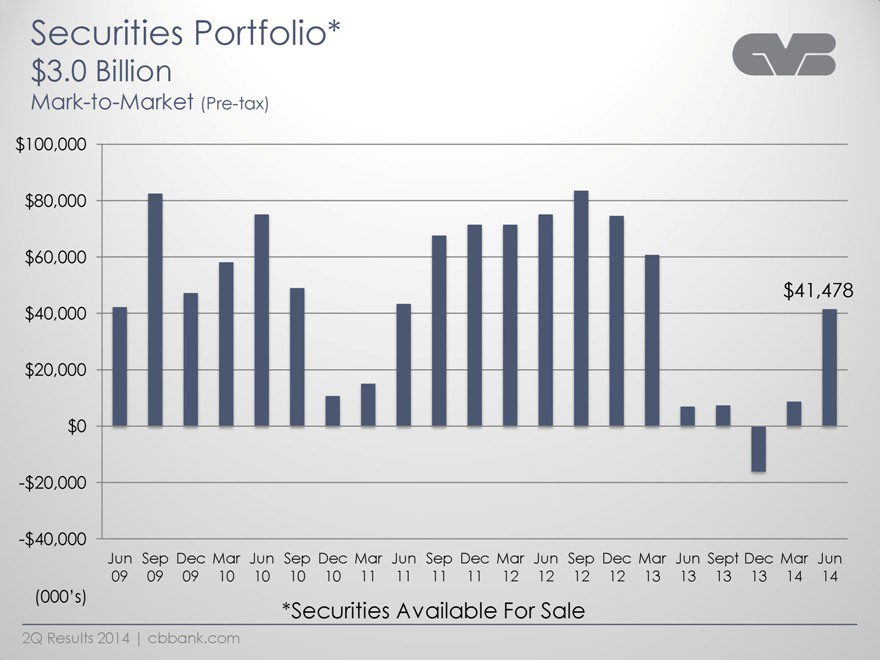
Securities Portfolio*
$3.0 Billion
Mark-to-Market (Pre-tax)
$100,000
$80,000
$60,000
$40,000
$20,000
$0
-$20,000
-$40,000
$41,478
Jun
Sep
Dec
Mar
Jun
Sep
Dec
Mar
Jun
Sep
Dec
Mar
Jun
Sep
Dec
Mar
Jun
Sept
Dec
Mar
Jun
09
09
09
10
10
10
10
11
11
11
11
12
12
12
12
13
13
13
13
14
14
(000’s)
*Securities Available For Sale
2Q Results 2014 | cbbank.com
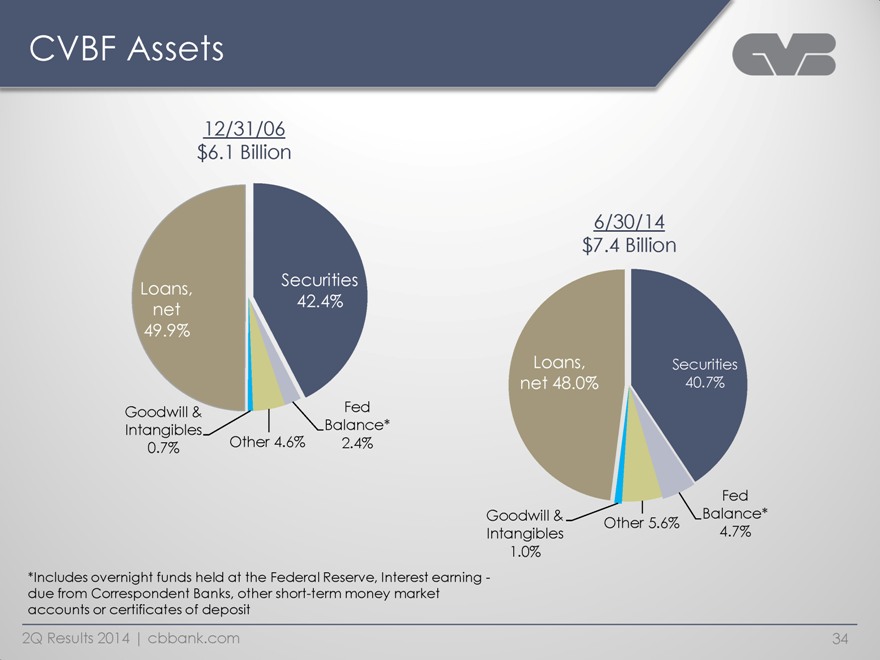
CVBF Assets
12/31/06
$6.1 Billion
Loans, net 49.9%
Securities 42.4%
Goodwill & Intangibles 0.7%
Other 4.6%
Fed Balance* 2.4%
6/30/14
$7.4 Billion
Loans, net 48.0%
Securities 40.7%
Goodwill & Intangibles 1.0%
Other 5.6%
Fed Balance* 4.7%
*Includes overnight funds held at the Federal Reserve, Interest earning -
due from Correspondent Banks, other short-term money market accounts or certificates of deposit
2Q Results 2014 | cbbank.com
34
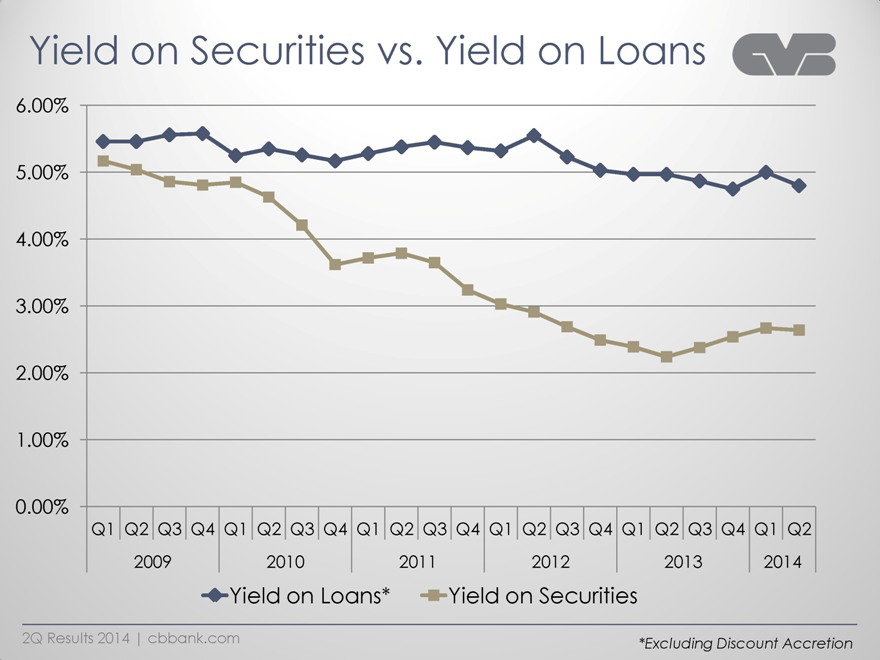
Yield on Securities vs. Yield on Loans
6.00%
5.00%
4.00%
3.00%
2.00%
1.00%
0.00%
Q1 Q2 Q3 Q4 Q1 Q2 Q3 Q4 Q1 Q2 Q3 Q4 Q1 Q2 Q3 Q4 Q1 Q2 Q3 Q4 Q1 Q2
2009
2010
2011
2012
2013
2014
Yield on Loans*
Yield on Securities
2Q Results 2014 | cbbank.com
*Excluding Discount Accretion
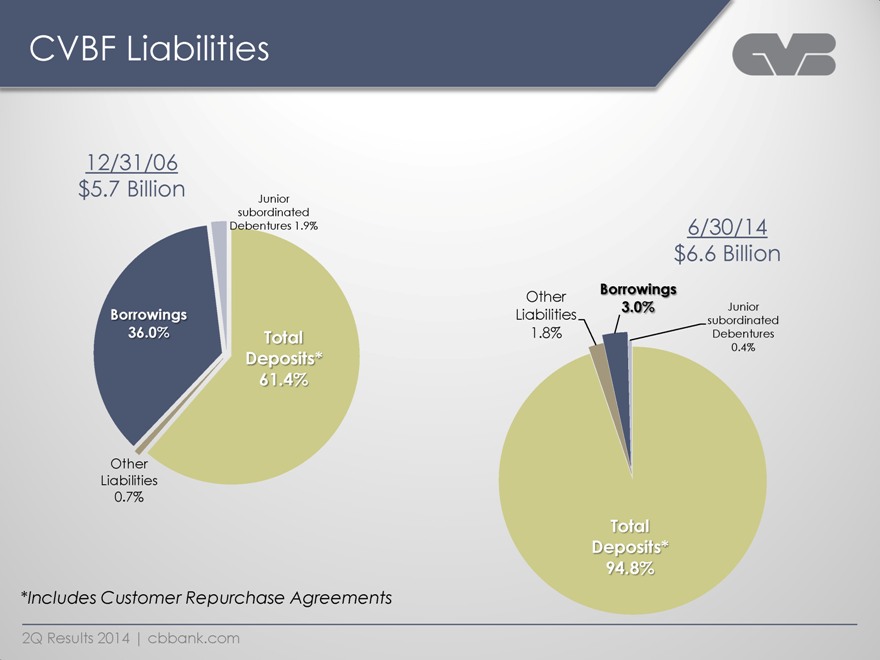
CVBF Liabilities
12/31/06
$5.7 Billion
Junior subordinated Debentures 1.9%
Borrowings 36.0%
Other Liabilities 0.7%
Total Deposits* 61.4%
6/30/14
$6.6 Billion
Other Liabilities 1.8%
Borrowings 3.0%
Junior subordinated Debentures 0.4%
Total Deposits* 94.8%
*Includes Customer Repurchase Agreements
2Q Results 2014 | cbbank.com
CVB Financial Corp.
New
Acquisition
“American Security Bank”
2Q Results 2014 | cbbank.com
37
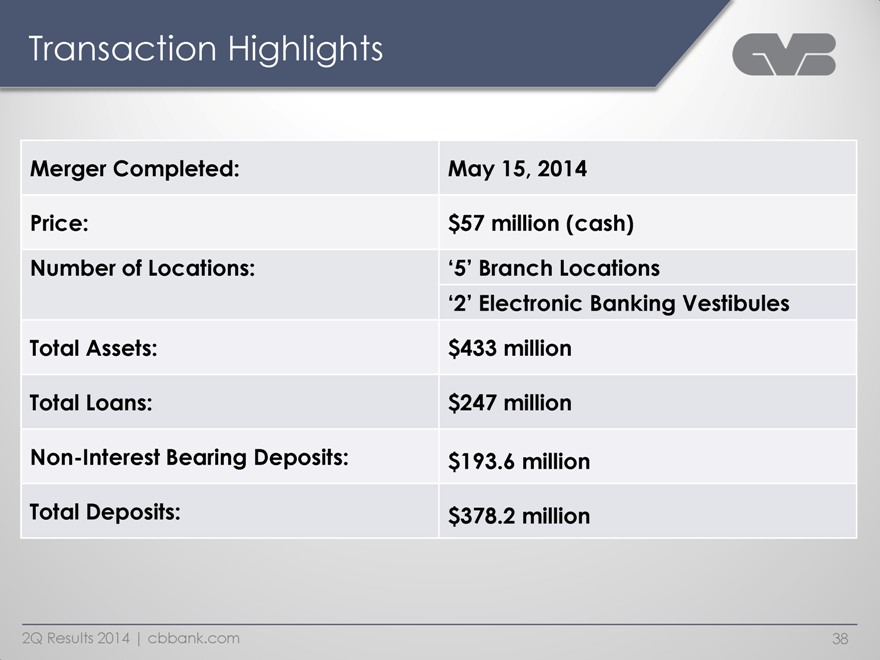
Transaction Highlights
Merger Completed: May 15, 2014
Price: $57 million (cash)
Number of Locations: ‘5’ Branch Locations
‘2’ Electronic Banking
Vestibules
Total Assets: $433 million
Total Loans: $247 million
Non-Interest Bearing Deposits: $193.6 million
Total Deposits: $378.2 million
2Q Results 2014 | cbbank.com
38
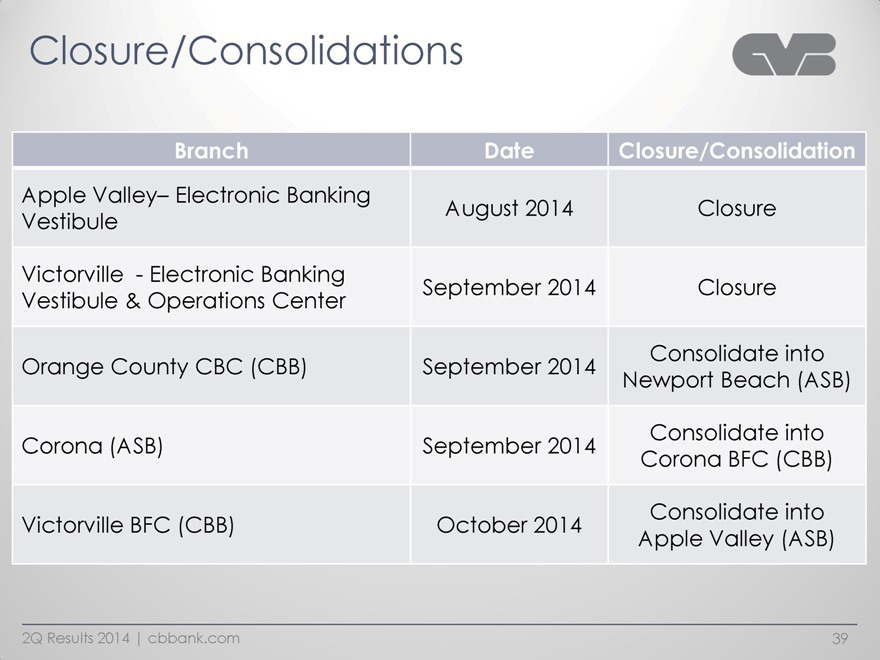
Closure/Consolidations
Branch Date Closure/Consolidation
Apple Valley– Electronic Banking
Vestibule August 2014 Closure
Victorville - Electronic Banking September 2014
Closure
Vestibule & Operations Center
Consolidate into
Orange County CBC (CBB) September 2014 Newport Beach (ASB)
Corona (ASB) September 2014
Consolidate into
Corona BFC (CBB)
Victorville BFC (CBB) October 2014
Consolidate into
Apple Valley (ASB)
2Q Results 2014 | cbbank.com
39
CVB Financial Corp.
Our
Growth Strategy
2Q Results 2014 | cbbank.com
Our Vision
Citizens
Business Bank will strive to become the dominant financial services company operating throughout the state of California, servicing the comprehensive financial needs of successful small to medium sized businesses and their owners.
2Q Results 2014 | cbbank.com
41
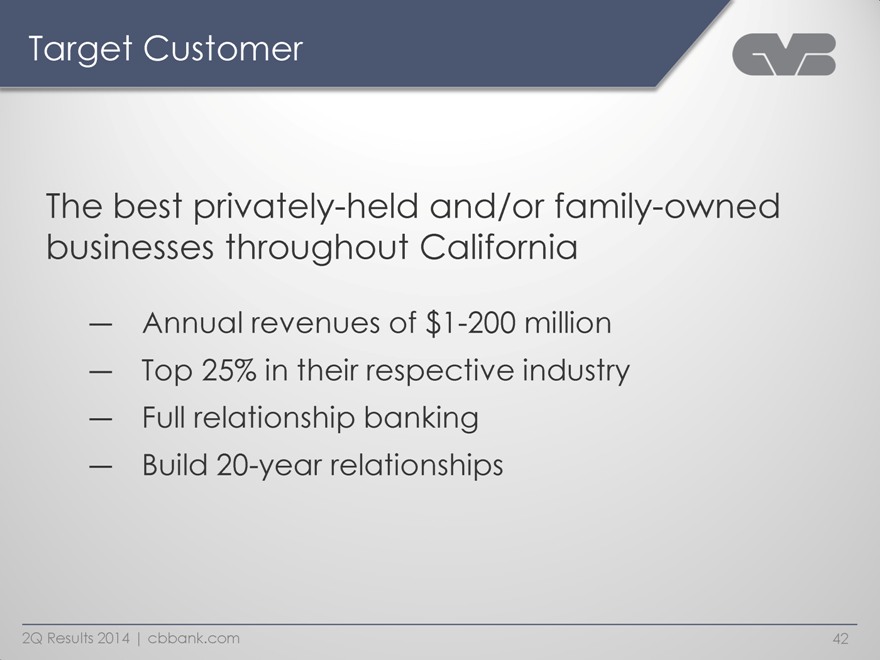
Target Customer
The best
privately-held and/or family-owned businesses throughout California
— Annual revenues of $1-200 million
— Top 25% in their respective industry
— Full relationship banking
— Build 20-year relationships
2Q Results 2014 | cbbank.com
42
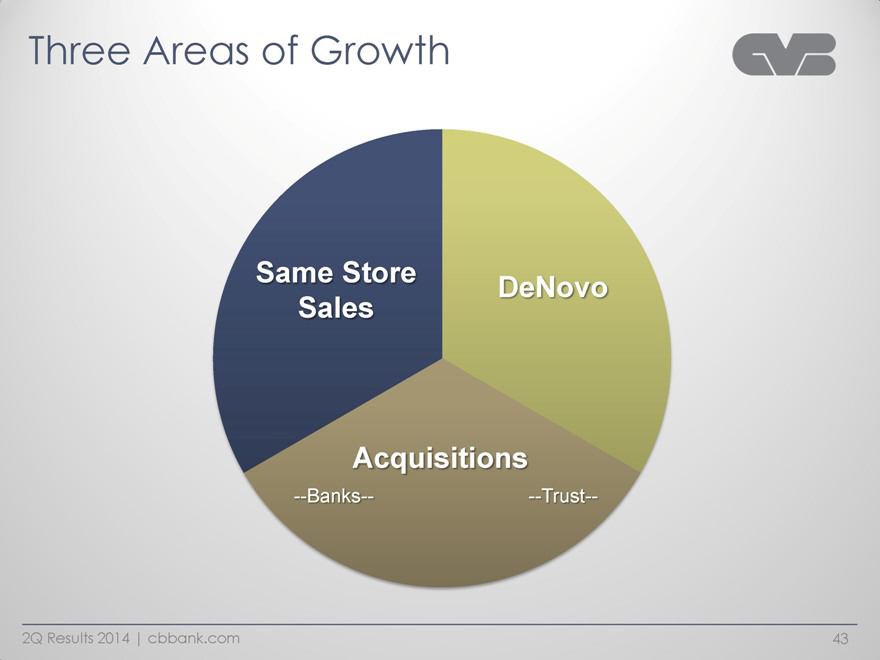
Three Areas of Growth
Same Store DeNovo
Sales
Acquisitions
--Banks-- --Trust--
2Q Results 2014 | cbbank.com
43
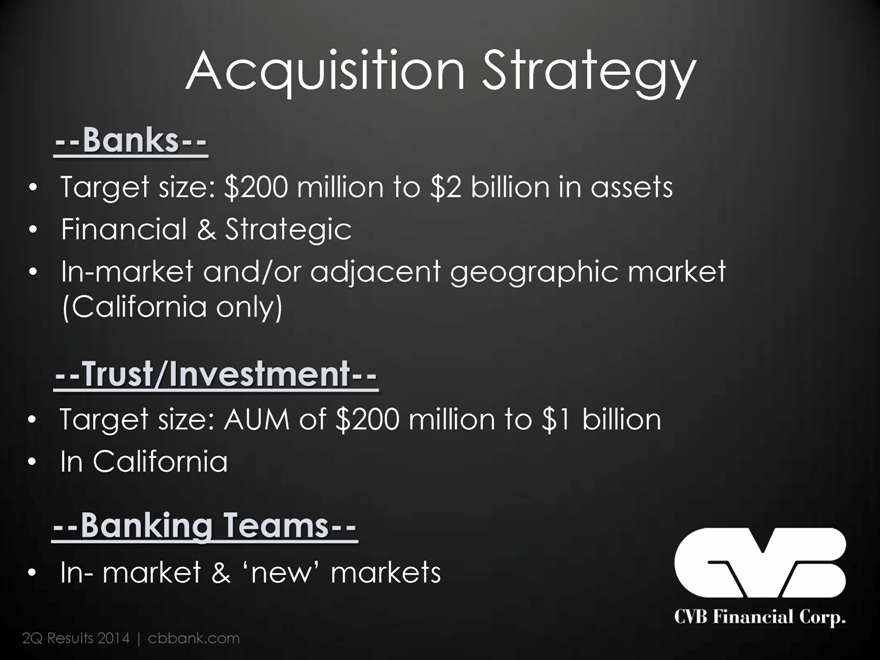
Acquisition Strategy
--Banks--
Target size: $200 million to $2 billion in assets
Financial & Strategic
In-market and/or adjacent geographic market (California only)
--Trust/Investment--
Target size: AUM of $200 million to $1 billion
In California
--Banking Teams--
In- market & ‘new’ markets
2Q Results 2014 | cbbank.com
CVB Financial Corp.
Our ‘Critical Few’
Execute on DeNovo Growth Initiatives
Pursue Strategic Acquisitions
Quality Loan Growth
Provide Customer Solutions Through Technology
Expand Market Share Through Same Store Sales
2Q Results 2014 | cbbank.com
CVB Financial Corp.
Copy
of presentation at www.cbbank.com
2Q Results 2014 | cbbank.com