Attached files
| file | filename |
|---|---|
| 8-K - FORM 8-K - INDEPENDENCE REALTY TRUST, INC. | d786259d8k.htm |
 Independence
Realty Trust, Inc. September 2014
Exhibit 99.1 |
 Forward Looking
Statements, Non-GAAP Financial Measures and Disclaimers 2
This document and the related presentation may contain forward-looking statements within
the meaning of the Private Securities Litigation Reform Act of 1995. These
forward-looking statements include, but are not limited to, statements about
Independence
Realty
Trust,
Inc.’s
(“IRT”)
plans,
objectives,
expectations
and
intentions
with
respect
to
future
operations,
projected acquisitions of properties under contract or in IRT’s pipeline and other
statements that are not historical facts. Forward-looking statements are sometimes
identified by the words “may”, “will”, “should”, “potential”, “predict”, “continue”,
“project”, “guide”, or other similar words or expressions. These
forward-looking statements are based upon the current beliefs and expectations of
IRT's management and are inherently subject to significant business, economic and competitive
uncertainties and contingencies, many of which are difficult to predict and generally not
within IRT’s control. In addition, these forward-looking statements are
subject to assumptions with respect to future business strategies and decisions that are
subject to change. IRT does not guarantee that the assumptions underlying such forward looking
statements are free from errors. Actual results may differ materially from the
anticipated results discussed in these forward-looking statements. The following
factors, among others, could cause actual results to differ materially from the anticipated results or other
expectations expressed in the forward-looking statements: the risk factors and other
disclosure contained in filings by IRT with the Securities and Exchange Commission
(“SEC”), including, without limitation, IRT’s most recent annual and quarterly reports
filed
with
SEC.
IRT’s
SEC
filings
are
available
on
IRT’s
website
at
www.irtreit.com.
You are cautioned not to place undue reliance on these forward-looking statements,
which speak only as of the date of this presentation. All subsequent written and oral
forward-looking statements attributable to IRT or any person acting on its behalf
are expressly qualified in their entirety by the cautionary statements contained or referred
to in this document and the related presentation.
Except
to
the
extent
required
by
applicable
law
or
regulation,
IRT
undertakes
no
obligation
to
update
these
forward-looking statements to reflect events or circumstances after the date of this
presentation or to reflect the occurrence of unanticipated events.
This document and the related presentation may contain non-U.S. generally accepted
accounting principles (“GAAP”) financial measures. A reconciliation of
these non-GAAP financial measures to the most directly comparable GAAP financial measure is
included in this document and/or IRT’s most recent annual and quarterly reports.
This presentation is for informational purposes only and does not constitute an offer
to sell or a solicitation of an offer to buy any securities of IRT.
|
 •
IRT is an apartment REIT focused on building a portfolio of well-located apartment properties
in supply constrained secondary and tertiary markets which generate
attractive current returns with
the potential for rent increases and improved operating efficiency.
–
Listed
on
the
NYSE
MKT
in
August
2013
–
“IRT”
–
Targets markets with strong demographic and employment trends with minimal new supply
–
19 properties in 11 states representing 5,342 units at June 30, 2014
–
Focused on delivering strong risk-adjusted returns
–
Monthly common dividend of $0.06 or $0.72 annually representing a 7.1% yield with a $10.08
stock price at September 4, 2014
–
IRT
is
externally
managed
by
a
subsidiary
of
RAIT
Financial
Trust
(NYSE:
RAS)
–
a
multi-strategy
commercial real estate company with a vertically integrated platform and significant
experience owning and lending against apartment properties
–
Seasoned external manager with significant resources for IRT’s benefit
Who are we?
3 |
 Attractive
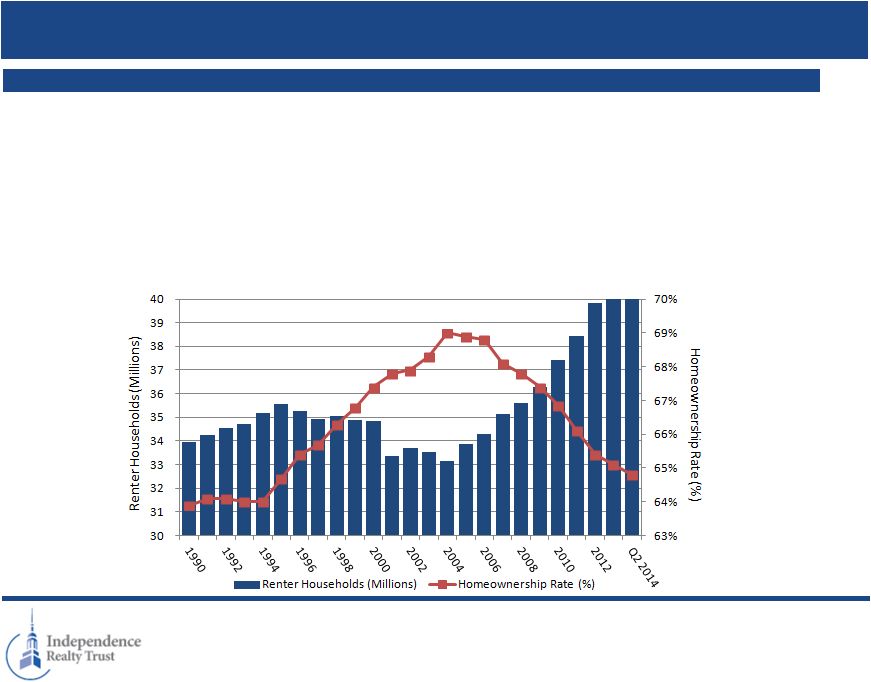
Apartment Industry Dynamics Support Strong Demand 4
IRT expects conditions will remain favorable for apartment fundamentals for the foreseeable
future in secondary markets. •
Positive
Demographic
Factors.
The
Echo
boom
generation
(born
early
80’s
–
’00’s),
which
is
significantly
larger
than
Gen
X
(born
early
60’s –
80’s), is entering the rental market. Harvard research suggests that renters could
make up half of all new households by 2020. This equates to up to 7 million new
renter households this decade. •
Supply Shortage.
Supply has been constrained since the recession; U.S. needs 300,000 new apartments every year
to meet demand. Supply is still playing catch-up from the impacts of the
recession. In 2010, there were only 100,804 new apartments built. In 2013,
134,520 new apartments were built. The majority of new developments since the downturn
have been focused on primary markets. •
Low homeownership.
Changing demographic factors and lifestyles plus stringent mortgage lending standards and
competition from own-to-rent
investors
have
resulted
in
the
homeownership
rate
at
levels
last
seen
in
the
mid-1990s
Positive Trends
Data Source: U.S. Census Bureau, National Multifamily Housing Council (NMHC), Economy.com,
RAIT Financial Trust |
 Key Statistics
- Strong Momentum in the Business
5
•
Since June 30, 2013, IRT has more than doubled its portfolio by number of units and
properties (1) Weighted average monthly effective rent per occupied unit
represents the average monthly rent collected for all occupied units after giving
effect
to
tenant
concessions.
We
do
not
report
average
effective
rent
per
unit
in
the
month
of
acquisition
as
it
is
not
representative
of
a
fullmonth
of operations. Same Store weighted average effective rent per unit was $798, $795, $792,
$784, and $784 for the periods presented above, respectively. Same Store is defined as
properties in the portfolio as of March 31, 2013. As of or For the Three-Month Periods Ended
June 30,
2014 March 31,
2014 December 31,
2013 September 30,
2013 June 30,
2013 Financial Statistics:
Total revenue ....................................
$
11,649
$
8,135
$
5,768
$
4,787
$
4,700
Earnings (loss) per share-diluted ........
$
(0.01)
$
0.19
$
0.03
$
0.03
$
0.01
Funds from Operations (“FFO”) per
share ............................................
$
0.18
$
0.33
$
0.17
$
0.17
$
0.23
Core funds from operations (“CFFO”)
per share ......................................
$
0.19
$
0.17
$
0.20
$
0.17
$
0.23
Dividends declared per common
share ............................................
$
0.18
$
0.18
$
0.16
$
0.16
$
0.16
Total Shares Outstanding ...................
17,751,540
17,742,540
9,652,540
9,643,540
5,643,540
Apartment Property Portfolio:
Reported investments in real estate
at cost ...........................................
$
362,323
$
320,437
$
190,096
$
166,665
$
154,040
Net operating income ........................
$
6,081
$
4,147
$
3,159
$
2,373
$
2,459
Number of properties owned.............
19
17
10
9
8
Multifamily units owned ....................
5,342
4,970
2,790
2,358
2,004
Portfolio weighted average
occupancy .....................................
93.1
93.9
94.6%
94.4%
94.2%
Weighted average monthly effective
rent per unit
...............................
$
764
$
730
$
765
$
784
$
784
(1) |
 •
IRT seeks to acquire well-located, stable apartment properties in secondary and tertiary
markets –
IRT owned 19 apartment properties totaling 5,342 units in 11 states at June 30, 2014
–
IRT
corporate
office
–
Philadelphia,
PA
Where we are?
6
(1)
Figures are as of and for the three months ended June 30, 2014.
Geographic Diversity (by units)
(1)
National Footprint
(1)
Apartment Property |
 IRT
Portfolio 7
Raindance Apts
Oklahoma City,
Oklahoma
Tresa at Arrowhead
Phoenix, Arizona
Augusta Apts
Oklahoma City,
Oklahoma
Belle Creek
Henderson, Colorado
Invitational Apts
Oklahoma City,
Oklahoma
Centrepoint
Tucson, Arizona
Heritage Park Apts
Oklahoma City,
Oklahoma
Cumberland Glen
Smyrna, Georgia
Windrush
Edmund,
Oklahoma
Crestmont
Marietta, Georgia
The Reserve at Eagle Ridge
Waukegan, Illinois
At June 30, 2014
Runaway Bay
Indianapolis, Indiana
Heritage Trace
Newport News, Virginia
Copper Mill
Austin, Texas
The Crossings
Jackson, Mississippi
Berkshire Square
Indianapolis, Indiana
King’s Landing
Creve Coeur, Missouri
Arbors at the
Reservoir
Ridgeland, MS
Carrington Park
Little Rock, AR |
 Stable,
Geographically Diversified Portfolio 8
(1)
All dates are for the year in which a significant renovation program was completed, except for
Runaway Bay, King's Landing, Carrington Park and Arbors at the Reservoir, which is the year construction was completed.
(2)
Units represents the total number of apartment units available for rent at June 30, 2014.
(3)
Physical occupancy for each of our properties is calculated as (i) total units rented as of
June 30, 2014 divided by (ii) total units available as of June 30, 2014, expressed as a percentage.
(4)
Average monthly effective rent per occupied unit represents the average monthly rent for all
occupied units for the three-month period ended June 30, 2014. (5)
Does
not
include
6,256
square
feet
of
retail
space
in
six
units,
of
which
1,010
square
feet
of
space
is
occupied
by
RAIT
Residential
for
use
as
the
leasing
office.
The
remaining
5,246
square
feet
of
space
is
86%
occupied
by
four
tenants with an average monthly base rent of $1,603, or $16 per square foot per year. These
five tenants engaged in the following businesses: grocery, retail and various retail services.
(6)
Acquired
as
part
of
the
Oklahoma
City
Portfolio
for
an
aggregate
purchase
price
of
$65,000.
(7)
Assumed
as
part
of
the
Oklahoma
City
Portfolio
and
currently
has
an
aggregate
outstanding
balance
of
$45,435.
(8)
We
do
not
report
average
effective
rent
per
unit
in
the
month
of
acquisition
as
it
is
not
representative
of
a
full
month
of
operations.
Average
effective
rent
during
the
period
of
acquisition
for
Arbors
at
the
Reservoir
was
$1,064.
Property Name
Location
Acquisition Date
Purchase
Price
Debt
Year Built or
Renovated(1)
Units(2)
Physical
Occupancy(3)
Average Monthly
Effective Rent per
Occupied Unit(4)
Belle Creek
Henderson, Colorado
4/29/2011
14,100
$
10,575
$
2011
162
(5)
97.5%
989
$
Copper Mill
Austin, Texas
4/29/2011
14,715
7,245
2010
320
97.5%
786
Crestmont
Marietta, Georgia
4/29/2011
13,500
6,653
2010
228
99.1%
716
Cumberland
Smyrna, Georgia
4/29/2011
13,800
6,802
2010
222
96.4%
704
Heritage Trace
Newport News, Virginia
4/29/2011
11,000
5,422
2010
200
90.5%
687
Tresa
Phoenix, Arizona
4/29/2011
36,675
27,500
2006
360
95.0%
821
Centrepoint
Tucson, Arizona
12/16/2011
29,500
17,600
2006
320
95.9%
816
Runaway Bay
Indianapolis, Indiana
10/11/2012
15,750
10,128
2002
192
95.3%
909
Berkshire Square
Indianapolis, Indiana
9/19/2013
13,250
8,612
2012
354
92.1%
584
The Crossings
Jackson, Mississippi
11/22/2013
23,000
15,313
2012
432
92.4%
735
Reserve at Eagle Ridge
Waukegan, Illinois
1/31/2014
29,000
18,850
2008
370
94.6%
934
Augusta
Oklahoma City, Oklahoma
2/28/2014
65,000
(6)
45,435
(7)
2011
197
82.2%
724
Heritage Park
Oklahoma City, Oklahoma
2/28/2014
-
(6)
-
(7)
2011
453
90.5%
619
Invitational
Oklahoma City, Oklahoma
2/28/2014
-
(6)
-
(7)
2011
344
93.0%
673
Raindance
Oklahoma City, Oklahoma
2/28/2014
-
(6)
-
(7)
2011
504
90.5%
532
Windrush
Edmond, Oklahoma
2/28/2014
-
(6)
-
(7)
2011
160
85.6%
775
King's Landing
Creve Coeur, Missouri
3/31/2014
32,700
21,200
2005
152
93.5%
1,460
Carrington Park
Little Rock, Arkansas
5/07/2014
21,500
-
1999
202
92.6%
1,066
Arbors at the Reservoir
Ridgeland, Mississippi
6/4/2014
20,250
-
2000
170
93.5%
-
(8)
Total/Weighted Average
353,740
$
201,335
$
5,342
93.1%
764
$
At June 30, 2014
($ in thousands, except per unit data) |
 Disciplined
Approach to Acquisitions 9
•
Focus on acquiring assets in
supply constrained submarkets
–
Secondary and tertiary markets
–
Sub-markets with no substantial
new apartment construction
–
Stable resident bases and
occupancy rates
–
Positive net migration trends
–
Markets with strong employment
drivers
•
Source acquisitions through existing
relationships and established
channels
–
Existing RAIT relationships
–
Existing property manager
relationships
–
Brokerage community
–
Off-market transactions
–
TIC Syndicates
•
Target Profile for Acquisitions
–
Mid-rise/garden style (150-500 units)
with good amenities
–
Acquire at less than replacement cost in
the $10 -
$35M price range; with 5 to 15
year operating track record
–
In-place cash flow with room to grow
rents
–
Operating efficiencies through
professional property management
–
Well-located property with good access
and favorable local work force
conditions
Markets
Sourcing
Assets
1
2
3 |
 Property
Acquisition & Pipeline Update Since 6/30/2014 10
(1)
IRT
cannot
assure
you
that
it
will
acquire
this
property
or
that
any
actual
acquisition
price
will
not
be
significantly
different
from
what
IRT
currently
estimates.
(2)
IRT has determined that no acquisitions in the pipeline are probable as of the date of this
presentation. IRT cannot assure you that it will acquire any of the properties in the
pipeline or that any actual acquisition price will not be significantly different from what IRT currently estimates.
•
Since June 30, 2014, IRT has acquired 2 properties totaling 626 units for purchase prices
aggregating approximately $52.2 million
-
360 units in Memphis, TN for $27.9 million
-
266 units in Raleigh, NC for $24.3 million
•
Property
under
contract
(1)
-
500 unit property in Memphis, TN for $29.8 million (expected mid-September closing)
•
Additionally, IRT currently has an acquisition pipeline of approximately 2,171 units with
an estimated
aggregate
purchase
price
of
$229.5
million
(2) |
 Sponsor: RAIT
Financial Trust (NYSE: RAS) 11
•
RAIT is a multi-strategy commercial real estate company organized as an
internally-managed REIT with $5.3 billion of assets under management as of June 30,
2014 –
RAIT’s IPO –
January 1998
–
Offices in Philadelphia, New York, Chicago, and Charlotte
–
Since its inception, RAIT has originated in excess of $1.8 billion of apartment loans and has
owned more than $1.1 billion of apartment properties
–
Allows RAIT to source attractive, off-market acquisition opportunities
–
Provides significant competitive advantage in targeting geographically diversified
portfolios •
Scalable “in-house”
commercial real estate platform with approximately 700 employees, including
property management personnel
•
Seasoned executive team with extensive real estate equity and debt experience
•
Substantial expertise lending to, owning and managing apartment properties
•
Extensive networks of contacts in the apartment industry
•
RAIT Residential, an apartment property management company that is majority-owned by RAIT,
manages over 12,500 apartments in 17 states |
 •
RAIT is the largest stockholder in IRT with 7.3 million shares or 28.2% of IRT’s
outstanding common stock at August 20, 2014
•
RAIT provides management and public company services to IRT
•
RAIT controls entities that advise and manage IRT and its properties
–
Externally managed by Independence Realty Advisors, a wholly-owned subsidiary of
RAIT –
Properties managed by RAIT Residential, a full-service apartment property manager that is
majority-owned by RAIT with approximately 300 employees
•
Management agreement structured to incentivize performance
–
No
acquisition,
disposition,
or
financing
fees
and
no
management
fees
on
shareholder
equity
–
No
management
fee
on
8
properties
acquired
prior
to
August
2013;
approximately
$154
million
of
real
estate
–
Low management fee (75 bps of gross real estate assets) on properties acquired after August
2013 –
Incentive fee (20% over a Core FFO yield of 7% (annualized))
Strong Alignment of Interests Between Sponsor and Stockholders
12 |
 Scott F.
Schaeffer Management Team
13
Chairman
and
CEO
–
Independence
Realty
Trust,
Inc.
and
Chairman
and
CEO
–
RAIT
Financial
Trust
CEO and Manager –
Independent Realty Advisors, LLC
Over 28 year career in real estate
James J. Sebra
CFO
and
Treasurer
–
Independence
Realty
Trust,
Inc.
and
CFO
and
Treasurer
–
RAIT
Financial
Trust
Treasurer –
Independent Realty Advisors, LLC
17 years of real estate experience
Farrell M. Ender
President
–
Independence
Realty
Trust,
Inc.
and
Senior
Vice
President
–
RAIT
Financial
Trust
President –
Independent Realty Advisors, LLC
Over 10 years experience in the acquisition/disposition, property management, construction
management of apartment properties
Raphael Licht
Manager
–
Independent
Realty
Advisors,
LLC
and
General
Counsel–
RAIT
Financial
Trust
17 years of real estate experience |
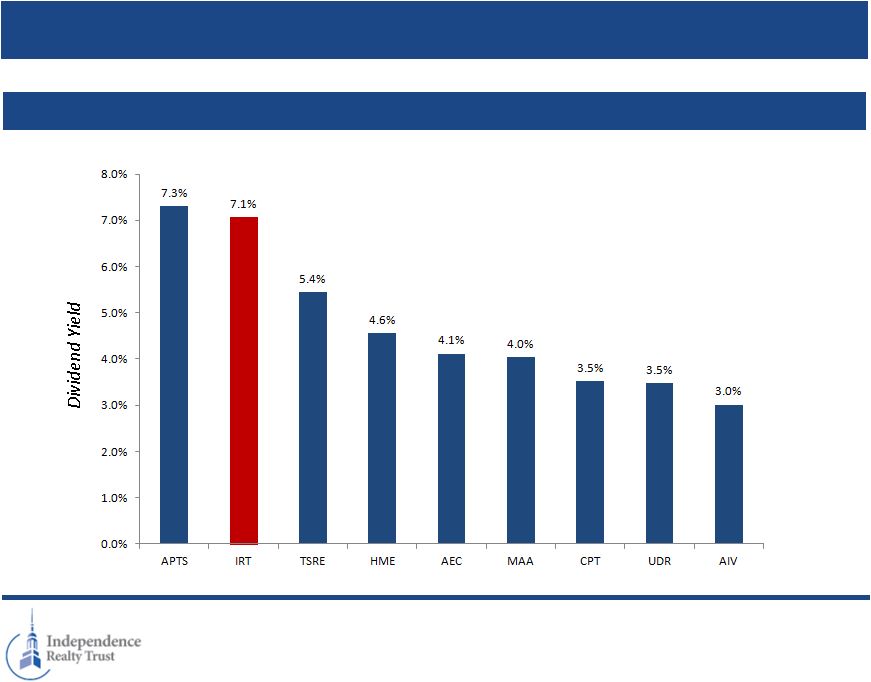 Attractive
Dividend 14
(1)
Dividend yields based on share price as of 9/2/2014 and most recently declared quarterly
dividend annualized, except for IRT, which is based on most recently declared monthly
dividend annualized.
Dividend Yield
(1)
(%) |
 Core FFO per
Share IRT Financial Highlights
15
Revenue
NOI
Dividends per Share
($ in millions, except per share data)
Note: Refer to slide 18 for reconciliation of Core FFO to GAAP net income (loss).
(1)
Represents a monthly dividend of $0.06 or $0.18 per quarter for Q1, Q2 & Q3.
|
 Highlights
16
Strong Momentum in the Business
1
Disciplined Acquisition Strategy with Robust Pipeline
2
Strong Sponsorship and Alignment of Interest with IRT Stockholders
3
Attractive Dividend
4
5
Stable Portfolio in Supply-Constrained Markets |
 Appendix
XXX
X |
 Income
Statement 18
At June 30, 2014 ($ in millions, except per unit data)
For the Three-Month
Periods Ended June 30
For the Six-Month
Periods Ended June 30
2014 2013 2014 2013 REVENUE:
Rental income
.............................................................................. $
10,613
$
4,218
$
17,966
$
8,396
Tenant reimbursement income.....................................................
436
220
802
443
Other income
............................................................................... 600
262
1,016
549
EXPENSES:
Property operating expenses ........................................................
5,585
2,241
9,573
4,406
General and administrative expenses ...........................................
378
94
546
271
Asset Management Fees
...............................................................
501
79
647
161
Acquisition expenses
.................................................................... 152
—
514
—
Depreciation and amortization .....................................................
3,232
1,063
5,355
2,099
Total expenses ....................................................................
9,848
3,477
16,635
6,937
Operating income
........................................................................
1,801
1,223
3,149
2,451
Interest expense
...........................................................................
(1,930)
(899
(3,229)
(1,787)
Interest income
............................................................................ 1
0
5
0
Gain (loss) on assets
..................................................................... —
—
2,882
—
Net income (loss):
........................................................................
(128)
324
2,807
664
Income allocated to preferred shares ...........................................
0
(4
0
(8)
Income (loss) allocated to noncontrolling interest
.........................
0
(272
0
(604)
Net income (loss) allocable to common shares ............................
$
(128)
$
48
$
2,807
$
52
Earnings (loss) per share:
Basic
................................................................................... $
(0.01)
$
0.01
$
0.17
$
0.03
Diluted
................................................................................ $
(0.01)
$
0.01
$
0.17
$
0.03
Weighted-average shares:
Basic
................................................................................... 17,707,287
3,556,349
16,459,623
1,959,998
Diluted
................................................................................ 17,707,287
3,556,349
16,484,357
1,959,998
|
 Balance
Sheet 19
At June 30, 2014 ($ in millions, except per unit data)
As of
June 30,
2014 As of
December 31,
2013
ASSETS:
Investments in real estate:
Investments in real estate at cost
................................................................................................
$
362,323
$
190,096
Accumulated depreciation
...........................................................................................................
(18,804)
(15,775)
Investments in real estate, net
.....................................................................................................
343,519
174,321
Cash and cash equivalents
....................................................................................................................
8,054
3,334
Restricted cash
.....................................................................................................................................
2,698
1,122
Accounts receivable and other
assets....................................................................................................
2,682
1,731
Intangible assets, net of accumulated amortization of $2,513 and $569, respectively
............................
1,126
517
Deferred costs, net of accumulated amortization of $293 and $151, respectively
.................................. 1,568
846
Total Assets
..........................................................................................................................................
$
359,647
$
181,871
LIABILITIES AND EQUITY:
Indebtedness
........................................................................................................................................
$
215,628
$
103,303
Accounts payable and accrued expenses
...............................................................................................
5,725
2,374
Accrued interest payable
......................................................................................................................
30
63
Dividends payable
................................................................................................................................
1,076
515
Other liabilities
.....................................................................................................................................
946
708
Total
Liabilities......................................................................................................................................
223,405
106,963
Equity:
Stockholders’ equity:
...................................................................................................................
Preferred stock, $0.01 par value; 50,000,000 shares authorized, 0 and 0 shares issued and
outstanding, respectively
...............................................................................................
—
—
Common stock, $0.01 par value; 300,000,000 shares authorized, 17,751,540 and
9,652,540 shares issued and outstanding, including 40,000 unvested restricted
common share awards, as of June 30, 2014
.................................................................... 177
96
Additional paid-in capital
....................................................................................................
140,973
78,112
Retained earnings (accumulated deficit)
............................................................................. (6,867)
(3,300)
Total shareholders’ equity
..................................................................................................
134,283
74,908
Noncontrolling interests
..............................................................................................................
1,959
—
Total Equity
..........................................................................................................................................
136,242
74,908
Total Liabilities and Equity
....................................................................................................................
$
359,647
$
181,871
|
 Mortgage
Indebtedness 20
At June 30, 2014 ($ in millions, except per unit data)
Outstanding Principal
Carrying Amount
Effective Interest Rate
Maturity Date
Belle Creek Apartments……..
$
10,575
$
10,575
2.4%(1)
April 28, 2021
Berkshire Square Apartments ..
8,612
8,612
4.4%(2)
January 1, 2021
Centrepoint Apartments ..........
17,600
17,600
3.7%(3)
January 1, 2019
Copper Mill Apartments ...........
7,245
7,245
5.7%
May 1, 2021
Crestmont Apartments .............
6,653
6,653
5.7%
May 1, 2021
Cumberland Glen Apartments
..
6,802
6,802
5.7%
May 1, 2021
Heritage Trace Apartments ......
5,422
5,422
5.7%
May 1, 2021
Runaway Bay Apartments ........
10,128
10,128
3.6%
November 1, 2022
Tresa at Arrowhead ..................
27,500
27,500
2.4%(1)
April 28, 2021
Reserve at Eagle Ridge .............
18,850
18,850
4.7%
March 1, 2024
OKC Portfolio ............................
45,435
47,578
2.8%(4)
April 1, 2016
Kings’ Landing
...........................
21,200
21,200
4.0%(5)
June 1, 2021
Crossings
...................................
15,313
15,313
3.9%(5)
June 1, 2024
Total mortgage debt/
Weighted-Average...............
$
201,335
$
203,478
3.7%
Secured Credit Facility ..............
12,150
12,150
2.9%(6)
October 25, 2016
Total indebtedness /Weighted-
Average ...............................
$
213,485
$
215,628
3.6%
|
 Non-GAAP
Financial Measures: FFO and CFFO (1)
21 |