Attached files
| file | filename |
|---|---|
| 8-K - 8-K - AAR CORP | a14-19136_18k.htm |
Exhibit 99.1
|
|
AAR CORP. Investor Presentation Jefferies 2014 Global Industrials Conference August 11-14, 2014 |
|
|
Forward-Looking Statements 2 This presentation includes certain statements relating to future results, which are forward-looking statements as that term is defined in the Private Securities Litigation Reform Act of 1995. These forward-looking statements are based on beliefs of Company management, as well as assumptions and estimates based on information currently available to the Company, and are subject to certain risks and uncertainties that could cause actual results to differ materially from historical results or those anticipated, including those factors discussed under Item 1A, entitled “Risk Factors,” included in the Company’s Form 10-K for the fiscal year ended May 31, 2014. Should one or more of these risks or uncertainties materialize adversely, or should underlying assumptions or estimates prove incorrect, actual results may vary materially from those described. These events and uncertainties are difficult or impossible to predict accurately and many are beyond the Company’s control. The Company assumes no obligation to update any forward-looking statements to reflect events or circumstances after the date of such statements or to reflect the occurrence of anticipated or unanticipated events. For additional information, see the comments included in AAR’s filings with the Securities and Exchange Commission. |
|
|
Company Overview 3 |
|
|
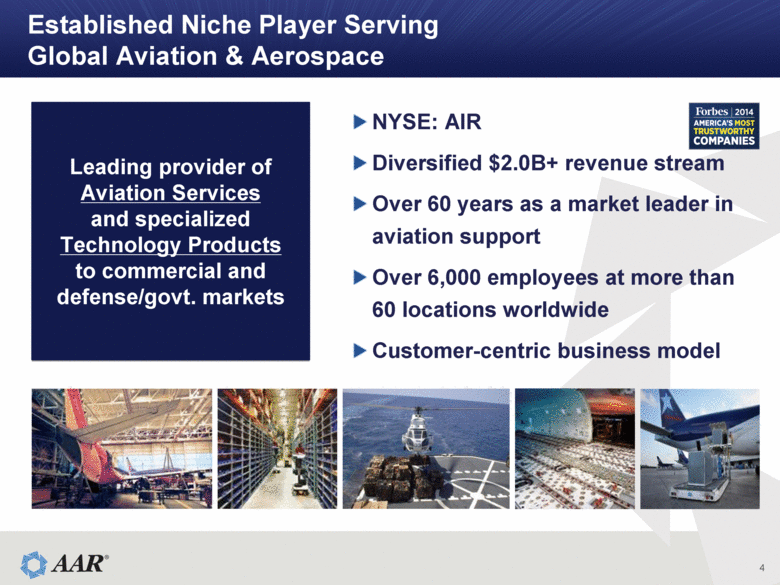
Established Niche Player Serving Global Aviation & Aerospace 4 Leading provider of Aviation Services and specialized Technology Products to commercial and defense/govt. markets NYSE: AIR Diversified $2.0B+ revenue stream Over 60 years as a market leader in aviation support Over 6,000 employees at more than 60 locations worldwide Customer-centric business model |
|
|
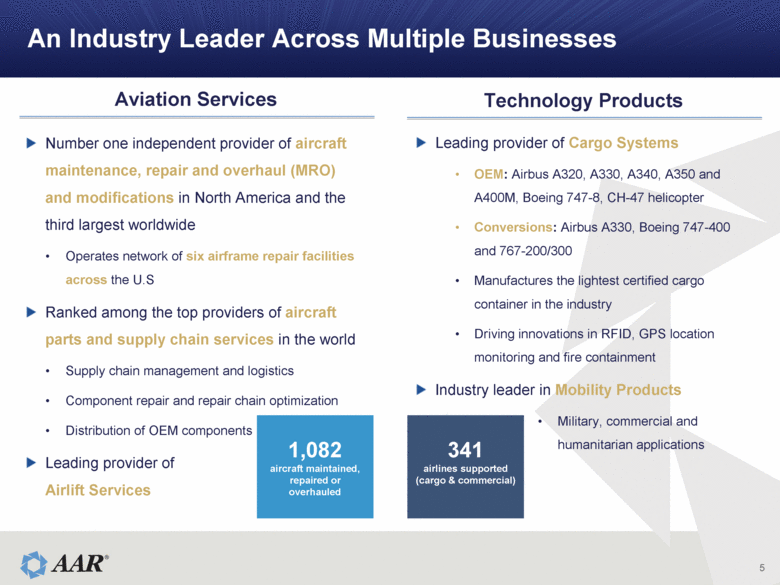
5 An Industry Leader Across Multiple Businesses Aviation Services Technology Products Number one independent provider of aircraft maintenance, repair and overhaul (MRO) and modifications in North America and the third largest worldwide Operates network of six airframe repair facilities across the U.S Ranked among the top providers of aircraft parts and supply chain services in the world Supply chain management and logistics Component repair and repair chain optimization Distribution of OEM components Leading provider of Airlift Services 1,082 aircraft maintained, repaired or overhauled 341 airlines supported (cargo & commercial) Leading provider of Cargo Systems OEM: Airbus A320, A330, A340, A350 and A400M, Boeing 747-8, CH-47 helicopter Conversions: Airbus A330, Boeing 747-400 and 767-200/300 Manufactures the lightest certified cargo container in the industry Driving innovations in RFID, GPS location monitoring and fire containment Industry leader in Mobility Products Military, commercial and humanitarian applications |
|
|
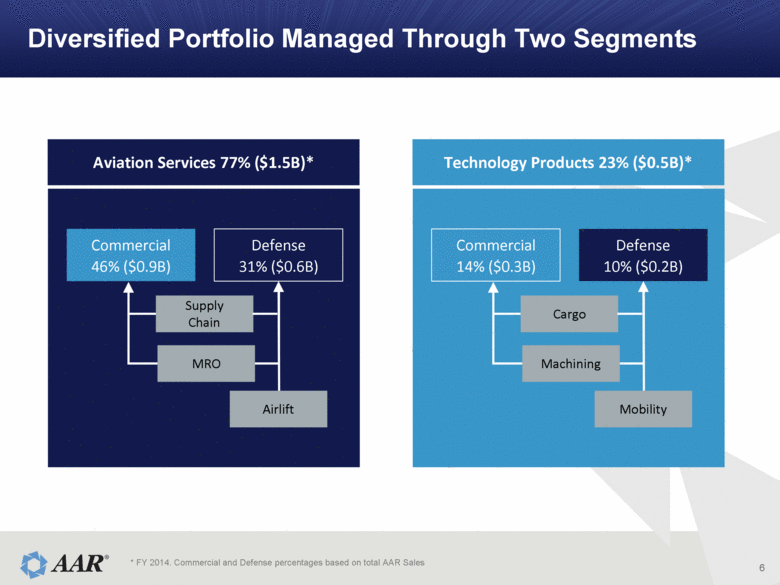
Diversified Portfolio Managed Through Two Segments 6 Commercial 46% ($0.9B) Defense 31% ($0.6B) MRO Supply Chain Airlift Aviation Services 77% ($1.5B)* Commercial 14% ($0.3B) Defense 10% ($0.2B) Machining Cargo Mobility Technology Products 23% ($0.5B)* * FY 2014. Commercial and Defense percentages based on total AAR Sales |
|
|
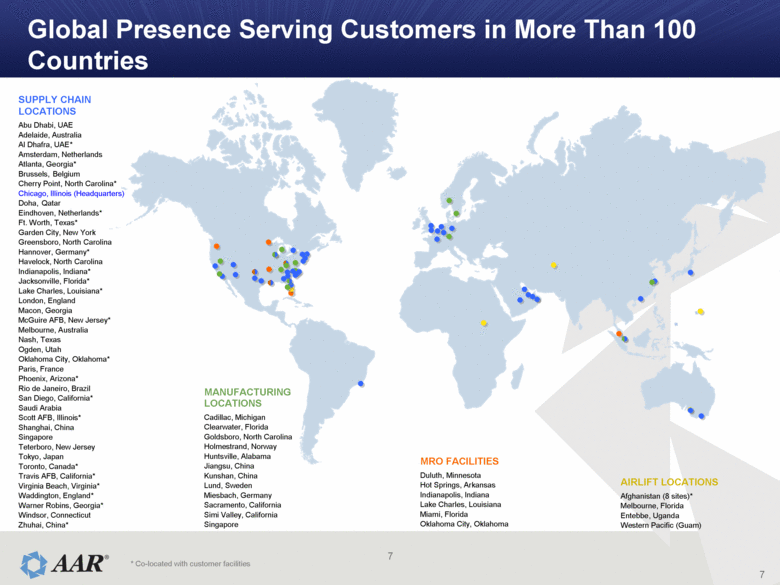
Global Presence Serving Customers in More Than 100 Countries 7 SUPPLY CHAIN LOCATIONS Abu Dhabi, UAE Adelaide, Australia Al Dhafra, UAE* Amsterdam, Netherlands Atlanta, Georgia* Brussels, Belgium Cherry Point, North Carolina* Chicago, Illinois (Headquarters) Doha, Qatar Eindhoven, Netherlands* Ft. Worth, Texas* Garden City, New York Greensboro, North Carolina Hannover, Germany* Havelock, North Carolina Indianapolis, Indiana* Jacksonville, Florida* Lake Charles, Louisiana* London, England Macon, Georgia McGuire AFB, New Jersey* Melbourne, Australia Nash, Texas Ogden, Utah Oklahoma City, Oklahoma* Paris, France Phoenix, Arizona* Rio de Janeiro, Brazil San Diego, California* Saudi Arabia Scott AFB, Illinois* Shanghai, China Singapore Teterboro, New Jersey Tokyo, Japan Toronto, Canada* Travis AFB, California* Virginia Beach, Virginia* Waddington, England* Warner Robins, Georgia* Windsor, Connecticut Zhuhai, China* AIRLIFT LOCATIONS Afghanistan (8 sites)* Melbourne, Florida Entebbe, Uganda Western Pacific (Guam) MRO FACILITIES Duluth, Minnesota Hot Springs, Arkansas Indianapolis, Indiana Lake Charles, Louisiana Miami, Florida Oklahoma City, Oklahoma MANUFACTURING LOCATIONS Cadillac, Michigan Clearwater, Florida Goldsboro, North Carolina Holmestrand, Norway Huntsville, Alabama Jiangsu, China Kunshan, China Lund, Sweden Miesbach, Germany Sacramento, California Simi Valley, California Singapore 7 * Co-located with customer facilities |
|
|
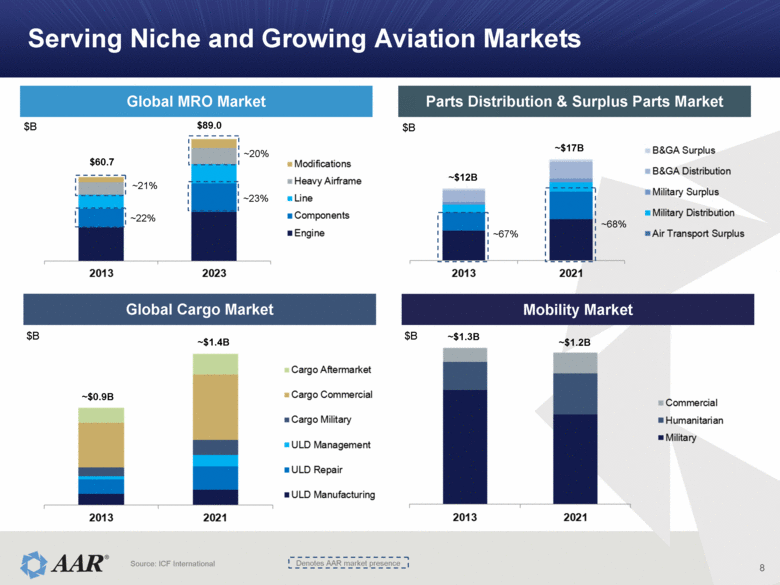
Serving Niche and Growing Aviation Markets 8 Global MRO Market $60.7 $89.0 $B Parts Distribution & Surplus Parts Market ~$12B ~$17B $B ~68% ~67% Global Cargo Market Mobility Market $B ~$0.9B ~$1.4B $B ~$1.3B ~$1.2B Source: ICF International ~20% ~21% Denotes AAR market presence ~23% ~22% |
|
|
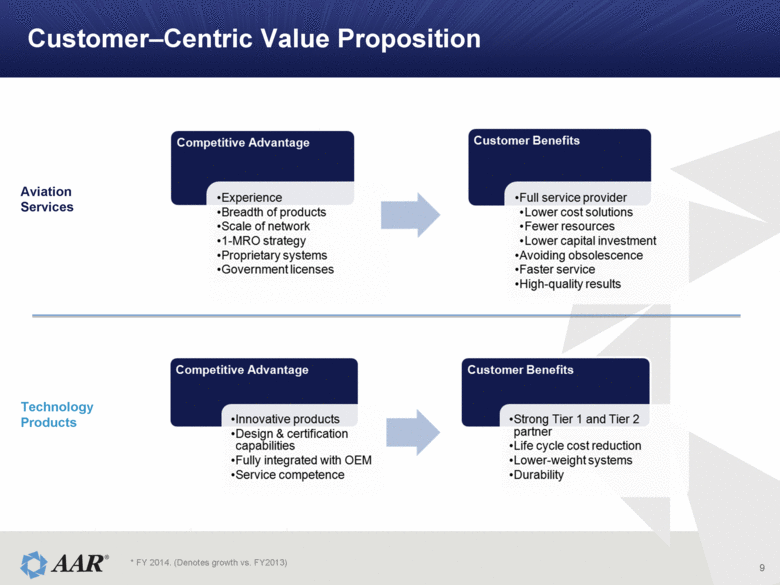
Customer–Centric Value Proposition 9 Aviation Services Technology Products * FY 2014. (Denotes growth vs. FY2013) |
|
|
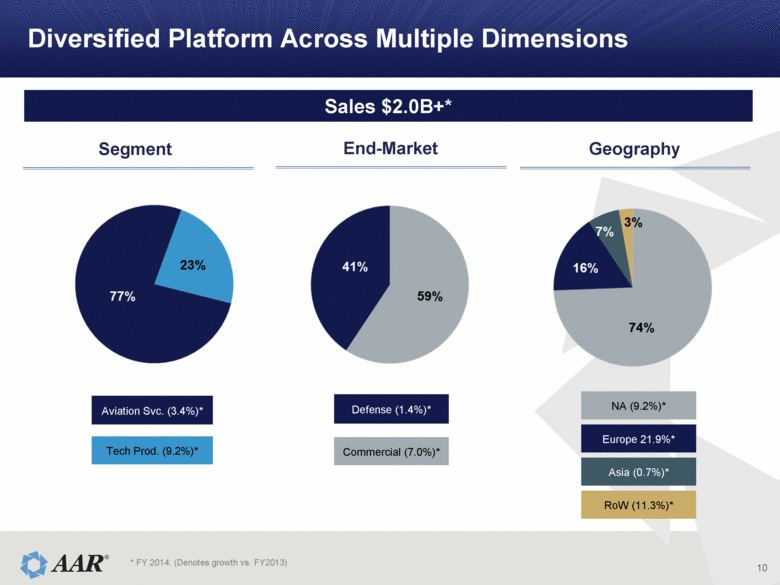
Diversified Platform Across Multiple Dimensions 10 Sales $2.0B+* Commercial (7.0%)* Defense (1.4%)* Aviation Svc. (3.4%)* Tech Prod. (9.2%)* * FY 2014. (Denotes growth vs. FY2013) NA (9.2%)* Europe 21.9%* Asia (0.7%)* RoW (11.3%)* Segment End-Market Geography |
|
|
Strong Customer Relationships 11 NATO U.S. DoD U.K. MoD Colombian Air Force U.S. Marshals Service Airlines OEMs Cargo & Leasing Government |
|
|
Financial Performance 12 |
|
|
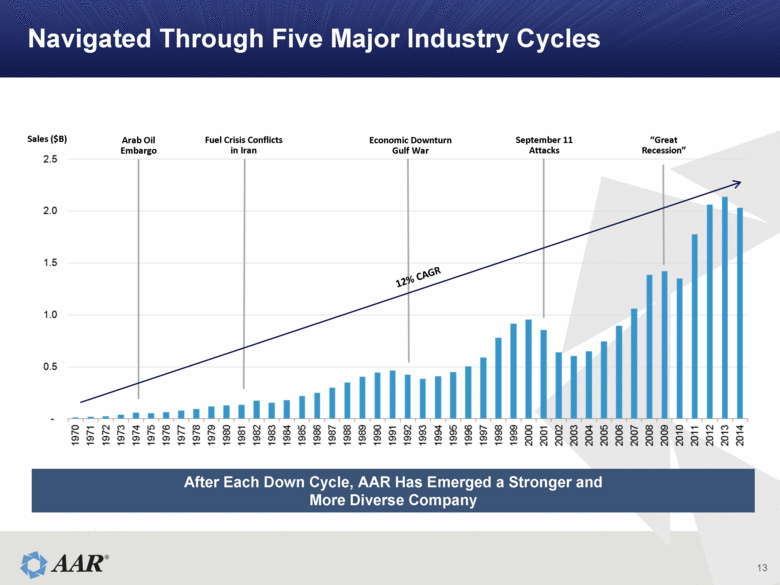
Navigated Through Five Major Industry Cycles 13 Arab Oil Embargo Fuel Crisis Conflicts in Iran Economic Downturn Gulf War September 11 Attacks “Great Recession” 12% CAGR Sales ($B) After Each Down Cycle, AAR Has Emerged a Stronger and More Diverse Company |
|
|
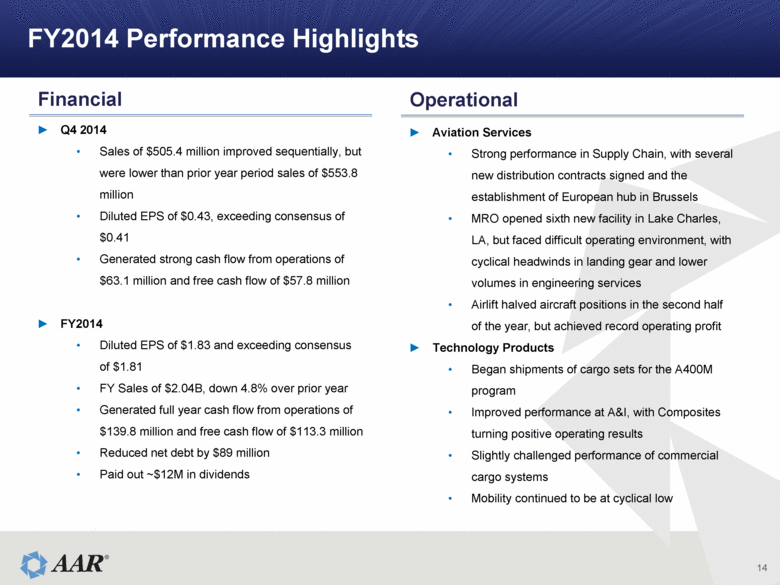
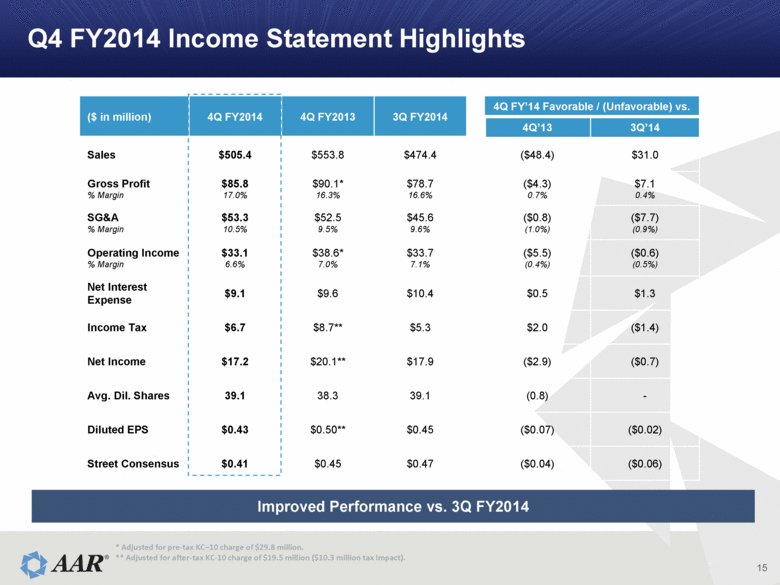
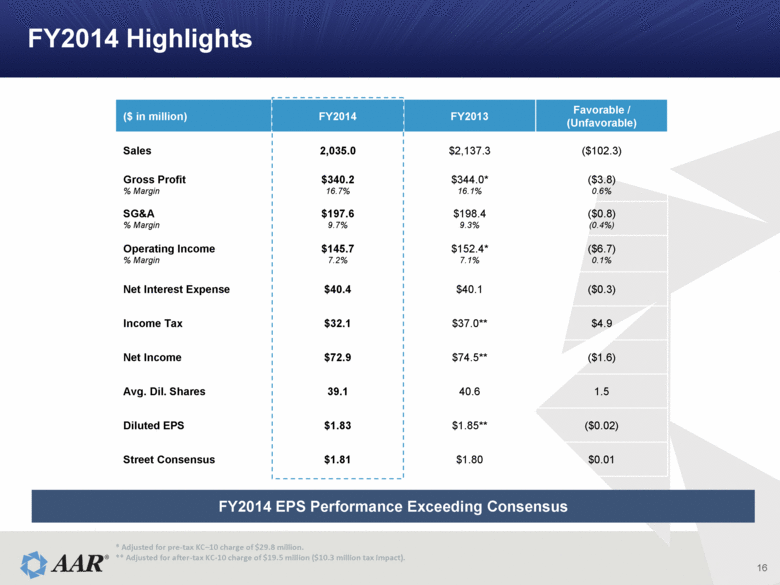
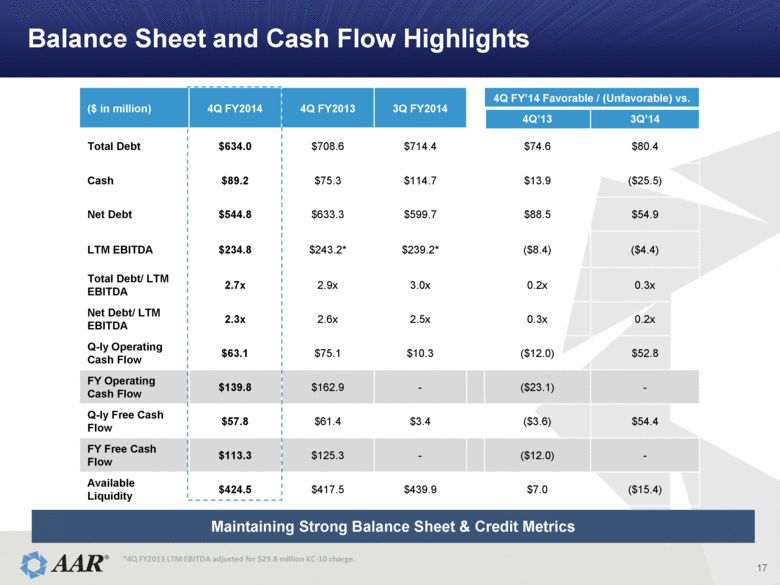
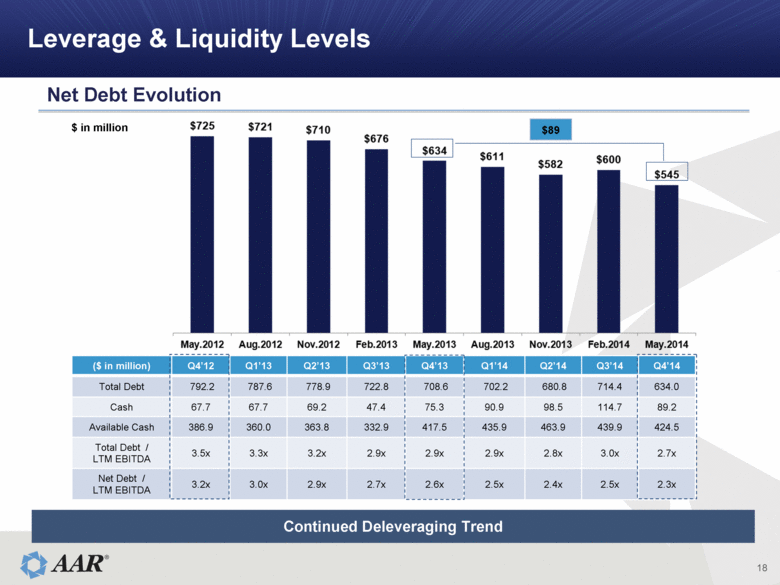
FY2014 Performance Highlights 14 Financial Operational Q4 2014 Sales of $505.4 million improved sequentially, but were lower than prior year period sales of $553.8 million Diluted EPS of $0.43, exceeding consensus of $0.41 Generated strong cash flow from operations of $63.1 million and free cash flow of $57.8 million FY2014 Diluted EPS of $1.83 and exceeding consensus of $1.81 FY Sales of $2.04B, down 4.8% over prior year Generated full year cash flow from operations of $139.8 million and free cash flow of $113.3 million Reduced net debt by $89 million Paid out ~$12M in dividends Aviation Services Strong performance in Supply Chain, with several new distribution contracts signed and the establishment of European hub in Brussels MRO opened sixth new facility in Lake Charles, LA, but faced difficult operating environment, with cyclical headwinds in landing gear and lower volumes in engineering services Airlift halved aircraft positions in the second half of the year, but achieved record operating profit Technology Products Began shipments of cargo sets for the A400M program Improved performance at A&I, with Composites turning positive operating results Slightly challenged performance of commercial cargo systems Mobility continued to be at cyclical low |
|
|
Q4 FY2014 Income Statement Highlights 15 ($ in million) 4Q FY2014 4Q FY2013 3Q FY2014 4Q FY’14 Favorable / (Unfavorable) vs. 4Q’13 3Q’14 Sales $505.4 $553.8 $474.4 ($48.4) $31.0 Gross Profit % Margin $85.8 17.0% $90.1* 16.3% $78.7 16.6% ($4.3) 0.7% $7.1 0.4% SG&A % Margin $53.3 10.5% $52.5 9.5% $45.6 9.6% ($0.8) (1.0%) ($7.7) (0.9%) Operating Income % Margin $33.1 6.6% $38.6* 7.0% $33.7 7.1% ($5.5) (0.4%) ($0.6) (0.5%) Net Interest Expense $9.1 $9.6 $10.4 $0.5 $1.3 Income Tax $6.7 $8.7** $5.3 $2.0 ($1.4) Net Income $17.2 $20.1** $17.9 ($2.9) ($0.7) Avg. Dil. Shares 39.1 38.3 39.1 (0.8) - Diluted EPS $0.43 $0.50** $0.45 ($0.07) ($0.02) Street Consensus $0.41 $0.45 $0.47 ($0.04) ($0.06) * Adjusted for pre-tax KC–10 charge of $29.8 million. ** Adjusted for after-tax KC-10 charge of $19.5 million ($10.3 million tax impact). Improved Performance vs. 3Q FY2014 |
|
|
FY2014 Highlights 16 ($ in million) FY2014 FY2013 Favorable / (Unfavorable) Sales 2,035.0 $2,137.3 ($102.3) Gross Profit % Margin $340.2 16.7% $344.0* 16.1% ($3.8) 0.6% SG&A % Margin $197.6 9.7% $198.4 9.3% ($0.8) (0.4%) Operating Income % Margin $145.7 7.2% $152.4* 7.1% ($6.7) 0.1% Net Interest Expense $40.4 $40.1 ($0.3) Income Tax $32.1 $37.0** $4.9 Net Income $72.9 $74.5** ($1.6) Avg. Dil. Shares 39.1 40.6 1.5 Diluted EPS $1.83 $1.85** ($0.02) Street Consensus $1.81 $1.80 $0.01 * Adjusted for pre-tax KC–10 charge of $29.8 million. ** Adjusted for after-tax KC-10 charge of $19.5 million ($10.3 million tax impact). FY2014 EPS Performance Exceeding Consensus |
|
|
*4Q FY2013 LTM EBITDA adjusted for $29.8 million KC-10 charge. ($ in million) 4Q FY2014 4Q FY2013 3Q FY2014 4Q FY’14 Favorable / (Unfavorable) vs. 4Q’13 3Q’14 Total Debt $634.0 $708.6 $714.4 $74.6 $80.4 Cash $89.2 $75.3 $114.7 $13.9 ($25.5) Net Debt $544.8 $633.3 $599.7 $88.5 $54.9 LTM EBITDA $234.8 $243.2* $239.2* ($8.4) ($4.4) Total Debt/ LTM EBITDA 2.7x 2.9x 3.0x 0.2x 0.3x Net Debt/ LTM EBITDA 2.3x 2.6x 2.5x 0.3x 0.2x Q-ly Operating Cash Flow $63.1 $75.1 $10.3 ($12.0) $52.8 FY Operating Cash Flow $139.8 $162.9 - ($23.1) - Q-ly Free Cash Flow $57.8 $61.4 $3.4 ($3.6) $54.4 FY Free Cash Flow $113.3 $125.3 - ($12.0) - Available Liquidity $424.5 $417.5 $439.9 $7.0 ($15.4) Balance Sheet and Cash Flow Highlights Maintaining Strong Balance Sheet & Credit Metrics 17 |
|
|
Leverage & Liquidity Levels 18 $ in million ($ in million) Q4’12 Q1’13 Q2’13 Q3’13 Q4’13 Q1’14 Q2’14 Q3’14 Q4’14 Total Debt 792.2 787.6 778.9 722.8 708.6 702.2 680.8 714.4 634.0 Cash 67.7 67.7 69.2 47.4 75.3 90.9 98.5 114.7 89.2 Available Cash 386.9 360.0 363.8 332.9 417.5 435.9 463.9 439.9 424.5 Total Debt / LTM EBITDA 3.5x 3.3x 3.2x 2.9x 2.9x 2.9x 2.8x 3.0x 2.7x Net Debt / LTM EBITDA 3.2x 3.0x 2.9x 2.7x 2.6x 2.5x 2.4x 2.5x 2.3x Continued Deleveraging Trend $89 Net Debt Evolution |
|
|
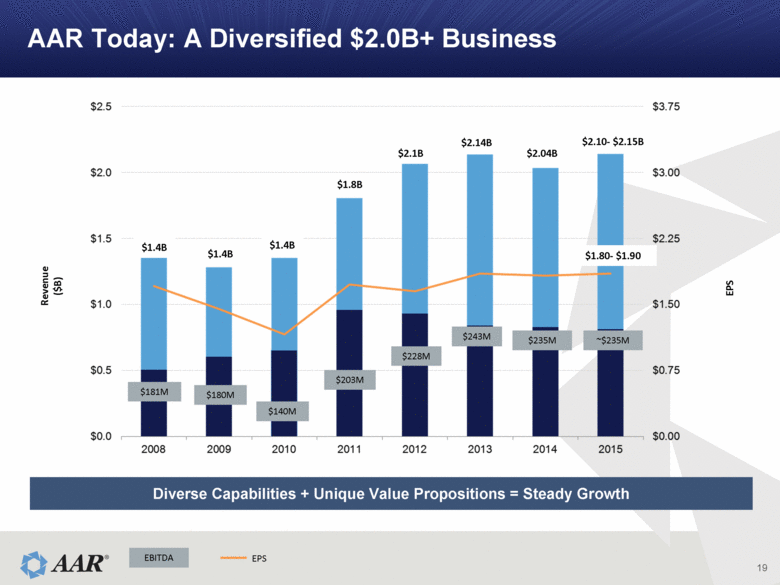
AAR Today: A Diversified $2.0B+ Business 19 EPS Revenue ($B) $181M $203M $140M $180M $228M $243M $235M $1.4B $1.4B $1.4B $1.8B $2.1B $2.14B $2.04B ~$235M $2.10- $2.15B $1.80- $1.90 Diverse Capabilities + Unique Value Propositions = Steady Growth EBITDA EPS |
|
|
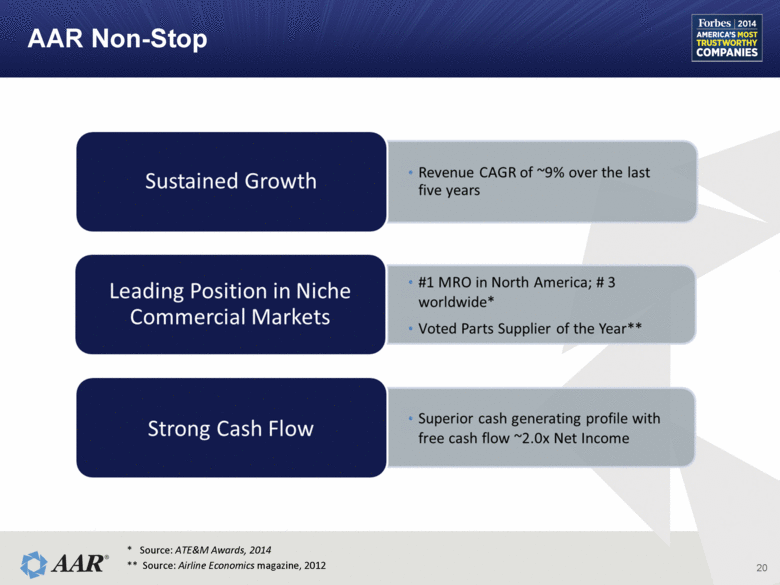
20 AAR Non-Stop * Source: ATE&M Awards, 2014 ** Source: Airline Economics magazine, 2012 |
|
|
Appendix 21 |
|
|
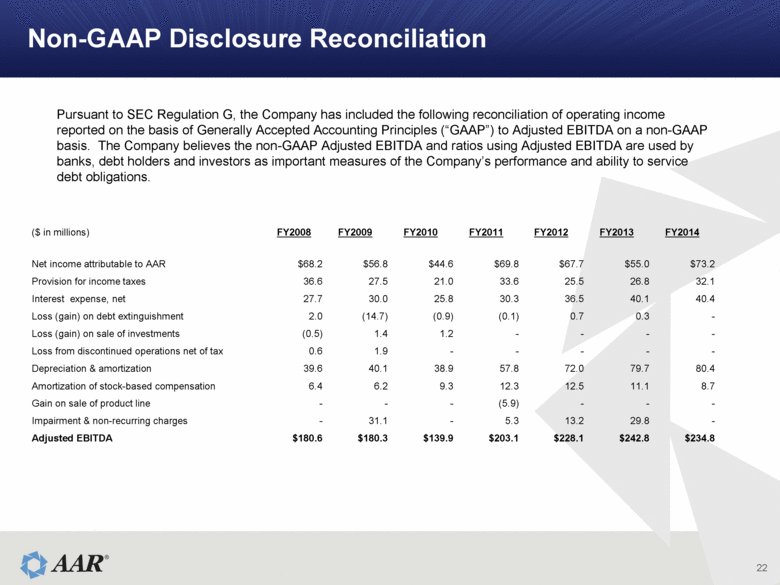
22 Non-GAAP Disclosure Reconciliation ($ in millions) FY2008 FY2009 FY2010 FY2011 FY2012 FY2013 FY2014 Net income attributable to AAR $68.2 $56.8 $44.6 $69.8 $67.7 $55.0 $73.2 Provision for income taxes 36.6 27.5 21.0 33.6 25.5 26.8 32.1 Interest expense, net 27.7 30.0 25.8 30.3 36.5 40.1 40.4 Loss (gain) on debt extinguishment 2.0 (14.7) (0.9) (0.1) 0.7 0.3 - Loss (gain) on sale of investments (0.5) 1.4 1.2 - - - - Loss from discontinued operations net of tax 0.6 1.9 - - - - - Depreciation & amortization 39.6 40.1 38.9 57.8 72.0 79.7 80.4 Amortization of stock-based compensation 6.4 6.2 9.3 12.3 12.5 11.1 8.7 Gain on sale of product line - - - (5.9) - - - Impairment & non-recurring charges - 31.1 - 5.3 13.2 29.8 - Adjusted EBITDA $180.6 $180.3 $139.9 $203.1 $228.1 $242.8 $234.8 Pursuant to SEC Regulation G, the Company has included the following reconciliation of operating income reported on the basis of Generally Accepted Accounting Principles (“GAAP”) to Adjusted EBITDA on a non-GAAP basis. The Company believes the non-GAAP Adjusted EBITDA and ratios using Adjusted EBITDA are used by banks, debt holders and investors as important measures of the Company’s performance and ability to service debt obligations. |

