Attached files
| file | filename |
|---|---|
| EXCEL - IDEA: XBRL DOCUMENT - NOV Inc. | Financial_Report.xls |
| 8-K - 8-K - NOV Inc. | d772118d8k.htm |
Exhibit 99.1
PART I - FINANCIAL INFORMATION
Item 1. Financial Statements
NATIONAL OILWELL VARCO, INC.
CONSOLIDATED BALANCE SHEETS
(In millions, except share data)
| March 31, | December 31, | |||||||
| 2014 | 2013 | |||||||
| (Unaudited) | ||||||||
| ASSETS | ||||||||
| Current assets: |
||||||||
| Cash and cash equivalents |
$ | 3,688 | $ | 3,436 | ||||
| Receivables, net |
5,310 | 4,896 | ||||||
| Inventories, net |
5,659 | 5,603 | ||||||
| Costs in excess of billings |
1,520 | 1,539 | ||||||
| Deferred income taxes |
325 | 373 | ||||||
| Prepaid and other current assets |
709 | 576 | ||||||
|
|
|
|
|
|||||
| Total current assets |
17,211 | 16,423 | ||||||
| Property, plant and equipment, net |
3,437 | 3,408 | ||||||
| Deferred income taxes |
479 | 372 | ||||||
| Goodwill |
8,875 | 9,049 | ||||||
| Intangibles, net |
4,953 | 5,055 | ||||||
| Investment in unconsolidated affiliates |
402 | 390 | ||||||
| Other assets |
123 | 115 | ||||||
|
|
|
|
|
|||||
| Total assets |
$ | 35,480 | $ | 34,812 | ||||
|
|
|
|
|
|||||
| LIABILITIES AND STOCKHOLDERS’ EQUITY | ||||||||
| Current liabilities: |
||||||||
| Accounts payable |
$ | 1,391 | $ | 1,275 | ||||
| Accrued liabilities |
2,717 | 2,763 | ||||||
| Billings in excess of costs |
2,079 | 1,771 | ||||||
| Current portion of long-term debt and short-term borrowings |
— | 1 | ||||||
| Accrued income taxes |
484 | 556 | ||||||
| Deferred income taxes |
427 | 312 | ||||||
|
|
|
|
|
|||||
| Total current liabilities |
7,098 | 6,678 | ||||||
| Long-term debt |
3,149 | 3,149 | ||||||
| Deferred income taxes |
2,088 | 2,292 | ||||||
| Other liabilities |
353 | 363 | ||||||
|
|
|
|
|
|||||
| Total liabilities |
12,688 | 12,482 | ||||||
|
|
|
|
|
|||||
| Commitments and contingencies |
||||||||
| Stockholders’ equity: |
||||||||
| Common stock - par value $.01; 1 billion shares authorized; 428,852,227 and 428,433,703 shares issued and outstanding at March 31, 2014 and December 31, 2013 |
4 | 4 | ||||||
| Additional paid-in capital |
8,933 | 8,907 | ||||||
| Accumulated other comprehensive loss |
(41 | ) | (4 | ) | ||||
| Retained earnings |
13,801 | 13,323 | ||||||
|
|
|
|
|
|||||
| Total Company stockholders’ equity |
22,697 | 22,230 | ||||||
| Noncontrolling interests |
95 | 100 | ||||||
|
|
|
|
|
|||||
| Total stockholders’ equity |
22,792 | 22,330 | ||||||
|
|
|
|
|
|||||
| Total liabilities and stockholders’ equity |
$ | 35,480 | $ | 34,812 | ||||
|
|
|
|
|
|||||
See notes to unaudited consolidated financial statements.
NATIONAL OILWELL VARCO, INC.
CONSOLIDATED STATEMENTS OF INCOME (UNAUDITED)
(In millions, except per share data)
| Three Months Ended March 31, |
||||||||
| 2014 | 2013 | |||||||
| Revenue |
$ | 4,889 | $ | 4,376 | ||||
| Cost of revenue |
3,599 | 3,209 | ||||||
|
|
|
|
|
|||||
| Gross profit |
1,290 | 1,167 | ||||||
| Selling, general and administrative |
491 | 474 | ||||||
|
|
|
|
|
|||||
| Operating profit |
799 | 693 | ||||||
| Interest and financial costs |
(26 | ) | (28 | ) | ||||
| Interest income |
4 | 3 | ||||||
| Equity income in unconsolidated affiliates |
10 | 19 | ||||||
| Other income (expense), net |
— | (23 | ) | |||||
|
|
|
|
|
|||||
| Income from continuing operations before income taxes |
787 | 664 | ||||||
| Provision for income taxes |
239 | 205 | ||||||
|
|
|
|
|
|||||
| Income from continuing operations |
548 | 459 | ||||||
| Income from discontinued operations |
41 | 41 | ||||||
|
|
|
|
|
|||||
| Net income |
589 | 500 | ||||||
| Net loss attributable to noncontrolling interests |
— | (2 | ) | |||||
|
|
|
|
|
|||||
| Net income attributable to Company |
$ | 589 | $ | 502 | ||||
|
|
|
|
|
|||||
| Per share data: |
||||||||
| Basic: |
||||||||
| Income from continuing operations |
$ | 1.28 | $ | 1.08 | ||||
|
|
|
|
|
|||||
| Income from discontinued operations |
$ | 0.10 | $ | 0.10 | ||||
|
|
|
|
|
|||||
| Net income attributable to Company |
$ | 1.38 | $ | 1.18 | ||||
|
|
|
|
|
|||||
| Diluted: |
||||||||
| Income from continuing operations |
$ | 1.28 | $ | 1.08 | ||||
|
|
|
|
|
|||||
| Income from discontinued operations |
$ | 0.09 | $ | 0.09 | ||||
|
|
|
|
|
|||||
| Net income attributable to Company |
$ | 1.37 | $ | 1.17 | ||||
|
|
|
|
|
|||||
| Cash dividends per share |
$ | 0.26 | $ | 0.13 | ||||
|
|
|
|
|
|||||
| Weighted average shares outstanding: |
||||||||
| Basic |
428 | 426 | ||||||
|
|
|
|
|
|||||
| Diluted |
429 | 428 | ||||||
|
|
|
|
|
|||||
See notes to unaudited consolidated financial statements.
2
NATIONAL OILWELL VARCO, INC.
CONSOLIDATED STATEMENTS OF COMPREHENSIVE INCOME (UNAUDITED)
(In millions)
| Three Months Ended March 31, |
||||||||
| 2014 | 2013 | |||||||
| Net income |
$ | 589 | $ | 500 | ||||
| Currency translation adjustments |
(51 | ) | (117 | ) | ||||
| Changes in derivative financial instruments, net of tax |
14 | (48 | ) | |||||
|
|
|
|
|
|||||
| Comprehensive income |
552 | 335 | ||||||
| Comprehensive loss attributable to noncontrolling interest |
— | (2 | ) | |||||
|
|
|
|
|
|||||
| Comprehensive income attributable to Company |
$ | 552 | $ | 337 | ||||
|
|
|
|
|
|||||
See notes to unaudited consolidated financial statements.
3
NATIONAL OILWELL VARCO, INC.
CONSOLIDATED STATEMENTS OF CASH FLOWS (UNAUDITED)
(In millions)
| Three Months Ended March 31, |
||||||||
| 2014 | 2013 | |||||||
| Cash flows from operating activities: |
||||||||
| Income from continuing operations |
$ | 548 | $ | 459 | ||||
| Adjustments to reconcile net income to net cash provided by operating activities: |
||||||||
| Depreciation and amortization |
191 | 170 | ||||||
| Deferred income taxes |
45 | (33 | ) | |||||
| Equity income in unconsolidated affiliates |
(10 | ) | (19 | ) | ||||
| Other, net |
64 | 16 | ||||||
| Change in operating assets and liabilities, net of acquisitions: |
||||||||
| Receivables |
(325 | ) | 230 | |||||
| Inventories |
(101 | ) | (27 | ) | ||||
| Costs in excess of billings |
20 | (108 | ) | |||||
| Prepaid and other current assets |
(133 | ) | 135 | |||||
| Accounts payable |
67 | (3 | ) | |||||
| Billings in excess of costs |
307 | (97 | ) | |||||
| Income taxes payable |
(79 | ) | 57 | |||||
| Other assets/liabilities, net |
(109 | ) | (294 | ) | ||||
|
|
|
|
|
|||||
| Net cash provided by continuing operating activities |
485 | 486 | ||||||
| Discontinued operations |
3 | 20 | ||||||
|
|
|
|
|
|||||
| Net cash provided by operating activities |
488 | 506 | ||||||
|
|
|
|
|
|||||
| Cash flows from investing activities: |
||||||||
| Purchases of property, plant and equipment |
(125 | ) | (149 | ) | ||||
| Business acquisitions, net of cash acquired |
(2 | ) | (2,375 | ) | ||||
| Other |
7 | 8 | ||||||
|
|
|
|
|
|||||
| Net cash used in continuing investing activities |
(120 | ) | (2,516 | ) | ||||
| Discontinued operations |
(6 | ) | (19 | ) | ||||
|
|
|
|
|
|||||
| Net cash used in investing activities |
(126 | ) | (2,535 | ) | ||||
|
|
|
|
|
|||||
| Cash flows from financing activities: |
||||||||
| Borrowings against lines of credit and other debt |
— | 1,386 | ||||||
| Repayments on debt |
(1 | ) | (186 | ) | ||||
| Cash dividends paid |
(111 | ) | (56 | ) | ||||
| Proceeds from stock options exercised |
5 | 5 | ||||||
| Other |
2 | 13 | ||||||
|
|
|
|
|
|||||
| Net cash provided by (used in) continuing financing activities |
(105 | ) | 1,162 | |||||
| Discontinued operations |
— | — | ||||||
|
|
|
|
|
|||||
| Net cash provided by (used in) financing activities |
(105 | ) | 1,162 | |||||
| Effect of exchange rates on cash |
(5 | ) | (11 | ) | ||||
|
|
|
|
|
|||||
| Increase (decrease) in cash and cash equivalents |
252 | (878 | ) | |||||
| Cash and cash equivalents, beginning of period |
3,436 | 3,319 | ||||||
|
|
|
|
|
|||||
| Cash and cash equivalents, end of period |
$ | 3,688 | $ | 2,441 | ||||
|
|
|
|
|
|||||
| Supplemental disclosures of cash flow information: |
||||||||
| Cash payments during the period for: |
||||||||
| Interest |
$ | 7 | $ | 7 | ||||
| Income taxes |
$ | 296 | $ | 152 | ||||
See notes to unaudited consolidated financial statements.
4
NATIONAL OILWELL VARCO, INC.
Notes to Consolidated Financial Statements (Unaudited)
1. Basis of Presentation
The preparation of financial statements in conformity with generally accepted accounting principles (“GAAP”) in the United States requires management to make estimates and assumptions that affect reported and contingent amounts of assets and liabilities as of the date of the financial statements and reported amounts of revenues and expenses during the reporting period. Actual results could differ from those estimates.
The accompanying unaudited consolidated financial statements of National Oilwell Varco, Inc. (“NOV” or the “Company”) present information in accordance with GAAP in the United States for interim financial information and the instructions to Form 10-Q and applicable rules of Regulation S-X. They do not include all information or footnotes required by GAAP in the United States for complete consolidated financial statements and should be read in conjunction with our 2013 Annual Report on Form 10-K.
In our opinion, the consolidated financial statements include all adjustments, all of which are of a normal recurring nature, necessary for a fair presentation of the results for the interim periods. The results of operations for the three months ended March 31, 2014 are not necessarily indicative of the results to be expected for the full year.
On May 30, 2014, the Company completed the spin-off of its distribution business into an independent public company named NOW Inc. In conjunction with the spin-off of NOW Inc. the Company reviewed its reporting and management structure, and effective April 1, 2014, reorganized the Rig Technology, Petroleum Services & Supplies and remaining operations of Distribution & Transmission reporting segments into four new reporting segments. The new reporting segments are Rig Systems, Rig Aftermarket, Wellbore Technologies and Completion & Production Solutions.
As a result of these changes, the Consolidated Financial Statements have been revised to reflect the spin-off of NOW Inc. as discontinued operations. In addition, Note 1 and Note 6 to the Consolidated Financial Statements have been revised to reflect the spin-off off of NOW Inc., as discontinued operations as well as to recast the financial information to reflect the new reporting segments. Note 8, Note 9, Note 11 and Note 15 have been revised to reflect the spin-off of NOW Inc., as discontinued operations only.
Fair Value of Financial Instruments
The carrying amounts of cash and cash equivalents, receivables, and payables approximated fair value because of the relatively short maturity of these instruments. Cash equivalents include only those investments having a maturity date of three months or less at the time of purchase. See Note 7 for the fair value of long-term debt and Note 10 for the fair value of derivative financial instruments.
2. Inventories, net
Inventories consist of (in millions):
| March 31, | December 31, | |||||||
| 2014 | 2013 | |||||||
| Raw materials and supplies |
$ | 1,414 | $ | 1,175 | ||||
| Work in process |
655 | 798 | ||||||
| Finished goods and purchased products |
3,590 | 3,630 | ||||||
|
|
|
|
|
|||||
| Total |
$ | 5,659 | $ | 5,603 | ||||
|
|
|
|
|
|||||
5
3. Accrued Liabilities
Accrued liabilities consist of (in millions):
| March 31, | December 31, | |||||||
| 2014 | 2013 | |||||||
| Customer prepayments and billings |
$ | 755 | $ | 673 | ||||
| Accrued vendor costs |
562 | 531 | ||||||
| Compensation |
348 | 516 | ||||||
| Warranty |
248 | 228 | ||||||
| Insurance |
137 | 131 | ||||||
| Taxes (non income) |
128 | 188 | ||||||
| Accrued Commissions |
92 | 97 | ||||||
| Interest |
30 | 11 | ||||||
| Fair value of derivatives |
21 | 31 | ||||||
| Other |
396 | 357 | ||||||
|
|
|
|
|
|||||
| Total |
$ | 2,717 | $ | 2,763 | ||||
|
|
|
|
|
|||||
Service and Product Warranties
The Company provides service and warranty policies on certain of its products. The Company accrues liabilities under service and warranty policies based upon specific claims and a review of historical warranty and service claim experience in accordance with Accounting Standards Codification (“ASC”) Topic 450 “Contingencies” (“ASC Topic 450”). Adjustments are made to accruals as claim data and historical experience change. In addition, the Company incurs discretionary costs to service its products in connection with product performance issues and accrues for them when they are encountered.
The changes in the carrying amount of service and product warranties are as follows (in millions):
| Balance at December 31, 2013 |
$ | 228 | ||
|
|
|
|||
| Net provisions for warranties issued during the year |
29 | |||
| Amounts incurred |
(11 | ) | ||
| Currency translation adjustments and other |
2 | |||
|
|
|
|||
| Balance at March 31, 2014 |
$ | 248 | ||
|
|
|
6
4. Costs and Estimated Earnings on Uncompleted Contracts
Costs and estimated earnings on uncompleted contracts consist of (in millions):
| March 31, | December 31, | |||||||
| 2014 | 2013 | |||||||
| Costs incurred on uncompleted contracts |
$ | 8,521 | $ | 7,608 | ||||
| Estimated earnings |
3,909 | 3,553 | ||||||
|
|
|
|
|
|||||
| 12,430 | 11,161 | |||||||
| Less: Billings to date |
12,989 | 11,393 | ||||||
|
|
|
|
|
|||||
| $ | (559 | ) | $ | (232 | ) | |||
|
|
|
|
|
|||||
| Costs and estimated earnings in excess of billings on uncompleted contracts |
$ | 1,520 | $ | 1,539 | ||||
| Billings in excess of costs and estimated earnings on uncompleted contracts |
(2,079 | ) | (1,771 | ) | ||||
|
|
|
|
|
|||||
| $ | (559 | ) | $ | (232 | ) | |||
|
|
|
|
|
|||||
5. Accumulated Other Comprehensive Income (Loss)
The components of accumulated other comprehensive income (loss) are as follows (in millions):
| Derivative | Defined | |||||||||||||||
| Currency | Financial | Benefit | ||||||||||||||
| Translation | Instruments, | Plans, | ||||||||||||||
| Adjustments | Net of Tax | Net of Tax | Total | |||||||||||||
| Balance at December 31, 2013 |
$ | 17 | $ | 5 | $ | (26 | ) | $ | (4 | ) | ||||||
| Accumulated other comprehensive income (loss) before reclassifications |
(51 | ) | 21 | — | (30 | ) | ||||||||||
| Amounts reclassified from accumulated other comprehensive income (loss) |
— | (7 | ) | — | (7 | ) | ||||||||||
|
|
|
|
|
|
|
|
|
|||||||||
| Balance at March 31, 2014 |
$ | (34 | ) | $ | 19 | $ | (26 | ) | $ | (41 | ) | |||||
|
|
|
|
|
|
|
|
|
|||||||||
The components of amounts reclassified from accumulated other comprehensive income (loss) are as follows (in millions):
| Three Months Ended March 31, | ||||||||||||||||||||||||||||||||
| 2014 | 2013 | |||||||||||||||||||||||||||||||
| Currency | Derivative | Defined | Currency | Derivative | Defined | |||||||||||||||||||||||||||
| Translation | Financial | Benefit | Translation | Financial | Benefit | |||||||||||||||||||||||||||
| Adjustments | Instruments | Plans | Total | Adjustments | Instruments | Plans | Total | |||||||||||||||||||||||||
| Revenue |
$ | — | $ | (13 | ) | $ | — | $ | (13 | ) | $ | — | $ | (2 | ) | $ | — | $ | (2 | ) | ||||||||||||
| Cost of revenue |
— | 3 | — | 3 | — | (3 | ) | — | (3 | ) | ||||||||||||||||||||||
| Tax effect |
— | 3 | — | 3 | — | 1 | — | 1 | ||||||||||||||||||||||||
|
|
|
|
|
|
|
|
|
|
|
|
|
|
|
|
|
|||||||||||||||||
| $ | — | $ | (7 | ) | $ | — | $ | (7 | ) | $ | — | $ | (4 | ) | $ | — | $ | (4 | ) | |||||||||||||
|
|
|
|
|
|
|
|
|
|
|
|
|
|
|
|
|
|||||||||||||||||
The Company’s reporting currency is the U.S. dollar. A majority of the Company’s international entities in which there is a substantial investment have the local currency as their functional currency. As a result, currency translation adjustments resulting from the process of translating the entities’ financial statements into the reporting currency are reported in Other Comprehensive Income or Loss in accordance with ASC Topic 830 “Foreign Currency Matters” (“ASC Topic 830”). For the three months ended March 31, 2014 and March 31, 2013, a majority of these local currencies weakened against the U.S. dollar resulting in net Other Comprehensive Loss of $51 million and $117 million, respectively, upon the translation from local currencies to the U.S. dollar.
7
The effect of changes in the fair values of derivatives designated as cash flow hedges are accumulated in Other Comprehensive Income or Loss, net of tax, until the underlying transactions to which they are designed to hedge are realized. The movement in Other Comprehensive Income or Loss from period to period will be the result of the combination of changes in fair value for open derivatives and the outflow of Other Comprehensive Income or Loss related to cumulative changes in the fair value of derivatives that have settled in the current or prior periods. The accumulated effect was Other Comprehensive Income of $14 million (net of tax of $6 million) for the three months ended March 31, 2014 and $48 million Other Comprehensive Loss (net of tax of $19 million) for the three months ended March 31, 2013.
6. Business Segments
Effective April 1, 2014, the Company’s operations were reorganized into four reportable segments: Rig Systems, Rig Aftermarket, Wellbore Technologies and Completion & Production Solutions. Within the four reporting segments, the Company has aggregated two business units under Rig Systems, one business unit under Rig Aftermarket, six business units under Wellbore Technologies and six business units under Completion & Production Solutions for a total of 15 business units. The Company has aggregated each of its business units in one of the four reporting segments based on the guidelines of ASC Topic 280, “Segment Reporting” (“ASC Topic 280”).
Rig Systems
The Company’s Rig Systems segment makes and supports the capital equipment and integrated systems needed to drill oil and gas wells on land and offshore. The segment designs, manufactures, and sells land rigs, offshore drilling equipment packages, including installation and commissioning services, and drilling rig components that mechanize and automate the rig process and functionality.
Equipment and technologies in Rig Systems include: substructures, derricks, and masts; cranes; pipe lifting, racking, rotating, and assembly systems; fluid transfer technologies, such as mud pumps; pressure control equipment, including blowout preventers; power transmission systems, including drives and generators; and rig instrumentation and control systems.
The Rig Systems segment primarily supports land and offshore drillers. Demand for Rig Systems products primarily depends on drilling contractors’ and oil and gas companies’ capital spending plans, specifically capital expenditures on rig construction and refurbishment.
Rig Aftermarket
The Company’s Rig Aftermarket segment provides comprehensive aftermarket products and services to support land rigs and offshore rigs, and drilling rig components manufactured by the Rig Systems segment.
The segment provides spare parts, repair, and rentals as well as technical support, field service and first well support, field engineering, and customer training through a network of aftermarket service and repair facilities strategically located in major areas of drilling operations.
The Rig Aftermarket segment primarily supports land and offshore drillers. Demand for Rig Aftermarket products and services primarily depends on overall levels of oilfield drilling activity, which drives demand for spare parts, service, and repair for Rig System’s large installed base of equipment; and secondarily on drilling contractors’ and oil and gas companies’ capital spending plans, specifically capital expenditures on rig refurbishment and re-certification.
Wellbore Technologies
The Company’s Wellbore Technologies segment designs, manufactures, rents, and sells a variety of equipment and technologies used to perform drilling operations, and offers services that optimize their performance, including: solids control and waste management equipment and services, drilling fluids, premium drill pipe, wired pipe, tubular inspection and coating services, instrumentation, downhole tools, and drill bits.
The Wellbore Technologies segment focuses on oil and gas companies and supports drilling contractors, oilfield service companies, and oilfield rental companies. Demand for Wellbore Technologies products and services primarily depends on the level of oilfield drilling activity by oil and gas companies, drilling contractors, and oilfield service companies.
8
Completion & Production Solutions
The Company’s Completion & Production Solutions segment integrates technologies for well completions and oil and gas production. The segment designs, manufactures, and sells equipment and technologies needed for hydraulic fracture stimulation, including pressure pumping trucks and pumps, blenders, sanders, hydration units, injection units, flowline, manifolds and wellheads; well intervention, including coiled tubing units, coiled tubing, and wireline units and tools; onshore production, including composite pipe, surface transfer and progressive cavity pumps, and artificial lift systems; and offshore production, including floating production systems and subsea production technologies.
The Completion & Production Solutions segment primarily supports service companies and oil and gas companies. Demand for Completion & Production Solutions products depends on the level of oilfield completions and workover activity by oilfield service companies and drilling contractors and capital spending plans by oil and gas companies and oilfield service companies.
Operating results by segment are as follows (in millions):
| Three Months Ended March 31, |
||||||||
| 2014 | 2013 | |||||||
| Revenue: |
||||||||
| Rig Systems |
$ | 2,256 | $ | 1,911 | ||||
| Rig Aftermarket |
750 | 551 | ||||||
| Wellbore Technologies |
1,278 | 1,223 | ||||||
| Completion & Production Solutions |
1,002 | 1,002 | ||||||
| Eliminations |
(397 | ) | (311 | ) | ||||
|
|
|
|
|
|||||
| Total Revenue |
$ | 4,889 | $ | 4,376 | ||||
|
|
|
|
|
|||||
| Operating Profit: |
||||||||
| Rig Systems |
$ | 451 | $ | 370 | ||||
| Rig Aftermarket |
191 | 142 | ||||||
| Wellbore Technologies |
221 | 182 | ||||||
| Completion & Production Solutions |
137 | 136 | ||||||
| Unallocated expenses and eliminations |
(201 | ) | (137 | ) | ||||
|
|
|
|
|
|||||
| Total Operating Profit |
$ | 799 | $ | 693 | ||||
|
|
|
|
|
|||||
| Operating Profit %: |
||||||||
| Rig Systems |
20.0 | % | 19.4 | % | ||||
| Rig Aftermarket |
25.5 | % | 25.8 | % | ||||
| Wellbore Technologies |
17.3 | % | 14.9 | % | ||||
| Completion & Production Solutions |
13.7 | % | 13.6 | % | ||||
| Total Operating Profit % |
16.3 | % | 15.8 | % | ||||
Sales from one segment to another generally are priced at estimated equivalent commercial selling prices; however, segments originating an external sale are credited with the full profit to the Company. Eliminations include intercompany transactions conducted between the four reporting segments that are eliminated in consolidation. Intercompany transactions within each reporting segment are eliminated within each reporting segment.
9
Included in operating profit are other costs related to acquisitions, such as transaction costs, the amortization of backlog and inventory that was stepped up to fair value during purchase accounting, the costs of the proposed spin-off of the Company’s distribution business and certain legal costs. Other costs by segment are as follows (in millions):
| Three Months Ended March 31, |
||||||||
| 2014 | 2013 | |||||||
| Other costs: |
||||||||
| Rig Systems |
$ | — | $ | 2 | ||||
| Rig Aftermarket |
— | — | ||||||
| Wellbore Technologies |
3 | 26 | ||||||
| Completion & Production Solutions |
6 | 36 | ||||||
|
|
|
|
|
|||||
| Total other costs |
$ | 9 | $ | 64 | ||||
|
|
|
|
|
|||||
7. Debt
Debt consists of (in millions):
| March 31, | December 31, | |||||||
| 2014 | 2013 | |||||||
| Senior Notes, interest at 6.125% payable semiannually, principal due on August 15, 2015 |
$ | 151 | $ | 151 | ||||
| Senior Notes, interest at 1.35% payable semiannually, principal due on December 1, 2017 |
500 | 500 | ||||||
| Senior Notes, interest at 2.6% payable semiannually, principal due on December 1, 2022 |
1,396 | 1,396 | ||||||
| Senior Notes, interest at 3.95% payable semiannually, principal due on December 1, 2042 |
1,096 | 1,096 | ||||||
| Other |
6 | 7 | ||||||
|
|
|
|
|
|||||
| Total debt |
3,149 | 3,150 | ||||||
| Less current portion |
— | 1 | ||||||
|
|
|
|
|
|||||
| Long-term debt |
$ | 3,149 | $ | 3,149 | ||||
|
|
|
|
|
|||||
The Company has a $3.5 billion, five-year unsecured revolving credit facility which expires September 28, 2018. The Company also has a commercial paper program that is supported by its revolving credit facility. At March 31, 2014, the Company had no commercial paper borrowings and no borrowings against its revolving credit facility. Funds available under the Company’s revolving credit facility were $2,509 million due to $991 million in outstanding letters of credit issued under the facility. Interest under this multicurrency facility is based upon LIBOR, NIBOR or EURIBOR plus 0.875% subject to a ratings-based grid, or the prime rate. The credit facility contains a financial covenant regarding maximum debt to capitalization and the Company was in compliance at March 31, 2014.
The Company also had $3,223 million of additional outstanding letters of credit at March 31, 2014, primarily in Norway, that are under various bilateral committed letter of credit facilities. Other letters of credit are issued as bid bonds and performance bonds.
The fair value of the Company’s debt is estimated using Level 2 inputs in the fair value hierarchy and is based on quoted prices for those or similar instruments. At March 31, 2014 and December 31, 2013, the fair value of the Company’s unsecured Senior Notes approximated $2,999 million and $2,896 million, respectively. At both March 31, 2014 and December 31, 2013, the carrying value of the Company’s unsecured Senior Notes approximated $3,143 million.
10
8. Tax
The effective tax rate for the three months ended March 31, 2014 was 30.4 %, compared to 30.9 % for the same period in 2013. Compared to the U.S. statutory rate, the effective tax rate was positively impacted in the periods by the effect of lower tax rates on income earned in foreign jurisdictions which are permanently reinvested, foreign exchange gains and losses for tax reporting in Norway, and the deduction in the U.S. for manufacturing activities.
The difference between the effective tax rate reflected in the provision for income taxes and the U.S. federal statutory rate of 35% was as follows (in millions):
| Three Months Ended March 31, |
||||||||
| 2014 | 2013 | |||||||
| Federal income tax at U.S. federal statutory rate |
$ | 276 | $ | 233 | ||||
| Foreign income tax rate differential |
(47 | ) | (57 | ) | ||||
| State income tax, net of federal benefit |
6 | 8 | ||||||
| Nondeductible expenses |
11 | 8 | ||||||
| Tax benefit of manufacturing deduction |
(7 | ) | (8 | ) | ||||
| Foreign dividends, net of foreign tax credits |
9 | 4 | ||||||
| Tax impact of foreign exchange |
(8 | ) | 18 | |||||
| Other |
(1 | ) | (1 | ) | ||||
|
|
|
|
|
|||||
| Provision for income taxes |
$ | 239 | $ | 205 | ||||
|
|
|
|
|
|||||
The balance of unrecognized tax benefits at March 31, 2014 was $127 million, $54 million of which if ultimately realized, would be recorded as an income tax benefit. The Company recognized no material changes in the balance of unrecognized tax benefits for the three months ended March 31, 2014.
The Company does not anticipate that its total unrecognized tax benefits will significantly change due to the settlement of audits or the expiration of statutes of limitation within 12 months of this reporting date.
The Company is subject to taxation in the U.S., various states and foreign jurisdictions. The Company has significant operations in the United States, Canada, the United Kingdom, the Netherlands and Norway. Tax years that remain subject to examination by major tax jurisdiction vary by legal entity, but are generally open in the U.S. for tax years after 2007 and outside the U.S. for tax years after 2005.
To the extent penalties and interest would be assessed on any underpayment of income tax, such accrued amounts have been classified as a component of income tax expense in the financial statements.
11
9. Stock-Based Compensation
The Company has a stock-based compensation plan known as the National Oilwell Varco, Inc. Long-Term Incentive Plan (the “Plan”). The Plan provides for the granting of stock options, performance-based share awards, restricted stock, phantom shares, stock payments and stock appreciation rights. The number of shares authorized under the Plan is 39.5 million. At March 31, 2014, 10,341,009 shares remain available for future grants under the Plan, all of which are available for grants of stock options, performance-based share awards, restricted stock awards, phantom shares, stock payments and stock appreciation rights. Total stock-based compensation for all stock-based compensation arrangements under the Plan was $25 million and $16 million for the three months ended March 31, 2014 and 2013, respectively. The total income tax benefit recognized in the Consolidated Statements of Income for all stock-based compensation arrangements under the Plan was $7 million and $5 million for the three months ended March 31, 2014 and 2013, respectively.
During the three months ended March 31, 2014, the Company granted 3,113,607 stock options with a fair value of $25.60 per share and 426,272 shares of restricted stock and restricted stock units with a fair value of $74.83 per share. In addition, the Company granted performance share awards to senior management employees with potential payouts varying from zero to 436,390 shares. The stock options were granted February 25, 2014 with an exercise price of $74.83. These options generally vest over a three-year period from the grant date. The restricted stock and restricted stock units were granted February 25, 2014 and vest on the third anniversary of the date of grant. The performance share awards were granted on February 25, 2014 and can be earned based on performance against established goals over a three-year performance period. The performance share awards are divided into two equal, independent parts that are subject to two separate performance metrics: 50% with a TSR (total shareholder return) goal (the “TSR Award”) and 50% with an internal ROC (return on capital) goal (the “ROC Award”).
Performance against the TSR goal is determined by comparing the performance of the Company’s TSR with the TSR performance of the members of the OSX index for the three year performance period. Performance against the ROC goal is determined by comparing the performance of the Company’s actual ROC performance average for each of the three years of the performance period against the ROC goal set by the Company’s Compensation Committee.
12
10. Derivative Financial Instruments
ASC Topic 815, “Derivatives and Hedging” (“ASC Topic 815”) requires a company to recognize all of its derivative instruments as either assets or liabilities in the Consolidated Balance Sheet at fair value. The accounting for changes in the fair value (i.e., gains or losses) of a derivative instrument depends on whether it has been designated and qualifies as part of a hedging relationship and further, on the type of hedging relationship. For those derivative instruments that are designated and qualify as hedging instruments, a company must designate the hedging instrument, based upon the exposure being hedged, as a fair value hedge, cash flow hedge, or a hedge of a net investment in a foreign operation.
The Company is exposed to certain risks relating to its ongoing business operations. The primary risk managed by using derivative instruments is foreign currency exchange rate risk. Forward contracts against various foreign currencies are entered into to manage the foreign currency exchange rate risk on forecasted revenues and expenses denominated in currencies other than the functional currency of the operating unit (cash flow hedge). In addition, the Company will enter into non-designated forward contracts against various foreign currencies to manage the foreign currency exchange rate risk on recognized nonfunctional currency monetary accounts (non-designated hedge).
The Company records all derivative financial instruments at their fair value in its Consolidated Balance Sheet. Except for certain non-designated hedges discussed below, all derivative financial instruments that the Company holds are designated as cash flow hedges and are highly effective in offsetting movements in the underlying risks. Such arrangements typically have terms between 2 and 24 months, but may have longer terms depending on the underlying cash flows being hedged, typically related to the projects in our backlog. The Company may also use interest rate contracts to mitigate its exposure to changes in interest rates on anticipated long-term debt issuances.
At March 31, 2014, the Company has determined that the fair value of its derivative financial instruments representing assets of $68 million and liabilities of $24 million (primarily currency related derivatives) are determined using level 2 inputs (inputs other than quoted prices in active markets for identical assets and liabilities that are observable either directly or indirectly for substantially the full term of the asset or liability) in the fair value hierarchy as the fair value is based on publicly available foreign exchange and interest rates at each financial reporting date. At March 31, 2014, the net fair value of the Company’s foreign currency forward contracts totaled a net asset of $44 million.
At March 31, 2014, the Company did not have any interest rate swaps and its financial instruments do not contain any credit-risk-related or other contingent features that could cause accelerated payments when the Company’s financial instruments are in net liability positions. We do not use derivative financial instruments for trading or speculative purposes.
Cash Flow Hedging Strategy
To protect against the volatility of forecasted foreign currency cash flows resulting from forecasted revenues and expenses, the Company has instituted a cash flow hedging program. The Company hedges portions of its forecasted revenues and expenses denominated in nonfunctional currencies with forward contracts. When the U.S. dollar strengthens against the foreign currencies, the decrease in present value of future foreign currency revenues and expenses is offset by gains in the fair value of the forward contracts designated as hedges. Conversely, when the U.S. dollar weakens, the increase in the present value of future foreign currency cash flows is offset by losses in the fair value of the forward contracts.
For derivative instruments that are designated and qualify as a cash flow hedge (i.e., hedging the exposure to variability in expected future cash flows that is subject to a particular currency risk), the effective portion of the gain or loss on the derivative instrument is reported as a component of Other Comprehensive Income and reclassified into earnings in the same line item associated with the forecasted transaction and in the same period or periods during which the hedged transaction affects earnings (e.g., in “revenues” when the hedged transactions are cash flows associated with forecasted revenues). The remaining gain or loss on the derivative instrument in excess of the cumulative change in the present value of future cash flows of the hedged item, if any (i.e., the ineffective portion), or hedge components excluded from the assessment of effectiveness, is recognized in the Consolidated Statements of Income during the current period.
13
The Company had the following outstanding foreign currency forward contracts that were entered into to hedge nonfunctional currency cash flows from forecasted revenues and expenses (in millions):
| Currency Denomination | ||||||||
| Foreign Currency |
March 31, 2014 |
December 31, 2013 |
||||||
| Norwegian Krone |
NOK 10,172 | NOK 10,503 | ||||||
| Euro |
€ | 500 | € | 406 | ||||
| U.S. Dollar |
$ | 443 | $ | 357 | ||||
| Danish Krone |
DKK 266 | DKK 278 | ||||||
| British Pound Sterling |
£ | 52 | £ | 23 | ||||
| Singapore Dollar |
SGD 36 | SGD 17 | ||||||
| Canadian Dollar |
CAD 16 | CAD 16 | ||||||
Non-designated Hedging Strategy
The Company enters into forward exchange contracts to hedge certain nonfunctional currency monetary accounts. The purpose of the Company’s foreign currency hedging activities is to protect the Company from risk that the eventual U.S. dollar equivalent cash flows from the nonfunctional currency monetary accounts will be adversely affected by changes in the exchange rates.
For derivative instruments that are non-designated, the gain or loss on the derivative instrument subject to the hedged risk (i.e., nonfunctional currency monetary accounts) is recognized in other income (expense), net in current earnings.
The Company had the following outstanding foreign currency forward contracts that hedge the fair value of nonfunctional currency monetary accounts (in millions):
| Currency Denomination | ||||||||
| Foreign Currency |
March 31, 2014 |
December 31, 2013 |
||||||
| Norwegian Krone |
NOK 3,866 | NOK 3,257 | ||||||
| Russian Ruble |
RUB 1,786 | RUB 2,149 | ||||||
| U.S. Dollar |
$ | 801 | $ | 715 | ||||
| Danish Krone |
DKK 383 | DKK 177 | ||||||
| Euro |
€ | 381 | € | 310 | ||||
| Singapore Dollar |
SGD 15 | SGD 3 | ||||||
| British Pound Sterling |
£ | 26 | £ | 14 | ||||
| Swedish Krone |
SEK 11 | SEK 4 | ||||||
| Canadian Dollar |
CAD 5 | CAD 3 | ||||||
14
The Company has the following gross fair values of its derivative instruments and their balance sheet classifications:
NATIONAL OILWELL VARCO, INC.
Fair Values of Derivative Instruments
(In millions)
| Asset Derivatives |
Liability Derivatives |
|||||||||||||||||||
| Fair Value | Fair Value | |||||||||||||||||||
| Balance Sheet | March 31, | December 31, | Balance Sheet | March 31, | December 31, | |||||||||||||||
| Location |
2014 | 2013 | Location |
2014 | 2013 | |||||||||||||||
| Derivatives designated as hedging instruments under ASC Topic 815 |
||||||||||||||||||||
| Foreign exchange contracts |
Prepaid and other current assets | $ | 33 | $ | 35 | Accrued liabilities | $ | 8 | $ | 18 | ||||||||||
| Foreign exchange contracts |
Other Assets | 13 | 5 | Other Liabilities | 3 | 9 | ||||||||||||||
|
|
|
|
|
|
|
|
|
|||||||||||||
| Total derivatives designated as hedging instruments under ASC Topic 815 |
$ | 46 | $ | 40 | $ | 11 | $ | 27 | ||||||||||||
|
|
|
|
|
|
|
|
|
|||||||||||||
| Derivatives not designated as hedging instruments under ASC Topic 815 |
||||||||||||||||||||
| Foreign exchange contracts |
Prepaid and other current assets | $ | 21 | $ | 19 | Accrued liabilities | $ | 13 | $ | 13 | ||||||||||
| Foreign exchange contracts |
Other Assets | 1 | — | Other Liabilities | — | — | ||||||||||||||
|
|
|
|
|
|
|
|
|
|||||||||||||
| Total derivatives not designated as hedging instruments under ASC Topic 815 |
$ | 22 | $ | 19 | $ | 13 | $ | 13 | ||||||||||||
|
|
|
|
|
|
|
|
|
|||||||||||||
| Total derivatives |
$ | 68 | $ | 59 | $ | 24 | $ | 40 | ||||||||||||
|
|
|
|
|
|
|
|
|
|||||||||||||
The Effect of Derivative Instruments on the Consolidated Statements of Income
($ in millions)
| Derivatives in ASC Topic 815 Cash Flow Hedging |
Amount of Gain (Loss) Recognized in OCI on Derivative (Effective Portion) (a) |
Location of Gain (Loss) Reclassified from Accumulated OCI into Income (Effective Portion) |
Amount of Gain (Loss) Reclassified from Accumulated OCI into Income (Effective Portion) |
Location of Gain (Loss) Recognized in Income on Derivative (Ineffective Portion and Amount Excluded from Effectiveness Testing) |
Amount of Gain (Loss) Recognized in Income on Derivative (Ineffective Portion and Amount Excluded from Effectiveness Testing) (b) |
|||||||||||||||||||||||
| Three Months Ended March 31, |
Three Months Ended March 31, |
Three Months Ended March 31, |
||||||||||||||||||||||||||
| 2014 | 2013 | 2014 | 2013 | 2014 | 2013 | |||||||||||||||||||||||
| Revenue | 13 | 2 | ||||||||||||||||||||||||||
| Foreign exchange contracts |
35 | (61 | ) | Cost of revenue | (3 | ) | 3 | Other income (expense), net | 13 | 3 | ||||||||||||||||||
|
|
|
|
|
|
|
|
|
|
|
|
|
|||||||||||||||||
| Total |
35 | (61 | ) | 10 | 5 | 13 | 3 | |||||||||||||||||||||
|
|
|
|
|
|
|
|
|
|
|
|
|
|||||||||||||||||
| (a) | The Company expects that $(19) million of the Accumulated Other Comprehensive Income (Loss) will be reclassified into earnings within the next twelve months with an offset by gains from the underlying transactions resulting in no impact to earnings or cash flow. |
| (b) | The amount of gain (loss) recognized in income represents nil related to the ineffective portion of the hedging relationships for each of the three months ended March 31, 2014 and 2013, respectively, and $13 million and $3 million related to the amount excluded from the assessment of the hedge effectiveness for the three months ended March 31, 2014 and 2013, respectively. |
15
11. Net Income Attributable to Company Per Share
The following table sets forth the computation of weighted average basic and diluted shares outstanding (in millions, except per share data):
| Three Months Ended March 31, |
||||||||
| 2014 | 2013 | |||||||
| Numerator: |
||||||||
| Income from continuing operations |
$ | 548 | $ | 461 | ||||
|
|
|
|
|
|||||
| Income from discontinued operations |
$ | 41 | $ | 41 | ||||
|
|
|
|
|
|||||
| Net income attributable to Company |
$ | 589 | $ | 502 | ||||
|
|
|
|
|
|||||
| Denominator: |
||||||||
| Basic—weighted average common shares outstanding |
428 | 426 | ||||||
| Dilutive effect of employee stock options and other unvested stock awards |
1 | 2 | ||||||
|
|
|
|
|
|||||
| Diluted outstanding shares |
429 | 428 | ||||||
|
|
|
|
|
|||||
| Per share data: |
||||||||
| Basic: |
||||||||
| Income from continuing operations |
$ | 1.28 | $ | 1.08 | ||||
|
|
|
|
|
|||||
| Income from discontinued operations |
$ | 0.10 | $ | 0.10 | ||||
|
|
|
|
|
|||||
| Net income attributable to Company |
$ | 1.38 | $ | 1.18 | ||||
|
|
|
|
|
|||||
| Diluted: |
||||||||
| Income from continuing operations |
$ | 1.28 | $ | 1.08 | ||||
|
|
|
|
|
|||||
| Income from discontinued operations |
$ | 0.09 | $ | 0.09 | ||||
|
|
|
|
|
|||||
| Net income attributable to Company |
$ | 1.37 | $ | 1.17 | ||||
|
|
|
|
|
|||||
| Cash dividends per share |
$ | 0.26 | $ | 0.13 | ||||
|
|
|
|
|
|||||
ASC Topic 260, “Earnings Per Share” (“ASC Topic 260”) requires companies with unvested participating securities to utilize a two-class method for the computation of Net income attributable to Company per share. The two-class method requires a portion of Net income attributable to Company to be allocated to participating securities, which are unvested awards of share-based payments with non-forfeitable rights to receive dividends or dividend equivalents, if declared. Net income attributable to Company allocated to these participating securities was immaterial for three months ended March 31, 2014 and 2013 and therefore not excluded from Net income attributable to Company per share calculation.
In addition, the Company had stock options outstanding that were anti-dilutive totaling 10 million and 7 million shares for the three months ended March 31, 2014 and 2013, respectively.
12. Cash Dividends
On February 26, 2014, the Company’s Board of Directors approved a cash dividend of $0.26 per share. The cash dividend was paid on March 28, 2014, to each stockholder of record on March 14, 2014. Cash dividends aggregated $111 million and $56 million for the three months ended March 31, 2014 and 2013, respectively. The declaration and payment of future dividends is at the discretion of the Company’s Board of Directors and will be dependent upon the Company’s results of operations, financial condition, capital requirements and other factors deemed relevant by the Company’s Board of Directors.
16
13. Commitments and Contingencies
We have received federal grand jury subpoenas and subsequent inquiries from governmental agencies requesting records related to our compliance with export trade laws and regulations. We have cooperated fully with agents from the U.S. Department of Justice (“DOJ”), the Department of Commerce Bureau of Industry and Security (“BIS”), the United States Department of Treasury, Office of Foreign Assets Control (“OFAC”), and U.S. Immigration and Customs Enforcement in responding to the inquiries. We have also cooperated with an informal inquiry from the Securities and Exchange Commission in connection with the inquiries previously made by the aforementioned federal agencies. We have conducted our own internal review of this matter. At the conclusion of our internal review in the fourth quarter of 2009, we identified possible areas of concern and discussed these areas of concern with the relevant agencies. We are currently negotiating a potential resolution with the agencies involved related to these matters. We currently anticipate that any administrative fine or penalty agreed to as part of a resolution would be within established accruals, and would not have a material effect on our financial position or results of operations. To the extent a resolution is not negotiated, we cannot predict the timing or effect that any resulting government actions may have on our financial position or results of operations.
On February 20, 2013, the Company acquired Robbins & Myers, Inc. (“R&M”). R&M was subject to an ongoing investigation by the DOJ and the BIS regarding potential export controls violations arising from certain shipments by R&M’s Belgian subsidiary to one customer in Iran, Sudan and Syria in 2005 and 2006. R&M has cooperated with the investigation and is currently negotiating a joint settlement with the DOJ and BIS. We currently anticipate that any administrative fine or criminal penalty agreed to as part of a resolution would be within established accruals, and would not have a material effect on our financial position or results of operations. To the extent a resolution is not negotiated, we cannot predict the timing or effect that any resulting government actions may have on our financial position or results of operations.
In addition, we are involved in various other claims, regulatory agency audits and pending or threatened legal actions involving a variety of matters. As of March 31, 2014, the Company recorded an immaterial amount for contingent liabilities representing all contingencies believed to be probable. The Company has also assessed the potential for additional losses above the amounts accrued as well as potential losses for matters that are not probable but are reasonably possible. The total potential loss on these matters cannot be determined; however, in our opinion, any ultimate liability, to the extent not otherwise provided for and except for the specific cases referred to above, will not materially affect our financial position, cash flow or results of operations. As it relates to the specific cases referred to above we currently anticipate that any administrative fine or penalty agreed to as part of a resolution would be within established accruals, and would not have a material effect on our financial position or results of operations. To the extent a resolution is not negotiated as anticipated, we cannot predict the timing or effect that any resulting government actions may have on our financial position, cash flow or results of operations. These estimated liabilities are based on the Company’s assessment of the nature of these matters, their progress toward resolution, the advice of legal counsel and outside experts as well as management’s intention and experience.
Our business is affected both directly and indirectly by governmental laws and regulations relating to the oilfield service industry in general, as well as by environmental and safety regulations that specifically apply to our business. Although we have not incurred material costs in connection with our compliance with such laws, there can be no assurance that other developments, such as new environmental laws, regulations and enforcement policies hereunder may not result in additional, presently unquantifiable, costs or liabilities to us.
14. Recently Issued Accounting Standards
In April 2014, the Financial Accounting Standards Board issued Accounting Standard Update No. 2014-08 “Reporting Discontinued Operations and Disclosures of Disposals of Components of and Entity” (ASU No. 2014-08), which is an update for Accounting Standards Codification Topic No. 205 “Presentation of Financial Statements” and Topic No. 360 “Property, Plant and Equipment’. This update changes the requirements of reporting discontinued operations. Under the amended guidance, a disposal of a component of an entity or a group of components of an entity is required to be reported in discontinued operations if the disposal represents a strategic shift that has (or will have) a major effect on an entity’s operations and financial results. The amendments in this update are effective for all disposals (or classifications as held for sale) of components of an entity that occur within annual periods beginning on or after December 15, 2014, and interim periods within those years, with early adoption permitted. The adoption of this update concerns presentation and disclosure only as it relates to our consolidated financial statements. The Company is currently assessing the impact of ASU No. 2014-08 on its consolidated financial position and results of operations.
17
15. Spin-off of distribution business
On May 30, 2014, the Company completed the previously announced spin-off (the “spin-off”) of its distribution business into an independent public company named NOW Inc., which trades on the New York Stock Exchange under the symbol “DNOW”. After the close of the New York Stock Exchange on May 30, 2014, the stockholders of record as of May 22, 2014 (the “Record Date”) received one share of NOW Inc. common stock for every four shares of NOV common stock held on the Record Date. No fractional shares of NOW Inc. common stock were distributed. Instead, the transfer agent aggregated any fractional shares into whole shares, sold those whole shares in the open market at prevailing rates and distributed the net cash proceeds, after deducting any taxes required to be withheld and any amount equal to all brokerage charges and commissions, pro rata to each holder who would otherwise have been entitled to receive fractional shares in the distribution.
In order to effect the spin-off and govern its relationship with NOW after the spin-off, the Company entered into a Separation and Distribution Agreement, a Tax Matters Agreement, an Employee Matters Agreement, a Transition Services Agreement, a Master Distributor Agreement, and a Master Services Agreement. The Separation and Distribution Agreement governs the terms of the separation of the distribution business from NOV’s other businesses. Generally, the Separation and Distribution Agreement includes agreements between NOW and NOV relating to the restructuring steps needed to be taken to complete the separation, including the assets, equity interests and rights to be transferred, liabilities to be assumed, contracts to be assigned and related matters. The Separation and Distribution Agreement also governs the treatment of aspects relating to indemnification, insurance, litigation responsibility, confidentiality, management, intellectual property (including trademarks) and cooperation.
The Tax Matters Agreement governs respective rights, responsibilities and obligations of NOV and NOW with respect to deficiencies and refunds, if any, of federal, state, local, and foreign taxes for periods before and after the distribution, as well as taxes attributable to the separation and distribution, and related matters such as the filing of tax returns and the conduct of IRS and other audits. In addition, the Tax Matters Agreement imposes certain restrictions on NOW and its subsidiaries (including restrictions on share issuances, business combinations, sales of assets and similar transactions) that are designed to preserve the generally tax-free status of the separation and distribution.
The Employee Matters Agreement governs the compensation and employee benefit obligations with respect to the current and former employees of NOV and NOW and generally allocates liabilities and responsibilities relating to employee compensation and benefit plans and programs. The Employee Matters Agreement provides for the treatment of outstanding NOV equity awards. The Employee Matters Agreement also sets forth the general principles relating to employee matters, including with respect to the assignment of employees and the transfer of employees from us to NOW, the assumption and retention of liabilities and related assets, expense reimbursements, workers’ compensation, leaves of absence, the provision of comparable benefits, employee service credits, the sharing of employee information and the duplication or acceleration of benefits.
The Transition Services Agreement sets forth the terms on which NOV will provide to NOW, and NOW will provide to NOV, on a temporary basis, certain services or functions that the companies historically have shared. Transition services may include administrative, payroll, human resources, data processing, environmental health and safety, financial audit support, financial transaction support, legal support services, IT and network infrastructure systems and various other support and corporate services. The Transition Services Agreement provides for the provision of specified transition services generally for a period of up to 18 months.
The Master Distributor Agreement provides that NOW will act as a distributor of certain of NOV’s products. Under the Master Supply Agreement, NOW will supply products and provide solutions, including supply chain management solutions, to NOV.
The following table presents the carrying value of assets and liabilities of NOW (in millions):
| March 31, 2014 |
December 31, 2013 |
|||||||
| Current assets: |
||||||||
| Cash and cash equivalents |
$ | 175 | $ | 101 | ||||
| Receivables, net |
754 | 661 | ||||||
| Inventories, net |
839 | 850 | ||||||
| Deferred income taxes |
29 | 21 | ||||||
| Prepaid and other current assets |
29 | 29 | ||||||
|
|
|
|
|
|||||
| Total current assets of discontinued operations |
1,826 | 1,662 | ||||||
| Property, plant and equipment, net |
104 | 102 | ||||||
| Deferred income taxes |
15 | 15 | ||||||
| Goodwill |
330 | 333 | ||||||
| Intangibles, net |
67 | 68 | ||||||
| Other assets |
1 | 3 | ||||||
|
|
|
|
|
|||||
| Total assets of discontinued operations |
$ | 2,343 | $ | 2,183 | ||||
|
|
|
|
|
|||||
| Current liabilities: |
||||||||
| Accounts payable |
$ | 313 | $ | 264 | ||||
| Accrued liabilities |
100 | 99 | ||||||
| Accrued income taxes |
7 | — | ||||||
|
|
|
|
|
|||||
| Total current liabilities of discontinued operations |
420 | 363 | ||||||
| Deferred income taxes |
17 | 16 | ||||||
| Other liabilities |
2 | 2 | ||||||
|
|
|
|
|
|||||
| Total liabilities of discontinued operations |
$ | 439 | $ | 381 | ||||
|
|
|
|
|
|||||
The following table presents selected financial information regarding the results of operations of our distribution business, which is reported as discontinued operations (in millions):
| Three Months Ended March 31, |
||||||||
| 2014 | 2013 | |||||||
| Revenue from discontinued operations |
$ | 1,077 | $ | 1,072 | ||||
|
|
|
|
|
|||||
| Income from discontinued operations before income taxes |
62 | 60 | ||||||
|
|
|
|
|
|||||
| Income tax expense |
21 | 19 | ||||||
|
|
|
|
|
|||||
| Income from discontinued operations |
$ | 41 | $ | 41 | ||||
|
|
|
|
|
|||||
Prior to the spin-off, sales to NOW were $140 million and $109 million for the three months ended March 31, 2014 and 2013, respectively. Prior to the spin-off, purchases from NOW were $50 million and $31 million for the three months ended March 31, 2014 and 2013, respectively. Prior to May 30, 2014, the spin-off date, revenue and related cost of revenue were eliminated in consolidation between NOV and NOW. Beginning May 31, 2014, this revenue and cost of revenue represent third-party transactions with NOW.
18
Item 2. Management’s Discussion and Analysis of Financial Condition and Results of Operations
Introduction
National Oilwell Varco, Inc. (the “Company”) is a worldwide leader in the design, manufacture and sale of equipment and components used in oil and gas drilling and production, the provision of oilfield services, and supply chain integration services to the upstream oil and gas industry.
Unless indicated otherwise, results of operations data are presented in accordance with accounting principles generally accepted in the United States (“GAAP”). In an effort to provide investors with additional information regarding our results of operations, certain non-GAAP financial measures, including operating profit excluding other costs, operating profit percentage excluding other costs and diluted earnings per share excluding other costs, are provided. See Non-GAAP Financial Measures and Reconciliations in Results of Operations for an explanation of our use of non-GAAP financial measures and reconciliations to their corresponding measures calculated in accordance with GAAP.
Rig Systems
The Company’s Rig Systems segment makes and supports the capital equipment and integrated systems needed to drill oil and gas wells on land and offshore. The segment designs, manufactures, and sells land rigs, offshore drilling equipment packages, including installation and commissioning services, and drilling rig components that mechanize and automate the rig process and functionality.
Equipment and technologies in Rig Systems include: substructures, derricks, and masts; cranes; pipe lifting, racking, rotating, and assembly systems; fluid transfer technologies, such as mud pumps; pressure control equipment, including blowout preventers; power transmission systems, including drives and generators; and rig instrumentation and control systems.
The Rig Systems segment primarily supports land and offshore drillers. Demand for Rig Systems products primarily depends on drilling contractors’ and oil and gas companies’ capital spending plans, specifically capital expenditures on rig construction and refurbishment.
Rig Aftermarket
The Company’s Rig Aftermarket segment provides comprehensive aftermarket products and services to support land rigs and offshore rigs, and drilling rig components manufactured by the Rig Systems segment.
The segment provides spare parts, repair, and rentals as well as technical support, field service and first well support, field engineering, and customer training through a network of aftermarket service and repair facilities strategically located in major areas of drilling operations.
The Rig Aftermarket segment primarily supports land and offshore drillers. Demand for Rig Aftermarket products and services primarily depends on overall levels of oilfield drilling activity, which drives demand for spare parts, service, and repair for Rig System’s large installed base of equipment; and secondarily on drilling contractors’ and oil and gas companies’ capital spending plans, specifically capital expenditures on rig refurbishment and re-certification.
Wellbore Technologies
The Company’s Wellbore Technologies segment designs, manufactures, rents, and sells a variety of equipment and technologies used to perform drilling operations, and offers services that optimize their performance, including: solids control and waste management equipment and services, drilling fluids, premium drill pipe, wired pipe, tubular inspection and coating services, instrumentation, downhole tools, and drill bits.
The Wellbore Technologies segment focuses on oil and gas companies and supports drilling contractors, oilfield service companies, and oilfield rental companies. Demand for Wellbore Technologies products and services primarily depends on the level of oilfield drilling activity by oil and gas companies, drilling contractors, and oilfield service companies.
19
Completion & Production Solutions
The Company’s Completion & Production Solutions segment integrates technologies for well completions and oil and gas production. The segment designs, manufactures, and sells equipment and technologies needed for hydraulic fracture stimulation, including pressure pumping trucks and pumps, blenders, sanders, hydration units, injection units, flowline, manifolds and wellheads; well intervention, including coiled tubing units, coiled tubing, and wireline units and tools; onshore production, including composite pipe, surface transfer and progressive cavity pumps, and artificial lift systems; and offshore production, including floating production systems and subsea production technologies.
The Completion & Production Solutions segment primarily supports service companies and oil and gas companies. Demand for Completion & Production Solutions products depends on the level of oilfield completions and workover activity by oilfield service companies and drilling contractors and capital spending plans by oil and gas companies and oilfield service companies.
Critical Accounting Policies and Estimates
In our annual report on Form 10-K for the year ended December 31, 2013, we identified our most critical accounting policies. In preparing the financial statements, we make assumptions, estimates and judgments that affect the amounts reported. We periodically evaluate our estimates and judgments that are most critical in nature which are related to revenue recognition under long-term construction contracts; allowance for doubtful accounts; inventory reserves; impairment of long-lived assets (excluding goodwill and other indefinite-lived intangible assets); goodwill and other indefinite-lived intangible assets; purchase price allocation of acquisitions; service and product warranties; and income taxes. Our estimates are based on historical experience and on our future expectations that we believe are reasonable. The combination of these factors forms the basis for making judgments about the carrying values of assets and liabilities that are not readily apparent from other sources. Actual results are likely to differ from our current estimates and those differences may be material.
20
EXECUTIVE SUMMARY
For its first quarter ended March 31, 2014, the Company generated $548 million in income from continuing operations, or $1.28 per fully diluted share, on $4.9 billion in revenue. Compared to the fourth quarter of 2013, revenue decreased $413 million or 8% and income from continuing operations decreased $82 million or 13%. Compared to the first quarter of 2013, revenue increased $513 million or 12%, and income from continuing operations increased $89 million or 19%.
The first quarter of 2014 included pre-tax other costs of $18 million, the fourth quarter of 2013 included pre-tax other costs of $16 million, and the first quarter of 2013 included pre-tax other costs of $64 million. Excluding the other costs and pre-tax gains from all periods, first quarter 2014 earnings from continuing operations were $1.29 per fully diluted share, compared to $1.49 per fully diluted share in the fourth quarter of 2013 and $1.19 per fully diluted share in the first quarter of 2013.
Pre-tax other costs of $18 million, $16 million, and $72 million for the first quarter of 2014, the fourth quarter of 2013 and the first quarter of 2013, respectively, included costs related to legal, acquisition, DNOW spinoff and the amortization of backlog and inventory that was stepped up to fair value during purchase accounting.
Operating profit, excluding other costs, was $817 million or 16.7% of sales in the first quarter of 2014, compared to $925 million or 17.4% of sales in the fourth quarter of 2013, and $757 million or 17.3% of sales in the first quarter of 2013.
Oil & Gas Equipment and Services Market
Worldwide, developed economies turned down in late 2008 as looming housing-related asset write-downs at major financial institutions paralyzed credit markets and sparked a serious global banking crisis. Major central banks responded vigorously through 2009, but a credit-driven worldwide economic recession developed nonetheless. Developed economies struggled to recover throughout 2010 and 2011, facing additional economic weakness related to potential sovereign debt defaults in Europe. As a result, commodity prices, including oil and gas prices, have been volatile. During the first quarter of 2009, oil prices averaged $43 per barrel, but slowly recovered into the $100 per barrel range by mid-2011 where they held relatively steady since (although the fourth quarter of 2012 dipped to average $88 per barrel). As a result of relatively high and stable oil prices, oil-drilling activity over the past two years has increased. In the third quarter of 2009, North American gas prices declined to average $3.17 per mmbtu. Gas prices recovered modestly, trading up above $5 six months later, but then slowly settled into the $3 to $4 per mmbtu through 2011 before turning down sharply in early 2012 to the $2 range. However, the average quarterly price per mmbtu climbed steadily since the second quarter of 2012 to an average of $5.18 per mmbtu in the first quarter of 2014 significantly up from a full year 2013 average of $3.72 per mmbtu. Recent price upticks seem to be a product of relatively colder weather; and, as a result, the supply of natural gas stockpiles diminishing.
The count of rigs actively drilling in the U.S. as measured by Baker Hughes (a good measure of the level of oilfield activity and spending) decreased to a low of 876 in June, 2009 as many oil and gas operators, reliant on external financing to fund their drilling programs, significantly curtailed their drilling activity. As commodity prices improved, the U.S. rig count increased steadily to 2,026 by late 2011, but began to decline to average 1,781 rigs during the first quarter of 2014. Recently low gas prices have caused operators to trim drilling, driving the average U.S. gas rig count down 61% from the fourth quarter of 2011, to an average of 345 in the first quarter of 2014. However, with high oil prices, many have redirected drilling efforts towards unconventional shale plays targeting oil, rather than gas. For the first quarter of 2014, oil-directed drilling rose above 80% of the total domestic drilling effort, and remains at its highest levels in the U.S. since the early 1980’s.
Most international activity is driven by oil exploration and production by national oil companies, which has historically been less susceptible to short-term commodity price swings; but, the international rig count exhibited modest declines nonetheless, falling from its 1,108 in September 2008 to 947 in August 2009. Since that decline, international drilling activity has increased and averaged 1,337 rigs in the first quarter of 2014.
During 2009 the Company saw its Wellbore Technologies and Completion & Production Solutions margins affected most acutely by a drilling downturn, through both volume and price declines. Resumption of drilling activity since enabled both of these segments to gain volume, stabilize and lift pricing, and improve margins over 2009 results. The Company’s Rig Systems segment was less impacted by the 2009 downturn owing to its high level of contracted backlog, which it executed well. It posted higher revenues and operating profits in 2009 than 2008 as a result. The segment’s revenues decreased in 2010 as its backlog declined, remained relatively flat in 2011, and rose 24% year-over-year in 2012 as orders for new offshore rigs increased.
The economic decline beginning in late 2008 followed an extended period of high drilling activity which fueled strong demand for oilfield services between 2003 and 2008. Incremental drilling activity through the upswing shifted toward harsh environments, employing increasingly sophisticated technology to find and produce reserves. Higher utilization of drilling rigs
21
tested the capability of the world’s fleet of rigs, much of which is old and of limited capability. Technology has advanced significantly since most of the existing rig fleet was built. The industry invested little during the late 1980’s and 1990’s on new drilling equipment, but drilling technology progressed steadily nonetheless, as the Company and its competitors continued to invest in new and better ways of drilling. As a consequence, the safety, reliability, and efficiency of new, modern rigs surpass the performance of most of the older rigs at work today. Drilling rigs are now being pushed to drill deeper wells, more complex wells, highly deviated wells and horizontal wells, tasks which require larger rigs with more capabilities. The drilling process effectively consumes the mechanical components of a rig, which wear out and need periodic repair or replacement. This process was accelerated by very high rig utilization and wellbore complexity. Drilling consumes rigs; more complex and challenging drilling consumes rigs faster.
The industry responded by launching many new rig construction projects since 2005, to 1.) retool the existing fleet of jackup rigs, 2.) replace older mechanical and DC electric land rigs with improved AC power, electronic controls, automatic pipe handling and rapid rigup and rigdown technology; and 3.) build out additional deepwater floating drilling rigs, including semisubmersibles and drillships, to employ recent advancements in deepwater drilling to exploit unexplored deepwater basins. We believe that the newer rigs offer considerably higher efficiency, safety, and capability, and that many will effectively replace a portion of the existing fleet.
As a result of the credit crisis and slowing drilling activity in 2009, orders in the Rig Systems segment declined below amounts flowing out of backlog as revenue, causing the segment’s backlog to decline to $4.4 billion by the end of 2010. Since 2010 lows, the backlog increased steadily as drillers ordered more than the Company shipped out of backlog, and the segment finished the first quarter of 2014 at a record $15.1B. Of this backlog, 94% of the total is for equipment destined for offshore operations, with 6% destined for land. Equipment destined for international markets totaled 94% of the backlog.
Manufacturing lead time for orders in the Completion and Production Solutions segment’s backlog is considerably shorter than that of the orders in Rig System’s backlog. This segment’s backlog has increased since 2009 as levels of drilling activity worldwide moved higher. Backlog in this segment was $1.6B at the end of the first quarter of 2014. Of the $1.6B, 65% of the total is for equipment destined for offshore operations, with 35% destined for land. Equipment destined for international markets totaled 81%.
Segment Performance
The Rig Systems segment generated $2.3 billion in revenues and $451 million in operating profit or 20.0% of sales in the first quarter of 2014. Compared to the prior quarter, revenues decreased $141 million, and operating profit decreased $2 million, representing 1% decremental operating leverage. Compared to the first quarter of 2013, segment revenues grew $345 million or 18%, and operating profit increased $81 million, representing 23% incremental leverage. The segments margins have moved down steadily since mid-2010 due to an adverse mix shift in the segment, the addition of lower-margin acquisitions, and incremental expenses to support several strategic growth initiatives. The mix shift arises from offshore projects contracted at high prices in 2007 and 2008, which were subsequently manufactured in low cost environments in 2009 and 2010, resulting in high margins for the group which peaked in the third quarter of 2010. As these projects have been completed and replaced with lower priced projects, margins have gradually declined. Margins have also been negatively impacted by the compression of delivery schedules from our shipyard customers, which have challenged the limits of our supply chain and increased our overall project costs. First quarter 2014 revenue out of backlog for the Rig Systems segment declined 8% in comparison to the fourth quarter of 2013, but increased 18% year-over-year. Orders for three deepwater floating rig equipment packages, and seventeen drilling equipment packages for jackup rigs, contributed to total order additions to the segment’s backlog of $2.1 billion during the first quarter of 2014.
The Rig Aftermarket segment generated $750 million in revenues and $191 million in operating profit or 25.5% of sales in the first quarter of 2014. Compared to the prior quarter, revenues decreased $9 million, and operating profit decreased $5 million, representing 56% decremental operating leverage. Compared to the first quarter of 2013, segment revenues grew $199 million or 36%, and operating profit increased $49 million, representing 25% incremental leverage. Year-over-year revenue and operating profit growth is mainly attributable to increased demand for spare parts, repairs and services along with continued investments in capacity expansions.
The Wellbore Technologies segment generated $1.3 billion in revenue and $221 million in operating profit, or 17.3% of sales, for the first quarter of 2014. Compared to the prior quarter, revenue decreased $93 million or 7%, and operating profit decreased $22 million, representing 24% decremental operating leverage. Revenues were down sequentially as large year-end shipments of drill pipe, downhole tools and solids control equipment did not repeat in the first quarter of 2014. Compared to the first quarter of 2013, revenues increased $55 million, and operating profit increased $39 million, representing 71% incremental leverage. Both revenues and operating profit were positively influenced by a higher average rig count year-over-year and the fact that our customers have worked through the excess inventory they carried into early 2013.
22
The Completion and Production Solutions segment generated $1.0 billion in revenue and $137 million in operating profit or 13.7% of sales during the first quarter of 2014. Sequentially, revenues decreased $153 million or 13% from the fourth quarter of 2013, and operating profit decreased $38 million, representing 25% decremental leverage. The sequential revenue decline was due to fewer shipments of subsea flexible pipe and well stimulation equipment, both of which had large order shipments at the end of 2013. Compared to the first quarter of 2013, revenues were flat, and operating profit increased $1 million. Year-over-year the segment experienced similar results as contributions from acquisitions and higher sales of offshore production equipment were offset by decreased demand for land related pressure pumping equipment and coiled tubing units.
Outlook
Following the credit market downturn, global recession, and lower commodity prices of 2009, we saw signs of stabilization and recovery in many of our markets in 2010 and into 2011, led by higher drilling activity in North America and slowly improving international drilling activity. Order levels for new deepwater drilling rigs have rebounded, and the Rig Systems segment continues to experience a high level of interest as dayrates for deepwater offshore rigs remain high. Still, margins, which were 20.0% in the first quarter of 2014, may continue to be challenged to expand beyond current levels due to a soft outlook for land drilling, low gas and natural gas liquids prices, higher costs of execution due to significantly compressed project timelines, continued flow through of lower priced projects, and incremental expenses incurred to support long-term strategic growth initiatives. As the fleet of rigs worldwide continues to grow, and with the majority of those rigs equipped with NOV products, we are confident that our Aftermarket business will continue to supply more spare parts, servicing and repair to the fleet. Strict regulatory drilling requirements worldwide will keep demand for the segment’s offerings at high levels.
Our outlook for the Company’s Wellbore Technologies segment and Completion and Production Solutions segment remains closely tied to the rig count, particularly in North America. Average U.S. rig count during the first quarter of 2014 saw modest gains of 1% compared to both the fourth and first quarters of 2013. The first quarter of 2014 saw average Canadian rig count improve 39% sequentially but remain relatively flat year-over-year. As a result, revenues for both segments improved sequentially in Canada. Domestic land drilling and well service firms are increasing activity, which is leading to increased demand for drilling and stimulation equipment to develop unconventional shales. However, for both the U.S. and Canada, pricing and volumes remain stressed as pressure pumpers, drilling contractors and oil companies reduce operating and capital expenditures. Additionally, economic weakness may pressure oil prices, which could lead to further activity declines, particularly among North American operators which may rely on cash flows from gas production and/or external financing to fund their drilling operations. In contrast, activity generally seems to be continuing to increase in most international markets outside North America.
The Company believes it is well positioned, and should benefit from its strong balance sheet and capitalization, access to credit, global infrastructure, broad product and service offering, installed base of equipment, and a record level of contracted orders. In the event of a market downturn, the Company also believes that its long history of cost-control and downsizing in response to slowing market conditions, and of executing strategic acquisitions during difficult periods will enable it to capitalize on new opportunities.
23
Operating Environment Overview
The Company’s results are dependent on, among other things, the level of worldwide oil and gas drilling, well remediation activity, the prices of crude oil and natural gas, capital spending by other oilfield service companies and drilling contractors, and worldwide oil and gas inventory levels. Key industry indicators for the first quarter of 2014 and 2013, and the fourth quarter of 2013 include the following:
| % | % | |||||||||||||||||||
| 1Q14 v | 1Q14 v | |||||||||||||||||||
| 1Q14* | 1Q13* | 4Q13* | 1Q13 | 4Q13 | ||||||||||||||||
| Active Drilling Rigs: |
||||||||||||||||||||
| U.S. |
1,781 | 1,758 | 1,757 | 1.3 | % | 1.4 | % | |||||||||||||
| Canada |
526 | 536 | 378 | (1.9 | %) | 39.2 | % | |||||||||||||
| International |
1,337 | 1,274 | 1,321 | 4.9 | % | 1.2 | % | |||||||||||||
|
|
|
|
|
|
|
|
|
|
|
|||||||||||
| Worldwide |
3,644 | 3,568 | 3,456 | 2.1 | % | 5.4 | % | |||||||||||||
| West Texas Intermediate Crude Prices (per barrel) |
$ | 98.75 | $ | 94.34 | $ | 97.34 | 4.7 | % | 1.4 | % | ||||||||||
| Natural Gas Prices ($/mmbtu) |
$ | 5.18 | $ | 3.49 | $ | 3.84 | 48.4 | % | 34.9 | % | ||||||||||
| * | Averages for the quarters indicated. See sources below. |
The following table details the U.S., Canadian, and international rig activity and West Texas Intermediate Oil prices for the past nine quarters ended March 31, 2014, on a quarterly basis:
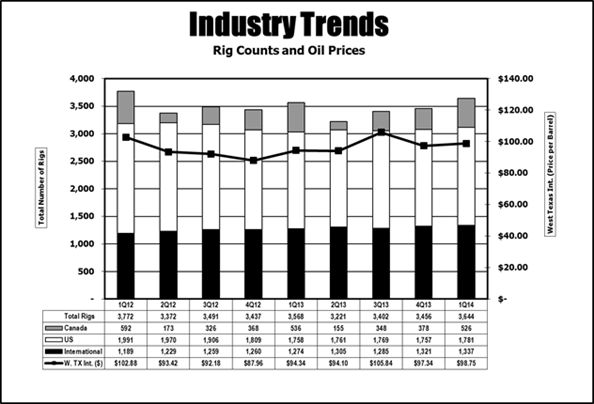
Source: Rig count: Baker Hughes, Inc. (www.bakerhughes.com); West Texas Intermediate Crude and Natural Gas Prices: Department of Energy, Energy Information Administration (www.eia.doe.gov).
24
The worldwide quarterly average rig count increased 5.4% (from 3,456 to 3,644) and the U.S. increased 1.4% (from 1,757 to 1,781), in the first quarter of 2014 compared to the fourth quarter of 2013. The average per barrel price of West Texas Intermediate Crude increased 1.4% (from $97.34 per barrel to $98.75 per barrel) and natural gas prices increased 34.9% (from $3.84 per mmbtu to $5.18 per mmbtu) in the first quarter of 2014 compared to the fourth quarter of 2013.
U.S. rig activity at April 25, 2014 was 1,861 rigs increased four percent compared to the first quarter average of 1,781 rigs. The price for West Texas Intermediate Crude was at $100.60 per barrel at April 25, 2014, increasing two percent from the first quarter average. The price for natural gas was at $4.65 per mmbtu at April 25, 2014, decreasing 10 percent from the first quarter average.
Results of Operations
Operating results by segment are as follows (in millions):
| Three Months Ended March 31, |
||||||||
| 2014 | 2013 | |||||||
| Revenue: |
||||||||
| Rig Systems |
$ | 2,256 | $ | 1,911 | ||||
| Rig Aftermarket |
750 | 551 | ||||||
| Wellbore Technologies |
1,278 | 1,223 | ||||||
| Completion & Production Solutions |
1,002 | 1,002 | ||||||
| Eliminations |
(397 | ) | (311 | ) | ||||
|
|
|
|
|
|||||
| Total Revenue |
$ | 4,889 | $ | 4,376 | ||||
|
|
|
|
|
|||||
| Operating Profit: |
||||||||
| Rig Systems |
$ | 451 | $ | 370 | ||||
| Rig Aftermarket |
191 | 142 | ||||||
| Wellbore Technologies |
221 | 182 | ||||||
| Completion & Production Solutions |
137 | 136 | ||||||
| Unallocated expenses and eliminations |
(201 | ) | (137 | ) | ||||
|
|
|
|
|
|||||
| Total Operating Profit |
$ | 799 | $ | 693 | ||||
|
|
|
|
|
|||||
| Operating Profit %: |
||||||||
| Rig Systems |
20.0 | % | 19.4 | % | ||||
| Rig Aftermarket |
25.5 | % | 25.8 | % | ||||
| Wellbore Technologies |
17.3 | % | 14.9 | % | ||||
| Completion & Production Solutions |
13.7 | % | 13.6 | % | ||||
| Total Operating Profit % |
16.3 | % | 15.8 | % | ||||
Rig Systems
Three Months Ended March 31, 2014 and 2013. Revenue from Rig Systems was $2,256 million for the three months ended March 31, 2014, compared to $1,911 million for the three months ended March 31, 2013, an increase of $345 million (18.1%). Additional capacity enabled Rig Systems to generate revenue out of backlog of $1,964 million for the three months ended March 31, 2014, a 18% increase compared to the same period in 2013. Increased demand for land drilling equipment in North America was helped by a first quarter 2014 rig count average of 2,307 rigs slightly higher than the first quarter 2013 average of 2,294 rigs.
Operating profit from Rig Systems was $451 million for the three months ended March 31, 2014 compared to $370 million for the three months ended March 31, 2013, an increase of $81 million (21.9%) from the same period in 2013.Operating profit percentage remained relatively flat at 20.0% as the segment continues to work through lower priced backlog, faces more aggressive delivery schedules and incurs increasing installation and commissioning costs.
25
The Rig Systems segment monitors its capital equipment backlog to plan its business. New orders are added to backlog only when the Company receives a firm written order for major drilling rig components or a signed contract related to a construction project. The capital equipment backlog was $15.2 billion at March 31, 2014, an increase of $3.1 billion (25.8%) from backlog of $12.0 billion at March 31, 2013. At March 31, 2014, approximately 94% of the capital equipment backlog was for offshore products and 6% was for land. In addition, at March 31, 2014, approximately 94% of the capital equipment backlog was for international markets and 6% was for domestic markets.
Rig Aftermarket
Three Months Ended March 31, 2014 and 2013. Revenue from Rig Aftermarket was $750 million for the three months ended March 31, 2014, compared to $551 million for the three months ended March 31, 2013, an increase of $199 million (36.1%). A growing installed base of NOV equipped rigs needing replacement parts and repair work, a fleet that continues to require re-certifications and additional aftermarket work required to comply with post Macondo regulations were the primary driving forces for the increase in revenue for this segment during 2013. Land drilling equipment in North America was helped by a first quarter 2014 rig count average of 2,307 rigs slightly higher than the first quarter 2013 average of 2,294 rigs.
Operating profit from Rig Aftermarket was $191 million for the three months ended March 31, 2014 compared to $142 million for the three months ended March 31, 2013, an increase of $49 million (34.5%). Operating profit percentage decreased in the three months ended March 31, 2014 to 25.5%, from 25.8% in the three months ended March 31, 2013.
Wellbore Technologies
Three Months Ended March 31, 2014 and 2013. Revenue from Wellbore Technologies was $1,278 million for the three months ended March 31, 2014 compared to $1,223 million for the three months ended March 31, 2013, an increase of $55 million (4.5%). This increase is primarily due to a slight strengthening in the U.S. market as well as continued growth internationally and the full quarter effect of Robbins & Myers.
Operating profit from Wellbore Technologies was $221 million for the three months ended March 31, 2014 compared to $182 million for the three months ended March 31, 2013, an increase of $39 million (21.4%). Operating profit percentage increased to 17.3% in the three months ended March 31, 2014, up from 14.9% in the three months ended March 31, 2013. This increase is primarily due to higher volumes and lower integration costs for the three months ended March 31, 2014 compared to the same period in 2013.
Completion & Production Solutions
Three Months Ended March 31, 2014 and 2013. Revenue from Completion & Production Solutions was $1,002 million for both the three months ended March 31, 2014 and March 31, 2013. Declines in revenue for pressure pumping and coiled tubing equipment were offset by an increase in our floating production and process and flow technologies businesses. Additionally we gained revenue from having a full quarter of revenues from the R&M acquisition.
Operating profit from Completion & Production was $137 million for the three months ended March 31, 2014 compared to $136 million for the three months ended March 31, 2013, a slight increase of $1 million. This increase is primarily due to lower integration costs for the three months ended March 31, 2014 compared to the same period in 2013.
Eliminations
Eliminations were $201 million and $137 million for the three months ended March 31, 2014 and 2013, respectively. This increase is primarily due to higher intersegment eliminations. Sales from one segment to another generally are priced at estimated equivalent commercial selling prices; however, segments originating an external sale are credited with the full profit to the company. Eliminations include intercompany transactions conducted between the four reporting segments that are eliminated in consolidation. Intercompany transactions within each reporting segment are eliminated within each reporting segment.
Other income (expense), net
Other income (expense), net were nil and expenses of $23 million for the three months ended March 31, 2014 and 2013, respectively. The decrease in expense is primarily due to exchange rate movements. During the first quarter of 2014, the Company recorded $5 million in currency exchange gains compared to $11 million in losses for the same period in 2013.
26
Provision for income taxes
The effective tax rate for the three months ended March 31, 2014 was 30.4%, compared to 30.9% for the same period in 2013. Compared to the U.S. statutory rate, the effective tax rate was positively impacted in the periods by the effect of lower tax rates on income earned in foreign jurisdictions, foreign exchange losses for tax reporting in Norway, and the deduction in the U.S. for manufacturing activities.
27
Non-GAAP Financial Measures and Reconciliations
In an effort to provide investors with additional information regarding our results as determined by GAAP, we disclose various non-GAAP financial measures in our quarterly earnings press releases and other public disclosures. The primary non-GAAP financial measures we focus on are: (i) operating profit excluding other costs, (ii) operating profit percentage excluding other costs, and (iii) diluted earnings per share excluding other costs. Each of these financial measures excludes the impact of certain other costs and therefore has not been calculated in accordance with GAAP. A reconciliation of each of these non-GAAP financial measures to its most comparable GAAP financial measure is included below.
We use these non-GAAP financial measures internally to evaluate and manage the Company’s operations because we believe it provides useful supplemental information regarding the Company’s on-going economic performance. We have chosen to provide this information to investors to enable them to perform more meaningful comparisons of operating results and as a means to emphasize the results of on-going operations.
The following tables set forth the reconciliations of these non-GAAP financial measures to their most comparable GAAP financial measures (in millions, except per share data):
| Three Months Ended | ||||||||||||
| March 31, | December 31, | |||||||||||
| 2014 | 2013 | 2013 | ||||||||||
| Reconciliation of operating profit: |
||||||||||||
| GAAP operating profit |
$ | 799 | $ | 693 | $ | 909 | ||||||
| Other costs (1): |
||||||||||||
| Rig Systems |
— | 2 | 5 | |||||||||
| Rig Aftermarket |
— | — | — | |||||||||
| Wellbore Technologies |
3 | 26 | 2 | |||||||||
| Completion & Production Solutions |
6 | 36 | 9 | |||||||||
| Eliminations |
9 | — | — | |||||||||
|
|
|
|
|
|
|
|||||||
| Operating profit excluding other costs |
$ | 817 | $ | 757 | $ | 925 | ||||||
|
|
|
|
|
|
|
|||||||
| Three Months Ended | ||||||||||||
| March 31, | December 31, | |||||||||||
| 2014 | 2013 | 2013 | ||||||||||
| Reconciliation of operating profit %: |
||||||||||||
| GAAP operating profit % |
16.3 | % | 15.8 | % | 17.1 | % | ||||||
| Other costs % |
0.4 | % | 1.5 | % | 0.3 | % | ||||||
|
|
|
|
|
|
|
|||||||
| Operating profit % excluding other costs |
16.7 | % | 17.3 | % | 17.4 | % | ||||||
|
|
|
|
|
|
|
|||||||
| Three Months Ended | ||||||||||||
| March 31, | December 31, | |||||||||||
| 2014 | 2013 | 2013 | ||||||||||
| Reconciliation of diluted earnings per share: |
||||||||||||
| GAAP earnings per share (continuing operations) |
$ | 1.28 | $ | 1.07 | $ | 1.47 | ||||||
| Other costs (1) |
0.01 | 0.12 | 0.02 | |||||||||
|
|
|
|
|
|
|
|||||||
| Earnings per share excluding other costs |
$ | 1.29 | $ | 1.19 | $ | 1.49 | ||||||
|
|
|
|
|
|
|
|||||||
| (1) | Other costs primarily related to acquisitions, such as transaction costs, the amortization of backlog and inventory that was stepped up to fair value during purchase accounting, the costs of the proposed spin-off of the Company’s distribution business and certain legal costs, items which are included in operating profit. For the three months ended March 31, 2014 and 2013, other costs included in operating profit were $18 million and $64 million, respectively. Certain other costs are included in other income (expense), net were nil and $8 million for the three months ended March 31, 2014 and 2013, respectively. Other costs for the three months ended December 31, 2013 totaled $16 million. |
28
Liquidity and Capital Resources
Overview
The Company assesses liquidity in terms of its ability to generate cash to fund operating, investing and financing activities. The Company remains in a strong financial position, with resources available to reinvest in existing businesses, strategic acquisitions and capital expenditures to meet short- and long-term objectives. The Company believes that cash on hand, cash generated from expected results of operations, amounts available under its revolving credit facility and its commercial paper program will be sufficient to fund operations, anticipated working capital needs and other cash requirements such as capital expenditures, debt and interest payments and dividend payments for the foreseeable future.
At March 31, 2014, the Company had cash and cash equivalents of $3,688 million, and total debt of $3,149 million. At December 31, 2013, cash and cash equivalents were $3,436 million and total debt was $3,150 million. A significant portion of the consolidated cash balances are maintained in accounts in various foreign subsidiaries and, if such amounts were transferred among countries or repatriated to the U.S., such amounts may be subject to additional tax obligations. Of the $3,688 million of cash and cash equivalents at March 31, 2014, approximately $3,262 million is held outside the U.S. If opportunities to invest in the U.S. are greater than available cash balances, rather than repatriating this cash, the Company may choose to borrow against its revolving credit facility or its commercial paper program.
The Company’s outstanding debt at March 31, 2014 was $3,149 million and consisted of $151 million in 6.125% Senior Notes, $500 million in 1.35% Senior Notes, $1,396 million in 2.60% Senior Notes, $1,096 million in 3.95% Senior Notes, and other debt of $6 million.
At March 31, 2014, the Company had no commercial paper borrowings and no borrowings against its $3.5 billion revolving credit facility. Funds available under the Company’s revolving credit facility were $2,509 million due to $991 million in outstanding letters of credit issued under the facility.
The Company also had $3,223 million of additional outstanding letters of credit at March 31, 2014, primarily in Norway, that are under various bilateral committed letter of credit facilities. Other letters of credit are issued as bid bonds, advanced payment bonds and performance bonds.
The following table summarizes our net cash provided by continuing operating activities, net cash used in continuing investing activities and net cash provided by (used in) continuing financing activities for the periods presented (in millions):
| Three Months Ended March 31, |
||||||||
| 2014 | 2013 | |||||||
| Net cash provided by continuing operating activities |
$ | 485 | $ | 486 | ||||
| Net cash used in continuing investing activities |
(120 | ) | (2,516 | ) | ||||
| Net cash provided by (used in) continuing financing activities |
(105 | ) | 1,162 | |||||
Operating Activities
For the first three months of 2014, cash provided by continuing operating activities was $485 million compared to $486 million in the same period of 2013. Before changes in operating assets and liabilities, net of acquisitions, cash was provided by continuing operations primarily through net income from continuing operation of $548 million plus non-cash charges of $236 million, less $10 million in equity income.
Net changes in operating assets and liabilities, net of acquisitions, used $353 million for the first three months of 2014 compared to $107 million used in the same period in 2013. This increase in the first quarter of 2014 compared to the same period in 2013 was primarily the result of our Rig Systems segment that experienced payment delays from some larger offshore rig customers. This increase was partially offset by continued customer financing, where prepayments and milestone invoicing on major projects outpaced costs incurred.
29
Investing Activities
For the first three months of 2014, net cash used in continuing investing activities was $120 million compared to $2,516 million for the same period of 2013. Net cash used in continuing investing activities continued to primarily be the result of acquisition activity and capital expenditures both of which decreased in the first three months of 2014 compared to the first three months of 2013. The Company used approximately $2 million for acquisitions in the first three months of 2014, a significant decrease compared to approximately $2.5 billion for the purpose of acquiring Robbins & Myers during the first three months of 2013. In addition, the Company used $125 million during the first three months of 2014 for capital expenditures compared to $149 million for the same period of 2013.
Financing Activities
For the first three months of 2014, net cash used in continuing financing activities was $105 million compared to net cash provided by continuing financing activities of $1,162 million for the same period of 2013. The change was primarily due to increased dividends and no borrowings during the first three months of 2014 compared to $1,200 million in net borrowings on the Company’s revolving credit facility, most of which was used to acquire Robbins & Myers, for the same period of 2013.
Other
The effect of the change in exchange rates on cash flows was a decrease of $5 million and $11 million for the first three months of 2014 and 2013, respectively.
We believe that cash on hand, cash generated from operations, amounts available under our credit facility and through our commercial paper program, as well as from other sources of debt will be sufficient to fund operations, working capital needs, capital expenditure requirements, dividends and financing obligations.
We intend to pursue additional acquisition candidates, but the timing, size or success of any acquisition effort and the related potential capital commitments cannot be predicted. We continue to expect to fund future cash acquisitions primarily with cash flow from operations and borrowings, including the unborrowed portion of the credit facility, our commercial paper program or new debt issuances, but may also issue additional equity either directly or in connection with acquisitions. There can be no assurance that additional financing for acquisitions will be available at terms acceptable to us.
Recently Issued Accounting Standards
In April 2014, the Financial Accounting Standards Board issued Accounting Standard Update No. 2014-08 “Reporting Discontinued Operations and Disclosures of Disposals of Components of and Entity” (ASU No. 2014-08), which is an update for Accounting Standards Codification Topic No. 205 “Presentation of Financial Statements” and Topic No. 360 “Property, Plant and Equipment’. This update changes the requirements of reporting discontinued operations. Under the amended guidance, a disposal of a component of an entity or a group of components of an entity is required to be reported in discontinued operations if the disposal represents a strategic shift that has (or will have) a major effect on an entity’s operations and financial results. The amendments in this update are effective for all disposals (or classifications as held for sale) of components of an entity that occur within annual periods beginning on or after December 15, 2014, and interim periods within those years, with early adoption permitted. The adoption of this update concerns presentation and disclosure only as it relates to our consolidated financial statements. The Company is currently assessing the impact of ASU No. 2014-08 on its consolidated financial position and results of operations.
30
Forward-Looking Statements
Some of the information in this document contains, or has incorporated by reference, forward-looking statements. Statements that are not historical facts, including statements about our beliefs and expectations, are forward-looking statements. Forward-looking statements typically are identified by use of terms such as “may,” “expect,” “anticipate,” “estimate,” and similar words, although some forward-looking statements are expressed differently. All statements herein regarding expected merger synergies are forward-looking statements. You should be aware that our actual results could differ materially from results anticipated in the forward-looking statements due to a number of factors, including but not limited to changes in oil and gas prices, customer demand for our products, difficulties encountered in integrating mergers and acquisitions, and worldwide economic activity. You should also consider carefully the statements under “Risk Factors,” as disclosed in our Annual Report on Form 10-K for the year ended December 31, 2013, which address additional factors that could cause our actual results to differ from those set forth in the forward-looking statements. Given these uncertainties, current or prospective investors are cautioned not to place undue reliance on any such forward-looking statements. We undertake no obligation to update any such factors or forward-looking statements to reflect future events or developments. The Company is currently assessing the impact of ASU No. 2014-08 on its consolidated financial position and results of operations.
31
Item 3. Quantitative and Qualitative Disclosures About Market Risk
We are exposed to changes in foreign currency exchange rates and interest rates. Additional information concerning each of these matters follows:
Foreign Currency Exchange Rates
We have extensive operations in foreign countries. The net assets and liabilities of these operations are exposed to changes in foreign currency exchange rates, although such fluctuations generally do not affect income since their functional currency is typically the local currency. These operations also have net assets and liabilities not denominated in the functional currency, which exposes us to changes in foreign currency exchange rates that impact income. We recorded a foreign exchange gain in our income statement of approximately $5 million in the first three months of 2014, compared to a $11 million foreign exchange loss in the same period of the prior year. The gains and losses are primarily due to exchange rate fluctuations related to monetary asset balances denominated in currencies other than the functional currency and adjustments to our hedged positions as a result of changes in foreign currency exchange rates. Strengthening of currencies against the U.S. dollar may create losses in future periods to the extent we maintain net assets and liabilities not denominated in the functional currency of the countries using the local currency as their functional currency.
Some of our revenues in foreign countries are denominated in U.S. dollars, and therefore, changes in foreign currency exchange rates impact our earnings to the extent that costs associated with those U.S. dollar revenues are denominated in the local currency. Similarly some of our revenues are denominated in foreign currencies, but have associated U.S. dollar costs, which also give rise to foreign currency exchange rate exposure. In order to mitigate that risk, we may utilize foreign currency forward contracts to better match the currency of our revenues and associated costs. We do not use foreign currency forward contracts for trading or speculative purposes.
The following table details the Company’s foreign currency exchange risk grouped by functional currency and their expected maturity periods at March 31, 2014 (in millions, except contract rates):
| As of March 31, 2014 | December 31, | |||||||||||||||||||
| Functional Currency |
2014 | 2015 | 2016 | Total | 2013 | |||||||||||||||
| CAD Buy USD/Sell CAD: |
||||||||||||||||||||
| Notional amount to buy (in Canadian dollars) |
202 | — | — | 202 | 229 | |||||||||||||||
| Average USD to CAD contract rate |
1.1205 | — | — | 1.1205 | 1.0669 | |||||||||||||||
| Fair Value at March 31, 2014 in U.S. dollars |
(2 | ) | — | — | (2 | ) | 1 | |||||||||||||
| Sell USD/Buy CAD: |
||||||||||||||||||||
| Notional amount to sell (in Canadian dollars) |
205 | 48 | — | 253 | 51 | |||||||||||||||
| Average USD to CAD contract rate |
1.1131 | 1.1180 | — | 1.1140 | 1.0230 | |||||||||||||||
| Fair Value at March 31, 2014 in U.S. dollars |
— | — | — | — | (1 | ) | ||||||||||||||
| EUR Buy USD/Sell EUR: |
||||||||||||||||||||
| Notional amount to buy (in euros) |
6 | — | — | 6 | 9 | |||||||||||||||
| Average USD to EUR contract rate |
0.7334 | 0.7405 | — | 0.7342 | 7.5900 | |||||||||||||||
| Fair Value at March 31, 2014 in U.S. dollars |
— | — | — | — | 1 | |||||||||||||||
| Sell USD/Buy EUR: |
||||||||||||||||||||
| Notional amount to buy (in euros) |
348 | 32 | — | 380 | 344 | |||||||||||||||
| Average USD to EUR contract rate |
0.7347 | 0.7340 | — | 0.7346 | 0.7401 | |||||||||||||||
| Fair Value at March 31, 2014 in U.S. dollars |
5 | — | — | 5 | 9 | |||||||||||||||
| KRW Sell USD/Buy KRW: |
||||||||||||||||||||
| Notional amount to buy (in South Korean won) |
195,421 | — | — | 195,421 | 195,020 | |||||||||||||||
| Average USD to KRW contract rate |
1,085 | — | — | 1,085 | 1,114 | |||||||||||||||
| Fair Value at March 31, 2014 in U.S. dollars |
2 | — | — | 2 | 10 | |||||||||||||||
32
| As of March 31, 2014 | December 31, | |||||||||||||||||||
| Functional Currency |
2014 | 2015 | 2016 | Total | 2013 | |||||||||||||||
| GBP Buy USD/Sell GBP: |
||||||||||||||||||||
| Notional amount to buy (in British Pounds Sterling) |
— | — | — | — | 11 | |||||||||||||||
| Average USD to GBP contract rate |
— | — | — | — | 0.6142 | |||||||||||||||
| Fair Value at March 31, 2014 in U.S. dollars |
— | — | — | — | — | |||||||||||||||
| Sell USD/Buy GBP: |
||||||||||||||||||||
| Notional amount to buy (in British Pounds Sterling) |
57 | 11 | — | 68 | 73 | |||||||||||||||
| Average USD to GBP contract rate |
0.6157 | 0.6092 | — | 0.6146 | 0.6201 | |||||||||||||||
| Fair Value at March 31, 2014 in U.S. dollars |
2 | — | — | 2 | 2 | |||||||||||||||
| USD Buy CAD/Sell USD: |
||||||||||||||||||||
| Notional amount to buy (in U.S. dollars) |
8 | 9 | — | 17 | 15 | |||||||||||||||
| Average CAD to USD contract rate |
0.9389 | 0.9399 | — | 0.9395 | 0.9431 | |||||||||||||||
| Fair Value at March 31, 2014 in U.S. dollars |
— | — | — | — | — | |||||||||||||||
| Buy DKK/Sell USD: |
||||||||||||||||||||
| Notional amount to buy (in U.S. dollars) |
61 | 24 | — | 85 | 71 | |||||||||||||||
| Average DKK to USD contract rate |
0.1811 | 0.1832 | — | 0.1817 | 0.1813 | |||||||||||||||
| Fair Value at March 31, 2014 in U.S. dollars |
1 | — | — | 1 | 1 | |||||||||||||||
| Buy EUR/Sell USD: |
||||||||||||||||||||
| Notional amount to buy (in U.S. dollars) |
600 | 269 | 9 | 878 | 773 | |||||||||||||||
| Average EUR to USD contract rate |
1.3476 | 1.3637 | 1.3915 | 1.3529 | 1.3411 | |||||||||||||||
| Fair Value at March 31, 2014 in U.S. dollars |
12 | 3 | — | 15 | 21 | |||||||||||||||
| Buy GBP/Sell USD: |
||||||||||||||||||||
| Notional amount to buy (in U.S. dollars) |
89 | 14 | — | 103 | 42 | |||||||||||||||
| Average GBP to USD contract rate |
1.6350 | 1.5978 | — | 1.6298 | 1.5779 | |||||||||||||||
| Fair Value at March 31, 2014 in U.S. dollars |
1 | 1 | — | 2 | 1 | |||||||||||||||
| Buy NOK/Sell USD: |
||||||||||||||||||||
| Notional amount to buy (in U.S. dollars) |
1,067 | 724 | 100 | 1,891 | 1,877 | |||||||||||||||
| Average NOK to USD contract rate |
0.1647 | 0.1623 | 0.1578 | 0.1634 | 0.1642 | |||||||||||||||
| Fair Value at March 31, 2014 in U.S. dollars |
8 | 8 | 3 | 19 | (28 | ) | ||||||||||||||
| Buy MXN/Sell USD: |
||||||||||||||||||||
| Notional amount to buy (in U.S. dollars) |
39 | — | — | 39 | — | |||||||||||||||
| Average MXN to USD contract rate |
0.0754 | — | — | 0.0754 | — | |||||||||||||||
| Fair Value at March 31, 2014 in U.S. dollars |
— | — | — | — | — | |||||||||||||||
| Buy SGD/Sell USD: |
||||||||||||||||||||
| Notional amount to buy (in U.S. dollars) |
32 | 6 | 1 | 39 | 15 | |||||||||||||||
| Average SGD to USD contract rate |
0.7887 | 0.7957 | 0.7874 | 0.7897 | 0.7966 | |||||||||||||||
| Fair Value at March 31, 2014 in U.S. dollars |
— | — | — | — | — | |||||||||||||||
| Sell CAD/Buy USD: |
||||||||||||||||||||
| Notional amount to buy (in U.S. dollars) |
2 | — | — | 2 | 2 | |||||||||||||||
| Average CAD to USD contract rate |
0.9614 | — | — | 1.0178 | 1.3625 | |||||||||||||||
| Fair Value at March 31, 2014 in U.S. dollars |
— | — | — | — | — | |||||||||||||||
| Sell DKK/Buy USD: |
||||||||||||||||||||
| Notional amount to buy (in U.S. dollars) |
32 | — | — | 32 | 11 | |||||||||||||||
| Average DKK to USD contract rate |
0.1828 | — | — | 0.1828 | 1.3625 | |||||||||||||||
| Fair Value at March 31, 2014 in U.S. dollars |
— | — | — | — | — | |||||||||||||||
| Sell EUR/Buy USD: |
||||||||||||||||||||
| Notional amount to sell (in U.S. dollars) |
321 | — | — | 321 | 190 | |||||||||||||||
| Average EUR to USD contract rate |
1.3894 | — | — | 1.3894 | 1.3109 | |||||||||||||||
| Fair Value at March 31, 2014 in U.S. dollars |
3 | — | — | 3 | (2 | ) | ||||||||||||||
| Sell GBP/Buy USD: |
||||||||||||||||||||
| Notional amount to sell (in U.S. dollars) |
22 | — | — | 22 | — | |||||||||||||||
| Average GBP to USD contract rate |
1.6034 | — | — | 1.6034 | — | |||||||||||||||
| Fair Value at March 31, 2014 in U.S. dollars |
(1 | ) | — | — | (1 | ) | — | |||||||||||||
| Sell NOK/Buy USD: |
||||||||||||||||||||
| Notional amount to sell (in U.S. dollars) |
331 | 71 | — | 402 | 385 | |||||||||||||||
| Average NOK to USD contract rate |
0.1650 | 0.1606 | — | 0.1642 | 0.1634 | |||||||||||||||
| Fair Value at March 31, 2014 in U.S. dollars |
(2 | ) | (1 | ) | — | (3 | ) | 6 | ||||||||||||
33
| As of March 31, 2014 | December 31, | |||||||||||||||||||
| Functional Currency |
2014 | 2015 | 2016 | Total | 2013 | |||||||||||||||
| Sell SGD/Buy USD: |
||||||||||||||||||||
| Notional amount to buy (in U.S. dollars) |
2 | — | — | 2 | 1 | |||||||||||||||
| Average SGD to USD contract rate |
0.7910 | — | — | 0.7910 | 0.8000 | |||||||||||||||
| Fair Value at March 31, 2014 in U.S. dollars |
— | — | — | — | — | |||||||||||||||
| Sell RUB/Buy USD: |
||||||||||||||||||||
| Notional amount to buy (in U.S. dollars) |
49 | — | — | 49 | 64 | |||||||||||||||
| Average RUB to USD contract rate |
0.0274 | — | — | 0.0274 | 0.0298 | |||||||||||||||
| Fair Value at March 31, 2014 in U.S. dollars |
— | — | — | — | (1 | ) | ||||||||||||||
| Sell SEK/Buy USD: |
||||||||||||||||||||
| Notional amount to buy (in U.S. dollars) |
1 | — | — | 1 | 1 | |||||||||||||||
| Average SEK to USD contract rate |
0.1546 | — | — | 0.1546 | 0.1529 | |||||||||||||||
| Fair Value at March 31, 2014 in U.S. dollars |
— | — | — | — | — | |||||||||||||||
| DKK Sell DKK/Buy USD: |
||||||||||||||||||||
| Notional amount to buy (in U.S. dollars) |
104 | — | — | 104 | 111 | |||||||||||||||
| Average DKK to USD contract rate |
5.3927 | — | — | 5.3927 | 5.6126 | |||||||||||||||
| Fair Value at March 31, 2014 in U.S. dollars |
— | — | — | — | — | |||||||||||||||
| Other Currencies |
||||||||||||||||||||
| Fair Value at March 31, 2014 in U.S. dollars |
2 | (1 | ) | — | 1 | (1 | ) | |||||||||||||
|
|
|
|
|
|
|
|
|
|
|
|||||||||||
| Total Fair Value at March 31, 2014 in U.S. dollars |
31 | 10 | 3 | 44 | 19 | |||||||||||||||
|
|
|
|
|
|
|
|
|
|
|
|||||||||||
The Company had other financial market risk sensitive instruments denominated in foreign currencies for transactional exposures totaling $732 million and translation exposures totaling $593 million as of March 31, 2014 excluding trade receivables and payables, which approximate fair value. These market risk sensitive instruments consisted of cash balances and overdraft facilities. The Company estimates that a hypothetical 10% movement of all applicable foreign currency exchange rates on the transactional exposures financial market risk sensitive instruments could affect net income by $48 million and the translational exposures financial market risk sensitive instruments could affect the future fair value by $59 million.
The counterparties to forward contracts are major financial institutions. The credit ratings and concentration of risk of these financial institutions are monitored on a continuing basis. In the event that the counterparties fail to meet the terms of a foreign currency contract, our exposure is limited to the foreign currency rate differential.
Interest Rate Risk
At March 31, 2014, long term borrowings consisted of $151 million in 6.125% Senior Notes, $500 million in 1.35% Senior Notes, $1,400 million in 2.60% Senior Notes and $1,100 million in 3.95% Senior Notes, and no borrowings under our revolving credit facility or our commercial paper program. Occasionally a portion of borrowings under our credit facility could be denominated in multiple currencies which could expose us to market risk with exchange rate movements. These instruments carry interest at a pre-agreed upon percentage point spread from either LIBOR, NIBOR or EURIBOR, or at the prime interest rate. Under our credit facility, we may, at our option, fix the interest rate for certain borrowings based on a spread over LIBOR, NIBOR or EURIBOR for 30 days to six months. Our objective is to maintain a portion of our debt in variable rate borrowings for the flexibility obtained regarding early repayment without penalties and lower overall cost as compared with fixed-rate borrowings.
34
Item 4. Controls and Procedures
As of the end of the period covered by this report, we carried out an evaluation, under the supervision and with the participation of the Company’s management, including the Company’s Chief Executive Officer and Chief Financial Officer, of the effectiveness of the design and operation of the Company’s disclosure controls and procedures. The Company’s disclosure controls and procedures are designed to provide reasonable assurance that the information required to be disclosed by the Company in the reports it files under the Exchange Act is accumulated and communicated to the Company’s management, including the Company’s Chief Executive Officer and Chief Financial Officer, as appropriate, to allow timely decisions regarding required disclosures and is recorded, processed, summarized and reported within the time period specified in the rules and forms of the Securities and Exchange Commission. Based upon that evaluation, the Company’s Chief Executive Officer and Chief Financial Officer concluded that the Company’s disclosure controls and procedures are effective as of the end of the period covered by this report at a reasonable assurance level.
There has been no change in our internal control over financial reporting (as defined in Rule 13a-15(f) under the Exchange Act) that occurred during our last fiscal quarter that has materially affected, or is reasonably likely to materially affect, our internal control over financial reporting.
35